WORLD ECONOMIC SURVEY 1987 - the United Nations
192
WORLD ECONOMIC SURVEY 1987 CURRENT TRENDS AND POLICIES IN THE WORLD ECONOMY UNITED NATIONS
-
Upload
khangminh22 -
Category
Documents
-
view
0 -
download
0
Transcript of WORLD ECONOMIC SURVEY 1987 - the United Nations

WORLDECONOMIC SURVEY1987CURRENT TRENDSAND POLICIES IN THE WORLD ECONOMY
UNITEDNATIONS

Department of International Economic and Social Affairs
WORLDECONOMIC SURVEY1987CURRENT TRENDSAND POLICIES IN THE WORLD ECONOMY
UNITED NATIONSNew York. 1981
E/1987/62ST/ESA/197

NOTE
Symbols of United Nations documents are composed of capital letters combined withfigures.
E/1987/62ST/ESA/197
UNITED NATIONS PUBLICATION
Sales No. E.B7.II.C.1
02200
ISBN 92-1-109113-6

PREFACE
The World Economic Survey 1987is the fortieth in a continuing annual series, the first ofwhich was published in 1947.'At that time, it was among the first attempts to provide a comprehensive view of the global economic situation. TheUnited Nations was thus a pioneer in this field. The Secretary-General was requested to provide "factual surveys andanalyses of world economic conditions and trends" (General Assembly resolution 118(11)) to assist the Economic andSocial Council and the Assembly in carrying out their responsibilities under the Charter of the United Nations to promoteinternational co-operation in solving international problems of an economic character.
The task of each Survey has been to analyse the major current issues in the world economy that require attention andaction by the international community. The analysis thus casts a wide net. Reflecting the complexity of internationaleconomic relations as well as the diversity of United Nations membership, the Survey analyses economic issues indeveloping countries, developed market economies and centrally planned economies and their interrelationships. It seeksto cover the broad range of issues at the forefront of international discussions, to identify emerging problems and toassess prospects. A discussion ofplausible scenarios for the next few years has become an important feature of the overallanalysis. In the present Survey, the topics raised are macro-economic policy co-ordination, international trade, international finance and debt, world energy markets, redirection of policies in planned economies, sources ofeconomic growthin developing countries and persistent unemployment in some developed market economies.
Secretariat policy recommendations have changed through the years in response to changing economic conditions andthe evolution of the political process in United Nations meetings. But a few themes run through the whole period and areas relevant today as they were when stated in the 1945-1947 Economic Report:
"Co-ordinated national and international actions are required which would take into account the factors limitingthe volume of production in the world...
"The bulk ofhuman, national and financial resources that will be required for an increased volume ofproductionin any country, must necessarily come from that country itself. In the ... [developing] countries, however, foreignfinancing and foreign goods are bound to play an important part in speeding reconstruction and in promotingeconomic development. ..
"Both in the interest of promoting 'higher standards of living, full employment and conditions of economic andsocial progress and development' [Article 55 of the Charter of the United Nations] as well as in the interest ofcreating and maintaining world economic conditions which would permit the eventual and orderly repayment ofinternational loans that may now be extended for the purpose of promoting economic reconstruction and development, it is essential that national and international action be considered now ... so as to ensure that high levels ofemployment and economic activity are maintained."2
In 1987, "regained" would be more appropriate than "maintained" at the end of the quotation; as discussed in thisSurvey, regaining high levels of employment and economic activity are among the main priorities on the present globaleconomic agenda.
The Survey was prepared in the Office of Development Research and Policy Analysis of the Department of International Economic and Social Affairs and is based on information available to the Secretariat as at early April. Theinformation underlying the analysis is in part collected directly by the Secretariat and in part obtained from UnitedNations regional commissions, the specialized agencies, other international organizations and Project LINK. But theanalyses and policy recommendations are based on a cross-sectoral approach to issues aimed at achieving a synthesis.
The World Economic Survey 1987 and other recent issues of the Survey take a forward-looking, more analytical andless descriptive approach than earlier ones. The issues and policy prescriptions in the Survey are selected in the light ofthe needs and concerns of Governments, to whom the Survey is primarily addressed.
Rafeeuddin AhmedUnder-Secretary-General for
International Economic and Social Affairs
I Economic Report: Salient Features o/the World Economic Situation. 1945-1947 (United Nations publication, Sales No. 1948.I1.C.l).2 Ibid.• pp. 29-30.
iii
CONTENTS
Preface . . . . . . . . . . . . . . . . . . . . . . . . . . . . . . . . . . . . . . . . . . . . . . . . . . . . . . . . . . . . . . . . . . . . . . . . . . . iiiExplanatory notes. . . . . . . . . . . . . . . . . . . . . . . . . . . . . . . . . . . . . . . . . . . . . . . . . . . . . . . . . . . . . . . . . . . viii
Chapter
I. THE GLOBAL ECONOMY: THE ROAD AHEAD. . . .. . . . . . . . . . . . . . . . . . . . . . . . . . . 1Economic growth in 1986: salient features. . . . . . . . . . . . . . . . . . . . . . . . . . . . . . . . . . . . . . . 2Policy conclusions 8
II. WORLD ECONOMY IN PERSPECTIVE: KEY FEATURES, POLICIESAND PROSPECTS. . . . . . . . . . . . . . . . . . . . . . . . . . . . . . . . . . . . . . . . . . . . . . . . . . . . . . . . 13
Global overview . . . . . . . . . . . . . . . . . . . . . . . . . . . . . . . . . . . . . . . . . . . . . . . . . . . . . . . . . . . . 13Growth impulses and channels of transmission in 1986. . . . . . . . . . . . . .. . . . . . . . . . . . . . . . 20Short-term outlook for the world economy . . . . . . . . . . . . . . . . . . . . . . . . . . . . . . .. . . . . . . . 26Regional economic performance in 1986 and selected policy issues. . . . . . . . . .. . . . . . . . . . 33
III. INTERNATIONAL TRADE.. . . .. . . .. . . . .. . . . . .. . .. . . . .. . . .. . . . . . .. . . 51Growth of world trade 51The trading system . . . . . . . . . . . . . . . . . . . . . . . . . . . . . . . . . . . . . . . . .. . . . . . . . . . . . . . . . . 52Recent developments in trade flows by country groups. . . . . . . . . . . . . . . . . . . . . . . . . . . . . . 53The changing commodity structure of international trade , , , . 58
IV. INTERNATIONAL FINANCE, DEBT AND BALANCE-OF-PAYMENTSADJUSTMENT . . . . . . . . . . . . . . . . . . . . . . . . . . . . . . . . . . . . . . . • . . . . . . . . . . . . . . . . . . . . 71Intercountry flows of financial resources. . . . . . . . . . . . . . . . . . . . . . . . . . . . . . . . . . . . . . . . . 71Composition of international financial flows. . . . . . . . . . . . . . . . . . . . . . . . . .. . . . . . . . . . . . 78The foreign debt crisis of developing countries . . . . . . . . . . . . . . . . . . . . . . . . . . . . . . . . . . . . 89
V. THE INTERNATIONAL OIL MARKET. . . . . . . . . . . . . . . . . . . . . . . . . . . . .. . . . . . . . . .. 101Energy consumption and output since the early 1970s. . . . . . . . . . . . . . . . . . . . . . . . . . . . . .. 101Oilprice developments in 1986 102The effects oflower oil prices on consumption . . . . . . . . . . . . . . . . . . . . . . . . . . . . . . .. . . .. 105Production shifts '. . . . . . . . . . . . . . . . . . . . . . . . . . . . . . . . . . . . . . . . . . . . .. 106Policy implications of expected oil production .. . . . . . . . . . . . . . . . . . . . . . . . . . . . . . . . . .. 109
VI. ECONOMIC GROWTH AND TRADE IN CHINA, EASTERN EUROPE AND THEUNION OF SOVIET SOCIALIST REPUBLICS DURING THE PERIOD 1986-1990. . . .. 111Centrally planned economies of Eastern Europe and the Union of Soviet Socialist
Republics. . . . . . . . . . . . . . . . . . . . . . . . . . . . . . . . . . . . .. . . . . . . . . . . . . . . . . . . . . . . . . .. 111China............................... 129Conclusions. . . . . . . . . .. . . . . . . . . . . .. . . . . . . . . . . . . . . . . . . . . . . . . . . . . . . . . . . . . . . . .. 137
VII. UNEMPLOYMENT IN DEVELOPED MARKET ECONOMIES:THE POLICY DILEMMAS : .. . . .. 139
Social and demographic aspects of unemployment . . . . . . . . . . . . . . . . . . . . . . . . . . . . . . . .. 141Income claims and unemployment. . . . . . . . . . . . . . . . . . . . . . . . . . . . . . . . . . . . . . . . . . . . .. 143Macro-economic causes ofunemployment . . . . . . . . . . . . . . . . . . . . . . . . . . . . . . . . . . . . . .. 145Policy dilemmas ' ,.. 151Conclusion. . . . . . . . . . . . . . . . . . . . .. . . . . . . . . . . . . . . . . . . . . . . . .. . . . . . . . . . . . . . . . .. 153
VIII. THE FAST-GROWING DEVELOPING COUNTRIES OF THE 1980s . . . . . . . . . . . . . . .. 155The shrinking number of "success stories" . . . . . . . . . . . . . . . . . . . . . . . . . . . . . . . . . . . . . .. 156The share of agriculture in GDP and growth ofagricultural output . . . . . . . . . . . . . . . . . . .. 156Export orientation of the economy. . . . . . . . . . . . . . . . . . . . . . . . . . . . . . . . . . . . . . . . . . . . .. 159Domestic macro-economic performance. . . . . . . . . . . . . . . . . . . . . . . . . . . . . . . . . . . . . . . .. 161Import capacity and growth of exports. . . . . . . . . . . . . . . . . . . . . . . . . . . . . . . . . . . . . . . . . .. 163An adverse external environment. . . . . . . . . . . . . . . . . . . . . . . . . . . . . . . . . . . . . . . . . . . . . .. 164Concluding remarks . . . . . . . . . . . . . . . . . . . . . . . . . . . . . . . . . . . . . . . . . . . . . . . . . . . . . . . .. 166
Annex. STATISTICAL TABLES 169
iv

CONTENTS (continued)
BOXES
11.1. Oil price, the dollar, and international interest rates . . . . . . . . . . . . . . . . . . . . . . . . . . . . . . . . 2011.2. Co-ordination ofmacro-economic policies in the industrial countries. . . . . . . . . . . . . . . . . . 3011.3. Debt relief for major debtor developing countries. . . . . . . . . . . . . . . . . . . . . . . . . . . . . . . . . . 32
III.l. Technical note on the measurement of trade in services . . . . . . . . . . . . . . . . . . . . . . . . . . . . . 67IV.l. External debt and economic adjustment in Eastern Europe. . . . . . . . . . . . . . . . . . . . . . . . . . . 75IV.2. Debt, net resource transfers and external adjustment in Turkey. . . . . . . . . . . . . . . . . . . . . . . 90
TABLES
11.1. Growth of world output and trade, 1971-1988. . . . . . . . . . . . . . . . . . . . . . . . . . . . . . . . . . . .. 1311.2. Countries with growth rates of real GDP at or belowthe rate of growth ofpopulation,
1970~1986 . . . . . . . . . . . . . . . . . . . . . . . . . . . . . . . . . . . . . . . . . . . . . . . . . . . . . . . .. . . . . . . 1611.3. World imports: geographical composition and volume changes, 1971-1986 ; 2211.4. World trade and output linkages: share of bilateral exports and imports in GDP, 1985. . . .. 2411.5. Developing countries' real rate of interest, and rate of
change in terms oftrade, export volume and external credit, 1961-1986 . . . . . . . . . . . . .. 2411.6. Short-term outlook for the world econo:rny, 1986-1988 2811.7. Developed market economies: short-term outlook for inflation and unemployment rates
and current account balances, 1986-1988. . . . . . . . . . . . . . . . . . . . . . . . . . . . . . . . . . . . . .. 2911.8. Frequency distribution of output growth rates and inflation in the developing countries,
1971-1986 . . . . . . . . . . . . . . . . . . . . . . . . . . . . . . . . . . . . . . . . . . . . . . . . . . . . . . . . . . . . . . . 3411.9. Developing countries: real GDP growth rates, 1971-1986. , . . . . . . . . . . . . . . . . . . . . . . . .. 35
11.10. Sources of central government revenue in developed and developing countries,1978-1984 . . . . . . . . . . . . . . . .. . . . . . . . . . . . . . . . . .. . . . . . . . . . . . . .. . . . . . . . . . . . . .. 38
11.11. Contribution of domestic demand and net foreign demand to GDP growth, 1984-1986 . . .. 3911.12. Global payments imbalances and savings-investment balance of the United States,
1979-1986 . . . . . . . . . . . . . . . . . . . . . . . . . . . . . . .. . . . . . . . . . . . . . . . . . . . . . . . . . . . . . .. 4511.13. Centrally planned economies: selected macro-economicindicators, 1981-1987 . . . . . . . . .. 48111.1. World trade, 1980-1986 ,.............................. 51III.2. World trade: annual rates of change in volume and price, 1976-1987 54III. 3. Developed market economies: merchandise trade balance, 1980-1986 . . . . . . . . . . . . . . . .. 56IliA. Trade balances of developing countries, 1980-1986 . . . . . . . . . . .. . . . . . . . . . . . . . . . . . . .. 56III.5. Trade balances of centrally planned economies, 1984-1986. . . . . . . . . . . . . . . . . . . . . . . . .. 57III.6. Changes in the values of currencies of of major countries, 1985-1986. . . . . . . . . . . . . . . . .. 57111.7. Real effective exchange rate of some major developing countries and territories 58111.8. Commodity composition of international trade. . . . . . . . . . . . . . . . . . . . . . . . . . . . . . . . . . . . 58III.9. Growth of manufacturing production. . . . . . . . . . . . . . . . . . . . . . . • . . . . . . . . . . . . . . . . . . . . 59
111.10. Growth of exports of manufactures by country groups. . . . . . . . . . . .. . . . . . . . . . . . . . . . .. 59111.11. The dependence of developing countries and territories on primary exports . . . . . . . . . . . . . 60111.12. Indices of primary commodity prices, 1982-1986. . . . . . . . . . . . . . . . . . . . . . . . . . . . . . . . . . 61111.13. Trade in non-factor services, 1975-1985. . . . . . . . . . . . . . . . . . . . . . . . . . . . . . . . . . . . . . . .. 65IV.l. World balance ofpayments on current account, by country group, 1980-1987 . . . . . . . . . .. 72IV.2. Net transfer of financial resources to the capital-importing developing countries,
1980-1986 . . . . . . . . . . . . . . . . . . . . . . . . . . . . . . . . . . . . . . . . . . . . . . . . . . . . . . . . . . . . . .. 73IV.3. Net international credit flows to the United States, 1980-1986..................... ... 77IVA. Net inflows from international portfolio investment, 1980-1986 . . . . . . . . . . . . . .. . . . . . .. 79IV.5. Gross borrowing arrangements on international capital markets by the developing countries ,
1980-1986 , .. . . . .. . . . . . . . . . . . . . . . . . . . . . . . 82IV.6. Net direct investment flows, 1980-1986 83IV.7. Net transfer of official financial resources to the capital-importing developing countries,
1980-1985 . . . . . . . . . . . . . . . . . . . . . . . . . . . . . . . . . . . . . . . . . . . . . . . . . . . . . . . . . . . . . .. 85
v

CONTENTS (continued)
IV.8. Gross foreign debt of the capital-importing developing countries, 1980-1986. . . . . . . . . . . . 88IV.9. Indicators of international financing and economic performance of 15 heavily indebted
countries, 1978-1986. . . . . . . . . . . . . . . . . . . . . . . . . . . . . . . . . . . . . . . . . . . . . . . . . . . . . .. 92IV.1O. Indicators of international financing and economic performance of sub-,saharan Africa,
1978-1986'. . . . . . . . . . . . . . . . . . . . . . . . . . . . . . . . . . . . . . . . . . . . . . . . . . . . . . . . . . . . . . . 93IV.11. Average nominal interest rates paid by developing countries by type ofdebt and creditor,
1980-1986 . . . . . . . . . . . . . . . . . . . . . . . . . . . . . . . . . . . . . . . . . . . . . . . . . . . . . . . . . . . . . .. 95V.I. Oil balances in selected years . . . . . . . . . . . . . . . . . . . . . . . . . . . . . . . . . . . . . . . . . . . . . . . . .. 103V.2. Change in petroleum product prices as of August 1986 relative to August 1985 . . . . . . . . .. 104V.3. Annual changes in petroleum product consumption, 1980-1986. . . . . . . . . . . . . . . . . . . . . .. 105V A. Foreign exchange revenues from oil sales for OPEC countries. . . . . . . . . . . . . . . . . . . . . . .. 107V.5. Production and operating costs in the United Kingdom sector of the North Sea in 1983 . . .. 107V.6. United States oil companies - exploration and development investments, 1985-1986 . . . .. 108
VI. I. Centrally planned economies of Eastern Europe and the USSR: selected actual and plannedmedium-term macro-economic growth rates, 1976-1990 . . . . . . . . . . . . . . . . . . . . . . . . .. 113
VI.2. Centrally planned economies of Eastern Europe and the USSR: net material product pro-duced and domestically used ; . . . . . . . . . . . . . . . . . . . . . . . . . . . . . . . . . . . . . . .. 114
VI.3. Centrally planned economies of Eastern Europe and the USSR: investment growth,1981-1990 ' '. 119
VIA. Centrally planned economies of Eastern Europe and the USSR: retail priceincreases ,1976-1985 121
VI.5. Centrally planned economies of Eastern Europe and the USSR: trade balances, 1981-1985. 123VI.6. Centrally planned economies ofEastern Europe and the USSR: annual growth in the volume
of exports and imports, 1981-1985 . . . . . . . . . . . . . . . . . . . . . . . . . . . . . . . . . . . . . . . . . . .. 124VI.7. China: average annual growth rates of selected macro-economic indicators, 1979-1985 .,. 130VI.8. China: selected indicators of the external sector, 1978-1985 133
VII.1. Developed market economies: unemployment rates, 1970-1987 . . . . . . . . . . . . . . . . . . . . .. 139VII.2. Selected developed market economies: long-term unemployment, 1982-1985 . . . . . . . . . .. 141VII.3. Selected developed market economies: youth unemployment, 1984-1987. . . . . . . . . . . . . .. 143VIlA. Selected developed market economies: real wage rate gap, 1969-1985 . . . . . . . . . . . . . . . .. 147VII.5. Selected developed market economies: estimates of real wage rigidity, 1967-1983 . . . . . . .. 148VII.6. Selected developed market economies: change in the inflation-adjusted structural budget
balance, 1984-1987 , 149VII. 7. Selected developed market economies: NAIRU estimates , 150VIII. 1. The changing number of success stories. . . . . . . . . . . . . . . . . . . . . . . . . . . . . . . . . . . . . . . . .. 156VIII.2. Growth of GDP, share of agriculture in GDP and growth of agricultural output . . . . . . . . .. 157VIII.3. Export orientation of the economy ". . . . .. 159VIII A. Domestic macro-economic performance. . . . . . . . . . . . . . . . . . . . . . . . . . . . . . . . . . . . . . . .. 162VIII.5. Growth of imports and exports, 1981-1985 163VIII.6. Impact of changes in terms of trade and debt burdens , 165VIII. 7. The relative interest payment burden ofthe fast-growing and other countries , 166VIII.S. Profile of growth performance of fast-growing energy-importing developing countries and
China " 167
FIGURES
II. 1. Nominal and real crude oil prices. . . . . . . . . . . . . . . . . . . . . . . . . . . . . . . . . . . . . . . . . . . . . . . 1511.2. Bilateral exchange rates . . . . . . . . . . . . . . . . . . . . . . . . . . . . . . . . . . . . . . . . . . . . . . . . . . . . . . 15II.3. Nominal effective exchange rates. . . . . . . . . . . . . . . . . . . . . . . . . . . . . . . . . . . . . . . . . . . . . . . 17IIA. Yield on long-term government bonds. . . . . . . .. . . . . . . . . . . . . . . . . . . . . . . . . . . . . . . . . . . . 17II.5. Real yield on long-term government bonds. . . . . . . . . . . . . . . . . . . . . . . . . . . . . . . . . . . . . . . 19II.6. Real lending rates. . . . . . . . . . . . . . . . . . . . . . . . . . . . . . . . . . . . . . . . . . . . . . . . . . . . . . . . . . . 19II. 7. United States: output and domestic demand, 1980-1986. . . . . . . . . . . . . . . . . . . . . . . . . . . .. 43
vi

CONTENTS (continued)
11.8. Japan: output and domestic demand, 1980-1986. . . . . . . . . . . . . . . . . . . . . . . . . . . . . . . . . .. 4311.9. Budget and current account balances of the United States, 1966-1986. " . . . . . . . . . . . . . . . 44
11.10. Domestic demand in EEC, Japan and the United States, 1980-1986... " . . . . . . . . . . . . . .. 44III. 1. Prices of groups of commodities, 1980.,1986. . . . . . . . . . . . . . . . . . . . . . . . . . . . . .. . . . . . . . 61111.2. Commodity prices and export unit values of manufactures, 1970-1986.. . . . . . . . . . . . . . . . 62III.3. Unit values of trade of developing countries with developed market economies
and terms of trade, 1980-1986 . . . . . . . . . . . . . . . . . .. . . . . . . . . . . .. . . . . . . . . . . . . . . . . 63IV.1. Net capital flows to capital-importing countries, 1978-1986. . . . . . . . . . . . . . . . . . . . . . . . .. 74IV.2. Net capital flow of the Federal Republic of Germany, Japan and the United States,
1978-1986 " . . . . . . . . . . . . . . . . . . . . . . . . . . . . . . . 76IV.3. World distribution of indebtedness to international banks, 1978-1986. . . . . . . . . . . . . . . . . . 81IVA. Net flow ofIMF credit to the main regions of the developing countries,
1980, 1983 and 1986 . . .. .. . .. . . .. .. . .. .. . . .. . .. . . .. .. . . .. . . .. . . .. . .. . .. . .. . 86IV.5. Interestburden of selected developing countries, 1978-1986 . .. . . . . . . . . . .. . . . . . . . . . . . 94IV.6. Sub-Saharan Africa: interest payments in relation to investment and imports, 1978-1986 .. 94IV.7. I:ifteen heavily-indebted countries: interest payments in relation to investment and imports,
1978-1986 . . . . . . . . . . . . . . . . . . . . . . . . . . . . . . . . . . . . . . . . . . . . . . . . . . . . . . . . . . . . . . . 94V.l. The price of Arabian light crude oil, 1973-1986 . . . . . . . . . . . . . . . . . . . . . . . . . . . . . . . . . .. 101V.2. OPEC oil production and oil prices . . . • . . . . . . . . . . . . . . . . . . . . . . . . . . . . . . . . . . . . . . . .. 103
VII. I. Selected developed market economies: standardized unemployment rates, 1973-1987. . . .. 140VII.2. Selected developed market economies: growth of employment, 1973-1987 140VII.3. Selected developed market economies: real wage rate gap, 1969-1985 . . . . . . . . . . . . . . . .. 147VIlA. Selected developed market economies: key macro-economic indicators, 1984-1987 .. . . .. 152
vii

EXPLANATORY NOTES
The following symbols have been used in the tables throughout the report:
Two dots (..) indicate that data are not available or are not separately reported.
A dash (--) indicates that the amount is nil or negligible.
A hyphen (-) indicates that the item is not applicable.
A minus sign (-) indicates a deficit or decrease, except as indicated.
A full stop (.) is used to indicate decimals.
A slash (I) indicates a crop year or financial year, for example, 1981/82.
Use of a hyphen (-) between dates representing years, for example, 1984-1986, signifies the full period involved,including the beginning and end years.
Reference to "tons" indicates metric tons and to "dollars" ($) United States dollars, unless otherwise stated.
Annual rates ofgrowth or change, unless otherwise stated, refer to annual compound rates. In most cases, the growthrate forecasts for 1986 and 1987 are rounded to the nearest half of a percentage point.
Details and percentages in tables do not necessarily add to totals, because of rounding.
The following abbreviations have been used:BIS Bank for International Settlements
BTU
CFF
d.f.
CMEA
ECLAC
ECU
EEC
FAO
f.o.b.
GATT
GDP
GNP
IDA
lEA
IFAD
IFC
IMF
LIBOR
mbd
MERM
MIGA
NAIRU
British thermal unit
Compensatory Financing Facility of the International Monetary Fund
Cost, insurance, freight
Council for Mutual Economic Assistance
Economic Commission for Latin America and the Caribbean
European currency unit
European Economic Community
Food and Agriculture Organization ofthe United Nations
Free on board
General Agreement on Tariffs and Trade
Gross domestic product
Gross national product
International Development Association
International Energy Agency
International Fund for Agricultural Development
International Finance Corporation
International Monetary Fund
London Inter-Bank Offered Rate
Million barrels per day
Multilateral Exchange Rate Model of the International Labour Organisation
Multilateral Investment Guarantee Agency ofthe World Bank
Non-accelerating inflation rate of unemployment
viii
NMP
ODA
OECD
OPEC
pb
Project LINK
SAF
SDR
UNCTAD
UNDP
Net material product
Official development assistance
Organization for Economic Co-operation and Development
Organization of the Petroleum Exporting Countries
Per barrel
International Research Group of Econometric Model Builders, with headquarters at theUniversity of Pennsylvania at Philadelphia
Structural Adjustment Facility of the International Monetary Fund
Special drawing rights
United Nations Conference on Trade and Development
United Nations Development Programme
Other net energy exporters(or deficit energy exporters):
The designations employed and the presentation of the material in this publication do not imply the expression of anyopinion whatsover on the part of the Secretariat ofthe United Nations concerning the legal status ofany country, territory, city or area or of its authorities, or concerning the delimitation of its frontiers or boundaries.
The term "country" as used in the text of this report also refers, as appropriate, to territories or areas.
For analytical purposes, the following country classification has been used:
Centrally planned economies: China, Eastern Europe, Union of Soviet Socialist Republics
Developed market economies: North America, southern and western Europe (excluding Cyprus, Maltaand Yugoslavia), Australia, Japan, New Zealand, South Africa
Developing countries: Latin America and the Caribbean area, Africa (other than South Africa),Asia (excluding Japan), Cyprus, Malta, Yugoslavia
For particular analyses, developing countries have been subdivided into the following groups:
Capital-surplus countries: Brunei Darussalam, Islamic Republic ofIran, Iraq, Kuwait, Libyan ArabJamahiriya, Qatar, Saudi Arabia, United Arab Emirates
Deficit countries (or capital-importing countries), subdivided into the following two subgroups:
Algeria, Angola, Bahrain, Bolivia, Cameroon, Congo, Ecuador, Egypt,Gabon, Indonesia, Malaysia, Mexico, Nigeria, Oman, Peru, Syrian ArabRepublic, Trinidad and Tobago, Tunisia, Venezuela
Net energy importers: All other developing countries
The designations of country groups in the text and the tables are intended solely for statistical or analytical convenience and do not necessarily express a judgement about the stage reached by a particular country or area in the development process.
ix

CHAPTER I
THE GLOBAL ECONOMY: THE ROAD AHEAD
The modest expansion that characterized the world economy during most of the first half of the 1980s persisted in1986. Inflation has decelerated considerably and industrialcountries are entering their fifth year ofexpansion, though ata slow pace. Indeed, the world economy appears to be set ina slow growth path, which is likely to delay the great adjustments required at the national and international levels. Thecontinuation in 1986 and early 1987 of the trade imbalancesof the larger industrial economies has added to the strains onthe world financial and trade systems.
Policy makers in major industrial countries have introduced some adjustments in their domestic policies to reducepresent disequilibria, but results have proved elusive. Investors remain hesitant and capital formation sluggish. A highdegree of uncertainty regarding exchange rates, interestrates and prices of key primary products prevails. The debtdifficulties of many countries have intensified, and by early1987 the solution of the debt problem appeared to be fartheraway than when the crisis erupted.
The present situation once again raises serious concernabout the ability of the existing international economic system to cope with these strains. Political tensions have risenas domestic policy adjustments have, in some instances,been deemed insufficient by partner countries. Bilateraltrade balances are increasingly being perceived as importanttargets, as the result ofgrowing impatience about the lack ofa quick resolution of the trade deficit of the largest economy.On the debt front, unilateral decisions have also affectedfinancial markets. Some countries, after a few years of substantial reverse transfers, have started to tailor their debtservice payments - including interest to non-officialcreditors - to domestic growth requirements.
These challenges pose serious risks. Some progress towards meeting them has been made. Policy co-ordinationamong large industrial countries has been strengthened. Solutions are being pursued that involve action on an array ofmacro-economic policies, rather than focusing exclusivelyon exchange rate targeting. In developing countries withbalance-of-payments difficulties, growth-oriented adjustment with increased multilateral support is gradually takingprecedence over short-term measures designed to achievean abrupt reversal in payment trends.
An important feature of the situation is the comparativelyfast economic growth of several of the most populous developing countries. They have generally achieved outputgrowth well above that ofpopulation. In 1986 and early 1987their domestic growth impulses remained strong. Development strategies that rely on the mobilization ofdomestic savings and on a balance among primary, secondary and tertiaryactivities attuned to the stage of development and the humanand natural resource endowment appear to have resulted inhigh and sustained growth. The more autonomous development path of these large developing economies is particu-
larly important at a juncture when growth prospects for theworld economy are precarious.
Economic growth is normally expected to stem from increased and more efficient use of the factors of production,technological change being a major source. The continuedimplementation in 1986 of widespread changes in domesticpolicies - privatization and deregulation in the developedmarket economies, institutional reform in the centrallyplanned economies and structural adjustment, particularlythrough the realignment of prices, in the developing countries - was directed towards achieving increased growthfrom better utilization of available inputs. Some progresshas already been made in this direction, the growth in thepopulous low-income countries being the most notable example.
For some countries, however, changes in per capita income in 1986 were the result of windfall transfers of incomeand wealth arising from changes in international prices.Changes in the prices of traded goods have caused shifts ofbillions of dollars in the distribution of income among countries, commodities, especially oil, being the main source ofsuch transfers. It is estimated that the developing countrieslost some $94 billion as a result of such changes in the termsof trade in 1986.
Other key prices have had a similar effect. The earlierincrease and more recent decline in nominal interest rateshave resulted in large changes in the flow of financial resources among countries and remain one reason for thepresent net transfer of resources from developing to developed countries. Changes in exchange rates, particularlywhen they are of the magnitude experienced in 1986 andearly 1987, also affect considerably the flow of resourcesacross borders.
There are both winners and losers from such changes;countries may benefit in one area and lose in another, or theymay be consistently fortunate or unfortunate. Over the medium term, the first outcome seems to have been the case. Inthe short term, however, much of the diversity in experiencehas been the result of the external environment and cannotbe attributed to domestic performance. Some developingcountries increased the volume of both production and exports of primary commodities in 1986, but are no better offand in many cases are in a poorer position. While the pendulum may swing for these countries and the external environment improve, there is a danger that the present damage totheir economies may be such that they are no longer in aposition to reap the benefits that a change might bring.
Since the unwinding of the major global imbalances is stillahead, it is quite possible that dramatic changes will occurbefore 1990. In this sense, the world economy is in uncharted waters. Resolution of the imbalances will involvesubstantial changes in the pattern of financial flows, and
changes in consumption and investment patterns acrosscountries. Its effects on global production are by no meanscertain, but if the process is orderly there is scope for mostcountries to benefit. A gradual but decisive and co-ordinatedeffort to narrow the large current imbalances could lead to amore predictable world economy, lower real interest rates,faster growth in international trade, and perhaps some recovery in primary commodity prices.
The main themes of the present Survey are the need toreduce uncertainties and achieve more predictability, and theadverse consequences - particularly for most of the developing countries - of the continuation of current trends inworld output and trade. This chapter presents an overview ofthe Survey, its content and the policy recommendations thatemerge from the analysis.
Chapter II examines recent developments in the worldeconomy. The assessment focuses on the reasons behind theslow-down of economic growth in 1986, paying particularattention to the. diversity of the situations prevailing in allcountry groups. In the discussion of the policy setting as atearly 1987, special emphasis is given to policy interactionsamong countries. A forecast based on current policies indicates the need for decisive national and international actionto narrow present imbalances. The baseline scenario suggests the continuation of world economic expansion at amodest rate; the analysis, however, indicates that the downward risks are great. Accordingly, two alternative scenariosare presented. One assumes tighter co-ordination ofpoliciesamong major industrial countries. The other analyses theglobal effects of a substantial reduction of interest costs indebtor developing countries. Both scenarios show an improvement in performance over the baseline scenario.
Chapter III identifies emerging trade patterns and discusses commercial policies. The working of the trading system and, in particular, the large trade imbalances amongmajorindustrial countries and their relation to exchange ratevariations are paid particular attention. Two interrelated issues - the changing commodity structure of trade in the1980s and the large fall in commodity prices, oil in particular~ are also examined. A section is devoted to the increasing importance of services in international tradediscussions.
Chapter IV reviews the recent changes in financial transfers. It assess'es intercountry flows of financial resources illthe 1980s, including the new reverse transfers from traditionally capital-importing developing countries. The analysis highlights the external debt crisis of a large number ofdeveloping countries and other key international financialdevelopments. It focuses on the new pattern of trade flowsof the largest economy. The financial flows required to balance its large trade deficit are not only large but are also
changing in character. The substantial changes in the structure of financial flows and the mechanisms being used toeffect them are examined. The probable impact of this on thepattern of prospective flows to developing countries provides the starting point for policy recommendations.
Chapter V analyses the decline in oil prices in internationalmarkets,its causes and consequences. The changingenergy consumption patterns and' petroleum productionshifts across countries that have come about as a result of thedrop in the price of oil are examined. The review of newinvestment trends and the reduction in petroleum exploration and development leads to policy conclusions that emphasize .the importance of a multilateral approach to avoidfurther market instability and prolonged under-investmentin the energy sector.
Chapter VI reviews the 1986-1990 development plans ofthe European centrally planned economies and China. It examines past economic trends and their relation to target setting in the current plans. The analysis covers the structuralchanges envisaged and their relationship to the investmentprocess and industrial programmes. In particular, it focuseson the modernization drive and the rapid expansion plannedfor the high technology branches. In the European centrallyplanned economies, CMEA integration efforts in scientificand technological development receive special consideration. The plans also emphasize the means to participatemore actively in the global trade and financial framework.
The analysis of the medium-term plan of China centres onthe efforts to reconcile a stable yet comparatively high rateofgrowth with widespread economic adjustments in the context of reforms launched at the end of the 1970s.
Chapter VII examines current employment trends and thepersistence of high unemployment in most developed market economies. It analyses the social and economic dimensions of the unemployment problem and contrasts thesituation in the different industrial countries. The main hypotheses that attempt to explain the phenomenon are reviewed and the key challenges faced by policy makers areidentified. In this context, special attention is paid to thepolicy implications of the trends in unemployment, including the role of internationally concerted action.
Chapter VIll discusses the economic performance of thefast-growing developing countries in the 1980s. Several factors, including the role ofagriculture, the export-orientationof the economy, the reliance on external savings, the trend inkey domestic balances, and the variation in terms of tradeare reviewed in an attempt to explain why these countries didbetter than other developing countries. The assessmentprobes the interaction between the changing internationalenvironmentand domestic policy responses.
Economic growth in 1986: salient features
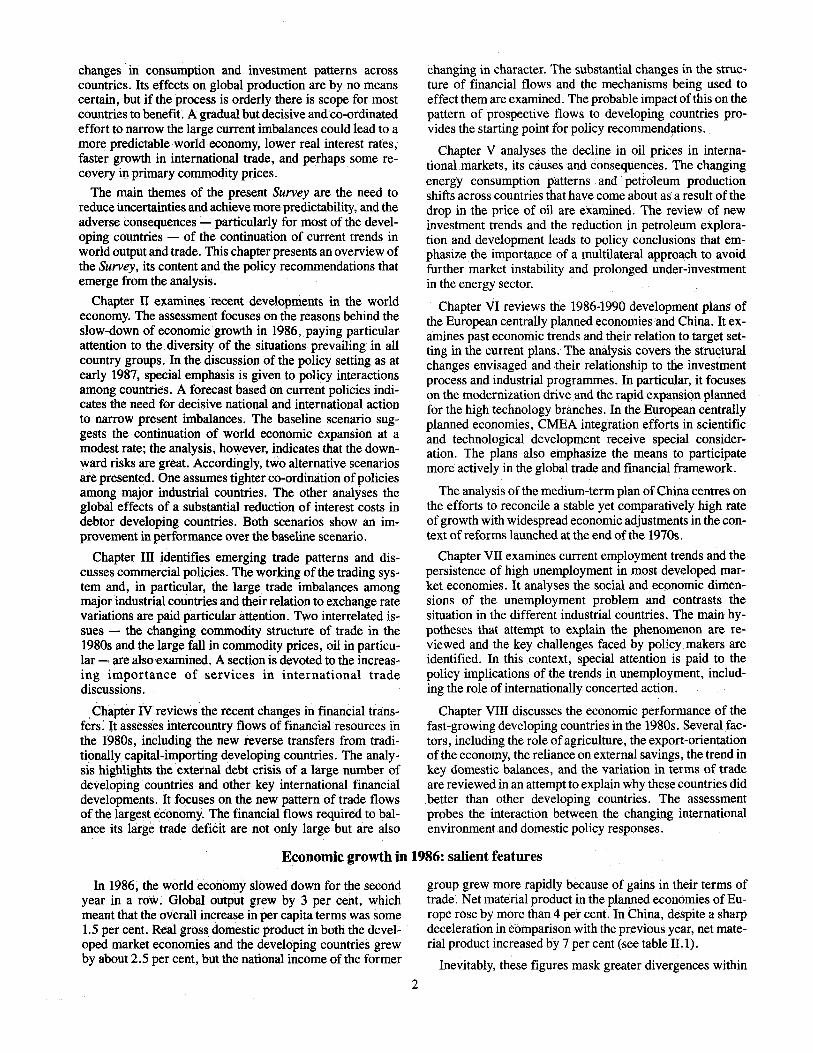
In 1986, the world economy slowed down for the secondyear in a row. Global output grew by 3 per cent, whichmeant that the overall increase in per capita terms was some1.5 per cent. Real gross domestic product in both the devel~
oped market economies and the developing countries grewby about 2.5 per cent, but the national income of the former
2
group grew more rapidly because of gains in their terms oftrade. Net material product in the planned economies of Europe rose by more than 4 per cent. In China, despite a sharpdeceleration in comparison with the previous year, net material product increased by 7 per cent (see table II.I).
Inevitably, these figures mask greater divergences within

the different groups of countries. They also fail to give aninsight into the present qualitative characteristics of theworld economy.
The diversity in performance is greatest among the developing countries. So far, despite their joint efforts, nationalGovernments and the international community have beenunable to devise ways and. means of ensuring sustainedgrowth for all the developing countries. In a small minorityof them, acceptable rates of growth have been attained overthe medium term; in only a handful has progress been consistently good.
The majority of developing countries have not enjoyedsuch sustained success. Periods of favourable growth haveoften been followed by· a more mediocre performance.Many countries have stagnated over the medium term. Theonly encouraging element is the evidence that fortunes maychange over time: a reversal in domestic policies, an improvement in weather conditions or a more favourable international economjc. environment have all served. to reversethe deterioration that many developing countries have encountered in the past decade.
The performance of developing countries during .1986conformed to this erratic pattern. The heavily indebtedcountries, with few exceptions, remained slow growers.They were joined by the energy-exporting countries afterthe collapse in the price of oil during 1986. The energyexporting, heavily indebted countries found themselves in adire predicament. The three most populous energy-exporting countries - Indonesia, Mexico and Nigeria - experienced a significant drop in per capita income; in severalother energy-exporting countries, the fall in national incomeexceeded 10 per cent.
The misfortunes of the energy-exporters were mirrored inthe gains of energy-importing countries from lower oilprices. Even for many ofthese countries, however, the yearalso brought bad news, in the form of a continuation of thedecline in non-oil commodity prices that characterized theprevious years of the decade. In real terms, commodityprices are at their lowest level in more than 50 years - sincethe Great Depression - and there are no signs of a generalimprovement.
The countries least affected by these changes in internationalmarkets tend to be the large and the diversified economies. Among the developing countries, Bangladesh, Brazil,China, India and. Pakistan performed comparatively wellduring 1986 (see table n.9). Ofthese, Brazil is an exceptionin that it is a middle-income, heavily indebted country,whose outstanding performance in 1986 appears to havebeen temporary. The remaining four countries are amongthose with the world's largest populations and the lowestincomes. Their economic growth rates during the mid-1980sare encouraging, particularly when viewed against theirprospects of a decade or two ago.
In contrast to this general picture, the economic situationin most countries in Africa is critical. Most of the countriesin the region are smallartdlack tbe diversity oflarger low~income countries. Their greater exposure to the intenlational economy has been more of a cost than a benefit in
3
recent years, when prices for the commodities on which theyare heavily dependent have been collapsing. Weather conditions improved for most sub-Saharan African countries in1986, but civil strife in several countries continued to inflictunacceptable human suffering.
Latin America continues to be overwhelmed by problemsemanating from its high level of indebtedness to foreigncommercial banks. A number of countries in other conti~
nents are similarly afflicted. Most of them have sufferednegative economic growth in one or more years in the recentpast. There is widespread evidence that the poorest groupswithin these countries have borne the brunt of the contraction that has taken place. A continuation of the present economic hardship in these countries will have wide-rangingnegative consequences, both within the countries themselves and for the world econqmy in general.
The diversity in economic performance among the developing countries contrasts with the similarity in the growth ofper capita incomes in the industrial countries in 1986. Thecentrally planned economies of Eastern Europe and theUSSR increased net material product by about 4 per cent in1986, most countries falling in the range of 3 to 6 per cent.With population increasing by about 1 per cent, per capitanet material product increased by some 3 per cent during theyear.
The developed market economies as a group recorded asimilar increase in per capita income. These countries arenow in their fifth consecutive year ofgrowth and no reversalis currently anticipated. This unusually long period of expansion of output has been maintained despite the existenceof a number of basic disequilibria in this group of countries- disequilibria between members of the group as well aswithin individual countries.
Global financial instability and market disequilibria:the dangers ahead
The baseline scenario described in chapter II indicates thata continuation of current policies would increase world output by about 3.5 per cent during the period 1987-1988. Developed market economies are likely to grow at between 2.5and 3.0 per cent in this period, so that their per capita incomeshould increase at an annual rate ofcloseto 2 per cent, However, there are no grounds for complacency. First, this rate isinadequate to revive world trade, to alleviate debt burdens,to reduce unemployment and to lead to a decisive narrowingof the trade imbalances among the major industrial countries. Crisis management is likely to continue to be a featureof the world economy under such circumstances. Secondly,and perhaps more important, there are considerable downward risks in this scenario. A slow growth path, accompanied by large domestic and external disequilibria, makes theworld economy extremely vulnerable to new shocks. Lingering uncertainties regarding both the tradf: and fiscal deficits of the largest economy and the domestic andinternational policies to cope with them can lead to suddenchanges in investment plans and consumer confidence. Adeceleration of growth in the United States of America at atime when output in major partners is sluggish would have
serious repercussions on overall growth. The possibilities ofa recession cannot be dismissed.
The fragility of the situation has also to be seen in terms ofthe room for manoeuvre of the largest economy. There is noscope for fiscal expansion; on the contrary, the required correction of the deficit calls for fiscal contraction. Monetarypolicy in the United States, which was not restrictive in1986, had to confroIlt a rapid depreciation of the dollar inearly 1987. Partly because of this, the baseline scenario foresees an increase in the interest rate of about 1 percentagepoint in 1987. Persistentpressures on the dollar might lead toa further review of monetary targets, a reduction in the rateof growth of the money supply and even a larger increase ininterest rates. In such circumstances, investment in developed and developing countries will decrease, with adverseeffects on global output in both· the short and the longerterm.
These macro-economic imbalances are accompanied bydisequilibria and instability in a number of markets for particular goods and services. Central among these are the international commodity markets, of which oil is the mostimportant. The year 1986 saw very sharp fluctuations in theprice ofoil. During the first seven months, oil prices fell bytwo thirds, but then recovered following the reduction in oiloutput decided by OPEC in August 1986 and again in December 1986. At the end of the year, the price was about halfthe level ofa year earlier.
The short-run effects of the price drop on oil demand andsupplywere considerable. The immediate effects on oil consumption surpassed expectations based on past estimates ofthe price elasticity of demand for oil. Oil consumption hasceased to decline and, at current prices, is expected to increase by about 2 per cent a year in the medium term. Thesupply situation is more complex since the change in oil production was a cause as well as an effect of the slide in oilprices. Lower oil prices have resulted in some productioncut-backs, especially in the United States, but low operatingcosts have allowed other oil-producing countries and regions to continue full production. OPEC members and someother countries have nevertheless cut back production in aneffort to maintain the new price level.
An important implication of the 1985-1986 oil price dropwas the shift of income from oil exporters to oil importers,largely reversing the income effects of the two oil shocks ofthe 1970s. The longer-run implications of the fall in oilprices depend on how long prices remain depressed. Energyinvestments however have already been affected. Expenditures on oil exploration and development, as well as on othersources ofenergy, declined in 1986 and there are few indications· that they will recover soon. As a result, developedmarket economies will become increasingly dependent onoil supplies from the developing countries, particularly fromthe low-cost producers of the Middle East.
Ifthe world economy is to avoid the adverse consequencesof oil price volatility, it will be necessary to seek ways andmeans of promoting international co-operation in this crucial market. Investments in energy are long term in natureand excessive gyrations in the market render price signals
4
unreliable, resulting in periodic market upheavals.
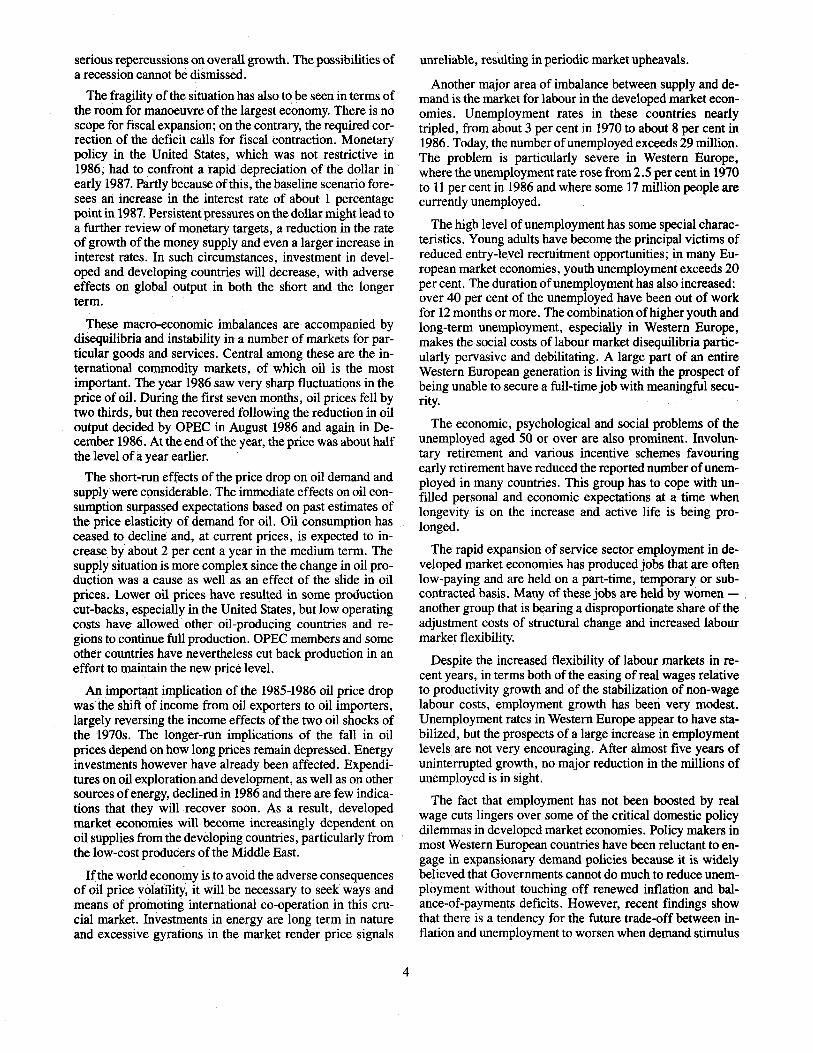
Another major area of imbalance between supply and demand is the market for labour in the developed market economies. Unemployment rates in these countries nearlytripled, from about 3 per cent in 1970 to about 8 per cent in1986. Today, the number ofunemployed exceeds 29 million.The problem is particularly severe in Western Europe,where the unemployment rate rose from 2.5 per cent in 1970to 11 per cent in 1986 and where some 17 million people arecurrently unemployed.
The high level of unemployment has some special characteristics. Young adults have become the principal victims ofreduced entry-level recruitment opportunities; in many European market economies, youth unemployment exceeds 20per cent. The duration ofunemployment has also increased:over 40 per cent of the unemployed have been out of workfor 12 months or more. The combination ofhigher youth andlong-term unemployment, especially in Western Europe,makes the·social costs of labour market disequilibria particularly pervasive and debilitating. A large part of an entireWestern European generation is living with the prospect ofbeing unable to secure a full-time job with meaningful security.
The economic, psychological and social problems of theunemployed aged 50 or over are also prominent. Involuntary retirement and various incentive schemes favouringearly retirement have reduced the reported number ofunemployed in many countries. This group has to cope with unfilled personal and economic expectations at a time whenlongevity is on the increase and active life is being prolonged.
The rapid expansion of service sector employment in developed market economies has produced jobs that are oftenlow-paying and are held on a part-time, temporary or subcontracted basis. Many of these jobs are held by women - .another group that is bearing a disproportionate share of theadjustment costs of structural change and increased labourmarket flexibility.
Despite the increased flexibility of labour markets in recent years, in terms both of the easing of real wages relativeto productivity growth and of the stabilization of non-wagelabour costs, employment growth has been very modest.Unemployment rates in Western Europe appear to have stabilized, but the prospects of a large increase in employmentlevels are not very encouraging. After almost five years ofuninterrupted growth, no major reduction in the millions ofunemployed is in sight.
The fact that employment has not been boosted by realwage cuts lingers over some of the critical domestic policydilemmas in developed market economies. Policy makers inmost Western European countries have been reluctant to engage in expansionary demand policies because it is widelybelieved that Governments cannot do much to reduce unemployment without touching off renewed inflation and balance-of-payments deficits. However, recent findings showthat there is a tendency for the future trade-off between inflation and unemployment to worsen when demand stimulus
is weak. There is mounting evidence of this "hysteresis"effect in Western European economies. According to thishypothesis, the cost of government inaction is not zero; itmeans a more difficult policy choice for the future.
Current trends in international trade
World trade grew slowly in 1986. The only significantstimulus was the increase in the volume of imports of thedeveloped market economies, part of which was accountedfor by the rise in oil imports. Exports of these economiesincreased only marginally because of the sharp reduction inthe volume of Japan's exports, the failure of exports fromthe United States to grow, and the 20 per cent fall in theimports of the energy-exporting developing countries.
The volume of exports of this last group increased byabout 10 per cent. Imports of the energy-importing countriesincreased a little; but were limited by the continuing balance-of-payments constraints of the heavily indebted countries. Exports of the energy-importing countries rose byover 6 per cent; much of this increase was accounted for bythe sales of the major exporters ofmanufactures to the developed market economies.
Coupled with the changes in international prices, theseshifts in the .pattern of trade led to important changes in thebalance of trade. The developed market economies' tradedeficit of $40 billion in 1985 turned into a small surplus in1986. Within the group, the United States deficit and thesurpluses of the Federal Republic of Germany and Japan allincreased, and an important feature of international trade in1986 was the apparent failure of the large exchange ratemovements during the year and in 1985 to correct these imbalances. The developing countries' overall trade surplusshrank, the energy exporters' surplus declining by considerably more than the energy importers' deficit. The overallbalance of trade ofthe Eastern European planned economiesdeteriorated, but a drastic reduction in imports and a largeincrease in exports led to a decline in China's trade deficit.
Some of the current features of international trade are reflections of the continuing long-term changes in the structure of production and demand in the world economy. Thecomposition of the world product is changing along a historical trend, with a shift from the primary sector to manufacturing and, in developed countries, a sharp increase· inservices. Much of the output of any country is not tradable;in world trade, however, manufactures have long grownfaster than primary commodities and at present account forover 60 per cent of world merchandise trade.
Despite the increased global importance of trade in manufactures, most developing countries still depend heavily onprimary commodities to generate foreign exchange. Almostthree quarters of the developing countries depend on primary commodity exports for over three quarters of their export earnings. This high degree of dependence means thatthe continued declines in commodity prices in 1986 had serious consequences for many countries. While some developing countries gained, there was a 30 per cent decline inthe
5
terms of trade of the developing countries with the developed market economies in 1986, and the group as a wholesuffered an unprecedented terms-of-trade loss estimated at$94 billion for the year.
The continuing weakness of non-fuel commodity pricesduring the 1980s is a result partly of the slow growth of theworld economy and partly of some fundamental changes inthe developed countries. The shift to services has meant apattern of production that is less material intensive. At thesame time, the quantity of materials required per unit of output of goods has been declining. These two irreversiblechanges have reduced the use ofprimary products per unit ofgross domestic product.
A further reason for the weakness of commodity prices isthat supply has failed to adjust adequately to the level ofdemand. Even in a sector where demand has increased andwill continue to do so, namely food, there is a sharp mismatch between supply and demand at the global level. Somelarge developing countries have achieved the goal of selfsufficiency in food and their demand for imports has fallenaccordingly. These efforts have not been matched by adjustments in the policies of the developed countries, leading toglobal overproduction ofsome products.
The developing countries still account for only 12 per centof total manufactured exports but were responsible for thebulk of the increase in this trade in 1986, when manufactured exports of the developed market economies remainedpractically stagnant and those of the planned economies increased only slightly. There is an increasing concentration ofmanufactured exports within the developing countries, 10countries and areas accounting for 80 per cent of the group'stotal. In 1986, exports from these few countries increased by15 per cent, mostly to the developed market economies sincedemand from the developing economies, especially the energy exporters, had contracted.
International trade in services has matched the growth oftrade in goods, non-factor services remaining at about 20 percent of total merchandise trade for the past decade. However, the proportion of traditional services, such as shippingand other transportation, has been declining, while the shareof information-based business services has been expandingrapidly.
An acceleration in the pace ofinternational trade is criticalto the solution of the debt problem and to a smooth unwindingof the trade imbalances of industrial countries. The outlook, however, is for a rather modest growth of trade in thenext few years. This vulnerability exposes the world economy to grave danger from a number of threatening sources.With constrained export growth, debt servicing might become irregular in more debtor countries. Protectionist pressures in large industrial countries might intensify andexacerbate present tensions, any action precipitating widespread retaliation. In addition to the strains under which it isalready struggling, the international trading system seemscertain to face further difficulties unless a number of majorpolicy decisions are taken.
The transfer problem in the second halfof the 19808
. Many capital-importing developing countries, particularly oil exporters, had to draw heavily on their foreign exchange reserves to finance larger current account deficits in1986. For the capital-importing developing countries as agroup, it is estimated that there was a net outflow of financial resources - net capital flows minus net investment income - of$24 billion in 1986; this is the same as the revisedestimate for 1985. In each of those years, 24 countries experienced negative net resource transfers. In such countries asthe Republic of Korea, this was the result of the stronggrowth ofexport earnings; in most cases, it reflected mainlyimport limitations and constrained economic growthbrought about by the inadequate availability of external financing. In 1986, net inflows ofofficial financing continuedto be insufficient to offset the negative net transfers arisingfrom private flows.
Net credit flows to the United States, in contrast, expanded by $24 billion in 1986, reaching $147 billion. Statesmembers of the European Economic Community, especiallythe Federal Republic ofGermany, were again a major sourceof these inflows but flows from Japan were more than twiceas large, reaching $53 billion. Of significance for the futurecourse of capital inflows to the United States and for theexchange rate of the dollar, net private credit flows were $11billion lower in 1986 than in 1985. This decrease was morethan offset by an expansion of foreign official inflows intothe United States, mainly the result ofofficial intervention inthe foreign exchange markets to slow the fall in the value ofthe dollar.
The institutional changes in international finance that havebeen under way in recent years reached dramatic proportions in 1986. Net international purchases of securities byJapan were almost $70 billion, while net sales of securitiesabroad by the United States were almost $90 billion. Threeyears earlier, these flows were virtually non-existent. Developing countries are largely bypassed by such flows: theywere able to arrange $7 billion of new international bondissues in 1985, a peak year, but only $3 billion in 1986.
Total international bank lending continued to growstrongly in 1986. It was concentrated on borrowers in themajor financial markets and especially in support of, or aspart of, international securities operations. Internationalcommercial banks continued their withdrawal from medium-term lending to developing countries; this accountedfor only 6 per cent of new bonds and medium-term bankfinancing in 1986, in contrast to roughly one quarter in theearly 1980s. '
Developing countries have not been favoured by recenttrends in foreign direct investment. Net flows to the capitalimporting countries have stagnated at between $8 billion and$9 billion since 1983. Direct investment flows among developed market economies continue to flourish, the most pronounced recenttrend being the growing net investor positionofJapan in foreign manufacturing and in services, especiallyfinancial services.
The international growth of Japanese banks, fuelled in
6
part by domestic funds and in part by resources mobilized inforeign markets, raised Japan to the status of the world'slargest international banking nation in 1985. By September1986, Japanese banks held over $1 trillion in internationalassets, equivalent to almost one third of the world total' thenext largest was the United States, with a share of less ilian20 per cent. Japanese investment banks have also assumed amajor role in international securities markets.
While the large current account surpluses of some of thedeveloped market economies should naturally flow to capital-scarce countries, this is not occurring. Recently, concernabout this stateof affairs in various countries, Japan in particular, has led to initiatives to recycle a larger part of thosesurpluses to developing countries. Such initiatives appearpromising, but the progress achieved has been overwhelmedby other developments.
Indeed, the dynamism in international financial relationsamong the developed market economies stands in sharp contrast to the stagnation of North-South financial flows. Notonly has there been diminished interest in private sector investment in the developing world, but official flows havealso weakened. Non-concessional bilateral credits, primarily export credits, have decreased, but so too have creditflows from the International Monetary Fund; indeed, repayments to the Fund of earlier loans (excluding payments ofFund charges) exceeded new credits to developing countriesby almost $3 billion in 1986.
The strongest component of official flows to developingcountries - aside from grants, which largely reflected thegenerous international response to the African food emergency - has been the flow from the multilateral development institutions. This component was strong mainly incomparison with a seriously weakened situation elsewhere.In 1985, the net transfer of resources associated with totalofficial lending had become negative or was very small forall major categories ofcreditors except the multilateral institutions. The net transfer associated with those institutionshowever, peaked in 1982. '
There are no indications of any recharging of official financial flows for development. A widely shared assessmentof the prospects for official development assistance is that itwill grow by no more than 2 per cent annually in real termsduring the remainder of the decade. Nominal gross resourcecommitments of the multilateral development institutionsa rough proxy of current and forthcoming disbursementsand operations - recovered from an earlier fall by increasing 15 per cent in 1985, but then grew only 4 per cent in1986.
Under current trends, private flows to developing countries will be limited at best; the reductions that have alreadytaken place are unlikely to be replaced by official flows. Inany event, the weak expectations for the growth of worldtrade raise doubts about the volume ofnew net credit inflowsthat many developing countries could service. The growthof only ~ per cent. in ~he total debt of the capital-importingdevelopmg countnes 10 1986 may itself have been excessivein that the level of debt of many countries already exceededwhat they could service. The ratio of debt to foreign ex-
change earnings of the capital-importing countries as awhole is estimated to have reached a new high of 213 percent in 1986 - about one quarter more than at the beginningof 1982.
The economic burden of servicing debt has grown correspondingly for many countries. Sub-Saharan Africa (excluding Nigeria) has recently had to pay almost4 per cent ofits GOP in interest charges alone, compared with well under2 per cent in the late 1970s. These countries' interest payments since 1984 were equivalent to about 25 per cent ofinvestment spending and almost 20 per cent of the value ofimports, both of which are alternative uses of the resourcesinvolved. For a group of 15 middle-income, heavily indebted developing countries, interest payments absorbedless than 2 per cent ofGOP in 1978, over 5 per cent in 1982and still over 4 per cent in 1986. Since 1983, interest payments have been over 25 per cent of investment and over 50per cent of imports for these countries. Current expectationsare that the ratio, of interest payments to GOP for this groupof countries will fall, but will remain in the neighbourhoodof3.5percentin 1990.
Redirections in policy in the centrally plannedeconomies
In the centrally planned economies, the second half of thepresent decade promises to be a time of major economicrestructuring stemming from far-reaching institutional readjustment. This process, which is already under way in themajority of these countries, was fostered by the pressingneed to overcome the slow-down in growth and the persistent economic imbalances of the previous quinquennium, andhas been stimulated further by the ongoing reassessment ofdevelopment priorities, policies and practices in the Unionof Soviet Socialist Republics.
The exhaustive policy discussions on the formulation ofthe socio-economic strategy for the current medium-termplans in the Eastern European countries and the USSR centred on the identification and elimination of the fundamentalcauses of the sluggish economic performance ofrecent yearsand aimed at shaping the ways and means of generating amore buoyant and sustainable pace of expansion. The decision makers had to come to grips with slowly expandingproductive resources, embedded rigidities in managementand planning systems, slow productivity growth and inadequate export performance. The remedy to those problemswas sought in a strategy of resource-efficient growththrough consistent systemic changes and more vigorous investment and structural policies, bolstered by an acceleration of technological progress.
The medium-term plans for 1986-1990 ofall the Europeanplanned economies stress the need for more rapid capitalformation in order to buoy the growth of output and to undertake structural change so as to increase productivity inthe years ahead. The new plans emphasize the further correcting of the external sector through positive adjustmentpolicies that envisage marked structural changes in the composition and quality of production and the material and energy intensity of output. The objective is to re-equip the
7
productive structure through more rapid growth of investment, the accelerated replacement of obsolete fixed assetsand cuts in gestation periods and construction costs.
Industry is to be the fastest growing sector in all of theseeconomies. Structural changes are expected to bring about asharp rise in productivity, particularly in high-technologybranches. The output of energy and material-intensive production is to increase moderately, even though extensiverenovation of fixed assets in those sectors is also contemplated. The medium-term targets for the agricultural sectorand the food industries are designed to ensure greater selfsufficiency and, where feasible, exports. Eliminating vulnerability to weather fluctuations, curtailing losses andimproving the agro-industrial infrastructure appear to be themajor objectives. Construction activity will expand onlymodestly, but more emphasis will be placed on shorteninggestation periods and improving both the quality of outputand labour productivity. Important features of the new plansare greater attention to environmental policy and modernization of infrastructure.
The plans remain firmly committed to steady, if modest,increases in personal consumption levels. Gains in this areawill be linked more closely to growth in overall output andefficiency by making renumeration more dependent on productivity gains. All plans highlight the need for consumerprice and income policies to be more active and flexible inbalancing supply and demand for goods and services.
The measures envisaged to promote these objectives aretwofold. First, each country has been re-examining its developmental priorities and the ways and means of implementing its objectives. In several countries, furtherdecentralization of decision-making is to proceed by way ofmarket-like instruments of indirect economic co-ordinationand their supporting institutions. One set of changes envisaged involves the enhancement of the role of indirect economic levers and incentives by appropriate modifications inmanagement, pricing and procurement systems. Secondly,the intra-group institutions and policies, especially withinthe context of CMEA, are to be recast.
Greater importance is being attached to the steady development of East-West trade and economic co-operation,which will be decisively influenced, first, by the international political and strategic climate and, secondly, by theadaptation ofcontractual and institutional mechanisms to thecommercial and financial changes. In this context, the plansemphasize more active participation in global trade and financial frameworks and the need to promote exports ofmanufactures with a substantial value added content. Theyaccordingly stress the need to reshape the trade mechanismsof these countries.
Trade among CMEA members is to expand sharply increasingly by means ofdirect ties among economic agentsat different levels of the planning hierarchy. One focus ofCMEA integration efforts is the implementation of the comprehensive programme for co-operation in science and technology, which seeks to promote direct and permanentintra-group links in research, development and production.The steady development of trade and economic co-operationwith other groups of countries is also emphasized.

Structural adjustments in China
The key objective of the current medium-term plan ofChina is to stabilize the economy, while continuing with thewidespread economic adjustments in the context of reformslaunched since the late 1970s. The 1986-1990 plan calls forfurther progress in the reform of the enterprise, pricing andfinance systems; a more pronounced shift away from capital-intensive production is emphasized. To gain room forreform and yet eliminate imbalances in the domestic economy and in external trade and payments, ad~eleration inthe growth of aggregate output is planned. At the same time,the composition of output should shift from the primary tothe tertiary sector. The adopted moderation in growth targets serves the purpose of easing bottle-necks in energy,transport, intermediate goods, consumer dutables and, inparticular, the external sectors.
Agricultural growth and rural industrialization are to continue at a steady pace,though well below the highly dynamicpace of the early 1980s.The sector's buoyancy is becomingincreasingly dependent on an upturn in capital formationand improvement in production and distribution systems. Industrial policies recognize the need to bolster growth in ba-
sic sectors, such as energy and primary industrial inputs,and to foster consumer goods industries in order to meet thepent-up demand that has resulted from gains in personal incomes in recent years. A brisk pace of investment in productive capacity, infrastructure and housing is projected,although at a lower rate than realized in recent years andwith greater control over the extrabudgetary investment ofenterprises and local government. The immediate focus oftrade policy is to reverse the foreign trade and paymentsdeficit, while acquiring the technology and materials essential for economic growth and promoting exports ofmanufactured goods. At the same time, China's policy regardingforeign direct investment .and foreign credit is rather cautious.
The current schedule ofongoing economic reform centreson the reshaping of urban enterprise management, includingwage and employment systems, the focus to be directed bythe end of· the decade towards adjustments in macro-economic planning and control, prices and finance. Yet the paceof the process is still uncertain. Reforms will apparently beimplemented with considerable caution and restraint in order to avoid organizational disruptions and aggravation ofinflationary pressures.
Policy conclusions
World economic growth is at present weak and fragile.The prevailing uncertainties point downwards: the simultaneous occurrence of only some of the latent negative influences could readily move the world economy into globalrecession. Unless international trade prospects improve, it isunlikely that significant progress will be made towards solving the debt crisis or speeding up the reduction of the largetrade imbalances of the industrial countries; the economicstagnation in most medium-sized and small-sized developing countries could continue, widening the income gap between most developing countries and the industrial world;high unemployment might persist in developed countries.
To change this scenario, domestic efforts are required inall countries. But some measures clearly require jointaction. Mutually supportive measures are necessary in theinterdependent world economy of the 1980s. The economicand political interrelationships among issues have to betaken into account.
In any assessment of the international situation, the firstpriority must be the stabilization of economic relationsamong the major actors in the world economy. No plans forthe organization of the international economic system haveseriously considered a situation of major conflict of interestamong the most advanced economies of the world. It hasbeen assumed, over the years, that their interests in the management of international economic affairs would fundamentally coincide, as in many matters they have.
The present situation is one in which the Governments thatcommand decisive influence over the world economy findthemselves in dispute over the economic policies they oughtto adopt. The conflict is real and serious. There is broadagreement on principles, but there are great obstacles.Long-term commitments regarding some key domestic policies, public opinion and the views of smaller but influential
8
groups are among the major obstacles because they may impede the implementation of measures that are agreed amongpolicy makers. The measures taken to implement collectivedecisions must include public awareness campaigns. Leaders of the major industrial countries have to emulate the resolve of those of their counterparts in developing countrieswho have adopted bold, sometimes unpopular, reforms.
A more assertive stance on the part of the leading economies is indispensable to extricate the world economy fromits present predicament. Unless these Governments are able,collectively, to remedy the imbalances and other disequilibria in the world economy, other measures will prove ineffectual.
Policy issues requiring action within a multilateralframework
Trade is the first concern. The multilateral trading systemhas been eroded by bilateralism and managed trade. Therehas never been any lack of verbal commitment to improvethe system and past experience shows that liberalization efforts can be successful if they are backed up by action. Thecommitments made at Punta del Este, Uruguay, marked animportant step towards strengthening the system and preventing its further deterioration: it is necessary to ensurethat these commitments are carried through.
The major difficulties confronting the trading system arealready well known; they have been analysed and discussedin great detail over the years in numerous forums, includingthe various GATT committees, especially since the GATTMinisterial Declaration of 1982. Familiarity with the problems and the dangers they pose have not prevented their escalation. Protectionism seems set to embark on anotherworld-wide rampage, as countries begin an acrimonious de-
bate and adopt forceful but short-sighted measures. The negotiating process that has already begun as a follow-up to thedecisions at Punta del Este provides the opportunity to haltthis process, but a much greater political will than has beenevident in the recent past is necessary for the successfulcompletion of these negotiations. Early implementation ofthe standstill and call-back provisions remain an importantpriority.
The recently announced intentions of the centrallyplanned economies to enhance their role in the process ofworld-wide economic change and to participate more actively in international trade, financial intermediation andtechnological development open the possibility ofexploringways by which this could be achieved in the existing or amodified multilateral framework. The more flexible optionof engaging in international trade at the enterprise levelshould invigorate the trade of the centrally planned economies.
A major threat ~o the trading system stems partly from thepersistently large trade imbalances of the large industrialcountries. Multilateral surveillance could help prevent largedisequilibria, lead to a more symmetrical adjustment process and be less costly in global terms than the present arrangements. Notwithstanding these potential benefits,progress in this field has been modest. The work of the International Monetary Fund and its members to strengthen multilateral surveillance through the use of objective economicindicators is a promising avenue. It would enable Governments to assess the interaction of domestic policies and theperformance of major economic actors, and to examine theimpact of their decisions on developing economies. Moredecisive support by all for the process of multilateral consultation and for the policy role of the Fund is fundamental ifsurveillance is to be effective in addressing major world economic problems.
Excessive instability in foreign exchange markets is adding to global uncertainties and hampering trade-related investment. There would seem to be a convergence of opinionin the views of the Group ofTen (of the developed countries)and the Group of Twenty-four (of the developing countries)that what is required is not a system of fixed exchange ratesbut one that permits flexibility with a degree of stability.Discussions on this issue continue in the Interim Committeeand the Executive Board of IMP. Global needs clearly pointto the importance of expediting the consideration of this issue. Progress could pave the way for an international monetary conference to decide on the global framework forexchange rate policies and also consider other outstandingissues included in the most recent reports of both the GroupofTen and the Group of Twenty-four.
The violent swings in oil prices, the large changes in theexport earnings ofenergy-exporting countries and in the import bills of energy-importing countries, and the drop in energy investments in 1986, which might lead to disruptions inenergy supplies in the years ahead, call for the close monitoring of the energy situation and for the exploration of waysin which oil markets could be made more stable. A promising dialogue between producers and consumers has begun;still, there is a clear need for better global monitoring and
9
analysis of oilmarket developments. The United Nations,especially the Economic and Social Council, could initiatesuch a process.
For developing countries, expeditious and flexible accessto official compensatory financing remains a key factor inavoiding the adverse effects of excessive fluctuations in export earnings. The widening in users of the CompensatoryFinancing Facility (CFF) of the International MonetaryFund is an important step forward. Nevertheless, the resources of the Facility are too small in relation to recentfluctuations in export earnings and consideration should begiven to the enlargement both of the Facility and of othersimilar schemes, such as the Stabex system of the EuropeanEconomic Community. In the meantime, the effectiveness ofsuch facilities should be further enhanced to cope withpresent problems. Use of CFF could be more automatic anddrawing limits could reflect the medium-term financialneeds and repurchase prospects of individual borrowersmore closely, rather than being rigidly linked to Fund quotas.
There is a need for new approaches to solve the debt crisisof the majority of developing countries. In resolution411202, adopted by consensus, the General Assembly recognizes the wide dimensions of the problem, the need for common commitment and mutual co-operation and theimportance of action in a number of areas. The recognitionthat growth-oriented adjustment is part of the solution implies that sustained efforts by developing countries to restructure their economies should be supported by a level ofnet transfers that allows them to increase their domestic capital investment. Apart from general policies leading to fastergrowth in international trade, which are likely to be accompanied by a movement of primary commodity prices towards their historical norms, three lines of action appearimportant.
First, there should be more comprehensive relief of theofficial debt oflow-income countries, particularly countriesin sub-Saharan Africa. This relief should be agreed upon inthe context of the adjustment requirements and investmentneeds of individual countries, as contemplated in the newinitiatives being considered by the Paris Club. It is also necessary to ensure that new arrangements lead ultimately to anadditional net flow of official financial resources to lowincome countries. Secondly, official and non-official creditors should contemplate ways to reduce interest costs in thecontext of debt restructuring exercises. The trend towardsthe elimination of fees and commissions and the reduction ofspreads in the restructuring process, as well as the shift fromthe prime rate to LIBOR, are important steps, but, in mostcases, progress towards achieving a rebate on interest - oneither concessional or commercial debt~ has been wanting.Thirdly, there has been increasing recognition that currentlevels ofexternal liabilities are unsustainable for debtors andthe market has discounted the value of their commercial debtaccordingly. There is, therefore, a case for additional formsof debt relief for non-concessionalloans: both lenders andborrowers have an interest in "clearing the books" of thedeveloping countries' debt in its present form. In the contextof restructuring exercises, for example, it is in the interest of

both parties if banks provide some debt relief when the policy package presented by the debtor country will clearly enhance its financial position in the medium term and therebyimprove its debt-servicing capacity.
A more comprehensive approach would be the establishment of a multilateral agency - preferably as part of anexisting institution - to purchase the debt of developingcountries from commercial banks at current. market valueand to convert it into new forms ofliability that would allowdebtor countries some. relief and a different maturity structure. Under the auspices of the United Nations University,the World Institute for Development Economics Research isconsidering a proposed Debt Reconstruction Facility containing these elements. It would be funded primarily throughrecycling part of the external· surplus of Japan·and .wouldreceive financial supportfrom other countries.
Enhanced support by the multilateral developmentinstitutions is critical at this time. Investment levels in developingcountries have been declining, but there isa continuing needfor infrastructural investment to ensure that the foundationsfor economic growth are not lost. Industrial countries shouldincrease their support for the lending programmes of theWorld Bank and the regional development banks. The proposed general capital increases should be effected expeditiously; in the case of the World Bank, this is long overdue.The soft loan resources of all the multilateral financial institutions should also be increased, particularly in view of thedecrease in the value of the dollar. The· recently agreedeighth replenishment of the International Development Association at a level of$12.4 billion may be considered a largeincrease when compared with the seventh replenishment,but it is no larger than the sixth replenishment in real terms.Despite recent efforts such as this, net resource flows todeveloping countries are not increasing adequately. In particular, much remains to be done to achieve the policy targets envisaged in the United Nations Programme of Actionfor African Recovery and Development 1986-1990 (GeneralAssembly resolution S-13/2).
The Venice summit meeting of the Group of Seven majorindustrial economies in June 1987 and the seventh session ofUNCTAD in July will provide the international communitywith the opportunity to progress on many of the questionsidentified above. An essential part of the process, however,is not only agreeing on principles, but deciding who shoulddo what and ensuring - and monitoring - implementation.Firm political support for the multilateral system of economic co-operation should enhance the prospects of overcoming the problems of the industrialized countries andachieving the universally accepted goal of acceleratedgrowth in the developing economies. Moreover, throughtheir feedback effects, the two processes should be mutuallyreinforcing. The resulting international environment willserve as a framework for and be strengthened by a variety ofpolicy measures adopted at the national level.
Policy issues requiring concerted action amongcountries and measures at the domestic level
As recognized by the policy makers of the major industrial
10
countries at the Louvre meeting in Paris in February 1987, aset of co-ordinated policies among the key developed economies is required to extend the life of the present economicrecovery and to achieve a smooth reduction in the large tradeimbalances. The elements of the policy package include areduction in the budget deficit of the United States, an expansionary fiscal stance in the Federal Republic ofGermanyand Japan and a co-ordinated monetary policy to stabilizeforeign exchange markets and avoid interest rate increases.There is considerable agreement on the direction of policiesand some appropriate measures are already in place, butthere is still hesitation regarding required magnitudes. Unless individual countries are able to compromise on some oftheir long-standing domestic commitments at the Venicesummit meeting, growth is likely to remain sluggish. However, as shown in chapter II, a policy scenario in which themajor actors jointly take appropriate decisive action is likelyto lead to a rate of growth in industrial economies of close to3 per cent in 1987, an even higheirate thereafter and only anegligible increase in inflation.
Despite an enhanced flow of information regarding economic co-operation among developing countries, su.ch tradeand financial activities have developed slowly. Nor hasmuch progress been achieved in trade and financial schemesat the regional and subregional levels, even though the mostdynamic economies are part of the developing world. Moreambitious South-South co-operation schemes than those established to date need to be developed to spread growth andbenefit from the fast-growing developing countries. A generalized system of preferences among developing countriesand regional and subregional agreements, focusing on tradecreation rather than trade diversion, could significantly enhance developing countries' prospects for faster and moreefficient industrialization. The larger and more dynamic developing economies could play a key role by opening uptheir rapidly expanding domestic markets as a quid pro quofor more open markets for their exports in other developingcountries.
The centrally planned economies are making concertedefforts to strengthen systemic changes in the institutionalframework of intra-CMEA co-operation. One of the key aspects of these changes is the emphasis on a joint programmefor scientific and technical progress. Supported by a reshaping of the external sector ofCMEA members, promotion ofcross-border ties at the enterprise level and encouragementofjoint venture production in priority areas, this new policyshould accelerate exports in the medium-term and relievethe current account pressures that some members now face.Simultaneously, closer interaction with developed marketeconomies would facilitate the renovation and modernization of the capital stock in key branches, machine-buildingin particular. If the international political climate permits,imports of capital goods from developed market economiesor collaboration in the area of science and technology couldspeed the process oftechnological transformation in the centrally planned economies.
Many developing economies, especially least developedcountries heavily dependent on a few primary commoditiesfor their export earnings, have fragmented economies andlimited adjustment capabilities; they require substantial

changes in their production structures. The formulation andimplementation of the necessary national developmentstrategies are the responsibility ofeach country, but internationalfinancial support - particularly in the first stages --'- remains important. There is a clear need for more decisive,sustained multilateral and bilateral financial assistance· forthose developing countries making efforts to transform anddiversify their economies.
The analysis of the few successful development experiences of the current decade suggest some common elementsin the policy approaches of fast-growing developing countries. First, in countries with agricultural potential, sustained efforts to increase farm productivity and to rewardfarmers and peasants accordingly should lead to substantialgains in agricultural output in the long-term. Secondly, domestic disequilibria should not be allowed to accumul!lte,nor should economies resort primarily to external financingto postpone the adj\lstment called for by such disequilibria.Thirdly, increased reliance on domestic resources and ahigher savings rate are likely to ensurea more steady expansion in productive investment. Fourthly, while a wide arrayof policies in several areas is usually necessary to accelerate
11
growth, it is critical that structural policies be carried out in amacro-economic policy framework that, while providingstability, does not work at cross-purposes with supply sidemeasures. This requires consistency between developmentpolicies and fiscal, monetary and balance-of-payments policies.
The persistence of high unemployment in a large numberof European market economies calls for renewed efforts toprovide additional employment opportunities and to tacklethose factors that impede the smooth functioning of labourmarkets. Measures in this area should be accompanied byactions to increase the demand for labour. There is a case forexpansionary policies to reduce unemployment, especiallyin those countries where inflation is low, where the cyclically adjusted (or structural) budget deficit is close to zeroand where there is no pressure on the balance ofpayments. Ifsuch countries move decisively, others with high unemployment but with pressure on their external accounts would bein a position to expand more freely. Under such conditions, amutually reinforcing acceleration of growth would be accompanied by a marked reductionin unemployment.


CHAPTERll
WORLD ECONOMY IN PERSPECTIVE:KEY FEATURES, POLICIES AND PROSPECTS
Global Overview
In 1986, the world economy slowed down for the secondyear running. Global output grew by only 3 per cent, compared with 3.4 per cent in 1985 and 4.5 per cent in 1984. Onaverage, economic conditions for the peoples of the worldimproved only marginally in 1986. World output per capitaincreased by about 1per cent. This was half the average paceachieved in the 1970s and only a third of that of the 1960s.
The onset ofeconomic depression in many energy-export-
ing developing countries and a significant deceleration in thepace of economic growth in China, Japan and North America were the major factors behind this decline (table 11.1).Large swings in the terms of trade, brought about by unprecedented changes in key raw material prices and exchangerates, and policy responses to them were the major determinants of economic change in the world economy in 1986.The slow-down in global economic activity in 1986 exacerbated two serious problems facing the world economy.
Table II.1. Growth of world output" and trade, 1971-1988
Output
Levelin 1980b
(billionsof
dollars)
Average
1971- 1981-
1980 1986 1984 1985 1986c 1987d 1988d
Percentage change
World
Developing countriesNet energy importersNet energy exporters
Developed market economiesNorth AmericaWestern EuropeJapan
Centrally planned economies of Europee
Chinae
Trade
World trade volume f
Memorandum items:
Per capita outputDeveloping countriesDeveloped market economies
3.9 2.7 4.5 3.4 3.0 3.2 3.7
2085 5.6 1.5 2.2 2.0 2.5 2.7 3.81160 5.0 2.8 3.8 3.4 5.5 4.3 4.5
925 6.4 -0.3 0.0 0.0 -1.6 0.5 2.7
7640 3.1 2.2 4.7 2.9 2.4 2.6 3.02866 2.9 2.4 6.4 2.8 2.6 2.7 3.43467 2.9 1.5 2.4 2.3 2.4 2.4 2.41060 4.7 3.6 5.1 4.5 2.5 2.6 3.0
5.2 3.3 3.8 3.6 4.3 4.1 4.5
5.7 8.8 12.0 12.3 7.0 7.0 7.0
1990 5.0 2.7 8.9 3.2 3.5 3.0 4.0
900.0g 3.4 -0.9 -0.1 -0.3 0.3 0.5 1.610296.2g 2.3 1.6 4.1 2.2 1.7 1.9 2.3
Source: Department of International Economic and Social Affairs of the United Nations Secretariat.
a Real gross domestic product. The classification of countries into the various analytical groups isshown in the explanatory notes to the present Survey. Output data for these country groups andfor each member country are aggregated with weights estimated on the basis of 1980 prices anddollar exchange rates. Developed market economies are aggregated with weights based on 1982prices and dollar exchange rates.
b GNP or GDP level in 1980 based on.1980 prices and dollar exchange rates.c Preliminary estimates.d Forecasts (based on Project LINK and other institutional forecasts). Projections for 1987-1988
are based on an average crude oil export price of $17 a barrel.e Net material product.f Arithmetic average of the growth rates of world volume of exports and imports.g In United States dollars; 1980 prices and exchange rates.
13

First, the international debt situation remains precarious.The total external debt of the developing countries hasgrown to almost $1,000 billion and the ratio of debt-servicepayments to exports for the group as a whole reached a record level in 1986. Involuntary bank lending has become themain feature of private financial flows to many developingcountries as net private financial flows to many of thesecountries have virtually halted (see chap. IV below). Interestpayments on external debt by the developing countries over $65 billion in 1986 - continued to be a major drag ontheir capacity to import and weakened their ability to grow,while the net transfer of resources from developing to developed countries amounted to about $24 billion for the secondyear in a row.
A second adverse effect of the sluggish pace ofglobal economic activity was the continued very high unemploymentrates, especially among the young, in many developed anddeveloping countries. Employment surveys in developingcountries indicate unusually high rates of urban unemployment, while in 10 out of 21 developed market economies,unemployment rates are currently in excess of 10 per cent,and in two countries nearly a fifth of the labour force is outof work.
During the period 1987-1988, the global economy is projected to grow by about 3.5 per cent a year. This modest gainover the mediocre performance in 1986 is chiefly the resultof two uncertain and, to a large extent, transitory forces: amild economic rebound in the energy-exporting countries(on the assumption that the price ofoil will not fall below itslevel of early 1987) and an inventory-led cyclical upturn inthe United States. If the macro-economic policy stance ofthe key industrial countries remains largely the same as inearly 1987, projections for 1987-1988 indicate that worldtrade will remain sluggish, interest rates will not decline anyfurther and will begin to increase, unemployment rates inindustrial countries will remain high and the external imbalances of the major industrial countries will persist. However, two alternative policy scenarios presented later in thischapter suggest the possibility of a significant improvementin global economic performance.
The medium-term outlook does not point to any decisiveimprovement in global economic growth. The slow pace ofcapital formation, caused by sluggish growth of aggregatedemand, lingering uncertainties and high real interest ratesin a large number of countries, remains a major obstacle tofaster output expansion, and to sustained improvement in thestandards of living ofall people throughout the world.
Developmel\ts in 1986 and early 1987
Owing to the slow-down in Japan and North America, thedeveloped market economies grew by only 2.4 per cent in1986, compared with 2.9 percent in 1985 and 4.7 per cent in1984. The sharp decline in exports to the developing countries, especially to the energy exporters, and the continuation of relatively non-accommodating macro-economicpolicies in a few key industrial countries were the majorfactors behind the economic slow-down. Several Western
14
European economies, however, experienced a modest acceleration in their pace of economic activity in 1986. Indeed,most countries in the group entered their fourth or fifth yearofcontinuous expansion, which by post-war standards is anatypically long period for a cyclical upswing; as at early1987, there were no clear signs of an impending generalizedslump. The industrial countries as a group continued to experience significant gains in per capita income in 1986. Atthe same time, greater convergence in their real outputgrowth rates emerged, though at a lower rate than in 1985.
The aggregate gross domestic product of the developingregions grew by only 2.5 per cent in 1986, which impliesthat, for the group as a whole, there was virtually no gain inper capita output that year. More significantly, average percapita income fell by about 4 per cent during the year,largely as a result of a marked deterioration in their terms oftrade.
In most developing countries, agricultural and food production increased at the same rate as population, or faster.Industrial expansion, however, remained sluggish. Miningactivities continued to face depressed export markets. Onthe whole, manufacturing expanded slowly as domestic demand remained weak and balance-of-payments constraintshindered imports of industrial inputs.
Diversity characterized the economic performance of individual developing countries in 1986 as it has in many yearsrecently. More than half those countries had a growth rate ofoutput equal to or less than that ofpopulation (see table 11.2),although most energy-importing developing countries expanded output significantly faster than population. Per capita gross domestic product in the Republic of Koreaincreased by close to 10 per cent, while it increased at between 2.5 per cent and 6 per cent in Argentina, Brazil,Chile, Colombia, Cyprus, India, Pakistan, Turkey and Uruguay. In contrast, whole areas were affected by the declinein oil prices, in particular West Asia and North Africa, andthe per capita gross domestic product of the large majority ofenergy-exporting developing countries fell considerably in1986. It was the unprecedented deterioration in the terms oftrade of this group of countries and, to a lesser extent, ofother exporters of primary commodities th~t was the causeof the overall decline in per capita income in the developingcountries during the year.
Thking a longer-term perspective, per capita output of thedeveloping countries, on average, fell by about 1 per cent ayear during the period 1981-1986, in contrast to the developed market economies, whose average per capita outputrose by 1.6 per cent a year over the same period. An important reason for this difference has been the disparity in average rates of population growth: the average growth rate of2.2 per cent a year for the developing countries was morethan three times that of the industrial countries.
A major concern in the current period of sluggish and, formost developing countries, unstable growth is the protectionof the most vulnerable groups of the population. The problem is compounded even further because large domestic adjustments are required to confront the changing international

Figure 11.1. Nominal and real crude oil prices(Dollars per barrel)
40-.-------------------.....
30
20
10
I•••...............
NOMINALa
REAL b
a Spot price of Middle East light crude oil.b 1980 prices nominally adjusted by the GDP deflator of the developed market economies.
Figure 11.2. Bilateral exchange rates(Index: 1980= 100)
200~----------------_
~1..1.YEN!$
/'.l \
~./ \I ,
r---- \
;Vv' \\" ',-.,/ '.
150
100
Source: Department oflnternational Economic and Social Affairs of the United NationsSecretariat.
15

economic environment and this limits policy-makers' roomfor manoeuvre.
Developments in 1986 present a mixed picture regardingthe poorest segments of the world's population. In one largeeconomy, Indonesia, average per capita income declined in1986 and the welfare of the .lower strata of the populationsuffered accordingly. On the other hand, rapid economicgrowth in two other populous countries - Brazil and India- was an important factor in increasing consumption amongthe poor in 1986, although the gains achieved by low-incomegroups in Brazil were rapidly vanishing in early 1987. Inmuch of sub-Saharan Africa and in medium-sized countriesin Latin America, better harvests and lower energy pricestended to improve general economic conditions in 1986, tothe benefit of the most vulnerable groups.
Government expenditures on health, nutrition and education are an important determinant of the welfare of the poorest groups. Although the situation varied considerablyamong countries, in most cases government revenues didnot increase to the extent needed to allow any significantimprovement in these expenditures. Particularly in the manycountries that are encountering declining incomes, there isstill a pressing need to prevent a furtherdeterioration in thesituation of the more vulnerable groups.
The planned economies have also been affected by thedevelopments in international trade and world prices of en-
ergy, although less than the other country groups. The decline in oil prices reduced the hard-currency earnings of thetwo main energy exporters, namely China and the SovietUnion. China's growth rate of? per cent was still one of thehighest in the world, despite a slow-down in comparisonwith recent years. The centrally planned economies of Europe grew by about 4 per cent. Most centrally planned economies continued to experience rising per capita net materialproduct in 1986.
World trade grew by about 3.5 per cent in 1986. A significant part of this rise was due to a sharp increase in the volume of trade in crude oil, brought about by an unusualincrease in stockpiling by several major net importers ofoil.There was a significant deceleration in the volume of tradein other sectors, especially in manufactures (see chap. IIIbelow).
Key global prices continued to fluctuate during 1986, withimportant repercussions for the world economy. Oil pricesmoved erratically in both directions, but were on averageabout 50 per cent lower than their level in 1985. By early1987, they were still $10 to $12 a barrel lower than in 1985(see figure 11.1). For the energy-importing countries, thismeant that the oil price increase of 1979-1980 was entirelyreversed. Adjusted for inflation in the industrial countries,the average price ofoil was nearly 20 per cent below its 1974leveP (see figure 11.1). Moreover, crude oil is priced and
Table 11.2. Countries with growth rates of real GOP at or below the rate of growthof population", 1970-1986
Affected countriesNumber of countries with real in 1986
Country or Total GDP growth rate at or below Population asregional sample population growth rate Population percentage asgroupings size 1970 1980 1982 1984 1985 1986b (millions) group total
World total 112 21 38 66 45 49 47 850.0 17.6
Developing economies 83 20 30 54 44 47 44 826.1 33.6Excluding India (82) (826.1) (48.5)
South and East Asia 14 5 4 2 5 3 239.8 17.5Excluding India (13) (239.8) (39.3)
West Asia 10 3 .4 7 8 7 7 81.6 85.9
Western hemisphere 23 3 7 21 12 15 12 147.1 37.8
Africa 32 9 14 24 23 19 22 357.6 67.2
Mediterranean 4 0 1 0 0 0
Developed market economies 22 1 6 10 1 2 13.3 1.8
Centrally planned economies ofEuropec 7 0 2 2 0 10.6 2.7
Sourct:: Department of International Economic and Social Affairs of the United Nations Secretariat.
a Population growth rates are based on medium variant estimates reported in World PopulationProspt:cts: Estimatt:s and Projt:ctions as Asst:sst:d in 1984 (United Nations publication, Sales No.E.86.XIII.3).
b. Based on preliminary data.c The measured variable is per capita net material product of Eastern Europe and the USSR.
I Oil prices deflated by the GDP deflator of the developed market economies.
16

Figure 11.3. Nominal effective exchange rate(Index: 1980= 1(0)
180 .....-------------------.
160
120
100
., ", ", .. "• •, ., ., ........
••. 111.. '.'
/".................... .-....... ~.........., /-,..... .........,...
Fed. Rep. ofGerlll8D3'
JAPAN
a MERM.
Figure 11.4. Yield on long-term government bonds(Percentage)
15..,..-----------------
10
5
....., "", ".' " .. . , "." . .: "-I. " \ ••• ..,
'" , " ", '._ I.'••• ' ••,
•••,"""...--
Fed. Rep. ofGenIaDy
JAPAN
o~ .... ~ .... ~ ... #~ "~$'" ....... ".$'" .... ~ ..'~ '~ '~ '~ '~ '~ '~ '~~ , ~ ~ ~ ~ ~ ~
OUAUEllLT DATA
Source: Department oflnternational Economic and Social Affairs ofthe United NationsSecretariat, based on IMF, International Financial Statistics.
17
UNITED STATES............

traded in terms of United States dollars and this unit of pricing itself continued to fall substantially against most majorcurrencies. By early 1987, it was up to 50 per cent loweragainst the yen and most European currencies relative to itspeak in early 1985 (see figures II.2 and II.3).
The combination of the dollar decline and Pte oil pricecollapse has been extremely costly to energy-exportingcountries, but beneficial for energy-importing countries. Indollar terms, the import costs of the energy-exporting developing countries increased considerably while the price oftheir oil fell by 50 per cent. For many of these countries, thepurchasing power of their exports fell by two thirds. ForWestern Europe and Japan, the price of oil in terms oflocalcurrencies fell by 65-75 per cent between late 1985 and early1987, nevertheless only a portion of the decline was actually'passed on to the final users.
Prices of non-fuel commodities exported by the developing countries remained weak, in spite of the four years ofeconomic recovery and expansion in the industrial coun~
tries. Prices of many commodities continued to decline andtheir combined index, in dollar terms, was about 20 per centlower in 1986 than in 1980; and in real terms it reached itslowest level in more than four decades. 2
Restraining inflation remains a main policy thrust in thelargest industrial economies. This policy thrust, the weakness of non-fuel commodity prices, the fall in energy prices,and wage increases that were moderated by very high unemployment rates, made inflation rates in 1986 the lowest inmore than two decades in a number of industrial countries.In a few countries, such as the Federal Republic of Germany, price levels fell. Inflation also decreased significantlyin many developing countries; .the median rate for the·groupwas the lowest since the late 1960s.
Nominal interest rates declined significantly in most major industrial countries (see figure 11.4) and in internationalcredit markets. The six-month LffiOR on dollar deposits fellby more than 2 percentage points during the year. By early1987, it had begun to increase somewhat as the fall of thedollar led to growing concern about the resurgence of inflation in the United States of America. However, real interestrates - the difference between nominal interest rates andinflation rates - remained high and, except in the UnitedStates, increased in the latter part of 1986 and early 1987(see figures II.5 and II.6).
Major policy develc>pments
Despite the slow-down in the rate of growth of output,high unemployment rates and the elimination ofhigh rates ofinflation, the overall macro-economic policy posture of thedeveloped market economies during 1986 remained cautious. Overall, fiscal policy stayed basically unchanged andmonetary policy did not become accommodating, as indi-
2 . Deflated by prices of manufactures exported by the industrial countries.
18
cated by the very high real interest rates. Continued fear ofrekindling inflationary pressures remained a major impediment to greater monetary accomodation, even in countrieswith appreciating currencies vis-a-vis the dollar.
Sharp divergences of views on macro-economic policiesin individual countries continued to be a source of tensionamong the major industrial countries during 1986. By early1987, the extent of these differences, particularly among theFederal Republic of Germany, Japan and United States, appeared to jeopardize the co-operative spirit that had developed since 1985. The majorsource of disagreement was thesubstantial divergence in fiscal policy stances. The differences in budgetary policy remained as wide as they had beensince the beginning of the 1980s, despite frequent officialpronouncements aboutthe need to harmonize them.
In recent years, developing countries have been hurt bytwo repercussions of these policy differences, namely thepersistence of high real interest rates and the continuedgrowth ofunprecedentedly large external imbalances amongthe major industrial countries. Because of the first repercussion, the cost for the developing countries of servicing theirexternal .debt hasreroained exceedingly high in real terms,even though the nominal costs have fallen. The second hasbeen a major cause of the sluggishness of world trade andintensification of protectionist pressures in countries withlarge trade deficits.
During 1986, the current account deficit of the United. States was in excess of $140 billion. The counte}"part of thisdeficit was to a large extent the combined sU}"plus of theFederal Republic ofGermany and Japan, which amounted toabout $122 billion. Moreover, the federal budget deficit inthe United States, which through its stimulating effect onaggregate demand had been a major cause of the country'slarge trade deficit, grew further to $212 billion in 1986.
The external deficit of the United States was financed byforeign capital inflows, which grew by more than 20 percent in 1986, making the wealthiest country in the world thelargest recipient of foreign capital and the biggest international debtor. By contrast, the inflow of private capital intothe developing countries remained almost unchanged andthere continued to be a negative net transfer of resourcesfrom those countries as a group (see chap. IV below).
The continuing wide daily fluctuations in foreign exchange markets, the sharp decline of the dollar, and theworsening of international debt problems led the policymakers of the major industrial countries (the Group ofSeven) to meet in Paris in late February 1987. Agreementwas reached that further depreciation of the dollar should beprevented and joint efforts, including heavy intervention incurrency markets, were to be made in order to stabilize theexchange rates of the key currencies at about the levels prevailing at that time. There was also a convergence of viewsamong the participating policy makers that the massive current account imbalances of the three largest economies -

Figure 11.5. Real yield on long-term government bonds'(Percentage)
10..,.--------------------,
5
0-1------......,.-------------'----1•••••-, ., ."•
QUARTERLY DArA
a Nominal rates deflated by consumer price index.
Figure 11.6. Real lending rates·b
(Percentage)
10-,.----------------~.,..".~, .~.,"\ . .. ..I!"••~ '.. ##' /
~ .: ~ ..., :,.."... :r-r 'f ,-:.~.' .;:,....'j •.,--;--....,..-............" '-..,'......
5
O-+-~_+r--......,.-----------------I
Source: Department of International Economic and Social Affairs of the United NationsSecretariat, based on IMP, International Financial Statistics.
a Lending rates of commercial banks to prime customers.b Nominal rate deflated by consumer price index.
19
Fed. Rep. ofGerlll8J1y
JAPAN
UNITED STATES-.--.-----_.
Fed. Rep. ofGermany
JAPAN
UNITED STATES......._-_ ..

the Federal Republic of Germany, Japan and the UnitedStates - were the main source of instability in currencymarkets. Pledges were made to co-ordinate policy in orderto eliminate the root causes of the imbalances, which were
identified as the large fiscal deficit in the United States andthe weak growth in Japan and the Federal Republic of Germany.
Growth impulses and channels of transmission in 1986
The terms of trade swings in 1986 were without precedent. The impact of these shifts, together with the macroeconomic policy responses to them and the internaladjustments of the major industrial countries, have significantly altered the dynamics of the international economy.
The dramatic price changes that have taken place since1985 are not altogether isolated incidents. Wide fluctuationsin either the price of oil, the value of the dollar or international interest rates are likely to have a measurable effect onthe current level, as well as on the future time-path, of other
key parameters. The relationships among these variables areby no means tight, and a host of other pertinent economicand political variables are also important. Nevertheless,there are important linkages among these three key globalprices. The macro-economic policies of the major industrialeconomies can play an important role in strengthening orweakening these linkages. The interrelationships amongboth the key parameters themselves and among policies directed towards them can play an important role in the transmission of growth across countries. Some key aspects ofthese linkages are highlighted in box II .1.
Box 11.1. Oil price, the dollar, and internationalinterest rates
The international price of oil, exchange rates among keycurrencies and international interest rates are mainly determined in their respective markets. Moreover, the variablesthat affect supply and demand in each market are wellknown. However, the main concern here is the less obviousimpact ofeach of these parameters on the other. These influences were more detectable in 1986 than usual since the sizeof change in each of the parameters was very large.
The relationship between the dollar exchange rate and theoil price is complex. First, in the international market, crudepetroleum is both priced and traded in dollars. 3 In 19841985, just before the fall in the oil price, the total value ofsuch transactions averaged about $300 billion a year, equivalent to about 15 per cent of world trade. The energy-exporting developing countries (which account for some 60 percent of total world oil trade) receive most of their oil revenuein dollars, but it is spent mainly on goods and services produced in non-dollar markets. On average, between 60 and65 per cent of the imports of the energy-exporting countriescome from industrial countries whose exchange rates floatagainst the dollar. Moreover, a significant portion of thenearly $450 billion of international assets held by the oilexporters (which is concentrated among a few members ofOPEC) is denominated in dollars. 4
A large change in the value of the dollar has thereforemajor ramifications for the oil exporters' purchasing powerabroad and for the value of their dollar-denominated assets.A sharp drop in the value of the dollar, for example, is likelyto set in motion forces that may lead to an increase in thedollar price of oil within a relatively short period of time.s
The lower local currency price of oil in importing countrieswith currencies that are appreciating against the dollar, ifpassed through to the users, may lead to a higher-level demand for oil, for consumption and stockpiling, and therebyto a higher dollar price of oil. Concerted restraint on thesupply of oil by the energy-exporting countries would reinforce the rise in the dollar price of oil. Events since the latterhalf of 1986 seem to confirm this mechanism. Indeed, thesharp decline in the value of the dollar may have been afactor in the decision of OPEC to restrict output.
On the other hand, as indicated by the oil price and theexchange rate movements of the period 1982-1985, a sharpincrease in the value of the dollar may have had the oppositeeffect on the oil prices. The demand for oil weakened incountries with depreciating currencies vis-a-vis the dollar,thus softening the dollar price of oil. It is also possible for alarge change in the dollar oil price, through its impact oninternational transaction demand for the dollar, to affect the
Box continued on adjacentpage
3 For a theoretical treatment of the link between the value of the dollar and the price of oil, see Paul Krugman, "Oil and the Dollar", in J. Bhandariand B. Putnam (eds.), Economic Interdependence and Flexible Exchange Rates (Cambridge, Mass., The MIT Press, 1983), pp. 179-190. For arecently conducted empirical work relating the oil prices and the exchange value of the dollar, see B. Trehan, "Oil prices, exchange rates and theU.S. economy: an empirical investigation", in Federal Reserve Bank of San Francisco, Economic Review, No.4 (Fall, 1986), pp. 25-43. Thebasic finding of the study is that changes in the value of the dollar have a substantial impact upon the dollar price of oil, but not vice versa.
4 As at mid-1986, the combined identifiable foreign asset holdings of OPEC were estimated to be about $449 billion, of which about $77 billionwere held in the United States and almost $130 billion were held in Euro-currency banks and the off-shore centres. A substantial portion of thelatter amount is believed to be denominated in dollars, though no precise estimate exists. For the breakdown of the "identified" oil exporters'fund, see Bank of England, Quarterly Bulletin, vol. 26, No.4 (December 1986), p. 491.
, In general, for a given level of dollar price of oil, the oil-importing countries with appreciating currencies vis-a-visthe United States dollar wouldexperience a terms-of-trade gain (and a rise in their real national income), which would result in a higher level of demand for oil. A fall in thedollar price of oil would reinforce such an effect.
20
Trade prices and divergences in economic performancein 1986
Nowhere has the diversity in performance in 1986 beengreater than between the oil exporters and the oil importersamong the developing countries. While the real output ofenergy-exporting developing countries fell by 1.6 per cent in1986, that of the energy importers rose by 5.5 per cent (seetable 11.1). The rell1 national income of the energy importers, despite the terms of trade losses incurred on accountof soft non-fuel commodity prices, grew by about 5 per centin 1986. The energy exporters suffered larger deteriorationsin their terms of trade - from 15 per cent to 60 per cent which meant that they registered declines in real national
9 Gross national product adjusted for terms of trade changes.
value ofthe dollar against other key currencies.6 This channel of influence, however, seems to have become less important in recent years as the non-oil countries' demand fordollars and dollar-denominated assets has multiplied. 7
The relationships between international interest rates andthe value of the dollar, on the one hand, and the price of oil,on the other, have also played important roles in developments in the world economy in 1986 and in the first quarterof 1987. The link between these parameters is the anticipatedrate of inflation in the industrial countries. The lower theanticipated rate of inflation, the lower the nominal rate ofinterest will be, especially yields on securities with longerterm maturity. Between the latter part of 1985 and mid-1986,the rate of inflation (which is a proxy for the expected inflation rate) in the United States fell by 1.9 percentage points,while the yield on long-term government bonds fell by about3 percentage points. There were similar tendencies in several other industrial economies. 8 In the absence of a sign.ificant upward movement in labour costs, a key determinant ofprice levels in the industrial countries, the drop in oil prices(and other raw material prices) contributed to the loweringof nominal interest rates and raising ofbond and stock pricesin 1986.
incomes ranging from 3 per cent to almost 30 per cent. 9 Thefall in the combined real national income of the energy-exporting developing countries as a group was about 11 percent. Within individual economies, the size of this declinedepended on several variables, notably the degree of openness of the economy, the degree of dependence on oil exports, and the composition of imports. In general, theMiddle Eastern oil·exporters, whose dependence on oil exports is high, were the hardesthit.
The adverse effects of the oil price decline on the energyexporting developed market and centrally planned· economies group were milder and the set-backs to their economieslimited largely to the energy sectors. Among the developedmarket economies, those losses were largely compensated
The link between the changes in the value of the dollar andnominal interest rates is indirect:it operates primarilythrough the anticipated inflation rate in the United States andthe perceptions of foreign investors in the United States securities markets. A sharp fall in the value of the dollar, ifimmediately and fully passed through via import prices,could lead to an increase in the inflation rate in the UnitedStates. Given the deregulation of the financial markets inrecent years, a rise in the anticipated rate of inflation wouldrapidly be reflected in higher nominal interest rates, andyields on financial securities, such as stocks and bonds,would tend to rise as their prices declined in reaction to thehigher interest rates. Such a rise in interest rates could bereinforced by a tightening of monetary policy in the UnitedStates in reaction to the acceleration in inflation rate. Therise in United States interest rates, however, need not spillover to other industrial economies if those countries followan expansionary monetary policy to take advantage of thelower oil and commodity prices in terms of their currenciesthat result from the fall of the dollar. On the other hand, ifthe1l10netary conditions in these countries do not become moreaccommodative, as has been the case especially since thelatter half of 1986, nominal interest rates may not fall sufficiently and may even rise in real terms.
, Usually even a small excess supply of oil, because of the price inelastic demand for oil, could lead to sharp drop in the price of oil. This in turnwould lead to a sharp drop in the amount of dollars needed for international transactions of petroleum trade, which may have a depressing effecton the value of the dollar. In addition, if the oil exporters revert to selling some of their dollar-denominated assets in order to make up for theshortfall in revenues, the dollar may come under further pressure.
, In recent years, investors in the surplus countries of Western Europe and Japan have overtaken those in the oil-exporting developing countries intheir purchases of dollar-denominated assets. The massive flows of capital from many industrial countries into the United States capital marketshave dwarfed those from OPEC. For example, between 1983 and 1986 (September) while the total liabilities of banks in the United States to theoil-exporting countries in the Middle East rose by only $0.7 billion, those to Western Europe and Japan rose by $57.6 billion (see Federal ReserveBulletin, vol. 73, No.1 (January 1987), p. A59). Moreover, by 1985, the average daily international demand for dollars arising from fuel transactions was not more than $1 billion, while the combined volume of the daily transactions in international foreign exchange centres involving thedollar may have reached $200 billion.
S Between the latter half of 1985 and mid-1986 the inflation rates in the Federal Republic of Germany and Japan fell by 2.2 percentage points and1.5 percentage points, respectively. However, in relation to the United States, the interest rate (yield on long-term government bonds) declineswere less pronounced: the interest rate fell by only 95 basis points in the Federal Republic of Germany and by 198 basis points in Japan. This mayindicate that besides the relatively less accommodating monetary stance of the Federal Republic of Germany and Japan, the inflationary expectations in these countries have been less affected by the decline in oil prices than those in the United States.
21

for by the gains in the manufacturing and other energy-usingsectors. There was, however, a significant deterioration inthe balance of payments of those countries. 10 Moreover, inthe United States, the largest producer of petroleum amongthe industrial countries, there was a spill-over of losses beyond the petroleum and mining sectors as the fall of the oilprices affected a number of regional banks with concentrated loan portfolios in the energy sector.
The fall in the value of the dollar in 1986 had several important global effects. By making Japanese products morecostly in the dollar zone, it led to a slow-down in economicactivity in Japan, as the volume ofexports fell by more than
2 per cent in 1986 after having increased by 30 per centbetween 1983 and 1985. Secondly, it benefited the majorexporters of manufactures among the developing countries.Those whose currencies were either pegged, or moved verylittle, vis-a-vis. the dollar (e.g., Hong Kong, the Republic ofKorea, Singapore and Taiwan, Province of China) gainedcompetitiveness for their exports in non-dollar currencyzones. In many cases also, the bilateral real exchange ratesagainst the dollar had depreciated between 1980 and 1986. 11
As a result, a number of developing countries were able toincrease their world market share significantly (see chap. IIIbelow).12 The combined exports of East-Asian major ex-
Table 11.3. World imports: geographical composition and volume changes,1971-1986
(Percentage)
Volume of imports
Share in (annual rate of change)
Country or world trade" Trend
country group 1985 1971-1980 1984 1985 1986b
World 100.0 5.0 9.0 3.5 3.6
Developed market economiesc 68.8 4.8 11.1 5.5 8.0
United States 18.0 4.5 23.9 8.7 10.5Western Europe 38.0 5.0 6.1 5.7 6.2
of which:Germany, Federal Republic of (7.9) (4.9) (5.2) (4.2) (6.5)
Japan 6.0 5.0 10.8 -0.2 13.3
Developing economies 20;5 6.5 1.0 -5.0 -7.5
Capital-surplus countries 3.3 12.7 -10.6 -17.9 -21.0Capital-importing countries 17.2 4.2 3.7 -2.3 -4.7
Centrally planned economies of'Europed 8.5 4.8 5.0 4.8 0.0
China 2.2 29.2 50.3 -20.0
Memorandum item: Billions of dollars
Value of world trade 2000 20.3 5.5 1.0 12.0of which:Developing country imports 410 22.3 -2.0 -5.0 1.8
Source: Department ofInternational Economic and Social Affairs ofthe United NationsSecretariat, based on GATT, International Trade. 1985/86 (Geneva, 1986); IMF, InternationalFinancial Statistics and Direction o/Trade, various issues; and other official national andinternational sources.
a Shares are based on merchandise imports valued in terms of United States dollars at currentprices. Figures are rounded.
b Preliminary estimates.c Including Australia, Canada, New Zealand and South Africa.d Eastern Europe and the USSR.
'0 Among the developed market economies, the combined current account of the main oil exporters (Le., Canada, Norway and United Kingdom)deteriorated by about $22 billion in 1986, while the impact of the oil price fall on their output growth was relatively small. Nevertheless, allsuffered significant terms of trade losses ranging from a 2 to 15 per cent decline in real national income. However, the high degree of economicdiversification was the key factor limiting the amount of damage in those countries in comparison with the energy-exporting developing countries.
" The real exchange rate on a bilateral basis is equal to the nominal exchange rate corrected for the differences between the inflation rate in thehome country (exporter) and that in the export market (importer). For example, between 1980 and early 1987 the. won of the Republic of Koreadepreciated by 28 per cent in real terms vis-a-vis the dollar, while the trade balance of that country rose from a deficit of $4.5 billion in 1980 to anestimated surplus of$4 billion in 1986.
" Combined exports of Hong Kong, the Republic of Korea, Singapore and Taiwan, Province of China, as a percentageof world trade increasedfrom 3.8 per cent in 1980 to 6.6 per cent in 1986. Moreover, these countries' combined trade balance vis-a-vis the rest of the world increased froma deficit of $12 billion in 1980 to a surplus of $16 billion in 1986.
22
porters of manufactures in 1986 increased by 24 per cent tothe United States, 15 per cent to Japan, and 40 per cent to theEuropean Economic Community, despite the general sluggishness of world trade. Thirdly, depending on the currencydenomination of the external debt and the foreign currencycomposition of export earnings, the decline in the value ofthe dollar has had a varying impact on the debt burden of thedeveloping countries. The debt burden was reduced forcountries whose total external debt was mainly dollar-denominated, and was increased for countries whose debt wasmostly denominated in currencies that had appreciatedagainst the dollar. 13
Trade impulses and the growth process in 1986
The substantial changes that emerged in the relative pricesof key commodity and product categories in 1986 affectedthe level as well as the direction of trade flows. In turn, thechanges in trade flows had a significant impact on the levelof economic activity in the trading countries.
In terms of volume of trade flows, the developed marketeconomies as a group were the only significant growth polein the world economy in 1986. 14 This was reflected in theconsiderable margin that developed during the year betweenthe rates of growth of imports and exports of those countries. In volume terms, their combined exports grew by lessthan 2 per cent while their imports rose by 8 per cent. Theoverall leakage of demand through trade channels to the restof the world was equivalent to 1.5 per cent of the industrialcountries' combined GDP.
The volume of merchandise imports fell by 7.5 per cent inthe developing countries (see table 11.3). Imports were stagnant in the centrally planned economies of Europe as agroupand declined by more than 20 per cent in China. Among thedeveloping countries, the sharpest decline in the volume ofimports was among the major exporters of energy.
Two special aspects of the global transmission of thegrowth process in 1986 need to be highlighted. First, thegrowth impulses were highly uneven and benefited mainly asmall number of the non-industrial countries, essentially themajor exporters of manufactures in East Asia. The trade andoutput linkages among the major country and countrygroupings (see table 11.4) show that, as recently as 1985, themost important market for the exports of developing countries was the United States. The developing countries' totalexports to the United States as a proportion of their collective GDP has been slightly above 7 per cent, with nearly half
that amount accounted for by the major exporters of manufactures in East Asia. For developing countries of South andEast Asia as a group, exports to the United States were morethan twice their imports from that country and accounted forabout 12 per cent of their combined GDP.
Japan and the United States were the most dynamic markets among the industrial countries in 1986, with the importvolumes ofeach growing by more than 10 per cent (see table11.3). This, combined with existing trade links (see table11.4), meant that the East-Asian economies were the majorbeneficiaries among the developing countries from globaltrade developments.
A second major aspect of trade in 1986 was that, for theindustrial countries as a group, the loss in trade volume wasmore than compensated for by a sharp improvement in theirterms of trade, especially against the energy-exporting developing countries. ls As a consequence of this offsettingprice movement, the industrial countries' combined tradebalance improved in nominal terms vis-a-vis the rest of theworld, although it deteriorated in real terms. 16 The oppositetook place for the developing countries as a group.
The terms of trade gains by the industrial countries in1986 were brought about mainly by the sharp drop in oilprices and the rise in the prices of manufactures. The macroeconomic transmission of the fall in oil prices operatesthrough several channels. The most important macro-economic transmission channel of a fall in oil prices is the transfer of income from the energy exporters to the energyimporters. In 1986, this transfer amounted to about $90 billion, of which more than $70 billion was from the energyexporting developing countries. Within the developingregions, however, the revenue loss of the energy exporterswas nearly four times the oil-related savings of the importers.
The ultimate impact of this transfer on the world economydepends on the relative size of the propensities to spend andto import in the income losing and gaining countries. The oilprice increases of the 1970s have shown that an incometransfer from comparatively low saving (industrial) countries to high saving (energy-exporting developing) countries, at least initially, may lead to a global slow-down asglobal aggregate demand weakens. An oil price declineshould have the opposite result. But the overall impact of thefall in oil prices on the world economy in the short-runseems to have been negative. Several factors may explainthis: by 1986 the savings rates of the two country groupsmay not have been much different and, as discussed below,
13 For a useful summary of the effect of exchange rate adjustments on the external debt of the East-Asian developing countries, see Economic andSocial Survey ofAsia and the Pacific 1986 (United Nations publication, Sales No. E.87.II.F.1), pp.26-27.
14 It is important to note that the import volume of Eastern Europe as a group (i.e., the centrally planned economies of Europe excluding the SovietUnion) increased significantly in 1986. In fact, their combined export volume to the non-Socialist countries fell by 5 per cent, while their importvolume from the same group rose by more than 6 per cent.
15 For example, in 1984, another year oflarge changes in international trade flows, the margin between rates of growth of import and export volumes of imports), while in 1986 the same margin was more than 6.5 percentage points. In 1984, however, those countries faced a decline in theirterms of trade (0.5 per cent), while in 1986 their terms of trade improved sharply by about 10 per cent. In sum, in 1986 the industrial countries'gain in terms of trade significantly exceeded their loss in trade volume.
16 The industrial countries' combined current account balance in nominal terms improved by about $50 billion in 1986. But in real terms, in constantdollars of 1985, it deteriorated by about $70 billion.
23

Table 11.4. World trade and output linkages: share of bilateral exports and importsin GDP, 1985"(Percentage)
Trading partners (2)Exports and imports United Japan European Federal Developing Centra]]yof country or States Economic Republic countries plannedcountry group Community of Germany Total Energy economies
(1) exporters
United Statesb
Exports 0.6 1.1 0.2 1.8 0.7 0.2Imports 1.9 1.8 0.6 3.2 1.0 0.2
Japanb
Exports 5.5 1.5 0.5 4.0 1.2 1.2Imports 1.7 0.6 0.2 4.6 3.2 0.5
European EconomicCommunityc
Exports 2.5 0.3 13.2 3.2 3.8 1.8 1.0Imports 2.0 0.9 13.0 3.5 4.3 2.5 1.3
Germany, Federal Republic ofb
Exports 3.2 0.4 14.8 5.4 1.7Imports 1.7 1.1 13.0 5.0 1.6
Developing countriesd
Exports 7.2 3.6 5.4 1.8 6.8 1.6Imports 4.1 3.1 5.3 2.0 6.9 2.0
South and East AsiaExports 12.0 6.2 4.3 11.4 2.6Imports 5.5 7.3 4.4 11.5 3.1
Source: Department ofInternational Economic and Social Affairs of the United Nations Secretariat,based on IMF, Direction ofTrade Statistics Yearbook 1986, GEeD, Main Economic Indicators;
GATT, International Trade, 1985/86 (Geneva, 1986); and other official international sources.
a Trade in services is not included. The figures in each row represent bilateral merchandise exportsand imports of the country or country group (1) vis-a-vis the countries or groups in each column(2) divided by the GNP of the row country (1). All figures are calculated from output and tradefigures in 1985 prices and dollar exchange rates.
b GNP data used.c Including the Federal Republic of Gemrany.d Including Asia but excluding China, which is included in the centra]]y planned economies group.
the slow-down may have been the result of the timing ofresponses of economic agents in both the energy-importingand energy-exporting countries.
In 1986, as a result of the lower energy prices, most international projections expected a somewhat faster growth ofreal output for the industrial countries than was actually experienced-3 percent as opposed to 2.5per cent.The shortfallwas mainly due to timing. First, the import contraction ofthe energy-exporting developing countries was somewhatlarger and took place in a shorter time span than had beenexpected; and secondly, the expected surge in consumerspending in the developed market economies did not takeplace because the pass-through of the declines in oil prices to
consumers was less than complete. Instead, the oil price declines resulted in increases in public sector revenues andprofit margins in many industrial countries.]7 An additionalfactor that played a role in subduing overall economic activity in the developed market economies was the negative impact of the decline in the price of oil on the energy sectorS ofthe energy producers among the group.
The sharp decline in import levels of the energy-exportingcountries had an important negative effect on the level ofeconomic activity of the industrial countries. The energy~
exporting developing countries account for about 25 percent of the industrial countries' total exports to the developing regions. Relative to each of the major industrial coun-
17 DEeD Economic Outlook, No. 40 (December 1986), pp. 36-43. For example, in Japan, while prices of imported energy fell by 55 per cent(between the second quarter of 1982 and the first quarter of 1986) after-tax gasoline prices fell by only 21 per cent; in Italy, while there was adecline in energy prices of about 30 per cent in the same period, after-tax gasoline prices actually rose by 18 per cent. For the industrial countriesas a whole, prices of imported energy fell by 40 per cent, but the after-tax gasoline prices declined by only 15 per cent.
24

Table 11.5. Developing countries' real rate of interest, and rate of change in termsoftrade, export volume and external credit, 1961-1986
(Percentage and annual percentage change)
Average
1961- 1971- 1981-1970 1980 1986 1984 1985 1986"
PercentageReal rate of interest faced byb
(l) All developing countries 4.2 -13.2 17.1 10.1 14.7 22.0(2) Energy exporters 5.0 -15.2 23.7 11.7 13.8 53.3(3) Energy importers 4.0 -4.0 15.6 9.0 15.1 7.0
Percentage change
Rate of change in terms of trade -1.6 7.0 -4.6 2.3 -2.5 -25.0
Rate of growth in export volume 7.2 2.0 -0.4 3.3 -0.5 7.7
Rate of growth of total private externalcredit to the developing countriesc
Nominal 11.4 19.8 4.6 2.5 2.4 0.7
Source: Department ofInternational Economic and Social Affairs of the United NationsSecretariat.
a Preliminary estimates.b United States prime interest rate deflated by:
(1) Rate of change in export unit value of the developing countries in dollars;(2) Rate of change in export unit value of the energy-exporting developing countries in dollars;(3) Rate of change in export unit value of the energy-importing developing countries in dollars.
c Figures for 1961-1975 are rough estimates; 1976-1986 figures for nominal changes are based onIMF, World Economic Outlook (Washington, D.C., October 1986). Credits are denominated interms of United States dollars.
tries' GDP, the degree of dependence on the energyexporters' markets varies from about 0.7 per cent for theUnited States, to 1.2 per cent for Japan and 1.7 per cent forthe Federal Republic of Germany (see table 11.4). The collapse of the energy-exporting developing countries' importsin 1986 may have reduced the GDP growth rate of the industrial countries by about 1 percentage point. 18
Financial linkages and transmission of growth
Financial linkages among national economies have alsoplayed a critical role in the transmission of growth impulsesacross countries. In some instances, this has been even moreimportant than the role of trade flows. The most importantfinancial linkage between the developed market economiesand the developing countries in recent years is the resourceflow related to the rising stock of debt of the developingcountries. The total external outstanding debt of those countries (excluding China) as a percentage of their aggregategross domestic product rose. from 28 per cent in 1980 tomore than 50 per cent in 1985. Net interest payments on
external debt have also risen, from 1.5 per cent of GDP in1980 to more than 3 per cent in 1985. Moreover, a large partof the developing countries' external debt is commercialbank debt with floating interest rates that are strongly linkedto both LIBOR and short-term interest rates in the UnitedStates.
The evolution of the financial linkages between the developed and the developing countries in recent years has amplified the degree of economic interdependence between thetwo groups. While the financial linkage appears highly lopsided in favour of the developed countries, the ability of thedeveloping countries to continue to service their externaldebt is important to the stability of the financial sector in theindustrial countries. In addition, the financial resourceflows from the developed to the developing countries playacritical role in the maintenance and expansion of the importmarkets in the developing areas, which in turn are importantto the dynamism of world trade (see box 11.3).
Reflecting this enhanced economic and financial interdependence, the cyclical fluctuations of output in developedand developing countries have become increasingly syn-
18 Ignoring the implied price effects, the impact of a 20 per cent reduction iiI the volume of imports by the energy-exporting countries on the GNP ofthe developed market economies can be calculated (approximately) as follows: (-0.20) (0.25) (0.15) = -0.7 per cent, where 0.25 is the share ofexports to energy-exporting developing countries in the industrial countries' total merchandise exports and 0.15 is the share of merchandiseexports in GNP of the industrial countries. Assuming an international multiplier ofl.5, which accounts for the secondary (or spill-over) effects,the total effect of the fall in exports to the oil producers in 1986 was about 1 percentage point of GNP.
25

chronized in recent years. The correlation co-efficient between the real output growth rates of these two groups ofcountries has risen from 0.25 in the period 1966-1974 to 0.5in the period 1975-1984.
As shown in table II.5, the movements in some of themajor transmission mechanisms, both real and financial,have been quite unfavourable to the developing countries inthe 1980s: real interest rates faced by them have risensharply, their terms of trade have deteriorated, their tradevolume has moved sluggishly and the external financial inflows have slowed down dramatically.
While interest rates on concessionalloans have remainedlow during the 1980s, in real terms they are also higher than
in the two previous decades. Moreover, several recent empirical studies have found that rising international interestrates, operating through financial channels, have had a significant negative effect on the growth of real GDP in developing countries. [9 As indicated in table II.5, in 1986 realinterest rates on commercial loans faced by the developingeconomies remained very high by post-war standards, whilethe nominal growth of private external credit flows to thesecountries remained very low. Thus, even though nominalinterest rates declined, in general the magnitude of the financial variables in 1986 were such that they continued to exerta dampening effect on the economic growth of many developing countries.
Short-term outlook for the world economy
The heightened uncertainty in the world economy makesit unusually difficult to forecast even short-term developments. However, the potential negative consequences of acontinuation of these uncertainties and the recognition of theneed for correction of the major global imbalances discussedearlier has caused the major market economies to attempt toco-ordinate a number of remedial measures. Effective implementation of those arrangements should introduce an element of stability into international economic relations andcontribute, both directly and indirectly, to an improvementin the world economic situation. On the other hand, continued disharmony in a number of other areas could readilymultiply and have significant negative consequences. Onbalance, therefore, the world economy continues to be in afragile state, its progress in the short to medium term being amatter of some conjecture.
The following subsection presents the results of a simula-
tion of the developments that seem likely to occur as at earlyApril 1987. The results of this forecasting exercise, which isbased on Project LINK, are shown in the tables in this section (and in the annex below) and represent an estimate ofthe likely course of the world economy over the next one totwo years. The forecast is based on a pragmatic assessmentof possibilities and is not to be interpreted as the most desirable outcome. The analysis in this Survey identifies a number of problem areas where a change in internationaleconomic policy would produce an improvement in theprospects for the world economy. In order to examine thebenefits of remedial action in two of these key areas, thissection also presents the results of alternative simulationsthat, first, assume a higher degree of policy co-ordinationamong the major developed market economies and, secondly, assume an element of debt relief for the indebted developing countries (see boxes 11.2 and 11.3).
19 Preliminary results from regression studies attempting to isolate the impact of changes in trade flows, in terms of trade and in real interest rates onthe rate of growth of output, indicate that the effect of real interest is quite large and dominates the effect of the trade variables (see the tablebelow). An IMF study (Susan M. Schadler, "Effect of a slowdown in industrial economies on selected Asian countries", January 1986) finds thata decline (rise) in United States interest rates exerts a significant positive (negative) impact on the GNP growth rate in the Asian countries. Seealso David Goldsborough and Iqbal Zaidi, "The transmission of economic influences from industrial to developing countries" , in StaffStudiesfor the World Economic Outlook (Washington, D.C., IMF, July 1986). pp. 173-187; R. Dornbusch, "Policy and performance links between LDCdebtors and industrial nations", Brookings Papers on Economic Activity. No.2 (1985), pp. 303-356.
Dependent variable: rate of growth of real GDP
TermsExport of Real Dummy
Constant volume trade interest (1974-1984) R2
Total developing 6.4 0.11 0.10 -0.46 -1.60 0.90(14.8)* (2.8)* (3.3)* (-8.3)* (-3.3)*
Net energyimporters 5.5 0.08 0.07 -0.34 -1.00 0.73
(11.4)* (1.5) (1.5) (-5.6)* (-2.2)*
Net energyexporters 7.5 0.17 0.04 -0.41 -2.9 0.91
(9.2)* (3.8)* (2.9)* (-3.5)* (-2.8)*
Major borrowers 6.5 0.02 0.19 -0.47 -1.83 0.73(10.3)* (0.3) (2.5)* (-4.2)* (-1.8)*
Note: Estimation method: oridinary least squares: period of estimation: 1965-1984. All variables are in percentage change (except realinterest rate, which is in percentage terms). Figures in parentheses are t-statistics; (*) indicates significant at 0.051evel. All regressions arecorrected for serial correlation. United Nations Secretariat country groupings have been used. Dummy variable measures percentage pointreduction in average annual output growth rates since 1973 independently of the variables listed in the table.
26

Key policy assumptions
The major macro-economic policy assumption in the baseline projections, which constitutes a clear departure fromrecent experience, is the prospective gradual tightening offiscal policy in the United States and a modest fiscal expansion in a few other major industrial countries (e.g., the Federal Republic of Germany and Japan), in line with theirannounced policies as at January/February 1987. Nevertheless, the overall fiscal stance of the seven major industrialcountries is to move towards restriction in 1987-1988.
During the same period, the overall monetary policystance of these countries is anticipated to become significantly less accommodating than in 1986, as the favourableimpact oflower energy prices on general price levels beginsto fade away. The tightening of monetary conditions resultsin a marked increase in interest rates in some of the majoreconomies, beginning in 1987. According to the baseline solution, by 1988 the United States prime rate of interest willhave risen by about 140 basis points from its low in 1986.The nominal effective dollar exchange rate will declinegradually throughout the simulation period and by the end of1988 it will reach its average level of 1980. The oil price (theaverage export price of OPEC) is set exogenously in thebaseline to average about $17 a barrel in 1987-1988. Thisrepresents a rise of 6 per cent a year in real terms. The totalinflow of capital (gross) into the developing countries is assumed to increase at an annual rate of 3.5 to 4 per cent innominal terms. Major debtor developing countries are assumed to continue their macro-economic adjustment programmes by holding down real rates of increase in publicspending, keeping real interest rates at positive levels, and atthe same time allowing for real depreciation of their currencies.
Among the centrally planned economies, policies arebased on the new socio-economic plan cycle for 1986-1990.In nearly all European planned economies, policies areaimed at accelerating the pace of output growth attained in1986 through sharp increases in the pace of investment activity. These plans give high priority to machine-buildingbranches and the production of electronic equipment andcomputers. The agricultural targets in these countries aremore modest than those set for industry. Targets for the Soviet Union are on the whole in line with 1986 achievements.Although the overall investment activity is to moderatesomewhat, some sectors with high priority are set to expandvery rapidly. For example, production of machinery andequipment for machine-building and engineering is to growby 40 per cent.
Given the persistent excess demand and emergence of imbalances in the budget and external account, China's economic plan for 1987 seeks to control and perhaps curbdomestic demand, in particular, fixed capital investment. Inagriculture, the priority is to raise grain output so as to matchthe record level achieved in 1984.
Salient features of the baseline projections
Key features of the baseline projections for the world
27
economy in the next 18 months are summarized in tables II. 6and II.7. The projections indicate that, without a major policy change, the world economy will continue to grow at amuch slower pace than in the 1970s. World trade will alsogrow at a sluggish pace, with a significant slow-down expected in 1987. The economic expansion of the developedmarket economies, which entered its fifth year in 1987, isexpected to continue at a slow pace. The average rate ofoutput growth for the industrial countries is expected to remain below 3 per cent in 1987 and improve only marginallyin 1988. Among the major industrial countries, only theUnited Kingdom is projected to grow at a measurably higherpace than in the 1970s.
The process of adjustment in the Federal Republic of Germany, Japan and the United States, resulting from the continued pressures exerted by their external imbalances, andthe tight fiscal and monetary policy assumed in the baselineare the key underlying factors for the slow pace of economicexpansion in these countries. While the average inflationrate is projected to remain below 4 per cent - less than halfthe average rate in the 1970s - the high unemployment rateswill not fall. Western Europe's unemployment rate is projected to remain around 11 per cent, which is nearly threetimes its average in the 1970s. The projections indicate thatthere will be a significant correction in trade imbalances ofthe Federal Republic of Germany, Japan and the UnitedStates in volume terms starting in 1987. In nominal terms theimbalances are more persistent and their correction seems tolie beyond the two-year horizon of the baseline simulation.
The developing countries as a group are also expected togrow at below 3 per cent in 1987. A moderate acceleration isanticipated in 1988 because of a partial recovery in theenergy-exporting developing countries, reflected mainly inhigher average growth rates in Africa and West Asia. On theother hand, the average growth rate of GDP in energy-importing countries as a group is expected to decelerate byabout 1 percentage point below 1986 as the favourable effects of lower oil prices begin to fade away. In addition, aslower pace of output growth projected for Brazil has adampening effect on the group's average. The great diversity of experience that has characterized the developingcountries' performance in recent years is expected to continue in the next two years. The average GDP growth rate inAfrica is expected to remain well below the rate of population growth, while the Asian economies will grow at rates inthe range of 4.5 to 5 per cent. The performance of the LatinAmerican region, with an expected average expansion ofabout 3.5 per cent, will continue to be dominated by theperformance of the major debtor countries in the region.High real interest rates internationally and expected low levels of capital inflows will leave little room for manoeuvre inthese countries.
In sum, baseline projections indicate that if there are nomajor initiatives to radically change policies in the industrialcountries, the world economy will not grow at a sufficientlyhigh pace to allow improvements in the standard of living ofa large number of developing countries. Furthermore, unemployment rates in industrial countries will remain high,the international debt problem will not go away and the large

Table II.6. Short-term outlook for the world economy, 1986-1988(Annual percentage change)
RatioAverage of1986-1988
Projectionsdivided byaverage of
1986' 1987 1988 1971-1980
World volume oftrade 3.5 3.0 4.0 0.70
Rea1GDPWorld 3.1 3.2 3.7 0.85
Developing countries 2.5 2.7 3.8 0.53Africa -2.1 -0.2 2.4 omSouth and East Asia 4.5 4.7 5.0 0.85West Asia 0.3 -1.1 2.7 0.10Western hemisphere 3.5 3.3 3.7 0.64Mediterranean 4.4 2.9 2.9 0.64
Developed market economies 2.4 2.6 3.0 0.86Western Europe 2.3 2.4 2.4 0.83Japan 2.5 2.6 3.0 0.54North America 2.6 2.7 3.4 1.00
Centrally planned ecnonomies of Europeb 4.3 4.1 4.5 0.83
Chinab 7.0 7.0 7.0 1.23
Memorandum item:Value of developing country exports C -8.2 10.0 11.0 0.16
Source: Department of International Economic and Social Affairs of the United NationsSecretariat, based on projections of Project LINK (9 March 1987) and other national andinternational sources. Forecasts are based on an average oil export price of $17 a barrel.
a Preliminary figures.b Output growth rates refer to net material product for 1986 as contained in plan fulfilment reports
and to Secretariat estimates for other years.c In terms of current dollars.
and persistent trade imbalances of the major industrial countries might exacerbate existing tensions.
The projected growth rates for 1987-1988 for the centrallyplanned economies are partly based on the annual plans for1987 and the medium-term policy intentions expressed inthe five-year plans, and these target rates still appear to berealistic under the prevailing socio-economic situations. Account has also been taken of plans that are consistently taut,and can therefore be attained only under the most favourableof domestic and external circumstances, including those inthe area of agriculture, trade and international finance.
For the European centrally planned economies, the projected data for 1987-1988 show, by and large, stability ingrowth. Relative stability derives essentially from the legacies of the recent adjustment efforts in Eastern Europe andthe fact that any acceleration of growth is being made contingent on a favourable external environment. Similarly, thegrowth efforts of the Soviet Union in the short run are predicated by and large on existing conditions. However, the ongoing economic reforms and other changes in economicinstitutions and mechanisms may help these countries to capitalize on the recent and near-term changes in economicstructures towards the end of the decade and beyond.
The expected growth in China still exceeds that of the
28
1970s, but is below the performance in the early 1980s. Thischange is largely predicated on the need to regain domesticand external balance in order to make headway with urbaneconomic reforms.
Risks and uncertainties
The greatest risk facing the world economy within thenext two years concerns the nature and the magnitude ofautomatic, as well as policy-induced, adjustments in the major global imbalances. Especially important is the policy response of Western Europe and Japan to a deceleration in thegrowth rate of United States imports. A combination ofhigher growth rates of exports and significantly lowergrowth rate of imports in the United States is expected tobring about a turn-around in the real foreign balance of theUnited States by 1988. This means that, on average, therewould be less stimulus for the world economy, perhaps by asmuch as 1 per cent of the GNP of the United States. Theslack left by the change in the economic situation of thatcountry has to be eliminated through greater demand elsewhere in order to avoid a world-wide recession. But not allofthe adjustment can or should fall upon the Federal Republic of Germany and Japan-the two countries with the largest trade surplus. A significantly higher level of financial

Table 11.7. Developed market economies: short-term outlook for inflation andunemployment rates and current account balances, 1986-1988
(Average annual or annual percentages)
RatioAverage of1986-1988
Projectionsdivided byaverage of
1986- 1987 1988 1971-1980
Inflation rate b
All developed market economies 4.0 3.0 3.5 0.44Western Europe 5.3 3.5 3.5 0.45Japan 2.0 1.0 2.0 0.22North America 2.6 2.8 4.0 0.43
Unemployment rateAll developed market economies 8.1 8.1 8.0 2.00
Western Europe 11.0 11.1 11.2 3.00Japan 2.8 3.2 3.4 2.00North America 7.3 7.0 6.7 1.20
Balance on current accountc
(billions of dollars)Germany, Federal Republic of 36 30 25Japan 86 78 74United States -141 -150 -145
Source: Department of International Economic and Social Affairs of the United NationsSecretariat, based on projections of Project LINK (9 March 1987) and other national andinternational sources.
a Preliminary estimates.b GOP/GNP deflator.C Including official transfers.
flows to the developing countries that would enable them toraise their import levels could go a long way towards easingsome of the pressures being exerted on the world economy.
A related major risk to the world economy arises from theintensification of protectionist pressures in the developedma.rket economies. There are already signs of domestic political pressure for trade barriers to stem the tide of importsinto the United States. If these barriers materialize, a tradewar could ensue, leading to significantly lower growth everywhere.
A sharp drop in the level of financial flows to the UnitedStates presents an important risk to the world economy. Sucha decline in net capital inflows before United States fiscaland trade deficits are significantly reduced will bring about afurther depreciation of the dollar vis-a.-vis other major cur-
29
rencies and, at the same time, push up interest rates in theUnited States. Higher interest rates may induce a sharp recession domestically and thereby in the rest of the world.This eventuality would intensify the international debt problem and could spell disaster for many developing countries.
The debt problem of the developing countries is potentially a large risk to the world economy. The unravelling ofthe domestic economic rdorms and re-emergence of thedebt crisis in Brazil in early 1987 is most worrisome, although the possibility of a fully-fledged debt crisis is lessimminent today than it was a year ago. This is because somefavourable accords have been reached in recent months between the commercial banks, the official lending institutionsand some of the largest debtor countries. Nevertheless, theoverall situation is still precarious.

Box n.2. Co-ordination of macro-economic policiesin the industrial countries
This scenario represents a set of feasible policy changesby the major developed market economies to reduce theirlarge internal and external imbalances, create more employment and raise their output growth above those in the baseline with no measurable increase in inflation. To achievethese goals and, at the same time, to ensure that the foreign
exchange and assets markets will function in an orderlymanner while the large adjustments are taking place, the policy shifts and the reconfiguration of the policy mixes in eachcountry should be tightly co-ordinated with those of theother countries.
Box continued on adjacent page
Impact of macro-economic policy co-ordination in theindustrial countries on the world economy, 1987-1989 a
Year 1 Year 2 Year 3
RealGDPWorldDeveloped market economies
EECJapanUnited States
Developing countries
World trade volume
Percentage deviation from baseline level
0.0 0.3 0.8-0.1 0.4 1.20.2 0.4 Q50.0 0.2 0.6
-0.4 0.6 1.9
0.0 0.2 0.2
0.1 0.5 1.0Percentage point difference from baseline
0.0 -0.1 -0.50.0 -0.1 -0.20.1 -0.3 -0.8
Billions of dollars difference from baseline
Inflation rateDeveloped market economies
EECUnited States
Unemployment rateDeveloped market economies
EECUnited States
Reduction inUnited States budget deficitUnited States current account deficit
0.00.00.0
410
0.10.20.1
2020
0.20.30.2
5012
Source: Project LINK.a Figures for output and trade represent a percentage change in the scenario level relative to the
baseline level. The figures for year 1 may also be interpreted as additions to the baselinegrowth rates. For subsequent years, the additional growth may be calculated by taking thedifference between one year's figure and that of the previous year. For example, in year 2 thelevel on real world GDP in this scenario is 0.3 per cent above the baseline level. The additionto the growth rate in year 2 relative to the baseline is 0.3 percentage points, which is thedifference between 0.3 and 0.0.
30

The baseline projections presented in this chapter assumea continuation of the cautious monetary policy and a gradualtightening ofthe overall fiscal policy, mainly on account ofadeficit reduction programme in the United States, in theseven leading industrial countries in 1987-1988. This alternative scenario assumes a sharper tightening of fiscal policyin the United States, expansionary fiscal policy in the Federal Republic of Germany and Japan, and an accommodating monetary policy in all major industrial countries. Thepolicy changes assumed in this scenario, are as follows (allpolicy changes are measured as sustained deviations frombaseline level of the same variable): (a) a cut of$20 billion ayearin 1982 dollars (about 2.5 per cent) in real public spending in the United States; (b) a 1.5 per cent increase a year inreal housing investment by the public sector in Japan; (c) a10 per cent cut in the tax rates of households and businessesin the Federal Republic ofGermany and Japan; and (d) monetary accommodation in all major economies (which resultsin a 1 percentage point reduction in interest rates in Canada,the United Kingdom and the United States, and a 0.5 percentage point reduction in all other major economies).
The implementation of these policies produces several important results (see table). The reduction in the budget deficit is likely to have an immediate contractionary effect onthe United States and other major industrial countries. However, global aggregate demand does not decline to any measurable extent because of the compensatory, though modest,fiscal expansion in the Federal Republic of Germany andJapan, and the monetary policy accommodation in all industrial countries. The latter policy change limits the decline ofoutput in the United States, while preventing interest ratesfrom rising in the Federal Republic of Germany and Japandespite their expansionary fiscal policy stance. The timepath of the nominal effective dollar exchange rate remainsvirtually unchanged from that in the baseline. Most benefitsto the world economy come in the latter part of the simulation period. World output and trade each gain 1 percentagepoint or more over the baseline projections. Average growthrate of real output in the industrial countries reaches 3 per
31
cent, while the developing countries begin to receive somebenefit in the form of higher real output in the latter part ofthe simulation period. Increases in inflation in the industrialcountries are modest because of the significant under-utilization of productive capacity in most countries in the baseline and because of the gains in labour productivity resultingfrom increases in real output. The unemployment rate is significantly reduced in the United States. Gains in this area inWestern Europe are modest but the decline in the unemployment rate in the Federal Republic ofGermany (by about halfa percentage point) is more significant than in other majorEuropean economies.
A key result of this scenario is that major reductions in thetwin-deficits of the United States do not take place until thesecond year. Initially, the fiscal deficit declines only marginally because tax revenue drops as the economy slows down.As the economy begins to strengthen, tax revenue begins torise while spending is curbed, and the deficit begins toshrink rapidly. On the other hand, the reduction in theUnited States current account deficit begins to slow down inthe third year of the simulation, mainly because the increasein the level of economic activity in the United Statesstrengthens import demand.
The results for the developing countries as a group aremodest because of two critical assumptions. First, energyprices, and to a lesser extent other raw material prices, donot increase above their baseline level, which, because ofthe rise in industrial countries' prices, implies a terms oftrade loss for the developing countries during the simulationperiod. Secondly, capital inflows into the developing countries remain unchanged from those in the baseline, wherethey were assumed to increase very little. In sum, the benefits of macro-economic policy co-ordination of the type described here accrues mainly to the industrial countries. Thisscenario suggests that the major industrial countries canachieve an increase in their output growth rate at a low rateof inflation, while correcting their macro-economic imbalances.

Box II. 3. Debt relieffor major debtordeveloping countries
The purpose of this scenario is to measure the impact of areduction in the amount of interest the debtor developingcountries pay to service their debt on their economic performance and on the world economy. The scenario is designed and implemented in such a way that the foreignexchange savings resulting from the reduced interest payments of each debtor country are used to increase that country's imports of capital goods.
The major policy assumptions embedded in this scenarioare (a) for all debtor developing countries or areas except theRepublic of Korea, Singapore, Turkey and Taiwan, Province of China, the centrally planned economies and all energy-exporting developing countries other than Indonesia,Mexico and Nigeria, interest payments are limited to 5 percent of each country's total external debt outstanding at theend ofthe preceding year; (b) each debtor country uses theresulting foreign currency savings to increase imports ofmanufactures; (c) initially, interest rates in creditor countries rise by about 100 basis points in response to the finan~
cial difficulties of their commercial banks, one aspect ofwhich would be a sharp decline in the stock prices and liquidity shortage of the affected banks in reaction to the fall
in their overseas earnings; and (d) central banks in the creditor countries increase the commercial banking system's reserves in order to curb the rise in interest rates.
The simulation results indicate that the size of the interestrelief is about $16 billion to $17 billion a year. A higher levelof real output in the debtor countries results from a rise ininvestment that, in turn, is facilitated by the higher level ofimported capital goods. The impact on the debtor countriesis quite large, as indicated by the gains accruing to selectedcountries listed in the table below. The increased imports ofthe developing countries also result in a rise in exports, andthereby a higher level of economic activity, in the industrialcountries.
The critical policy assumption is the monetary expansionin the industrial countries. As indicated in the table below,without monetary accommodation interest rates could risesubstantially in response to a liquidity shortage encounteredby the commercial banks because of the decline in their revenues. A sharp rise in international interest rates, if allowedto take place, would defeat the purpose of the exercise and infact lead to a global economic slow-down. This important
Box continued on adjacentpage
Impact of debt relief for major debtor developingcountries on the world economy, 1987-1989'
Year I Year 2 Year 3
Percentage deviation from baseline level
RealGDPWorld
Developed market economies
Developing countriesMajor debtorsb
ArgentinaBrazilMexicoNigeria
Republic ofKoreac
World trade volumeDeveloping country importsd
Developed country exports d
Interest rategWith monetary accommodation(Without monetary accommodation
0.2 0.2 0.2
0.2 0.2 0.2
0.4 0.4 0.4
2.0 1.9 1.80.7 0.7 0.80.8 2.5 3.20.6 0.6 0.6
0.2 0.2 0.2
0.7 0.7 0.72.5 2.5 2.50.7 0.7 0.9
Basis points difference from baseline
3 7 -579 78 76)
Source: Project LINK.
a See note a to the table in box II.2 for an interpretation of the figures.b Only a partial list of the countries included in the debt relief exercise.c Not included in the debt relief scheme.d Values, deflated by export unit value of developed market economies, in terms of United States
dollars.e Three-month treasury bill rate in the United States. One full percentage point is equivalent to 100
basis points.
32

conclusion applies equally to the discussion of alternativepolicies regarding the debt problem in chapter IV below.
It is important to note that some of the major debtor developing countries, particularly major exporters of manufactures (e.g., the Republic of Korea, Singapore and Taiwan,Province of China) benefit from the scenario, even thoughthey are excluded from receiving debt relief, because of thehigher level of world economic activity. The major shortcoming of the policy that forms the basis of this scenario isthat it bypasses most of the smaller African debtor countries.
The 5 per cent cap on interest payments may not result insignificant savings in relation to foreign currency earningsfor these countries since their external obligations aremainly in the form of long-term official debt with averageeffective interest rates substantially below those paid bymarket borrowers. A separate relief mechanism is requiredto respond to the pressing needs of the large numbers of lowincome official debtors, most notably those in sub-SaharanAfrica. This issue is also addressed at greater length in chapter IV.
Regional economic performances in 1986 andselected policy issues
The second half of the decade of the 1980s will be a criticalperiod for the world economy. Important economic problems inherited from the first half of the decade remain unresolved: sluggish growth of output and trade continues inmost parts ofthe world; protectionist pressures have heightened; the debt problem and the intensification of the development crisis threaten the social and political fabric in manydeveloping countries; high rates of unemployment, particUlarly among young people, have led to social and politicalalienation of a large number of people in both the developedand the developing countries; and massive macro-economicand financial imbalances impair the orderly functioning ofthe world economy. More important, the pace of investments has slowed down and, given the present policies, it isdoubtful that there will be a significant increase in capitalformation in the near future.
It was the stagflation of the 1970s that prompted thechange in the economic regime, from low to high real interest rates, in the industrial countries. 2o But after five years,instead of the sustained, non-inflationary high rate of outputgrowth that they were seeking, the industrial countries have
achieved a sustained, non-inflationary low rate of outputgrowth together with a high unemployment rate. It had beenwidely agreed by policy makers that private capital investment had to rise significantly to achieve a high rate of outputgrowth. This, in turn, has as one of its requirements stableprices, which was the reason for the anti-inflationary policies of the early 1980s. However, investment rates have increased only moderately. Western European investmentrates remain relatively low, and those in Japan and theUnited States have decelerated significantly since 1985.Gross fixed capital formation as a percentage ofGDP for thedeveloped market economies was lower in 1985-1986 than itwas in 1980.21 Low rates of growth of aggregate demand,uncertainty about its future level, particularly in Europe andJapan, and high real interest rates have been important factors inhibiting private investment. Moreover, intensifiedtrade frictions and wide fluctuations in financial variablesbrought about by the large external imbalances have increased the uncertainty faced by private investors.
Similarly, in the majority of developing countries, widedomestic imbalances, rising interest rates, a heavy debt-
20 Stagflation generally refers to relatively long periods of low output growth rate, high unemployment rate and high inflation rate. For a detailedanalysis of this phenomenon during the 1970s see, Michael Bruno and Jeffrey Sachs, Economics ofWorldwide Stagflation (Cambridge, Mass.,Harvard University Press, 1985).
21 Gross fixed capital formation as percentage ofGDP for the developed market economies as a group was 22.1 per cent in 1980 and 20.2 per cent in1985. In the European Economic Community, the ratio fell from 21.2 per cent in 1980 to 18.6 per cent in 1985 (see OEeD Economic Outlook, No.40 (December 1986), table R3).
33

service burden, stagnant or declining demand and sluggishtrade performance have affected investment and outputgrowth. However, the major problem in most developingcountries is the inadequate level of savings. The total level ofnet domestic savings has been depressed by declining realper capita incomes and by greater public sector dissaving asa result of widening government budget deficits in the early1980s. Both of these factors have themselves been influenced by external factors. For the major debtor countries, aportion of domestic savings has been transferred abroad toservice their external debt, often resulting in a reverse netresource transfer. The low rate of economic growth in theindustrial countries has adversely affected the terms of tradeand the trade performance of many developing countries. Inaddition, inflows of foreign savings, in the form of net financial flows, have virtually halted. With low or declininginvestment rates, rates of growth of real income in manydeveloping countries are barely equalling or exceeding population growth rates.
In several centrally planned economies, the new mediumterm socio-economic plans for capital formation in the second half of the 1980s, in contrast to those in the previousplan cycle, express a deliberate policy change to acceleratecapital formation. In Eastern Europe, a significant slowdown in investment occurred in the early 1980s. In the period 1981-1985, it fell by more than 6.5 per cent, while that ofthe Soviet Union rose by 18 per cent. The investment plansfor the second half of the current decade envisage a 20 percent rise in Eastern Europe and a nearly 24 per cent increasein the Soviet Union.
Investment rose by 130 per cent in China between 1980and 1985. Policy makers in China, with the aim of slowing
down the growth of the economy, are planning for a significantly less rapid pace of investment increase in the secondhalf of the 1980s. Even so, the new plan contemplates anincrease in per capita income exceeding 5 per cent a year.
Diversity of situations in developing regions
Economic performance has remained disappointing inmany developing countries: in 1986, of a sample of 83countries, 39 had real growth rates of GDP below 2.5 percent, compared with only 19 countries in the 1970s (see table11.8). But there was also a considerable degree of diversity:in 1986, some 13 countries, with a combined population of400 million people, had GDP growth rates in excess of 5 percent. The increase in the net material product of China alsoexceeded this figure.
One of the distinguishing factors that separated the fastgrowers from others continued to be the size of economy.The larger countries have tended to perform better in recentyears. Large domestic markets and the more diverse naturaland human resource base have, in general, provided the policy makers in the larger developing countries with moreroom for manoeuvre. Among the very large economies, thatis, countries with population well above 100 million people,Brazil and India again experienced in 1986 a rate of outputgrowth significantly higher than that of their respective populations, and far higher than the average output growth forthe developing countries (see table 11.9). Domestic impulsesin both these countries played a major role in their economicexpansion as exports changed little-and declined in the caseof Brazil-from the previous year. Agriculture and agroindustry maintained the robust performance observed sincethe mid-1970s in India. In Brazil, a rapid increase in the real
Table II.8. Frequency distribution of output growth rates and inflationin the developing countries, 1971-1986
(Number of countries)
19711980
19811986 1982 1983 1984 1985 1986-
Distribution of realoutput growth ratesb
Zero or below 4 22 40 33 29 25 200.1-2.5 per cent 15 31 18 17 17 20 192.6-5.0 per cent 31 20 11 19 20 26 315.1-7.5 per cent 18 9 9 9 10 8 97.6 per cent and over 15 1 5 5 7 4 4
Distribution ofinflation ratesc
5 per cent or lower 0 12 6 14 18 23 255.01-10 per cent 26 22 24 19 15 13 1410.01-20 per cent 41 20 26 22 16 15 1220.01-50 per cent 7 13 13 12 15 15 1350.01-100 per cent 2 4 4 2 7 4 8Over 100 per cent 0 5 3 7 5 6 4
Source: Department oflnternationa1 Economic and Social Affairs of the United Nations Secretariat.
a Preliminary estimates.b Based on rates of growth of real GDP in 83 developing countries.c Based on inflation rates, measured by consumer price indexes of76 developing countries.
34

Table 11.9. Developing countries: real GDP growth rates, 1971-1986
Gross domesticPopulation product in 1984b
in 1984- (billions GDP growth rateC
(millions) of dollars) 1971-1980 1981-1985 1986d
Percentage changeAll developing countries 2540.0 5.6 1.3 2.4
Seven large~t developingcountries· 1406.2 790.1 6.3 2.4 2.7
Energy importers 1 073.8 472.3 5.9 3.3 6.3
Bangladesh 98.5 12.4 4.0 3.9 4.5Brazil 132.6 227.3 8.6 1.9 8.0India 745.0 197.2 3.3 4.7 4.0Pakistan 97.7 35.4 4.7 6.4 7.0
Energy exporters 332.4 317.8 6.8 1.2 -2.6
Indonesia 163.4 85.4 8.0 4.1 1.0Mexico 77.0 158.3 6.6 1.9 -3.5Nigeria 92.0 74.1 6.3 -3.5 -5.0
Smaller developingcountries f 1 133.8 1200 5.7 0.9 2.2
Energy importers 704.2 5.1 2.7 4.8Energy exporters 429.6 6.2 -0.8 -0.7
Source:Department ofInternational Economic and Social Affairs of the United Nations Secretariat,based on World Population Prospects: Estimates and Projections as Assessed in 1984 (UnitedNations, Sales No. E.86.XII.3); World Bank, The World Bank Atlas 1986, IMF, 1nternationalFinancial Statistics; and other official national and international sources.
a Annual mid-year population, medium variant.b Based on estimates provided in The World Bank Atlas 1986.c Annual average and annual rates of growth of real gross dOffiStic product.d Preliminary estimates.e Developing countries (excluding China) with populations greater than 75 million persons in
1984.f Seventy-six developing countries.
wage bill as a result of a stabilization plan stimulated industrial activities. The decline in oil prices and, particularly inthe case of Brazil, the lower interest rates on external debtenabled these two countries to increase their imports to support the expansion of their industrial sectors. However, several other large economies such as Indonesia, Mexico andNigeria, because of their dependence on oil exports, suffered considerable set-backs in 1986 as oil prices plummeted.
Diversity of performance at the regional level
The interregional diversity in economic performance thathad prevailed since the early 1980s in the developing areasdid not change in 1986, so that Asia continued to fare betterthan other regions. But the intra-regional growth patternchanged markedly. In Africa, countries south of the Sahara-with the drought ending in most countries of the region-generally sustained the moderate recovery that hadstarted in 1985. With the exception of the Congo, Gabon andNigeria, where real GDP fell considerably, the rate of
growth of the sub-Saharan countries clustered in the range of2.5 to 5 per cent in 1986. An improvement in agriculturalproduction in most of these countries both on account ofbetter weather conditions and because of an increase in producer prices and other recent redirections of policies liftedoverall output. Notwithstanding improved food productionin the subregion, such countries as Angola, Ethiopia, Mozambique, Somalia and the Sudan will still need a considerable amount offood aid in 1987.22
In North Africa, only Morocco achieved a considerableexpansion of output in 1986. The drop in oil prices and areduction in remittances from workers in the Persian Gulfarea complicated the external payments position of severalcountries. Until 1984, oil exporters in North Africa hadmanaged to maintain high import levels despite the softeningof oil prices. But a significant decline in import levels wasrecorded in Algeria, Egypt, the Libyan Arab Jamahiriya andTunisia in 1985. In 1986, these cut-backs intensified andseverely affected industrial production. The problem wascompounded by drastic cuts in public investment budgets.Consequently, not only did the real per capita GDP fall
22 See Adebayo Adedeji, '~dedeji's Message", West Africa, ·12 and 19 January 1987.
35

sharply but, because of the considerable deterioration in theterms of trade, all four countries experienced a drop in percapita real incomes of 8 to 10 per cent.
There was an acceleration in the rate of growth of LatinAmerica and the Caribbean to 3.5 per cent in 1986. RealGDPgrowth rate in Argentina, Brazil, Chile and Colombia-all large or medium sized energy-importing countries-ranged from 5 to 8 per cent. The policy-induceddeceleration of inflation in Argentina and Brazil led to considerable increases in the real wage bill and hence in thelevel ofdomestic demand, which in turn stimulated the levelof manufacturing output. In Chile and Colombia, increasesin agricultural output and exports provided impetus to overall output expansion. On the other hand, energy-exportersand the smaller economies of the Caribbean and CentralAmerica experienced a very sluggish expansion and, insome cases, a regression. Peru was an important exception.A rise in aggregate demand induced by consumer spendingand the Government's decision to limit the service paymentson external debt, allowing an increase in imports of close to30 per cent, resulted in a rapid increase in industrial output.The rate ofgrowth in the GDP of Peru exceeded 8 per cent in1986. But in this case, as in the case of Brazil, the currentaccount deteriorated markedly and it will be difficult tomaintain the rapid pace of growth in 1987.23
The economic performance of the Asian developing countries continued to be more robust than that of other developing areas. The success of several major exporters ofmanufactures in substantially increasing their exports to theindustrial countries has been a major factor behind the buoyant economic activity in Asia. Real GDP for the region as awhole grew by 4.5 per cent in 1986, an acceleration of 1.3percentage points cOmpared with the 1985 performance.The economy ofthe Republic of Korea, stimulated by a substantial depreciation of the won against the yen and a sharpincrease in its volume of exports to the industrial countries,grew by about 12 per cent. Pakistan and, to a lesser extent,Burma maintained the growth momentum of the first half ofthe decade as agricultural production kept the rapid pace ofexpansion of previous years. Bangladesh, Nepal, Sri Lankaand Thailand grew at virtually the same rate-around 4 percent-as in 1985, while Indonesia, Malaysia, the Philippinesand Singapore virtually stagnated. Growth is likely to resume, though at a moderate pace, in the latter four countriesin 1987. Some improvements in their balance of paymentsshould take hold after a protracted adjustment process in1985 and 1986.
The decision by some Middle Eastern OPEC members(mainly Saudi Arabia) in the second half of 1985 to raisecrude oil output resulted in an increase in the petroleum production in West Asia. However, the contribution of this increased oil production to growth in GDP was largely offsetby a rapid decline in real incomes brought about by the lower
oil prices and the decision of most Governments to cutbudget expenditures. Overall output in the region barely increased in 1986. Average per capita real income fell by morethan 10 per cent. Even though oil prices recovered somewhat in late 1986, the full impact of budget cuts is likely tobefelt in 1987.
Countries in the Mediterranean region-Cyprus, Malta,Turkey and Yugoslavia-experienced a considerable acceleration in the rate of growth of their real GDP from an average of less than 3 per cent in 1985 to 4.4 per cent in 1986.Lower oil prices had a beneficial effect on the import bills ofall four countries. None the less, these countries also haveclose economic links-exports of goods and services-witha large number of energy-exporters in the Middle East andthe overall impact of oil price changes has been rathermixed. After a successful adjustment in the early 1980s,Turkey has maintained a rate of growth of above 5 per centin the past three years. Real GDP of Yugoslavia, after aperiod ofprotracted recession since 1980, grew by 3per centin 1986.
The fight against inflation in 1986
The sustained efforts of a number of developing countriesto correct external and domestic imbalances, particularly byimplementing policies to reduce government budget deficits, have had an important effect in reducing inflation. But asignificant development in 1986 was the pervasive deceleration of inflation in some of the countries that followed unorthodox policies. Nearly all countries that had beenexperiencing hyperinflation or the threat of it in 1985 exhibited a remarkable slow-down in the pace of price increasesby mid-1986. 24 Between 1985 and 1986, the annual averagerate of inflation in consumer prices in Argentina declinedfrom 385 per cent to about 80 per cent, in Bolivia from morethan 8,000 per cent to less than 100 per cent, in Brazil fromsome 230 per cent to about 70 per cent, in Israel from morethan 300 per cent to under 60 per cent, and in Peru from 150per cent to 60 per cent.
The unorthodox policies adopted by these countries tofight inflation relied heavily on measures designed to lowerinflationary expectations, including price controls, de-indexation and rules for wage-setting in the pqblic and privatesectors. Soon after the introduction of the stabilizationplans, inflationary pressures eased considerably. However,after a year of application of the plans, serious problemspersist and certain imbalances have emerged in some ofthese countries, particularly Brazil, as prices of a large number of goods, services and production factors have not adcjusted adequately to reflect relative scarcities. Plans haveentered a second phase in which attention has shifted to thefiscal imbalances, with the objective of achieving a bettermix in the structure of relative prices in the context of areduced inflation rate. The rapid decline in inflation,
2l See Andres Bianchi, Robert Devlin and Joseph Ramos, "The adjustment process in Latin America 1981-1986", paper prepared for the Symposium on Growth-Oriented Adjustment Programs, convened by the World Bank and the International Monetary Fund, Washington, D.C., 25-27February 1987.
24 Only in the case of Mexico and Nicaragua was there a sharp acceleration in the rates of inflation.
36

through its effect on tax revenues, had already led to someautomatic reductions in fiscal imbalances (as a share ofGDP). However, as inflation rates began to stabilize incountries in which the thrustof the fiscal policy had not beenchanged, fiscal deficits widened again and inflation ratesshowed some acceleration in the latter part of 1986.
In the great majority of the developing countries, particularly those in South and East Asia, inflation rates have con~
tinued to subside and remain at comparatively low levels.
Selected policy issues
Even though some developing countries have succeededin growing at a fast pace despite external adversities, theeconomic progress of many developing countries during the1980s has been particularly disappointing. The lack of flexibility that has characterized most of their economies, in partas a result of past policies but mainly because of internalstructural factors, has proved to be a serious handicap in aperiod of a rapidly changing international environment. Theerratic behaviour of international trade in the period 19801984 and its modest growth in 1985-1986, together with significant declines in primary commodity prices, has requiredsubstantial structural adjustments as well as major changesin the conduct of economic policy in commodity-exportingcountries.
Moreover, the shift from a regime of low to one of highreal interest rates in the industrial countries, accompaniedby a retrenchment of international bank credit, has requireda major redirection in the economic policies of a large number of the developing countries that earlier had borrowedheavily from international commercial banks. As protectionist pressures have become a reality in the developedcountries, the major exporters of manufactures among thedeveloping countries also have had to undertake adjustmentsto lessen their vulnerability to international trade. These adjustments have included less reliance on foreign commerciallending, lowering the level of external debt, accumulation ofreserves, strengthening of the agricultural sector and reorientation of exports towards faster growing markets and newproduct lines.,
The economic adjustments in the large majority of the developing countries have been mostly of a contractionary nature. In the process, most economic groups living in urbanareas have been affected. While the need to protect the mostvulnerable groups is being increasingly recognized, progress has been slow. Efforts have been hampered by tightfiscal conditions and by a lack of institutions and policy instruments to reach and assist the affected groups in an effective way. In only a few cases has adjustment beenaccompanied by an acceleration in the output growth rate.
Savings and investment
A major factor in the slow-down of economic growth indeveloping countries has been the decline in investment.The rate of investment has continued to fall as the decline inthe inflowof capital from abroad (foreign savings) has beenaccompanied by marked decreases in the level of domesticsavings. 25. It is estimated that the gross capital formation as ashare of gross domestic product for the capital-importingdeveloping countries as a whole fell by more than 5 percentage points between the late 1970s and the mid-1980s. Yetabout a quarter of those countries still managed to achieve asignificant increase in that share. As analysed in chapterVIII, investment and savings ratios increased in severalcountries between the second half of the 1970s and the mid1980s.
In Africa and Latin America-the regions hardest hit bythe external debt problem-the investment ratio fell by morethan 6 percentage points during the same period. For thedeveloping countries as a group, central government fiscaldeficits as a share of gross domestic product doubled in thesame period, though much of the rise was concentratedamong the energy exporters. The reduction in the level ofnet domestic savings in the developing countries reflectsboth a deterioration in the fiscal deficits of central Governments and a reduction in the level of private savings as realincomes declined.
An important structural factor that has affected the savings-investment balance in many developing countries, although to varying degrees, is the considerable dependenceof public sector revenues on trade-related activities. Asshown in table 11.10, while the share of tax revenues derivedfrom international trade for the developed market economies in 1983"1984 was, on average, about 3.9 per cent, forthe developing countries it was more than 25 per cent. For afew developing countries, the trade-dependence ratio was ashigh as·two thirds, while the.maximum ratio for the developed countries was no more than 16 per cent.
Sinceimport tariffs usually constitute an important shareof the fiscal revenues, any shock that reduces the capacity toimport-for example, a drop in capital inflows-leads to asignificant decrease in fiscal revenues. More important, inmany countries government revenues, development budgetsand investment plans are often closely linked to export taxesor. surpluses generated by publicly owned export-orientedfirms. An adverse external demand shock for exportableproducts not only has a direct effect on the fiscal budgetbecause of an abrupt reduction in public sector revenues, butalso has indirect effects through the diminished capacity toimport.
25 For several studies concerning investment performance in the developing countries during the 1980s, see ECLAC, "Preliminary overview of theLatin American economy, 1986" (LC/G .1454); M. Watson, D. Mathieson, R. Kincaid, and E. Kalter, International Capital Markets: Developments and Prospects, Occasional Paper No. 43 (Washington, D.C., IMF, February 1986), pp. 77-81. Inter-American Development Bank, WorldEconomic Survey 1986 (Washington, D.C.), pp. 23-25; (United Nations publication, Sales No. E.86.II.C.l), pp. 108-121; IMF, World EconomicOutlook. April 1986, pp. 58-60.
37

Table 11.10 Sources of central government revenue in developedand developing countries, 1978-1984
Taxes on net income and Taxes on internationalprofit (percentage trade (percentageof total revenues) of total revenues)
1978-1979' 1983-1984 1978-1979' 1983-1984
Developing countriesMeanb 20.2 22.7 30.1 25.1Co-efficient of variationc 0.5 0.6 0.5 0.6Range 71.5-3.3 67.0-3.1 66.3-4.4 70.8-2.7
Developed market economiesMeanb 33.3 31.6 4.3 3.0Co-efficient ofvariationc 0.5 0.5 1.3 1.3Range 64.7-9.8 60.9-9.2 21.6"0.0 15.9-0.0
Source: Department of International Economic and Social Affairs of the United Nations Secretariat,based on IMF, Government Finance Statistics Yearbook, 1979 and 1986.
a 1978-1979 was chosen to show the degree of dependency before the onset of the slow-down ofworld trade in the 1980s.
b Unweighted arithmetic mean.c Ratio of standard deviation to mean. The smaller the ratio (i.e., the closer it is to zero), the less
variation there is.
Increasing domestic taxes and issuing government bondsare not viable options for policy makers in most developingcountries. Domestic capital markets are underdeveloped andnew taxes, particularly income taxes, usually have administrative and legislative delays and are difficult to collect.Moreover, it is both economically and politically difficult toincrease taxes at a time when personal incomes and profitsare either stagnant or falling. There are other policy alternatives to increase investment levels, but they require either areduction in government consumption, which could provecostly in political terms, or monetization of the public sectordeficit which, because of the inflationary pressures that itusually induces, is likely to be counterproductive in the mediumterm.
Energy-importing developing countries have resorted to amixture ofpolicy responses to the trade-related fiscal shocksof the 1980s. One common feature was an abrupt fall in public investment, including funding for national developmentbanks, which often constitute the major source for mediumterm to long-term finance of the domestic private sector. Inthe second half of the 1980s, the reverberations of the external shocks have begun to subside and new policies have contributed to an improvement in the public sector financialposition in a number of countries. However, the modestgrowth of international trade has limited these countries'room for policy manoeuvre and does not provide a largedomestic stimulus to speed up growth.
The policy dilemmas faced in the energy-exporting developing countries have been formidable. The economic situation in these countries has deteriorated ever since thepositive effects of oil price changes on trade-related publicrevenues peaked in 1981. Thereafter, because of slowlygrowing or declining export volumes, but particularly as theresult of the oil price counter-shock that began in late 1985,there have been widespread and drastic cut-backs in the development budgets of these countries. A big problem facingsome of the Middle Eastern oil exporters is the financial
crisis of their large private enterprises. Although the Governments of the countries of the region are still net creditors,the combination of private capital flight and a sharp drop inasset values has brought a large-scale financial crisis to someof the countries in the Persian Gulf area.
Exogenous factors have also played direct roles in reducing private savings in the developing countries in recentyears. First, real per capita incomes have been adverselyaffected by the deterioration of the terms of trade in the1980s, which in turn has inhibited private savings levels despite increases in domestic real interest rates. Secondly,countries with large external debts, or countries that had torely heavily on short-term official or commercial credit, experienced sudden declines in profits as domestic firms faceda rapid rise in the outflow of resources to service their external debt. In sum, given the present constraints on domesticsavings and the sharp decline in the net inflows of foreignfinancial capital into these countries, investment rates arelikely to remain depressed in many developing countries.This in turn will restrain the rate of growth pf output fromaccelerating far above the average of the 1980s.
Although the nominal interest rates in industrial countrieshave been on a downward trend since 1984, the burden ofservicing external debt has been increased for developingcountries because their export prices have declined morethan the international interest rates. Many developing countries have been forced to redirect their investment policiestowards smaller-scale, possibly more efficient, investmentswith shorter gestation periods. In some countries, wheremarket incentives have been used aggressively to promoteprivate initiative, the results thus far have been encouraging,particularly in the agricultural sector. Although it is still tooearly to generalize, it seems that the new policies of liberalization and deregulation of markets have led to a measurableacceleration in the growth of output in a number of countriesin the mid-1980s. But it remains to be seen to what extent thenew policies will lead to a sustained rise in per capita in-
38

Although real disposable income increased by 3 per centfor the year as a whole in the United States, it began to decline in the second half of 1986. The consumption level wasmaintained to a large extent because of a continued declinein the savings ratio, which fell to 2.7 per cent in the fourthquarter of 1986-the lowest rate since 1939. Moreover, theconsumer debt rose sharply to a record level-about 17.5 percent of GNP. However, increases in prices of equities andreal estate in the United States in 1986 prevented the ratio ofhousehold assets to liabilities from changing significantly. Inthe Federal Republic of Germany and Japan, real domesticdemand also began to weaken towards the end of 1986 asexports began to suffer from the sharp appreciation of theircurrencies against the dollar, and as energy-exporting developing countries reduced imports. In both of these countries,the fall in exports has begun to seriously affect the traderelated investment and employment.
Japan and the United States demand grew at virtually thesame rate as in 1985 (table II.11). There was, however, asignificant weakening in the United States in the latter half of1986 due to a decline in business investment rate and a slowdown in consumer demand. Uncertainty regarding the effecton business investment of the 1986 Tax Reform Bill was themajor factor behind the 1.5 per cent drop in real non-residential investment in the United States in 1986.
Major differences in external and internal sources of output growth notwithstanding, there was considerable convergence in output performance in 1986. Real GNP grew byabout 2.5 per cent in France, Italy, Japan and the UnitedStates. The Federal Republic ofGermany 's output grew by 2
The strengthening of domestic demand was more marked per cent, and that of Canada and the United Kingdom by 3among the major European economies (France, the Federal per cent and 2.8 per cent, respectively. The smaller indus-Republic of Germany and the United Kingdom), while in trial countries grew by 2 per cent, which was a slightly
Table 11.11. Contributions of domestic demand (DO) and net foreign demand (FD)to GOP growth, 1984-1986
comes in the absence of significant stimulus from eitherworld trade or international financial capital.
Economic interactions, policy debate and large externalimbalances among the developed marketeconomies
The main driving forces that affected prices, trade, outputand employment in nearly every industrial country in 1986were set in motion by the depreciation of the dollar and thefall in oil prices. The dollar decline, by affecting the relativecompetitiveness of each country internationally, redistributed demand away from the tradable goods and services produced in the yen and deutsche mark currency zones towardsthose produced in the dollar zone. The decline in oil pricesbenefited the energy-using sectors but hurt the energy industry, which suffered a significant decline in investment andemployment in the major oil-producing countries. Externally, the industrial countries benefited from a terms of tradegain of some $95 billion against the energy- and commodityexporting developing countries, but their exports to the developing countries fell sharply.
Despite the terms of trade gain of about 1.5 per cent oftheir combined GOP, real output in the industrial countriesincreased by only 2.4 per cent in 1986 a deceleration of 0.5per cent in comparison with 1985. Real domestic demand,however, grew by 3.5 per cent, 0.5 per cent higher than in1985. The higher demand growth reflected the favourableimpact of the lower oil prices on private consumption expenditures. On the other hand, private investment in severalmajor economies weakened, particularly in the latter half of1986.
Developed Federal Republicmarketeconorrries of Germany Japan United States
GOP DDs FOb GOP ODs FOb GOP DDs FBb GOP DDs FObgrowth growth growth growth
Percentage change
1980-1985c 2.0 1.9 0.1 1.2 0.3 0.9 3.9 2.5 1.4 1.9 2.5 -0.6
1984 4.4 4.8 -0.3 3.3 2.2 1.1 5.1 3.7 1.3 6.4 8.4 -1.9
1985 2.9 3.0 -0.1 2.5 1.5 1.0 4.7 3.7 1.0 2.7 3.4 -0.7
1986d 2.4 3.5 -1.1 2.1 3.6 -1.5 2.5 3.8 -1.3 2.5 3.6 -1.1
1986d e
First quarter 2.5 3.5 -1.0 1.7 1.7 0.0 3.0 3.2 -0.2 3.1 4.4 -1.3Second quarter 2.8 4.3 -1.5 3.3 5.0 -1.7 2.5 4.4 -1.9 2.7 3.9 -1.3Third quarter 2.6 4.0 -1.4 2.3 3.2 -0.9 2.4 4.3 -1.6 2.2 3.6 -1.4Fourth quarter 2.0 3.6 -1.6 2.0 2.5 -0.4
Source: Department ofinternational Econorrric and Social Affairs ofthe United Nations Secretariat,based on OECD, Quarterly National Accounting and other official sources.
a Rate of growth of real domestic demand, which is the sum of consumption expenditure and grossdomstic investment.
b Change in real foreign (trade) balance as a percentage of previous year's GOP/GNP.c Annual average growth rates.d Prelirrrinary estimates.e Quarterly growth figures are annual rates calculated with respect to the corresponding quarter in
the preceding year.
39

slower pace than in 1985. There was, however, a markeddiversity of performance among those economies. The major exporters of food and other primary commodities, Australia and New Zealand, suffered terms of trade losses andtheir real output grew very little or fell. There was also aslow-down in the pace ofeconomic activity in Belgium, Finland, Greece, Ireland and the Netherlands all of which grewat less than 2 per cent in 1986. In Denmark, Norway, Portugal and Switzerland, however, output grew by 3 per cent ormore.
Inflation declined in nearly all industrial countries and theaverage rate fell to less than 3 per cent-the lowest in morethan a quarter of a century. However, in .four countries,Greece, Iceland, Portugal and New Zealand, the inflationrate was still in double digits, while in Japim and Switzerlandinflation fell to less than 1 per cent, and in the Federal Republic of Germany it. was slightly negative. Most of the decline in inflation rates in 1986 was due to the fall in rawmaterial prices, but the rate of change in unit labour costs inmanufacturing, alsoa major determinant ofcosts and prices,remained fairly moderate in most countries within thegroup.26 The average rate of increase in hourly wages inmanufacturing in 1986 was the lowest in more than two decades. The unemployment rate remained stubbornly high atabout 8 per cent for the group as a whole. This persistentproblem plaguing many industrial economies, particularlyin Western Europe, is the subject of a more detailed analysisin chapter VII below.
The major developed market economies have reached animportant juncture in their conduct of macro-economic policies. Although their overall budgetary and monetary policies have remained cautious, major inconsistencies amongtheir policies have given rise to serious risks for the international economy. Despite efforts in 1985, 1986 and February1987 to raise the level of economic co-operation, major economic problems not only remain, but have intensified. As atearly 1987, the major macro-economic problems facing theindustrial countrieswere massive trade imbalances; instability in foreign exchange markets, particularly the sharp decline of the dollar; very high rates of unemployment in thelarge majority of the countries; and the potential negativeimplications of the developing countries' external debt crisisfor international financial stability and for the creditor countries themselves.
These policy issues are intimately related to one another.The key variable that links them together is the growth in theindustrial countries of aggregate demand and its geographical distribution. The major policy debate has, therefore,centred on the desirability of a higher rate of growth of demand, its distribution among the major economies, and thepolicy changes needed to achieve the desired results. TheUnited States Government, in order to avoid a recession andto stave off the intense political pressure for protectionistmeasures, wants to see the massive trade deficit narrow sig-
nificantly and quickly. Ithas urged the other major industrialeconomies to step up their demand growth in order to absorbmore United States exports. It has been argued that if demand in the rest of the world does nor grow at a sufficientlyfast pace, the dollar will fall even Illore and protectionistlegislation will have to be acted upon to narrow the tradedeficit in the United States,
It should be pointed out, however, thatmore than a quarterof the $100 billion increase in the United·States trade deficitbetween 1982 and 1986 has been with the developing countries, which, because of the debt problem and the collapse ofcommodity prices, have had tocut back their imports.
Fiscal and monetary policy
Data on structural, or cyclically· corrected, budget balances show that the fiscal stances of the Federal Republic ofGermany and Japan until 1986 were restrictive while that ofthe major industrial countries as a whole was expansionary(see table A.tO). However, a major policy shift is takingshape among the major industrial countries in the area offiscal policy, which, on balance, is moving towards restriction. The most important aspect of the shift is the gradualtightening of the fiscal stance in the United States. Otherchanges as at early 1987 involve a moderate expansion in theFederal Republic of Germany, Japan and the United Kingdom, and a movement towards restriction in Canada, Franceand Italy.
The main objective of monetary policy in all major economies has remained that of continual downward pressure oninflation and inflationary expectations, and the policy posture of the three major economies has been only cautiouslyaccommodative (see table All). Even though monetary aggregates have been growing at the upper bound of officiallyset targets (or above, in the case of the Federal Republic ofGermany), the declining income. velocity of money hasmade policies less accommodative than had been anticipatedby the monetary authorities .. Falling nominal interest ratesand deceleration of inflation were the key factors behind thedecline in velocity in 1986. Financial innovations, deregulation of financial markets and, in general, .greater substitutability between moneyanctother financial instrumentsaccount for the unpredictability of money demand. The highdegree of volatility of demand for money in most of the major industrial countries in recent years has put the usefulnessof monetary targets in.doubt. In early 1987 the monetaryauthorities in the United States stopped targeting the M 1(i.e" currency in circulation· plus· demand deposits), themost volatile monetary aggregate in that country.
Although the reductions in official discount rates causedsignificant declines in nominal interest rates in many countries, most of the reductions came in the latter half of 1985and early 1986 when oil prices began to fall precipitously.The favourable effect of the oil price declines on inflation
26 Unit labour cost (ULC) in manufacturing is defined as the nominal wage bill per unit of real output in the manufacturing sector. The percentagechange in ULe is equal to the percentage change in the average nominal wage rate less the percentage change in average labour productivity(output per man-hours).
40

rates caused real interest rates to remain very high; indeed,they increased in both the Federal Republic of Germany andJapan.
Attempts at policy co-ordination in industrial countries
The policy makers in the major industrial countries haverecognized that the magnitude and nature of the problemsfacing their economies are such that their resolution requiresfrequent consultation, discipline and tight co-ordination inthe conduct of macro-economic policy. Several major attempts have been made in that direction in the past twoyears. These were the Group of Five agreement (the PlazaAgreement) on exchange rate realignments and macro-economic policy adjustments (New York, September 1985); thepolicy declarations of the Tokyo summit meeting of theGroup of Seven in May 1986; the bilateral agreements between the United States and Japan in mid-1986 on the yen"dollar exchange rate; and the Group of Six agreement (theLouvre Agreement) on policy realignments and joint intervention in foreign exchange markets to stabilize the exchange rate of the dollar (Paris, February 1987).
Despite these agreements, in the first quarter of 1987 thedollar fell sharply vis-a-vis all key currencies. The international currency markets were awaiting evidence supportingthe declared policy pronouncements, particularly the intended reflation in the Federal Republic of Germany andJapan. Meanwhile, as the dollar declined, tensions began todevelop over trade issues among the key countries.
Continued instability in the currency markets and furtherdecline of the dollar have dangerous repercussions. Theycould induce a deep recession in Europe and Japan with adverse global repercussions. A recession would reduce thosecountries' imports from the United States. Moreover, asharp and disorderly depreciation of the dollar would also bepotentially troublesome for the United States since it wouldeventually lead to a higher rate of inflation and, most likely,to higher nominal rates of interest there.
The highly expansionary fiscal stance of the United Statesbetween 1982 and 1986 (see table A.lO) has been a majorcause of the deterioration in the trade position of the UnitedStates. The size of that country's fiscal deficit is expected todecline by $30 billion in 1987, to about $180 billion. This isa sizable reduction even though it fails to reach the targetlevel of about $150 billion set by the Balanced Budget andEmergency Deficit Control Act of 1985 (the Gramm-Rudman-Hollings bill). However, a more decisive policy shift inthe United States has to be made and co-ordinated with theother major actors to avoid the possibility of a world-widerecession, with the major market economies in Europe andJapan accelerating their demand growth as pledged in theLouvre Agreement in February 1987. The policy makers inthese countries fear that a significantly higher rate of growth
of demand will trigger inflationary pressures, particularly ifthe demand for raw materials expands too rapidly.27 Moreover, Japan has argued that its central government budgetdeficit in relation to GNP is already quite large (see tableA.IO) and that the burden of public debt, measured as theratio of debt to GNP, has increased from 28 per cent in 1980to more than 40 per cent in 1985.
Persistence of large external imbalances
The massive external payments imbalances that have emerged since 1983 in several major industrial countries haveproved difficult to eliminate, and their persistence has hadhighly undesirable side effects on the world economy. Theyhave already fundamentally altered global economic relations, and their prospective ramifications, both in real andfinancial terms, continue to be a major cause for concern.These imbalances are very large and still growing: the current account deficit of the United States rose from $9 billionin 1982 to $140 billion in 1986, or about 3.3 per cent of thecountry's GNP in 1986.28
To a large extent, the counterpart of the. United States deficit has been the current account surpluses of the FederalRepublic of Germany and Japan, which together rose from$11 billion in 1982 to $122 billion in 1986. Japan's surplus,in both absolute and relative terms, is unprecedented. At$86 billion, Japan's surplus in 1986 was nearly twice as largeas that of the previous record holder-Saudi Arabia in 1980.Relative to the size of its economy, Japan's current accountsurplus has also been growing very rapidly, from less than 1per cent of GNP in 1982 to 4.2 per cent in 1986.
A major factor that distinguishes the present imbalancesamong the major industrial countries from those experienced in the 1970s is their persistence. The current accountsurplus of the countries members of OPEC emerged in 1974and had disappeared by 1978, and OPEC's larger surplus of1980 ($106 billion) turned into a sizable deficit in just twoyears. Another important distinction between the 1970s andthe 1980s is the source ofthe imbalances. The large currentaccount deficits and surpluses of the 1970s emerged becauseof the sharp increases in the prices of oil and other raw materials, and were mainly between the industrial countries andthe energy-exporting developing countries. The paymentsimbalances of the 1980s have been mainly among the majorindustrial countries and, to a large extent, are the result ofinconsistencies in their macro-economic policies.
The magnitude and persistence of the present global imbalances have had three major repercussions. First, the massive international capital flows that have financed thecurrent account deficits among the industrial economieshave taken place at a time of near-stagnation in financialflows to the capital-importing developing countries andhave lowered real interest rates in the receiving countries
27 There is some empirical evidence that supports this hypothesis (see W. Beckerman and T. Jenkinson, "What Stopped the Inflation? Unemployment or Commodity Prices?", The Economic Journal, March 1986, pp. 39-54).
28 Only Italy and the United Kingdom (in 1975) had current account deficits as a percentage of their GDP larger than that of the United States in1986.
41

relative to those in the rest of the world. Secondly, the magnitude of the present and prospective external imbalancesand their implied financing requirements have led to excessive volatility in foreign exchange and financial markets, asuncertainty about policy responses and their impact has infiltrated the markets. In such an environment, decisionmaking by economic agents investors in particular hasbecome exceedingly difficult. Thirdly, the trade imbalanceshave heightened protectionist pressures in the deficit cOUntries; in cases where threats have turned into action, the dynamism of world trade has been reduced.
The origin of the imbalances lies in part with the seriousand prolonged misalignments among the exchange rates ofkey currencies in the period 1980-1985. However, the majorcause of their emergence and their persistence has been thesignificant differences in the rates ofgrowth ofreal domesticdemand, mainly induced by policy, among the major industrial countries. Between 1980 and 1985, the annual rate ofgrowth of real domestic demand was 3.6 per cent in theUnited States, 2.9 per cent in Japan, and only 0.5 per cent inthe Federal Republic of Germany (see figures 11.7 and 11.8).In the same period, the dollar appreciated by 5 per centagainst the yen and by 60 per cent against the deutsche mark.These two influences provided a strong external boost forthe economies of the Federal Republic of Germany and Japan and a major drain on the United States economy. Severalstudies measuring the size of the effects of exchange ratemovements and of the differential growth rates of domesticdemand seem to indicate that the trade imbalances wouldhave widened even in the absence of exchange rate movements, but that the latter played a key role in aggrevating thesituation.29
A persistent deterioration in the current account balanceofa country is, in most instances, a reflection ofan excess ofaggregate demand over aggregate domestic production ofgoods and services; to eliminate such an imbalance, eitherdomestic production has to be increased or domestic demandhas to be reduced. The sharp deterioration in the UnitedStates current account balance between 1982 and 1986 is adirect result of such an internal imbalance. It is closelylinked to the developments in the budget balance of theUnited States Government (see figure 11.9) and to thechanges in the balance between private savings and investment in that country over the same period. As shown in table11.12, the general government budget of the United Stateswas consistently in deficit between 1982 and 1986 in theamount of about 3.5 per cent of GNP. In the same period,domestic sources offinancing for this deficit dried up, as theexcess of gross private savings over gross private domestic
investment fell from 3.5 per cent of GNP (17.6 less 14.1) in1982 to zero (16.2 less 16.3) in 1986. Foreign savings (netinflow of capital into the United States) have become themain source of financing of the budget deficit. The majorcauses of the change in the savings and investment balanceof the United States have been the sharp decline in the personal savings rate (from 6.8 per cent of disposable income in1982 to 3.9 per cent in 1986), and a significant rise in grossprivate domestic investment during the period 1982-1985 asthe economy, mainly fuelled by the government budget deficit, expanded. Although private investment has begun toslacken, excess domestic savings have not occurred as aresult.
In the Federal Republic of Germany and Japan, the situation regarding the savings and investment balance has differed widely from that in the United States. In Japan, grossdomestic investment has declined as a share of GNP, whileprivate savings have remained steady and the governmentbudget deficit has been sharply reduced. The combination ofthese elements has created an excess of domestic productionover domestic demand, giving rise to a net outflow of resources that has risen continuously since 1983 and amountedto more than 4 per cent of the GNP of Japan in 1986. In theFederal Republic of Germany, on the other hand, gross domestic investment as a percentage of GNP has remainedmore or less steady, but private savings have increased,while the government budget deficit has declined significantly. Hence, in both the Federal Republic of Germany andJapan, the excess of the domestic supply of goods and services over domestic demand has resulted in a continuous increase in the outflow of capital from 0.4 per cent of theircombined GNP in 1982 to 3.5 per cent in 1986. Such factorsas exchange rates, personal saving rates, tax rates and tradeelasticities, among others, have important roles in explaining the persistent imbalance in the current accounts of thethree largest industrial economies, but the evidence indicates that the main cause lies in the divergence in fiscal developments among these countries. 3D
Since early 1985, the rates of growth of real domestic demand in the United States and Japan have become virtuallythe same (see figure 11.10). In the European Economic Community, mainly because of the Federal Republic of Germany, there was an acceleration in the rate of increase indomestic demand in 1986. In addition, the value of the dollarhas fallen precipitously since early 1985. Yet the imbalanceshave persisted; and although there are signs that they maystop growing, there are likely to be delays in the adjustmentprocess. There is also the fear that, as long as the underlyingpolicy causes are not corrected more decisively, the adjust-
29 See Vincent Reinhart, "Macroeconomic influences on the U.S.-Japan trade imbalance", Federal Reserve Bank ofNew York Quarterly Review,Spring 1986, pp. 6-11. This study finds that the slower income growth in Japan than in the United States in 1980-1985 accounted for about 40 percent of the deterioration in the bilateral trade balance. An earlier study by Stephen Marris (Deficits and the Dollar: The World Economy at Risk(Washington, D.C., Institute for International Studies, December 1985)), looking at the entire period 1980-1984, found that the growth gapbetween the United States and the rest of the world accounted for 25 per cent of the total deterioration in the United States current account deficit.However, in 1984 the growth gap effect had grown to 50 per cent. .
30 See Philip Turner, "Savings, investment and current account: an empirical study of seven major countries, 1965-1984", Bank of Japan, Monetary and Economic Studies, vol. 4, No.2 (October 1986), pp. 1-58; Bank for International Settlements, Annual Report (Basle, June 1986), pp.62-66; Council of Economic Advisers, Economic Report ofthe President (Washington, D.C., United States Government Printing Office, February 1987), pp. 107-113.
42

~i>!l.rj.r!sprlolANDCNP ••••••
FigureII.7. United States: output an
125r (In_d_e~x~:1~9=8:0~=~1~0:0~~_d_o_m_es~t~iC~d:e:m:an:dd
120
Figure II.8. Japan: output and d(Index: 1980 = 1oo~mestic demand
110
105
100
~i>!'!.rj.r!SprIolANOCNP ••••••
95 ...~ ~#~ ~ ~.!!! ~ ~ ~;-... ~ " ~~,';':::.$'~""~
.!!! .!!!'" ... ~ '" ~ ~ .,'" ~ ~ .lo.
S
QUARTER.!!!.!!!'" "'''' "'..... ~ ~~,,,. D """ ~
b . epartment f Iased on GEeD Q 0 nternational E ., uarterl AT' conorruc and Sy natIOnal Ac ocial AU .counts airs of the U .. mted Nations Secretariat,
43

Figure II. 9. Budget and current account balancesof the United States(Billions ofdollars)
50 __-------------------,
-50
-100
-150
-200
\.\\\..."\.
'.
~~!~E~~!BUDG£T eAtANa
Source: Department oflnternational Economic and Social Affairs of the United Nations Secretariat,based on Council of Economic Advisers, Economic Report ofthe President (Washington, D.C.,United States Government Printing Office, February 1987).
Figure n.lO. Domestic demand in EEe, Japanand the United States(Index: 1980=100)
125-,--------------------.
110
115
105
lli.._ .._ ...~JAPAN
120
/ ...-.., ..._..,
~". ~.....-....100 .. ---- ~...,........~~. . ...-..,.... , " / .........../..........."...
==~-==~-==~-==~-==~-==~----~ --~ --~ --; --~ --:
~ ~ ~ m OJ ~
QUARTERLY DATA
Source: Department oflnternational Economic and Social Affairs ofthe United Nations Secretariat,based on OECD, Quarterly National Accounts.
44

Table n.12. Global payments imbalance and savings-investment balanceof the United States, 1979-1986
1979 1982 1983 1984 1985 1986'
Billions of United States dollarsCurrent account balanceb
United States --I -9 -47 -106 -118 -141Japan -9 7 21 35 49 86Germany, Federal Republic of -6 4 4 7 13 36
Percentage of GNP
Net capital inflowc (foreign savings)United States 0.1 -·0.0 1.1 2.4 2.7 3.5Japan 0.9 0.7 -1.8 -2.8 -3.9 -4.2Germany, Federal Republic of 0.8 -0.4 -0.5 -0.8 -2.0 -3.5
Government savingsd
United States 0.5 -3.5 -3.8 -2.7 -3.4 -3.4
Gross private savingsUnited States 17.8 17.6 17.4 17.9 17.2 16.2
Gross private domestic investment e
United States 18.2 14.1 14.7 17.6 16.5 16.3
Memorandum item:Inflow of capital to theUnited States f
(billions of dollars) 64 127 101 128 150 240
Source: Department oflnternational Economic and Social Affairs of the United Naitons Secretariat,based on OECD Economic Outlook, No. 40 (December 1986), United States Federal Reserve Bank,Federal Reserve Bulletin (Washington, D.C.), various issues; Council of Economic Advisers,Economic Report ofthe President (Washington, D.C., United States Government Printing Office,1986 and 1987); and Bank for International Settlements, Fifty-Sixth Annual Report (Basle, 1986).
a Preliminary estimates.b Including official transfers.c Including statistical discrepancy; minus sign indicates an outflow.d General government budget balance, which is the sum of the budget balances offederal, state and
local governments.e By definition, gross private domestic investment is equal to the sum of government savings,
gross private savings and net capital inflow.f Sum of the net changes in foreign official and private assets in the United States plus the errors
andomissions of the balance of payments of the United States.
ment pressure will fall upon exchange rates among key currencies and interest rates; these may easily overshoot theirdesirable levels, making the eventual correction process extremely costly.
While the legacy ofthe large United States budget deficitand its eventual correction weighs heavily in achieving amore sustainable trade deficit in that country, there are stillother factors that might make the adjustment process undulyprotracted. First, the dollar has not depreciated evenlyagainst all currencies, as analysed in chapter III, and hasappreciated against the currencies of main trading partnersof the United States, namely Canada and Mexico, withwhom the United States has a substantial bilateral trade deficit. Secondly, many exporters to the United States have notpassed on to consumers the full impact of the dollar depreci-
45
ation, opting instead to protect their market shares and to lettheir profit margins be squeezed, at least in the short run.
A third factor, structural in nature, is that the ratio ofUnited States merchandise imports to exports has becomevery high, rising from 1.10 in 1979 to 1.65 in 1986. The 65per cent excess of United States imports over its exportscurrently means a difference of $145 billion. The opposite istrue for Japan: in 1986, its exports were 65 per cent largerthan its imports. For the Federal Republic of Germany, thedifference is less glaring: exports exceed imports by about30 per cent. Given these initial conditions, it will take sometime for the corrections to become visible, even though therehave already been substantial price and income adjustments.
Fourthly, income elasticity of demand is relatively low for

United States exports, and quite high for its imports. Theopposite is true for Japan.3! Estimates made by the UnitedNations Secretariat of the income elasticities for exports areabout 1.0 for both the United States and the Federal Republicof Germany and 1.75 for Japan. On the other hand, the income elasticity of imports is over 2 for the Federal Republicof Germany and the United States, and only 0.75 for Japan.These differences are closely linked to the commodity composition of each country's exports and imports.32 An important policy implication of the differences in incomeelasticities is that stimulating domestic demand will be moreeffective in the Federal Republic of Germany than in Japanin reducing the trade surplus. Moreover, given the initialconditions and the income elasticities of exports and imports, real imports by the rest of the world must grow morethan three times as fast as the rate of growth of real domesticdemand in the United States in order for the United States toreduce its trade deficit quickly. 33
A fifth factor affecting the adjustment of the trade balances is price elasticities of exports and imports. Economic
theory holds that, if price elasticities of demand for exportsand imports add up to more than unity, exchange rate adjustments will lead to a correction of trade imbalances. 34 However, trade volumes may adjust only slowly to price changesinduced by exchange rate realignments; initially trade imbalances may even worsen in nominal terms. This phenomenon, which is known as the J-curve effect, has been anadditional factor in delaying the adjustments in the trade imbalances. 35
A sixth set of factors that may have played a critical role inthe emergence of global imbalances is the large, and sometimes destabilizing, changes in real exchange rates broughtabout by excessive capital mobility.36 The attractiveness ofUnited States assets to foreign investors, in part because ofhigher interest rates in the United States caused by the expansionary fiscal policy, has also been a factor in delayingthe correction of the United States imbalance. Uncontrolledand excessive capital flows, together with relatively slowadjustments in product and labour markets, can lead to verylarge shifts in relative prices through exchange rate changes.
'I For an analysis of the statistical estimates of income and price elasticities of export and import demand for the United States, the Federal Republicof Germany and Japan, see Yuzo Kumasaka, "Japan's trade surplus since the G-5 meeting ofSeptember 1985", Department ofInternationalEconomic andSocial Affairs of the United Nations Secretariat, Working Paper No.3, May 1987.
Income elasticity of demand for imports is defined as the percentage change in the volume of imports demanded induced by a I per cent increase in the country's real income, holding all other variables, including prices, constant. Income elasticity of demand for exports is defined asthe percentage change in the volume of exports demanded induced by a I per cent increase in the real income of the country's trading partners,holding all other variables, including prices, constant.
Price elasticity of export demand is defined as the percentage change in the volume of exports when the export price increases by I per cent,holding the real income of trading partners and all other prices fixed. Price elasticity of import demand is defined as the percentage change in thevolume of imports when the import price increases by I per cent, holding the country's real income and all other prices constant.
Estimates of export and import demand equations are shown in the following table:
Income Price elasticity a
Trade volume by country elasticity Short-termb Long-term b
Germany, Federal Republic ofExports 0.95 -0.04 -0.36Imports 2.04 -0.21 -0.46
JapanExports 1.75 -0.06 -1.35Imports 0.75 -0.03 -0.49
United StatesExports 1.00 -0.21 -0.93Imports 2.19 -0.30 -1.20
Note: Estimation method: ordinary least squares; period of estimation: first quarter 1977 to first quarter 1986.• Relative price of exports: unit value of exports in dollars divided by that of the rest of the world; relative price of imports; unit value of imports
in domestic currency divided by the country's wholesale prices.b Short-term: one quarter; long-term: eight quarters.
32 In general, internationally traded manufactures have a higher income elasticity of demand than that of raw materials. In 1985-1986, manufacturestrade as a percentage oftotal imports was 24 per cent in Japan, 58 per cent in the Federal Republic of Germany and 62 per cent in the UnitedStates. On the export side the same shares were 98 per cent in Japan, 90 per cent in the Federal Republic of Germany and 70 per cent in the UnitedStates.
"For the United States the naive calculation, other things being equal, is as follows: (2.2 income elasticity ofimports/1.0 [income elasticity forexports])*1. 65 =3.6, where 1.65 is the initial ratio of imports to exports. Thus world trade must grow by 3.6 times the rate of growth of domesticdemand in the United States.
34 This stability requirement is known as the Marshall-Lerner condition. Secretariat estimates indicate that the condition holds for the United Statesand Japan, but the results for the Federal Republic of Germany do not warrant a firm conclusion.
35 The J-curve effect is observed because trade contracts are usually ratified long before the delivery date, but the transaction is recorded in tradestatistics. So, for a given exchange rate change, trade volumes are not going to be affected for some time. Since, as is the usual practice in theindustrial countries, exports are invoiced in the currency of the exporter, the trade balance may worsen initially as the result of exchange ratedevaluation.
36 See James Tobin, "A proposal for international monetary reform", Eastern Economic Journal, July/October 1978; and R. Dornbusch, "Exchange rate economics: 1986", National Bureau ofEconomic Research Working Paper, No. 2071, November 1986.
46
Large inflows of capital into the United States since 1980raised the demand for dollars and dollar-denominated assetsand contributed to the appreciation of the dollar over thatperiod, thereby aggravating the trade deficit. As shown intable 11.12, the net inflow ofcapital to the United States (i.e.,excluding outflows from the United States) rose from $64billion in 1979 to $240 billion in 1986. Such a massivemovement of financial capital into a single country is unprecedented. Liberalization of financial markets, throughthe progressive removal of capital controls and the integration of national markets, particularly in Japan, the UnitedKingdom and the United States in recent years, has playedan important role in this regard (see chap. IV below).
The overwhelming dominance of financial capital movements over the real flows in recent years may be illustratedby the fact that in 1986 the average daily transaction of internationally traded goods and commodities was about $5.5billion, while the dollar transactions, induced by capitalflows, in foreigp exchange markets reached $200 billion aday. In 1979, the respective figures were $5 billion and $75billion. As long as capital can move freely and in massiveamounts, it is likely to influence exchange rate changes significantly and to affect adjustments in trade flows correspondingly.
On balance, it seems likely that the present large tradeimbalances may persist. They will certainly do so if uncoordinated macro-economic policy shifts take place in keycountries and if there are large swings in exchange ratesbrought about by capital movements rather than by changesin trade balances. During most of the post-war era, international capital flows were restricted while trade flows wererelatively free of barriers. In the 1980s, the opposite seemsto be the case and the global economy is having difficultyadjusting to the new situation.
The new policy setting and economic situationin the planned economies
As the starting point of the medium-term socio-economicplans for the second half of the 1980s, 1986 was targeted asthe year in which policy makers hoped to make headwaywith laying the foundations for the "economic intensification strategy" or with consolidating and strengthening theachievements of recent years. All-round economic intensification permeates the medium-term plan intentions. Two circumstances favoured this. First, the moderate to largeexternal imbalances in a number of these countries, especially in Eastern Europe's trade with convertible currencypartners, and the world-wide recession ofthe early 1980shad eased considerably by mid-decade. Secondly, policymakers in virtually all countries had decided to formulateand implement structural adjustment policies through concerted policy designs, which is a major departure from pastpractice.
Policy setting
Perhaps the most striking feature of this departure frompast practice in the majority of the plans of the Europeancentrally planned economies emerges from the policy
47
change as regards the choice between consumption and capital formation. Especially with respect to the latter, the newplans in several countries are in sharp contrast to those of thefirst half of the 1980s, when investment expansion was heldto a minimum throughout Eastern Europe and in fact declined in several countries members of the group. Policymakers appeared to be prepared to ease the priority that hadbeen placed earlier on safeguarding consumption levels, especially during the initial phase of the emerging adjustmentmeasures taken in several Eastern European countries. Inparticular, the Union of Soviet Socialist Republics is embarking on a major acceleration of capital formation, eventhough the investment plan for 1981-1985 was well exceeded.
Though some of the Eastern European centrally plannedeconomies appear to have returned to the policy ofaccelerating output growth through strong investment activity, whichwas typical of the 1970s, the underlying strategy differssharply. Policy makers now intend to focus on highly selective branches, especially in high technology fields, and toimplement various efficiency and capacity utilization measures. This stems from the need to strengthen the foundationsfor the modernization strategy envisaged through the late1980s and early 1990s, and to improve domestic balances.This attitude is also very pronounced in the USSR.
In China, the key policy concern since late 1985 has beenthe further rounding off of the economic reforms and structural adjustments that have been major features of economicpolicies since the late 1970s, with urban reforms placed atcentre-stage. With the political changes since the beginningof 1987, however, the pace of these reforms has beenslowed. At the same time, in late 1985, policy makers inChina, in contrast to the European countries, were hoping tocool off the economy, especially by holding the rate of increase in investment activity well below that observed during the period 1983-1985. This stance had several goals.Perhaps uppermost was relieving import pressure and domestic imbalances. The very rapid increase in consumer incomes, and hence demand, in the recent past could be metonly partially because imports were not allowed to expandsufficiently. The major impetus to this policy stance was theprospect that a prolonged relaxation of import curbs to rectify consumer markets would lead to an undesirable, and atany rate unsustainable, deterioration in the external accounts. Because policy makers in China have restricted theinflow of capital from abroad to productive investments, asharp and sustained deterioration in the payments balance inorder to accommodate private consumption could not bepermitted.
The other Asian planned economies are currently in a better position to experiment with economic reforms. Moreover, some have been aiming either at a moderation ofgrowth, as in Mongolia, in view of the above-normal 1985performance, or at very robust growth, as in Viet Nam, as away of encouraging better capacity utilization, which hadslackened earlier in the decade because of severe externalpayments difficulties. The Viet Nam plan aimed at 7.5 percent growth for aggregate output, 8.8 per cent in industryand 8.9 per cent in agriculture. .

Table 11.13. Centrally planned economies: selectedmacro··economic indicators, 1981-1987
1981- 1986- 19861985 1990 1984 1985 ------ 1987
Actual Planned Actual Actual Planned Actuala Planned
Total outputEastern Europe 2.2 4.0b 5.3 3.7 5.1 4.7 4.7Soviet Union 3.6 4.2b 2.9b 3.5 3.8e 4.1 3.9China 9.4 6.7 12.0 12.3 7.0 7.0b 7.0
Industrial outputEastern Europe 2.8 4.4b 4.8 4.1 4.4 4.7 4.1
Soviet Union 3.7 4.6 4.1 3.9 4.3 4.9 3.8China 12.0 7.5 16.3 21.4 8.8 10.0b
AgricultureEastern Europe l.ld 2.7b d 6.9 -1.3 3.0 5.1 b 3.2Soviet Union l.ld 2.7 d -0.1 0.1 4.4 5.1 2.4China 8.1 4.0 12.3 3.0 3.0 4.0b
InvestmentEastern Europe -1.3d 3.4b d 2.2 4.0 4.0 2.6b 4.8Soviet Union 3.7d 4.3d 1.9 3.0 7.6 8.0e 5.0Chinaf 18.4 1O.0b 33.9 35.0 15.0
Source: Department of International Economic and Social Affairs of the United Nations Secretariat,based on national and international sources.
a Preliminary.b Secretariat estimate.c NMPused.d Growth over the five-year period relative to the preceding five years on an annual basis.e State sector only.f Current prices.
Overall output targets for 1986 in the European plannedeconomies ranged between 2.3 and 4.4 per cent, except forRomania, where planners had set growth at 10 to 12 percent. This meant a slight acceleration on average over levelsattained in 1984-1985. In China, aggregate output was set at7 per cent, which was about half the pace registered in 1985(table II. 13). China's growth targets for 1986 were set withinthe context of the continuing need to seek moderation, adjustment, the elimination of flaws in the system of economicmanagement, greater harmony in sectoral growth performances, and other aspects of the ongoing changes in organization, management and economic structures. A sharpdownturn in aggregate, industrial and agricultural growth incomparison with the feverish expansion of 1983-1985 was,therefore, anticipated.
In the other Asian centrally planned economies, mattersare less transparent. Policies announced by Viet Nam in late1985 and early 1986 stressed as a priority the developmentof agriculture and the better utilization of capacity in part tosupport vigorous growth of consumer and export goods.Elsewhere among the Asian planned economies, fairly cautious policies appear to have been at the root of the plans,details ofwhich were only partially available in official publications.
The aggregate output targets for the majority of the European countries were expected to be within reach by holdingindustrial output expansion to within the moderate range of 2
48
to 4.5 per cent-on average only a slight acceleration overgrowth in 1984-1985. Once again, Romania was the exception as it had slated industrial growth at more than 9 per cent.China was also an exception: in its efforts to cool down theswift growth of 1984-1985, it was aiming at compressingindustrial growth from over 21 per cent in 1985 to about 9per cent in 1986.
In agriculture, a diversity of objectives prevailed. TheSouth-Eastern European countries and the USSR were hoping for a substantial recovery after the rather sluggish performance of 1985. The Central European countries, on theother hand, were anticipating little to moderate growth overthe excellent crop gains obtained in 1985. Chinese authorities aimed at improving grain harvests and at moderatingproduction of some other crops (e.g., cotton) in view ofweak commodity prices.
Perhaps the single most important feature of some of theplans of the European countries was the stance on capitalformation. This was particularly pronounced for the USSR,which planned a sharp acceleration in investment activity(7.6 per cent), and, to a lesser extent, for the Eastern European countries, particularly Romania, whose room for manoeuvre in recent years has been constrained. Chineseauthorities, once again, had been hoping to bring investmentactivity under better control, through, for example, the central policy measures already put in place in mid-1985.

Constraints versus goals and the performance in 1986
Several unanticipated developments or, at any rate, eventsthat could not have been fully reflected in the plans haveinterfered with the smooth implementation of the planners'intentions in 1986, especially in the case of the Europeanmembers of the group: the sharp decline of energy prices,weather variability, sluggish progress with economic reforms and country-specific problems with sustaining industrial growth.
Perhaps most serious has been the fall of energy prices,particularly for oil. But coal prices too, have declined,which has affected convertible currency revenues especiallyin the case of Poland. Although each of the planned economies, other than China and the USSR, in the aggregate is anet importer of liquid fuels, each has derived substantialconvertible currency revenues from the sale of petroleumproducts to the market economies for about a decade. At thesame time, the pulk of the crude oil imports of these countries continues to be procured from the USSR under thetransferable rouble pricing regime. Romania is the only major exception to this generalization.
As a result of the slide in world oil prices, convertiblecurrency revenues of the net fuel exporters (mainly Chinaand the USSR) have been adversely affected, although therehad been sizeable increases in export quantum of crude oiland oil products from the USSR. Most of the net fuel importers, however, have not been able to offset price losses byincreasing volume for lack of availability. Moreover, thesecountries have not yet fully benefited from the downturn inworld oil prices because the transferable rouble prices for1986 were in principle based on the average of 1981-1985world prices of oil and average annual exchange rates for thesame period, most years of which were characterized byhigh prices and high dollar exchange rates. At prevailingofficial exchange rates, transferable rouble oil prices(roughly $26 to $28 per barrel) remained well above theaverage world price (about $13.5 per barrel), even if allowance is made for the apparent overvaluation of the transferable rouble.
Regarding procurements from convertible currency countries, chiefly the fuel exporters in the Middle East and NorthAfrica, most Eastern European countries obtain their crudeoil through contractual arrangements. In some cases, theseare heavily weighted in favour of long-term barter arrangements, so that the fuel importers in Eastern Europe were notable to take full advantage of the sharp decline in world oilprices on the import side, although the exports to marketeconomies bore the full impact of the price slide.
The second important development was weather patternsand their effects, particularly on agriculture and primaryelectricity generation. With the exception of the GermanDemocratic Republic and Poland, grain and several othersummer crops in most of Eastern Europe and the USSR ear-
37 These systemic changes are discussed in detail in chapter VI below.
49
lier in the year appeared to suffer from prolonged droughtand heat. This led to some cautious trade positions. However, rather favourable conditions in the latter part of theyear helped to raise grain crops to well over the levels anticipated in mid-summer. This was especially true in the USSR,and in several other countries as well, so that the year as awhole was decisively good for agricultural products in general.
Whereas the adverse crop output situation was reversed asthe crop season drew to a close, the weather conditions hadserious consequences for other sectors in a number of countries of the group. Because of the severity and duration of thedrought, electricity generation suffered considerably asplanned hydropower could not be assured, owing to low water levels. Moreover, in the USSR, the drought in some partsof Central Asia affected water levels for hydropower generation. This was aggravated by the idling of the Chernobylreactors. Together, these factors resulted in some drain onprimary electricity generation. In addition, the comparatively poor crop expectations during most of the first half ofthe year in some of the Eastern European countries and theban on imports of food from Eastern Europe imposed by theEuropean Economic Community after the Chernobyl accident adversely affected their trade in agricultural products inthe short run. Agricultural growth in China, Mongolia andViet Nam appears to have proceeded quite satisfactorily.
Thirdly, it should be borne in mind that these countries areundergoing a period of serious assessment of the economicpolicies, policy instruments and supporting economic institutions that were enunciated at the Party Congresses of1985-1986. This uneasy and at times arduous reform of thetraditional economic mechanisms in many of these countriesand the implications for the scope and range ofeconomic cooperation, especially within the context of CMEA, continued to counsel caution sometimes excessive in the pursuit ofshort-term socio-economic objectives, without losing trackof medium-term and long-term goals.'?
Finally, the recovery in industrial output recorded by theEuropean countries in the second half of 1985, after the veryweak performance in the first half of the year,could not besustained throughout 1986 in some of the countries of theEuropean group because of the tightening foreign exchangeconstraint. In spite of the generally more favourable sentiment in world financial markets towards lending to the centrally planned economies and, on balance, some gain inreducing oil import costs from convertible currency countries, the pace of activity, especially in Romania, had to bereduced at times for want of industrial inputs.
Details regarding 1986 performances at this stage remainsketchy for some of the Asian centrally planned economies.The preliminary output figures for Eastern Europe indicateoverall growth ofabout 4.7 per cent. Although this growth isbelow plan expectations, it surpassed the level attained in1985 by a full percentage point (see table 11.13). There was

also a robust, if smaller, improvement for the USSR, from3.5 per cent in 1985 to 4.1 per cent in 1986.38 China's aggregate output growth of about 7 per cent was roughly on plantarget. Mongolia is likely to surpass its 4.5 per cent growthtarget. 39 Growth in Viet Nam remained well below targets at4.3 per cent (5.6 per cent in industry and 1.4 per cent inagriculture) and a number of constraints developed, for example in runaway investment activity, output quality, energyand other key industrial products. In addition, the Democratic People's Republic of Korea continues to encounter severe input supply problems for crucial products, oil inparticular, because of foreign exchange constraints and below-plan domestic output growth.
Industrial growth in most Eastern European countries exceeded the pace observed in 1985 (see table 11.13). It wasbetter than planned in Czechoslovakia, the German Democratic Republic and Poland. In the USSR, it accelerated to4.9 per cent or 1 percentage point above the 1985 level.China's industrial output slowed down dramatically from 20per cent in the first half of 1985 to less than 5 per cent by themiddle of 1986; it then rebounded sharply. For the year as awhole, growth was about 10 per cent-well above plan expectations. One positive feature of this rather expansive policy is that the rate of growth in light industry surpassed thatof heavy industry by a significant margin. This is a favourable development both for the export supply of manufacturesand for improving balance in domestic consumer marketstwo priorities of the current medium-term plan, as discussedin chapter VI below.
Product output levels or reported achievements relative toplan rates for industrial branches or ministries suggest thatin most of the European countries of the group efforts toimprove considerably the quality and range of output of themachine-building sector, especially electronics, automationand computer equipment, have been bearing fruit. In thecase of the Soviet Union, growth in construction materials,metallurgy, including steel, and machine-building exceededthe pace for industry as a whole, but no dramatic achievement in changing the structure of industrial output in favourof high technology was registered. Production of primaryand intermediate industrial products in China grew at asteady pace that was well above overall industrial growth,thereby improving market balance.
For agriculture as a whole, 1986 was a fairly good year inspite of poor grain harvests in some countries. In Eastern
Europe, overall growth in the sector may have exceeded 5per cent well above the 3 per cent planned rate of expansion(see table 11.13). But, as already noted, agricultural growthin 1986 was mixed, with record or near-record crops in thenorthern tier of Eastern Europe but another year of relatively poor and definitely below-plan crop growth in someCentral European countries. The European group's total cereal output was about 310 million tons, which representsgrowth of about 5 per cent for Eastern Europe and about 10per cent for the USSR. The latter's grain crop reached 210million tons or roughly 20 million tons more than the preceding year. China's crops developed satisfactorily too, asthe overall rate of growth of agricultural output exceededboth the plan and 1985 achievement.
The largest deviations from plans appear to have emergedfor investment activity and foreign trade balances. Capitalexpenditures have been a critical determinant of the buoyancy of growth in virtually all European centrally plannedeconomies. All except Hungary, Poland and Romania accelerated the pace of investment activity in 1985; but only someopted to replicate this effort in 1986. Only Bulgaria, Romania and the USSR aimed at a major boost in 1986. As itturned out, investments exceeded plans in Czechoslovakia,the German Democratic Republic and Hungary. Elsewherethe pace was modest at best.
Especially disappointing in countries, including theUSSR, that had counted on a major breakthrough in modernization through the acceleration in investment activity,was the sharp increase in the volume of projects-in-progress, quite contrary to planners' intentions. Progress withrestructuring the investment process and cutting gestationperiods has been much more modest than policy makers hadhoped for. In some Eastern European countries, especiallyPoland, the priority of foreign trade constraints was suchthat no more than a modest expansion in domestic demandcould be accommodated and this was on the whole reservedfor personal consumption.
Although the economic performance of China is deemedto be better balanced and progressing at a more normal pacein 1986 than in the preceding three years, investment expansion continued at a very high rate (in current prices, 15 percent in the state sector and probably by as ml)ch in the industrial activities of the rural sector; this may translate intoabout 7 to 8 per cent in constant prices). This is still wellabove the planners' intentions, and authorities are aiming atreducing it further in the years ahead.
38 The macro-economic data of the USSR for 1985-1986 seem to be in some cases statistically inconsistent. For instance, the data released in thestatistical yearbook for 1985 are not internally consistent and are apparently based on revisions of data released in earlier editions of the yearbookor in the data reported by the CMEA secretariat. The same problems of comparability pertain to some of the preliminary data for 1986. Onemajor reason may be a revision in methodology in computing aggregate output and use levels when there is a very sharp decline in the productionand consumption of one important product category (alcoholic beverages in the case of consumer goods). Other modifications appear to havebeen introduced in some of the accounts but not in others.
39 Details on other Asian centrally planned economies (the Democratic People's Republic of Korea and Viet Nam) are too preliminary to permit anyreliable estimate to be made.
50

Chapter III
INTERNATIONAL TRADE
International trade patterns in 1986 were shaken by asharp fall in oil prices, and continued to be affected by sudden changes in currency values and by the contraction ofmany debtor countries. This made for a significant redistribution of trade and for continued slow growth.
Prices of non-fuel primary commodities increased byabout 5 per cent, and oil prices declined by about 45 per centin dollar terms in the international markets, while the dollarprices of manufactures increased by 20 per cent. Thischange in relative prices of primary commodities producedan unprecedented movement in terms oftrade.
The fall in oil prices and the resulting reduction in oil output in high-cost producers were a major factor behind themild upturn in the growth of world trade in 1986: the volumeof oil trade expanded by about 10 per cent. However, loweroil prices were devastating for many energy exporters, especially the heavily indebted ones.
World trade as a whole grew slowly, by about 3.5 per cent,but country experiences were extremely diverse. While thevolume of imports of the developed market economies increased by about 8 per cent, imports of energy-exportingdeveloping countries declined by about 20 per cent. Imports
of Japan and the United States of America increased sharply.Imports of China declined by about 20 per cent, while thoseof other centrally planned economies declined marginally.
The stresses and imbalances in the international·economydiscussed elsewhere in this Survey had a profound impact onthe growth of world trade and on the flow of trade betweencountries. The heavily indebted developing countries arestill impelled to expand their exports to service their debtand to restrict the growth of their imports as part of theiradjustment efforts.
A favourable trade environment remains critical for thegrowth of the world economy and the smooth unravelling ofsome of its present imbalances. But the multilateral tradingsystem itself is under serious stress, and the many nationaland international proclamations of intention to strengthenthe system have not produced any significant result. Tradetensions increased during the year and there was no evidenceof rollback of protectionism. By early 1987, new restrictiveactions raised fears of a full-fledged trade war among someof the industrial countries. The recent international initiatives launching a new round of trade negotiations do, however, hold out some hope for improvement.
Growth ·of world trade
World exports in 1986 are estimated to have been about$2.15 trillion, not much more than the $2 trillion in 1980.Between 1980 and 1986, world trade in real terms probably
. increased by about 17 per cent (see table III.l). But, in aperiod of rapid changes in exchange rates, figures in realterms are only rough approximations, as it is difficult tomeasure with any precision what the changes in real flowsreally were.
Present indications are that growth in 1987 will be no better than 3 per cent, if the surge in the volume oftrade in oil,which accounted for much of the increase in the total volumeof world trade last year, returns to more normal levels. Indeed, the rate of growth of world trade has been declining.World exports grew at a rate of2.5 per cent per year duringthe period 1981-1985, compared with 5 per cent during the1970s. The elasticity of world trade with respect to world
income has itself also declined. A 1 per cent increase inworld income during the 1960s was associated with a 1. 8 percent increase in trade (i.e., an elasticity of 1.8), but only witha 1.3 per cent increase in trade during the period 1980-1986.For 1986, the corresponding elasticity of about 1.2 per centwas the same as during the first half of the 1980s.Thus,trade remained a weaker engine of growth than in the past.
Moreover, a large part (about 2 percentage points) of thegrowth in the volume of trade in 1986 was accounted forby asignificant but probably transitory increase in the export ofoil. A good portion of the growth of world trade in 1986 wasthus the result of a change in relative prices rather than thereflection of an expanding world economy. Excluding oil,the growth of world trade in 1986 was less than 2 per cent,which was below the rate of growth of world income.
Table III. I. World trade: 1980-1986
1980 1982 1984 1985 1986
Total exports (billion dollars)Total volume (1980= 100)
2 002 I 848 I 907 I 933 2 146100 98 110 113 117
Source: Department ofInternational Economic and Social Affairs of the United NationsSecretariat, based on Monthly Bulletin ofStatistics, June 1986, and GATT, International Trade1985-86. Figures for 1986 are preliminary estimates of the Department ofInternationalEconomic and Social Affairs.
51

The persistent weakness of world trade raises major questions of trade and development policy, in particular, whethercountries should seek a greater degree of stimulant from thedomestic economy than in the past. The question is not new.
It has been asked especially in the context of "dependency"in international economic rerationships, but the present slowgrowth of world trade has given the question addedrelevance.
The trading system
The working of the multilateral trading system continuesto be a cause for serious anxiety. I
Proclamations of commitments to the strengthening of theopen multilateral trading system were often followed by national actions which have tended to undermine the system.Some of these actions were taken for the purpose ofensuringwhat has been termed as "fair" trade, while in other casesnational-political or regional considerations have played anoverriding role. Tension among trading partners rosesharply.
By the end of 1986, about 90 bilateral export restraint arrangements were reported by GATT, a large number ofwhich were negotiated or renegotiated during the year.These were additional to bilateral agreements under theMultifibre Arrangement. Most of these were voluntary export restraints, involving the use of export quotas, but in afew cases unilateral quotas were also imposed.
The largest number of these export restraint arrangementspertain to trade in steel and steel products, followed by agricultural commodities, transport equipment, electronic products and textiles. The majority of such arrangements wereamong developed market economies but almost a quarter ofthem concerned exports from developing countries. A notable aspect of the developments in this area is that "voluntary" restraints, which used to be associated with traditionalindustries and agriculture, are now spreading to high-technology sectors, as in recent bilateral arrangements on tradein semiconductors.
High tension was manifested in the strong reaction in theUnited States to changes in Spain and Portugal's import policy on maize and sorghum, consequent to their entry intoEEC. This exacerbated the conflict between the UnitedStates and EEC on agricultural policy. An agreement was,however, worked out in this area early in 1987 and the situation was diffused. Also in1986, while talks were being heldfor an agreement on free trade between the United States andCanada, the two countries imposed large countervailing duties on each others' imports of lumber and corn, moveswhich have been termed, in some quarters, as a prelude totrade war. During 1986, threats of a trade war between Japanand the United States, whose imports have been growingfast in recent years, were averted by a series of arrangements between the two countries, some restraining exportsor raising prices of exports from the former, some of thelatest being semiconductors, textiles and machine tools,while others were aimed at increasing the access of UnitedStates exports (e.g., semiconductors, autoparts and aluminium) to the Japanese markets. Some broad understandingbetween the two countries on co-ordination of macro-eco-
nomic policies was also worked out, which might have contributed to the easing of tension towards the end of the year,though the effectiveness of such policy co-ordination wasbeing viewed with scepticism almost as soon as it was announced.
In March 1987, the United States announced a decision toimpose a 100 per cent tax on imports of a variety of electronic products in retaliation against what the administrationconsidered a breach, on the part of Japan, of an agreementon semiconductors concluded between the two countries inthe summer of 1986. The agreement included improved access for United States manufacturers of semiconductors toJapanese markets and for monitoring of costs and prices ofsemiconductor exports from Japan both to the United Statesand to third country markets and was widely considered asignificant step in the increasing bilateralism and "management" of international trade in recent years. This latest controversy between the two countries is additional evidence ofthe hazards of managed trade and the weakness of thepresent multilateral trading system.
A major development in 1986 was the extension of theMultifibre Arrangement by another five years, effectivefrom August 1986. The Arrangement - formally, the Arrangement Regarding International Trade in Textiles - wasfirst negotiated in 1973 and was intended to be a temporarymeasure for an orderly expansion of the trade in textiles. Itnow covers nearly half ofthe total world trade in textiles andclothing. It is one of the major arrangements in internationaltrade which has remained outside normal GATT rules. Itsprincipal beneficiaries tend to be established textile producers in countries with already large textile exports; thelosers are the newcomers, particularly those from the developing countries. The Protocol extending the Arrangementdeclares, however, that the ultimate objective of the participants is the application of normal GATT rules to trade intextiles. It also reiterates that the principal aim of the Arrangement is to secure a substantial increase in the exports oftextiles from the developing countries. The actual application of the Arrangement, which is usually effected throughbilateral agreements between exporters and importers, has,however, become increasingly restrictive over the life of theArrangement.
On the positive side, the most significant step taken duringthe year was the agreement reached at the special GATTsession at Punta del Este, Uruguay, to launch a new round ofmultilateral trade negotiations. In a two-part MinisterialDeclaration on trade in goods and trade in services, issued atthe conclusion of the session, the participants agreed thatthemain objectives of the negotiations were further liberalIzation of world trade and the strengthening of the multilateraltrading system and the role of GATT. It was also agreed, as
I The World Economic Survey 1986 (United Nations publication, Sales No. E.86.II.C.l) dealt at some length with the systemic issues and problemsof international trade.
52

one of the general principles governing the negotiations, thatthe principle of differential and more favourable treatmentfor the developing countries, as embodied in Part IV of theGeneral Agreement and as decided in the Tokyo Round,would continue to apply to the forthcoming negotiations. Amajor aspect of the agreement was the commitment made bythe participants that they would not take any trade restrictivemeasures which were inconsistent with GATT provisionsand instruments and would phase out all such existing measures (the standstill and rollback commitments). The agreement envisaged that the multilateral trade negotiationswould be completed within four years.
The Ministerial Declaration also contained a separateagreement on trade in services. The main objective of negotiations in this area was to establish a multilateral frameworkofprinciples and rules for trade in services for the purpose ofexpansion of such trade and as a means of promoting economic growth. Reflecting the reservation ofmany countries,especially developing countries, in this field, it was furtheragreed that the framework to be established would respectnational policy objectives and laws relating to services, andtake into account the work of relevant international organizations.
A major step in the Uruguay Round was taken in January1987 when the GATT Group of Negotiations on Goods, established under the Ministerial Declaration, agreed on a negotiating structure and plans for negotiations on trade ingoods. The Trade Negotiations Committee, set up to oversee the conduct of the Uruguay Round, arrived at an agreement on the mechanism for surveillance of the standstill androllback commitments made in the Ministerial Declaration.At the same time, the Group of Negotiations on Servicesadopted a programme for the initial phase of negotiations onservices.
The factors that have contributed to the weakening of themultilateral trading system - mercantilist sentiments andshort-term national and sectoral interests - as well as thequestion of inequality of bargaining strength and the differences in the stages of development of the participants, willalso come into play in the negotiating process. The task willrequire an equal measure of farsightedness and goodwill if itis to lead to a greater correspondence between proclamations of commitment to freer trade and actual trade policiesthan has been observed in recent years.
The recognition of interrelationships between the tradingsystem and the monetary and financial system remains critical for the srnooth functioning ofboth. Several hard-presseddebtor countries have continued to cut imports in order togenerate a trade surplus and service unusually large interestpayments on their debts. And, although the United Statesdollar has fallen by more than 40 per cent against the Japanese yen and the deutsche mark since the September 1985meeting of the Group of Five, this has not, so far, correctedthe huge deficit in the trade of the United States with its
. major trading partners, which has been the main source oftrade tension among these countries.
The value of the dollar rose continually for almost fiveyears and in 1985 _was almost 50 per cent higher than in1980. This prolonged period of rising exchange value islikely to have affected consumption patterns in favour ofimported goods and, at the same time, eroded productivecapacity in major lines ofexport and import-competing production through a persistent loss of competitiveness. Thesechanges may not be easily reversible. From this point ofview, some of the trade imbalances between the major developed countries appear to have been the result of the benign neglect of the exchange rate.
Recent developments in trade flows by country groups
Changing sources of growth of imports and exports
The volume of imports of the developed market economies in 1986 provided the main stimulus to the growth ofworld trade. Imports into these economies, which increasedby about 5.6 per cent in 1985, after a peak of 11 per cent in1984, are estimated to have grown by 8 per cent in 1986. Theincrease was especially large in the United States and Japan,but imports of the Federal Republic ofGermany, France andthe United Kingdom also increased substantially. Thegrowth of import demand in the United States, which significantly contributed to the recovery of world trade in. 1984,fell sharply in 1985 but is estirnated to have been about 11per cent in 1986. Japan's imports did n9t grow at all in 1985but rose by an estimated 13 percent in 1986. IrnportsoftheFederal Republic of Germany increased by about 6.5 percent, compared',Vitha4 percent groWth in 1985. The rate ofgrowth of imports into France was 9 per cent, up from a 4per cent growth in 1985. For the smaller developed marketeconomies, imports increased at about 5 per cent.
A significant part of this increase in import demand in thedeveloped market economies consisted of oil imports. Preliminary estimates suggest that the import of oil by these
53
countries rose by about 10 per cent in 1986, after an actualdecline in 1985. Since imports of oil account for about 20per cent of their total imports, this raised the total volume ofimports of these countries by at least 2 per cent.
Exports of the developed market economies grew onlymarginally, by 2 per cent during the year. This partly reflectsJapan's efforts at slowing down the rapid increase in its exports to the United States, and stagnant United States exports. Japan's exports declined, for the first time in the1980s, by about 0.5 per cent, and United States exports remained virtually stagnant in 1986. There was, however, anotable increase in trade between Japan and the Europeandeveloped market economies. Europe's exports to Japanrose sharply during the year by almost 40 per cent indollarterms. The flow of exports from Japan to Europe increasedalmost as fast.
A significant factor·in the slow growth of total exports ofthe developed market economies was the decline in theirexports to the developing countries. These exports probablydeclined by as much as 6 percent in 1986, as developingcountries faced a considerable decline in their capacity toimport because of falling export revenues.
Imports of the developing countries as a group fell by

about 7 per cent in 1986 after a 5 per cent fall in 1985. Much prices of oil. Imports of this group of countries had alreadyof this was due to a sharp decline in imports of the oil-ex- declined significantly in 1985. Since developing countriesporting developing countries, directly related to the falling account for about 20 per cent of exports from the developed
Table III.2. World trade: annual rates ofchange in volume and price, 1976-1987"(percentage)
1976- 1981- 19871980 1986 1984 1985 1986 (forecast)
Volume ofexports
World 5.2 2.1 7.6 3.0 3.5 3.0Developed market economies 6.6 3.0 9.1 4.6 2.0 3.5Developing countries 2.1 -0.4 3.3 -0.5 7.7 2.0
Capital-surplus countries -1.6 -10.6 -9.3 -10.8 17.0Other net energy exporters 2.8 -1.0 3.5 -4.1 4.5Net energy importers 7.5 7.6 10.0 6.1 6.5
Centrally planned economiesb 5.7 4.1 5.5 -0.6 2.8 1.0
China 11.3 17.6 6.8 12.0 8.0
Volume of imports
World 5.5 2.8 9.0 3.5 3.9 3.0Developed market economies 5.6 4.1 11.1 5.5 8.0 4.5Developing countries 5.6 -0.6 0.8 -5.0 -7.2 0.0
Capital-surplus countries 11.4 -4.2 -10.6 -17.9 -21.0Other net energy exporters 6.1 -4.1 -0.7 -6.2 -21.0Net energy importers 3.9 1.8 6.0 -0.2 2.0
Centrally planned economiesb 4.8 2.3 5.0 5.0 -1.6 2.0
China 11.9 29.2 50.3 -21.0 6.0
Unit value of exports
World 12.2 -1.3 -2.2 -1.8 6.6 10.6Developed market economies 9.8 -0.1 -2.8 -1.0 15.5 12.0Developing countries 19.0 -5.6 0.4 -4.0 -18.3 9.0
Capital-surplus countries 23.5 -10.7 -2.3 -2.0 -45.3Other net energy exporters 21.0 -7.5 0.3 -3.4 -32.1Net energy importers 11.2 -3.1 2.8 -4.6 1.0
Centrally planned economiesb 8.7 0.2 -3.7 -1.3 7.1 2.0
China -4.8 0.1 -2.1 -10.0 0.0
Unit value of imports
World 11.7 -1.7 -2.7 -2.0 6.9 9.8Developed market economies 12.1 -2.1 -2.8 -2.0 6.1 10.0Developing countries 12.5 -1.1 -1.9 -1.7 7.8 16.3
Capital-surplus countries 10.8 0.0 -1.9 -1.4 16.1Other net energy exporters 11.1 -0.7 -2.1 -1.6 11.9Net energy importers 13.4 -1.4 -1.9 -1.9 4.6
Centrally planned economiesb 6.8 0.8 -3.6 -1.5 13.6 0.0
China -3.9 -0.8 2.6 9.2
Terms oftrade
Developed market economies -2.1 2.0 -0.1 1.0 9.0 0.5Developing countries 5.8 -4.6 2.3 -2.4 -24.6 -6.3
Capital-surplus countries 11.5 -10.7 -0.3 -0.6 -52.9Other net energy exporters 8.8 -6.8 2.5 -1.8 -39.3Net energy importers -2.0 -1.7 4.8 -2.7 -3.5
Centrally planned economiesb 1.7 ~0.6 -0.1 0.2 -5.8 1.0
China -0.3 0.9 -4.6 -17.6 0.0
Source: Department oflnternational Economic and Social Affairs of the United NationsSecretariat, based on IMF, International Financial Statistics, and calculations and forecast madeby the Secretariat.
a Rates of change in unit values are based on indices expressed in dollars.b Eastern European centrally planned economies and USSR.
54

market economies, this decline in their import demand madefor a drop of some 1.5 per cent to those exports.
Imports of the energy-importing developing countries increased by about 2 per cent in 1986 following a slight declinein 1985. The growth of imports of Latin American countrieswas uneven, with a large increase in Brazil and Peru. African imports declined by about 10 per cent, largely becauseof declining foreign exchange earnings of the energy exporters. Imports of the energy exporters of the South andEast Asian region declined, while those of the energy importers increased by over 6 per cent.
The volume of exports from the developing countries, onthe other hand, increased by about 8 per cent during the year,after a decline of about 1 per cent in 1985. A part of thisincrease was due to the substantial expansion of oil exports,but exports from the energy-importing developing countriesalso increased by about 6 per cent. Exports from LatinAmerica declined by about 2.5 per cent, owing to an 8 percent fall in Brazil's exports and a 14 per cent decline in Mexico's. There was a substantial increase in exports from Southand East Asia, notably from the energy exporters, whichincreased the volume of their exports by well above 5 percent.
A number of developing countries managed to increasetheir exports remarkably. The combined exports of the ninemajor exporters ofmanufactures2 to developed market economies increased, in dollar value, by about 13 per cent in1986. A notable feature was that while exports of these
- countries to Europe and Japan had been stagnant over muchof the 1980s, they increased fast in 1986. The value of theirexports to Japan and Europe increased by 8 per cent and 24per cent, respectively, and exports to the United States grewby some 8 per cent. This marked a significant diversion ofexports of these countries from the United States, which hasbeen absorbing an increasing share of this trade in recentyears, to other developed market economies.
The volume of imports of the European centrally plannedeconomies declined by 1.6 per cent during 1986. The volume of imports of Eastern Europe from developed marketeconomies increased, but there was a sharp cutback in theSoviet Union's imports, partly as a result of a good harvest.The volume of exports of these economies, on the otherhand, rose by about 3 per cent after a decline of 1 per centduring the previous year, partly as a result of an increase inoil exports. The growth of imports of China was drasticallycurtailed, from a rise of50 per cent in 1985 to a decline of20per cent in 1986; yet China's exports continued to increase ata rapid pace of 12 per cent.
Changes in balance of trade by country groups
A dominant feature of the balance of trade of the developed market economies in 1986 was the continuing largetrade deficit of the United States along with large surplusesof Japan and the Federal Republic of Germany.
Export earnin~s ofthe United States remained practicallyunchanged despIte the fall of the dollar, and its imports increased significantly, leading to a larger trade gap. The tradesU~luses of Japan. and the Federal Republic of GermanyregIstered a large mcrease, by about $37 billion and $27billion, respectively, and signs of reduction in these surpluses were not yet evident by early 1987. The trade surplusof Canada remained significant, particularly its surplus withthe United States.
The overall trade balance of the developed market economies turned from a deficit of $40 billion in 1985 to a surplusof about $3 billion in 1986, largely owing to the 45 per centfall in the price ofoil. The increase in the prices of manufactures, in dollar terms, relative to non-fuel primary commodities also contributed. The sharp reduction in the tradedeficit of these countries thus reflected a very large improvement in their terms of trade.
The decline in the price ofoil and the large adverse changein the terms of trade of developing countries worsened thetrade balances of the developing countries despite a substantial increase in their volume ofexports and a decline in theirvolume of imports. The balance of trade surplus of thisgroup shrank to $10 billion in 1986, a sharp decline from$53 billion in 1985.
The largest change took place in the capital surplus energy-exporting countries, whose balance of trade surplusdeclined from $34 billion to $8 billion, the lowest since1~70. Other energy exporters suffered a deterioration onlyshghtly less steep. There was a reduction in the energy-importing developing countries' trade deficit in 1986, reflecting continuing adjustments in some countries aimed atcompressing imports, as well as substantial expansion ofexports from some others. The trade deficits of these countriesdeclined from $58 billion to $15 billion between 1980 and1985 and shrank further to about $8 billion in 1986.
During the first half of the 1980s, the centrally plannedeconomies made significant adjustments in their externaltrade, including changes in the geographical direction andcomposition of their trade, aimed at generating convertiblecurrency surpluses. Recently, however, nearly all thesecountries were led to scale down their plans for convertiblecurrency surpluses to more modest levels or even to temporary deficits, owing in part to the slide in oil prices and to adrop in agricultural exports.
Two major factors determined developments in the tradeof the European centrally planned economies in 1986: thedrop in the dollar price of oil and the depreciation of thedollar against other major currencies. The price of oil, theSoviet Union's major export, declined by about a third. Theexport price of other commodities in convertible currencytrade increased by about 6 per cent, while import prices increased by about 13 per cent. The terms of trade of theseeconomies with developed market economies deterioratedas a result.
2 Argentina, Brazil, Hong Kong, India, Malaysia, Philippines, Republic of Korea, Singapore and Thailand.
55

The overall trade balances of the Eastern European economies deteriorated considerably during 1986. Their surplusdwindled from about $US5 billion in 1985 to a deficit of$US400 million in 1986. However, they still maintained asmall surplus with developed market economies. Their surplus with developing countries shrank to $US800 million.The Soviet Union, despite the deterioration in its terms oftrade, increased its overall trade surplus by some $US3.3billion over the surplus of 1985, by sharp cuts of imports,especially from non-socialist countries, and also a significant increase in the volume of exports. With its convertiblecurrency partners, however, the USSR had only a slight surplus.
China's trade deficit was reduced considerably from thehigh level of 1985, despite a sharp fall in terms of trade. Thevolume of imports was heavily cut, by 21 per cent in com~
parison to 1985, while the volume of exports rose by 12 percent.3
Exchange rate movements and trade balances
The changes in the values of major currencies during the1980s, and especially since September 1985, have beenlarge. The trade-weighted value of the United States dollarrose by 50 per cent in five years since 1980 reaching a peakin the first quarter of 1985 when it was 60 per cent above thebase year value. By the end of 1986, it had fallen by 26 percent from its peak level. The changes in the bilateral ratesbetween the dollar and the major trading partners of theUnited States Were even greater. Thus, the yen and thedeutsche mark appreciated against the dollar by about 60 percent (or the dollar depreciated by 40 per cent) between thefirst quarter of 1985 and the end of 1986.
Tableill.3. Developed market economies: merchandise trade balance (f.o.b.),1980-1986
(Billions of United States dollars)
Country or country group 1980 1983 1984 1985" 1986b
All developed market economies -69.4 -22.7 -47.6 -39.5 2.2ExclUding United States -43.9 44.4 64.9 84.4 143.0
Major industrial countries -33.1 -12.4 -46.1 -40.0 -4.7
Canada 8.0 15.0 16.6 13.3 7.2France -13.4 -8.8 -4.6 -4.5 -2.7GerIlllU1Y, Federal Republic of 8.7 21.5 22.0 28.7 56.4Italy -16.4 -3.2 -6.0 -6.8 1.2Japan 2.1 31.5 44.3 56.0 92.6United Kingdom 3.4 -1.3 -5.9 -2.3 -11.7United States -25.5 -67.1 -112.5 -124.4 -147.7
Other countries -36.3 -10.3 -1.5 0.5 7.5
Surplus countriesc 0.5 8.6 10.1 10.0 7.5Others -35.8 -18.9 -11.6 -9.5 0.0
Source: Department of International Economic and Social Affairs of the United NationsSecretariat, based on IMF,/nternmional Financial Statistics, and Project LINK.
a Estimate.b Preliminary estimates.c Netherlands and Norway.
Thble III.4. Trade balances ofdeveloping countries, 1980-1986(Billions of dollars)
1980 1984 1985
All developing countries 111 51 53Energy- exporting countries 169 67 68
Capital surplus countries 136 31 34Other energy exporters 33 36 34
Net energy importers -58 -16 -15
1986
10188
10-8
Source: IMF, Balance ofPayments Statistics, 1986 Yearbook, and other national andinternational sources.
, For detailed trade balances by countries and regions for the period 1981-1985, see chapter VI.
56

Changes in exchange rates are expected and intended toproduce changes in the value and volume of imports andexports. However, in the first place, it takes time for exchange rate changes to take effect. A deficit country whichdoes not by itself set world prices will at first find that depreciation of its currency will raise both import and exportprices in domestic currency in the same proportion, butsince imports exceed exports, this will at first worsen thetrade balance. It is only when these price changes take effectthat the expected changes occur:when exporters take advantage of the opportunity to cut their prices in world marketsand export more, and when domestic buyers respond to theincrease in prices for imported goods by switching to domestic products. This produces the so-called "J" curve.
But that is only part of the overall picture. A trade deficitthat is due to a persistent tendency to spend more than acountry produces cannot be corrected by exchange rates adjustments alone, particularly when the savings gap is largein comparison tb GNP or total exports. There have to beaccompanying changes in the so-called fundamentals of the
situation. In the case of deficit countries, fiscal restraint isusually called for; surplus countries need to accompany theappreciation of their currency by a certain amount of fiscalstimulus to make it effective.
This is why present imbalances in the trade and currentaccount situation cannot be resolved without the harmonization of the macro-economic policies of the major economiesin the world system, discussed in chapter II.
lt should also be noted that, in the present internationalmonetary system, it is not self-evident how the changingvalues of currencies should be described and what effectsone should expect from them. Much attention is given to thebilateral exchange rates between the major actors - theUnited States, Japan and the Federal Republic of Germany.But other countries have chosen different approaches intheir exchange rate policies. Some have chosen to follow akey currency of special importance to them, others seek tostabilize the value of a basket of currencies, in which theweights given to other countries express their general tradeconcerns.
Table III. 5. Trade balances of centrally planned economies, 1984-1986(Billions of dollars)
1984 1985 1986
Total 16.7 -5.9 -2.2Eastern Europe 6.9 5.0 -0.4USSR 11.1 4.0 7.3China -1.3 -14.9 -9.0
Source: Department oflnternational Economic and Social Affairs of the United NationsSecretariat. based on official national and international sources.
Table 111.6. Change in the values of currencies of major countries, 1985-1986
Rate of change(Percentage)
Average
Indexes of value (1980= 100) of 1986
1986over 1986: IV
1985 average overCountry I II III IV Average I II III IV Average of 1985 1985:1
United States (E) 160 156 148 137 150 129 124 119 118 123 -18.0 -26.3Japan (E) 122 123 125 139 127 148 160 171 166 161 26.8 36.1
(A) 88 90 95 109 95 121 133 145 142 135 42.1 61.4Federal Republic of
103 104 108 110 106Germany (E) 93 95 97 100 96 10.4 18.3(A) 56 59 64 70 62 77 80 87 90 84 35.4 60.7
United Kingdom (E) 75 82 86 83 82 78 79 75 71 76 -7.3 -5.3(A) 48 54 59 62 56 62 65 64 61 63 12.5 27.1
France (E) 67 69 71 74 70 76 74 74 75 75 7.1 11.9(A) 42 45 49 54 47 59 59 62 64 61 29.8 52.4
Italy (E) 68 67 66 67 67 68 69 70 71 70 4.5 4.4(A) 42 43 45 49 45 54 56 60 61 58 28.9 45.2
Canada (E) 107 104 102 98 103 94 93 92 91 93 -9.7 -15.0(A) 86 85 86 85 86 83 85 84 84 84 -2.3 -2.3
Source: IMF, International Financial Statistics, January 1987.
E: Index of effective exchange rate, calculated by IMF using the Fund's Multilateral ExchangeRate Model (MERM).
A: Index of average rate in United States dollars per national currency.
57

Table Ill.6 shows some effective exchange rates. They illustrate the difference between bilateral rates and weightedones. The dollar had fallen by about 40 per cent against theyen between the first quarter of 1985 and the fourth quarterof 1986 (i.e. the yen had risen by about 60 per cent). But itsweighted average rate (weighted by the trade of the UnitedStates with 17 other industrial countries), shown in the tableas (E), had declined by only 26 per cent.4 The estimatedchange thus depends on the weights used.
The change is even smaller when the number of the trading partners included in the calculation is increased. A quar-
ter of industrial trade and about a third of total trade of theUnited States are with the developing countries. The currencies of some of the largest exporters among them actuallydepreciated against the dollar. Table ITI.7 shows the changesin the real exchange rates of majordeveloping country trading partners of the United States. The real exchange rate ofthese countries vis-ii-vis the dollar has continued to depreciate. All of these countries are actually running trade surpluses either to service a large debt or to replenish theirreserves. Indeed, a trade-weighted dollar, taking into account all relevant trading partners of the United States, depreciated by only about 14 per cent in 1986.5
Table III. 7. Real effective exchange rate of some major developing countries andterritories a
(1980-1982 = 100)
Change between1985 and 1986
1984 1985 1986 (Percentage)
Argentina 80 71 61 -14.1Brazil 86 85 74 -12.9Mexico 92 91 65 -28.6Republic of Korea 96 89 74 -16.9Hong Kong 100 104 94 -9.6Singapore 102 96 80 -16.7Taiwan, Province of China 97 95 88 -7.4
Average -15.2
Source: Morgan Guaranty Trust Company, World Financial Markets, December 1986.
a The largest exporters to the United States.
The changing commodity structure of international trade
The current problems of international trade partly reflectlong-term structural changes in the world economy. Thesechanges result from shifts that have been taking place in the
structure of production and demand and thus have major implications for trade and development policies at both the national and international levels.
Table Ill.8. Commodity composition of international trade
Annual rates
Share in totalof growth in
export volumemerchandise exports (Percentage)
(Percentage}a 1960- 1970- 1980-1960 1970 1980 1985 1970 1980 1985
Agricultural products 32 21 15 14 3.9 3.5 1.2Minerals (including fuels) 17 • 17 29 23 7.2 1.7 -3.7Manufacturing 51 62 56 63 10.5 7.1 4.8
Total 100 100 100 100 8.6 5.0 2.6
Source: Based on GATT, International Trade 1985-86, (Geneva, 1986).
a Derived from current dollar values.
4 These changes are in nominal terms. For the purpose of examination of the impact of exchange rate changes on trade, the changes should ideallybe measured in real terms, i.e. adjusted for the relative movements of rates of inflation in the trading countries. Since, however, the United Statesrate of inflation was not very different from the average rate for the other major economies, the real effective exchange rate of the United Statesshould be close to the nominal.
, Morgan Guaranty Trust Company of New York, World Financial Markets, February/March 1987.
58

As table III.8 shows, the share of agricultural commodities in world trade has been halved since 1960, while that ofmanufactures has increased by one quarter. The increase inthe proportion of trade in minerals is entirely due to the increase in oil prices during the 1970s, which also accounts forthe fall in the share of manufactures between 1970 and 1980.The changing roles of the three groups of products are morevividly seen in the rates of growth of exports (real terms).The rate of growth of world trade in agricultural productsdeclined by two thirds, while exports of minerals actuallyfell in absolute terms and trade in manufactures rose almosttwice as fast as world trade as a whole.
Trade in manufactures
Manufactures account for over 60 per cent of world merchandise trade. Since the long-term shift in the structure ofproduction is away from primary production to manufactures, the growth of trade is becoming increasingly a matterof the growth of trade in manufactures. The shift from primary products to manufactures is very marked in exports ofdeveloping countries. The share of manufactures in their total exports increased from about 18 per cent in 1980 to 33 percent in 1984 and 40 per cent in 1986.
Since the 1960s trade in manufactures has expanded muchfaster than trade in agricultural products and minerals, butthe rate of growth has dropped in recent years. During theperiod 1981-1985, exports of manufactures grew at 4.8 percent, compared with 7 per cent during the 1970s and over 10
per cent in the 1960s. Preliminary indications suggest thatthey increased only about 3 per cent in 1986.
One reason for the deceleration in the growth of trade inmanufactures in recent years is that the growth of worldmanufacturing production slowed down during the 1970sand decelerated further in the first half ofthe 1980s, as tableIII.9 shows. The decline occurred in all three countrygroups but was much the sharpest in developed market economies.
The shifts in the sources of growth of manufactured exports have also been significant. Developing countries account for the bulk of the increase in manufactured exportsduring the period 1980-1985, as seen in the relative rates ofgrowth (table III.I0). Their exports of manufactures, afterincreasing at an annual rate of 24 per cent during the period1970-1980, grew by 6 per cent during 1980-1985. As aresult, developing countries increased their share of theworld exports ofmanufactures from about 7 per cent in 1970to 10 per cent in 1980, and to about 12 per cent in 1985. Theshare of the developed market economies declined from 85per cent in 1970 to about 80 per cent in 1985. The centrallyplanned economies maintained their share at about 8 percent.
Most of the increase in exports of manufactures from thedeveloping countries has been directed towards developedmarket economies, not only because these economies account for about two thirds of developing country exports,but also because in recent years, exports to developed market economies have grown at a substantially higher rate than
Table III.9. Growth of manufacturing production(Annual rate)
Developed Centrallymarket Developing planned
World economies countries economies
1963-1970 7.1 6.1 6.8 8.11971-1980 4.2 3.1 6.9 6.91980-1985 2.5 1.7 4.7 3.8
Source: Department ofInternational Economic and Social Affairs ofthe United NationsSecretariat, Yearbook ofIndustrial Statistics, 1975 (United Nations publication, Sales No.E.77.XVII.8), Industrial Statistics Yearbook, 1983 (United Nations publication, Sales No.EF. 85 .XVII.ll) and Monthly Bulletin ofStatistics, February 1987.
Table III. 10. Growth of exports of manufactures by country groups·(Annual rates)
Developed market economiesDeveloping countriesCentrally planned economies
1965-1970
13.417.88.2
1970-1980
18.723.716.4
1980-1985
0.46.01.1
Source: Department ofInternational Economic and Social Affairs of the United NationsSecretariat, Yearbook ofInternational Trade Statistics, 1982 (United Nations publication, SalesNo. EF.84.XVII.6), and Monthly Bulletin ofStatistics, May 1987.
a Growth of export values atcurrent dollar prices.
59
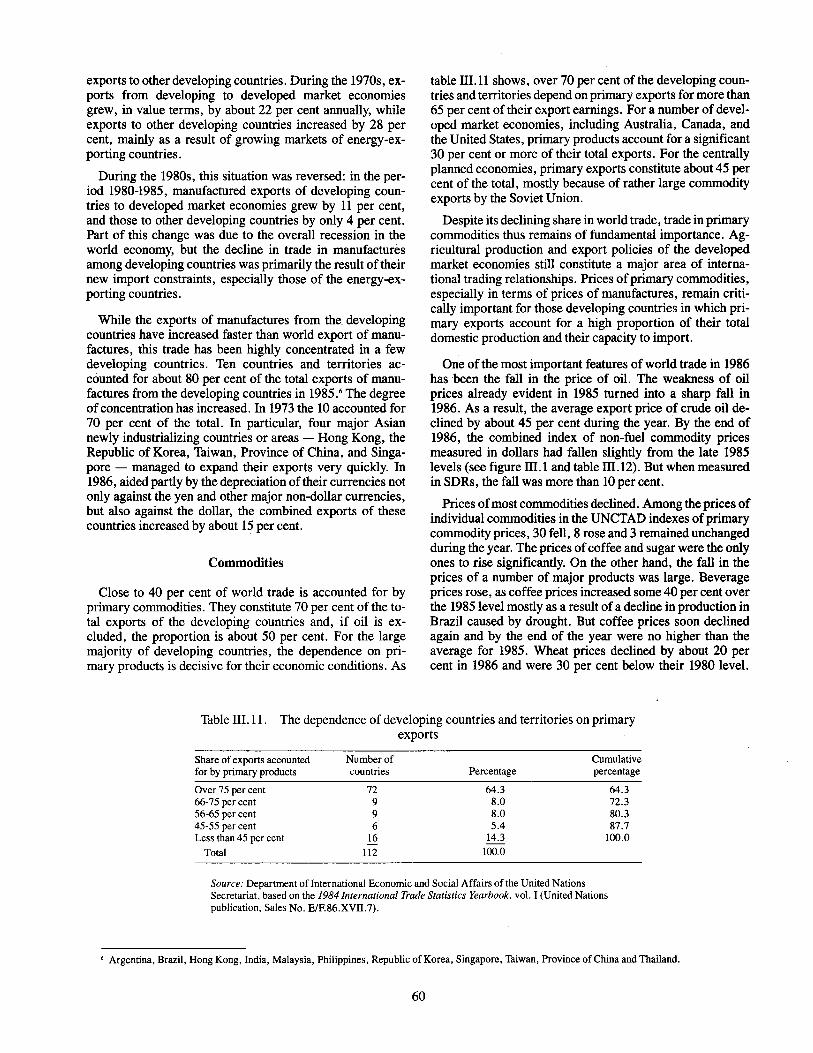
exports to other developing countries. During the 1970s, exports from developing to developed market economiesgrew, in value terms, by about 22 per cent annually, whileexports to other developing countries increased by 28 percent, mainly as a result of growing markets of energy-exporting countries.
During the 1980s, this situation was reversed: in the period 1980-1985, manufactured exports of developing countries to developed market economies grew by 11 per cent,and those to other developing countries by only 4 per cent.Part of this change was due to the overall recession in theworld economy, but the decline in trade in manufacturesamong developing countries was primarily the result of theirnew import constraints, especially those of the energy-exporting countries.
While the exports of manufactures from the developingcountries have increased faster than world export of manufactures, this trade has been highly concentrated in a fewdeveloping countries. Ten countries and territories accounted for about 80 per cent of the total exports of manufactures from the developing countries in 1985.6 The degreeofconcentration has increased. In 1973 the 10 accounted for70 per cent of the total. In particular, four major Asiannewly industrializing countries or areas - Hong Kong, theRepublic of Korea, Taiwan, Province of China, and Singapore - managed to expand their exports very quickly. In1986, aided partly by the depreciation of their currencies notonly against the yen and other major non-dollar currencies,but also against the dollar, the combined exports of thesecountries increased by about 15 per cent.
Commodities
Close to 40 per cent of world trade is accounted for byprimary commodities. They constitute 70 per cent of the total exports of the developing countries and, if oil is excluded, the proportion is about 50 per cent. For the largemajority of developing countries, the dependence on primary products is decisive for their economic conditions. As
table m.ll shows, over 70 per cent of the developing countries and territories depend on primary exports for more than65 per cent of their export earnings. For a number of developed market economies, including Australia, Canada, andthe United States, primary products account for a significant30 per cent or more of their total exports. For the centrallyplanned economies, primary exports constitute about 45 percent of the total, mostly because of rather large commodityexports by the Soviet Union.
Despite its declining share in world trade, trade in primarycommodities thus remains of fundamental importance. Agricultural production and export policies of the developedmarket economies still constitute a major area of international trading relationships. Prices ofprimary commodities,especially in terms of prices of manufactures, remain critically important for those developing countries in which primary exports account for a high proportion of their totaldomestic production and their capacity to import.
One of the most important features of world trade in 1986has been the fall in the price of oil. The weakness of oilprices already evident in 1985 turned into a sharp fall in1986. As a result, the average export price of crude oil declined by about 45 per cent during the year. By the end of1986, the combined index of non-fuel commodity pricesmeasured in dollars had fallen slightly from the late 1985levels (see figure III.1 and table m.12). But when measuredin SDRs, the fall was more than 10 per cent.
Prices ofmost commodities declined. Among the prices ofindividual commodities in the UNCTAD indexes ofprimarycommodity prices, 30 fell, 8 rose and 3 remained unchangedduring the year. The prices ofcoffee and sugar were the onlyones to rise significantly. On the other hand, the fall in theprices of a number of major products was large. Beverageprices rose, as coffee prices increased some 40 per cent overthe 1985 level mostly as a result of a decline in production inBrazil caused by drought. But coffee prices soon declinedagain and by the end of the year were no higher than. theaverage for 1985. Wheat prices declined by about 20 percent in 1986 and were 30 per cent below their 1980 level.
Table IIL11. The dependence of developing countries and territories on primaryexports
Share of exports accounted Number of Cumulativefor by primary products countries Percentage percentage
Over 75 per cent 72 64.3 64.366-75 per cent 9 8.0 72.356-65 per cent 9 8.0 80.345-55 per cent 6 5.4 87.7Less than 45 per cent 16 14.3 100.0
Total 112 100.0
Source: Department oflnternational Economic and Social Affairs of the United NationsSecretariat, based on the 19841nternational Trade Statistics Yearbook. vol. I (United Nationspublication, Sales No. E/F.86.XVII.7).
6 Argentina, Brazil, Hong Kong, India, Malaysia, Philippines, Republic of Korea, Singapore, Taiwan, Province of China and Thailand.
60
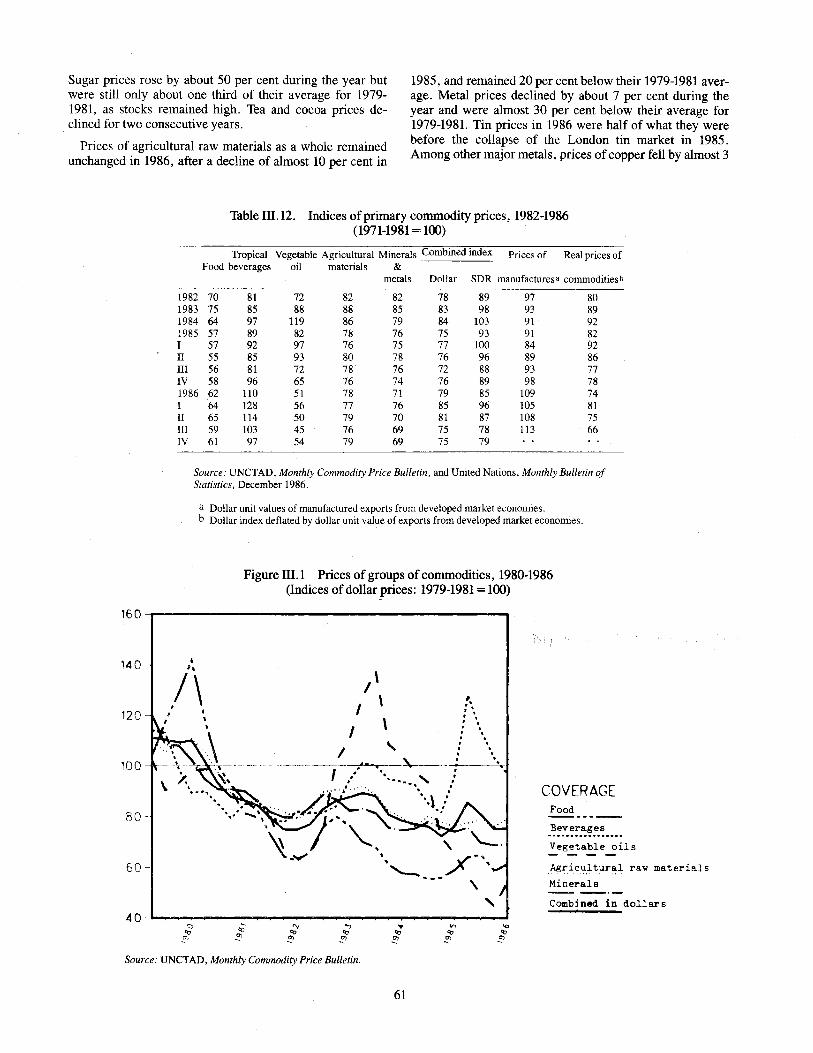
Sugar prices rose by about 50 per cent during the year butwere still only about one third of their average for 19791981, as stocks remained high. Tea and cocoa prices declined for two consecutive years.
Prices of agricultural raw materials as a whole remainedunchanged in 1986, after a decline of almost 10 per cent in
1985, and remained 20 per cent below their 1979-1981 average. Metal prices declined by about 7 per cent during theyear and were almost 30 per cent below their average for1979-1981. Tin prices in 1986 were half of what they werebefore the collapse of the London tin market in 1985.Among other major metals, prices ofcopper fell by almost 3
Tablem.12. Indices ofprimary commodity prices, 1982-1986(1971-1981 =100)
Tropical Vegetable Agricultural Minerals Combined index Prices of Real prices ofFood beverages oil materials &
metals Dollar SDR manufactures' commoditiesb
1982 70 81 72 82 82 78 89 97 801983 75 85 88 88 85 83 98 93 891984 64 97 119 86 79 84 103 91 921985 57 89 82 78 76 75 93 91 82I 57 92 97 76 75 77 100 84 92II 55 85 93 80 78 76 96 89 86III 56 81 72 78 76 72 88 93 77IV 58 96 65 76 74 76 89 98 781986 62 110 51 78 71 79 85 109 74I 64 128 56 77 76 85 96 105 81II 65 114 50 79 70 81 87 108 75III 59 103 45 76 69 75 78 113 66IV 61 97 54 79 69 75 79
Source: UNCTAD, Monthly Commodity Price Bulletin, and United Nations, Moltthly Bulletin ofStatistics, December 1986.
a Dollar unit values of manufactured exports from developed market economies.b Dollar index deflated by dollar unit value of exports from developed market economies.
Figure m.l Prices of groups of commodities, 1980-1986(Indices of dollar prices: 1979-1981 =100)
160-r----------------------,
140
120
100
80-
60
\
tI,
/\. •I
•
I'I ' !..".."
: '.. .. ." ../ : \" . .--.--........-..--~,._.-:--~......... " :'. .. .'. \ .. .
.':COVERAGE
Food
Beverages
Vegetable oils
Agricu,ltun.l ra" materials
Minerals
"-40 -
C:> ~ '" .., ... '" '0
'" '" '" '" '" '":" :" :" :" :" !'} !'}
Source: UNCTAD, Monthly Commodity Price Bulletin.
61
Combined in dollars
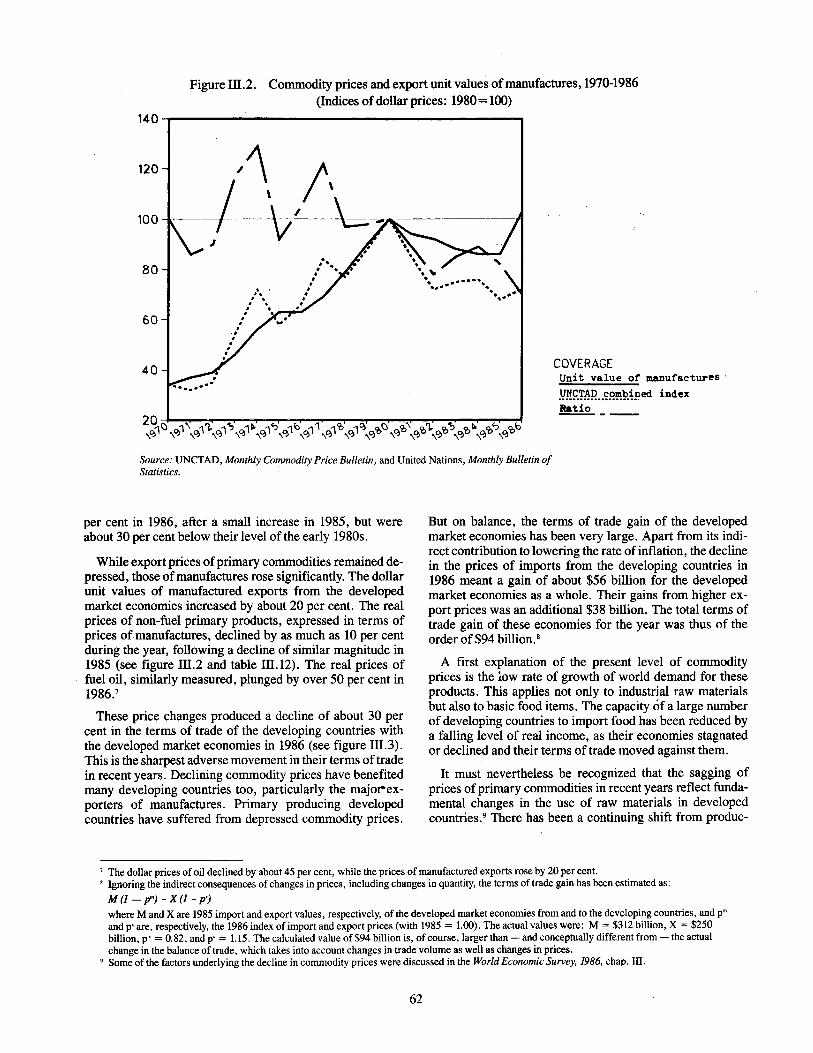
Figure m.2. Commodity prices and export unit values of manufactures, 1970-1986(Indices of dollar prices: 1980=100)
140.,....---------------------.
COVERAGEUnit value of manufactures'
.l!!!£r~p...r:~~!>.;p.ed indexRatio _
.I.I •
I •
: 9.,I..
·1I....
60
80
40
120
100
Source: UNCTAD, Monthly Commodity Price Bulletin, and United Nations, Monthly Bulletin ofStatistics.
per cent in 1986, after a small increase in 1985, but wereabout 30 per cent below their level of the early 1980s.
While export prices of primary commodities remained depressed, those of manufactures rose significantly. The dollarunit values of manufactured exports from the developedmarket economies increased by about 20 per cent. The realprices of non-fuel primary products, expressed in terms ofprices of manufactures, declined by as much as 10 per centduring the year, following a decline of similar magnitude in1985 (see figure 111.2 and table 111.12). The real prices offuel oil, similarly measured, plunged by over 50 per cent in1986.7
These price changes produced a decline of about 30 percent in the terms of trade of the developing countries withthe developed market economies in 1986 (see figure 111.3).This is the sharpest adverse movement in their terms of tradein recent years. Declining commodity prices have benefitedmany developing countries too, particularly the majol""exporters of manufactures. Primary producing developedcountries have suffered from depressed commodity prices.
But on balance, the terms of trade gain of the developedmarket economies has been very large. Apart from its indirect contribution to lowering the rate of inflation, the declinein the prices of imports from the developing countries in1986 meant a gain of about $56 billion for the developedmarket economies as a whole. Their gains from higher export prices was an additional $38 billion. The total terms oftrade gain of these economies for the year was thus of theorder of $94 billion. 8
A first explanation of the present level of commodityprices is the low rate of growth of world demand for theseproducts. This applies not only to industrial raw materialsbut also to basic food items. The capacity of a large numberof developing countries to import food has been reduced bya falling level of real income, as their economies stagnatedor declined and their terms of trade moved against them.
It must nevertheless be recognized that the sagging ofprices of primary commodities in recent years reflect fundamental changes in the use of raw materials in developedcountries. 9 There has been a continuing shift from produc-
7 The dollar prices of oil declined by about 45 per cent, while the prices of manufactured exports rose by 20 per cent., Ignoring the indirect consequences of changes in prices, including changes in quantity, the terms oftrade gain has been estimated as:
M (l - p"') - X (l - ]1')
where M and X are 1985 import and export values, respectively, of the developed market economies from and to the developing countries, and pmand P' are, respectively, the 1986 index of import and export prices (with 1985 = 1.00). The actual values were: M = $312 billion, X = $250billion, pm = 0.82, and p' = 1.15. The calculated value of $94 billion is, of course, largerthan - and conceptually different from - the actualchange in the balance of trade, which takes into account changes in trade volume as well as changes in prices.
9 Some of the factors underlying the decline in commodity prices were discussed in the World Economic Survey, 1986, chap. III.
62
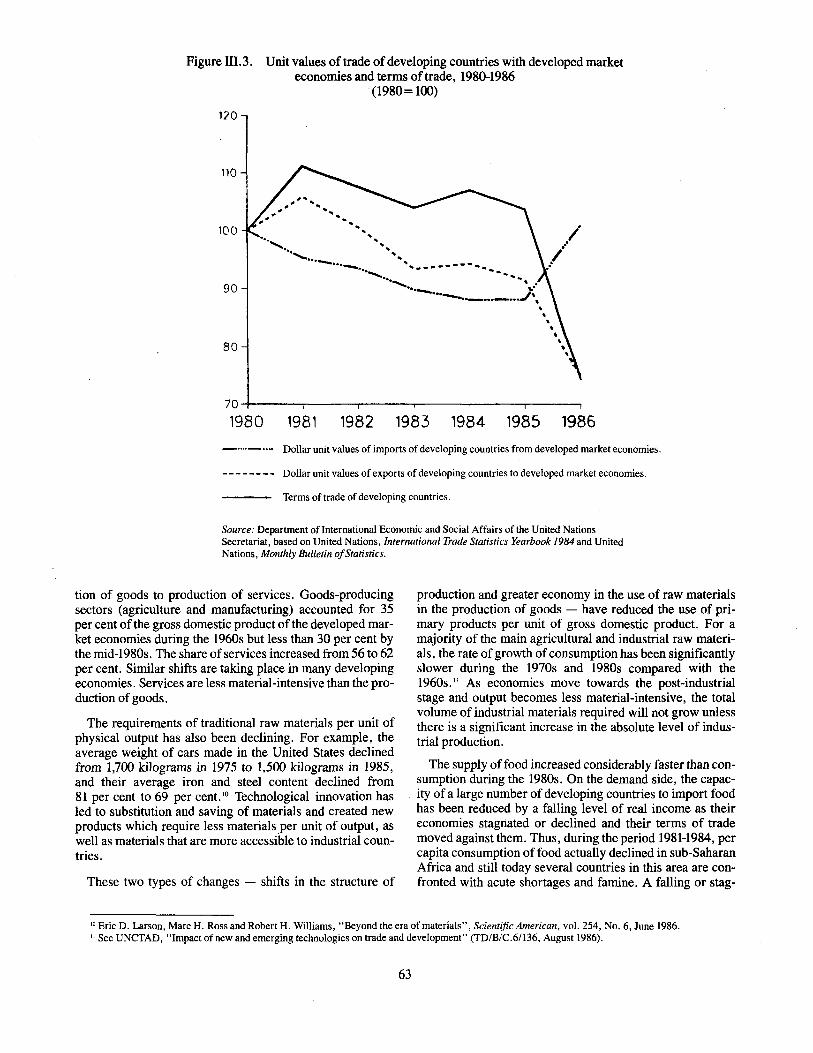
Figure m.3. Unit values of trade ofdeveloping countries with developed marketeconomies and terms of trade, 1980-1986
(1980=100)
170
110
100
90
80
.. ~.. ~.. ~
~.,. ... ............ ~~
~.......... ~~~
.......... ~" .............-.. .......... --..................... .. .........
................. ',..-.................__..._ ....J,,
19861985198419831982198170 -1-------,---.....,....------,----.---..........------.
1980
Dollar unit values of imports of developing countries from developed market economies.
Dollar unit values of exports of developing countries to developed market economies.
Terms of trade of developing countries.
Source: Department oflnternational Economic and Social Affairs of the United NationsSecretariat, based on United Nations, International Trade Statistics Yearbook 1984 and UnitedNations, Monthly Bulletin ofStatistics.
tion of goods to production of services. Goods-producingsectors (agriculture and manufacturing) accounted for 35per cent of the gross domestic product of the developed market economies during the 1960s but less than 30 per cent bythe mid-1980s. The share of services increased from 56 to 62per cent. Similar shifts are taking place in many developingeconomies. Services are less material-intensive than the production of goods.
The requirements of traditional raw materials per unit ofphysical output has also been declining. For example, theaverage weight of cars made in the United States declinedfrom 1,700 kilograms in 1975 to 1,500 kilograms in 1985,and their average iron and steel content declined from81 per cent to 69 per cent. 10 Technological innovation hasled to substitution and saving of materials and created newproducts which require less materials per unit of output, aswell as materials that are more accessible to industrial countries.
These two types of changes - shifts in the structure of
production and greater economy in the use of raw materialsin the production of goods - have reduced the use of primary products per unit of gross domestic product. For amajority of the main agricultural and industrial raw materials, the rate of growth ofconsumption has been significantlyslower during the 1970s and 1980s compared with the1960s. ll As economies move towards the post-industrialstage and output becomes less material-intensive, the totalvolume of industrial materials required will not grow unlessthere is a significant increase in the absolute level of industrial production.
The supply offood increased considerably faster than consumption during the 1980s. On the demand side, the capacity of a large number of developing countries to import foodhas been reduced by a falling level of real income as theireconomies stagnated or declined and their terms of trademoved against them. Thus, during the period 1981-1984, percapita consumption of food actually declined in sub-SaharanAfrica and still today several countries in this area are confronted with acute shortages and famine. A falling or stag-
10 Eric D. Larson, Marc H. Ross and Robert H. Williams, "Beyond the era of materials" ,Scientific American, vol. 254, No.6, June 1986.II See UNCTAD, "Impact of new and emerging technologies on trade and development" (TD/B/C.6/136, August 1986).
63

nant real income in other developing countries alsodepressed their food import demand.
On the supply side, the achievement of other developingcountries in attaining food self-sufficiency had the same effect on trade in food. The farm support policies of manydeveloped market economies, by restricting imports and increasing export surpluses, depress international prices ~f
food. Overproduction offood grains as a result of these polIcies has led to a huge increase in stocks in recent years. Theestimated world stock of cereals increased from 248 milliontons in 1981 to 399 million tons in 1986, or by 60 per cent. In1986, about 70 per cent of these stocks were held by thedeveloped market economies, 45 per cent by the UnitedStates alone. 12
It is unrealistic to expect trade in raw materials in generalto grow in the foreseeable future at anything like their ratesduring the 1950s and 1960s. This has grave implicati~ns formany developing countries which have only a narrow mdustrial base and depend on one or two commodities for the bulkof their exports earnings.
Trade in services
International trade in services only kept pace with thegrowth of trade in goods. Available information indica~es
that the share of non-factor services in the total merchandisetrade ofdeveloped market economies and developing economies together was virtually constant during the past decad~.In dollar terms, this share was approximately 21 per cent m1975 and about the same percentage in 1985. However, services are a very heterogeneous group. During the 1980s,while traditional services such as shipping and other trans··portation have been declining, international markets havebeen expanding in the category "other services", which includes banking, insurance, consulting and other internationally traded business services undergoing technologicalchanges related to the progress in telecommunications andthe computer industry. The growth of trade in non-factorservices during the past decade is shownin table ilL 13 . Depending on which items are included, the estimate of theshare of services may go beyond the often-mentioned figureof about 20 per cent of world trade. By the same token, adifferent assessment will be made of the growth of trade inservices. Usually, those who identify strong expansion in thetrade in services include in the definition the profit remittances of service companies abroad or even the dividends onall foreign direct investment, and sometimes all invisibles inthe balance of payments, which are then vaguely treated as"trade in services" .
One source of uncertainty in evaluating the changing importance of services in world trade is that there is no information about costs and prices in the trade in services.Therefore, it is impossible to ascertain to what extent
changes in services reflect changes in prices or real flo~s.
For the services whose border exchanges can be more easl1yobserved, such as shipping, passenger services, port services and other transportation, as well as travel, it is possibleto gather some information on tonnage, number of passengers etc. But services do not physically cross borders andthey do not pass through customs, where the volume ofgoods crossing borders is registered. No distinction betweenvalue and volume can be established for the category ofservices whose border exchanges are "non-visible", as royalties and license fees paid for patents, trademarks, copyrights and similar non-financial intangibles, nor for thegamut of transactions lumped together under "other privateservices" .
It is believed that, in addition to the' underreporting inworld shipping owing to the treatment given to revenues offlags of convenience fleets, most of the und~rreporti~g intrade in services occurs in the category of busmess services.Thus, very uncertain magnitudes are reported for servic:swhich are the fastest growing component in the domestlcmarket of services in developed countries and preciselythose where most of the potential for growth in internationaltrade in services is deemed to be.
For the developed market economies, exports of servicesappear to have grown at a somewhat slower pace than thoseof goods during the past decade. The service to goods ratioin exports has thus declined, though only slightly. But thecategory "other services" has grown faster than the othergroups. In the United States, this category of exports hascome to exceed the exports of royalties, fees and trademarks. The types of services in this fast-growing categoryvary in importance from country to country. The largestcomponents of United States exports in this category areinsurance, construction, health, education, and computersoftware. In the United Kingdom, by far the most importantis financial services, followed by other business consultancy. In France, engineering in public works and technicalco-operation projects constitute the most important type ofservice exports. There is, however, little information on thegrowth of these types of trade.
The lack of disaggregated trade data on private servicesand the limited information on the directien of this trademakes it so far impossible to examine in detail the possibletrends of international trade in business services. In the postwar period, trade in goods has expanded fast as a result ofspecialization among firms within the same industry. andhighly differentiated consumer preferences. InternatlOnaltrade in services may well develop along similar lines.Countries would then not only be exchanging services fromdifferent sectors, but also specializing within the same sectors. This is already happening among airlines, mainly asgeographical specialization, but it could occur in other sectors, and not only geographically, but activity-wise. 13
" FAO, Food Outlook, February 1987. ...,,' enha en13 See H. Schaumburg-Muller, "Europe's trade in services: comparative advantage ofzn~ra-zndustrytrade ,working paper 4/1985 (Cop g,
Institute ofInternational Economics and Management, Copenhagen School of EconomIcs and Busmess AdmmlstratlOn, 1985).
64

Table III.13. Trade in non-factor services(Billions of dollars)
Annualaverage
rate of growth
1985/ 1985/1975 1980 1982 1984 1985 1875 1980
Developed market economies
Shipping + 25.9 50.0 44.9 41.8 43.3 5.3 -2.8- 26.8 50.6 46.3 49.4 49.7 6.4 -0.4
-0.9 -0.6 -1.4 -7.6 -6.4
Passenger services + 6.4 14.3 14.4 15.0 15.4 9.0 1.56.5 13.3 14.1 15.8 16.6 9.8 4.5
-0.1 +1.0 +0.3 -0.8 -1.2
Other transportation + 21.3 43.5 41.5 38.0 38.2 6.0 -2.6- 23.3 47.0 45.8 40.4 40.5 5.7 -2.9
-2.0 -3.5 -4.3 -2.4 -2.3
Travel + 32.8 72.2 69.7 70.5 73.8 8.5 0.235.5 76.7 71.5 71.6 75.3 7.8 -0.6-2.7 -4.5 -1.8 -1.1 -1.5
Royalties and fees + 6.3 11.5 9.5 10.2 10.8 5.5 -1.35.0 9.3 9.3 10.2 10.8 7.7 3.0
+1.3 +2.2 +0.2 0 0
Other private services + 41.6 88.9 89.6 86.5 91.3 8.2 0.533.8 71.9 74.6 72.3 75.1 8.3 0.9
+7.8 +17.0 +15.0 +14.2 +16.2
Total non-factor services + 134.3 280.4 269.6 262.0 272.8 7.3 -0.6- 130.9 268.8 261.6 259.7 268.0 7.4 -0.1
+3.4 +11.6 +8.0 +2.3 +4.8
Share in merchandise exports (per cent) 23.9 22.7 23.5 21.5 21.7Share in merchandise imports (per cent) 23.5 20.6 22.3 20.5 20.6
Developing countries
Shipping + 3.5 7.1 8.1 7.8 7.4 7.8 0.814.3 32.9 33.7 28.5 23.8 5.2 -6.3
-10.8 -25.8 -25.6 -20.7 -16.4
Passenger services + 1.1 3.8 4.4 4.2 4.3 14.6 2.51.3 4.1 4.1 3.4 2.9 8.4 -6.7
-0.2 -0.3 +0.3 +0.8 +1.4
Other transportation + 4.9 12.4 11.6 10.3 9.3 6.6 -5.64.0 11.7 11.8 10.5 8.9 -8.3 -5.3
+0.9 +0.7 -0.2 -0.2 -0.4
Travel + 4.6 24.2 21.9 21.4 20.7 16.3 -3.16.9 21.7 21.0 18.3 18.0 10.1 -3.7
-2.3 +2.5 +0.9 +2.8 +2.7
Royalties and fees + 0.2 0.5 1.1 0.2 0.1 -6.7 -14.90.5 1.0 1.3 1.0 1.0 7.2 0
-0.3 -1.0 -1.2 -0.8 -0.9
Other private services + 6.7 17.1 26.4 22.1 20.0 11.6 3.28.6 26.5 38.0 32.5 32.3 14.2 4.0
-1.9 -9.4 -11.6 -10.4 -12.3
Total non~factor services + 20.8 64.6 72.4 65.5 61.7 11.5 -0.9- 35.6 97.9 109.9 94.2 86.9 9.3 -2.4
-14.8 -33.3 -37.5 -28.7 -25.2
Share in merchandise exports (per cent) 11.5 14.0 17.6 16.9 17.7Share in merchandise imports (per cent) 21.4 26.2 28.6 27.0 28.0
Source: Department ofInternational Economic and Social Affairs of the United NationsSecretariat, based on IMF, Balance ofPayments Statistics tapes, partial data for 24 developedand 100 developing countries.
Note: A plus sign ( + ) indicates export or receipt.A minus sign (-) indicates import or payment.
65

The relatively slow growth of the exports of services mayseem at odds with the impression of fast growth that discussion on the subject often gives. There are a number of reasons for this. Apart from the lack of adequate data andwidespread underreporting (see box III. 1), there are conceptual and statistical difficulties of measurement. For example, there is no agreed way of measuring banking and otherfinancial services. Data on international banking do not permit separation between fees for services (and therefore tradein services) and payments associated with foreign investment. There is probably underreporting oftrade in services.A further reason is that many services cannot be transportedacross borders, despite the progress in data processing andstorage and telecommunications. They either require themovement of the consumer to the country providing the
, services (as in tourism or some health services), or themovement abroad of firms and/or experts providing theservices. Business services are often of the latter type. Ifinternational sales of services can occur only by transferringabroad the "production" of that service, they are obviouslyexcluded from trade statistics. 14 The increasing importanceof services in the domestic economy does not thus show upin a corresponding increase in trade. Perhaps equally important in this context, the comparison of the proportion of domestic output of goods traded internationally with that of
, services may be unwarranted because a large fraction of domestic services is already embodied in goods traded and thisshare is increasing over time. 15
Finally, slow growth is often due to the numerous barriersto this trade from state supervision and regulation of serviceactivities. These regulations are basically designed for implementing various domestic policy goals and might not beintended to keep6ut foreign suppliers, but they neverthelesscan reduce the potential for international trade. Most countries consider that certain services cannot be left entirely tothe market place. Banking, for instance, raises issues of fiduciary and monetary control; telecommunication raises is~
sues of national security; some audio-visual works andentertainment may be considered inimical to national and
cultural identity and value systems; and social security, medical insurance and also other forms of insurance raise questions of consumer protection, equity and distribution. 16
Such considerations seem to suggest that the growth oftrade in services will remain modest in the near future, evenif progress is made in multilateral trade negotiations on thesubject, which will take a long time.
The growth of the developing countries' trade in serviceshas been somewhat higher than that of the developed countries, though the data are uncertain, cloud the actual trendand make international comparisons tenuous. The growthhas been highest for the category of "other private services", and imports in this group of services have grownfaster than exports. Construction and engineering, mostly inthe area of infrastructure projects, as weIhs related professional and technical services, are the most important itemsin the category of "other services" for the handful of developing countries exporting such services. The Republic ofKorea has been by far the most successful in the field, wellahead of Turkey, Yugoslavia, Brazil and India. Developingcountry exports of construction and engineering serviceshave been directed mostly to other developing countries, especially the oil-exporting countries. 17
Developed countries have had a surplus in their trade innon-factor services, but, after growing during the 1970s, thesurplus has recently declined from $US12 billion in 1980 to$US5 billion in 1985. The deficit ofdeveloping countriesdeclined during the same period from $US33 billion to$US25 billion.
The developing countries' deficit in trade in services withdeveloped countries is heaviest in the category of "otherprivate services". In this category, developed market economies have consistently shown a positive balance of about$US16 billion annually during the 1980s, while developingcountries during the same period had a negative balance ofnearly $USlO billion per year.
14 For the examination of foreign direct investment as a vehicle for delivering services abroad, see report of the Secretary-General on the role oftransnational corporations in services, including transborder data flows (E/C .10/1987111), . .
15 Canadian research is under way to estimate the direct and indirect amount of services embodied in a unit of the country's exports and Imports WIththe help of input-output tables. For Canada, using very rough approximations, H. G. Grube.le~timates that OI'le-th~r~ of the va.lue added to gro.ssgoods output consists of intermediate services. If the same percentage can be assumed to eXIst m exported ,goods, It IS eas.y to mfer that a ~onslder.
able share of merchandise exports are actually services. For Canada, for instance, it would mean that servIces exports (dIrect and embodIed)could be more than three times higher than what is recorded in their balance of payments (see H. G. Grubel, "Direct and embodied, trade inservices", service project discussion paper 86-1 (Vancouver, Canada, The Fraser Institute, 1986), and A, M. Rugman, '1\ transactIOn cost approach to trade in services", paper presented to the annual meeting of the American Economic Association, New Orleans, December 1986 ..
16 It has been argued that here "the analogy has to be partly with armaments negotiations: we would not expect nation states to leave the location ofdefence production to be detemined by market forces" (J.N. Bhagwati, "GATT and trade in services: how we can resolve the North-Southdebate", Financial Times, 27 November 1985).
17 See A. Sapir, "Trade in investment-related technological services", World Development, vol. 14, No.5, May 1986.
66

Box III.!. Technical note on the measurement of trade in services
Service exports can be categorized in three major groups.The first comprises those services whose border exchangesare more "visible": shipping, passenger services (basicallytransportation of persons) and "other transportation" (basically port services, but including also charters of carriers),as well as travel (mainly tourism). In short, the group represents transportation and travel.
The second group is royalties and license fees. In thestandard balance of payments, it appears as "property income not included elsewhere", and its main component isincome accruing to the owners ofpatents, copyrights, trademarks and similar non-financial intangible assets. The inclusion of royalties and license fees in trade in services iscontroversial. It can be debated whether they are paymentsfor services - at least they are payments for intangibles or factor payments. The discussion on the role of knowledgein production and trade cannot be settled here. In practice,most frequently royalties and license fees are included inservice trade, as they are here. Depending on the level ofdetail that information on services will reach in the future,they could become an altogether separate grouping in thebalance of payments, specifying diverse "intellectual property rights" payments or "disembodied technology" payments, containing disaggregate figures to show whichindustries are earning or generating royalties payments.
The third group is an extremely heterogeneous collectionunder the heading "other goods, services and incomes" . Inits guidelines for member countries in making their balanceof-payments reports, IMF does not yet require disaggregated data for the residual item "other goods, services andincome". This heading basically comprises services and,moreover, it is under this residual heading that most of theservices are reported. Goods are not recorded in this item,despite the title, except for goods that should probably becalled "embodied services", such as periodicals comingfrom abroad under subscription arrangements. Broadcastingand television programmes embodied in tapes are probablyrecorded under this item, though there is no assurance thatsome of it does not appear also under "merchandise" .
The only disaggregation broadly available in this item isbetween official and private transactions. "Official services" comprise those of general government and the centralbank; the principal kinds are those performed by embassiesand consulates, military units and agencies abroad, otherofficial entities such as aid missions, government information, tourism and immigration offices abroad (but not stateenterprises), receipts or contributions under military arrangements and military services obtained, and other goodsand services provided to or obtained by Government.
"Official transactions" should be excluded from trade inservices for certain purposes. The corresponding expenditures are determined mainly by political power and diplomatic goals and can hardly be regarded as subject to trade
67
policy or trade negotiations. It might be that in some cases,official and private transactions are difficult to disentanglein international statistical records, because what in onecountry is the export of a private engineering firm, andtherefore included under" other private services" , could be,in the reporting country, a government procurement for roadbuilding or airport construction, and recorded under officialservices.
"Other private services" is a miscellaneous item coveringall the rest, namely, a very large number of different activities, provided not only to final consumers but also, in particular, to firms. The item would include:
(a) Communications (postal, cable, telephone and telecommunications) ;
(b) Insurance (other than international freight insurancerecorded under shipping);
(c) Brokerage, as fees paid to agents other than those included in the value of merchandise, brokerage and commissions charged on other transactions;
(d) Financial services performed by banks, underwritersand finance houses, as measured by the amounts of theircharges (but not interest payments, which are an altogetherdifferent item in the balance of payments);
(e) Merchandising, inclusive gains from transactions incommodity futures and commodity arbitrage ~here the parties are not residents of the same economy (although financial futures and operations and arbitrage gains on financialitems are in the capital account of the balance of payments);
(f) Provision of management, accounting and kindredservices (for instance, those provided to a subsidiary by itsparent);
(g) Legal and other consulting;
(h) Processing and repair (except those under "port services");
(i) Franchises and similar rights;
(j) Software and data processing;
(k) Research, surveys, testing and chemical and physicalanalysis;
(1) Provision of instruction, training and technical knowhow;
(m) Construction and building design;
(n) Engineering and industrial design;
(0) Leasing of structures, machinery and equipment(other than the leasing of transportation equipment registered under "other transportation"); these transactions appear in some national records as "equipment rental";
Box continued on nextpage
(p) Leasing of films, tapes, records and other tangible assets;
(q) Medical services and other care and cure services;
(r) Entertainment and cultural services, as by orchestras,theatre, opera or ballet groups, circus, sports, individual
, performers;
(s) Other professional and technical services.
The information on trade in "other services" disaggregated in its heterogeneous types that exists for a few developedcountries goes down to only four or five very broad categories. Only the United States has information available downto some 20 categories. For developing countries, disaggregated data are non-existent, and a number of developingcountries lack the item in their balance of payments even atthe aggregate level.
Moreover, it might be that some of the payments for theseservices appear under other categories in the balance of payments such as labour income. Labour services provided bythe crew of carriers in international transportation are classified under "labour income" in the IMF Balance of Payments Manual. Though such a recommendation is not speltout for construction crews, it is likely that the foreign earnings of construction and engineering firms are partly reflected in remittances of their construction teams abroad andclassified under "labour income" or "workers remittances".
Data on the direction oftrade in "other services", whichwould allow the examination of the question "who is tradingwith whom", are in an even more shaky state than the sector-wise disaggregation.
Recorded under the heading "other private services" are,in principle, all the most technologically advanced intermediary services or business services. Concrete figures for thisaggregate are sometimes puzzling,18 and it could be that theweight of less sophisticated types of services in this aggregate is still important. The exact composition, even in thecase of developed countries, is unknown and further datahave to be awaite(1
By theIr very nature, service transactions are more difficult to measure. In fact, the largest discrepancies betweentotal world exports and total world imports appear in serviceitems, namely, in transportation and in "other official andprivate services". A high discrepancy is shown in transpor-
tation, where world receipts recorded have been consistently lower than world expenditures. At the origin ofmost ofthe underreporting is the existence of open-registry fleets(also called "flags of convenience" fleets); these are fleetsoperating under flags ofcountries that do not require ownership or management to be located within their territories. Asa rule, receipts and expenditures of open-registry fleets arenot recorded in the balance of payments of countries of registry. Neither are they in the countries of residence of theshipowners, since they are operated by subsidiaries locatedin the country of registry. 19
Other large discrepancies appear in the item "other official and private services". Uncertainties about measures inthis item are of particular concern because proposals for theliberalization in services are focused on activities grouped init. Measurement difficulties arise from the balance of serv- 'ices ofcentrally planned economies, from a seeming overestimation in the OPEC data for both expenditures and receiptsin "other services" and, more importantly, from an underreporting of exports of business services of developed countries.
A special inquiry made in Sweden for the year 1977 revealed that actual receipts of royalties, patents and licenseswere almost double the data recorded, and exports oftechnical services were almost four times the figure recorded in thebalance of payments. 20 In the United States, according to arecent study, "as much as half of the nation's exports ofservices may escape the official statistics" .21 Defining tradein services as non-factor income and including fees and royalties, this study by the Office of Technology Assessment ofthe Congress of the United States concludes that the UnitedStates balance-of-payments data understate both importsand exports of services. The understatement for exports exceeds that for imports and in consequence, the United Statessurplus on services trade appears to be far greater than reflected in the offical statistics. The mid-range estimate of theOffice of Technology Assessment for exports is almost double the official figures. 22 The study has left out of the comparison the banking services, because in the United Statesbalance-of-payments, there is no way of isolating whatwould be the fees earned by banks for setvices - that is,non-factor income and therefore part of trade in services from the returns to United States holders of foreign portfolioinvestments - that is, factor income. 23 The special difficultyin measuring the services exported by the banking sector isnot peculiar to the United States; co-mingling with interest
Box continued on adjacent page
I' For instance, IMF balance of payment records show that developing countries, during the 1970s, have expanded their exports of "other privateservices" much more rapidly than developed market economies.
19 For a more detailed discussion, see UNCTAD, Economic Consequences ofthe Existence or Lack ofa Genuine Link between Vessel and Flag ofRegistry, Geneva, 1977 and OECD, "The world current account discrepancy", Occasional Studies, June 1982.
20 See "The development of Sweden's balance of payments, Appendix: Omissions in reporting of exports of services", Quarterly Review oftheSveriges Riksbank, ]979: 2, cf. OECD, "The world current account discrepancy", loco cit.
21 United States Congress, Office of Technology Assessment, "Trade in services: exports and foreign revenues - special report" (OTA-ITE-316),(Washington, D.C., Government Printing Office, September 1986), p. 3.
22 Ibid., pp. 37-38.23 Ibid., pp. 31, 38 and 54-58.
68

payments and other investment earnings is a general shortcoming.
Underestimation in service exports might arise also fromthe fact that in many cases services are sold bundled withgoods - for instance, maintenance service for some equipment - and might be recorded under goods. This statisticalproblem is different from the larger issue of the growing"service content" in all industrial goods.
The uncertainty of the data on production of services andtheir trade across borders, and the possibility of the marginof errors that cannot be estimated, are likely to hamper forquite some time the assessment of trends and their impact indifferent economies or country groups. It might significantly slow the formulation of policy and negotiating positions in discussions on trade in services.
69

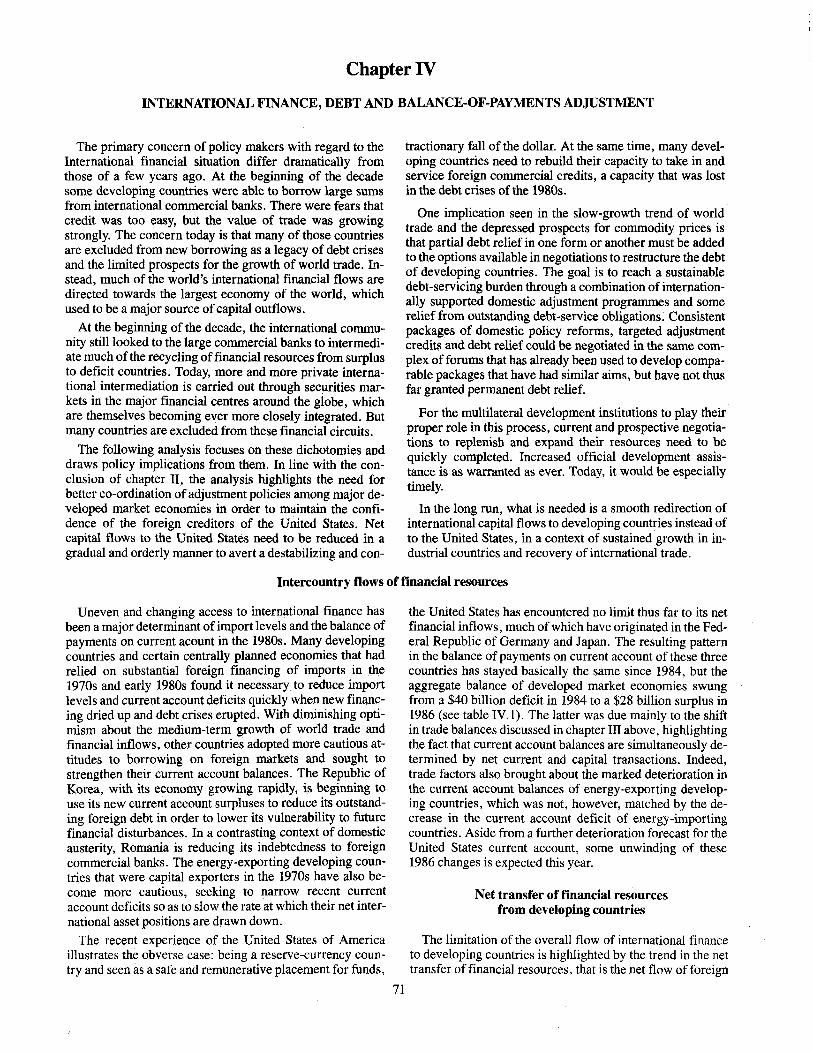
Chapter IV
INTERNATIONAL FINANCE, DEBT AND BALANCE-OF-PAYMENTS ADJUSTMENT
The primary concern of policy makers with regard to theInternational financial situation differ dramatically fromthose of a few years ago. At the beginning of the decadesome developing countries were able to borrow large sumsfrom international commercial banks. There were fears thatcredit was too easy, but the value of trade was growingstrongly. The concern today is that many of those countriesare excluded from new borrowing as a legacy of debt crisesand the limited prospects for the growth of world trade. Instead, much of the world's international financial flows aredirected towards the largest economy of the world, whichused to be a major source ofcapital outflows.
At the beginning of the decade, the international community still looked to the large commercial banks to intermediate much of the recycling offinancial resources from surplusto deficit countries. Today, more and more private international intermediation is carried out through securities markets in the major financial centres around the globe, whichare themselves becoming ever more closely integrated. Butmany countries are excluded from these financial circuits.
The following analysis focuses on these dichotomies anddraws policy implications from them. In line with the conclusion of chapter II, the analysis highlights the need forbetter co-ordination ofadjustment policies among major developed market economies in order to maintain the confidence of the foreign creditors of the United States. Netcapital flows to the United States need to be reduced in agradual and orderly manner to avert a destabilizing and con-
tractionary fall of the dollar. At the same time, many developing countries need to rebuild their capacity to take in andservice foreign commercial credits, a capacity that was lostin the debt crises of the 1980s.
One implication seen in the slow-growth trend of worldtrade and the depressed prospects for commodity prices isthat partial debt relief in one form or another must be addedto the options available in negotiations to restructure the debtof developing countries. The goal is to reach a sustainabledebt-servicing burden through a combination of internationally supported domestic adjustment programmes and somerelief from outstanding debt-service obligations. Consistentpackages of domestic policy reforms, targeted adjustmentcredits and debt relief could be negotiated in the same complex of forums that has already been used to develop comparable packages that have had similar aims, but have not thusfar granted permanent debt relief.
For the multilateral development institutions to play theirproper role in this process, current and prospective negotiations to replenish and expand their resources need to bequickly completed. Increased official development assistance is as warranted as ever. Today, it would be especiallytimely.
In the long run, what is needed is a smooth redirection ofinternational capital flows to developing countries instead ofto the United States, in a context of sustained growth in industrial countries and recovery of international trade.
Intercountry flows of financial resources
Uneven and changing access to international finance hasbeen a major determinant of import levels and the balance ofpayments on current acount in the 1980s. Many developingcountries and certain centrally planned economies that hadrelied on substantial foreign financing of imports in the1970s and early 1980s found it necessary to reduce importlevels and current account deficits quickly when new financing dried up and debt crises erupted. With diminishing optimism about the medium-term growth of world trade andfinancial inflows, other countries adopted more cautious attitudes to borrowing on foreign markets and sought tostrengthen their current account balances. The Republic ofKorea, with its economy growing rapidly, is beginning touse its new current account surpluses to reduce its outstanding foreign debt in order to lower its vulnerability to futurefinancial disturbances. In a contrasting context of domesticausterity, Romania is reducing its indebtedness to foreigncommercial banks. The energy-exporting developing countries that were capital exporters in the 1970s have also become more cautious, seeking to narrow recent currentaccount deficits so as to slow the rate at which their net international asset positions are drawn down.
The recent experience of the United States of Americaillustrates the obverse case: being a reserve-currency country and seen as a safe and remunerative placement for funds,
71
the United States has encountered no limit thus far to its netfinancial inflows, much of which have originated in the Federal Republic of Germany and Japan. The resulting patternin the balance of payments on current account of these threecountries has stayed basically the same since 1984, but theaggregate balance of developed market economies swungfrom a $40 billion deficit in 1984 to a $28 billion surplus in1986 (see table IV.l). The latter was due mainly to the shiftin trade balances discussed in chapter III above, highlightingthe fact that current account balances are simultaneously determined by net current and capital transactions. Indeed,trade factors also brought about the marked deterioration inthe current account balances of energy-exporting developing countries, which was not, however, matched by the decrease in the current account deficit of energy-importingcountries. Aside from a further deterioration forecast for theUnited States current account, some unwinding of these1986 changes is expected this year.
Net transfer of financial resourcesfrom developing countries
The limitation of the overall flow of international financeto developing countries is highlighted by the trend in the nettransfer of financial resources, that is the net flow of foreign

Table IV. 1. World balance of payments on current account", by country group,1980-1987
(Billions of dollars)
1980 1982 1984 1985 1986b 1987c
Developed market economies -37.9 -7.4 -40.0 23.3 28.3 -3.0Large industrial countries -11.6 14.7 -40.0 -26.1 11.3 -17.0
Germany, Federal Republic of -8.9 10.3 13.4 20.5 43.7 37.0Japan -9.4 8.3 36.5 50.1 87.8 80.0United States 8.4 -1.7 -96.0 -104.1 -126.7 -140.0
Other industrial countries -26.3 -22.1 0.1 2.8 17.0 14.0
Developing countries 40.2 -87.3 -39.1 -27.5 -61.5 -46.5Capital-surplus countries 105.6 15.1 -2.3 8.3 -15.4 -8.0Capital-importing countries -65.4 -102.4 -36.8 -35.8 -46.1 -38.5
Energy exporters 2.5 -35.0 -0.5 -3.1 -24.1 -17.0Energy importers -67.9 -67.4 -36.3 -32.7 -22.0 -21.5
China -3.2 5.9 2.4 -11.5 -7.5 -7.0
Centrally planned economies of Europed -5.0 3.3 10.0 2.3 -2.2 ,...0.5Eastern Europe -8.2 0.3 3.8 2.0 -1.8 -0.5USSR 3.6 3.5 6.6 0.5 -0.2 0.5
Residuale 6.0 85.5 66.7 60.0 42.9 57.0
Source: Department ofInternational Economic and Social Affairs of the United NationsSecretariat, based on IMF, Balance ofPayments Statistics and other official national andinternational sources.
a Balance on goods, services and private transfers.b Preliminary estimates.c Secretariat forecast, rounded to the nearest half-billon dollars, based on an average crude oil
export price of $17 a barrel.d Balance with market economies; total includes net interest payments of CMEA banks.e Reflects errors in reported data, balances of economies whose data are not included, and timing
asymmetries in national inflows and outflows. Errors include under-reporting of servicesearnings, especially involving investment income channelled through offshore financial centresand non-factor services exported by the developed market economies to energy-exportingcountries.
exchange resulting from net capital flows minus international payments of interest and profiC' For the capital-importing developing countries taken together, the net transferwas significantly negative in 1986 for the third year in a row(see table IV.2).
The contrast between the early and middle 1980s is stark.In the first period, capital-importing developing countries asa whole enjoyed net financial transfers that were appliedboth to the accumulation of official reserve assets and topayment for import levels that exceeded what could be purchased only with current proceeds, that is earnings from export of goods and services and the remittances fromnationals working abroad. With the sharp fall beginning in1982 in the net financial transfer and the heavy depletion ofreserves, it became impossible for those countries in aggregate to spend more on imports than was earned in exportsand remittance activity. Instead, the balance of payments ongoods and non-capital services had to shift into surplus inorder to effect a net transfer out of these countries, as well asto rebuild reserve levels. The latter had been accorded a highpriority, which with hindsight was appropriate, as many
countries found it necessary again to draw down their reserves, especially the energy-exporting countries (see tableA.12).
The negative transfers of $24 billion for 1985 and 1986shown in table IV.2 are each the result of adding togethernegative transfers for Some countries, and positive transfersfor others. It is nevertheless significant that 27 developingcountries had negative transfers in 1985; with perhaps aslightly smaller number having negative transfers in 1986.
A negative transfer of financial resources is not alwaysburdensome. For example, in the case of the Republic ofKorea, the net transfer of resources was an outflow of over$7 billion in 1986. In part this represented large net interestpayments, but over $4 billion of the net transfer was a netcapital outflow, which took the form ofboth increases inforeign assets and net repayments of foreign debt. However,because of the Republic ofKorea's strong export performance in 1986, and a favourable development of its terms oftrade due especially to lower oil prices, import volume grewby 13 per cent and GDP by 12 per cent.
I For a formal derivation of the net financial transfer from standard macro-economic identities, see "Definition and measurement of the net transferof resources", World Economic Survey 1986 (United Nations publication, Sales No. E. 86 .11.C.l), annex III.
72
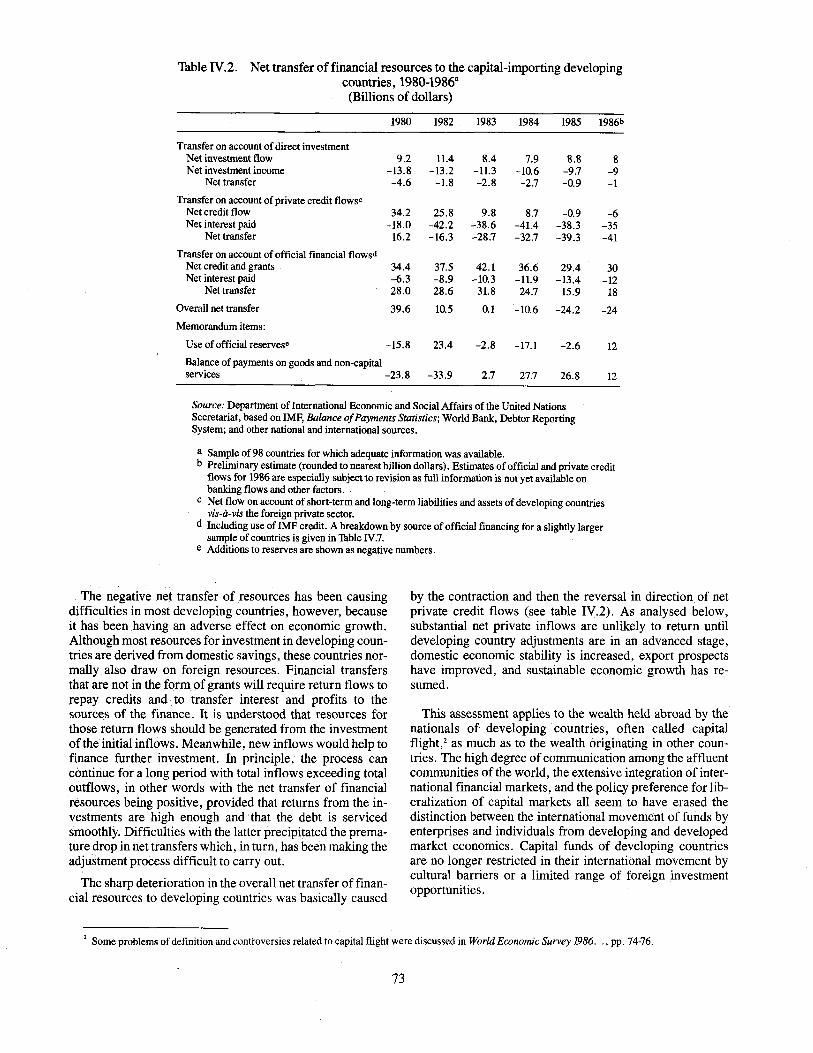
Table IV.2. Net transfer of financial resources to the capital-importing developingcountries, 1980-1986"(Billions of dollars)
1980 1982 1983 1984 1985 1986b
Transfer on account of direct investmentNet investment flow 9.2 11.4 8.4 7.9 8.8 8Net investment income -13.8 -13.2 -11.3 -10.6 -9.7 -9
Net transfer -4.6 -1.8 -2.8 -2.7 -0.9 -1
Transfer on account of private credit flowsc
Net credit flow 34.2 25.8 9.8 8.7 -0.9 -6Net interest paid -18.0 -42.2 -38.6 -41.4 -38.3 -35
Net transfer 16.2 -16.3 -28.7 -32.7 -39.3 -41
Transfer on account of official financial flowsd
Net credit and grants 34.4 37.5 42.1 36.6 29.4 30Net interest paid -6.3 -8.9 -10.3 -11.9 -13.4 -12
Net transfer 28.0 28.6 31.8 24.7 15.9 18
Overall net transfer 39.6 10.5 0.1 -10.6 -24.2 -24
Memorandum items:
Use of official reservese -15.8 23.4 -2.8 -17.1 -2.6 12
Balance of payments on goods and non-capitalservices -23.8 -33.9 2.7 27.7 26.8 12
Source: Department of International Economic and Social Affairs of the United NationsSecretariat, based on IMF, Balance ofPayments Statistics; World Bank, Debtor ReportingSystem; and other national and international sources.
a Sample of98 countries for which adequate information was available.b Preliminary estimate (rounded to nearest billion dollars). Estimates of official and private credit
flows for 1986 are especially subject to revision as full information is not yet available onbanking flows and other factors.
c Net flow on account of short-term and long-term liabilities and assets of developing countriesvis-a-vis the foreign private sector.
d Including use of IMF credit. A breakdown by source of official financing for a slightly largersample of countries is given in Thble IV.7.
e Additions to reserves are shown as negative numbers.
The negative net transfer of resources has been causingdifficulties in most developing countries, however, becauseit has been having an adverse effect on economic growth.Although most resources for investment in developing countries are derived from domestic savings, these countries normally also draw on foreign resources. Financial transfersthat are not in the form of grants will require return flows torepay credits and. to transfer interest and profits to thesources of the finance. It is understood that resources forthose return flows should be generated from the investmentofthe initial inflows. Meanwhile, new inflows would help tofinance further investment. In principle, the process cancOntinue for a long period with total inflows exceeding totaloutflows, in other words with the net transfer of financialresources being positive, provided that returns from the investments are high enough and that the debt is servicedsmoothly. Difficulties with the latter precipitated the premature drop in net transfers which, in turn, has been making theadjustment process difficult to carry out.
The sharp deterioration in the overall net transfer of financial resources to developing countries was basically caused
by the contraction and then the reversal in direction of netprivate credit flows (see table IV.2). As analysed below,substantial net private inflows are unlikely to return untildeveloping country adjustments are in an advanced stage,domestic economic stability is increased, export prospectshave improved, and sustainable economic growth has resumed.
This assessment applies to the wealth held abroad by thenationals of developing countries, often called capitalflight,2 as much as to the wealth originating in other countries. The high degree ofcommunication among the affluentcommunities of the world, the extensive integration ofinternational financial markets, and the polic.y preference for liberalization of capital markets all seem to have erased thedistinction between the international movement of funds byenterprises and individuals from developing and developedmarket economies. Capital funds of developing countriesare no longer restricted in their international movement bycultural barriers or a limited range of foreign investmentopportunities.
2 Some problems of definition and controversies related to capital flight were discussed in World Economic Survey 1986... , pp. 74-76.
73

Figure IV. 1. Net capital flows to capital-importing countries, 1978-1986"(Percentage of GOP)
8.....-------------------.......
6
4
2
, ,, , - DE8T-SERVICING
!!!.TE!.RU!.TEE. _
NOT INTERRUPTED
o-~--r--....--........--.--_,..-___.--r__~1978 1979 1980 1981 1982 1983 1984 1985 1985
Source: Department of International Economic and Social Affairs of the United NationsSecretariat, based on data and country classification of IMF, World Economic Outlook.
a Including official transfers, but excluding net changes in official reserves as a form of capitalflow.
Diversity of situations in capital-importing countries
One determinant of the ability of capital-importing countries to mobilize foreign financial resources is their recentdebt-servici.ng history. Figure IV.l summarizes the experience of two groupings of countries drawn from a largergrouping comprising the capital-importing developingcountries, certain smaller developed market economies andmember countries ofIMF with centrally planned economies(see also box IV.l).3
On the whole, capital-importing countries that had no interruption in their debt-servicing did not suffer a shock totheir net inflow of foreign capital. Since the late 1970s, asshown in figure IV.l, the range of fluctuation of the ratio ofnet capital inflows to the GDP of these countries as a wholehas been less than 2 percentage points. Foreign capital hasprovided 10 per cent of the financing of domestic investmenton average, a significant but not overriding contribution.The countries have also made substantial saving and investment efforts oftheir own, leading to a high overall ratio of
investment to GDP of 26 per cent or more from 1978 to1986. As expected when investment is consistently high, itwas accompanied by relatively rapid economic growth, averaging 5.5 per cent a year over the same period.
This experience is in marked contrast to that of the countries that had difficulties in servicing their foreign debt in theearly 1980s, defined as the countries that incurred arrearsduring 1983 and 1984 or rescheduled their debt at least oncefrom the end of 1982 to mid-1985. Capital inflows to thosecountries averaged 5 per cent of GDP from 1978 to 1981; butsince the onset of the debt crisis, the ratio has dropped, ending in the neighbourhood of 1.5 per cent in 1985 and 1986.Net foreign capital in flows accounted for a relatively highshare of investment in the first five years, a,:eraging over 19per cent, but that share was halved over the next few years.Investment also suffered, falling from a substantial annualaverage share of GOP of 25 per cent from 1978 to 1982, toan average of only 18 per cent since 1983. Not surprisingly,output growth suffered as well, averaging slightly over 2 percent for the whole period, or zero growth in per capitaterms.
3. The sample includes all countries covered by IMF, World Economic Outlook, except the groups there denoted "industrial countries" and "capitalexporting countries" . Data pertaining to the groups of countries shown in figure IV.l were derived from data ofIMF. Sixty-one countries were inthe subgroup whose debt servicing was interrupted and 63 countries were in the other subgroup.
74

Box IV. 1. External debt and economic adjustmentin Eastern Europe
100
400
500
orous adjustment programmes. Today, after considerableprogress in the intervening years, these countries remainvulnerable to debt difficulties.
The main policy goal of their early adjustment programmes had been to restrain absorption by holding down oreven slashing investment and to a lesser degree consumption, containing imports and promoting exports. As a result,the group's trade balance with market economies shiftedfrom a deficit of $4.0 billion in 1980 to a surplus of $7.0billion by 1984. External debt indicators for convertiblecurrency debt consequently improved that year (see the figure).
Trade balances with centrally planned economies improved at a slower rate, from a deficit equivalent to $1.8billion in 1980 to near balance by 1984. During that period,a continuing net capital inflow, especially from the SovietUnion, was obtained. That inflow, which helped to ease thetransition to a trade surplus with the market economies, rosefrom $1.9 billion in 1980 to $3.4 billion in 1981, droppingback to $1.8 billion in 1982. This was a major departurefrom earlier policy, in which trade balances within the groupof the European centrally planned economies were keptwithin narrow bounds and not accumulated significantlyover time. Indeed, special measures were taken to assist Poland in both its intra-regional and extra-regional paymentsrelations.
After several years ofausterity, Governments were able toease restraints on imports and consumption, and investmentslowly began to recover. But the dollar value of exports tothe market economies fell in 1985; it essentially stagnated in1986, when the terms oftrade also deteriorated. In essence,the limit to export expansion on the basis of existing capacities and economic structures had been reached. The protracted slow growth in investment had taken its toll on thegrowth of overall production capacity, while the social andeconomic scope for switching expenditure from domesticuse to exports had severely narrowed.
Once again, the region was confronted with a dilemma:cut absorption or increase external debt. Half the countrieschose the latter, borrowing and building up foreign exchange reserves in1985 and drawing on these and new facilities in 1986. As a result, the debt indicators worsenedappreciably in 1986. The dilemma thus persists.
A lasting solution requires greater growth in productioncapacity - and thus in investment - than is foreseen. The4.8 per cent growth in investment planned for Eastern Europe in 1987 is a sharp improvement over the 2.6 per centrealized in 1986. But more appears required to make up forthe slow growth in 1979-1984. If 1987 targets are realized,the group's investment levels will return to what they werein 1980, but still remain well below the peak of 1978.
200
300
o.l---..,----r----r----r~-----r--......,
'980 1981 1982 1983 1984 19$5 1986
Source: Department ofInternational Economic and Social Affairs of the UnitedNations Secretariat, based on national and international data.
Debt(right seale)
Indicators of the convertible-currency debt of EasternEurope" owed to market economies, 1980-1986(Percentage of convertible-currency exportsb
)
a Bulgaria, Czechoslovakia, German Democratic Republic, Hungary, Poland andRomania.
b As convertible-currency exports make up only part of exports to developingcountries, it is difficult to give a precise estimate of total convertible-currencyexports. The figure therefore shows debt and interest payments each relative toexports to developed market economies and to the latter plus developing countries,the actual ratios relative to convertible-currency exports lying in between (i.e., inthe shaded areas)
Interest(lert seale)
Ofthe six centrally planned economies of Eastern Europe,Poland and Romania have required multiple reschedulingsin the 1980s of international commercial bank debt and official debt owed to developed market economies. Both countries had confronted sudden limitations of credit from themarket economies at the beginning of the decade and introduced sharp adjustment programmes in response. The othercountries of the region, recognizing that adhering to plansfor growth of output required net financial inflows whoseavailability was suddenly less assured, also introduced rig-
75

Figure IV.2. Net capital flow of the Federal Republic of Germany, Japan and theUnited States, 1978-1986"
(Percentage of Gnp)
6 ........------------------..
4
., .......................
COUNTRIES::d~:"RTbli,:-or-ge~~Japan
.. '......... '
2
-2
-4
o+---,f'-'---......~~~~----------I
-6~-.....,.--..-- ......-_--..._-__--_-~1978 1979 1980 1981 1982 1983 1984 1985 1986
United States
Source: Department ofInternational Economic and Social Affairs of the United NationsSecretariat, based on data ofIMF and national authorities.
a Net inflow (positive) or outflow (negative) of all assets and claims, including official reserveassets.
Changing capital flows of the United States
In marked contrast to many other capital-importing countries, net capital flows into the United States reached a newpeak in 1986. So, too, did net outflows from the FederalRepublic of Germany and Japan. The net inflow to theUnited States well exceeded 3 per cent of its GNP, capping asteady increase that began in 1983. The Federal Republic ofGermany's net capital outflow almost doubled in 1986 as itapproached 4 per cent of GNp, while that of Japan exceeded4 per cent for the first time (see figure IV.2). The UnitedStates inflow is expected first to widen in 1987 and then tobegin narrowing in 1988. The surpluses of Japan and theFederal Republic ofGermany are expected to begin narrowing in 1987. In any event, all the net flows are forecast toremain substantial over the medium run and a primarysource of the inflows to the United States would continue tobe those outflows from the Federal Republic of Germanyand Japan"
The United States has been a favoured placement for international funds, especially since 1984. The attraction has ap-
plied both to United States funds that might otherwise havebeen lent overseas and to foreign funds that are placed in theUnited States market, as opposed to offshore dollar investments or investments in other currencies. Increasingly, thenet flows have come from Japan, other Asian sources, especially in 1986, and from the European Economic Community, particularly the Federal Republic of Germany and theUnited Kingdom (see table IV.3). 5
A new feature in 1986 was that net private sector flows tothe United States were $11 billion less than in 1985. Total netcredit flows rose $24 billion, however, to $147 billion forthe year. These extra funds came from foreign official inflows, virtually all of which were used to purchase UnitedStates Treasury securities. The flows were concentrated inthe second and third quarter of the year when industrialcountries attempted to slow the fall in the dollar exchangerate through intervention activities.6 As a result, flows fromGovernments accounted for over one fifth of the net creditflows to the United States in 1986.
United States private lending abroad rebounded to $66 bil-
• In particular, the baseline projection of Project LINK foresees net capital flows to the United States of $120 billion in 1990, while net outflowsfrom Japan would be $55 billion, and the net outflow from the Federal Republic of Germany would fall to $13 billion (forecast presented at ameeting of Project LINK, United Nations Headquarters, 9 March 1987).
5 The integration of EEC financial markets makes it necessary to present data in table IV.3 for the Community as a whole rather than for individualcountries. For example, substantial investments of the Federal Republic of Germany are routinely routed through Luxembourg and England.Even so, credit flows ofEEC, Japan and others that are routed through offshore centres are not grouped with their original sources. Nationallyidentified flows in table IV.3 thus understate the actual flows.
6 United States Department of Commerce, "U.S. international transactions, fourth quarter and year 1986", Survey ofCurrent Business, March1987.
76

Table IV.3. Net international credit flows to the United States, 1980-1986"(Billions of dollars)
Partner country or country group 1980 1982 1983 1984 1985 1986b
Canada -6.0 -1.0 0.5 3.0 7.2 7.5Japan 8.3 13.9 19.3 33.1 45.0 5304European Economic Community -8.4 -13.1 -2.0 10.2 25.1 26.0Other developed market economies" 1.9 0.5 1.1 ~0.2 2.1 1.8USSR and Eastern Europe -3.1 -3.0 -1.7 -2.1 -1.4 -0.3OPEC countries 33.9 lOA 8.7 1I.9 9.0 8.0Offshore banking centres and other developing
countriesd -19.3 -9.8 lOA 32.3 3504 50.3
Total 7.4 -2.1 36.2 88.1 122.4 146.6
Memorandum items
Private and public sector flowsForeign official 15.. 5 3.6 6.0 3.0 -1.3 33.4United States Government" -5.2 -6.1 -5.0 -5.5 -2.8 -2.0Net private -2.9 0.5 35.3 90.6 126.6 115.2
Source: Department ofInternational Economic and Social Affairs of the United NationsSecretariat, based on United States Department of Commerce, Survey ofCurrent Business,various issues.
a Excluding transactions in United States official reserve assets and direct investment; including astatistical discrepancy in United States payments data, which incorporate, inter alia, transactionswith third countries in United States liabilities and assets. Positive numbers in the table indicatenet inflows; negative signs indicate net outflows.
b Including preliminary fourth quarter data.c Including smaller amounts for international organizations, United States-affJ.Iiated shipping
companies operating under certain foreign flags and other unallocated flows.d Including China.e Excluding reserves.
lion in 1986 from only $7 billion in 1985. About 85 per centof those credit outflows comprised bank lending, especiallyby Japanese banks that were funding international dollarloans in part with funds raised in the United States market bytheir branches in that country and United States-ownedbanks that were financing European securities operationsfrom United States resources.? In 1985, foreign lending bybanks in the United States was not even $1 billion. In 1982 ithad been $111 billion. That decline in the outflow of fundshad freed resources to pay for rapidly growing imports whenthe outflow of funds had freed resources to pay for rapidlygrowing imports when the United States current accountdeficit first swelled. The return to high levels of gross lending abroad in 1986 eliminated that source of financing andinstead pushed up gross United States foreign borrowing requirements significantly beyond the net borrowing shown intable IV.3.
Measured total borrowing of $188 billion was mainly supplied through three channels. First, foreign borrowing bybanks provided over 40 per cent of the total. Secondly, foreign purchases of United States Treasury securities accounted for about another 20 per cent. Finally, almost 40 percent of the gross measured foreign credit inflow was metthrough foreign purchases of other United States securities.
Out of a total inflow of $71 billion to buy those latter securities, 25 per cent were for purchases of corporate stocks andthe rest for bonds. In both cases, Western European buyerswere dominant (54 per cent of foreign purchases of stocksand 74 per cent of bonds), although Japanese buyers werealso important (19 per cent of foreign purchases of bothtypes of security). Whereas European buyers haveJong beenactive in United States securities markets, as have Canadianbuyers, substantial Japanese activity is a relatively new phenomenon, particularly in the equity markets.
The pattern shown by gross capital inflows to the UnitedStates in 1986 may typify the composition of inflows for therest of the decade that is, heavily oriented towards portfolioinvestments. What is not yet known is whether such investments will be more or less volatile than traditional international banking flows or the interaffiliate financing oftransnational corporations. Foreign investors, especiallyJapanese investors as discussed below, have apparently beeninterested in diversifying their portfolios into United Statesequity shares and bonds, despite exchange rate losses due tothe fall of the dollar against the yen and several Europeancurrencies. For short-term placements, exchange-ratelosses can be hedged on the forward or futures market.Funds placed in the market for a longer period, however, are
7 Ibid. Data presented on United States financial inflows and outflows are as measured in United States balance·of~payments statistics. However,the large statistical discrepancy in United States payments data averaging $24 billion in the 1980s is thought to significantly involve private financial flows and their earnings, which means that measured flows are incomplete.
77

exposed to exchange-rate loss, as was again the case in thefirst quarter of 1987.
The answer to what happens when the United States bullmarket ends probably depends heavily on what is happeningat that time in other markets in the United States and elsewhere. At the present time, it can only be said that a certainvulnerability exists in the rapidly growing external financialclaims on the United States economy. And although foreignclaims of the United States are also growing, the net international investment position of that country including directinvestment is becoming substantially negative; more thandoubling in 1986 to the neighbourhood of $250 billion. 8 Inthis sense, the United States has become the world's largestnet debtor, although its gross debt the conventional measureof indebtedness usually cited in discussions of other debtorcountries was far higher, on the order of $920 billion at theend of 1986.
A large and rapidly growing pool of foreign-ownedUnited States assets is thus being held by large numbers ofinvestors in highly marketable and liquid form. Despite thelarge amount of outstanding foreign indebtedness, however,
the United States would not face a debt crisis in the samesense as already faced by the developing countries. Indeed,the debt is almost entirely denominated in domestic currency. The question at issue is the exchange value of thedollar payments and United States interest rates relative tothose abroad. Reserve currency status as enjoyed by theUnited States is predicated on confidence in the purchasingpower of the currency. Sharp and sudden movements of dollar exchange rates as in the first quarter of 1987 alreadyseem to indicate substantial uncertainty on the part of holders of dollar assets. A loss of confidence of the foreign investors in the value of those assets measured in their homecurrencies could destabilize international foreign exchangetrading and provoke a rapid further fall of the dollar exchange rate. In response, United States monetary policymight tighten to raise interest rates relative to those abroad,with contractionary effects on total demand, leading possibly to a recession. Confidence would be raised, however, byshowing progress in correcting the full pattern ofimbalancesin international payments and fiscal positions, which emphasizes the importance of timely implementation of the coordinated adjustment measures derived in the analysispresented in chapter II.
Composition of international financial flows
While it is expected that the international payments imbalances among major developed market economies will bereduced, though at a slow pace, it is uncertain whether adequate net financial flows will be redirected to the other capital-importing countries of the world. If not, the worldeconomy may remain trapped in a path of undesirably slowgrowth of trade and output. It was argued in chapter II thatsignificantly rising real income on a world-wide basis presupposes Qomestic macro-economic and structural adjustment in developed and developing countries and areinvigorated growth of world trade. International financialflows are needed to support those developments. Yet it isdoubtful that the institutional channels through which suchflows were made in the past will again be open to the samedegree to many capital-importing developing countries.
Portfolio investment: the emergence of Japan
Portfolio investment (equity shares, bonds and other securities) has recently served as a major form of balance-ofpayments financing for the United States. On a smallerscale, net purchases of securities by the capital-surplus developing countries in the years of high petroleum prices andcurrent account surpluses were followed by net reflows ofportfolio funds since 1983, as foreign securities were soldand bond issues of the capital-surplus countries were floated
internationally. Capital-importing developing countries,however, have not generally received significant inflows ofportfolio investment. The 15 countries on which the discussion of the debt crisis in middle-income countries has focused had some success in tapping such funds in theearly1980s, but there was a net reversal of those flows aftertheir debt crises began (see table IVA).
The growth of international flows of portfolio investmentamong developed market economies has well exceeded theincreases expected solely on the basis of changing currentaccount balances. Individuals and institutions are now relying more heavily on securities as a form in which to holdinternational wealth and borrow foreign resouces. In 1986,for example, bonds accounted for over 60 per cent of netinternational bank and bond financing of the world, compared with under 40 per cent in 1982.9 One reason is that thesecurities markets ofthe major developed market economiesare increasingly being liberalized with respect to the instruments that can be floated, issuance procedures, interest ratesand exchange controls. 10 In addition, innovations in securities financing have created a broader and more widely available selection of financial instruments. 11 The internationalinvestment-banking industry continues to generate a virtualflood of innovations in securities, many individually designed to meet the needs of one client or another. In 1986,
• Calculated as end-1985 net negative position of $107 billion plus the net financing of the current account deficit of $141 billion. More completefigures, including the effects of changes in exchange rates and the market prices of securities, are usually published by the United States Department of Commerce in the June issue of Survey ofCurrent Business.
9 These estimates are stated so as to take account of increases in coverage of banking data over time and estimates of double-counting of bank andbond financing, bond redemptions and repurchases. Data for 1986 pertain to first-half year (see Bank for International Settlements, InternationalBanking and Financial Market Developments, October 1986, p. 21).
JO See IMF, International Capital Markets: Developments and Prospects (Washington, D.C., December 1986), pp. 32-38.II See "The changing institutional character of international financial markets in the 1980s", in Supplement to World Economic Survey 1985-1986
(United Nations publication, Sales No. E.86.II.C.2).
78
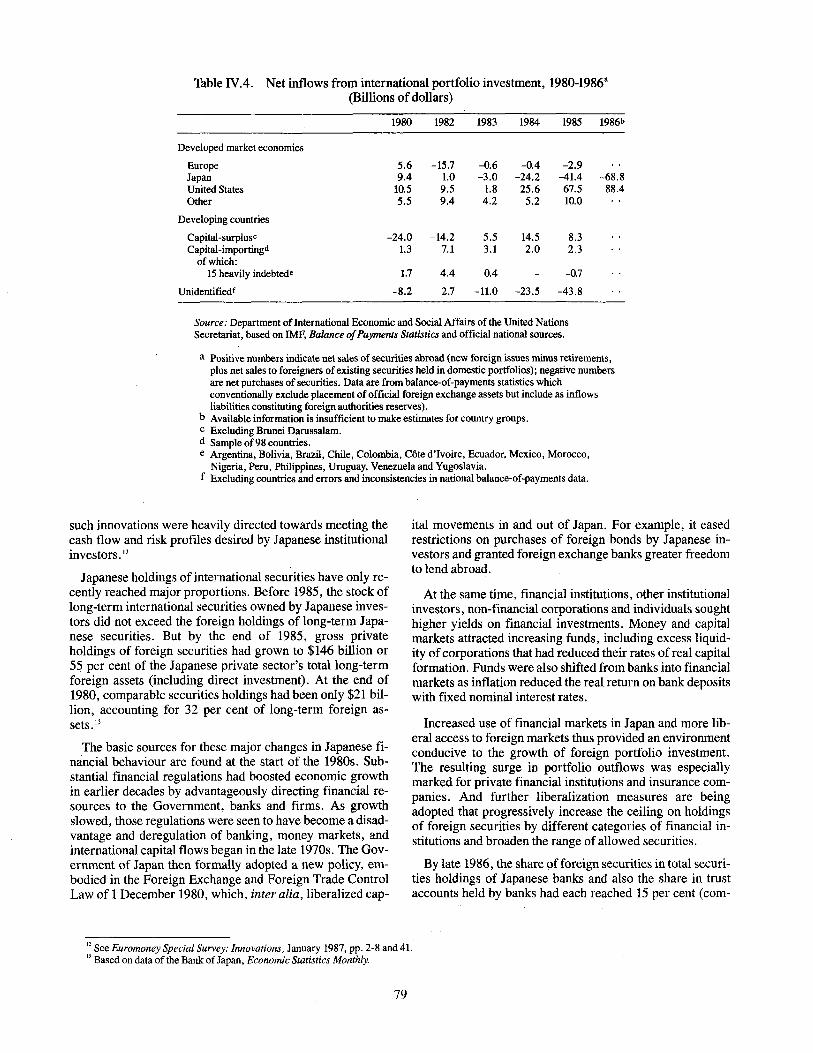
Table IVA. Net inflows from international portfolio investment, 1980-1986"(Billions of dollars)
1980 1982 1983 1984 1985 1986b
Developed market economies
Europe 5.6 -15.7 -0.6 -0.4 -2.9Japan 9.4 1.0 -3.0 -24.2 -41.4 -68.8United States 10.5 9.5 1.8 25.6 67.5 88.4Other 5.5 9.4 4.2 5.2 10.0
Developing countries
Capital-surplusc -24.0 -14.2 5.5 14.5 8.3Capital-importingd 1.3 7.1 3.1 2.0 2.3
of which:15 heavily indebtede 1.7 4.4 0.4 -0.7
Unidentifiedf -8.2 2.7 -11.0 -23.5 -43.8
Source: Department ofInternationai Economic and Social Affairs of the United NationsSecretariat, based on IMF, Balance ofPayments Statistics and official national sources.
a Positive numbers indicate net sales of securities abroad (new foreign issues minus retirements,plus net sales to foreigners of existing securities held in domestic portfolios); negative numbersare net purchases of securities. Data are from balance-of-payments statistics whichconventionally exclude placement of official foreign exchange assets but include as inflowsliabilities constituting foreign authorities reserves).
b Available information is insufficient to make estimates for country groups.c Excluding Brunei Darussalam.d Sample of 98 countries.e Argentina, Bolivia, Brazil, Chile, Colombia, Cote d'Ivoire, Ecuador, Mexico, Morocco,
Nigeria, Peru, Philippines, Uruguay, Venezuela and Yugoslavia.f Excluding countries and errors and inconsistencies in national balance-of-payments data.
such innovations were heavily directed towards meeting thecash flow and risk profiles desired by Japanese institutionalinvestors. 12
Japanese holdings of international securities have only recently reached major proportions. Before 1985, the stock oflong-term international securities owned by Japanese investors did not exceed the foreign holdings of long-term Japanese securities. But by the end of 1985, gross privateholdings of foreign securities had grown to $146 billion or55 per cent of the Japanese private sector's total long-termforeign assets (including direct investment). At the end of1980, comparable securities holdings had been only $21 billion, accounting for 32 per cent of long-term foreign assetsY
The basic sources for these major changes in Japanese financial behaviour are found at the start of the 1980s. Substantial financial regulations had boosted economic growthin earlier decades by advantageously directing financial resources to the Government, banks and firms. As growthslowed, those regulations were seen to have become a disadvantage and deregulation of banking, money markets, andinternational capital flows began in the late 1970s. The Government of Japan then formally adopted a new policy, embodied in the Foreign Exchange and Foreign Trade ControlLaw of 1 December 1980, which, inter alia, liberalized cap-
ital movements in and out of Japan. For example, it easedrestrictions on purchases of foreign bonds by Japanese investors and granted foreign exchange banks greater freedomto lend abroad.
At the same time, financial institutions, other institutionalinvestors, non-financial corporations and individuals soughthigher yields on financial investments. Money and capitalmarkets attracted increasing funds, including excess liquidity ofcorporations that had reduced their rates of real capitalformation. Funds were also shifted from banks into financialmarkets as inflation reduced the real return on bank depositswith fixed nominal interest rates.
Increased use of financial markets in Japan and more liberal access to foreign markets thus provided an environmentconducive to the growth of foreign portfolio investment.The resulting surge in portfolio outflows was especiallymarked for private financial institutions and insurance companies. And further liberalization measures are beingadopted that progressively increase the ceiling on holdingsof foreign securities by different categories of financial institutions and broaden the range of allowed securities.
By late 1986, the share offoreign securities in total securities holdings of Japanese banks and also the share in trustaccounts held by banks had each reached 15 per cent (com-
12 See Euromoney Special Survey: Innovations, January 1987, pp. 2-8 and 41.13 Based on data of the Bank of Japan, Economic Statistics Monthly.
79

pared with 2.5 per cent in 1980). The comparable holdingsoflife insurance companies reached 25 per cent and those ofother financial institutions almost 20 per cent. Indeed, anactive market in United States Treasury bonds has arisen inTokyo itself, and the yen-denominated Euro-bond market with no exchange rate risk for Japanese buyers - growsapace.
The growth of international securities investing by Japanand analogous growth in the demand for international securities elsewhere are increasing the flexibility of world finance as they increase the diversity offinancial instruments.In another sense, however, external portfolio investmentsare a relatively narrow mode of financing, as they channelresources almost completely to developed countries. To attract more of these funds into placements in developingcountries, several developing country Governments andmultilateral institutions have recently stepped up financialexperimentation, seeking, for example, to deepen local capital markets and create mutual funds of developing countrysecurities that could be sold internationally. 14
For countries with a capacity to absorb additional debt,capitalizing on the securitization trend in international finance may be a key to channelling inflows of private financial resources over the medium term at least - provided themarket finds those countries to be acceptable credit risks.For borrowers able to carry additional debt but lacking direct access to securities finance, new financial flows will bemore dependent on the intermediation of the World Bankand other multilateral institutions. The latter borrow undertheir own name in the securities markets by issuing bonds,the proceeds of which are lent to member countries. Thesecountries usually cannot float bond issues of their own andcertainly not on the terms realized by the multilateral institutions. This emphasizes the importance of expanding thelending capacity of these institutions by increasing their owncapital.
The changing nature of international banking
Net international bank lending to the capital-importing developing countries totalled -$4.5 billion in the first threequarters of 1986. Although a certain portion of this represented a writing-down on the books of banks of the value ofdebt to a few countries or sales of such debt to non-bankbuyers, it also represented repayments of principal on bankloans in excess of new bank lending. During the same period, the capital-importing countries reduced their deposits inthe same banks by $10.9 billion, representing what might betermed a disengagement of the banks and the developingcountries of $15.4 billion. 15 On a comparable basis, lending
to Eastern Europe (excluding the Soviet Union) stagnated,while deposits were drawn down by $1.4 billion. At thesame time, total net international bank lending grew by $110billion.
These developments do not seem to have been an aberration but a continuation of recent trends. The partial exception was a temporary jump in lending to Eastern Europe of$1.9 billion in 1985 (see box IV.1). In 1984, Eastern European bank debt had contracted by $1.6 billion. For the capital-importing developing countries as a whole, bank lending(net of amortization) was of the order of $40 billion a yearbefore 1982, but it fell to $9 billion in 1984, $8 billion in1985, and turned negative in 1986.
Global bank lending continued to grow throughout theperiod, which means that the lending has been increasinglyconcentrated on borrowers in the major financial marketsand, in particular, United States borrowers. The flow oflending from international banks to the United Statesreached $36 billion in 1984, $58 billion in 1985, and $47billion in the first three quarters of 1986. 16
These lending trends have persisted long enough to havechanged the composition of the world stock of internationalbank debt. From the late 1970s until 1984, the developingcountries accounted for about 20 per cent of total international indebtedness to banks. By September 1986, theirshare had fallen to 16 per cent. The decline was concentratedin 15 high-debt developing countries, but the share of otherdeveloping countries also fell. So, too, has the share of thecentrally planned economies (seefigure IV.3).
The changing distribution of international bank debtseems to reflect a sharply different emphasis in the businessstrategy ofthe banks compared with that of the early 1980s.At that time, banks were heavily engaged in directly recycling financial resources from capital-exporting countries tocapital-importing countries. The standard instrument was amulti-bank arrangement financed out of Euro-currency deposits, although domestic currency loans to foreign borrowers also played a role. Together, these credit facilitiesaccounted for over half of the total of international bank andbond financing arrangements. However, by 1984, this formof financing represented only one quarter of the total and in1986 it was only 18 per cent.
Instead, banks have become ever more involved in theinternational securities markets discussed above. Almosthalf the gross international lending arrangements set up bybanks in 1984 and 1985 were not even loans but back-upfacilities for various international securities transactions, upfrom only 5 per cent in 1982. 17 Banks have also been major
14 See IMF, International Capital Markets .. . , pp. 72-73." Data are quarterly flows at constant exchange rates and pertain to all capital-importing developing countries" excluding offshore financial centres
(derived from BIS, International Banking Developments, January 1987)."The resurgence in 1986 of overseas lending by banks located in the United States appreciably slowed the growth of net international claims of
banks on the United States economy. The latter fell from an increase of $34 billion in 1984, to one of $24 billion in 1985 and to one of only $5billion in the fIrst three quarters of 1986.
17 Arrangement of such facilities may have peaked in 1985 as the newly emergent Euro-commercial paper market, which does not require back-ups,has offered new competition. As a result, the facilities arranged by banks fell to 36 per cent of international bank lending arranged in 1986 (data ofOECD, Financial Statistics Monthly, January 1987).
80

Figure IV.3. World distribution of indebtedness to international banks, 1978-1986(Percentage share at year-end")
100lgal
80
70
60
50
40
Countries
Iffi 15 high debt developingQ!l Other developing~ Centrally plannedrza United StatesCJ Other
Source: Department ofInternational Economic and Social Affairs of the United NationsSecretariat, based on data ofthe Bank for International Settlements.
a End of September 1986.
participants in the securities markets themselves, engagingheavily in swaps, options and forward rate agreements involving instruments with different currency and interest-ratecharacteristics. 18 As more and more of their income isearned in securities activities, international banks are becoming more like investment banks than pure commercialbanks.
While this development has important implications for theeffectiveness of monetary policy in the major internationalfinancial centres and for the prudent supervision of banksthemselves,19 it also has major implications for the interna-
tional flow offinancial resources. In 1982, developing countries accounted for one quarter of the gross value of fundsarranged on international banking and bond markets. In1986, they accounted for only 6 per cent (see table IV.S).Developing countries were least active in the securities markets, where broad market familiarity and a high degree ofinvestor confidence have been prerequisites for successfulborrowing. Instead, developing countries were concentratedin syndicated bank borrowing, Table IV.S. Developingcountries were least active in the securities markets, wherebroad market familiarity and a high degree of investor confidence have been prerequisites for successful borrowing. In-
" See BIS, Recent Innovations in International Banking (Basle, April 1986), prepared by a study group established by the central banks of the groupof ten countries.
19 See BIS, Recent Innovations ... and DEeD, "Prudential supervision in banking," Financial Market Trends, No. 35 (November 1986), pp. 13-23.
81

Table IV.5. Gross borrowing arrangements on international capital markets by thedeveloping countries, 1980-1986
(Billions of dollars)
1980 1982 1983 1984 1985 1986
Bank credits arranged 50.5 41.4 32.3 29.3 20.3 16.1of which:
Involuntary lending" 13.9 11.1 7.1Bonds 4.2 4.0 2.6 3.5 7.1 3.1
Total financing arranged 54.2 45.3 34.9 32.8 27.4 19.2
Memorandum items:Share of developing countries in world total
(percentage)Bank credits 33.9 39.9 40.1 25.0 17.4 17.6Total financing 27.0 25.3 22.1 14.3 9.6 6.1
Source: Data of OEDC, Financial Market Statistics, re-aggregated according to World EconomicSurvey country grouping (forced lending, according to IMF enumeration of debt-restructuringagreements, as published to International Capital Markets: Development and Prospects,December 1986).
a "New money" arranged as part of agreements to restructure commercial bank debt. Althoughnew money for Mexico ($6 billion) and Nigeria ($0.3 billion) was negotiated in 1986,arrangements were not completed and no commitments were announced before the end of theyear.
stead, developing countries were concentrated in syndicatedbank borrowing, where they have taken a declining share ofa declining market. Indeed, a substantial portion of thecredits arranged since 1983 were required of the banks in theform of "new money" components of debt-restructuringagreements in order to help service already outstandingdebt. Even restricting attention to countries that have not hadmajor debt-servicing difficulties and that have the capacityto carry additional foreign debt, the aggregate flow of loanable resources that might be intermediated directly by theinternational commercial banks does not seem set for a major expansion. Should those countries wish or need to substantially increase their rate of foreign borrowing, .theymight have to mobilize foreign resources through otherchannels. As noted previously, securities markets might beanoption for some of the countries, but countries with lowaverage income levels are unlikely to be able to tap suchmarkets.
The path of direct investment
Foreign direct investment has often significantly increased the capacity of host countries to produce tradablegoods; but international capital movements to finance directinvestment have not generally had a dominant impact on thebalance of payments of major economies or on the conventional statistical aggregates of smaller economies. Net direct
investment flows have recently made a moderate contribution in aggregate to the net capital inflows of the capitalimporting developing countries, averaging about $8 billiona year after the onset of the debt crisis of 1982 (see tableIV.6). The flows appear to have been deterred by overalleconomic slow-downs associated with balance-of-paymentsand domestic stabilization in host countries. In particular,net flows since 1983 to the 15 high-debt countries have averaged less than 60 per cent of the average flow from 1980 to1982.
Major changes have also occurred in the flows of directinvestment registered by developed market economies.20
While there has been an increase in the measured net outflow from several countries, that of Japan has been especially marked and is likely to be sustained. Indeed, aninfluential report by a panel of advisers to the Prime Minister proposed a doubling over the next seven years of netdirect investment as a share of Japan's gross domestic product. 21
Japan's foreign direct investment outflows have beengrowing rapidly since approval requirements for direct investment were removed by the Foreign Exchange and Foreign Trade Control Law of 1980. Since then, Japanese directinvestors only need to notify the Government of their investments. Meanwhile, foreign direct investment in Japan hasremained marginal, generally staying below $500 million ayear.
20 Differences in definition, coverage and valuation in national data on direct investment require that extreme caution be used in makingcross-country comparisons from table IV.6. The extent of the inconsistency in reported data is indicated by the wide swings in unidentified flowsshown in the table (see also the report of the Secretary-General on data on foreign direct investment, including capital inflows and outflows, andother aspects ofthe activities of transnational corporations (E/C.1O/1986/3), submitted to the Commission on Transnational Corporations at itstwelfth session.
21 See "Report of the Advisory Group on Economic Structural Adjustment for International Harmony" (Maekawa Report), April 1986.
82
TableIV.6. Net direct investment flows, 1980-1986"(Billions ofdollars)
1980 1982 1983 1984 1985 1986b
Developed market economies
Japan -2.1 -4.1 -3.2 -6.0 -5.8 -11.6
Major European sourcesGermany, Federal Republic of -3.9 -2.0 -1.4 -2.2 -2.9 -3.5Netherlands -3.3 -1.6 -2.2 -3.4 ~2.7 -2.0United Kingdom -1.2 -2.4 -2.7 -7.4 -4.7 -5.7
North AmericaCanada -3.2 -2.4 -3.5 -1.3 -6.0 -0.5United States -2.4 16.3 11.5 21.4 -0.3 -6.3
Other 3.7 2.9 3.3 -1.4 -2.2
Developing countries
Capital-surplusc -0.4 9.2 5.6 5.5 2.2 2.0Capital-importingd 9.2 11.4 8.4 7.9 8.8 8.0
of which:15 heavily indebted 4.6 6.1 3.4 3.2 4.1 3.0
Unidentifiede 3.5 -27.5 -15.7 -13.2 13.6
Source: Department of International Economic and Social Affairs of the United NationsSecretariat, based on IMF, Balance ofPayments Statistics and official national and other sources.
a Net inflows are shown as positive numbers, net outflows as negative numbers. Significantdifferences among national reporting practices require extreme caution in making cross-countrycomparisons of the value of direct investment flows.
b Data of developed market economies partly estimated; preliminary estimates for developingcountries.
c Excluding Brunei Darussalam.d Sample of98 countries.e Excluding countries and errors and inconsistencies in national balance-of-payments data.
The outflow of Japanese direct investment has beenstrongly linked to Japan's trade performance, in particular,Japan's share of host country imports.22 Much of Japaneseinvestment has been for export substitution or the furthermanufacturing of Japanese intermediate goods for re-export. This notwithstanding, only 29 per cent of Japan's direct investment has been in manufacturing itself (measuredin terms of the total value of investment notifications received since 1951, which excludes increases due to reinvestment of profits). The share of manufacturing is alsodeclining, accounting for only 19 per cent of new investments in fiscal year 1985/86. The share of mining has declined even faster; although accounting for 14 per cent ofaccumulated investment since 1951, it was only 5 per cent ofthe total in 1985/86. The major growth has been in investment in services, especially financial services. Accountingfor only 13 per cent of total investment since 1951, financialsector direct investment was 21 per cent of the total in 1984/85 and 31 per cent in 1985/86.
Having thus achieved a strong overseas presence-andwith increased lending from Tokyo itself-Japan has become the world's largest international banking nation. Itsbanks held over $1 trillion in international assets in September 1986 or almost one third of the global total. By comparison, the second largest banking nation of the world, theUnited States, held less than 20 per cent and the third, theFederal Republic of Germany, held only 8 per cent. Twoyears earlier, Japan had been in second place, close behindthe United States, whose banks then held more than onequarter of the world's international bank assets. 23 Similarly,Japanese investment banks have taken an increasing role inworld securities markets; for example, four Japanese financial institutions were among the top 15 Eurobond investmenthouses in 1986, lead managing over 20 per cent of all issues,double their share in 1985.24
The recent growth of Japanese direct investment has beenparticularly concentrated in the United States, accountingfor 44 per cent of the value of Japanese investment notifica-
22 Econometrically estimated equations suggest that relative cost factors have also been important determinants, particularly the cost of raw materialimports to Japan for investment in North America and relative wage rates, especially for investment in Asia (see Japan Economic PlanningAgency, Economic White Paper 1986. pp. 200-201).
23 BIS, International Banking Developments, January 1987, p. 15. Japanese banks became especially prominent in 1986 as underwriters of noteissuance facilities, accounting for 7 of the top 15 banks in this field. Only 2 were in the top 15 in 1985, notwithstanding the fact that total activityin this market segment had been higher that year (based on data compiled by Euromoney).
24 Euromoney, February 1987, p. 9.
83

tions during fiscal year 1985/86, compared with 33 per centthe year before. Market-related factors have in part determined the flows to the United States-for example, the attraction to financial sector investments or the effect of therising yen in reducing the competitiveness of Japanese manufactured exports. However, policy-related factors havealso played a role. As discussed in chapter III, there havebeen responses to pressures for protectionist limitationsagainst imports from Japan and other major suppliers. Direct investments may be made in order to jump such barriersor prospective barriers. The most fully developed exampleis the automobiles industry, where Japanese companies haveestablished co-operative ventures with every Americanmanufacturer and have set up manufacturing facilities oftheir own in the United States. Japanese companies that produce automobile components are also undertaking direct investments in the United States. 25
As the fastest growing source of direct investment, theJapanese share of the stock of total foreign direct investmentin the United States rose from under 6 per cent in 1980 toover 10 per cent at mid-decade. The total inflows to theUnited States from all sources, however, after growing rapidly through the 1970s and up to 1981, when they reached$25 billion, have since fluctuated in a range of $12 billion to$26 billion a year, the latter being the inflow in 1986.
Meanwhile, United States direct investment abroad, afteran uncharacteristic period of very low or negative outflowsfrom 1982 to 1984, rose to $19 billion in 1985 and then to$32 billion in 1986, fuelled especially by reinvested overseas earnings and loans from United States parents to overseas affiliates, the latter concentrated in the services sector.As a result, far from being a net source of financing for theUnited States balance-of-payments deficit on current account, net direct investment added $6 billion to the UnitedStates net foreign borrowing needs in 1986 that were discussed above.
About one tenth of the 1986 outflow of United States direct investment went to developing countries, as did perhaps15 per cent of Japanese direct investment in fiscal year 1985/86 (in both cases, excluding investments in tax-haven countries). Comparable figures apply to other sources of directinvestment outflow. Policy makers believe that these flowscan be increased through new multilateral efforts that wouldsupplement existing schemes to promote direct investmentin developing countries. Thus, to complement national facilities of developed market economies that insure direct investments against non-commercial risks (e.g.,expropriation, convertibility and transfer abroad of profits
and capital, and breach of contract), the World Bank developed the Multilateral Investment Guarantee Agency(MIGA). When it becomes operational, MIGA will provideguarantees, insurance and reinsurance of direct investmentsalong with technical and advisory services to host countryGovernments for promoting investment. The latter wouldsupplement advisory services and research now provided bythe United Nations through its Centre on Transnational Corporations. In addition, the International Finance Corporation (IFC) of the World Bank Group introduced a newservice in 1986 designed to overcome investor hesitancy bytransferring full investment risk from the investor to IFCuntil the investment matures. 26
Aided by such new initiatives, developing countries willcontinue to arrange direct investments in particular projectsor sectors, perhaps at a higher aggregate rate than in therecent past. Nevertheless, it will be difficult - as it hasalways been - to mobilize large volumes of direct investment when countries are in the midst of economic adjustment difficulties. For general balance-of-payments needs,other forms of financing must first be applied as catalysts foreconomic recovery.
Official finance for adjustment and growth of developingcountries
In the entire post-war period, official financial flows haveplayed a substantial role in financing balance-of-paymentsadjustment and economic growth in the developing countries. In the 1970s, parts ofboth of those roles were transferred to private sector financing, especially internationalbanking. The preceding review of recent developments ininternational finance indicates that private resources havenot recently made a major contribution to financing adjustment processes in developing countries.
Against those developments in private sector flows mustbe set the trend in official finance. Official grants virtuallystagnated over the first half of the 1980s, although they roseat mid-decade in response to the food crisis in Africa. Theperformance of official lending, however, has been disappointing. The net transfer of resources associated with officiallending has declined sharply in nomin~ dollar terms, asnew lending did not keep pace with growing principal andinterest payments. From over $20 billion in 1983, these netresource transfers fell to $2 billion in 1985, the last year forwhich reasonably complete data are available (see tableIV.7). The sum of all bilateral transfers arising from officiallending actually became negative in 1985, owing to the especially marked decline in new official export credits.27 Bilat-
" See the report of the Secretary-General on recent developments related to transnational corporations and international economic relations (EIC.101l987/2), paras. 13-25, submitted to the Commission on Transnational Corporations at its thirteenth session
2. Denoted GRIP (Guaranteed Recovery of Investment Principal), the programme eliminates the risk of capital loss by having the irvestor lend itsinvestment funds to IFC which itself makes the equity investment in the project. Later, the original investor either recovers his loan or takes overthe equity stake ofIFC if the project is a success. Capital gains and dividends would be split. '
27 The decline in imports caused by balance-of-payments restrictions was one reason for the decline in official export credit financing, which extends to export credit insurance as well as the direct lending included in table fV.7. Another reason for the decline is the standard cut-off of newcredit as a result of debt-servicing difficulties and debt-restructuring agreements. For an analysis of issues in restoring official export creditcover, see "Trade financing for developing countries: some aspects of current difficulties and policy responses" (TD/B/C.31212, II July 1986)study by the UNCTAD secretariat for the Committee on Invisibles and Financing Related to Trade. ' . .
84

Table IV.7. Net transfer of official financial resources to the capital-importingdeveloping countries, 1980-1985"
(Billions of dollars)
1980 1981 1982 1983 1984 1985
Net transfers on lending
Developed market economies 5.0 6.1 4.9 4.2 2.8 -1.4Concessional 3.9 4.4 3.6 2.4 2.3 1.7Non-eoncessional 1.1 1.8 1.2 1.8 0.6 -3.1
Centrally planned economies 0.9 0.5 0.6 0.7 0.2 0.5Concessional 0.7 0.2 0.3 0.5 0.2 0.3NOIl-concessional 0.2 0.3 0.2 0.2 0.2
Capital-surplus developing countries 1.4 1.7 0.5 0.6 0.3 -0.4Concessional 1.2 1.5 0.7 0.3 0.3 0.2Non-concessional 0.2 0.2 -0.3 0.3 -0.6
Multilateral development institutionsb 6.1 5.9 7.4 5.8 7.0 5.2Concessional 3.6 2.6 3.0 2.7 2.8 2.9Non-concessional 2.5 3.4 4.4 3.1 4.2 2.3
IMFcredit 1.1 4.7 4.2 9.0 1.8 -2.4
Total transfers on lendingc 15.1 19.7 17.6 20.5 12.3 1.9Concessional 9.4 8.6 7.8 5.9 5.7 5.5Non-eoncessional 5.7 11.0 9.8 14.7 6.6 -3.7
Official grantsd 13.4 13.6 11.3 11.5 12.6 14.5
Overall net official transfers 28.5 33.3 28.9 32.1 24.9 16.3
Source: Department oflnternational Economic and Social Affairs of the United NationsSecretariat, based on World Bank, Debtor Reporting System; IMF, International FinancialStatistics and Balance ofPayments Statistics; and other sources.
a' Disbursements minus principal and interest payments on medium-term and long-term credits to104 capital-importing developing countries (World Economic Survey grouping) based on debtordata reported to the World Bank.
b Excluding IMF, except for IMF Trust Fund.c Including other countries, multiple creditors and unallocated loans.d Aggregate of official transfers received from all sources for all purposes as reported in recipient
countries' balance-of-payments statistics.
eral transfers related to concessional financing have notbeen spared from a weakening or stagnating trend; nor havethe transfers from any of the groups of donor countriesshown in table IV.7.
Lending by multilateral development finance institutionsstands out strongly in comparison with these other lendingflows. Although the transfer of financial resources throughthese institutions has fallen from its 1982 peak, it was theonly source of significant positive net transfers associatedwith lending in 1985 among the groupings identified in tableIV.7.
In comparison with the multilateral development institutions, flows from the International Monetary Fund showedgreater swings. The Fund had boosted its net lending in support of adjustment of developing countries to $11.1 billion in1983 from half that amount in the two preceding years.Whether or not the 1983 flow was at a sufficient level, thenet flow became -$2.7 billion in1986, having fallen to virtu-
ally zero in 1985 (see table A.l3). Gross lending by the Fundin 1986 had fallen to little more than one quarter of its 1983peak, while repayments on loans were more than four timesthe 1983 level. Net reflows came from the developing countries of Africa and Asia, while the net flow to western hemisphere countries was virtually nil (see figure IVA).Lower-income and middle-income groups of developingcountries accounted for almost the entire amount of net repayments (94 per cent). 28 The least developed countriesmade net repayments in 1986 for the third consecutive year.
These repayments of Fund loans did not indicate a generalcompletion of adjustment processes. Indeed, the numberand value of new IMF lending arrangements for developingcountries increased in 1986 to 31, committing a total of $4.0billion in Fund resources (compared with 26 arrangementsfor $3.4 billion in 1985). Nine of the new arrangements,committing $0.2 billion, were under the new Structural Adjustment Facility (SAF), aimed specifically at the adjust-
" Countries classified into income groups in accordance with Handbook ofInternational Trade and Development Statistics, Supplement 1985(United Nations publication, Sales No. E/F.85.II.D.12).
85

Figure IVA. Net flow ofIMF credit to the main regions of the developingcountries, 1980, 1983 and 1986"
(Millions ofdollars)
8,000
6.000
4,000
2,000
-2,000
-4.000 -L- ~----..,.._----..,__----
COVERAGE1m ArRICA5!!il ASIAIl:J WESTERN HEMISPHERE
1980 1983 1986
Source: Department of International Economic and Social Affairs of the United NationsSecretariat, based on IMF, International Financial Statistics.
a Net flows in SDRs, including Trust Fund, converted to dollars at yearly average exchange rates.
ment needs of low-income countries. The Facility financed out of reflows from the IMF Trust Fund and providing res<;mrces on highly concessional terms under threeyear adjustment programmes - became operational in1986. It represented an explicit recognition that enhancedIMF financing of low-income developing countries waswarranted. An important precedent was also set in 1986 forIMF financing of certain middle-income countries: for thefirst time, the Compensatory Financing Facility of the Fundwas used to help meet the balance-of-payments needs of acountry that is a substantial exporter of petroleum, namely,Ecuador.
Some additional official resources for adjustment assistance were also provided in 1986 by the World Bank throughthe $1.6 billion Special Facility for Sub-Saharan Africa established in 1985 and designed to provide quick-disbursingassistance to low-income countries in the subregion thatwere undertaking medium-term policy reforms. In addition,World Bank Group programmes of structural and sectoraladjustment lending were expanded. Policy-based lending arrangements reached 22 per cent of total lending by the WorldBank Group in 1986. However, total lending of the Grouprose only 2 per cent in 1986, after a one third rise in 1985.Taking the last two years together, policy-based lending hasthus been a rising share of a growing total.
Total commitments by multilateral development institutions grew only 4 per cent in 1986. This followed a 15 percent growth in 1985, but the latter had largely been a recovery from a previous fall (see table A.14). These commitments have not grown commensurate with the need formultilateral co-operation, which must support adjustment aswell as traditional long-run development programmes. Thetrend in total flows necessarily follows the trend in those ofthe World Bank Group, as the latter accounts for over twothirds of the total. But the trend of slow growth or decline inannual commitments has been almost universal among theinstitutions that provide financial and direct operationalassistance. Indeed, most of the multilateral institutions committed less resources in 1986 than in their previous peak yearand the commitments of several actually declined. Commitments of the World Bank Group in 1986 did exceed the previous peak (1983), generating an average growth since thenof 4 per cent a year. Only the activities ofthe African Development Bank have expanded rapidly beyond their last peakyear. 29
One reason for the overall shortfall in recent years in multilateral financial activities lies in the nature of the bulk ofthe activities themselves, which are related to long-term development projects and programmes. A common consequence of adjustment programmes in response to
29 Development finance commitments by Arab regional and national development institutions have also been on a declining or stagnant trend (seetable A.15).
86

balance-of-payments difficulties has been a cut-back in investment spending. Countries under pressure to adjust theirfiscal deficits tend first to reduce expenditures that can bepostponed with minimal economic or social disruption forexample, local counterpart financing of new public investment projects. In addition, some projects that were plannedwhen expectations of international prices were differentwere reassessed, and in some cases new Governments thathad replaced the originators of the project had different priorities. As a result, not only have projects been delayed, buta number of outright cancellations of multilateral loan agreements have occurred, as borrowing countries would otherwise have had to continue paying commitment fees on theundrawn balances ofloan agreements.
While adjustment strategies had thus reduced the ability ofmany developing countries to absorb long-term multilateralfinance, so, too, have the resources for lending been constrained on the supply side. Protracted negotiations for theseventh increase in the resources of the Inter-American Development Bank (IDB) not only slowed the Bank's lendingactivity in 1985 and 1986, but also curtailed the developmentof new types of operations that would have aimed at increasing the flexibility of its present operations. Similarly, theInternational Fund for Agricultural Development (IFAD),whose resources are exclusively devoted to projects for therural poor, found its lending slowed by the long delay between the initiation of consultations on the second replenishment of the Fund in July 1983 and the coming into effect ofthe replenishment at a low level in November 1986 (theIFAD Special Programme for Sub-Saharan Africa had goneinto effect in May). Commitments in 1986 were less thanhalf the average for the period 1979-1983.
In the face of its resource constraints, IFAD has soughtexpanded co-financing from donor and beneficiary countryGovernments. Co-financing has also been a significant feature of the operations of the regional development banks andthe World Bank. Regional banks have supplied funds toprojects of IFAD and the World Bank, as have other development assistance and export credit agencies. In addition,the World Bank has pioneered in developing co-financingwith private creditors, while both IDB and the Asian Development Bank have also experimented with private co-financing programmes of their own.
Most co-financing, however, has served to channel additional official financing into projects approved by the multilateral institutions. Although improved efficiency isembodied in having official financial institutions draw onthe project evaluation expertise of the multilateral institutions, official co-financing does not in general raise net newresources for development financing and only modestamounts of new private resources have thus far been mobilized. In particular, between July 1983 and June 1986, the
World Bank arranged $2.6 billion in commercial co-financing, one fifth of total co-financing with the World Bank. Infiscal year 1985/86, less than $0.6 billion was arranged withprivate sources for four projects (out of 113 projects having$3.5 billion in co-financed resources). This notwithstanding, World Bank co-financing with private sources of finance, especially commercial banks, may help facilitate there-entry into private markets of countries that have been excluded from those markets since encountering debt-servicing crises. 31
After more than half a decade of experience with officialand private financial flows under the special conditions ofthe 1980s, an international consensus has been forming thatmultilateral finance for development should expand significantly over current levels. For example, the joint Development Committee of the World Bank and IMF stronglysupported a growth path of World Bank lending that wouldraise total lending to $21.5 billion in fiscal year 1989/90,although the existing capital stock could currently support amaximum continued annual lending level of about $14.5 billion to $15.0 billion. The Committee thus agreed that "asubstantial general capital increase will be required if quality .lending materializes as expected". Planning such a capitalincrease might be accorded high priority in 1987, especiallyas an important outstanding financing arrangement wascompleted in February 1987, namely that for the International Development Association (IDA), the soft-loan affiliate of the Bank. That agreement will provide $12.4 billion incontributions for the eighth replenishment of IDA to be lentover three years, beginning 1 July 1987.
Major capital increases of the regional development banksare also under negotiation. The proposed capital increase ofIDB would raise its lending authority by $25 billion overfour years, compared with total loan approvals since theBank was created in 1959 of only $35 billion. The capital ofthe African Development Bank would be increased by 200per cent, to approximately $18 billion, according to a proposal agreed upon in November 1986 by a special committeeof 18 representatives of the Board ofGovernors of the Bank.Lending during 1987 to 1991 could rise more than 100 percent over that of the period 1982-1986. Negotiations on thereplenishment of the Bank's soft-loan affiliate, the AfricanDevelopment Fund, are scheduled to begin in 1987. Deliberations over a future capital increase of the Asian Development Bank are also under way, as the period covered by thepresent capital increase ends in 1987 (the Asian Development Fund was replenished in April 1986 for the period1987-1990 at a slightly increased level in nominal terms overthe previous replenishment).
At the same time, many efforts are also under way to improve the functioning of the multilateral institutions bystreamlining and refocusing their activities. The United Na-
30 Statement made by the President of the Inter-American Development Bank to the Joint Development Committee of IMF and the World Bank,Washington, D.C., 29 September 1986 (see IDB News, November 1986).
31 See World Bank, Annual Report 1986, Washington, D.C., 1986), pp. 27-29.J2 Communiques of the Joint Ministerial Committee of the Boatd of Governors of the World Bank and IMF on the Transfer of Real Resources to
Developing Countries (Development Committee), 11 April 1986, para. 10, and 29 September 1986, paras. 9 and 10 (see IMF Survey, 21 April1986 and 20 October 1986).
87

Table IV.8. Gross foreign debt of the capital-importing developing countries,1980-1986
(Billions of dollars)
1980 1982 1983 1984 1985 1986'
Medium- and long-term debt 423.0 549.0 635.2 680.6 735.8 777
Official concessionalb 105.4 120.0 125.5 129.4 146.4 } 290Official non-concessional 58.5 78.8 95.7 108.2 122.3Use ofIMF credit 8.9 18.7 28~6 31.0 35.3 37Private 250.1 331.5 385.3 412.0 431.8 450
Short-term debt 124.1 159.2 128.6 119.1 116.8 112
Total 547.0 708.2 763.7 799.7 852.6 889
Total as a share of exportsc
(Percentage) 129.5 170.0 187.6 182.9 201.6 213
Memorandum item:Total debt of capital-importing countries
(broader grouping)d 650 825 890 929 992 1035
Source: Department of International Economic and Social Affairs of the United NationsSecretariat, based on World Bank, Debtor Reporting System; IMF, International FinancialStatistics and Balance ofPayments Statistics; and other sources.
a Preliminary estimate.b Including lMF Trust Fund.c Total debt of a sample of 98 countries as a ratio to their exports of goods and services and private
transfers receiVed.d· Including in addition to the capital-importing developing countries, the member countries of the
World Bank with centrally planned economies, Greece and Portugal (among the developedmarket economies), the Islamic Republic ofIran and Iraq (as published in World Bank, WorldDebt Tables, 1986-87 Edition (Washington, D.C., 1987), p. viii).
tions has been an active participant in these recent efforts, inparticular withregard to the co-ordination of technical assistance and other operational activities of the various parts ofthe United Nations system (see General Assembly resolution41/171). Strengthening management and eliminating duplication not only raise the effectiveness and efficiency of ongoing programmes, but they also raise the confidence ofdonors and recipients in the processofmultilateral co-operation for development.
The argument for increasing multilateral efforts, however, is not that they should substitute for diminished bilateral efforts. All should increase. Indeed, total officialdevelopment assistance (aDA) in the mid-1980s has not beensignificantly more than it was at the start of the decade inreal terms (i.e., at constant prices and exchange rates) oreven in nominal terms, estimated at roughly $24 billion in1986. A widely held expectation is that aDA is unlikely togrow by more than 2 per cent a year in real terms over themedium run. Although improved arrangements for donorco-ordination and better integration of aDA in adjustmentand development planning will improve the productivity ofaDA flows, many viable projects and programmes thatwould otherwise be supported with aDA financing will haveto be postponed, abandoned, under-funded or not even decsigned. Meanwhile, evidence grows of increasing povertyand declining standards of living that have accompanied the
sharp economic adjustments of the 1980s. Expanded aDA,concentrated on improving the productivity and well-beingof low-income groups, could make a unique contribution toameliorating their situation.
If it is clear that additional official finance is needed andthat aDA along with non-concessional flows from bilateraland multilateral sources should expand, it is less clear howlarge the overall increase in officialfinancing needs to be. Itis one thing to determine the total financing needs of thecapital-importing countries based on their absorptive capacity and their ability to channel domestic savings into capitalformation. It is another, however, to determine the capacityof these countries to carry more foreign debt. In recent yearsthe growth of the overall indebtedness pfthe capital-importing countries has slowed markedly (see table IV. 8), but theiroverall debt-servicing capacity does not seem to have grownstronger as a result. Indeed, one rough measure of debtservicing capacity, the ratio of external debt to export earnings, worsened appreciably in 1986, reaching a level about25 per cent above that in 1982 when the debt crisis began.The 1986 deterioration was due especially to the influence oflower petroleum prices on the exports of the highly indebtedoil.:.exporting countries. In other words, the ability to carrymore debt depends very much on the outlook for· exportearnings.
33 See United Nations Children's Fund, Adjustment with a Human Face (forthcoming) and World Bank, "Protecting the poor during periods ofadjustment," paper prepared for the Development Committee, 10 April 1987 (see World Bank News, 16 April 1987, pp. 8-10).
88 .

For some low-income countries that depend on a narrowrange of commodity exports whose price trends have beenweak, the requirements of servicing existing debt may already exceed their debt-servicing capacity over the mediumrun. For such countries only inflows of grant financing maybe justified. Indeed, instead of new credits, some officialflows might well take the form of subsidies or partial forgiveness of interest charges or write-offs of some past official loans. As will be argued below, several countries,particularly in sub-Saharan Africa, might be candidates forsuch considerations.
Another set of issues pertains to the countries that weresubstantial recipients of private bank lending, but have hadcredit lines virtually cut off since entering into debt-servicing crises. It appears, in particular, that outstanding bankloans to countries in this category are shrinking. Should thattrend continue, new official lending would serve, in effect,
to help repay private credits. In that case, taxpayers in donorcountries would indirectly help "bail out" the commercialbanks. Larger budgetary allocations in donor countrieswould thus be needed to make a given net financial contribution to developing countries. Doing so would certainly further complicate an extremely difficult legislative process ofincreasing official resources for development assistance.
When banks withdraw frorrilending to such countries, it isbecause they have a negative assessment of the debt-carrying capacity of the countries, presumably derived from anoutlook for trade, growth and interest rates comparable tothat discussed in chapter II above. Economic adjustment ofthese countries might thus require some means for reducingthe level of outstanding debt or interest costs, as well asmeasures to promote structural change and growth. Theyneed to increase investment and this, in turn, warrants anincreased transfer of resources to them.
The foreign debt crisis of developing countries
The debt crisis of developing countries is not being resolved, as the unilateral suspension onmerest payments oyBrazil and Ecuador in early 1987 has shown. It is now almost five years since August 1982, most commonly cited asthe beginning of the crisis. It was in that month that Mexicowas forced to abandon efforts to meet its foreign debt-servicing obligations and seek a negotiated restructuring of themalong with a new programme for domestic economic adjustment. This had a symbolic as well as a real significance:Mexico was the second largest debtor country of the developing world, a country to which foreign commercial bankshad lent over $70 billion (including short-term and longterm credits), a major exporter of petroleum, and a countrythat had enjoyed a long period of economic and politicalstability. The confidence of international commercial bankshad already been shaken by the deterioration of the economic situation of Poland in late 1980 and by the war in theSouth Atlantic in April 1982. But the August events dealt ablow to their willingness to lend to developing countries.Since then, the only debt-rescheduling country to fully reenter the market has been Turkey, whose adjustment processdiffered significantly from that of other debtor countries(see box IV.2). A few special cases of voluntary bank lending to debt-rescheduling .. countries were arranged in 1986(e~g., co~ffDanClng-w1ththe World Bank for Cote d'lvoireand Uruguay and a self-liquidating trade financing facilityfor Ecuador). On the whole, however, the confidence of thebatiks has yet to recover.
Another debt crisis, affecting low-income countries without significant access to commercial bank credit, began evenearlier. In 1981, seven countries of sub-Saharan Africareached agreement with their major creditors to rescheduleforeign debt. In those cases, the debt was largely owed toofficial creditors and the restructurings were multilateral of-
ficial exercises under the aegis of the Paris Club, in whichthe French Treasury serves as host for the negotiations. Repeated return trips by representatives of sub-Saharan countries to the meetings of the Paris Club have become almostroutine.
Adjustment efforts and the debt crisis
Despite many years of domestic adjustment efforts, generally at great cost to local populations, and after severalrounds of debt renegotiating exercises, opinions still differabout the most effective strategy for regaining economicbalance with sustained growth. It is increasingly acceptedthat there can be different paths ofadjustment, although theyall have certain broad features in common. 34 The politicallimits to prolonged austerity are recognized in most circlesas is the need for a longer view of the adjustment problem. Itis agreed that reforms should aim at relaxing structural impediments to economic change and stimulating entrepreneurship which is to say creativity and initiative in economicorganizations, be they in the public or private sector.
But such reforms are not easily implemented when domestic economies are depressed, when slow growth of creditor countries makes it difficult for them to absorb anincreased production of debtor country exports at prices remunerative for sellers, and when debtor countries have tooperate with lower or negative resource transfers than in thepast.
The economic adjustment difficulties of the high-debt,middle-income countries in particular were the focus of aninternational debt strategy put forward by the United StatesSecretary of the Treasury in his address to the 1985 Annual
34 For a major synthesis of recent thinking and experience that found broad support among both developing and developed country delegations to aregional forum, see ECLAC, "Latin America and Caribbean development: obstacles, requirements and options", (Le/G .1440), paper presentedto the Special Conference of ECLAC, Mexico City, 19-23 January 1987.
89

Box !V.2. Debt, net resource transfers andexternal adjustment in Turkey
Turkey has regained significant access to foreign privatefinancing after a debt-servicing crisis forced it from the market in the late 1970s. The return to creditworthiness wassignalled in 1985 when, rather than drawing fully on an IMFstand-by facility, Turkey arranged a substantial internationalcommercial bank stand-by loan. The IMF stand-by was allowed to lapse without replacement. By 1986, official andprivate Turkish borrowers had begun to tap the market forrevolving underwriting facilities, one of the new instruments for international securities finance.
Turkey's debt crisis arose after a rapid build-up of shortterm debt in the mid-1970s. When a shortage of foreign exchange provoked a liquidity crisis in 1977, almost 60 percent of total debt outstanding was scheduled for repaymentwithin a year. A sequence of debt-reschedulings and economic adjustment measures followed, including a structuraladjustment programme announced in January 1980 that wasstrongly oriented towards encouraging exports and enhancing productivity through greater reliance on market pricesand stepped-up investment.
The results have been dramatic. The volume of exports,
which had grown by less than 4 per cent a year from 1973 to1977, rose by 28 per cent a year in the first half of the 1980s(see the table). The spurt in demand from energy-exportingcountries of the Middle East in 1981 and 1982 helped. Thevalue of merchandise exports to that region tripled in 1981and rose by another third in 1982. Exports to industrializedcountries jumped by one third in 1981 and another 9 per centin 1982. Thereafter, export growth was mainly accountedfor by increaseq sales in industrial countries. In 1986, however, exports to the latter stagnated and sales to energy-exporting countries of the Middle East plummeted. However,the fall in export earnings in 1986 is expected to be morethan made up in 1987.
An important shift in the composition of exports also occurred: the share of manufactures rose from 36 per cent in1980 to 75 per cent in 1985. Service earnings improved substantially from construction contracting in the Middle East,tourism, and inflows ofremittances from Turkish workers inother countries. All of these suffered in the special circumstances of 1986.
Gross national product grew by 4.6 per cent a year fromBox continued on adjacent page
Turkey in periods of economic crisis and adjustment: economic indicators of the1970s and first half of the 1980s
1973- 1978-1977 1979 1980 1981 1982 1983 1984 1985
Annual rates of change
Gross national product 6.5 1.2 -1.1 4.1 4.6 3.3 5.9 5.1
Private consumption 6.6 -3.5 -5.2 0.6 4.2 5.0 4.9 3.7Public consumption 9.5 5.7 8.8 0.9 2.0 1.7 3.2 3.3
Private fixed investment 9.8 -8.8 -17.3 -8.7 5.5 4.7 7.3 7.0Public fixed investment 18.4 -5.0 -3.7 9.4 2.2 1.9 1.4 17.1
Export volume" 3.6 -0.5 7.4 62.2 36.9 7.8 20.6 11.8Import volume" 7.6 -20.9 -2.8 11.1 4.9 12.5 13.5 6.0
Terms of tradeb -2.9 -6.2 -18.0 -8.4 -5.9 -1.2 12.1Real effective exchange rate 2.1 3.3 -22.6 5.3 -8.3 -2.6 -2.6 0.4Consumer pricesc 21.5 64.4 116.7 45.8 27.2 30.2 53.0 45.5
Percentages
Unemploymentd 12.3 12.7 14.4 14.8 15.1 15.7 16.0 16.2Net [mancial transfer/GNpe 2.4 1.2 4.9 1.4 -0.2 1.7 0.5 -0.9Debt/exports f 177 359 334 229 199 216 191 190
Source: OECD and Department ofInternational Economic and Social Affairs of the UnitedNations Secretariat, based on data of Turkish national authorities, IMF, World Bank and MorganGuaranty Trust Company (real effective exchange rate index).
a Goods and services (OECD national accounts basis).b Merchandise trade only.c Implicit private consumption deflator of GNP accounts.d Including disguised unemployment in agriculture.e Net capital flows and official transfers minus net interest and profit payments as a share of GNP
in dollars.f Total debt as at year-end divided by earnings from exports of goods, services and private
transfer.
90

1981 to 1985 (and by about 7 per cent in 1986). This supported a steady increase in consumption and a substantialexpansion of investment, first in the public and then in theprivate sectors. Not all economic adjustment problems hadbeen solved by the time Turkey returned to the private financial markets, as evidenced by the inflation and unemployment data shown in the accompanying table. Relativelyheavy debt-servicing, resulting from deferment of principalpayments under rescheduling, will have to be absorbed forthe rest of the decade. It is clear, however, that substantialeconomic adjustment has been undertaken in Turkey in acontext of economic growth and supported by a significantly expanding volume of trade.
A key condition for this performance is that along withdomestic policy reforms to increase incentives for exports
Meetings of the Boards of Governors ofIMF and the WorldBank. 35 Since that speech, a group of 15 developing countries have become prominent in discussions of debt and development. Other middle-income countries have alsoendured debt crises in recent years, but a section of the following analysis highlights the 15 as a grouping of countriesfamiliar to international discussions.
What stands out is the sharp contraction in the currentaccount deficit of these countries, accompanied by poor economic growth. Table IY.9 shows that taken together theyachieved no net increase in production from 1982 to 1984,during which time their aggregate current account deficit ofover $50 billion was virtually eliminated. They suffered aprogressive deterioration in per capita output and a furtherdecline in real income due to declining terms of trade andrising net foreign interest payments.
Their current account improvement was largely the resultof import cut-backs, especially in 1982 and 1983. Domesticinvestment fell from around 25 per cent ofGDP at the beginning of the decade to about 17 per cent in the mid-decadeyears. With stagnant GDP, investment in absolute terms declined by one third. Without investment, efforts to increaseexport volumes, especially in new lines, come up against acapacity constraint.
With weak foreign markets, the ratio of foreign debt to
(see, for example, real exchange rate adjustments shown inthe table), substantial foreign financial resources were provided. Had these foreign resources not been mobilized, thesharp deterioration in the terms of trade would have severelyreduced import capacity. Financing included IMF andWorld Bank lending, the OEeD Special Action Programmefor Turkey, and a sequence of debt reschedulings from thelate 1970s to March 1982, including a plan by which arrearson non-guaranteed suppliers' credits could be settled in domestic currency, an option that was in fact taken by over halfof those creditors. The financial arrangements for Turkeyallowed the net transfer of financial resources to becomestrongly positive in the first year of the structural adjustmentprogramme and to remain positive on the whole until 1985,thus adding significantly to domestic resources for investment.
export earnings has continued to rise despite the cut in newborrowing forced by the debt crisis. In aggregate, the netinflow offinancial resources turned to a net outflow in 1982;it has remained negative since then. Instead of receivingover 3 per cent of GDP in net resource transfers, as in thelate 1970s, the 15 countries together have transferred out anaverage of 3 per cent of GDP since 1983.
The second focus of the analysis of external debt is thedeveloping countries in sub-Saharan Africa, which havealso found it difficult to adjust. Significant arrears in international payments or formal debt reschedulings occurred in31 out of 44 sub-Saharan countries in the first half of the1980s. Import volumes were cut each year from 1982 to1985 as current account deficits were reduced. The growthof output did not keep pace with population growth and theshare of output devoted to investment fell.
The net transfer of financial resources remained positivein most countries, although it fell in almost all of them. Inaggregate, for the countries included in table IV.10,36 the nettransfer fell from over 8 per cent of GDP on average in theyears before 1982, to 4 per cent in 1984 and 1985. In the firsthalf ofthe decade, export volume grew less than 2 per cent ayear and the terms of trade fell 1 per cent a year on average.As a consequence, the ratio of debt to exports rose steadily.
The deterioration in Some of these respects is estimated to
35 See IMF, Summary Proceedings ofthe Fortieth Annual Meeting ofthe Board ofGovernors , 8-11 October 1985 (Washington, D.C., 1985), pp.50-58.
36 Nigeria is excluded from table IV. 10 because the large economy of Nigeria (accounting for roughly 45 per cent of the GDP of the sub-Saharanregion) would statistically overwhelm the data for 41 other countries. Nigeria is included in the 15 larger countries shown in table IV.9. It hasexperienced a negative transfer of resources since 1984.
91

TableIV.9. Indicators of international financing and economic performance of 15heavily indebted countries, 1978-19868
(Annual rate of change, unless otherwise specified)
1978-1980 1981 1982 1983 1984 1985 1986b
Gross domestic product 4.8 0.5 -0.4 -3.4 2.2 3.1 3.5Investment (percentage of GDP) 25.5 24.5 22.3 18.2 17.4 16.5 16.8
Merchandise export volume 4.6 -2.2 -5.1 6.4 9.6 1.8 -6.5Merchandise import volume 6.4 4.3 -16.7 -21.2 -2.4 1.1 -8.5Terms of trade 4.5 -2.8 -4.1 -3.5 2.2 -1.9 -16.1
Current accountc
(billions of dollars) -26.9 -51.2 -51.3 -16.0 -1.2 -1.1 -12.5Net fmancial transfer/GDP
(percentage) 3.5 1.8 -1.0 -2.3 -2.8 -3.7 -3.0Total debt/exportd
(percentage) 186 203 273 298 281 299 342
Source: IMP, World Economic Outlook; and Department ofInternational Economic and SocialAffairs of the United Nations Secretariat, based on IMP data (financial transfers and debt).
a Argentina, Bolivia, Brazil, Chile, Colombia, Cote d'Ivoire, Ecuador, Mexico, Morocco,Nigeria, Peru, Philippines, Uruguay, Venezuela and Yugoslavia.
b Estimate.c Balance of payments on goods, services and private transfers.d Including debt to IMP; exports ofgoods and services.
have stopped in 1986 for example, export volume increased8 per cent and the transfer of resources rose to 6 per cent ofGDP but a recuperation is not in sight. Indeed, the terms oftrade fell 12 per cent. Certainly, there is no sign yet of asustainable surge in economic growth that would once againplace the region as a whole on a path of rising per capitaoutput, which has not been seen since the early 1970s.
The economic trends of the 1980s, and the severe droughtin 1984 and 1985, highlighted the crisis of African economicdevelopment. The seriousness of the situation led to the convening of a special session of the General Assembly in May/June 1986, at which African Governments committed themselves to implement the Organization of African Unity's priority programme for economic recovery 1986 to 199()37 andthe international community committed itself to support andcomplement those efforts (see General Assembly resolutionS-13/2, annex). It was recognized that to carry out the programme, African countries needed additional external resources and that measures had to be. taken to alleviate thesevere burden of external debt in many of them (Assemblyresolution S-13/2, annex, paras. 16 and 17).
The argument for debt relief for Africa
One outcome in sub-Saharan Africa of the internationalstrategyto address the debt crisis is that 22 countries resche-
duled their official or commercial bank debt 82 times from1980 to 1986.38 Aid flows were significantly increased in1985 and 1986 (emergency food aid accounting for roughlyhalf the 1985 increase), and domestic adjustment policieswere being implemented in many countries in accordancewith commitments made in the General Assembly.39 Meanwhile, international economic conditions, in particular withregard to trade, have yet to improve as expected.
The servicing of external debt involves interest and amortization. The latter is generally offset by new capital inflows. For countries in debt crisis, however, the scheduledrepayments of principal and sometimes interest are insteadpostponed in debt restru.;turing exercises. But payment ofinterest is thought to be a charge that should normally bekept current and not rescheduled. Indeed, over the long run,interest obligations must be met if the debt situation is to besustainable that is, if the debtor is to be regarded as solvent.But for many countries in sub-Saharan Africa, doing so imposes a burden that is not likely to be ameliorated in themedium run under current trends for the growth of outputand trade. Thus, even if continued application of the currentdebt renegotiation strategy serves to roll over amortizationpayments over the next several years, something more isneeded in order to address the interest-servicing burden.
One way to measure the economic cost of interest payments is to compare them with the total value of domestic
37 Africa's PriOritY-Programme for Economic Recovery 1986-1990, adopted by the Assembly of Heads of State and Government of the Organizationof African Unity at its twenty-first ordinary session, held at Addis Ababa from 18 to 20 July 1985 (see A/40/666, annex I, declaration AHGlDecl.1 (XXI), annex).
38 Based on enumeration in World Bank, Developing Country Debt: Implementing the Consensus (Washington, D.C., 1987).39 See end-of-year statement by the Executive Secretary of the Economic Commission for Africa (reprinted in West Africa. 12 and 19 January 1987).
92

Table IV. 10. Indicators of international financing and economic performance ofsub-Saharan Africa, 1978-1986'
(Annual rate of change, unless otherwise specified)
1978-1980 1981 1982 1983 1984 1985 1986b
Gross domestic product 2.3 2.4 0.6 -0.7 2.0 3.0 4.0Investment (percentage of GDP) 18.0 17.7 16.7 14.7 14.7 15.1 17.1
Merchandise export volume 1.8 -1.9 2.8 0.7 6.2 1.6 8.2Merchandise import volume 4.3 0.1 -4.2 -8.0 -2.4 -0.3 3.0Terms oftrade -4.5 -5.6 -4.0 1.6 4.5 -2.5 -·12.0
Current accountc
(billions of dollars) -9.2 -13.0 -11.8 -9.2 -6.8 -6.9 -9.8Net financial transfer/GDP
(percentage) 7.8 9.4 8.3 6.7 3.7 4.1 6.0Total debt/exportd
(percentage) 155 194 230 247 243 280 306
Source: IMF, World Economic Outlook; and Department of International Economic and SocialAffairs of the United Nations Secretariat, based on IMF data (financial transfers and debt).
a Excluding Nigeria.b Estimate.c Balance of payments on goods, services and private transfers.d Including debt to IMF; exports of goods and services.
production: In this sense, the interest burden of sub-SaharanAfrica rose from well under 2 per cent of GDP in the late1970sto almost 4 per cent in the mid-1980s (see figureIV.5).Making foreign interest payments requires more than twicethe share of domestic output that was required in the late1970s. Had the interest burden not risen, it is not possible tosay how the resources would have been used. But for thecountries induded in figure IV. 6, the interest payments actually made since 1984 represent about 25 per cent of thevalue of investment spending and 19 per cent of importscompared with less than half that percentage for each variable in the late 1970s.
Although the burden of interest payments already mademay thus be judged high, what matters most is the extent towhich the situation is likely to be improved. Most of theforeign debt of the region (excluding that of Nigeria) is owedto official creditors, the share having risen continuouslyfrom 55 per cent of total debt in 1978 to 72 per cent of thetotal in 1986. Average interest rates paid on the stock ofvarious types of debt owed by developing countries to official creditors have hardly fluctuated (see table Iv.n). 40 Indeed, average interest rates paid by sub-Saharan Africa onits outstanding foreign debt have been about 6 per cent fromthe late 1970s to 1986. Most of the increases in total interestpaid by these countries were therefore not due to the largejump in international market interest rates in the early1980s; nor have these countries gained substantially fromthe subsequent fall in those rates. Moreover, further declinesin market interest rates would bring little benefit.
The increase in total interest paid by these countries a risefrom $1 billion in 1978 to over $4 billion in 1986 was largelydue to the growth of the debt outstanding. That growth wassubstantial at the end of the 1970s (e.g., 22 per cent in 1979),but it has slowed in the 1980s. In all, the debt of the groupreached about $82 billion at the end of 1986.
The countries of sub-Saharan Africa are caught in a bind:their interest burden is already high but it will rise even further if new capital inflows can be obtained and such newcapital inflows are essential. The dilemma might be avoidedif international commodity prices recover, improving theterms of trade, and if export markets become more buoyantthan they have been for several years; but none of this islikely.
Given the overwhelming role of official financing in theregion, Governments in their roles as bilateral creditors andgovernors of multilateral financial institutions could reducethe interest burden where it is excessive. Determining howmuch to reduce that burden in individual cases would be aprocess of adjustment planning and negotiation, but .the object should be to ensure that adjustment is hastened insteadof being hindered that is, that resources for essential programmes and projects are not siphoned off.
One way to implement such an approach is to agree inprinciple to consider full or partial forgiveness of interestdue on certain classes of official debt as one option in ParisClub negotiations, linked to adjustment programmesadopted with and supported by the international community.
40 This is the result of the smaller fluctuation in interest rates on new official credits compared with new private credits and of the fact that interestrates on most long-term official credits were fixed for the life of the loan while interest rates on most long-term private credits are adjusted periodically (usually every six months) in response to changes in short-term interest rates such as the London interbank offered rate (LIBOR).
93

Figure IV.5. Interest burden of selected developing countries 1978-1986(Percentage of GDP)
6-r--------------------,
4
././
2
COUNTRIES15 HEAVilY INDE8TED
!y8=-SAliA~N ~R.!EA C.
o-~-..,...--..,--......-_,.--T"'""-'"'T'"-___,r__-""1978 1979 1980 1981 1982 1983 1984 1985 1986
Source: Department ofInternational Economic and Social Affairs of the United NationsSecretariat, based on data of IMP.
a Excluding Nigeria.
Figure IV.6. Sub-Saharan Africa: interest payments in relation to investment andimports, 1978-1986'
(Percentage)
30
SHARE OF"INVESTMENT
!!iP~Ts.. .
- ---././
-
5 - --,--,----,----.1978 1979' 1980 1981 1982 1983 1984 1985 1986
10
15
20
25
Source: Department ofInternational Economic and Social Affairs of the United NationsSecretariat, based on data of IMP.
a Excluding Nigeria, imports of merchandise, f.o.b.
94

Table IV. II. Average nominal interest rates paid by developing countries by typeof debt and creditor, 1980-1986"
(percentage)
1980 1982 1983 1984 1985 1986b
Concessional debtBilateral official 2.3 2.1 2.0 1.9 2.1 2.7
Developed market economies 2.5 2.1 2.2 2.2 2.3 2.7Centrally planned economiesc 1.6 1.2 1.0 1.0 1.9 1.8Developing country lenders 2.4 2.3 1.9 2.2 1.2 3.2
Multilateral loans 1.9 1.5 1.3 1.3 1.3 1.5
Non-concessional debtBilateral official 6.8 8.1 7.3 7.0 7.4 9.0
Developed market economies 7.0 8.3 7.7 7.4 8.1 9.4Centrally planned economiesc 4.1 5.1 . 6.1 5.6 6.6 5.2Developing country lenders 6.2 7.9 5.8 5.8 4.6 7.9
Multi1ateralloansd 9.6 8.3 8.4 8.4 8.4 10.0
Private debtBonds 7.5 8.0 7.6 7.4 7.6 7.5Floating rate bank debt 15.5 17.1 12.2 12.1 10.5 8.5Short-term bank debt 12.0 12.5 10.0 10.5 8.2 6.9
Source .. For private debt, DECD, Financing and External Debt ofDeveloping Countries, 1985Survey (Paris, 1986) and information supplied by DECD; for official debt, Department ofInternational Economic and Social Affairs of the United Nations Secretariat, based on data of theWorld Bank Debtor Reporting System.
a Dollar value of annual interest payments and other charges (including spreads and fees onfloating rate debt) as a percentage of disbursed and outstanding debt at the beginning of the year.
b Estimated (official debt is based on scheduled interest payments as at end-December 1985 atend-1985 exchange rates).
c Based only on loans to developing countries that report data to the World Bank.d Excluding use of IMF credit.
Interest payments on non-concessionalloans of multilateralinstitutions might also be reduced under comparable conditions. In both cases, the cash flow of the creditor institutionswould be disrupted, although the total amounts would not belarge in most cases. One way to handle this in a multilateralcontext might be to establish a fund to subsidize interest payments, following the precedents of the two subsidy accountsset up in 1975 and 1980 at IMF to reduce the interest cost ofdrawings from the Oil Facility and the Supplementary Financing Facility.
While reduction of the interest burden is central to a longrun solution of the African debt problem, the short-run difficulty in meeting amortization payments must also beaddressed. Interest plus principal payments absorbed littlemore than 15 per cent ofexport earnings of the group ofsubSaharan countries at the end ofthe 1970s. In 1986, they wereestimated to rise to 36 per cent and to rise to 38 per cent in1987 and 1988 according to the forecast of IMF. The prospect, in effect, is for more intensive use ofdebt reschedulingor a new accumulation of arrears.
Superior alternatives would reduce the long-run interest
burden at the same time as the short-run shortage ofliquidityis alleviated. Creditors might thus agree to accept paymentof interest and a portion of principal in local currency, theproceeds being placed in development funds for counterpartfinancing of internationally assisted projects. Another approach might entail conversion of certain classes of loansinto grants, in other words, a write-off of such loans. Thiswould extend a principle to new forms of credit that hasalready been accepted by the international community withrespect to aDA loans. The adjustment of the terms of outstanding aDA loans to bring them into line with subsequently prevailing softer terms for aDA lending was agreedin principle in 197842 and implemented by many donor countries. In 1986, Canada and a number of European countriesannounced moratoria on debt servicing or acceptance of debtrescheduling on concessional terms or outright cancellationof particular debts to low-income African countries undergoing adjustment. And in early 1987, the official creditors inthe Paris Club began actively considering proposals formore realistic rescheduling terms, including the possibilityof below-market interest rates.
Such a process applied to multilateral loans, converting
4\ Including Fund charges and repurchases of Fund credit (based on IMF, World Economic Outlook, April 1987, statistical appendix).42 See Official Records ofthe General Assembly, Thirty-third Session, Supplement No. 15 (A/33/15), Vol. I, part two, annex I, resolution 165
(S-IX).
95

some of them into grants or very long-term loans on highlyconcessional terms (e.g., those of IDA), would help to reduce the debt-servicing burden of low-income countries ofAfrica. Multilateral debt is usually not rescheduled, butthree quarters of the debt-servicing during the period 198(j1988 of 13 of these countries is to be paid to multilateralinstitutions (including IMF). For such situations, at least,innovative debt relief of some sort is warranted.
Debt relief for middle-income countries
The recent history ofattempting to cope with debt crises inheavily indebted, middle-income countries is one of repeated frustration. The 21 middle-income or higher-incomedeveloping countries outside sub-Saharan Africa that haverescheduled their official or private debt since 1980 havedone so 85 times up to the end of 1986. Substantial domesticadjustment needs have had to be addressed, as well as recovery needs from natural catastrophes, such as a series of severe earthquakes in Latin America. Many of these countriesare heavily dependent on commodity exports and continueto suffer under the unprecedented weakness of the international prices of those commodities. What initially appearedto be a largely temporary shortage of foreign exchange-aliquidity problem-now seems to be a solvency problem.
The past and prospective cost of staying current on interest payments indicates the difficulty. The interest burden ofthe 15 highly indebted countries rose from less than 2 percent ofGDP in 1978 to 5 per cent in 1982 and was still over 4per cent ofGDP in 1986 (see figure IV.5). The 15 countriespaid about $38 billion in interest in 1986, compared with $11billion in.1978. Interest payments have averaged over 25 percent of investment expenditures and over 50 per cent of merchandise imports since 1983, compared with less than 10 percent and less than 20 per cent, respectively, in the late 1970s(see figure IV.7).
These countries have been especially vulnerable to swingsin international interest rates since more than four fifths ofthe debt of the group was owed to private creditors. Whentheir debt situation deteriorated, higher risk premiums anddebt-rescheduling charges boosted the average rates on medium-term bank debt (see table IV.11). With the subsequentfall in market interest rates and a reduction in spreads insuccessive. rounds of renegotiations of bank debt, the overallaverage interest rates paid have fallen. From 9 per cent in1979, the average interest rate rose to 14 per cent in 1981 and1982, before returning to 9 per cent in 1986.
The decline in market interest rates during 1986 is likely
to reduce annual interest payments further in 1987 for thegroup of 15 major debtors. Also, the spreads on floating ratedebt to be renegotiated in 1987 are likely to fall, which willhave a certain impact:3 It is difficult to anticipate interestrate changes over the medium run, but only rather narrowmovements of market rates are forecast, barring unforeseeneconomic shocks or a revival of inflationary expectations.Total interest payments should thus rise slowly from 1988.
The rapid rise in interest payments in the early 1980s andthe slower subsequent rise were partly due to the changingcomposition of the debt. The share of official loans in thetotal debt of the 15 countries fell from 18 per cent in 1978 to13 per cent in 1982 when the debt crisis erupted. Thesharehas since risen to 25 per cent and will rise further only iflending from official sources continues to grow on a net basis.
Related to this is the currency composition of debt. Bankdebt outstanding is overwhelmingly denominated in dollars,while official debt and suppliers' credits are generally in thecurrency of the creditor country. For many heavily indebtedcountries, especially in Latin America, the share of exportearnings to non-dollar markets exceeded the non-dollarshare of interest payments. For such countries, increasedexports to pay debt-servicing were required in the period inwhich the dollar rose. By the same token, the decline in theexchange rate of the dollar since 1985 has helped these countries. In contrast, for developing countries whose debts arerelatively more concentrated in yen or European currencieswhile their exports are directed more to dollar markets, theperiod of a falling dollar has been the more difficult one. 44
The outlook for the interest-servicing ratio under currenttrends and policies is not encouraging. For the 15 high-debtcountries, although the ratio is expected to fall, it will stilllikely be in the neighbourhood of 3.5 per cent of GDP in1990.45 Total debt is itself forecast to grow by less than 3 percent a year in the period. This is in sharp contrast to the yearsbefore 1982 when the debt grew by more than 20 per centannually; it is even less than the average rate from 1984 to1986, which was about 4 per cent a year.
Growth ofoutput is also expected to be low: for the groupof 15 heavily indebted countries it is expected to average 3per cent annually during the remainder of the decade. T!Ieterms of trade of many of these countries may worsen ascommodity markets remain depressed while price levelscreep upwards in the developed market economies, whjchwill raise the prices of manufactured imports from thosecountries. The growth of export volume is expected to beslow, averaging 4 per cent a year for the 15 countries duringthe rest of the decade. Exports will be constrained partly by
43 The most recent restructuring of Mexico's commercial bank debt dropped the spread over LIBOR from 1.13 per~ntage points t?O.&l percentagepoints. Argtenina and Brazil, with spreads of 1.44 percentage point and 1.13 percentage points, respectively, have also been seeking significant .reducitons of spreads in their 1987 negotiations, as have other debtor countries (data of ECLAC, "Balance preliminar de la economfa latinoamericana" , Noms sabre La econom[a y el desarrollo. No. 438/439, December 1986).
"For the experience of several developing countnes of Asia, see Economic and Social Survey ofAsia and the Pacific 1986 (United Nations publication, Sales No. E.87.II.F.1), pp. 26-27.
43 Derived from the baseline scenario of Project LINK (prepared in March 1987). The LINK system includes models for 14 of these 15 countries,with all but two models of the smaller countries making explicit forecasts of foreign interest payments.
96

Figure IV.7. Fifteen heavily-indebted countries; interest payments in relation toinvestment and imports, 1978-1986"
(Percentage)
60
/ ...../ .....
50 //
/40 .I
I
30 //
'"20 /--\0 SHARE or
INVrST~[NT
I~PORTS
0- - _.
-.,1978 1979 1980 1981 1982 1983 1984 1985 1986
Source: Department of International Economic and Social Affairs of the United NationsSecretariat, based on data of IMP.
a Merchandise imports f.o.b.
limited growth of foreign demand (assuming no roll-back ofprotectionist measures), and partly by capacity constraintsresulting from inadequate investment levels. This is not anenvironment in which internationally supported domesticaspirations for development will be met.
The key question is how to raise the economic growth ofthese countries without worsening their interest-servicingburden. The danger in increasing the inflow ofnew credits ifsuch could be mobilized lies in raising the debt and futureinterest payments. For middle-income countries it is not realistic to expect a significant increase in aDA grants, giventhe budget constraints on donor countries and the priorityattached to channelling those funds to low-income countries.Non-debt-creating flows with greater long-run potential forsignificant expansion are increases in direct investment anda return flow of flight capital. But a major impediment tosuch higher flows is the uncertainty and instability in thedebtor countries that derives from the very difficulties ofeconomic adjustment under a severe external financial constraint.
Increasing attention has therefore been given to possibilities of reducing the level ofdebt outstanding. Debt to officialcreditors accounts for only a small share of the total debt ofthese countries $112 billion out of a total debt of about $454billionfor the 15 countries at the end of 1986. The discussionhas thus focused on reduction of the debt or interest payments to private creditors, especially foreign commercialbanks.
Commercial banks and debt relief
A mechanism has already evolved whereby banks voluntarily write down loans to some debtor countries and offerthe loans in a secondary market centred in New York. Mostof the activity involves banks swapping loans or exchangingloans for other financial assets, but there have also been outright sales of loans. Turnover in this market has not beencontinuous, although the total value of transactions hasgrown rapidly. No systematic data on its size exist, but market participants have claimed that more than $2 billion ofdebtor country debt was swapped or sold in 1986.
By themselves, such transactions do not benefit debtorcountries as their liabilities are the same whether the loan ispayable to the initial lender, another bank or some other institution. But an important factor is that the loan trades at adiscount from face value, the size of the discount dependingon the market's assessment of the difficulty the borrowerwill have in servicing the loan. Discounts have ranged beyond 40 per cent or even over 90 per cent in certain specialcases, but for countries having debt-rescheduling agreements and adjustment programmes in effect, discounts onthe order of 25 per cent to 35 per cent have been more common.
In the case of especially steep discounts, debtor countryGovernments might purchase some of their own loans andretire them. However, this option is limited by the lack offoreign exchange resources, which is the condition that cre-
97

ated the steep discount in the first place. What several debtorcountries have done instead is to have another party purchase government or government-guaranteed foreign debt ata discount and in turn sell it back to the Government for localcurrency at an advantageous exchange rate and with variousconditions set on the use of the local currency proceeds.
Most common are schemes to convert swapped foreigndebt into equity, for example in the form of an increasedstake of a transnational corporation in its subsidiary in thedebtor country or investment by an international bank in adomestic financial institution in the country. It is estimatedthat in Latin America roughly $1-2 billion out of $3-4 billionof foreign direct investment has recently been financed withdebt/equity swaps. This is not to say that direct investmenthas thereby been significantly increased, since many of theinvestments would probably have been undertaken anyway,though with a different financing arrangement. What thedebtor country gains, however, is that the swapped debt is nolonger a foreign exchange liability of the Government.
A variant of the debt/equity swap is to make it financiallyattractive for wealthy residents of debtor countries to purchase foreign debt at a discount (or swap for it) using assetsthat the residents had earlier moved offshore. The residentthen converts the newly acquired debt into local currency ata value between the discounted price and the face value ofthe debt instrument and uses the proceeds to purchase domestic financial instruments. In such cases, although restrictions may be placed on the use of the proceeds to ensure thatthe funds are not again taken out of the country, the investormay seek to move other funds abroad to return his personalportfolio to what he originally thought appropriate. If hedoes so, that capital outflow will have to financed. Whetheror not the investor is able to do this depends on the extent ofcapital controls and the degree of openness of the financialand trading system of the country. Whether or not he wantsto do it depends on his confidence in the domestic economicsituation and the rate of return in his home market comparedwith overseas.
All in all, the amount of debt that can be retired throughsuch swaps is limited by the amount of direct investment andnet repatriation of flight capital that is feasible at any giventime. As noted previously, such resources are likely to become more readily available after the debtor country's adjustment process has already advanced a certain distance.
If there are limits on the demand side to the reduction ofdeveloping country debt through sales and swaps, limits alsoexist on the supply side. As banks have carried the debt ontheir books at face value, they realize a loss when the debt issold. In taking such actions, banks are usually withdrawingfrom medium-term lending to the debtor country. Thus far,
the practice seems to have been restricted to banks for whichlending to the specific countries has not been a major part oftheir business.
In contrast, several of the world's largest banks are constrained in their participation in this market because theythemselves hold much of the debt. That is, as at mid-1986,$57 billion or over 20 per cent of the total bank debt of the 15heavily indebted countries discussed previously was owed tothe nine large money centre banks in the United States.These banks also dominate total United States bank lendingto the 15 countries, accounting for two thirds of the $87billion total for United States banks.4
?
United States banks account for the largest share of thetotal bank debt of the 15 countries, but that share is less thanone third. The share held by all Japanese banks together isroughly half the United States share, followed by that ofBritish banks (13 per cent of the total). Banks from Canadaand the Federal Republic of Germany each hold about 7 percent. 48
Attention thus necessarily focuses on treatment of the debtby the money centre banks of the United States. If a largeUnited States bank sells part of its holdings of the debt of onecountry in such a way that the discount is readily identified,the bank might no longer be able to assert convincingly thatit believes that the rest of its holdings of debt of the countryhas full face value. United States regulatory authoritiescould therefore insist that the remainder of the bank's holdings be written down by the amount of the discount. Thiswould impose a major accounting loss on the banks, cuttingdeeply into reported profits when the losses are taken, but itwould not reduce the debt-servicing obligations of the borrower country.
Indeed, a major motivation for the participation of the major banks in repeated reschedulings of developing countrydebt may have been precisely to avoid having to accept major losses. For the nine United States money centre banks,the value of the loans to the 15 high-debt countries in mid1986 exceeded their own capital by 29 per cent. In contrast,the exposure of the next 14 middle-sized banks was 72 percent of their capital and for the smaller banks, loans outstanding to the 15 countries were only 32 per cent of capital.These ratios were considerable improvements over the situation in 1982, especially for the nine largest banks whenloans outstanding to the same countries exceeded their capital by 97 per cent.
Both small and large banks have built up their capital andreserves against problem loans in recent years, but smallerbanks have been the most active in adjusting their portfoliosof developing country loans through. debt write-down and
46 See the report of the Secretary-General entitled "Transnational banks: operations, strategies and their effects in developing countries" (E/C.l0/1987/13), para. 59, submitted to the Commission on Transnational Corporations at its thirteenth session.
47 Data of the United States Federal Financial Institutions Examination Council for June 1986." Based on data and estimates for roughly comparable dates and country coverage derived from consolidated data of banks and their foreign
branches and affiliates, as contained in Bank ofEngland Quarterly Bulletin for British banks, Monthly Report ofthe Deutsche Budesbank, vol.39, No.1 (January 1987), p. 48, for banks of the Federal Republic of Germany; and Canada: the International Financial Institutions and the DebtProblem ofDeveloping Countries, report of the Canadian Senate Committee on Foreign Affairs, to be published in May 1987, for Canadianbanks; and data on exposure of Japanese banks as released by the Minsistry of Finance of Japan.
98

discounting in the secondary market. The result is that thedollar value of the exposure of the nine large banks was thesame in 1986 as in 1982, as concerted lending to somedebtors was offset by some write-downs of loans to others,but the exposure of all other United States banks fell IS percent.
Writing down these loans had not been required by theregulatory authorities in the United States, except in circumscribed cases. Full valuation of the loans was concomitantwith the international strategy for returning the high-debtcountries to creditworthiness in the eyes of the market,which would thereby restore the full value of outstandingloans. A member of the Board of Governors of the FederalReserve System of the United States recently observed thatcarrying debt at face value is warranted as long as the banksbelieve that the debt will be serviced and repaid and thatparticipation in restructuring and new lending arrangementsenhanced that likelihood, whereas refusal to partake in refinancing activitie.s might signal the banks' own doubts aboutthe collectability and thus the valuation of the loans. 49
In any event, the economic condition of United Statescommercial banks has not been assessed higWy.by the financial markets. Indeed, the rate of bank profitability (measured relative to assets or as return to equity) has declinedfairly consistently since the late 1970s, with 1986 havingbeen one of the harshest years for the largest banks since thebeginning of deregulation. 50 The riskiness perceived by thecapital market in lending to the banks themselves also seemsto have increased. One indicator is the widely followed ratings by Moody's Investors Service, which showed a declinein the average senior debt rating of bank holding companiesfrom Aa3 in 1981 to just below the next lower rating, AI, in1986. The fall was most marked for the money centre banks:before 1981 they averaged above Aal, but by 1986 they hadfallen by three ratings to about AI. In early 1987 the ratingsfell further. The smaller regional banks, meanwhile, hadraised their average rating from the relatively low A2 in1981 to above Al in 1986.51
However subjective the valuation of corporations by ratings services, there is a widespread feeling that the majorUnited States banks are not as strong as their balance sheetsindicate. Loans to developing countries are only part of theproblem as the banks have also lent extensively in the agricultural and energy sectors of the United States economy,which have been buffeted in recent years. This notwithstanding, it might be time for the large United States banksto begin to recognize formally that a significant portion oftheir assets are overvalued and to accept some losses onthem.
Indeed, banks from other countries have been takinglosses on developing country loans through the discountmarket, as have the regional banks of the United States. Inthose countries, banks have been building up their capital
position and loan-loss reserves as United States banks havebeen doing, in all cases under the intense scrutiny of supervisory authorities. The banks have also increased special provisions or reserves against loss from loans to countries thatexperienced debt-servicing difficulties. Differences in accounting and legal treatment of banks make it difficult tocompare the risk remaining to banks in various countries,but the apparently greater willingness of banks outside theUnited States to formally accept losses suggests that the provisioning by those banks had advanced beyond that of thelarge United States banks. In fact, besides the actual accumulation ofopen or hidden reserves, the position of banks incountries whose currencieshave appreciated against the dollar has been strengthened recently, since the reserves areheld in local currency while most of the debt is in dollars.
Japanese banks are even acting to facilitate the writingdown of their loans to debtor countries to a greater extentthan encouraged by Japanese tax law. In March 1987, 28Japanese banks formed an offshore company to buy suchdebt at a discount with resources provided by the banksthemselves. The banks, which as noted above have beengrowing rapidly, would thereby remove from their booksassets against which they have already made certain provisions. The loss from the discounted sales of debt would beset against other earnings for tax purposes and the loan-lossreserve would be released. In addition, interest paid by thedebtor to the offshore company and transferred to the original bank would be taxed at a lower rate than the same interestaccrued directly. The offshore company is expected to absorb problem debt owed to Japanese banks in a systematic,loan-by-loan procedure and not all at once, and when a loanof a borrower is discounted to the company, other loans tothe same borrower still on the books of the banks will notalso have to be written down.
The shortcoming in the Japanese innovation is that it doesnot benefit the debtor country (unless the offshore companyhelps place the discounted debt in a debt/equity swap as discussed above). But the initiative implicitly recognizes thatthe existing international debt strategy is not working.
A new strengthening of the international debt strategy istherefore called for, one that would leave the banks less vulnerable and hasten the process of adjustment in the debtorcountries. Indeed, the former requires the latter. Adjustmentwould be well served by a larger net transfer of resources tothe debtor countries to be applied to structural adjustmentand also by a lower interest burden than has yet beenachieved under the existing strategy of debt management.Writing off an agreed percentage of the outstanding commercial bank loans would support both aims. It would alsocontribute to returning the actual value of the remaining debtheld by the banks to face value by restoring debt servicing ofthe debtor to a sustainable level.
The write-offs could be negotiated in the same complex of
49 H. Robert Heller, "The debt crisis and the future of international banking", paper prepared for the Annual Meeting of the American EconomicAssociation, New Orleans, 29 December 1986.
so Federal Reserve Bank of New York, Recent Trends in Commercial Bank Profitability: A StaffStudy, September 1986.51 Moody's Money Centre Banks Industry Outlook, Janaury 1987.
99
linked forums that is already used for negotiating debt restructuring and policy adjustment, namely, commercialbank committees, IMF and World Bank executive boards,the Paris Club for loans of official creditors and various adhoc bilateral official arrangements. The key difference isthat bank committees, as well as the Paris Club, would'beempowered and encouraged to consider a wider range ofdebttestructuring alternatives than is the current practice,that is by including a collective and selective debt write-offamong the options.
Proposals to require banks· to write off a portion of thedebt or to waive some interest payments are increasinglybeing made. 52 Large banks and others involved in the currentstrategy have argued vigorously against such proposals. 53
Yet some version of partial debt forgiveness appears to benecessary, given the outlook for trade and non-debt creatingfinancial flows.
From a global perspective, the partial debt relief optionalso has certain advantages. A partial debt write-off or a
reduction in interest payments below market rates (they canbe made equivalent in actuarial terms) would not only raisethe growth of developing countries and speed their adjustment, but would also raise the rate of growth of developedcountries whose exports to the debtor countries would rise,as illustrated by the scenario discussed in chapter nabove.
Implemented through case-by-case negotiations with eachdebtor and given the improved provisioning for bad debtsand strengthened capital positions of the commercial banks,a partial debt write-off would not add a new threat to thestability of the world financial system. Indeed, it wouldprobably be seen as strengthening the system. Appropriatephasing of the debt write-off by creditors (perhaps with central banks making contingent credit available to certainbanks that might otherwise be placed in difficult circumstances) would serve to allay fears that major internationalbanks and therefore the international financial system are atrisk. Continuing along the current path would provide nosuch assurances.
52 In the Unit~ St~tes alone, for example, proposals were made in 1986 by Senator Bill Bradley of New Jersey (originally in an address at Zurich,Switzerland, 29 June 1986) and by Congressman Charles E. Schumer of New York (The New York Times. 10 March 1986, and in more detail forthe case of Mexico, jointly with Robert M. Lorenz and Jorge G. Castaneda in Financial Times. 22 October 1986), as well as by an increasingnumber of academic authorities. See, for example, Rudiger Dornbusch, "La economfa mundial: t6picos de interes para America Latina", in MasAlta de la Crisis de la Deuda, Ricardo Ffrench-Davis and Richard Feinberg, eds. (Santiago de Chile, Corporaci6n de Investigaciones Econ6micaspara Latinoamerica and Inter-American Dialog, 1986), pp. 17-32; Stanley Fischer, "Sharing the burden of the international debt crisis", paperprepared for the Annual Meeting of the American Economic Association, New Orleans, 29 December 1986; and Jeffrey Sachs, "Managing theLDC debt crisis", Brookings Papers on Economic Activity, No.2 (1986), pp. 397-431.
53 See, for example, Morgan Guaranty Trust Co., World Financial Markets, September 1986.
100

CHAPTER V
THE INTERNATIONAL OIL MARKET
The year 1986 saw very sharp fluctuations in the price ofoil. During the first seven months, oil prices plummetedabout 64 per cent and recoveredby about 36 per cent in therest of the year. At year-end the price was roughly 51 percent below its level one year earlier. The short-run effects ofthe price drop on oil demand and supply were considerable.On the demand side, the immediate effects on oilconsumptionsurpassed expectations based on past estimates of theelasticity ofoil demand with respect to oil prices. On thesupply side, the situation was more complex as the expansion of oil production was cause as well as effect of the slidein prices. Another important implication was the pronounced shift in income from oil exporters to oil importers.The 1985-1986 oil shock largely reversed the income effectsof the two oil shocks ofthe 1970s.
The longer-run implications of the fall in oil prices dependon how long prices will.remain depressed. Energy invest~
ments, however, have already been affected. Expenditureson oil exploration and development, as well as on. othersources of energy, declined substantially in 1986 and thereare few indications that they will recover soon.
Energy consumption and output since the early 1970s
The sharp rise in the price of oil in 1973-1974 and 19791980 induced profound and far-reaching reactions. Much ofthe reaction to higher prices fell on consumption. Globalenergy consumption grew by an average 1.7 per cent per
Figure V. I. The price of Arabian Light crude oil, 1973-1986(Dollars per barrel)
40 ----------------------....
3J
20
10
SPOT. PRICES a
9!ILCJ~~!.RJS~~ b
O~~~,._~~__:':',.-~~__.:,;-~"""::""'__:'-,..,...""':!"I"'~
\~1:' \~1llr \~1'J \~1'O \~11 \~1'O \~1~\~'O\:) \~,o\~,o\~,o\~,ollr\~,o\~,o\~,o1QUARTERLY DATA
Source: Department ofInternational Economic and Social Affairs of the United NationsSecretariat, based on Petroleum Intelligence Weekly, various issues.
a Spot market prices from the fourth quarter of 1984 to the latest figures in 1987 areestimated netback values.
b No official prices set for 1986.
year over. the period 1973-1985. This contrasted sharplywith the average 5.2 per cent per year sustained during the1960s and early 1970s. Energy use decelerated progressively towards the end of the 1970s and into the 1980s as aresult of investments in energy-efficient durable goods andshifts in consumption patterns. In the developed market
101
economies, energy consumption actually declined in absolute terms during the years 1979-1981, despite annual growthin aggregate income over the same period. This marked ahistoric shift in the relationship between income and energyuse in these countries.

Energy production capacity, on the other hand, grew rapidly during the period 1973-1985. Its rate of growth rose asthe period progressed. Investments made during the early1970s began to payoff in terms of sizeable increments inproduction capacity in the late 1970s and early 1980s. Theseinvestments did not substantially change the broad geographic distribution of proven reserves, which remainedpreponderantly in the Middle East (see table A.16). But theproduction of fossil fuels and of nuclear power and hydropower rose on a broad geographical base during the 1970s.Towards the end of the decade, however, there was somemoderation in production growth under the influence of declining rates of growth of energy consumption.
By early 1981, the cumulative effects of falling energyconsumption and rising energy supplies began to be felt inenergy markets, especially in spot oil markets. As the excesssupply situation gradually unfolded during the early 1980s,overt price competition developed in the oil market, whichled to a rapid expansion in the amount of oil traded in spotmarkets. Spot transactions rose from 1 to 3 per cent of oiltraded internationally in 1979 to perhaps one third of international sales by early 1985. 1
Starting at nearly $40 per barrel (pb) in 1981, or almost $8pb above the official price of $32 pb, the spot market pricefor the "marker" crude oil (Arabian Light, 340 API, f.o.b.Ras Tanura) (see figure V.1) had fallen below the officialprice level by mid-summer. Until late 1982, the spot pricefluctuated between $30 pb and $33 pb, basically in responseto seasonal demand. By the autumn and winter of 1982/83the spot price dropped below $29 pb. It remained in the $28$29 pb range during the first half of 1984, and slipped intothe $27-$28 pb range during the second half. Official pricesgenerallyJollowed the course of spot prices with a lag (seefigure V.1). Stocks played an important role in determiningprice movements over the entire period (see table A.17).
As price competition rose in the latter half of 1985 socalled "market-oriented" pricing instruments came intowide use. These included the discounting of official prices,barter exchanges at imputed prices below official prices andnetback pricing arrangements. None ofthese practices werereally new. The explosion in the number of transactions involving one or more of these devices was, however, unprecedented.' Netback pricing grew particularly fast. Under thisarrangement, the price of crude oil sold depends on the(spot) market value of the products it yields, after allowingfor transportation and refining costs. Such sales shift a considerable part of the refining risk from the refiner to theproducer of crude oil.
The various marketing techniques adopted in the latterpart of 1985 were symptoms of chronic over-supply. Thiswas exacerbated by the decision of OPEC producers to limit
the application of its system of official prices supported byproducer quotas in order "to secure and defend for OPEC afair share in the world oil market consistent with the necessary income for Member Countries' development". 3 Thisdecision had two consequences: a drop in oil prices and thecollapse of the spot market. The value of the netbacks forArabian Light was about $25 pb in late 1985, a $2 pb declinefrom the corresponding spot price at mid-year. Furthermore, the general resorting to incentive marketing devices,particularly for Middle Eastern crude oils or blends, cutsharply into spot markets. 4
Oil price developments in 1986
Although seasonal demand rose and seasonal supplydropped in the first quarter of 1986, the decline in pricespicked up momentum as potential buyers withheld purchases in anticipation of still lower prices and in fact resorted to stock liquidation. This derived in part from theperception that netback and other incentive pricing arrangements would induce a sharp increase in liftings of crude oillater in the year. Netback prices for Arabian Light collapsedfrom $21 pb in early January to $15 pb in late March, andwere below $10 pb by mid-summer, as some of the earlierpredictions of a crude oil glut materialized.
Despite the seasonal drop in consumption and non-OPECproduction in the second and third quarters, OPEC outputrose from 18.6 million barrels per day (mbd) in the firstquarter to 19.2 mbd in the second and 20.7 mbd in the third.At the same time, exports of oil from centrally plannedeconomies rose to about twice the level obtained during thefirst quarter. As a result, an enormous 5.3 mbd were addedto stocks in developed market economies between 1 Apriland 1 October, and returns on Arabian Light plunged to anaverage $9 pb in July. Some semblance of stability was restored to the market after August, when OPEC decided toreduce production quotas (see table A.18). Prices rose toabout $12.70 pb roughly half the price of one year earlier.
One result of the greater adherence to quota limitationswas a drastic reduction in OPEC production '- about 2.0 mbd- between the third and fourth quarters (see figure V.2 andtable V.l). Together with the seasonal rise in oil consumption and seasonal decline in imports from centrally plannedeconomies, approximate balance between physical demandand supply for oil was obtained. Although at the writing ofthis chapter it is too early to discern a clear trend in oilprices, the tone of the market in 1987 is firmer than in 1986.
The rise of netback sales in 1986 led to a change in thegeographical direction of oil trade. Trade patterns reminis-
I Petroleum Intelligence Weekly, vol. XXIV, No.1 (7 January 1985), p. 8.2 The prevalence of such practices in the summer of 1985 led the Ministerial Executive Council of OPEC to issue a report in September 1985 on
"marketing malpractices", see Petroleum Intelligence Weekly, vol. XXIV, No. 42 (21 October 1985), special supplement.3 Quoted in OPEC Bulletin, vol. XVI, No. 10, (Vienna; December 1985-January 1986), p. 5.4 Some major price reporting services, for eXilmple, ceased to offer quotations of Arabian Light towards the end of the year, or qualified quotations
as "notional". Thereafter, only estimated netback values for these crude oils have been published.
102

Figure V.2. OPEC oil production (millions of barrels per day)and oil prices (dollars per barrel)
30~-------------------..
25
20
.......... ..~-- ~..-.-.,,,
15
MONTHLY DATA
Sourre: Department oflnternational Economic and Social Affairs of the United NationsSecretariat, based on:
1. Production: Petroleum Economist, March 1986 and March 1987.2. Prices: United States Department of Energy, Weekly Petroleum Status Report, September
1985-December 1986. Average weekly prices (f.o.b.) weighted by estimated export volume.
Table V.l. Oil balances in selected years
(Millions of barrels per day)
Developed market economiesConsumption 40.0 41.6 34.0 34.8Production 13.8 15.7 18.8 17.9Net imports 26.2 25.9 15.9 16.9
Developing countries
Consumption 6.7 10.8 11.6 11.8Production 34.0 36.9 25.7 27.8Net exports 27.3 26.1 14.1 16.0
Centrally planned economies
Consumption 9.4 11.1 10.7 10.8Production 10.4 12.2 12.3 12.7Net exports 1.0 1.1 1.6 1.9
Memorandum:
Saudi Arabia production 7.6 9.5 3.2 5.0Soviet Union production 8.6 11.8 11.9 12.3United States production 9.1 8.4 9.8 9.6
Source: Department oflnternational Economic and Social Affairs of the United NationsSecretariat, based on Yearbook ofWorld Energy Statistics (United Nations publication, Sales No.EF.80.XVn.7); lEA, Monthly Oil Report, January 1987, Petroleum Economist, January 1987.Note: For each group and year, consumption is production plus net imports (or minus netexports) minus stock additions.
103
PRODUCTION.......... -PRICES

cent of the 1970s were re-established. Middle Eastern oilbegan to reappear in North America in significant quantitiesand partially displaced Mexican and Venezuelan crude oils.Especially large flows of oil also reached Europe in 1986.
Financial innovations in the oil market intensified in early1986. Netback arrangements were used by producers in theMiddle East for sales to a broader array of customers, andother producers began to employ netback arrangements· aswell. Netbacks were also applied to spot sales of crude oiland even to the production share of foreign oil companiesoperating in developing countries. Other kinds of "formulapricing" of crude oil were adopted during the first half of1986 in an effort to work out contractual terms that offeredless risk to market participants. The proliferating contractual forms, though different in detail, all embodied a formula that linked the price of the oil purchased to publishedopen-market spot quotations for baskets of oil on the date of
loading or delivery. By mid-year, crude oil supplies governed by netbacks or formulae represented 75-80 per cent ofcrude oil traded internationally.5
At the same time, oil markets further integrated. Oil futures contracts which appeared in 1985, began to assume asignificant role in oil price formation in 1986.6 The volumeofcontracts in both crude oil and products actually settled inkind is sufficient to have importanteffects on correspondingspot prices; indeed, prices in some spot transactions arebased on near-term futures contracts. Furthermore, futureoil prices in London and New York directly affect the spotprices of similar crude oil sold elsewhere and indirectly influence the pricing of the entire spectrum of refinery feedstocks throughout the world. The overall effect of thesedevelopments has been to link more closely the various markets for both crude oil and products across types ofmaterialsand geographic locations.
Table V.2. Change in petroleum product prices as ofAugust 1986 relative to August 1985
(Percentage)
End-userEnd-user price
price End-user Change in with taxSpot excluding price dollar exchange (Prices in
pricea tax with tax rateb national(Prices in United States dollars) currency)
Gasoline
Western Europe c -31.4 -41.1 -11.1 -28.6 -29.8Japan n.a. 17.0 30.0 -35.0 -15.2United States -43.8 -38.0 -29.2 -29.2
Household heat oil
Western Europec -48.0 -39.0 -23.5 -18.6 -41.6Japan -52.2 29.4 29.4 -35.0 -16.0United States -43.7 -28.0 -28.0 -28.0
Industrial heavy fuel oil
Western Europe -54.0 -53.2 -39.3 -18.6 -51.6Japan -54.6 6.2 - 6.2 -35.0 -39.6United States -52.2 -50.0 -50.1 -50.1
Memorandum item:
The 12 month percentage changes in crude oil pricesd (as of June 1986 are: Western Europe -56.8;Japan -55.2; and United States -51.7.
Source: Department ofInternational Economic and Social Affairs of the United NationsSecretariat, based on IEA, Energy Prices and Taxes, second quarter 1986, 1986/No. 4,pp.15-16.a New York, Rotterdam and Singapore.b In Japan, gasoline and household heating oil prices to end-users in yen fell relatively less than the
amount of the yen's appreciation vis-a-vis the dollar, therefore, the signs of the relative changein the prices of these products in dollars are positive.
c Exchange rates for Western Europe are based on ECUs.d All prices are for landed crude oil, c.i.f., in United States dollars.
5 Petroleum Intelligence Weekly, voL XXV, No. 26 (30 June 1986), p. 1.6 Futures contracts for gas oil and crude oil are currently traded in London, and those. for gasoline, number 2 fuel oil, and crude oil in New York.
Because of the similarity of materials traded in the cases of crude oil (Brent Blend and West Texa~ Intermediate) and light fuel oil (gas oil andnumber 2 fuel oil) and the similarity of contractual terms between London and New York. arbitrage minimizes price swings in both markets.
104
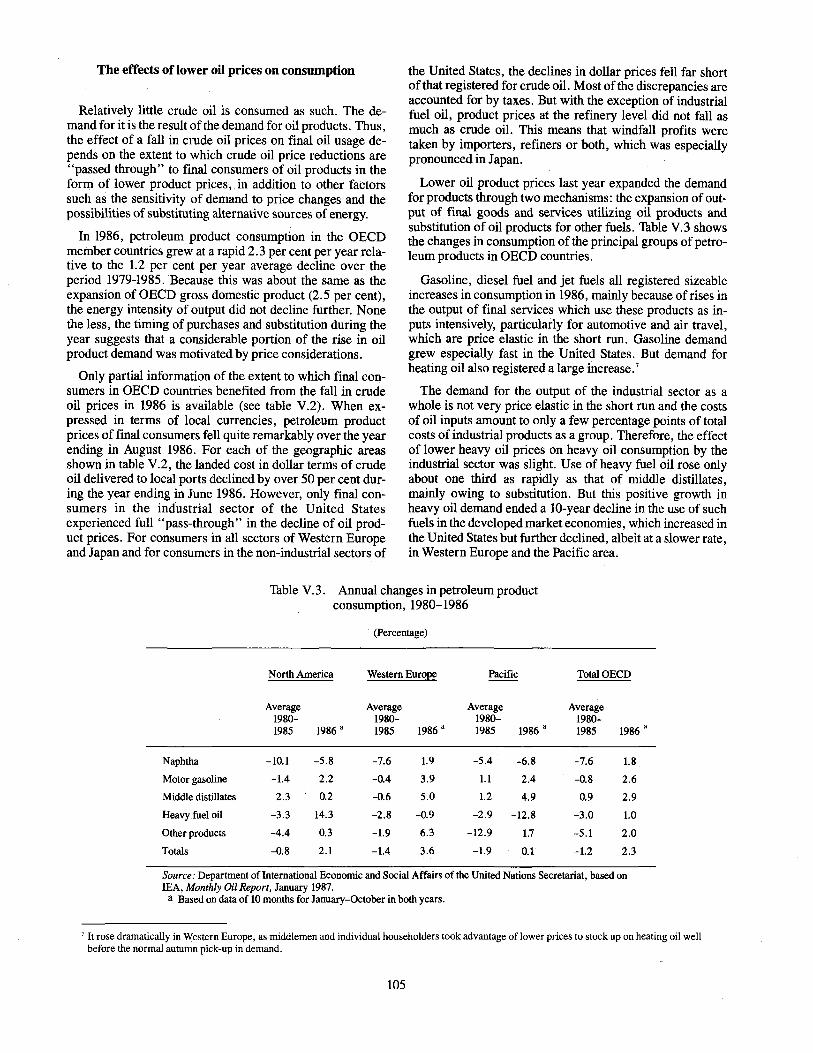
The effects of lower oil prices on consumption
Relatively little crude oil is consumed as such. The demand for it is the result of the demand for oil products. Thus,the effect of a fall in crude oil prices on final oil usage depends on the extent to which crude oil price reductions are"passed through" to final consumers of oil products in theform of lower product prices, in addition to other factorssuch as the sensitivity of demand to price changes and thepossibilities of substituting alternative sources of energy.
In 1986, petroleum product consumption in the OECDmember countries grew at a rapid 2.3 per cent per year relative to the 1.2 per cent per year average decline over theperiod 1979-1985. Because this was about the same as theexpansion of OECD gross domestic product (2.5 per cent),the energy intensity of output did not decline further. Nonethe less, the timing of purchases and substitution during theyear suggests that a considerable portion of the rise in oilproduct demand was motivated by price considerations.
Only partial information of the extent to which final consumers in OECD countries benefited from the fall in crudeoil prices in 1986 is available (see table V.2). When expressed in terms of local currencies, petroleum productprices of final consumers fell quite remarkably over the yearending in August 1986. For each of the geographic areasshown in table V.2, the landed cost in dollar terms of crudeoil delivered to local ports declined by over 50 per cent during the year ending in June 1986. However, only final consumers in the industrial sector of the United Statesexperienced full "pass-through" in the decline of oil product prices. For consumers in all sectors of Western Europeand Japan and for consumers in the non-industrial sectors of
the United States, the declines in dollar prices fell far shortof that registered for crude oil. Most of the discrepancies areaccounted for by taxes. But with the exception of industrialfuel oil, product prices at the refinery level did not fall asmuch as crude oil. This means that windfall profits weretaken by importers, refiners or both, which was especiallypronounced in Japan.
Lower oil product prices last year expanded the demandfor products through two mechanisms: the expansion of output of final goods and services utilizing oil products andsubstitution of oil products for other fuels. Table V.3 showsthe changes in consumption of the principal groups of petroleum products in OECD countries.
Gasoline, diesel fuel and jet fuels all registered sizeableincreases in consumption in 1986, mainly because of rises inthe output of final services which use these products as inputs intensively, particularly for automotive and air travel,which are price elastic in the short run. Gasoline demandgrew especially fast in the United States. But demand forheating oil also registered a large increase. 7
The demand for the output of the industrial sector as awhole is not very price elastic in the short run and the costsof oil inputs amount to only a few percentage points of totalcosts of industrial products as a group. Therefore, the effectof lower heavy oil prices on heavy oil consumption by theindustrial sector was slight. Use of heavy fuel oil rose onlyabout one third as rapidly as that of middle distillates,mainly owing to substitution. But this positive growth inheavy oil demand ended a 10-year decline in the use of suchfuels in the developed market economies, which increased inthe United States but further declined, albeit at a slower rate,in Western Europe and the Pacific area.
Table V.3. Annual changes in petroleum productconsumption, 1980-1986
(Percentage)
North America Western Europe Pacific TotalOECD
Average Average Average Average1980- 1980- 1980- 1980-1985 1986 a 1985 1986 a 1985 1986 a 1985 1986 a
Naphtha -10.1 -5.8 -7.6 1.9 -5.4 -6.8 -7.6 1.8
Motor gasoline -1.4 2.2 -0.4 3.9 1.1 2.4 -0.8 2.6
Middle distillates 2.3 0.2 -0.6 5.0 1.2 4.9 0.9 2.9
Heavy fuel oil -3.3 14.3 -2.8 -0.9 -2.9 -12.8 -3.0 1.0
Other products -4.4 0.3 -1.9 6.3 -12.9 1.7 -5.1 2.0
Totals -0.8 2.1 -1.4 3.6 -1.9 0.1 -1.2 2.3
Source: Department of International Economic and Social Affairs of the United Nations Secretariat, based onlEA, Monthly Oil Report, January 1987.
a Based on data of 10 months for January-October in both years.
7 It rose dramatically in Western Europe, as middlemen and individual householders took advantage of lower prices to stock up on heating oil wellbefore the normal autumn pick-up in demand.
105
Given the improved energy efficiency of the capital stockin the developed market economies that was built up over thepast decade, there was little room in the short run for substitution of energy for capital services. However, the demandfor industrial fuel oil was expanded by substitution for coaland natural gas in secondary electricity generation and industry. But the extent of fuel switching was much less thanmight have been expected, even in the United States wheredual-fired capacity is much larger than elsewhere. 8
The stability in market shares of competing fuels throughout the developed market economies apparently stemmedfrom the general emulation of marketing tactics originallyadopted in the oil sector. Thus spot sales of coal and gas rosemarkedly.9 The spot sale format provided a vehicle for themaintenance of vigorous price competition by substitute fuels with residual fuel oil. For example, by July 1986, whenfuel oil prices were about $8 pb, international coal priceshad fallen 15-20 per cent from a year earlier and were also inthe $8-9 pb (BTU basis) range. to
Production shifts
A decline in oil prices might be expected to lead to a shiftin oil production in favour ofoil-exporting developing countries, especially in the Persian Gulf, and against oil-producing developed market economies, particularly in NorthAmerica. The size of the shift is especially a function ofrelative operating costs, which are significantly lower inmost of the oil-exporting developing countries, and the degree to which current and expected prices cover operatingcosts in developed market economies. Other things remaining equal, a decline in oil prices will squeeze out the leastefficient producers, especially the "small field" producers.But short-run price impacts need not be sustained into thefuture. Moreover, exogenous factors might be at work aswell.
Among these exogenous factors, the decision of OPEC inDecember 1985 to seek a larger share of the international oilmarket was clearly significant. Oil production accelerateduntil August 1986 when OPEC in an effort to arrest the drastic decline in oil prices decided to reinstate a quota system(see figure V.2). In addition, repeated OPEC calls for theco-operation of North Sea and North American oil producers in restricting their output did not meet with any favourable response. On the contrary, in some casesauthorities eased their taxation in order to maintain production. ll
Oil output reductions in the developed market economieswere largely limited to the United States owing to the highcost of production of marginal fields, especially stripperwells. The call of OPEC for oil production cut-backs, however, received more favourable consideration by a numberof oil-exporting developing countries, such as Egypt, Malaysia, Mexico and Oman, which announced their own cutbacks.
By autumn 1986, it had become clear that the new OPECpolicy of increasing its share of the oil market could not beachieved in the short term without a persistent reduction inoil prices to levels even lower than those experienced in thesummer of 1986. But the sharp contraction in oil prices thatdid occur resulted in severe reductions in foreign exchangeearnings for all OPEC countries (see table VA) and otherenergy exporters.
Under these circumstances, a drastic reversion of policieswas achieved at the OPEC conference which met at Genevafrom 11 to 20 December 1986, and OPEC decided to returnpromptly to a fixed price system at a level of $18 per barrel(the reference price of OPEC) as at January 1987. Moreover, OPEC came to the conclusion that it was necessary toundertake cuts in its production level as a means to supportthat price. An agreement was reached that the total production of OPEC for the first and second quarters of 1987should not exceed 15.8 mbd. It was also agreed that production regulation should be pursued throughout the remainingperiod of the year to ensure enough support for the newOPEC price structure.
The decision of OPEC to cut output further and to revertto a system of reference rather than netback prices resultedin a firming up of oil prices to the target of $18 per barrel atthe beginning of 1987. The OPEC decision met with supportonce again from non-OPEC oil-exporting developing countries (e.g., Egypt, Malaysia, Mexico and Oman), which announced further cutbacks in their productions and, for thefirst time, Norway also announced a reduction of 7.5 percent in its North Sea production. Further support was forthcoming from China and the Soviet Union, with announcements of cutbacks in oil exports to support the target oilprice.
Whether voluntary restraints on production and/or exportwill succeed in giving greater stability to oil markets in 1987depends on the increase in oil demand, which is expected tobe lower than 2 per cent per annum, adherence to productioncut-backs among OPEC and non-OPEC countries and oilproduction trends in other countries, including exports fromthe centrally planned economies.
, In the United Stat~s, ~witching from natural gas to residual fuel oil amounted to less than 200,000 barrels per day over the course of the year. Bycontrast, in 1979-1980 when heavy oil prices rose, nearly 500,000 barrels per day of residual fuel oil were displaced by natural gas, see PetroleumIntelligence Weekly, vol. XXV, No. 21 (26 May 1986), p. 4.
9 Internationally traded spot sales of steam coal in mid-July constituted between '60 and 70 per cent of total market activity for coal, much higherthan even one year earlier. Similarly, the spot market component of natural gas sales in the United States rose from about one third of the total in1985 to over one half in 1986.
10 Petroleum Intelligence Weekly, vols. XXV and XXVI, various issues. Substitution for heavy fuel oil was also hampered to some extent byregulatory rules, e.g., the Fuel Use Act in the United States.
II For instance, royalty payments in some states in Canada and the United States were eliminated or reduced.
106
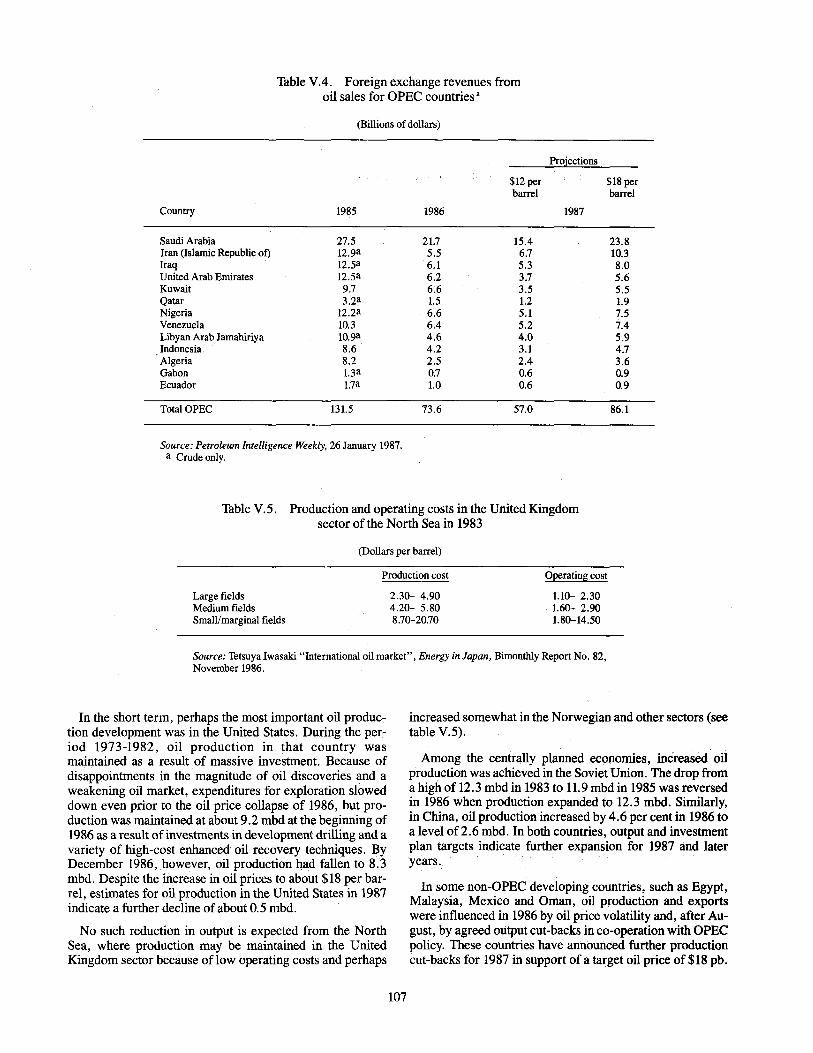
Table VA. Foreign exchange revenues fromoil sales for OPEC countries a
(Billions of dollars)
Projections
$12 per $18 perbarrel barrel
Country 1985 1986 1987
Saudi Arabia 27.5 21.7 15.4 23.8Iran (Islamic Republic of) 12.9a 5.5 6.7 10.3Iraq 12.5a 6.1 5.3 8.0United Arab Emirates 12.5a 6.2 3.7 5.6Kuwait 9.7 6.6 3.5 5.5Qatar 3.2a 1.5 1.2 1.9Nigeria l2.2a 6.6 5.1 7.5Venezuela 10.3 6.4 5.2 7.4Libyan Arab Jamahiriya 1O.9a 4.6 4.0 5.9Indonesia 8.6 4.2 3.1 4.7Algeria 8.2 2.5 2.4 3.6Gabon 1.3a 0.7 0.6 0.9Ecuador l.7a 1.0 0.6 0.9
Total OPEC 131.5 73.6 57.0 86.1
Source: Petroleum lntelligence Weekly, 26 January 1987.a Crude only.
Table V.5. Production and operating costs in the United Kingdomsector of the North Sea in 1983
(Dollars per barrel)
Large fieldsMedium fieldsSmall/marginal fields
Production cost
2.30- 4.904.20- 5.808.70-20.70
Operating cost
1.10- 2.301.60- 2.901.80-14.50
Source: Tetsuya Iwasaki "International oil market", Energy in Japan, Bimonthly Report No. 82,November 1986.
In the short term, perhaps the most important oil production development was in the United States. During the period 1973-1982, oil production in that country wasmaintained as a result of massive investment. Because ofdisappointments in the magnitude of oil discoveries and aweakening oil market, expenditures for exploration sloweddown even prior to the oil price collapse of 1986, but production was maintained at about 9.2 mbd at the beginning of1986 as a result of investments in development drilling and avariety of high-cost enhanced oil recovery techniques. ByDecember 1986, however, oil production had fallen to 8.3mbd. Despite the increase in oil prices to about $18 per barrel, estimates for oil production in the United States in 1987indicate a further decline of about 0.5 mbd.
No such reduction in output is expected from the NorthSea, where production may be maintained in the UnitedKingdom sector because of low operating costs and perhaps
107
increased somewhat in the Norwegian and other sectors (seetable V.5).
Among the centrally planned economies, increased oilproduction was achieved in the Soviet Union. The drop froma high of 12.3 mbd in 1983 to 11.9 mbd in 1985 was reversedin 1986 when production expanded to 12.3 mbd. Similarly,in China, oil production increased by 4.6 per cent in 1986 toa level of 2.6 mbd. In both countries, output and investmentplan targets indicate further expansion for 1987 and lateryears.
In some non-OPEC developing countries, such as Egypt,Malaysia, Mexico and Oman, oil production and exportswere influenced in 1986 by oil price volatility and, after August, by agreed output cut-backs in co-operation with OPECpolicy. These countries have announced further productioncut-backs for 1987 in support of a target oil price of $18 pb.
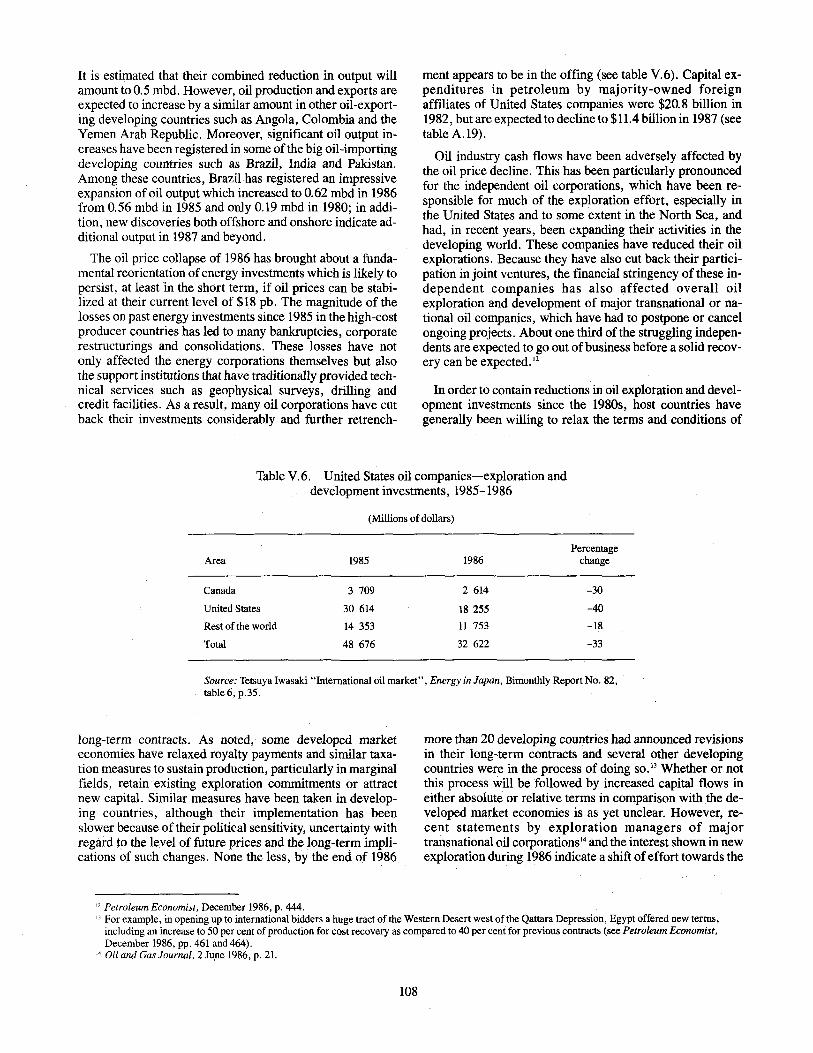
It is estimated that their combined reduction in output willamount to 0.5 mbd. However, oil production and exports areexpected to increase by a similar amount in other oil-exporting developing countries such as Angola, Colombia and theYemen Arab Republic. Moreover, significant oil output increases have been registered in some ofthe big oil-importingdeveloping countries such as Brazil, India and Pakistan.Among these countries, Brazil has registered an impressiveexpansion of oil output which increased to 0.62 mbd in 1986from 0.56 mbd in 1985 and only 0.19 mbd in 1980; in addition, new discoveries both offshore and onshore indicate additional output in 1987 and beyond.
The oil price collapse of 1986 has brought about a fundamental reorientation ofenergy investments which is likely topersist, at least in the short term, if oil prices can be stabilized at their current level of $18 pb. The magnitude of thelosses on past energy investments since 1985 in the high-costproducer countries has led to many bankruptcies, corporaterestructurings and consolidations. These losses have notonly affected the energy corporations themselves but alsothe support institutions that have traditionally provided technical services such as geophysical surveys, drilling andcredit facilities. As a result, many oil corporations have cutback their investments considerably and further retrench-
ment appears to be in the offing (see table V.6). Capital expenditures in petroleum by majority-owned foreignaffiliates of United States companies were $20.8 billion in1982, but are expected to decline to $11.4 billion in 1987 (seetable A.19).
Oil industry cash flows have been adversely affected bythe oil price decline. This has been particularly pronouncedfor the independent oil corporations, which have been responsible for much of the exploration effort, especially inthe United States and to some extentin the North Sea, andhad, in recent years, been expanding their activities in thedeveloping world. These companies have reduced their oilexplorations. Because they have also cut back their participation in joint ventures, the financial stringency of these independent companies has also affected overall oilexploration and development of major transnational or national oil companies, which have had to postpone or cancelongoing projects. About one third of the struggling independents are expected to go out ofbusiness before a solid recovery can be expected. 12
In order to contain reductions in oil exploration and development investments since the 1980s, host countries havegenerally been willing to relax the terms and conditions of
Table V.6. United States oil companies-exploration anddevelopment investments, 1985-1986
(Millions of dollars)
PercentageArea 1985 1986 change
Canada 3 709 2 614 -30
United States 30 614 18 255 -40
Rest of the world 14 353 11 753 -18
Total 48 676 32 622 -33
Source: Tetsuya Iwasaki "International oil market", Energy in Japan, Bimonthly Report No. 82,table 6; p.35.
long-term contracts. As noted, some developed marketeconomies have relaxed royalty payments and similar taxation measures to sustain production, particularly in marginalfields, retain existing exploration commitments or attractnew capital. Similar measures have been taken in developing countries, although their implementation has beenslower because of their political sensitivity, uncertainty withregard to the level of future prices and the long-term implications of such changes. None the less, by the end of 1986
more than 20 developing countries had announced revisionsin their long-term contracts and several other developingcountries were in the process of doing SO.13 Whether or notthis process will be followed by increased capital flows ineither absolute or relative terms in comparison with the developed market economies is as yet unclear. However, recent statements by exploration managers of majortransnational oil corporationsl4 and the interest shown in newexploration during 1986 indicate a shift of effort towards the
12 Petroleum Economist, December 1986, p. 444.IJ For example, in opening up to international bidders a huge tract of the Western Desert west of the Qattara Depression, Egypt offered new terms,
including an increase to 50 per cent of production for cost recovery as compared to 40 per cent for previous contracts (see Petroleum Economist.December 1986, pp. 461 and 464).
14 Oil and Gas Journal. 2 June 1986, p. 21.
108

developing countries, where exploration and productioncosts have been consistently lower than in the developedmarket economies. 1
\ At the same time, a shift away fromoffshore prospecting appears to have manifested itself inview of the cost of geophysical surveys, exploration andproduction drilling, and development of discoveries. Because profitability is greatly influenced by the level of oilprices and their volatility, host countries as well as transnational corporations may have to explore more flexible provisions of long-term contracts.
In contrast to the trends in developed market economies,some developing countries, including Angola, Brazil and India, have either maintained or even increased their plans forinvestment in oil exploration and development. Considerable increases have also been registered in recent years innatural gas, coal, nuclear power and new and renewablesources of energy.
Policy implications of expected oil production
A variety of energy projections under different oil pricescenarios have been prepared in the recent past. They indicate a reversal of recent consumption and production trends.Small annual increases in oil consumption in the developedmarket economies and bigger consumption increases in thedeveloping world are expected.
In order to maintain or to increase oil output in the centrally planned economies, large investments are required.Some of the incremental output may be needed for domesticdemand. In the Soviet Union, however, substitution of natural gas and nuclear power for oil may have a considerableeffect on available export supplies. Medium-term oil production in the developed market economies is expected to besignificantly lower than recent output levels because of thenatural decline in productivity ofexisting fields and the continuation oflower levels of exploration and development efforts. High energy prices during the late 1970s and early1980s not only permitted vast investments for new oil reserves but also the application of high-cost secondary andenhanced recovery techniques in existing fields.
In both the United Kingdom and the United States, outputis expected to decline below current levels even if pricesstabilize. The general consensus is that United States production cannot be maintained at existing levels unless oilprices rise considerably. In addition, since long lead timesare required in exploration and development of new oilfields, particularly in difficult offshore or Arctic areas, considerable effort and time would be needed to rebuild oil industry capacity. Similarly, the United Kingdom sector of theNorth Sea was believed to be near its peak production capacity even before the oil price decline. Low oil prices willprobably hinder exploration and development in that sectoras well as in the Norwegian sector. But some additional out-
put may be expected from these North Sea areas in the mediumterm.
As a result of increasing consumption and the likely reduction in their indigenous oil production, the developedmarket economies are likely to become increasingly dependent on oil imports from the developing countries. Sincemost of the proven oil reserves of the world are in the MiddleEast, additional supplies will have to come largely from thatarea. Other oil-exporting developing countries, includingIndonesia and Nigeria, although currently producing wellbelow capacity, will need most of the incremental suppliesfor domestic consumption. A similar situation prevails inseveral oil-producing, oil-importing countries, because ofthe continuing slow-down in exploration effort, decreasinginvestment by transnational oil corporations and the overallscarcity of financial and technical capacities in many ofthese countries.
The world oil market can be expected to remain volatilebecause of its investment costs, lead times and market structure. The capital intensity of production makes the oil market inherently volatile. In periods of recession, oil pricestend to be eroded because of overcapacity and sizeable differences in marginal costs; in periods of growth, prices tendto rise owing to the same inflexibility of production and highmarginal costs. Historically, production and explorationhave been largely influenced either by a few transnational oilcorporations or, more recently, by Governments. On theconsumption side, excise taxes or import fees have beenused either as important sources of government revenue orfor the protection of domestic energy sources.
The overall result of these interventions is that at presenttwo thirds of the oil market outside the centrally plannedeconomies is supplied by the owners of limited and high costoil reserves, which have been developed with massive investments. Owners of low-cost and abundant reserves supply the residual in the market, leaving at present at least 10mbd of shut-in, low-cost capacity. This misallocation ofscarce investment resources has taken place in periods ofvery high and low interest rates. It has concentrated resources in the developed market economies at a time whenthe developing world is starved of investment capital eitherfrom governmental or private sources. Furthermore, highcost investments are not limited to oil, but also apply to othercapital-intensive energy sources, such as nuclear power,whose economic feasibility is invariably justified on the ex- .pectation of high oil prices in the long run, and fears of import dependence, while often ignoring decommissioning,waste disposal and related costs as well as the possibility ofcatastrophic safety hazards.
Repeated calls by consumer countries for negotiations andstability during the period of high oil prices in the 1970s didnot meet with a favourable response on the part of producercountries. Similar calls by producer countries during theperiod onower oil prices in the 1980s continue to be ignoredby the consumer countries. In these circumstances, the pro-
15 See report of the Secretary-General on energy exploration and development trends in developing countries (A/411383-E/1986/1Ol).
109

posal of the Secretary-General at the second regular sessionof the Economic and, Social Council in July 1986 remainsimportant. The dangers of continuing uncertainty in the international energy situation need to be addressed. Investments in energy are long-term in nature and excessive
110
gyrations in the markets render price signals unreliable, resulting in periodic market upheavals. All parties would benefit if discussions were launched about ways and means toimprove the monitoring and analysis of the international energy situation.

CHAPTER VI
ECONOMIC GROWTH AND TRADE IN CHINA, EASTERN EUROPE AND THE UNION OFSOVIET SOCIALIST REPUBLICS DURING THE PERIOD 1986-1990
During the first half of the 1980s, economic growth inmost countries of Eastern Europe and the Union of SovietSocialist Republics was, on average, less than during thepreceding five years. The annual rate ofexpansion of aggregate output in Eastern Europe decelerated from 3.9 per centin 1976-1980 to 2.2 per cent in 1981-1985 and in the USSRduring the same period from 4.2 per cent to 2.2 per cent. Inmost Eastern European countries, performance remainedwell behind the plan targets for 1981-1985. This comparatively sluggish performance was widespread within countries. In every country for which data are available, the paceof expansion in agriculture, construction and industrylagged behind plan targets and, in many instances, trailedthe achievements of the late 1970s. In addition, there weremarked year-to-year variations in the recorded levels ofeconomic activity. The fundamentals underlying the economicfluctuations and comparatively modest performance arecomplex. They range across the spectrum of key domesticand external constraints, some of which are chiefly exogenous and others the result ofpolicy choices.
The mid-1980s provides an unusual, if convenient, watershed in the development policies of the European centrallyplanned economies. First, it is the period of the broad policydiscussions on the formulation of the new medium-termplans, which in all these countries cover the years 19861990 and which are, in principle, synchronized through theco-ordination of intra-group trade intentions. As such, themedium-term planning framework offers the opportunityfor a rounded assessment of recent economic performanceand for a re-examination of the directions of current andprospective economic policies.
The introspection that accompanies the policy discussionson the successive drafts of the plans is invariably stronglyinfluenced by the experiences of the plans just concluded. Inthe context of the unusual developments of the early 1980s,these plans exhibited unique characteristics as a result ofvarious internal and in particular external economic imbalances, most of which could not have been foreseen at thetime the plans were drafted and approved. This particularperiod in the medium-term planning cycle is also unusualbecause it coincides with shifts in economic institutions,management, and structural policies of several of thosecountries, including the USSR.
Secondly, the mid-1980s is characterized by experimentation with various new policy instruments and institutionaland managerial features, and by the recasting of development strategies and growth objectives. The experimentationand recasting have been done for a variety of reasons, but
two stand out. The difficult economic policy choices thathad to be made on an emergency basis in the early 1980s,primarily because of external payments imbalances, haveled to calls for more flexible policies and institutions that canbuttress more expansive growth ambitions. Systemicchanges are also being sought in order to come to grips withthe apparently long-term slow-down of growth in several ofthe industrially advanced members of the group. These efforts affect not only individual countries but also, directly aswell as indirectly, regional economic co-operation within thecontext of the Council for Mutual Economic Assistance(CMEA).
The recent experiences, developmental priorities and policy concerns of China differ measurably from those of themajority of the European members of the group. During theearly 1980s, China's economic performance was exceedingly buoyant. This stemmed especially from domestic policy changes and gradual shifts in institutions. Together theyhave moved the Chinese economy from being a strictlyplanned entity to one in which decentralized decision-making is gradually fostered. But the situation in the mid-1980sis lopsided and dualistic: the urban industrial sector is stilloverwhelmingly managed through central planning, in contrast to the rural, largely agricultural, sector.
In view of the major differences in economic performance, objectives, institutions and policy instruments, thefirst section of this chapter examines the framework of themedium-term plans of the European planned economieswhile the second deals with the Chinese economy. Specialattention is devoted to the changes in economic mechanismsand policies and to the imbalances prevailing at mid-decade.
Centrally planned economies ofEastern Europeand the Union of Soviet Socialist Republics
Policy concerns and medium-term plans in the early 1980s
Two principal themes marked the medium-term socio-economic development plans for 1981-1985.1 In most of Eastern Europe, these plans accorded the highest priority torectifying the external imbalances incurred in the 1970s.Such imbalances had developed for a variety of reasons, including the serious deterioration in the terms of trade in bothtransferable rouble and convertible currency relations during the second half of the 1970s; constraints on the supply ofkey primary goods from within the CMEA region that had tobe offset through other channels at different prices; and mis-
I For further details on these plans, see' 'Medium-term growth and trade in the light of the socio-economic development plans of Eastern Europeand the Union of Soviet Socialist Republics for 1981-1985", in Supplement to World Economic Survey 1981-1982 (United Nationspublication, Sales No. E.82.II.C.2), pp. 15-35.
111

calculations in external economic policies, including the assumption that the disturbances engendered by the first oilprice shock in the mid-1970s would be a temporary aberration rather than the beginning of more fundamental shifts inglobal economic relations.
Some planners hoped to ease those external constraints byrapidly implementing the Long-term Target Programmes ofEconomic Co-operation that CMEA members had beenelaborating since the mid-1970s. The larget Programmeswere expected to help ease supply constraints in critical areas of production (especially fuels and raw materials) andservices (in particular transportation). They were also intended to stimulate and accelerate the pace of broadly basedspecialization of production within CMEA. Forging morecomplex ties through specialization in a growing number ofeconomic activities was thought to be an indispensable condition for regaining the trade pattern that had prevailedwithin CMEA during most of the post-war period: the exchange primarily of fuels and primary industrial productsfrom the USSR for machinery and other manufactured products fromEastern Europe.
The correction of domestic imbalances took second placeto the concern about improving the external sectors; evenso, most countries hoped to improve control of both domes~
tic investment and consumption demand by shifting resources into the export sectors and cutting down on domesticdemand for imports. TIlis was deemed necessary to accommodate external needs and also to create a more favourableenvironment for economic experimentation and for thegrowth of productivity. To the extent permitted by externalconstraints, there was to be an acceleration in the transitionfrom the extensive type of economic development, relyingchiefly on steadily expanding the supply of factor inputs, tothe more intensive type of economic growth, in which increases in value added result principally from gains in factorproductivity.
This order of priorities in policy concerns stemmed fromthe adverse experiences of the late 1970s and expectationsabout the prospective economic environment. These expectations included a long-term slow-down in the growth ofthelabour force; limited expansion of investment expenditures;limitations on the distribution of available capital fundsamong sectors, including distribution between the materialand non-material spheres; a further deterioration of EasternEurope's terms of trade; the policy objective of working offpast debt; and export-marketing problems for manufactures,given the weak demand that was then besetting the globaleconomy.
In view of those anticipated constraints on growth, outputexpansion for 1981-1985 was to be secured largely fromproductivity gains. Such gains were expected from a combination of organizational modifications, more intensive utilization of the. available capital stock, including importedtechnology, changes in macro-economic planning tech-
niques, more flexible micro-economic management, bettermobilization and motivation of the labour force, utilizationof capital funds for reconstruction, modernization and automation rather than for the expansion of physical capacity,lowering the raw material and fuel intensities of output, improving the quality ofdomestic and export supply, and fastertransmission of technological progress.
The external constraints for the Soviet Union were markedly different for at least two reasons. First, the USSR hadbeen experiencing sharp gains in its terms of trade and hadmanaged to expand its transferable rouble and convertiblecurrency earnings, notably by increasing supplies of gas andoil. Secondly, the debt level of that country relative to itssize, wealth and economic potential was far below that of themajority of Eastern European countries. However, the Soviet Union was also subject to certain external constraints.Successive harvest set-backs had to be offset through imports, especially of feed grains; the growing need to modernize plant and equipment through the importation ofadvanced technology; and emerging capacity constraints onfeasible output levels for crude petroleum and hence on theprimary external revenue earner. For those reasons, virtually all European planned economies adopted cautious economic policies.
Plan targets and achievements in the early 1980s
The evaluation of recent economic performance in the1986-1990 plans and the intensive policy discussions priorto the finalization of the plans demonstrate that policymakers have become very concerned about the slow-downofgrowth in the early 1980s. The fact that, despite the rather"soft" plans adopted for 1981-1985, results fen short of intentions in several respects is being viewed as an opportunity to experiment further and make up lost ground,primarily through changes in policies, institutions and policy instruments.
As shown in table VLl, only Bulgaria attained the plannedpace of aggregate output growth between 1981 and 1985.Except for agriculture in the German Democratic Republic,neither the industrial nor the agricultural sectors in any ofthe countries for which final data are available exceeded themagnitudes planned. For the countries that adopted ranges(for example, Czechoslovakia), the pace of expansion atbest approximated the lower bound. Though the below-planperformance in agriculture and industry was less pronounced in the USSR than in the Eastern European countriesas a group, achievements remained well below the expectations of policy makers in the early 1980s (when the effect ofthe sizeable gains in terms oftrade through 1984 could havebeen taken into account).
For most members of the group, 1981-1983 was characterized by a deceleration in growth rates compared with the1970s. 2 For the group as a whole, the rate of growth declined
, The average growth rates for the period as a whole mask the considerable swings that were sustained on a year-to-year basis. For the period1981-1984, the evolution of the main macro-economic aggregates and the adjustment efforts undertaken are traced in "Adjustment andinvestment policies in the centrally planned economies of Eastern Europe", in World Economic Survey 1985 (United Nations publication,Sales No. E.85.H.C.!), pp. 89-101.
112

Table VI. 1. Centrally planned economies of Eastern Europe and the USSR: selected actual andplanned medium-term macro-economic growth rates, 1976-1990
National income" Gross industrial outputb Gross agricultural outputc
1976- 1981- 1986- 1976- 1981- 1986- 1976- 1981- 1986-1980 1985 1990 1980 1985 1990 1980 1985 1990------ ------
Actual Planned Actual Planned Actual Planned Actual Planned Actual Planned Actual Planned
Albania 4.6 6.2-6.5 3.0 6.2-6.5 6.0 6.3-6.6 4.9 5.2-5.5 3.9 5.4-5.7 2.5 6.2-6.5Bulgaria 6.1 3.7 3.7 5.4 6.0 5.1 4.3 4.6-5.4 2.1 3.4 1.2 1.9Czechoslovakia 3.7 2.0-2.6 1.8 3.4-3.5 4.7 2.7-3.4 2.7 2.8-3.4 1.7 1.8-2.2 1.8 1.2-1.4German Democratic
Republic 4.1 5.1 4.6 4.6 5.0 5.1 d 4.1 3.7-4.1 d 0.4 0.7-0.ge 2.2 1.5 f
Hungary 3.2 2.7-3.2 1.3 2.8-3.2 3.4 3.5-4.1 2.2 2.7-3.0 2.9 2.3-2.8 2.2 1.4-1.9Poland 1.2 -0.8 3.2 4.7 0.4 3.1 0.5 -0.5 2.0Romania 7.3 7.1 4.4 9.9-10.6 9.5 7.6 4.0 7.5-8.3 4.8 4.5-5.0 2.0 6.1-6.7
Eastern Europeg 3.9 3.4-3.8 2.2 5.2 5.5 3.8-4.2 2.8 4.4 1.8 2.1-2.7 1.1 2.7USSR 4.2 3.4 3.6h 4.3e 4.5 4.7 3.7 4.6 1.7 2.5 1.1 2.7Totalg 4.1 3.4-3.5 3.2 4.6 4.8 4.4-4.6 3.4 4.6 1.7 2.4-2.6 1.1 2.7
Source: Department of International Economic and Social Affairs of the United Nations Secretariat, based on nationalstatistical publications, plans and plan fulfillment reports.
a National income produced, except for the USSR, where the planned rates refer to national income domestically used.b Gross value of output at constant prices, except for the German Democratic Republic, where the plan data refer to the
value of commodity production (i.e., gross output less work in progress).c Change in the five-year average output from the average of the preceding five years, expressed as annual compound
rates.d Commodity production.e Estimate.f Estimated on the basis of projected individual or aggregate crop and livestock yields.g Excluding Albania and, for the period 1981-1985, assuming the following average annual growth rates for Poland: 0 to
1 per cent for national income, 0.5 to 1.5 per cent for industrial output and 1.5 to 2.5 per cent for agricultural output.h The actual rate for net material product used was 3.1 per cent. The data on total output and its components for the
period 1981-1985 as a whole and for 1985 released in the 1985 statistical yearbook are not fully compatible with theannual data and the period averages for 1981-1984 disclosed in earlier yearbooks.
from about 5 per cent in 1978 to less than 3 per cent in 1982.This stemmed in part from the marked contraction in economic activity in Poland. But negative growth occurred inseveral other countries as well, at least for one of the yearsobserved: 1982 yielded the lowest pace of growth recordedin the post-war period for nearly all of those countries. Arebound started in the USSR and Eastern Europe in the second half of 1983. This recovery solidified noticeably in1984, aided partly by an exceptionally favourable agricultural performance,3 but growth tapered off markedly in1985.
The new plans and the related official policy discussionsdifferentiate between domestic and external factors as reasons for the uneven developments of the early 1980s. Thekey external factors that help to explain the comparativelypoor performance of most European planned economies are(a) the further marked deterioration in the terms of trade,particularly in transferable rouble relations; (b) the modestsuccess in bolstering export performance, which appearedto have been geared largely to emergency measures to stemthe drain on convertible currency reserves; (c) weak demand, especially in Western Europe, through 1983, whichhampered efforts to expand convertible currency trade; (d)
for some countries, the limitations imposed on domesticmacro-economic policies by high interest rates, the comparatively high level of convertible currency indebtedness inrelation to export earnings and the small amount of freshfunds obtainable in the global financial circumstances of1981-1983; (e) the unexpected deterioration in the politicalclimate of East-West relations, which reduced the volume ofreciprocal trade and capital flows; and (f) the virtual abandonment of the target programming approach when nationaleconomic policies began to focus on emergency adjustmentmeasures rather than on structural changes.
Domestic constraints in a number of countries were noless pronounced. In spite of the planned moderation ofgrowth in aggregate demand, the anticipated efficiencygains from better resource allocation and from modifyingthe composition of output were not realized in most countries. It proved difficult to reallocate investment resources,to maintain capital formation at planned levels and to realizethe efficiency targets, with the result that the reduced, andeven negative, rates of growth in investment entailed bottlenecks thatthe policy makers had hoped to resolve throughgrowth moderation. This exacerbated bottle-necks in material supply; it also resulted in a slow-down in the renovation
3 There were also two more working days in 1984 than in either 1983 or 1985. If growth performance had not changed, this by itself would haveraised the aggregate numbers by perhaps 0.75 percentage points over the levels attained in 1983.
113

or replacement of fixed assets,4 capital-output ratios generally remaining exceedingly high or even worsening; it hampered the intended cut-backs in ongoing capital projects,
whose volume in nearly all countries continued to rise;5 andthe more intensive and prolonged use of the rising obsoletecapital stock caused expenditures for capital repair to soar. 6
Table VI.2. Centrally planned economies of Eastern Europe and the USSR: netmaterial product produced and domestically used
(Average annual increase)
NMP NMP Consumption
produced used Total Personal" Socialb Accumulationc
Bulgaria0.11976-1980 6.1 2.8 4.0 4.1 4.9
1981-1985 3.7 3.6 4.0 3.9 4.9 2.41986-1990d 5.4
1981 5.0 7.7 5.3 5.0 5.5 14.8
1982 4.2 1.9 3.7 3.6 6.5 -3.3
1983 3.0 1.2 2.9 2.5 2.5 -3.6
1984 4.6 5.2 4.9 4.6 5.0 6.21985 1.8 2.3 3.3 2.6 -0.8
Czechoslovakia1976-1980 3.7 2.2 2.5 1.7 4.8 1.41981-1985 1.8 0.0 2.0 1.0 4.2 -7.3
1986-1990d 3.4 3.0 2.9 2.3 4.11981 -0.1 -3.4 2.6 1.7 4.9 -21.7
1982 0.2 -1.6 -1.1 -2.3 1.8 -3.6
1983 2.3 0.6 2.8 2.1 4.2 -8.0
1984 3.5 1.2 3.0 1.7 5.7 -6.6
1985 3.0 3.2 2.7 1.9 4.4 5.8German Democratic Republic
3.11976-1980 4.1 3.6 3.8 4.0 3.11981-1985 4.6 1.2 2.5 2.8 1.4 4.41986-1990d 4.6
1981 4.8 1.2 2.6 2.6 2.3 -3.7
1982 2.6 -3.3 1.2 1.9 0.6 -19.4
1983 4.6 0.5 0.6 0.6 -1.7 0.01984 5.5 3.4 3.7 4.3 1.7 0.01985 4.8 4.2 4.7 4.7 4.0 2.9
Hungary1976-1980 2.8 1.7 3.0 2.6 5.9 -2.91981-1985 1.3 -0.9 1.4 1.4 1.3 -13.61986-1990d 3.0 2.7 1.7
1981 2.5 0.7 3.0 3.0 3.0 -8.6
1982 2.6 -1.1 1.4 1.4 1.3 -12.4
1983 0.3 -2.8 0.6 0.5 0.7 -20.41984 2.5 -0.6 0.9 0.9 1.2 -11.31985 -1.4 -0.6 1.2 0.7 4.5 -15.0
Poland1976-1980 1.2 -0.2 4.5 4.3 5.3 -11.81981-1985 -0.8 -1.6 -0.8 -1.6 4.1 -4.01986-1990d 3.2 2.9 2.6 3.ge
1981 -12.0 -10.5 -4.6 4.1 -8.1 -27.61982 -5.5 -10.5 -11.5 -14.6 11.5 -6.61983 6.0 5.6 5.8 6.2 3.1 4.91984 5.6 5.0 4.4 3.8 8.3 7.31985 3.4 3.8 2.9 2.2 6.6 7.2
4 Thus, in the USSR, the ratio of amortized assets to the amount of fixed capital in industry declined by one third from 2.1 per cent in 1965 to 1.8per cent in 1970, 1.6 per cent in 1975 and 1.4 per cent in 1985.
5 For example, the share of fixed assets put on stream with a vintage up to five years in the total year-end value of fixed assets in the USSRdeclined from 37 per cent in 1975 to 34 per cent in 1980 and 29 per cent in 1984; the corresponding figures for industry are 40 per cent, 37 percent and 28 per cent. Comparable data for 1985 are not available, but a sharp reversal is unlikely to have occurred. The severe problemsencountered with the accelerated replacement of fixed capital were no less pronounced for Eastern Europe. For countries that publish data(Bulgaria, Czechoslovakia, Hungary and Poland), the reported retirement rates of fixed assets were uniformly lower than in the USSR; inCzechoslovakia and Poland in recent years, they have amounted to around half the Soviet level. Furthermore, except for Bulgaria, retirementrates in all countries were steadily decreasing over time. This probably stemmed in part from the generally anaemic investment activitysustained in the first half of the 1980s.
6 In Soviet ferrous metallurgy, for example, the expenditures equalled the amount of gross capital investment.
114
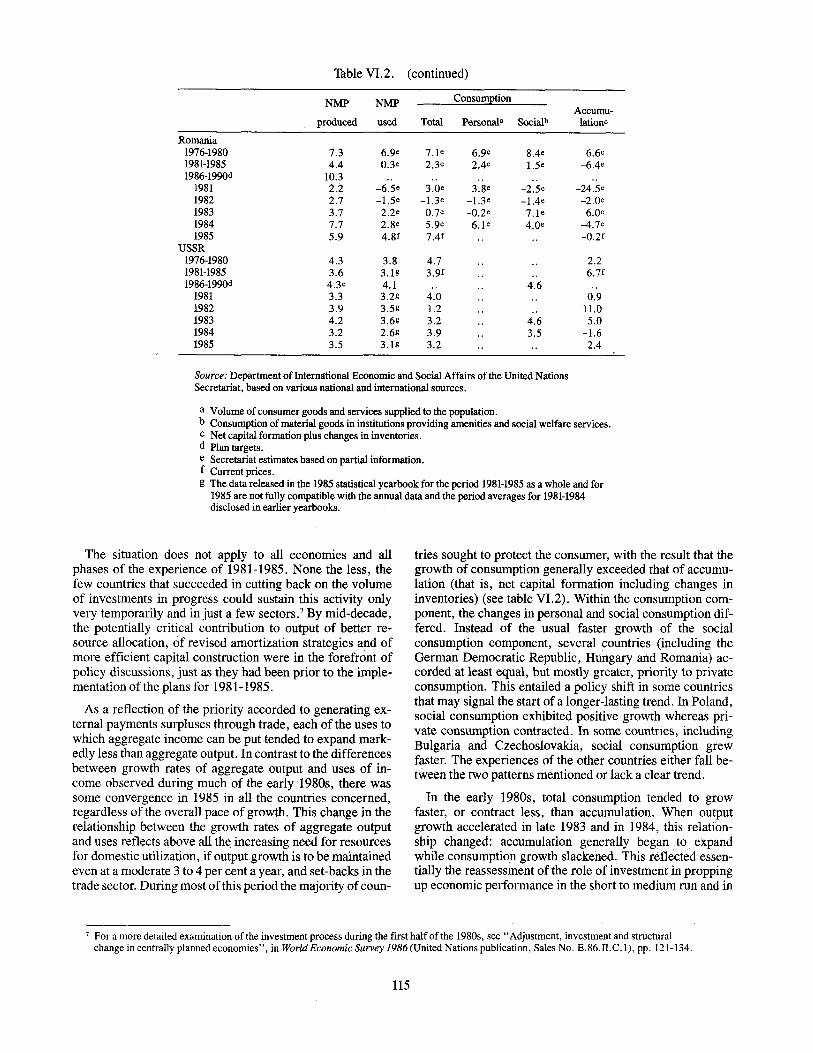
Table VI.2. (continued)
NMP NMP ConsumptionAccumu-
produced used Total Personal' Socialb lationc
Romania1976-1980 7.3 6.ge 7.1e 6.ge 8.4e 6.6e1981-1985 4.4 0.3e 2.3e 2.4e 1.5e -6.4e1986-1990d 10.3
1981 2.2 -6.5e 3.0e 3.8e -2.5e -24.5e1982 2.7 -1.5e -1.3e -1.3e -l.4e -2.0e1983 3.7 2.2e 0.7e -0.2e 7.1 e 6.0e1984 7.7 2.8e 5.ge 6.1 e 4.0e -4.7e1985 5.9 4.8f 7.4f -0.2f
USSR1976-1980 4.3 3.8 4.7 2.21981-1985 3.6 3.H 3.9f 6.7f1986-1990d 4.3e 4.1 4.6
1981 3.3 3.2g 4.0 0.91982 3.9 3.5g 1.2 11.01983 4.2 3.6g 3.2 4.6 5.01984 3.2 2.6g 3.9 3.5 -1.61985 3.5 3.1g 3.2 2.4
Source: Department of International Economic and Social Affairs of the United NationsSecretariat, based on various national and international sources.
a Volume of consumer goods and services supplied to the population.b Consumption of material goods in institutions providing amenities and social welfare services.c Net capital formation plus changes in inventories.d Plan targets.e Secretariat estimates based on partial information.f Current prices.g The data released in the 1985 statistical yearbook for the period 1981-1985 as a whole and for
1985 are not fully compatible with the annual data and the period averages for 1981-1984disclosed in earlier yearbooks.
The situation does not apply to all economies and allphases of the experience of 1981-1985. None the less, thefew countries that succeeded in cutting back on the volumeof investments in progress could sustain this activity onlyvery temporarily and in just a few sectors. 7 By mid-decade,the potentially critical contribution to output of better resource allocation, of revised amortization strategies and ofmore efficient capital construction were in the forefront ofpolicy discussions, just as they had been prior to the implementation of the plans for 1981-1985.
As a reflection of the priority accorded to generating external payments surpluses through trade, each of the uses towhich aggregate income can be put tended to expand markedly less than aggregate output. In contrast to the differencesbetween growth rates of aggregate output and uses of income observed during much of the early 1980s, there wassome convergence in 1985 in all the countries concerned,regardless of the overall pace of growth. This change in therelationship between the growth rates of aggregate outputand uses reflects above all the increasing need for resourcesfor domestic utilization, if output growth is to be maintainedeven at a moderate 3 to 4 per cent a year, and set-backs in thetrade sector. During most of this period the majority ofcoun-
tries sought to protect the consumer, with the result that thegrowth of consumption generally exceeded that of accumulation (that is, net capital formation including changes ininventories) (see table VI.2). Within the consumption component, the changes in personal and social consumption differed. Instead of the usual faster .growth of the socialconsumption component, several countries (including theGerman Democratic Republic, Hungary and Romania) accorded at least equal, but mostly greater, priority to privateconsumption. This entailed a policy shift in some countriesthat may signal the start of a longer-lasting trend. In Poland,social consumption exhibited positive growth whereas private consumption contracted. In some countries, includingBulgaria and Czechoslovakia, social consumption grewfaster. The experiences of the other countries either fall between the two patterns mentioned or lack a clear trend.
In the early 1980s, total consumption tended to growfaster, or contract less, than accumulation. When outputgrowth accelerated in late 1983 and in 1984, this relationship changed: accumulation generally began to expandwhile consumption growth slackened. This reflected essentially the reassessment of the role of investment in proppingup economic performance in the short to medium run and in
7 For a more detailed examination of the investment process during the first half of the 1980s, see "Adjustment, investment and structuralchange in centrally planned economies", in World Economic Survey 1986 (United Nations publication, Sales No. E.86.Il.C.l), pp. 121-134.
115

ensuring genuine progress towards a more intensive, resource-efficient path of economic development. Judging bythe strategies contained in the 1986-1990 plans, this trendmay become even more pronounced in the years ahead.
The overall economic performance of the region in 19811985 provides few indications that the underlying deceleration in growth of the 1970s could be decisively reversed orthat the foundations for such a shift in the future were evencompleted. In this connection, it is noteworthy that the favourable developments in 1983-1984 were achieved predominantly by cutting imports rather than exports, byimposing strict guidelines for saving energy and raw material and, in some cases, through partial modifications of institutional and organizational mechanisms. The markedimprovement in the trading environment, especially inWestern Europe, also played an important role. As developments have demonstrated, such measures by themselves arenot likely to generate sustainable efficiency gains. The decisive long-term acceleration of economic growth can beachieved only by promoting structural changes through newinvestments, including the introduction of more efficientand productive technologies.
Policy environment for the second half of the 1980s
As a result of the uneven economic performance of theearly 1980s, planners have come to recognize the need toaddress themselves to such issues as slowly expanding productive resources, deficiencies in management and planningsystems, and slow factor productivity growth. These andrelated concerns have provided further impetus for policymakers to search more vigorously for ways and means ofgenerating more buoyant economic activity, which is onceagain at the forefront of current medium-term economic policies. Such a path should be sustainable in the medium tolong term, permit the correction of bottle-necks and imbalances, and raise the level of efficiency ofproduction. Thenew five-year plans generally envisage an acceleration ofgrowth throughout the second half of the decade as a resultof consistent adjustment of economic structures and, in anumber of instances, more vigorous investment policies.
The development strategies that emerge from the fiveyear plans aim at resource-efficient economic growth. Significant increments in national output at essentially currentlevels of energy, raw material and labour inputs, as well as asharp reversal of the decline in capital productivity, are envisaged. These goals may be feasible if the policy commitments expressed in the plans - to foster more buoyantinvestment activity and promote technical progress, to enactconsistent changes in the composition of investments by sector and technology, to increase efficiency in the utilization ofenergy and raw material inputs, and to undertake.appropriate improvements in the overall character of policies, planning, management and organizational infrastructure - arekept firmly ahead of short-term economic disturbances andexigencies.
The rethinking of development strategies and especiallythe recasting of the concept of "intensification" on the basisof recent experiences appear to have led decision makers tothe conclusion that a resource-efficient path ofeconomic development does not of itself entail slower economic growth.It is deemed essential in some countries, including theUSSR, to maintain the rate of growth of output at an averageof about 4 to 5 per cent a year in order to provide for themodernization of the production apparatus and theacceleration of technological change. Accordingly, planned rates ofgrowth ofoutput for 1986-1990, except in the German Democratic Republic, have been set at levels that exceed those of1981-1985 by between half a percentage point a year for theUSSR and 6 percentage points for Romania (see table VI, 1);Poland comes in at the upper end of the acceleration range,with an average increase of 4 percentage points. The German Democratic Republic has maintained comparativelybuoyant growth in the first half of the 1980s and its currenttargets call for a continuation of its previous achievements.
These higher growth targets are the result of a twopronged development strategy. They depend critically ongenerating much higher levels offactor productivity growththan could be attained in the past. At the same time, in orderto foster greater efficiency, this relatively ambitious acceleration of output growth is expected to provide the capital resources to implement far-reaching structural change andmodernization of fixed assets. Structural policies, a streamlining of economic mechanisms and the wider use of incentives for rational production decisions and workperformance are expected to help achieve these goals. 8 Toreinforce material incentives, plans provide for the growthof retail trade, especially services, to outpace that of remuneration, which is slated to expand only modestly. Betterutilization of labour resources, therefore, is expected toemerge mainly through other than wage incentives.
The focal points of the efforts designed to adjust economicstructures are the creation of' an institutional' environmentthat fosters steady innovation in the material sphere as anintegral ingredient of the general overhaul of the planningand management systems. The institutional modificationsenvisaged range from the forms and methods of centralizedeconomic control to new legal provisions that create moreroom for independent decision-making by enterprises. Theyare themselves considered a probe for still further fundamental adaptations ofeconomic mechanisms. Such shifts arebeing undertaken, or are in the initial phases of policy discussions, in the majority of the European planned economies. In the longer term, they are bound to affect theenvironment for CMEA economic integration.
Aggregate and sectoral output plans and policy orientation for 1986-1990
Most of the plans emphasize special efforts to prevent output in the first phase of the five-year plan period from lagging behind the plan objectives, as happened in the first half
B The plans emphasize that further gains in personal incomes must be linked more closely to the contribution to output and efficiency.
116
of the 1980s. Except for Romania, the 1986~1987 aggregateoutput targets in all countries were set at the lower end of therange first adopted in the directives for the elaboration of thefive-year plans;9 that is, they are synchronized with theachievements of 1984-1985. The plan projections for theperiod 1986-1990 as a whole depend on gradual improvements in factor productivity, some of which should resultfrom the ongoing changes in economic mechanisms in thosecountries. If kept on the present course, such changes inpolicies, institutions, policy instruments and behaviouralrules may yield their first results in terms oflevel and qualityof growth towards the end of the current five-year plan period.
Sectoral projections for 1986-1990 are, in some cases, atmarked variance with average achievements earlier in thedecade. The recent constraints on domestic and importedfuels and energy demonstrated that improved efficiency inresource use and faster adjustment to changing demand areessential to improve industrial performance. In recognitionofthis, the plans for 1986-1990 highlight policies for structural adjustments in the composition of output and the organization of enterprises, and for material and other incentivesto boost technological achievements. The measures encompass the whole cycle from research to application and dissemination. This strategy is two-pronged. On the one hand,fast growth in output of branches promoting technologicalchange (engineering, electronics, automation, new materials and biotechnology) is anticipated. On the other hand,policy makers expect to be able to reshape the existing economic mechanisms quickly and radically enough to speed upthe transition to more efficient, less resource-intensive industrial growth. This in turn cans for an acceleration ofmodernization and a retooling of the economies.
Industry is generally expected to be the fastest growingsector in the coming quinquennium. Profound structuraltransformation is envisaged in order to reflect the recentshifts in domestic and external supply and demand. Suchhigh-technology branches as informatics, telecommunications, complex and computer-controlled engineering, androbotics are to expand very rapidly. On average, the growthof capital funds appropriated for these sectors exceeds theaverage of that for industrial investments by a considerablemargin. Output of energy- and material-intensive branches,including metallurgy and construction materials is slated torise more moderately, in part to accommodate the high priority placed on compressing per unit material and factor inputs substantially below current levels. Some countries hopethat savings in energy and material inputs alone will yield again in productivity equivalent to more than half the targetedindustrial growth.
The 1986-1990 targets for agriculture and the food com-
pIex as a whole are designed to ensure stable levels of supplywell above desirable minimums. Another main aim is toraise the level of agricultural self-sufficiency and, in somecountries, the volume of exports. The importance of improving the efficiency of agriculture through further modifications in the organization, management and incentivesystems, in a number of cases by curtailing compulsory targets, is also emphasized in the plans. The role of indirecteconomic levers and incentives is bound to be more vigorousin the countries that have already introduced managerialchanges. Agricultural units are expected to reduce production costs and waste of all kinds, and to utilize fixed assets,labour, energy and raw material inputs more effectively. Tothis end, measures will be enacted to raise deliveries of agrochemicals and technical equipment, to improve water andpower supplies, and to expand food-processing capacity, including storage facilities. Improvements in pricing and procurement systems are intended to raise profitability levels inboth crop and livestock production.
Measured against the levels achieved in the precedingquinquennium, average annual growth of gross agriculturaloutput in 1986-1990 is targeted between 1.3 and 2.7 per cent(see table VI.l). An exceptionally high annual growth ratebetween 6.1 and 6.7 per cent - has been adopted by Romania. Except for Czechoslovakia, Hungary and the USSR,these targets are generally above the average growth rates· of1981-1985. 10 Because the early 1980s was a comparativelygood growth period for agriculture, the targets for thepresent quinquennium are predicated on rather favourableclimatic conditions. The primary aim appears to be to eliminate the vulnerability to weather fluctuations, to overcomesuch chronic obstacles as the seasonal shortage oflabour, tocurtail losses and to ease bottle-necks in the agro-industrialinfrastructure, rather than to accelerate output growth.
Construction activity in the early I980s remained gener··ally rather weak as a result of the priority accorded to appropriating investment funds in favour of raising technologicallevels, rather than starting up new structures. This policycontinues to prevail. Most countries envisage expandingconstruction activity only modestly, although residentialconstruction, the demand for which continues to be very intense, is an exception in several cases. lI In financing residential construction, greater use will be made of householdsavings. Developments in the construction sector will beconditioned by efforts to focus resources, to readjust planning and management (with a view to shortening gestationperiods and improving both the quality of output and labourproductivity) and to introduce new materials and technologyon a wide scale.
The transportation and communication sectors encountered severe bottle-necks during the earlier part of the dec-
9 For further details, see the discussion of the current economic situation in chapter II above.'0 Because of unusual year-to-year fluctuations in agriculture, all growth rates are measured over five years (i.e .. total output over 1981-1985
relative to 1976-1980) and then annualized." In the first half of the 1980s, residential construction remained well below the achievements of the preceding quinquennium in all countries but
the German Democratic Republic (see Svet Hospodti'f-stv{ (Prague), 1986: 121, p. 6), although a major increase in 1985 was reported by theUSSR. In some countries, the new plans do not foresee any marked acceleration because of the priority of industrial modernization. On thewhole, construction activity is to expand slowly at best.
117
ade in a number of countries. In order to avert a repetition,the broad improvement of infrastructure, the further electrification of railroads and the upgrading of the energy-efficiency of transportation stand at the forefront ofdevelopments in these sectors. Because of growing infrastructural interdependence within CMEA, modernization inelectrification, transportation and communication is increasingly based on the needs of the group as a whole. Another important feature of the new plans is the importanceattached to environmental policy and conservation of naturalresources.
Distribution of aggregate output
The new medium-term plans do not generally provide adetailed analysis of intentions regarding the expansion anddistribution among uses of domestic income in the yearsahead. From the available quantitative (see table VI.2) andqualitative information, all economies envisage somewhathigher growth for uses of income during this plan periodthan was attained in 1981-1985. Both the rate of expansionand the distribution between consumption and accumulationremain subject to potentially conflicting policy objectives.The plans are committed to far-reaching structural change,to the re-equipment of the productive apparatus (and henceto more rapid growth of investment than in the previous planperiod), to working off external debt in both convertiblecurrency and, except for Poland, transferable roubles, andto ensuring moderate growth in consumption for 1986-1990.Even with this acceleration, accumulation envisaged forseveral countries will remain below the 1980 level. 12
The economic strategy outlined in the plans for 1986-1990seeks important changes in the approach to planning the ratio between accumulation and consumption. At the beginning of the 1980s, it was widely asserted that a reduction inthe level of accumulation without reducing output growthwas an indicator of intensive development as well as an important source of steady growth in consumption. This is nowwidely considered to be unfounded. 13 A reduction in theshare of accumulation, against the backdrop of a moderateor diminishing growth of aggregate output, inevitably compresses feasible consumption levels in the medium term.The strategic concept of development now asserts that themaximization of consumption in the long run must beachieved not through cuts in accumulation, but rather byexpanding capital formation and through a vigorous investment policy.
In recent years, it has become increasingly clear that a lowlevel of accumulation slows down the renovation of the capital stock. To improve the efficiency of fixed assets, it isnecessary to enact rationalization measures, which may require comparatively low new capital investment at first. But
in the longer term, productivity can be improved at a steadypace only by raising capital formation, which may temporarily lift the share of accumulation in the uses of aggregateincome. This short-run statistical effect should not necessarily be taken as evidence of a return to "extensive" development policies. On the contrary, intensification is beingplaced right at the centre of the current medium-term development efforts. Along with this rethinking of the role ofcapital formation in growth, a number of countries (including Bulgaria, Hungary, Poland and the USSR) also emphasize that the key to investment efficiency lies beyond purelyquantitative adjustment of its volume.
Under the investment policy of the current five-yearplans, the share of accumulation in aggregate income usesmay temporarily rise, but the funds thus earmarked for capital formation will be released only in support of output decisions that yield marked productivity growth. "Intensiveaccumulation", which is resource-saving, presupposes astepped-up pace of growth in high-technology sectors, anincrease in the share of reconstruction and retooling, accelerated replacement offixed assets and decisive cuts in gestation periods and construction costs. A reduction in excessivestocks of materials and equipment and an increase in theturnover of both working capital and commodity stocks inindustry and in trade will also yield positive results.
The qualitative and quantitative growth path set for 19861990 thus depends heavily on more buoyant investment activity. The plans for 1986-1990 foresee a substantial reversalof the decline in investment ratios that characterized 19811985 for most CMEA countries. But the intentions are notuniform. The rise in gross investment in the Soviet Unionwill be slightly higher than output expansion; the same istrue for Eastern Europe, except for Czechoslovakia, theGerman Democratic Republic and Romania (see tableVI.3). Policy actions required to ensure structural changeand raise efficiency, especially in Poland and the USSR, arebeing undertaken early in the current five-year planning period. In other countries, greater scope is seen for investmentsin the late 1980s. This increase in the volume of outlays,together with a stronger concentration and allocation by priority branches, are the principal features of the investmentpolicy of the European centrally planned economies in 19861990.
The rationale for this approach may be illustrated by theindustrial investment policy pursued in recent years in Eastern Europe. The decline in investment levels delayed themodernization of the sector's fixed assets and exacerbatedcapacity constraints in some branches. To overcome thislegacy in the second half of the decade, the modernization ofthe engineering branches is to be fostered by a substantialinfusion ofcapital funds. As a result, the share of the investment fund appropriated for this sector is set to rise. In the
12 This is especially the case in Hungary (see J. Hos, "A VII. oteves terv koncepciomllis kerdesei", Gazdasdg (Budapest), No.3 (1985), p. 16).13 During the industrialization phase between the two World Wars in the USSR and for the major part of post-war developments in nearly all
countries, the share of accumulation in aggregate income uses steadily increased. The change in the proportion between accumulation andconsumption in favour of consumption has become a new policy feature in the past 15 years or so. Thus, in the USSR, the share ofaccumulation in aggregate income uses declined from 28 per cent in 1966-1970 to 27.7 per cent in 1971-1975,26.1 per cent in 1976-1980, and25.1 per cent in 1981-1985.
118

Table VI.3. Centrally planned economies ofEastern Europe and the USSR:investment growth, 1981-1990
(Percentage)
1986-1981-1985 1990 1986 1987--
Planned- Actual- Planned- 1983 1984 1985 Planned Actual Planned
Bulgaria 3.6 4.5b 5.8-7.0b 0.7 0.3b 8.6b 5.8c 2.0 12.1dCzechoslovakia -2.1 -0.4 1.9-2.3 0.6 -4.2 5.4 0.8 2.8 2.6dGermanDemocraticRepublic -0.6 0.1 1.5-1.9 0.0 -4.9 3.7 1.8 5.0 1.5dHungary 0.0 -2.0 0.6-1.0- -3.4 -3.7 -3.0 O.Oc 5.1b 1.0-2.0Poland -7.4 4.4 9.4 11.4 6.0 4.2 3.0 3.2-4.3Romania 5.2 1.3 3.6 2.4 6.1 b 1.6b 6.8 1.2 6.7
Eastern Europe -O.lf -1.3 3.4 2.4 2.2 4.0 4.0 2.5 g 4.8gUSSR 2.1 3.3 4.3 5.6 1.9 3.0 7.6 8.0h 5.0d
Total 1.8f 1.9 4.1 4.7 2.0 3.2 6.6 6.5g 4.9g
Source: Department of International Economic and Social Affairs of the United NationsSecretariat, based on national and international sources.
a Annualized on the basis of the ratio of investments in the current five-year plan to investments inthe preceding five years.
b Current prices.c Estimate of plan-over-plan; price basis unknown.d Estimate based on values; no details are available of whether the figures are evaluated in constant
or current prices.e Based on year-end magnitudes.f Based on an estimated 5.9 per cent for Poland.g Secretariat estimate.h State investment only.
USSR, for example, investments earmarked for this purposeare planned to rise by 80 per cent over the average of thepreceding five-year period, whereas they increased only by18 per cent during the previous five years. In other countriesthe contrast is not so sharp, but the shift in policy is none theless very marked.
An investment policy targeted firmly at the steady modernization of economic structures and the acceleration oftechnological progress remains contingent in most countrieson the easing of prevailing external and internal constraintsand, secondarily, on the legacies of past capital formation.External payment commitments still take a heavy toll insome of these countries, and measures must be enacted toraise export earnings to a level sufficient for both debt repayment and the financing of imported investment goods.On the domestic side, the expeditious completion, and insome cases the scrapping, of the backlog of unfinished construction accumulated during the past five years, withoutjeopardizing the envisaged renewal of productive fixed assets, remains a critical task.
To work off the existing level of unfinished capital construction, regulations have been adopted to freeze someprojects and to curb new ones. In addition, the share of investments earmarked for completion of projects in progressis to increase. In some cases, projects are being scrapped inmid-stream. Plans also emphasize a sharp expansion of the
share of machinery and equipment in total investments at theexpense of new project start-ups or construction. The weeding-out of obsolete equipment is also to be accelerated. Inthe Soviet Union, for example, the rate of retirement of machinery and equipment is due to nearly double.
Given the priority accorded to investment, the plans emphasize that further gains in personal incomes are contingenton raising output and efficiency. Steady, if modest, increasesin real incomes and levels of living remain high among thepolicy priorities. The patterns of consumers' incomes, consumer price formation and total consumption policy exhibitthree main characteristics. First, incomes and consumptionremain highly regulated by central fiat. Adverse developments that cannot be accommodated in the plan are generallyoffset either by general measures to adjust income distribution and consumption or by specific income or consumptionallowances. Secondly, the socialist framework of theseeconomies ensures that differences in the socio-economicposition of different groups remain within rather narrowbounds. Finally, income policies continue to be implemented through the wage fund of enterprises, the level anddistribution of social consumption funds and consumer pricepolicies. All centrally planned economies emphasize theneed to strengthen the incentive role of wages by linkingthem to productivity gains. 14 Most countries also stress thatconsumer price policies need to be more flexible. Policy in-
14 This was attempted during the previous medium-term plan, but the ongoing policy discussions suggest the policy will be strengthened in thesecond half ofthe 1980s.
119
tentions regarding social consumption are less detailed.While no change seems to be envisaged on subsidies to themore vulnerable groups, in most countries, there appears tobe a policy trend to limit social transfers to the bulk of theable-bodied population. This may ease the pace at which theshare of the social consumption fund in total available resources rises, but it will not necessarily reverse it. 15
Consumer prices and price policies
The price and income policies of these countries are institutionally anchored to pervasive government controls.These policies are guided by both economic and overall social objectives that aim to ensure that all income groups ofthe population can procure basic necessities. The two maininstruments to achieve this goal are the regulation of retailprices by planning the price level and its movements and theuse of transfers to compensate partially different layers ofsociety for changes in the price level. Though these preceptscontinue to prevail in the late 1980s, they do not inhibit afurther widening of the more active consumer price policiespursued since the early 1980s in a number of countries.
Seen in the post··war perspective, movements in consumerprices in 1981-1985 were considerable, and were not neutralized by income or consumption increases in the majorityof the cotmtries concerned (see table VIA). Official retailprice indices showed a pronounced rise in all but the GermanDemocratic Republic. The increase ofbetween 0.9 and 2 percent a year in Bulgaria, Czechoslovakia and the USSRstemmed largely from administrative price changes, as illustrated by the "blips" in the series shown in table VIA. InPoland, for example, the price rise was unusually large andwas achieved through deliberate policy measures. Hungarykept its price increases within the 6-7 per cent range attainedin 1976-1980. In Romania, however, there was an acceleration from an annual average of 1.4 per cent in 1976-1980 to5 per cent in 1981-1985. A common feature was that retailprices of foodstuffs increased faster than those of non·.foodproducts, except in Hungary, where. the reverse prevailed.
Adjustments were even more pronounced for wholesale
prices, the linking of wholesale and retail prices, and thesynchronization of foreign trade and wholesale prices. Forlack of statistical dat.a, these various interlinkages can bedocumented for a period of time for only Czechoslovakia,Hungary and Poland. The data suggest, first, that there hasnot been a uniform approach regarding the relationshipamong the three price layers. With respect to the link between import prices and industrial producer prices, the threecountries followed quite different patterns. In Poland, thecorrelation is very high, exceptin 1982 when the centralauthorities implemented a general, autonomous price increase. Industrial producer and retail prices began to bealigned in Poland in 1983. The correlation is better for Hungary, largely because of its policy ofletting prices reflect themarket value of products, including trade prices, but withgreater automaticity for producer than for consumerprices. 16 Nevertheless, other socia-economic precepts temporarily interfered with the smooth feeding through of pricechanges in the early 1980s. 17 In Czechoslovakia, no clearcorrelation exists between foreign trade and industrial pricesor between the industrial prices and retail prices, basicallybecause the country adheres to a substantial degree of domestic price autonomy, except during periodic (usually on afive to ten year basis) overhauls of fiat prices. 18
Both the data for these countries and less systematic observations for others indicate that price policies have becomemore active since the early 1980s. More attention has beengiven to the import price level and to the structure of pricesin comparison with prevailing domestic prices. Individualcountry price policies, however, continue to differ markedly. In the new five-year plans, modifications in price policies have been sketched even in some of the countries thathave generally adhered to administratively fixed prices. Allthe plans emphasize the increasing role of consumer pricesin balancing supply and demand for goods and services andin shaping real incomes. Consumer markets could becomesomewhat better balanced in these econornies, especially ifthe planned growth of retail trade materializes.
In Hungary, Poland and Romania, and probably Czechoslovakia, future increases in consumer pri.ces are determined largely by the policy objectives of balancing supply
15 In 1981-1985, benefits from the social consumption fund played an important role in raising consumption and real incomes. In some countries,the share of social consumption in domestic resource use rose considerably over previous levels. This stemmed partly from the fact that thenumber of people whose incomes are derived from the social consumption fund, including pensioners, expanded more rapidly than the labourforce. But it also arose because services provided from the social consumption fund grew faster than labour incomes in many countries.Nevertheless, in some countries (including Hungary, Poland and Romania) consumer price policies, especially for staple products, had anunusually large impact on the real value of such transfers.
16 Briefly, an enterprise must adjust its domestic prices to export prices according to a special formula when its convertible currency exportsamount to at least 5 per cent of its domestic sales. This is to ensure that the domestic price level, on average, should not move more than theexport price in convertible currency relations. Furthermore, the producer price may not exceed the domestic price of a product that has thesame utility characteristics and can be imported continuously in substantial quantities from convertible currency markets. Prices for energy,industrial basic materials and semifinished products have to be brought into line with their import prices.
17 In 1981-1983, the priority of generating a convertible currency surplus necessitated some compromises on price policy principles. The policyprinciple was re·-emphasized in 1985, however, and is strongly stressed too for the new five-year plan period (see B. Szikszay,"Arrendszeliinkceljai es lehetosegei", Nipszabadsag (Budapest), 22 January 1985, p. 4; Magyar Koztony (Budapest), 5November 1984, pp. 866-871; and B. Csik6s-Nagy, "Politika tsen v Vellgrii", Voprosy ekonomiki (Moscow), No, 7 (1982), pp, 118-126)
" Wholesale prices were modified in 1982. Further rationalization measures in the price formation system were implemented on 1 January 1984,when there was again a one-time increase in the wholesale prices of fuel, energy and certain raw materials, including agricultural rawmaterials. In 1985, wholesale prices for other sectors were raised. Prices offuel, energy and raw materials are based on actual acquisition,mostly import cost, but they are not uniformly incorporated into producer prices. However, wholesale prices are gradually being patterned onthe basis of export effectiveness (see M. Sabolcik's commentary in Finance a Uver (Prague), No.3 (1984), pp. 150-157).
120
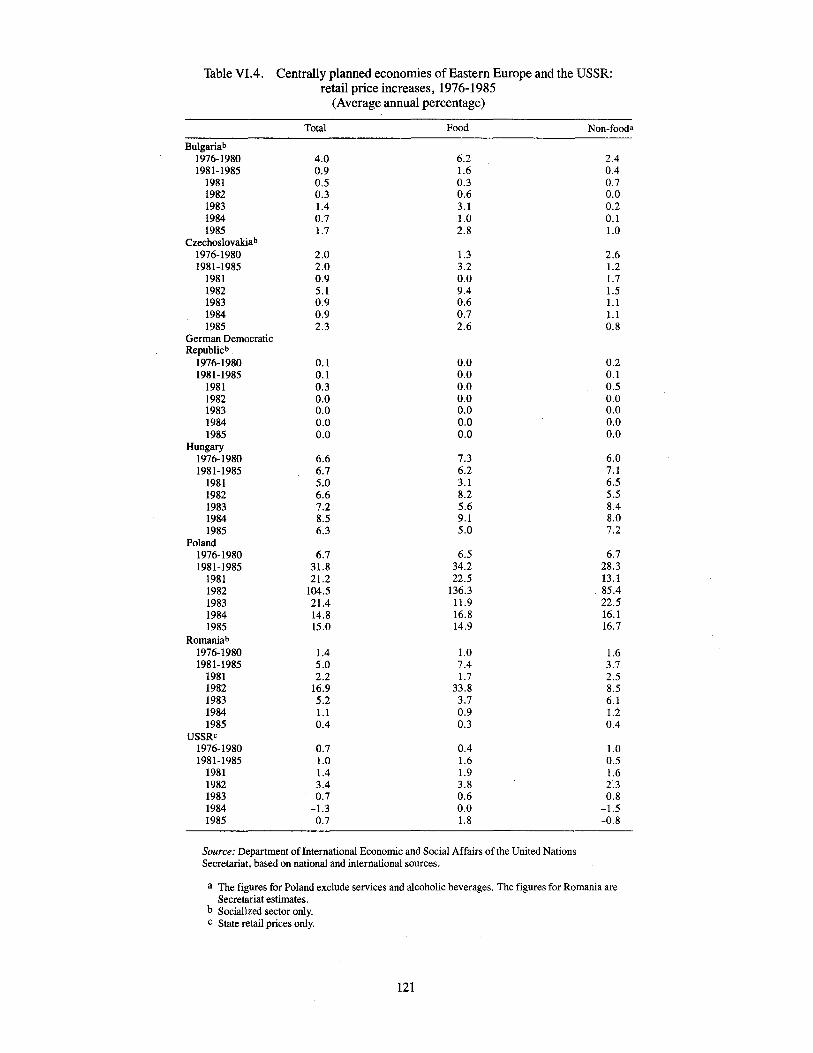
Table VIA. Centrally planned economies of Eastern Europe and the USSR:retail price increases, 1976-1985
(Average annual percentage)
Total Food Non-food'
Bulgariab
1976-1980 4.0 6.2 2.41981-1985 0.9 1.6 0.4
1981 0.5 0.3 0.71982 0.3 0.6 0.01983 1.4 3.1 0.21984 0.7 1.0 0.11985 1.7 2.8 1.0
Czechoslovakiab
1976-1980 2.0 1.3 2.61981-1985 2.0 3.2 1.2
1981 0.9 0.0 1.71982 5.1 9.4 1.51983 0.9 0.6 1.11984 0.9 0.7 1.11985 2.3 2.6 0.8
German DemocraticRepublicb
1976-1980 0.1 0.0 0.21981-1985 0.1 0.0 0.1
1981 0.3 0.0 0.51982 0.0 0.0 0.01983 0.0 0.0 0.01984 0.0 0.0 0.01985 0.0 0.0 0.0
Hungary1976-1980 6.6 7.3 6.01981-1985 6.7 6.2 7.1
1981 5.0 3.1 6.51982 6.6 8.2 5.51983 7.2 5.6 8.41984 8.5 9.1 8.01985 6.3 5.0 7.2
Poland1976-1980 6.7 6.5 6.71981-1985 31.8 34.2 28.3
1981 21.2 22.5 13.11982 104.5 136.3 85.41983 21.4 11.9 22.51984 14.8 16.8 16.11985 15.0 14.9 16.7
Romaniab
1976-1980 1.4 1.0 1.61981-1985 5.0 7.4 3.7
1981 2.2 1.7 2.51982 16.9 33.8 8.51983 5.2 3.7 6.11984 1.1 0.9 1.21985 0.4 0.3 0.4
USSRc1976-1980 0.7 0.4 1.01981-1985 1.0 1.6 0.5
1981 1.4 1.9 1.61982 3.4 3.8 2.31983 0.7 0.6 0.81984 -1.3 0.0 -1.51985 0.7 1.8 -0.8
Source: Department oflnternational Economic and Social Affairs of the United NationsSecretariat, based on national and international sources.
a The figures for Poland exclude services and alcoholic beverages. The figures for Romania areSecretariat estimates.
b Socialized sector only.c State retail prices only.
121

and demand and of ensuring better synchronization betweenconsumer prices and production costs. State subsidies forsome consumer goods are expected to be curtailed or removed altogether, which is bound to entail painful adjustments, especially if trade results are passed on to domesticprices on a regular basis. 19 When indicated in the plans for1986-1990, consumer price increases are to be less pronounced than those realized in the preceding medium-termplan period. 20
The five-year plans for Bulgaria, the German DemocraticRepublic and the Soviet Union reaffirm the commitment tostable or only slowly increasing consumer price levels, butthe plans of several other countries stress that the role ofprices should be further increased. Producer prices in particular are slated to serve the intended structural change inthe economies, to contribute to the phasing out of outdatedproduction and to speed up the introduction and productionof high-level technology. In the consumer sphere, more active retail price policies are to be pursued, in most casessubject to the social priority of maintaining positive real income gains. At the same time, the synchronization of retailprices with socially necessary outlays, economy-wide priorities and the user properties of goods and services are to bepursued.21 In some cases, this may entail price reductions ifthe currently planned capital resources are appropriated andproduction efficiency raised.
External trade and fmance
During the period 1981-1985, the European plannedeconomies made rapid and sharp adjustments in their external trade and finance: some of them had been adopted astargets in the medium-term plans; others were necessitatedby unexpected developments. Most countries shifted from alarge trade deficit, especially in convertible currency relations, to a sizeable surplus.
Pronounced fluctuations occurred not only in trade levels,but also in the geographical direction and commodity composition of trade. Some ofthese shifts stemmed from differential price movements in alternative currency markets andin the main product groups. There were also pronouncedchanges in export quantums, however, especially in 19821984; changes in import volumes were made conditional onexport performance. This stance was eased in 1985 and theearlier gains were partly reversed - a trend that has continued in 1986-1987. The plans and, even more so, the accompanying policy discussions emphasize that, if the externaladjustment efforts of the early 1980s are to bear fruit in themedium to long term, it is necessary to overcome these set-
backs, to promote exports of goods with a substantial valueadded content and to consolidate the potential to participatemore fully and fruitfully in global markets.
Three key characteristics of trade developments in theearly 1980s were the efforts to generate convertible currency surpluses, largely through import cuts; the difficultyencountered by most countries in sustaining sizeable gains inexport volumes; and unusual differences in price movements among commodity classes and partner groups. Cutting the convertible currency deficit and generating asurplus constituted the greatest success. From substantialconvertible currency deficits, especially with the developedmarket economies (see table VI.5), all Eastern Europeancountries went into surplus by 1982 and, except for Bulgariaand Hungary, sustained it, though at a lower level, through1985. The quick and marked improvement in the currentaccounts was principally an outcome of recent highly restrictive policies that, at the same time, weakened the capacity of the countries concerned to regain a more expansionaryeconomic policy. The improvement in the current accountand related trade transformations allowed most of the Eastern European countries to service their external debt in anorderly manner and to ease the external payments constraintby mid-decade. That constraint continues to be quite confining, particularly in Poland and Romania.
Current account considerations were less acute for theUSSR than for Eastern Europe. However, the sharp ups anddowns in feed grain imports because of domestic harvestfluctuations, the buoyant demand for technology importsand the recent erosion of export revenues because of the oilprice slide have caused the USSR to be more concernedabout its external equilibrium. This is having an importantimpact on policy aims for the latter half ofthe 1980s.
Adjusting trade imbalances by cutting imports has been afeature of the response of the planned economies to externalpayments problems. Table VI.6 shows the movements intrade by source and destination. Unsynchronized changes inthe prices of different commodities have constituted one ofthe most difficult problems confronting a large number ofcountries. In the case of the centrally planned economies,there were also differences in the price movements amongmajor partner groupings, because of the institutional features of CMEA trade and payments mechanisms. Most important in this respect is that, since 1976, CMEA tradeprices for many key products, especially fuels, foodstuffsand industrial raw materials, have been derived essentiallyfrom an average of reference world market prices for thefive preceding years.
The regional price differentiation within CMEA has had
19 This is mainly so for Czechoslovakia, Hungary and Poland where external prices have an impact on producer prices. For Hungary, see theinterview with Rezs8 Nyers in FigyelO (Budapest), 22 May 1986, p. 3.
20 The Hungarian plan, for example, specifically targets an anti-inflationary economic policy with emphasis on price and fiscal policy as well ason the further development of market relations. It is considered that inflationary pressures should be fought by economic policy and not bydirect government interference. The plan aims at a substantial deceleration in the growth of consumer prices from 6-7 per cent a year in1981-1985 to about 5 per cent (see Nepszabadsag (Budapest), 23 December 1985 (Supplement), p. 25 and T. Erdos, "Leszorfthat6-e azinflaci6s rata?", Tarsadalmi Szelmle (Budapest), No.6 (1985), pp. 31-41).
21 This was stressed especially in the Soviet draft plan (see (Moscow), 9 November 1985, pp. 1-6).
122

Table VI.5. Centrally planned economies of Eastern Europe and the USSR:trade balances, 1981-1985
(Billions of United States dollars)
1981-1985 1981 1982 1983 1984 1985
BulgariaTotal -0.5 -0.1 -0.1 -0.2 0.1 -0.3Centrally planned economies -2.7 -0.8 -0.8 -0.5 -0.4 -0.2Developed market economies -3.3 -0.7 -0.6 -0.4 -0.6 -0.9Developing economies 5.5 1.4 1.3 0.8 1.1 0.8
CzechoslovakiaTotal 0.6 0.2 0.2 0.1 0.1 -0.1
Centrally planned economies -2.9 -0.1 -0.3 -0.7 -0.9 -0.8Developed market economies -0.2 -0.3 -0.1 -0.0 0.2 0.1Developing economies 3.7 0.7 0.7 0.9 0.8 0.6
German Democratic RepublicTotal 7.2 -0.3 1.5 2.3 1.9 1.8Centrally planned economies 2.2 -0.3 0.0 0.9 0.9 0.6Developed market economies 3.1 -0.5 0.8 0.9 0.8 1.1Developing economies 2.0 0.5 0.7 0.5 0.2 0.1
HungaryTotal 0.5 -0.4 -0.0 0.2 0.5 0.3Centrally planned economies 1.6 0.4 0.3 0.2 0.3 0.4Developed market economies -2.1 -1.1 -0.6 -0.0 0.2 -0.6Developing economies 1.1 0.3 0.3 0.1 0.0 0.4
PolandTotal 1.5 -2.2 1.0 1.0 1.1 0.7Centrally planned economies -3.9 -2.2 -0.5 -0.5 -0.4 -0.3Developed market economies 2.0 -0.6 0.5 0.7 0.9 0.5Developing economies 3.3 0.5 1.0 0.7 0.6 0.4
RomaniaTotal 10.2 0.2 1.8 2.5 3.2 2.6Centrally planned economies 1.1 -0.1 0.2 0.2 0.4 0.4Developed market economies' 8.6 0.2 1.4 2.2 2.5 2.3Developing economies' -1.8 0.1 -0.1 -0.2 -0.7 -0.9
USSRTotal 41.8 6.2 9.3 11.2 11.0 4.0Centrally planned economies 21.9 6.0 4.4 4.0 4.0 3.6Developed market economies 1.3 -1.2 -0.0 1.3 2.2 -0.8Developing economies 18.5 1.5 4.9 5.9 4.9 1.3
Source: Department ofInternational Economic and Social Affairs of the United NationsSecretariat, based on national and international sources.
a Because no subgroup totals are available, the data for developed market economies anddeveloping economies are based on the sum of the reported bilateral trade flows.
both favourable and unfavourable repercussions. The delayed transmission of global price changes into the CMEAprice formula undoubtedly eased the adjustment burden inthe short run. Because CMEA countries provide more thanthree quarters of their energy imports, the Eastern Europeancountries were initially shielded against the sharp price fluctuations in world markets, except on the margin. At the sametime, the muted and delayed transmission of global pricechanges blunted the incentive to seek early and speedy adjustment to emerging imbalances. The structural transformations brought about to date have been slower and moreconfined than would have been desirable. This circumstancemay exert a powerful influence on prospective changes ineconomic mechanisms.
123
Most of the five-year plans disclose only general intentions with respect to the planned growth in the level, commodity composition and geographical direction of trade. Butthe policy-related discussions, including those relating to recharting long-term CMEA co-operation, contain sufficientinformation to deduce intended trade policies for the nearfuture.
The ability of the European planned economies to intensify their trade dependence, as intended, is largely a functionofdemand, special CMEA co-operation arrangements, theirproductive potential and their success in boosting exports ofmanufactures. Such success depends on the institutionalcharacteristics of the trade mechanisms of these countries,
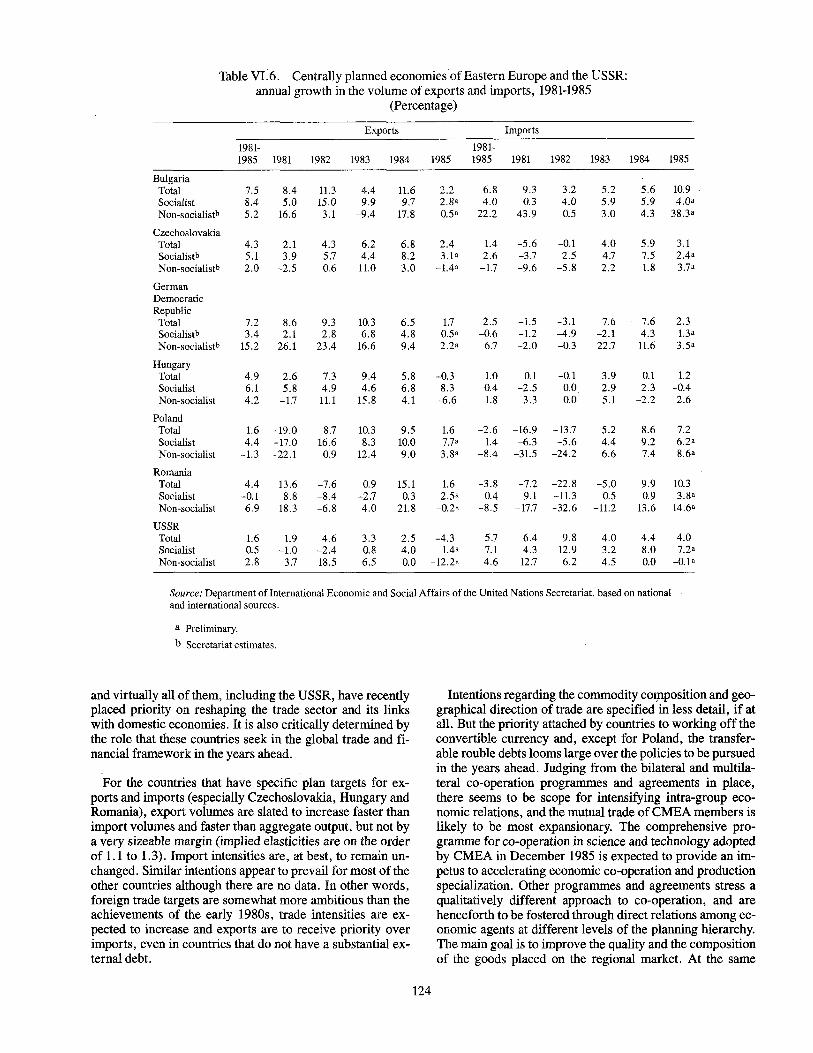
Table VI.6. Centrally planned economies of Eastern Europe and the USSR:annual growth in the volume of exports and imports, 1981-1985
(Percentage)
Exports Imports
1981- 1981-1985 1981 1982 1983 1984 1985 1985 1981 1982 1983 1984 1985
BulgariaTotal 7.5 8.4 11.3 4.4 11.6 2.2 6.8 9.3 3.2 5.2 5.6 10.9Socialist 8.4 5.0 15.0 9.9 9.7 2.8a 4.0 0.3 4.0 5.9 5.9 4.0aNon-socialistb 5.2 16.6 3.1 -9.4 17.8 0.5a 22.2 43.9 0.5 3.0 4.3 38.3a
CzechoslovakiaTotal 4.3 2.1 4.3 6.2 6.8 2.4 1.4 -5.6 -0.1 4.0 5.9 3.1Socialistb 5.1 3.9 5.7 4.4 8.2 3.1 a 2.6 -3.7 2.5 4.7 7.5 2.4aNon-socialistb 2.0 -2.5 0.6 11.0 3.0 -1.4a -1.7 -9.6 -5.8 2.2 1.8 3.7a
GermanDemocraticRepublic
Total 7.2 8.6 9.3 10.3 6.5 1.7 2.5 -1.5 -3.1 7.6 7.6 2.3Socialistb 3.4 2.1 2.8 6.8 4.8 0.5a -0.6 -1.2 -4.9 -2.1 4.3 1.3aNon-socialistb 15.2 26.1 23.4 16.6 9.4 2.2a 6.7 -2.0 -0.3 22.7 11.6 3.5a
HungaryTotal 4.9 2.6 7.3 9.4 5.8 -0.3 1.0 0.1 -0.1 3.9 0.1 1.2Socialist 6.1 5.8 4.9 4.6 6.8 8.3 0.4 -2.5 0.0 2.9 2.3 -0.4Non-socialist 4.2 -1.7 11.1 15.8 4.1 -6.6 1.8 3.3 0.0 5.1 -2.2 2.6
PolandTotal 1.6 -19.0 8.7 10.3 9.5 1.6 -2.6 -16.9 -13.7 5.2 8.6 7.2Socialist 4.4 -17.0 16.6 8.3 10.0 7.7a 1.4 -6.3 -5.6 4.4 9.2 6.2aNon-socialist -1.3 -22.1 0.9 12.4 9.0 -3.8a -8.4 -31.5 -24.2 6.6 7.4 8.6a
RomaniaTotal 4.4 13.6 -7.6 0.9 15.1 1.6 -3.8 -7.2 -22.8 -5.0 9.9 10.3Socialist -0.1 8.8 -8.4 -2.7 0.3 2.5a 0.4 9.1 -11.3 0.5 0.9 3.8aNon-socialist 6.9 18.3 -6.8 4.0 21.8 -0.2a -8.5 -17.7 -32.6 -11.2 13.6 14.6a
USSRTotal 1.6 1.9 4.6 3.3 2.5 -4.3 5.7 6.4 9.8 4.0 4.4 4.0Socialist 0.5 -1.0 -2.4 0.8 4.0 1.4a 7.1 4.3 12.9 3.2 8.0 7.2aNon-socialist 2.8 3.7 18.5 6.5 0.0 -12.2a 4.6 12.7 6.2 4.5 0.0 -O.l a
Source: Department of International Economic and Social Affairs of the United Nations Secretariat, based on nationaland international sources.
a Preliminary.
b Secretariat estimates.
and virtually all of them, including the USSR, have recentlyplaced priority on reshaping the trade sector and its linkswith domestic economies. It is also critically determined bythe role that these countries seek in the global trade and financial framework in the years ahead.
For the countries that have specific plan targets for exports and imports (especially Czechoslovakia, Hungary andRomania), export volumes are slated to increase faster thanimport volumes and faster than aggregate output, but not bya very sizeable margin (implied elasticities are on the orderof 1.1 to 1.3). Import intensities are, at best, to remain unchanged. Similar intentions appear to prevail for most of theother countries although there are no data. In other words,foreign trade targets are somewhat more ambitious than theachievements of the early 1980s, trade intensities are expected to increase and exports are to receive priority overimports, even in countries that do not have a substantial external debt.
124
Intentions regarding the commodity composition and geographical direction of trade are specified in less detail, if atall. But the priority attached by countries to working off theconvertible currency and, except for Poland, the transferable rouble debts looms large over the policies to be pursuedin the years ahead. Judging from the bilateral and multilateral co-operation programmes and agreements in place,there seems to be scope for intensifying intra-group economic relations, and the mutual trade of CMEA members islikely to be most expansionary. The comprehensive programme for co-operation in science and technology adoptedby CMEA in December 1985 is expected to provide an impetus to accelerating economic co-operation and productionspecialization. Other programmes and agreements stress aqualitatively different approach to co-operation, and arehenceforth to be fostered through direct relations among economic agents at different levels of the planning hierarchy.The main goal is to improve the quality and the compositionof the goods placed on the regional market. At the same

time, jointly agreed output targets are to address shortagesand make up for the non-availability of goods and servicesfrom market economies that arise because of foreign exchange shortages or because of economic and other impediments between East and West.
The quantitative goals for intra-group trade are ambitious.According to the recently concluded medium-term tradeagreements, the targets for increasing reciprocal bilateraltrade flows range between 3.5 and nearly 10 per cent a year,most being between 5.5 and 7 per cent. This suggests a further shift in the direction of trade in favour of CMEA partners. There appear to be similar intentions of high growth ofreciprocal trade volumes with socialist countries that are notmembers of CMEA, particularly China and Yugoslavia.
Relations with the market economies in the years aheadwill depend on East-West economic relations, the successwith which convertible currency debts can be serviced andthe ability of the developing countries to increase their tradewith the centrally planned economies without gaining accessto substantial new capital inflows. These constraints arelikely to be more confining for trade with developed marketeconomies than for economic relations with many developing countries. The experiences of the 1980s show that economic relations among the planned and developing countryeconomies gain from having contractual and institutionalmechanisms that reflect the special features of trade amongcountries having different socio-economic systems. In thisrespect, the conclusion of long-term intergovernmentalagreements has generally been highly conducive to trade.
More attention has now to be given to flexibility in tradebetween planned economies and developing countries. Especially critical are provisions that permit faster adaptationto a changing environment, including prompt trade information and the dovetailing of plans by commodity groups andindividual projects. The scope and forms of economic tiesunder long-term agreements could be made less rigid. Another set of problems, which became especially pronouncedin the first half of the 1980s, derives from the paymentssystem. Payment constraints for both the developing countries and the planned economies seriously impeded trade.Both groups need to look for forms of payment that supportan expansion of their economic relations. Related to this isthe need to leave room for exports of manufactures from thedeveloping countriesio the centrally planned economies.
In the long run, manufactures can find a stable market inthe centrally planned economy countries only if those countries' policy decisions regarding economic structures createa demand for them. A mutually beneficial adjustment proc-
ess must necessarily be based on prevailing comparative advantages, industrial development ambitions and theextension of industrial co-operation. In their plims andguidelines for 1986-1990, the centrally planned economiessee the extension of industrial co-operation as the basicmeans of strengthening their economic relations with the developing countries.
The impact of the expressed intentions regarding tradeand international economic co-operation depends on twocritical features. First, a proper political and strategic climate between East and West is a prerequisite for buoyantcommercial and financial intercourse. Recently profferedinitiatives to strenthen confidence in these relations are important. Similar interest expressed by several planned economies, including the USSR, in co·-operating more closelywith international organizations, such as the General Agreement on Tariffs and Trade (GATT), the World Bank and theInternational Monetary Fund. 22 may signal a major departure from the post-war attitude of these countries towardssuch organizaitons. 23 Likewise, the leaders of some plannedeconomies have proposed a framework agreement betweenthe European Economic Community and CMEA. It is important that the international community examine these andsimilar overtures in depth. Perceived obstacles should befully explored before potentially important initiatives aresummarily rebuffed. 24
The second requirement for enhanced relations betweenplalmed and market economies is a continuation of the modifications in the organization and decision-making of theplanned economies. Obstacles inhibiting more flexible andmore extensive participation in the global economy couldusefully be removed, subject to concordance with domesticsocia-economic and political precepts. Modifications of thetrade mechanism have been at the forefront of the ongoingchanges in economic mechanisms and policies. It would certainly be helpful if the efforts of the centrally planned economies were to be complemented by measures in marketeconomies to reduce and eventually eliminate hindrances totrade between East and West.
CMEA integration and regional economic co-operation
The process of enhancing the dovetailing of the CMEAeconomies is regulated by a variety of bilateral and multilateral agreements. The national medium-term plans are synchronized at the CMEA level, inter alia, through themedium-term trade agreements and the specific protocolsabout joint projects included in the Concerted Plan of Multilateral Integration Measures. 25 The implications of the Plan
22 The evolution of this attitude towards the international monetary system, as well as ways in which these countries could co-operate in thatsystem, are explored in "International monetary reform and the socialist countries", in Supplement to World Economic Survey 1985-1986(United Nations publication, Sales No. E.86.II.C.2), pp. 1-27.
2J Some ofthe countries -- most recently Poland in late May 1986 - have already joined the Fund and the Bank. Others have explored ways inwhich they can co-operate more closely with these institutions.
" The request made by the USSR in August 1986 to accede to GATT as an observer may be mentioned as an example.25 This instrument of CMEA integration was first introduced for the medium-term period 1976-1980. It is now a standard part ofthe CMEA-wide
negotiations concerning the co-ordination of plans. It is directly linked to longer-term integration documents, such as the programme onscientific and technological co-operation discussed below.
125

and of the trade agreements are integral components of thenational five-year plans for each country. Seen within thisframework, the new medium-term plans emphasize a continuation of past integration efforts, but with a shift in emphasis towards technological co-operation and economicintensification.
Fostering productivity growth through more intensiveparticipation in global trade and finance was slated as a pivotal component of the five-year plans for 1981-1985. Inview of the constraints on economic relations with the developed market economies, which had been rising since themid-1970s, accelerated integration within CMEA becamethe prime focus of foreign economic policies. Target programming was to be the most important vehicle to facilitateeconomic integration, primarily among the EuropeanCMEA members. Five Target Programmes for enhancingregional economic co-operation (in fuels and primary rawmaterials, agriculture and foodstuffs, transportation, machine-building, and manufactured consumer goods) wereelaborated in the second half of the 1970s. They comprisedsome 340 projects, the majority of which were to be initiatedduring the first half of the 1980s, in part through the SecondConcerted Plan.
These Programmes were designed to be a common policyfor structural adjustments and were intended to redress theprevailing domestic and external imbalances in some member countries, to support growth, to secure greater regionalself-sufficiency in producer and consumer goods, and to expand and modernize the transportation sector. However, inview of the adverse developments in foreign trade and payments, particularly in 1981-1983, many of the measures envisaged iJ1. the Target Programmes had to be postponed andeventually their goals and modus operandi had to be re-examined in detail. The elaboration of a common policy forstructural adjustment is, therefore, once again high on theagenda of national and regional policy measures associatedwith the current five-year plans.
At the forty-first (special) meeting of the Session ofCMEA held on 17 and 18 December 1985, member countries adopted the comprehensive programme for co-operation in science and technology, which had first beenenunciated at their economic summit meeting in June 1984.26
The programme envisages the acceleration of technologicalprogress through bilateral and multilateral agreements reflected in the annual and medium-term plans. 27 Specifically,
the programme aims at speeding up scientific and technological progress in the productive sphere in five broad areas:electronics, automation, nuclear energy, new materials andtechnologies, and biotechnology. In these sectors, CMEAmembers hope not only to catch up with existing scientificand technological know-how, but to surpass it and reach thefrontier of research and industrial application, at the latestby the turn of the century. Such advances should permit acceleration of the pace of productivity growth in the CMEAregion as a whole so that average labour productivity will beat least twice the present level by the year 2000 and the material content, especially energy and critical raw materials, ofaggregate national output will be drastically reduced.
One of the fundamental aims of the programme is the creation of mutually compatible technologies throughout theCMEA area, and so the scope for production specializationand trade intensification is to be broadened significantly.The bases for generating technological progress and improving productivity could be radically altered during theimplementation of the programme. A key provision is theemphasis on direct relations among enterprises, associationsand scientific and technical institutes through concrete protocols and contracts. In addition, special bilateral or multilateral organizations may be set up to tackle particular issuespertaining to the acceleration of technological progress andproductivity growth. Financing will be arranged throughregular budgetary appropriations as well as through loansfrom the two CMEA banks. In addition, special funds maybe set up for some of the concrete agreements yet to beworked out.
Since the adoption of the programme in late 1985, CMEAmembers have decided on a number of concrete steps towards carrying out the programme, and the modalities for itsimplementation have been discussed in depth. The programme comprises a total of93 separate research projects tobe finalized in the next three years; most of them are alreadyregulated by concrete agreements concluded in the course of1986. Each project includes a number of "topics" or subprojects and, at a still more disaggregated level, severalthousand "themes" or targets. 28 Unlike earlier forms of scientific and technological co-operation, each project is to beheaded by a specialized Soviet entity that ,is invested withextensive executive powers in order to foster direct and permanent intra-group links in research, development and production. 29 The realization of these goals will require seriouschanges in the structure of CMEA, and in the style and
26 The programme is entitled "Comprehensive Programme to Promote the Scientific and Technological Progress of the Member Countries of theCouncil for Mutual Economic Assistance up to the year 2000". It was published in all the main Communist Party newspapers of 19 December1985.
21 A number of elements were already in place at the end of 1985 because of the bilateral programmes of scientific and technical co-operation thathad been negotiated earlier, in the first place between the majority of the Eastern European countries and the USSR.
28 See Ondrej Ur, "Komplexnf program vedeckotechnickeho pokroku zemf RVHP - vyznam organizacf-koordimitoru", Svet Hospodti'fstvf .(Prague), No. 42 (1986), p. 1.
29 See Izvestia (Moscow), 22 March 1986, p. 1, Nedelya (Moscow), No. 27 (1986), pp. 6-7, Vyacheslav V. Sychev, "Novye rubezhinauchno-tekhnicheskogo sotmdnichestva", Ekonomicheskoe sotrudnichestvo stran-chlenov SEV (Moscow), No.1 (1986), pp. 14-19; andVyacheslav V. Sychev, "Novye mbezhi nauchno-tekhnicheskogo progressa stran-chlenov SEV", Planovoe khozyaistvo (Moscow), No.4(1986), pp. 14-51.
126

methods of its activities. 30 These goals are to be pursued, asare the objectives of the programme, in conjunction with theongoing changes in institutions, policies and instruments detailed in national plans and the related policy discussions.
Changes in the economic mechanisms
Most of the policy discussions on the 1986-1990 plans,and some of the finalized plans themselves, emphasize theneed for some type of economic reform in order to fosterintensive development, focusing on efficiency, productivityand quality. Perhaps the largest change is envisaged in thecharacter of traditional central planning. Major weaknessesof directive planning (such as insufficient flexibility, the unwillingness or inability of central authorities to deny resources to entrenched ministerial or local interests, the lackof adequate incentives to promote quality, innovation andefficiency, and the inclination of economic units to overspend) became major liabilities at the beginning of the 1980sand are to be mitigated by directing central planning increasingly towards strategic long-term development aims.
Changes in economic mechanisms have been under way insome countries for some time and announced in others. Allcountries have tried to improve management both below andabove the enterprise level. Within enterprises, smaller andmore compact organizational units, in most cases "brigades", have gradually taken responsibility for the fulfilment of plan targets. Labour remuneration is increasinglybeing linked to performance. Above the enterprise level,new associations are being created, including amalgamations of enterprises within branches or sectors.
A second feature of the early 1980s is the wider use ofcost-accounting principles at all organizational levels. Insome countries, this has been applied to whole ministries; inothers, to selected institutions. A third common element isthe use of indicators of economic performance that areclosely connected with cost-accounting principles. In mostof the countries, the number of obligatory norms for enterprise performance was lowered. This was accompanied by ashift from gross physical and value indicators to net valueindicators, such as net normative output, income andprofit. 3
!
Fourthly, internal prices have been better aligned withworld prices. This has been notably the case for energy andraw material inputs, in order to foster rationalization andgreater cost consciousness. For wholesale prices and, to asmaller degree, for retail prices, reforms have taken place inall countries and the new plans leave no doubt that furtherchanges are in the offing. 32
Finally, the general requirements for improving plan discipline and more dynamic entrepreneurship have been reexamined. In Hungary, this has led to a deliberateacceleration of economic reform, while in other countries ithas taken the form more of an adjustment to the existingsystems. 33
Much has been done to improve the economic mechanismin the USSR as a result of the economic experiments conducted since 1983: the rights of some industrial productionassociations in planning and day-to-day operations, including labour organization and remuneration have been expanded; at the same time, these organizations are held morefully responsible for the results of their work. In consequence, a higher degree of fulfilment of the assignments forproduct sales have emerged and labour incentives have beenstrengthened. 34 After an evaluation of the experiment, it wasdecided to move on towards the creation of an "intergratedsystem of management and control" ,35 which has been underway since early 1986 for formal introduction mainly in1987. As one of the important elements of this system, priceformation has received special attention, although there isnot as yet a clear consensus among experts on desirable pricereforms and the management of prices. 36 More recently, therole of foreign trade in economic development, the decentralization of foreign trade operations in certain activitiesand the linking of trade and domestic economic sectors havebeen at the focus of policy attention.
Most countries are considering changes, or extensions ofmodifications recently enacted, in their management andplanning systems. The scope ofthese intended changes varies from country to country. Almost all the five-year plansforesee a widening of the rights and responsibilities ofenterprises in planning, production and investment decisions. Insome cases, this implies the abolition of high-level management tiers and ministries; in others, it reinforces the role of
30 Vyacheslav V. Sychev, loc. cit., p. 19. The importance that these economies accord to this programme is shown by two further pieces ofevidence. Soon after the programme was adopted, two new standing commissions (one for new and renewable materials and the other forbiotechnology) were created. These are crucial CMEA organs for the examination of technical materials, organization and management ofproduction co-operation and specialization, and are the nodal points for the preparation of feasible alternatives for decisions by higher-levelCMEA organs. The other instance concerns the dovetailing of the modes of implementation of the programme with the ongoingtransformations in the economic mechanisms of a number of CMEA members.
31 G. Shilina, "Ekonomicheskie normativy v sisteme khozyaistvennogo mekhanizma", Voprosyekonomiki (Moscow), No. II (1985), pp.43-49.
J2 For a recent broad-ranging, yet succinct, recent review of Eastern European price policies, see N. Mitrofanova, "Sistema kontrolya tsen vstranakh SEV", Voprosy ekonomiki (Moscow), No.7 (1986), pp. 109-118.
33 A. Bachurin, "Khozraschet v sisteme upravlenia ekonomikoy", Planovoe khozyaistvo (Moscow), No. 12 (1985), pp. 31-42.J4 For a summary of the results of the economic experiments, see A. Milyukov, "Novye formy upravlenia v deistvitelnosti" , Ekonomicheskaya
gazeta (Moscow), No. 33 (1985), pp. 9-10.35 From the resolution of the Central Committee as reproduced in Kommunist (Moscow), No.4 (1986), p. 29.35 See N. Glushkov, "Planovoe tsenoobrazovanie: puti sovershenstvovania", Kommunist (Moscow), No.3 (1985), pp. 38-48; I. Lipsits,
"Sovershenstvovanie khozyaistvennogo mekhanizma tsenoobrazovania", Ekonomicheskie nauki (Moscow), No.7 (1985), pp. 12-18; A.Komin, "Tekhnichesky progress i tseny", Planovoe khozyaistvo (Moscow), No. 10 (1985), pp. 13-20; and A. Gorodetski, "Khozraschet ioptovye tseny", Voprosyekonomiki (Moscow), No. 11 (1985), pp. 11-21.
127

medium-level associations of enterprise:s, such as the Kombinate in the German Democratic Republic.
The plans emphasize the need for a stricter link betweenthefinancial means ofenterprises and their performance; forgreater financial responsibility and hence less reliance onthe state budget; and for increasing opportunities to mobiljzeretained earnings for expansion and modernization. Moreactive use of credit in investment, including stricter creditconditions, is also being entertained. In nearly all countries,the number of mandatory enterprise indicators is being curtailed, in some cases quite sharply.37 Contractual agreementsamong enterprises for their sales and purchases will be widened, and they will eventually become the dominant mode ofinter-enterprise transactions in a number of economies.
All plans stress that scientific and technological excellence is indispensable to the development and large-scaleapplication of key technologies. There are basically two approaches to this goal. One emphasizes even more vigorousadherence to centrally set research and development schedules. The other looks for more flexible co-operation between research and development institutions andproduction, and for further decentralization of research anddevelopment activities. 38
Flexible price formation and sensitivity to changes in demand are called for. Price levels need to be linked not only tothe cost of inputs, but also to the qualitative properties ofgoods and consumer demand. In other words, demand conditions are to play a more effective role in determiningprices. Some countries plan to keep retail prices for basicgoods and services stable throughout the plan period, although prices of new consumer products of high quality areto be modified as required.
In some countries, the regulations that apply to industryand agriculture differ. Most give top priority to encouraging
output and productivity in agriculture. The methods explored include delegating greater decision-maldng powersto agro-industrial complexes, collective farms and statefarms; reducing waste by mechanizing storage, transportation and processing of farm output; and applying contractsystems for groups and even families. In the USSR, farmsare encouraged to use their own funds and raise bank loansto expand production. Cost-accounting principles are to beapplied to agro-industrial complexes and farms, just as theyare to industrial enterprises. This implies that the wages offarm workers will be contingent on the income earned bytheir unit. 39 It is not clear, however, whether retail prices inthis sector are also to become more flexible than in the past.If so, procurement prices would have to be modified4D andthe state subsidy schemes would need to be re-examined. 41
One of the most general. objectives is to improve the economic determinants of accumulation, including investmentdecisions and their financing, especially in view of the difficulties in financing investment expenditures encountered inthe early 1980s. In a number of countries, especially theUSSR, the share of funds left at the discretion of enterprisesin 1981-1985 remained well below the levels envisaged inadministrative and legal provisions;42 this made it impossiblefor enterprises to employ their financial resources effectively and profit margins shrank as a result. 43 Another consequence was the practice of using amortization funds tofinance new investment projects instead of leaving them atthe disposal of enterprises for maintenance and replacement.
In some countries, the plan calls for a steady decrease incosts not only in industry but also in agriculture and con··struction, although the target rates for the latter sectors areless clear than those for the economy as a whole or for industry.44 This is expected to consolidate the financial base forincreased accumulation. The economic mechanisms in thenew policy guidelines aim at raising cost awareness, espe-
J7 In Czechoslovakia, for example, from 1986 on, there are only two compulsory plan indicators in agriculture: one each for grain and livestockproduction (see Hefi Vilaggazdasag (Budapest), 22 March 1986, p. 13). In the German Democratic Republic, net production, profits, productsand services for the consumer markets, and exports are to be used as the essential targets at all levels of management and planning.
38 The USSR in particular is emphasizing the creation of interbranch associations for the purpose of acceleratingscientific and technologicaldevelopment. Hungary specifically aims at increasing the role of enterprises in deciding upon the share of total outlays to be appropriated forresearch and development. The Kombillate in the German Democratic Republic already integrate basic research, development and applicationin production.
3\' Concrete regulations in the USSR include (a) a 50 per cent price bonus on the production of major commodities above the average 1981-1985level, regardless of whether output actually reaches the new, and higher, 1986-1990 official targets; (b) both state and collective farms will beable to sell 30 per cent of the fruit and vegetables produced under the plan targets directly to local shops and restaurants or in private markets;(c) local regional authorities will have the power to fix retail prices for fruit and vegetables in local state shops; and (d) prices will vary fromregion to region. Most of these regulations are to be introduced in full in the course of 1987.
4(J In Czechoslovakia, state subsidies for capital goods are to be limited further, which will necessitate a price increase. Funds thus freed willremain at the disposal of agriculture, however. From I January 1986, the system of the mutual relationship between the growth of wages andadjusted producer costs, already in effect in other production sectors of the national economy, is extended to agriculture too (see Rude Prdvo(Prague), 3 September 1985, pp. 1 and 2 and Hospodarski Novilly (Prague), No. 29 (1985), pp. 1 and 6).
41 The German Democratic Republic is not planning any price increase for agricultural procurement prices, which necessitates a substantial risein price subsidies, as noted in the plan. Retail price subsidies forfoodstuffs rose from 7.8 billion marks in 1980 to 27.6 billion marks in 1985,when they constituted 31 per cent of total monetary allocations to the population from the state budget.
" In 1976-1980, the volume of profit in Soviet industry grew by 30 per cent (in comparable prices), instead of70 per cent as envisaged in thefive-year plan. In 1981-1984, the volume of profit increased by 28 per cent in the economy as a whole, instead of 31 per cent as envisaged (seeB. Plyshevsky, "Teoriya i metodologiya planirovaniya: sovremennoe sotsialisticheskoe nakoplenie", Planovoe khozyaistvo (Moscow), No.3(1986), p. 24).
43 During the first half of the 1980s in the USSR, for example, the reduction in the cost of production in industry practically halted and, inagriculture and constmction, costs increased.
44 For example, in the USSR the cost of industrial production is envisaged to decline by 4-5 per cent in 1986-1990, which means a quadrupling ofthe pace in the previous quinquennium.
128
cially in the investment sphere. The financing of capital investment will be more closely linked to sectoral andenterprise performance, with priority accorded to retoolingand modernization. The transfer ofprofits to the budget willbe set on the basis oflong-term norms. The use of amortization deductions from enterprises for the financing of otherindustrial investment projects will cease, and depreciationallowances will be· retained in the enterprise developmentfund. Higher rates of depreciation are to be introduced in1986-1987. The resulting medium-term increase in the rateof accumulation should give greater impetus to technicalchange.
Important modifications in the economic mechanisms arebeing launched in external trade and finance. Many enterprises are being given greater autonomy in negotiating tradecontracts with foreign trade enterprises, and some have beengetting the authority to engage in trade directly. Some exportrevenues can be retained by these enterprises to finance imports, directly or indirectly, and thus their own expansionand modernization. Another part accrues in the form of bonuses to workers.
In recent years, the desirability of establishing joint ventures has come to the fore. This.affects economic relationswith both market economies and other planned economies.The European planned economies have become convincedthat more active participation in the international division oflabour, especially in the technology-intensive branches, requires closer domestic and foreign inter-company relations.The aim is to attain a higher level of technological sophistication, to use joint ventures to mobilize the benefits of cooperation with foreign partners and to foster investments inhigh-technology sectors without endangering the externalbalance. All European members of CMEA except Albaniaand the German Democratic Republic introduced new ormodified existing legislation in late 1985 or early 1986.
The general characteristic of the changes is a gradual acceptance of certain kinds of foreign direct investment as ameans of invigorating selected domestic economic sectors.The main target has been participation of foreign capital inequity joint ventures, mostly in sectors ofhigh priority. Earlier joint venture laws in Bulgaria, Hungary, Poland and Romania yielded very modest results. This stemmed partlyfrom insufficient guarantees and excessive restrictions,which have since been changed in successive modificationsto provide additional incentives for foreign investors. Countries that passed such laws for the first time during 1986(Czechoslovakia and the Soviet Union) formulated their legislation only after careful study of the results attained overthe years by the first group of countries. Now that the SovietUnion has introduced joint venture legislation and is activelyseeking modernization of foreign trade management, a newdimension may be added to this form of co-operation.
The results of the new legislation will depend on the mo-
dalities for its implementation. Ongoing managerial reforms, other changes in economic mechanisms, recentbilateral agreements concerning CMEA-wide interenterprise relations and the establishment of joint productionentities appear to be mutually supportive. They may alsofoster joint ventures with third countries. Co-operation andspecialization of production within CMEA and more realistic commodity and price relations could be promoted by successful joint enterprise ventures. Because the changes inCMEA co-operation mechanisms likely to come to the forein the next few years are bound to be wider than those dealing with inter-enterprise relations and CMEA joint undertakings, the impact of CMEA integration on co-operationand specialization in production is bound to be still larger.
The forty-second meeting of the CMEA Session was heldat Bucharest in November 1986, when the first year of thecurrent medium-term plan period was coming to a close. Atthat time, economic performance in 1986 had been moremodest than planned. The need to phase out obsolete products and processes, to raise efficiency and find the best waysto accelerate growth were apparently at the centre of thediscussions. Most of the delegations shared the view thatnew forms of co-operation were required. It was stressedthat accelerated growth could be attained in only two ways:by the adoption of more up-to-date methods of management,and by the faster introduction and application of the latesttechnology.
China
Since 1978, when the agenda for rapid and balanced longterm economic growth until the end of the century waspromulgated, China has attained very rapid expansion inboth agriculture a'1d industry. This was particularly so in thefirst half of the 1980s, when aggregate output growth averaged an annual 9.4 per cent (see table VI. 7); the corresponding rates for agriculture and industry were 8.1 per cent and12 per cent. Actual output exceeded plan targets by a considerable margin. At the same time, however, this impressiveperformance has given rise to serious bottle-necks and todomestic and external payments imbalances that need to bedealt with in order to sustain high-level growth and steadyfactor productivity gains.
The current five-year plan of China is the second mediumterm development plan in the context of the economic adjustments and reforms promulgated since the late 1970s.45
The approval of the plan in early 1986 came at a criticaljuncture in the path ofChina's transition to a middle-income,industrial country by the year 2000. The pivotal decisions oneconomic development and reform adopted in 1978, whilemaintaining the traditional goal of high growth, reflectedfundamental changes in the approach to be taken. 46 Unlikethe development policies of the previous three decades,which aimed at maintaining high levels of investment, even
45 Seventh Five-year Plan for Economic and Social Development ofthe People's Republic ofChina (1986-1990): Excerpts, approved on 12 April1986 at the fourth session ofthe Sixth National People's Congress.
46 Decisions promulgated at the Third Plenum of the Eleventh Congress of the Central Committee of the Chinese Communist Party in December1978.
129

Table VI.7. China: average annual growth rates of selectedmacro-economic indicators, 1979-1985
(percentage)
1979- 1981-1985 1986- 1981 1982 1983 1984 19851980 1990
Actual Planned Actual Planned Actual
Net material product 6.7 4.0 9.4 6.7 4.9 8.3 9.8 12.0 12.3
Gross agriculturaloutputa 4.4 4.0 8.1 4.0 6.5 11.3 7.8 12.3 3.0Gross industrialoutputb 9.0 4.0 12.0 7.5 4.3 7.8 11.2 16.3 21.4
Gross fixedinvestmentc 7.3 18.4 W.Od -3.7 17.3 14.1 33.9 35.0
Personalconsumptione 8.2 4.8 9.0 5.0 7.3 5.3 7.6 10.9 14.1
Source: Department oflnternational Economic and Social Affairs of the United Nations Secretariat,based on State Statistical Bureau, Statistical Yearbook ojChina, various issues, and the World Bank.
a Excluding output of village-run industrial enterprises.
b Including output of village-run industrial enterprises.
c In current prices.
d Estimated volume over the entire period relative to the volume of the preceding period reset to anaverage annual rate of growth.
e Per capita.
at the expense of consumption, the new policies have envisaged high growth with immediate improvements in the levelof consumption. Efficiency gains in production through reforms in the economic system and changes in output structure, as well as through new capital formation, are toprovide the backbone of sustained growth.
One key objective of current medium-term planning is tocontinue the drastic readjustment of economic structures.Current development priorities, like those in effect since1978, emphasize the further shift from capital-intensive production toward labour-intensive production of consumptionand light manufactured goods. Bottle-necks in energy infrastructure, transportation and the supply of non-fuel raw materials are to be eased by maintaining substantial growth ofinvestment in those sectors. At the same time, the expansionof foreign trade is expected to continue at more moderaterates than in the late 1970s and early 1980s. The focus ofimport policies is on the acquisition of the technology andmaterials necessary for economic growth and, within theconstraints of foreign exchange availability, for meeting domestic demand for consumer goods to a greater extent thanhas recently been the case.
These output goals are predicated in part on further reforms in enterprise management, finance, prices, wages andforeign trade. Reforms since 1978 have been aimed at raising economic efficiency through decentralization of decision-making. While contributing to rapid growth, they also
resulted in some macro-economic imbalances. The muchlarger than planned expansion of fixed investment and consumption aggravated commodity shortages and inflationarypressures. The imbalances in 1985 threatened the politicalviability of the objective of continued high growth and gaverise to concern that further decentralization would lead toloss of control over the economy.
The 1986-1990 plan is a compromise and emphasizes theneed to slow the pace of reform. However, the commitmentto continued reform ofthe economic system is stated withoutambiguity in the plan. Towards the end of 1986, with theapparent success in moderating the pace of economic expansion that year, the schedule of some reforms, including thoserelating to prices and some financial mechanisms and institutions, appeared to have been moved forward relative to thepolicy tenor of the five-year plan. 47 Since then, however, theapproach to reforms appears to have become more cautiousagain, price reforms in particular being slowed down forfear of aggravating inflationary pressures.
Economic development and the policy setting since1978
By the time the new economic policy agenda was adoptedin 1978, the economy had experienced several years ofvolatile but slow economic growth. The immediate cause was the
47 Editorial in Renmin ribao (People's Daily)(Beijing), 23 November 1986, p. 1.
130

prolonged socio-political uncertainty associated with thecultural revolution and its aftermath. The debilitated policymaking framework threatened to destabilize the structure ofthe economy. The long-term causes were the cumulative effects of a continuation of negative factors, which included achronically unproductive agricultural sector unable to meetdomestic demand, inefficient use of capital resources andlow labour productivity resulting from a lack ofmaterial andother incentives.48 As a result, aggregate output growth declined. It averaged 5.5 per cent in 1971-1978 compared with6.2 per cent in the period 1952-1970 , but there were considerable year-to-year fluctuations. Furthermore, large tradeimbalances began to accumulate in the early 1970s owing todeteriorating terms of trade, sharp increases in food importsand declining exports. Although the deficit was reversed in1976 through the stringent cut-back of imports, poor harvests necessitated substantial increases in food grain importsin 1976 and 1977.
Following the shift in policy in 1978, aggregate outputduring 1979-1980 grew very rapidly. The growth rates ofboth agriculture and industry accelerated, surpassing historical rates and exceeding considerably the averages of theearlier 1970s (see table VI.7). Consumption grew substantially: the share of consumption in aggregate domestic usesof resources rose from 64 per cent in 1978 to 70 per cent in1980, as rural and urban incomes were raised by large increases in agricultural prices, wages and bonuses. However,the budget deficit grew to 5 per cent of the total materialproduct in 1980, on account of retail price subsidies andcentrally financed investment expenditures. With the rapidexpansion of demand, shortages of energy, transport andmaterials became very severe at times. Rapid domesticgrowth and more liberal trade policies accorded priority tothe importation of machinery, equipment and foodstuffs,and the external trade account swung into substantial deficitin 1980.
The response to these imbalances was a number of measures in 1981 to stabilize the economy, primarily a reductionof the money supply (through the sale of government bondsand controls over credit creation). 49 The fiscal deficit wasalso drastically curtailed, primarily through cut-backs inbudgeted investment expenditures in large infrastructuralprojects. Owing to the decentralization of investment financing, the central Government's efforts fell short of curbing the growth ofaggregate investment expenditures in largeinfrastructural projects. However, it proved to be very difficult to impose effective limits on capital formation financedby the local governments, by industries outside the state sector and even by state-owned enterprises with large retained
profits. In the external sector, imports were drastically compressed through restrictions on the importation of machinery and manufactured consumer goods.
The stabilization measures resulted in slower growth in1981. External and domestic deficits were reduced andshortages eased. The 1981-1985 plan adopted in 1982 setmodest targets (see table VI.7), reflecting a recognition ofthe persistence of constraints on rapid growth and the fundamental lack of effective macro-economic management. Theplan opted for balance at the cost of growth, while pressingforward with readjustment and reform.50 By 1982, however,the economy resumed a rate of growth of over 8 per centdespite a target of 4 per cent. Planners were unsuccessful inrestraining the expansion of gross fixed investment, a problem that has continued to plague economic management inrecent years.
The more extensive economic and organizational reformsimplemented in the 1980s modified - and in critical aspectsdiluted - direct governmental controls, without establishing alternative mechanisms for macro-economic management. This loss in the effectiveness of aggregate economicpolicies was particularly evident in the growth of fixed investment, personal incomes and imports that occurred afterthe easing of the administrative measures taken in 1981 tostabilize the economy. The growth of capital investment resumed in 1982, but control over investment was maintaineduntil the end of 1983 through the political coaxing of localgovernment leaders and the imposition of taxes on the use ofretained funds and on investment by enterprises outside theplan. 51 Urban wages also grew modestly through 1983 as nomajor wage increases were mandated and much stricter ruleson awarding bonuses were enforced. Rural incomes continued to rise as the decollectivization of agricultural production proceeded rapidly.
The reform of the financial system, which accorded thebanking sector a more active role in the creatiOn ofcredit forurban and rural enterprises and agriculture, further weakened central control over the supply of money. By early1985, the economy had returned to a rapid rate of growthand domestic and· external imbalances reminiscent of thoseof 1979-1980, but of much more serious magnitudes.
The outstanding development in the Chinese economysince 1978 has been the rapid growth of the agricultural sector. The growth ofagricultural output accelerated from 4 percent in the late 1970s to 8 per cent annually between 1981and 1985 as a result of increased inputs and productivitygrowth (see table VI.7). Record levels ofper capita output of
48 N. Lardy, "Recent Chinese economic performance and prospects for the ten-year plan", in Chinese Economy Post-Mao, vol. 1, Policy andPeiformance, a compendium of papers submitted to the Joint Economic Committee, Congress of the United States, 9 November 1978, pp.50-54.
49 See World Bank, China: Recent Economic Trends and Policy Development, Report No. 4072-CMA, (Washington, D.C., 31 March 1983).50 Sixth Five-year Plan for Economic and Social Development ofthe People sRepublic ofChina (1981-1985), approved on 10 December 1981 at
the fifth session of the Fifth National People's Congress.51 B. Naughton, "Finance and planning reforms in industry", in China sEconomy Looks Toward the Year 2000, vol. I, The Four
Modernizations, selected papers submitted to the Joint Economic Committee, Congress of the United States of America, 21 May 1986, p. 610.
131
the major crops ofgrain, cotton and oil seeds were achieved.The increased productivity of the agricultural sector was adirect result of fundamental changes in agricultural policy,which emphasized material incentives and more decentralized decision-making. In addition, significant growth in capital construction - large-scale hydrological projects forexample - and technological innovations in seeds and otherinputs had occurred in earlier years. 52 Government procurement prices of the major agricultural commodities wereraised by approximately 25 per cent between 1977 and 1982,concurrently with significant growth in private sales in trademarkets. The earlier emphasis on grain production ratherthan cash crops and on local self-sufficiency in grain wasreversed. Centrally mandated cropping patterns for local areas were abolished.53 By 1983, the communal mode of production was completely transformed into a system ofhousehold production, under which land remains collectively owned, but is leased to farmers for up to 15 years;earnings are based on the output of the individual unit ofproduction. Farmers are permitted to transfer their lease andto engage in other production locally or in small towns. 54
The increased mobility of labour and the encouragement ofnon-agricultural production in rural areas has resulted in thesubstantial mobilization and relocation of labour no longerrequired in agriculture.
The main themes underlying industrial policy for 19811985 were readjustment of the structures ofoutput and intensified use of capital. Industrial growth targets were set at anannual level of 4 per cent, and two years of low to moderateperformance elapsed before rapid growth resumed in 1983(see table VI.7). After the buoyant growth of light industryin the late 1970s and early 1980s, the readjustment ofoutputappeared to come to a halt and since 1982 light industry hasgrown more slowly than heavy industry. Between 1981 and1985, the composition of heavy industry shifted towards themachine-building and construction materials sectors, wheregrowth substantially exceeded that of the energy, coal andmetallurgical sectors. With high growth in fixed investment,output of the construction industry also grew very rapidly,but not nearly quickly enough. Bottle-necks in supply, particularly of intermediate goods and infrastructural commodities and services, were not eased to any marked degree inthe early 1980s and were aggravated in 1984-1985. Energyshortages persisted because industries were unable to improve their energy efficiency and because projects had hadto be delayed or cancelled in 1981 in an attempt to stabilizethe economy.
The lack of success in industrial restructuring in the early
1980s stemmed largely from the loss of control over capitalinvestment in industry and, as a result, over the sectoral allocation of investment and growth. Attempts initiated in 1978to intensify the use of capital met with little success as fixedassets grew faster than output between 1979 and 1985.
After administrative and fmancial controls were lifted,fixed investment resumed its rapid growth in 1984 (see tableVI.7). Enterprises had larger retained funds than in the late1970s as a result of the taxation of profits, extended to allenterprises in 1983-1984, in lieu ofthe earlier transfer of netenterprise receipts to the budget. Reform of the financialsystem shifted the control of credit supply for fixed investment and, in particular, for working capital to the banksaway from budgetary allocations, and thereby greatly expanded the availability of funds for extrabudgetary investment.55
The enterprise reforms begun in 1978 were meant to create material incentives for enterprises to raise productivity.In the initial phase of reforms, this was done by allowingenterprises to retain part of their realized profit, which previously had to be transferred entirely to the State. This permitted enterprises to utilize a share ofprofits to raise workerremuneration and benefits, or investment. This was later replaced by a system ofprofit taxation which was structured topermit enterprises to retain the same proportion ofprofits asunder the profit-retention system. 56 However, the implementation of this arrangement remains to be completed and thetaxation system has not yet exploited the incentive effects offiscal policy. 57
Consumption grew rapidly in 1984 and 1985, after a period of moderation since 1981 (see table VI.7). Major determinants were the expansion of personal incomes, theincreased supply of food and consumer goods from the rapidly growing agricultural sector and the easing of imports.Rural incomes expanded markedly owing to the development of non-agricultural production and the increase in procurement and market prices of agricultural commodities. In
.contrast, wages of urban workers rose little between 1980and 1983, as government regulations limited bonuses to twomonths' wages. This control was necessary as enterpriseswith large amounts of funds had little incentive to maximizelong-term profits and chose to improve the short-run remuneration and welfare of workers. The reported disincentiveto productivity was a major consideration in the sharp modification in 1984, which imposed a progressive tax on bonuses exceeding two and a half months of total wages. 58 Inthe same year, bonuses per worker increased by more than
" N. Lardy, "?verview: agricultural reform and the rural economy", in China's Economy Looks Toward the Year 2000... , pp. 325-331.53 But productIOn quotas of the major crops were retained until 1984-1985.54 Central Committee of the Chinese Communist Party, Document No.1, 1984.55 See Jingji ribao (Economic Daily) (Beijing), 25 September 1985, p. 2, and Jingji daobao (Economic Report) (Hong Kong), No. 47 (25
November 1985), pp. 27-28." B. Naughton, op. cit., pp. 607-609 and 611-613." The ~act that the propo~ed capital use tax was not generally in force in 1985 contributed to the high level of demand for fixed investment by
keepmg th.ecost of capI~1 to enterprises artificially low. Other unreformed aspects of enterprise management, particularly the weak financiala~countablhty ofenterpnses .and the lack of decision-making power of enterprises in most operational areas, also contributed to the continuedhIgh demand for mvestment m the expansion of production (see Renmin ribao (Beijing), 22 August 1986 p. 5).
" Jingji ribao (Beijing), 20 April 1984, p. I. '
132

Table VI.8. China: selected indicators of the external sector, 1978-1985"
1979- 1981-1985 1986- 1981 1982 1983 1984 _1985_1980 1990
Actual Planned Actual Planned Actual
Average annual percentage changeExport valueb 38.7 8.6 21.6 1.5 -0.5 17.6 4.7Import valueb 40.6 16.2 lOA -12.4 10.9 28.1 54.2Export volumec 21.1 8.1 11.3 8.1 17.9 13.3 3.4 17.4 W.OdImport volumec 19.2 9.2 14.0 6.1 5.4 -0.7 9A 29.1 50Ad
1978 1979 1980 1981 1982 1983 1984 1985
Billions of dollars
Trade halancee -1.1 -2.0 -2.8 1.7 4.3 2.0 0.0 -13.1Current accountbalancee -0.7 -1.6 -2.4 2.0 5.8 4.5 2.5 -11.4Change in foreignexchange reservese 7.1 -0.6 -0.5 -2.2 -6.3 -4.8 -1.8 4.6
Source: Department.ofInternational Economic and Social Affairs of the United Nations Secretariat,based 011 State Statistical Bureau, Statistical Yearbook ofChina, various issues, the World Bank andthe Internaitonal Monetary Fund.
a Based on Ministry of Foreign Economic Relations and Trade data for 1979-1980 and on customsstatisticsJor 1981-1985.
b Exports are valued f.o.b. and imports c-i.f.
c Estimates based on j\·{jnistry of Foreign Economic Relations and Trade import and export priceindices for 1979-1980 and United Nations commodity and manufactured export price indices for1981-1985.
d Preliminary estimate.
e World Bank and IMF statistics, based on Bank of China data.
50 per cent as many enterprises paid the equivalent of four tofi ve months of wages. Much of the excess over normalbonus payments was ultimately financed by credit from thebanking system, greatly increasing the amount of money incirculation. 59 This may have occurred in part because bonuses were paid under pressure from workers, regardless ofprofits, or because enterprises decided to hold their liqllidretained profits so as to maintain flexibility in fixed investment decisions. A very accommodating lending policy onthe part of banks facilitated the financing of large increasesin bonuses.
After import restrictions were lifted and imports officiallyencouraged in 1983, the trade surplus that had existed since1981 became a small deficit in 1984 and widened to almost$13 billion by the end of 1985 (see table VL8).Attempts bycentral decision makers to slow the growth of imports didnot have any effect until import controls and a recentralization of the foreign trade system were implemented in late1985.
The ineffectiveness of macro-economic policies in thetrade sector, as in the case of investment, was a consequenceof partial and incomplete reform. The decentralization of
the foreign trade mechanism and its institutional support wascarried out without changing the fundamentals of the relationship between domestic. and international prices. Thedevolution of authority to engage in trade, from centrallyadministered foreign trade corporations to corporations administered by local governments and to individual enter-·prises, multiplied the number of organizations thatparticipated in trade but were not directly controned by thecentral Government. These organizations and local governments were also given access to significant amounts of foreign exchange through profit retention. 60 Because they werealso made financially accountable, they tended to emphasizetransactions that were profitable. Domestic prices of manufactured goods relative to international prices were high because of high material and factor costs. This wasaccentuated by the overvalued exchange rate which madeimports more profitable than exports. The strong domesticdemand for consumer durables, intermediate goods and ma-·chinery and equipment, as a result of the rapid growth inoutput and income, reinforced the demand for imports.
The Chinese authorities became concerned about theovervalued exchange rate in the early 1980s. The relationship between domestic and international prices was first ad-
59 Financial fi"les, 28 March 1985,p. 1.(i{) Y. Y. Kueh and C. Howe, "China's international trade: policy and organizational change and their place in the 'economic adjustment"', China
Quarterly, December 1984, and Renmin ribao (Beijing), 20 September 1984, p. 1.
133

justed in 1981, when an "internal rate of settlement" wasinstituted. This rate, which was more favourable than theofficial one, applied to the conversion of foreign exchangeinto domestic currency (at ¥RMB 2.8 compared with¥RMB 1.7 to the dollar in 1981) by enterprises or tradingcorporations. Significant official devaluation of the yuanrenminbi against major currencies began in 1984 and continued through 1985, resulting in a depreciation of over 60per cent between the end of 1983 and 1985. There was another major devaluation of 17 per cent against the dollar inmid-1986, but those depreciations were insufficient to rectify the external imbalance.
Other policy responses to the deficit included recentralization efforts and measures to adjust prices. Control over foreign exchange and access by trade corporations andenterprises were tightened.61 Controls on the importation ofmachinery were put in place and a ban on importing consumer durab1es and motor vehicles was imposed in late1985. As a result, import growth slowed to 1.6 per cent in1986.
Along with the rapid expansion of international tradesince 1978, there have been significant changes in the commodity composition of trade. During the early years of reform, between 1978 and 1980, the major changes in importswere in machinery, equipment and metals (to meet the demands of modernization) and in foodstuffs and consumerdurables (to improve the level of consumption). With thestabilization policy of 1981, imports of machinery, equipment and metals were severely reduced while imports offoodstuffs and cereals continued to grow as agricultural reform had yet to yield major gains in production and the policy of improving consumption was retained.
Between 1983 and 1985, the structure of imports againshifted in favour of manufactured goods, particularly intermediate goods and machinery and equipment, owing to increased imports of those goods and substantially reducedimports of foodstuffs and agricultural raw materials. Theshare of primary and processed goods in total imports declined continuously from 40 per cent in 1982 to 12 per centin 1985. The increase in imports of manufactured goods reflected a change in policy to promoting such imports aftertwo years of severe trade restrictions, a rising trade surplusand excess domestic demand. The decline in imports of primary goods was the result of unprecedented growth in domestic grain and cotton output which enabled China to be anet exporter of these crops. The composition of China's exports has not changed significantly since 1978, except for aslight increase in the share of primary goods since 1983 because of the strong growth in exports of foodstuffs, live animals and crude oil.
The direction of trade changed significantly between 1978and 1985, with a growing share of trade with developedmarket and developing economies and a corresponding decline in the share with centrally planned economies. Thisreflects a continuation of the trend that began in the early
1970s with China's renewed participation in the world economy. The shares of the planned economies in China's exports and imports in 1978 were 15 per cent and 13 per cent,respectively, but had declined to 10 per cent for both exportsand imports by 1980. This decline continued through 1985,when the shares were 9 per cent for exports and 7 per centfor imports. The importance of imports from developedmarket economies in meeting domestic demand in China isemphasized by their share in total imports, which fluctuatedaround 70 per cent over the period 1978-1985.
Medium-term plan for 1986-1990
The current plan emphasizes the importance of stabilizingthe economy while continuing with the agenda of economicreform. Because of the priority placed on slowing down thegrowth of aggregate demand to mitigate rising inflation andshortages ofmaterials and energy, growth targets were set atmoderate levels compared with performance in the period1981-1985. The current plan envisages a period ofsustainedannual growth of about 7 per cent and, by 1990, a reformedsystem of enterprise, pricing and finance that the centralGovernment will be able to control effectively through bothdirect and indirect policies. In particular, the plan calls forthe continuation of enterprise reform, while cautiously continuing further modifications of the economic system in theareas of pricing, finance and macro-economic planning andpolicies.62
Aggregate output growth targets have been set at 6.7 percent, which is much lower than the almost 10 per cent annualgrowth for the period 1981-1985 (see table VI.7). This moderation was adopted in response to the immediate concernabout easing domestic shortages in energy, transport, intermediate goods and consumer durables. The plan envisages ashift in the structure of production from the primary to thetertiary sector. By 1990, the proportion of output in the tertiary sector is to increase to 25 per cent, from 21 per cent in1985, with a corresponding decline in the share of the primary sector to 27 per cent, from 32 per cent. The share ofthe secondary sector is expected to remain unchanged.
Among the main sectors, agriculture is ,planned to growthe slowest, at about 4 per cent a year. This is substantiallyless than that obtained since 1978, but comparable to thepost-war trend. This plan target reflects the recognition thatthe immediate effect on productivity of the organizationalreforms discussed above is wearing off and that future agricultural growth will require increasing investments andother inputs and improved organization of production anddistribution. The plan also emphasizes the need to shift resources into the secondary and tertiary sectors, where productivity is higher. This will tend to compress the volume ofincremental resources available to the traditional sectors.
Industrial output is planned to expand at an annual rate of7.5 per cent, the rates for light and heavy industry beingalmost the same. Among light industries, consumer goods
6\ The Asian Wall Street Journal Weekly, 24 February 1986, p, 14,62 Seventh Five-Year Plan for Economic and Social Development a/the People's Republic a/China (1986-1990): Excerpts, chap. 1.
134

industries, in particular the processed foods, household appliances and textile and garment industries, are to be fostered to accommodate the increasing demand resulting fromgains in personal income. The textile and garment industriesare also expected to grow faster than average in order topromote these industries as one of the key sources of manufactured exports.
In heavy industry, policy discussions emphasize the needto bolster growth in basic sectors, such as energy and primary industrial inputs. Rapid growth in transportation isalso stressed to ease bottle-necks. The expansion ofproduction ofraw and manufactured materials, such as timber, steeland chemical fertilizers, is also given particular attention.The policy discussions emphasize that, in order to meet therequirements of modernization, gross output of the machine-building and electronics industries needs to grow 8.5per cent annually during the period 1986-1990. However,the level of technology that is scheduled to be attained by1990 is expected to continue to be well below that of developed countries, in part because the increase in o.utput and inimports of such goods is likely to continue to fall short ofdemand. Other sectors will be given less emphasis. In anticipation of a continued brisk pace of investment in productivecapacity and housing, gross output ofthe construction industry is targeted to grow by 7 per cent a year in the same period.
Experience since 1978 suggests that the realization ofthese priorities will depend significantly on the ability of thecentral Government to control decentralized fixed investment and guide its sectoral allocation. The output of ruralindustries is planned to grow faster than the rest, as the policy of promoting rural industrialization remains in place.Service industries will grow most rapidly and priority willbe given to the development of transport and communications, which remain bottle-necks in the economy. Commercial and personal service industries are also targeted to growsubstantially, as they remain underdeveloped relative to thedemands of the economy.
The distribution of output scheduled in the current medium-term plan does not differ significantly from the preceding plan. It is intended to raise consumption per capita byapproximately 5 per cent, or total consumption by just over6 per cent a year. This will mean a slower rate of improvement of levels of living than the growth of 8 to 9 per cent percapita since 1978. With rising incomes, there will be a shiftin the pattern of consumption demand towards manufactured goods and it cannot be expected that this will be met bydomestic production. However, owing to the need to regainbalance in the external accounts, the excess domestic demand will probably not be met by imports in the short run.The growth in consumption will therefore be limited and,with continued efforts to curtail inflation, the excess demand will result in forced savings.
Investment is planned to account for an average of 30 percent of domestic resource uses over the five-year period,about the same as that attained in 1981-1983, when invest-
63 Renmin ribao (Beijing), 24 July 1986, p. I.
135
ment growth was somewhat stabilized. The key to bettercontrol of investment will be the ability to control overalllevels of extrabudgetary investment by enterprises and localgovernment using retained funds, local taxes and bankcredit. It is planned that about 60 per cent of total investmentwill be from the state budget, about two thirds of which isearmarked for priority industries. Because extrabudgetaryinvestment tends to be made in heavy manufacturing, besides basic industries, its control is crucial to the achievement ofoverall sectoral investment priorities.
Control of fixed investment by indirect measures is beinghampered by the incomplete reforms of the enterprise management system and ofthe overall financial system. The regulations issued in July 1986 to control fixed investment donot address the problems of the low cost of capital and thelack of financial accountability of enterprises,63 but tend torely on stricter administrative control over investment planning at local levels of government and on more rigorousrequirements for obtaining working capital for new production units. An interest charge of 30 per cent on credit forunplanned investments was also instituted. More effective,flexible and permanent mechanisms for controlling investment are on the agenda for enterprise reform discussed below.
The planned annual growth in trade (8.1 per cent for exports and 6.1 per cent for imports) is below that of the 19811985 period and aims at reversing the foreign trade andpayments deficits. The immediate focus of trade policy is toreduce the $13 billion trade deficit of 1985. The ban on imports of consumer durables and automotive equipment appears likely to remain in effect through 1987. As yet, thereare no indications that the recentralization measures takenwith regard to the foreign trade system will be rescinded inthe next five years. The 17 per cent devaluation declared inmid-1986 entails continued adjustment of domestic versusinternational prices. During the next five years, there will beselective imports in the areas of technology and productiongoods in short domestic supply, namely steel, chemical fertilizers, raw materials and fibres. The strategy to achieve theplanned export growth includes the promotion of exports ofmanufactured goods, particularly textiles and other lightmanufactured goods. The collapse in world oil prices andcontinued weak markets for agricultural commodities havemade it even more imperative for China to continue to placegreater reliance on the growth of exports of manufactures.
Based on official policy discussions and recent developments, including trade agreements signed since 1985, a significant growth in trade with the USSR and the centrallyplanned economies of Eastern Europe can be expected during the period 1986-1990. Trade with developed marketeconomies will likely grow steadily during that period in theabsence of protectionist measures in these economies or arestriction of imports of machinery and equipment byChina. With the decline in the value of oil exports fromChina to developed market economies and of grain importsby China from these countries, the composition of this dimension of China's trade can be expected to change further.

According to official statements, China expects to expandits utilization ofinternationalfinancial resources by promoting foreign direct investment and foreign credit. Barringdramatic changes in the environment for foreign investors,the bulk ofgrowth is likely to bein loan capital rather than inforeign direct investment. Plamled figures are not availablebut the amount of credit, in,cluding bonds, used in 19791985 was approximately $20 billion. The amount for thecurrent plan period will probably be significantly higher. In1986, the utilization offoreign loans amounted to $4.8 billion, an increase of 93 per cent over 1985.64 This suggeststhat initially the Government was willing to raise its externaldebt -- a major reversal of traditional policy - in order tofinance imports needed for modernization and for the improvement of consumption, even if efforts to promote export growth fell short of target in the short run. However,recent policy modifications do not preclude a return to thetraditional policy of balanced trade. If such a shift were tooccur, China's demand for foreign loans could contract significantly.
Continuation and extension of the economic reforms
The overall goal of reforms in 1986-1990 is the gradualtransition from a centralized system to one that relies on acombination of direct controls and indirect economic instruments as guides for decision-making by individual economicagents. The plan emphasizes the gradual implementation offundamental reforms of the system in the areas of prices,finance and macro-economic planning and policy co-ordination. These reforms will be instituted in the latter part of tlleplan period. In the first two years, continued reform of urban enterprise management and the urban wage and employment systems will be the. focus. .Based on the ongoingdiscussions on the annual plan for 1987,65 the current pace ofreform appears to be consistent with the medium-term planand suggests some slowing down from the pace that wasindicated in late 1986. Reports suggest that even the adoption as law of the centrepiece of enterprise reform - the"factory director responsibility system" - will be delayed.
As noted, urban enterprise reforms have yet to deal successfully with the lack of financial accountability and lack ofautonomy of enterprises. These two factors remain majorobstacles to the effective decentralization of decision-making in the urban sector. Reforms in the current plan willaddress these two issues, specifically by improving profittaxation, adopting legal procedures for bankruptcy, increasing the authority of enterprise directors and devolving control of the supply of inputs to the market and to individualenterprises.
The implementation of the new taxes proposed in 1983
remains to be completed. The new syst~mhas, thus far, beenapplied in a manner that does not link performance to aftertax profits effectively. Continuing reform will focus onstrengthening the incentive effect of taxation. A law onbankruptcy of state-owned enterprises has been implemented on an experimental basis but has not yet beenadopted as law. 66 It sets the conditions of bankruptcy andprovides the legal framework for the disposal of state-ownedassets for the settlement of debts, taxes and wages. It alsoprovides for the possibility of legal action against leaders ofa failed enterprise and their governmental supervisors.
The "factory director responsibility system", which hasbeen phased in since 1985, provides the basis for grantingfactory managers more authority to enforce measures designed to improve productivity. Its success depends on thefreeing of managers from extraneous interference. Resistance to the system has surfaced on two fronts: the centres ofentrenched political and administrative control, whosepowers are being eroded, and the workers, who object to iliepriority accorded to profits over wages and benefits. Supplementary regulations concerning this new system were issuedin November 1986 in an attempt to separate the function andresponsibilities of the factory director, party cadres andworkers in an enterprise. According to these regulations, itappears that the authority of factory managers will be sharedby party cadres and workers. This is expected to further thefull-scale adoption of the system in the near future. However, ratification of proposed legislation to provide the legalframework for increased autonomy of factory directors hasbeen stalled. 67
Looser administrative allocation of materials will give enterprises greater control over the availability of needed inputs. More materials will be traded directly betweenenterprises, and prices will fluctuate according to supplyand demand. Changes implemented in late 1986 includefreeing above-quota output of rolled steel, chemicals andchemical fertilizers from controlled distribution. 68
Modifications in the employment and wage systems in urban enterprises are an important component of central policyefforts to improve macro-economic control. They also haveramifications for enterprise autonomy. The objective of thereform of the employment system is to promote flexibility oflabour markets, in some instances by permitting managersto dismiss workers. Under new regulations, all new employees of state-owned enterprises have been placed on fixedterm employment contracts, in most cases of a duration ofup to five years,69 effective from October 1986. They may bedismissed during the contract pedad if they do not fulfil per~formance requirements in the contract. At the end of thecontract, the enterprise has the option to renew or to terminate the relationship. A recently instituted system of unem-
64 China Daily (Beijing), 24 January 1987, p. 1.65 Renmin ribao (Beijing), 17 December 1986, p. J, and China Daily (Beijing), 16 February 1987, p. 2.66 Renmin ribao (Beijing), 5 September 1986, p. 1, and China Daily (Beijing), 18 November 1986.67 China Daily (Beijing), 5 June 1986, p. 4, ibid., 7 June 1986, p. 3, Renmin ribao (Beijing), 16 January 1987 , p. 2, and The New .York Times,
23 March 1987, p. 7." China Daily (Beijing), 21 October 1986, p. 2.59 Renmin ribao (Beijing), 9 October 1986, p. 2.
136
ployment insurance, with contributions from enterprises,will provide benefits for those workers who lose their jobs. 70
Improving linkages between performance and reward continues to be a key objective of wage reforms. 71 At present,wage scales remain centrally determined and total bonuspayments by enterprises and job-promotion provisions arestill subject to intervention at various levels of government.Despite these planned changes, the ability of enterprise directors to make rational decisions concerning employment,promotion and bonuses will hinge on the degree of autonomy that they eventually achieve.
One of the objectives of the ongoing reforms has been toimprove the use of prices in the allocation of resources byshifting to a system that combines directive planning, guidance planning and market determination. This will entail reform of the pricing system to reflect supply and demand. Italso calls for creating markets for commodities and services,such as technology, finance and labour. Prices of most consumer goods will be decontrolled over time and will be determined by supply and demand rather than by central fiat.The proportion of production goods subject to plannedprices will be reduced, which is in line with the reformsimplemented since 1978. These reforms have effectively decontrolled prices of some production goods, raw materialsand agricultural commodities; but even planned prices willbe adjusted to reflect market prices on an international basis.
The slow pace of progress with price changes reflectslong-standing concern about the potential inflationary consequences. The 30 per cent increase in non-staple foodprices and the sharp rise in the price of above-quota steel in1985, after prices were decontrolled, have made that concern even more acute. In 1986, experimentation with furtherprice reforms in the areas of consumer durables and textilematerials continued. Enterprises have been allowed to raiseor lower prices to widen the differential between goods ofdifferent quality and demand. In 1987, however, the priorityappears to be price stability at the retail level. 72
A critical component of measures to improve the effectiveness of indirect macro-economic policies is reform ofthe financial system. Financial reforms implemented since1978 have given the banking system a much more active rolein the creation of credit. However, the central bank stilllacks the instruments necessary to control the money supply.Similarly, branches of specialized banks in industry, agriculture and foreign exchange have neither the autonomy nor theincentive to grant credit based on economic criteria; they arestrongly influenced by local governments. The current medium-term plan envisages reforms that will place controlover interest rates and reserve requirements at the disposalof central banks and that will reorganize specialized banksand other financial institutions into financially accountableenterprises carrying out their transactions in an economically rational manner.
Conclusions
In comparison with previous medium-term and annualplans, the economic outlook for the second half of the 1980sthat emerges from the new five-year plans is for a greaterpace of growth of investment and output. All plans stress theneed to have more expansion of capital formation than previously in order to accelerate modernization and foster gainsin productivity. Emphasis in the preceding five-year planswas placed largely on rectifying external imbalances, moderating the growth of output in order to compress importdemand and protecting attained levels of living. These objectives usually had to be modified in the light of developments during implementation.
Policy makers appear to have committed themselves toundertaking measurable structural changes by national efforts as well as, in the case of the CMEA members, at thelevel of intra-group institutions and policies. The new plans,particularly in Eastern Europe, still emphasize the priorityof correcting the external sector, but do so largely throughpositive adjustment policies that envisage marked structuralchanges in the composition and quality of production, andthe material and factor intensity ofaggregate output. In addition, undertaking urgent changes in national and group-wideeconomic policies, institutions and policy instruments is animportant component of most of the plans. Further decentralization of decision-making is to proceed by way of market-like instruments of indirect economic co-ordination andtheir supporting institutions. Greater enterprise autonomyand self-financing responsibilities may in time exert a positive effect on trade and other relations with market economies. Finally, more than before, the plans emphasize theimportance of intensifying participation in internationaltrade and finance. CMEA members may temporarily seek toenhance their group-wide ties more than their relations withdeveloped and developing market economies in order to foster socialist economic integration. If successful, such effortswill in turn assist these countries in bolstering their exportpotential in global markets. Significant improvements in theenvironment for East-West economic relations and the widerparticipation of the centrally planned economies in international econOinic organizations are desirable components ofthe growing integration of these countries in global tradingand financial networks.
As developments during the early phase of the currentplan period have demonstrated already, more so than duringany plan implementation phase prior to the 1980s, the fiveyear plans are being treated as policy blueprints that shouldbe modified when circumstances require. The shifts in institutions and policies, as well as unforeseen developments inforeign markets, affected performance in 1986. On thewhole, they have been weathered without losing sight of thekey priorities in the development philosophy embedded in
70 Ibid.71 See the interview with the Minister for Labour and Personnel in Ban yue tan (Beijing), No.9, 10 May 1986, pp. 8-15, translated into English
in Joint Publications Research Service, China Report - Economic Affairs, 16 July 1986, pp. 95-103.72 Renmin ribao (Beijing), 30 December 1986, p. 1.
137

the plans and, even more, in the ongoing policy discussions.Holding this course should permit these countries to modifytheir domestic economies, particularly if exogenous circumstances (including foreign trade and the weather) are at leastaverage. Such measures are, in turn, bound to spill over intothe foreign trade sphere, affecting also integration effortswithin CMEA, later in the decade. There are also bound tobe direct and indirect repercussions on trade with the marketeconomies. Relations with these countries, however, remain
138
partly constrained by the fact that there continues to be aconsiderable mismatch between the products supplied by theplanned economies and demand in third markets. A moregrowth-oriented combination of economic policies in keymarket economies and further relaxation of tension in EastWest relations would provide the environment for theplanned economies to have a more expansionary impact onthe world economy.
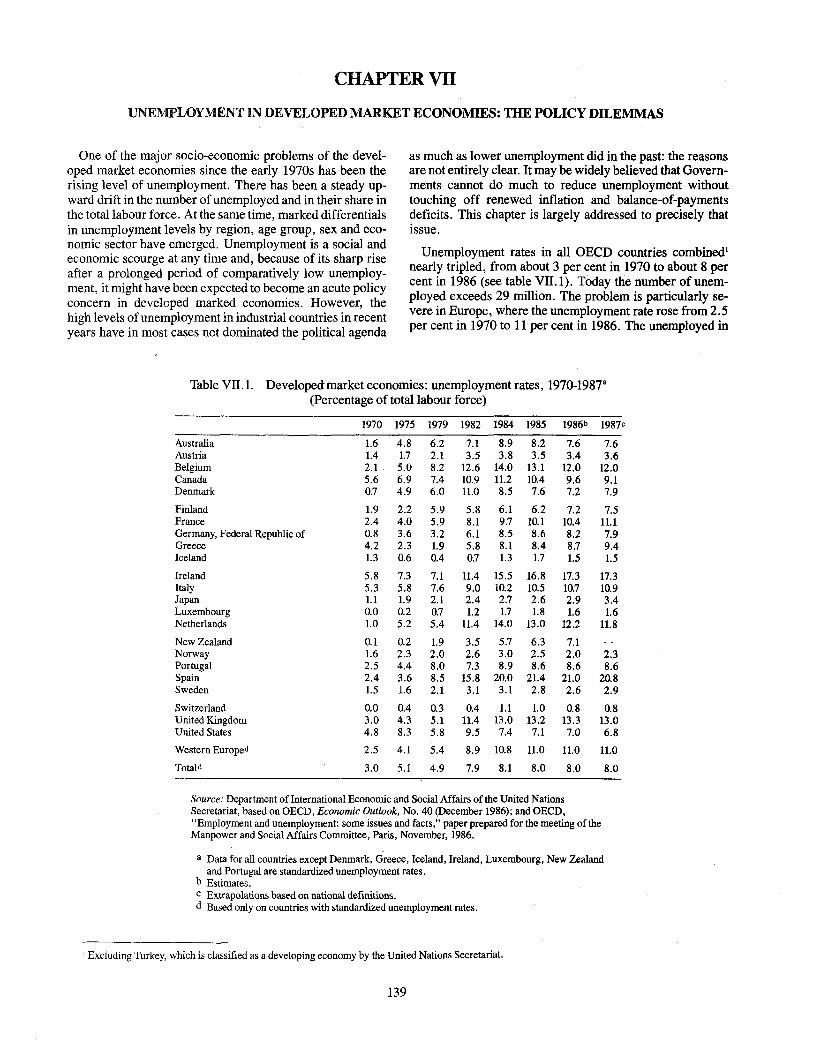
CHAPTER VII
UNEMPLOYMENT IN DEVELOPED MARKET ECONOMIES: THE POLICY DILEMMAS
One of the major socio-economic problems of the developed market economies since the early 1970s has been therising level of unemployment. There has been a steady upward drift in the number of unemployed and in their share inthe total labour force. At the same time, marked differentialsin unemployment levels by region, age group, sex and economic sector have emerged. Unemployment is a social andeconomic scourge at any time and, because of its sharp riseafter a prolonged period of comparatively low unemployment, it might have been expected to become an acute policyconcern in developed marked economies. However, thehigh levels ofunemployment in industrial countries in recentyears have in most cases not dominated the political agenda
as much as lower unemployment did in the past: the reasonsare not entirely clear. It may be widely believed that Governments cannot do much to reduce unemployment withouttouching off renewed inflation and balance-of-paymentsdeficits. This chapter is largely addressed to precisely thatissue.
Unemployment rates in all GEeD countries combined!nearly tripled, from about 3 per cent in 1970 to about 8 percent in 1986 (see table VII. 1). Today the number of unemployed exceeds 29 million. The problem is particularly severe in Europe, where the unemployment rate rose from 2.5per cent in 1970 to 11 per cent in 1986. The unemployed in
Table VILI. Developed market economies: unemployment rates, 1970-1987"(Percentage of total labour force)
1970 1975 1979 1982 1984 1985 1986b 1987c
Australia 1.6 4.8 6.2 7.1 8.9 8.2 7.6 7.6Austria 1.4 1.7 2.1 3.5 3.8 3.5 3.4 3.6Belgium 2.1 5.0 8.2 12.6 14.0 13.1 12.0 12.0Canada 5.6 6.9 7.4 10.9 11.2 10.4 9.6 9.1Denmark 0.7 4.9 6.0 11.0 8.5 7.6 7.2 7.9
Finland 1.9 2.2 5.9 5.8 6.1 6.2 7.2 7.5France 2.4 4.0 5.9 8.1 9.7 10.1 10.4 11.1Germany, Federal Republic of 0.8 3.6 3.2 6.1 8.5 8.6 8.2 7.9Greece 4.2 2.3 1.9 5.8 8.1 8.4 8.7 9.4Iceland 1.3 0.6 0.4 0.7 1.3 1.7 1.5 1.5
Ireland 5.8 7.3 7.1 11.4 15.5 16.8 17.3 17.3Italy 5.3 5.8 7.6 9.0 10.2 10.5 10.7 10.9Japan 1.1 1.9 2.1 2.4 2.7 2.6 2.9 3.4Luxembourg 0.0 0.2 0.7 1.2 1.7 1.8 1.6 1.6Netherlands 1.0 5.2 5.4 11.4 14.0 13.0 12.2 11.8
New Zealand 0.1 0.2 1.9 3.5 5.7 6.3 7.1Norway 1.6 2.3 2.0 2.6 3.0 2.5 2.0 2.3Portugal 2.5 4.4 8.0 7.3 8.9 8.6 8.6 8.6Spain 2.4 3.6 8.5 15.8 20.0 21.4 21.0 20.8Sweden 1.5 1.6 2.1 3.1 3.1 2.8 2.6 2.9
Switzerland 0.0 0.4 0.3 0.4 1.1 1.0 0.8 0.8United Kingdom 3.0 4.3 5.1 11.4 13.0 13.2 13.3 13.0United States 4.8 8.3 5.8 9.5 7.4 7.1 7.0 6.8
Western Europed 2.5 4.1 5.4 8.9 10.8 11.0 11.0 11.0
Totald 3.0 5.1 4.9 7.9 8.1 8.0 8.0 8.0
Source: Department ofInternational Economic and Social Affairs of the United NationsSecretariat, based on DECD, Economic Outlook, No. 40 (December 1986); and DECD,"Employment and unemployment: some issues and facts," paper prepared for the meeting of theManpower and Social Affairs Committee, Paris, November, 1986.
a Data for all countries except Denmark, Greece, Iceland, Ireland, Luxembourg, New Zealandand Portugal are standardized unemployment rates.
b Estimates.c Extrapolations based on national definitions.d Based only on countries with standardized unemployment rates.
I Excluding Turkey, which is classified as a developing economy by the United Nations Secretariat.
139

Figure VIT.1. Selected developed market economies: standardizedunemployment rates, 1973-1987(Percentage of total labour force)
15 --.-------------.....;...--------.
10-
.................
",,,,,,
5
.'-- -- _ /._...._....~ .....-....._.....--- ........./'"
IJNITED STATES
JAPAN
Source: Department of International Economic and Social Affairs of the United NationsSecretariat, based on table VII. 1 and OEeD, Economic Outlook, No. 40 (December 1986).
Note: DME Europe refers to Belgium, France, the Federal Republic of Germany, Italy, theNetherlands, Spain and the United Kingdom of Great Britain and Northern Ireland.
Figure VU.2. Selected developed market economies: growthofemployment, 1973-1987
(1973=100)
140--.---------~--------......- .......
130
UNITED STATES
~~~~ ..._...~~f-':;'l!~q~L .
110
120
............--../"'-'"
....---- .......-,.,.,.,..,. ............_...-'..100 -L......,,~-.""_...':. _ ••••• - •• - - - _ - -_ ---
Source: Department of International Economic and Social Affairs of the United NationsSecretariat, based on OEeD Employment Outlook, September 1986.
Note: DME Europe refers to all European countries members ofOECD except Turkey.
140

Western Europe currently amount to some 17 million people. There are great variations among countries. Spain hasthe highest unemployment rate (21 per cent on a standardized basis) followed by Ireland. Japan, Luxembourg, Switzerland and some Scandinavian countries have held theunemployment rate below 3 per cent.
The United States of America lies between these extremes, although its unemployment rate too has fluctuatedaround a rising trend over the past decade and a half (seefigure VII. 1). In Western Europe, as the figure shows, therehas been an upward ratcheting of unemployment, with joblessness rising in cyclical recessions (1974-1975 and 19801982) and cyclical recoveries (1976-1979 and 1983 to thepresent) too weak to improve the situation. This contrastswith the experience of the United States, where the cyclicalrecovery was sufficiently strong to bring unemploymentrates down. From 1973 to 1987, net employment grew by 11per cent in Japan and by 31 per cent in the United States (seefigure VII.2). In Western Europe, few new jobs were created during that period. In the United States, there was arapid expansion of part-time employment and lower payingjobs.
The unofficial or "underground" economy has grown inall developed market economies but more so in Western Europe than elsewhere. However, the share of the "secondeconomy" on a value basis should not be exaggerated. Recent estimates put an upper bound of 4 per cent of GNP onthat kind of activity in the more industrialized DECD countries, although the share for Southern European countriesmay be much higher. 2
Social and demographic aspects of unemployment
The unemployed are members of the labour force whowant to work but cannot find ajob. This group ofpeapie is inconstant turnover, fed by new lay-offs or job seekers, butdepleted by those who find jobs. The incidence and durationof unemployment in relation to specific social groups hasalso been changing in recent years. Two features stand out:the very high levels of unemployed young people and of thelong-term unemployed, that is, those who are out of workfor 12 months or more.
The combination of higher long-term and youth unemployment, especially in Western Europe, makes the socialcosts of labour market disequilibria particularly pervasiveand debilitating. A large part of an entire Western Europeangeneration has been living with the prospect of not beingable to obtain a full-time job with meaningful security. Without determined poliCy measures, the near-term prospects remain bleak. The persistence of high unemployment can onlylead to further social unrest. The economic, psychologicaland social problems of the unemployed aged 50 or over arealso prominent. Involuntary retirement and various incentive schemes favouring early retirement have, in many countries, reduced the reported number of unemployed people.But this group has to cope with unfilled personal and economic expectations at a time when longevity is on the increase and active life is prolonged.
Long-term unemployment, especially in Western Europe(see table VII.2), is in part due to structural adjustment,
Table VII.2. Selected developed market economies: long-termunemployment, 1982-1985
(Percentage of total unemployment)
1982 1983 1984 1985----- _.Six One Six One Six One Six One
months' yearb months year months year months year
Japan 33.1 14.9 33.8 15.5 37.6 15.2United States 16.6 7.7 23.9 13.3 19.1 12.3 15.4 9.5Selected Western
European countriesFrance 64.1 42.1 67.0 42.2 66.5 42.3 71.0 46.8Germany, Federal
Republic of 46.4 21.2 54.1 28.5 55.1 32.7 51.7 31.0Italy 37.8 41.9 47.9Spain 69.1 49.4 71.0 53.6 73.2 54.2 74.2 57.3United Kingdom 54.7 33.6 58.1 36.5 60.2 39.8 60.4 41.0._--_.
Source: Department of International Economic and Social Affairs of the United NationsSecretariat, based on OEeD Employment Outlook, September 1986, table K.
a Six months and over.b Twelve months and over.
2 The size of the Portuguese underground economy, for example, has been estimated at 11 per cent of Gnp; see Bank of Portugal, QuarterlyBulletin, vol. 6, No.1, (March 1984), annex VII.
141
which is inevitably associated with some degree ofmismatchbetween available labour skillsan(rthe changIng pattern ofdemand and new technologies. In Belgium, France, Ireland,Italy, the Netherlands, Spain and the United Kingdom ofGreat Britain and Northern Ireland, over 40 per cent of thetotal are long-term unemployed. This is once again-in contrast with the experience of the United States, where longterm unemployment has not exceeded 15 per cent of the totaland the share fell by 4 percentage points from 1983 to 1985.
Two implications of long-term unemployment need to behighlighted. First, those who have been unemployed for along time do not usually play any direct role in wage negotiations, unlike those out ofajob for shorter periods. 3 In manycases, problems of the long-term unemployed do not evenenter wage negotiations indirectly, through, for example,social contract or union negotiations. As a result, the employed, the "insiders", have a vested interest in seekingwage settlements that provide security for themselves. Sinceit has an important bearing on the nature of the trade-offsfacing policy makers in combating unemployment, the potential policy implications of the "insider-outsider" problem are especially significant in Western Europe. Secondly,just as steady employment enhances the career prospects ofjob holders, so being out of work for a prolonged period oftime diminishes the productivity, work opportunities and income-earning power of the workers affected.
Young adults have become victims of reduced entry-levelrecruitment opportunities. In such countries as Italy, where ahigh degree of job security is enjoyed by those in employment, the unemployment rate for youth is more than threetimes the country's overall average. The lack of training andwork experience of unemployed young people makes manyof them unsuitable even for low-paying and part-time jobs inthe service sector in which some minimum skills are required, given the increased availability of married women,immigrants and others for such work.
Youth unemployment in Western Europe is nearly twiceas high as in the United States and more than three times ashigh as in Japan (see table VII. 3). For most European developed market economies youth unemployment exceeds 20per cent. The comparatively low rate in the Federal Republicof Germany' is explained by the highly developed networkofvocational training and apprenticeship programmes there.
High youth unemployment often engenders low motivation, poor achievement in schools, crime and the risk of riots, so that there is much interest in setting up training andjob programmes for unemployed young people. With morejob creation and training programmes in place, youth unemployment may slowly ease in Western Europe. Despite this,youth unemployment rates will probably remain above 20per cent in Western Europe for the next few years.
There have been many attempts to explain the high rates ofyouth unemployment in industrial countries. Two factorshave contributed significantly to it. One is demography: thelarge cohorts born in the immediate post-war period enteredthe labour force between the mid-1970s and late 1980s. Thisso-called "baby-boom" started later and lasted longer insome countries, notably the Federal Republic of Germany,Italy, Japan, Spain and the United Kingdom. The second factor is increased labour force participation of females, particularly those in the age group 20-24.
The drop in the cohorts entering the economically activepopulation is likely to reduce youth unemployment in thenext 10 to 15 years. Population growth will decline in themajority ofthe developed market economies, becoming virtually zero and possibly even negative in the Federal Republic of Germany, and growth in the age groups 15-19 and20-24 will be lower than growth oftotal population in practically all these countries, in most cases even negative. Thedecline in the share of new cohorts in the active populationin the next decade is especially marked in Western Europe. 5
Except in Japan, labour force participation rates of females increased dramatically between 1970 and 1980. Sincethen, these rates have stabilized in most DEeD countries.More than 50 per cent of the female population of workingage now have a job outside the home, compared with about30 per cent two decades ago. This demographic shift in thelabour force is due in part to supply-side factors: efforts tosupplement head-of-household incomes in the light of increasing expectations and declining purchasing power, antidiscrimination legislation, rising levels of education, theavailability of appliances and conveniences that reducehousehold chores, and changing social norms (such as selfrealization as a personal goal, later marriages, fewer children and higher divorce rates). On the demand side, in spiteof equal-pay legislation, women can be hired more cheaply
FranceGermany, Federal Republic ofItalyJapanSpainUnited KingdomUnited States
3 See O. Blanchard etal., "Employment and growth in Europe: a two-handed approach", Centre for European Policy Studies, No. 21, May 1985;and R. Layarad and S. Nickell, "The causes of British unemployment", National Institute Economic Review, February 1985.
4 The Scandinavian countries for which data are available also have low youth unemployment (well below 10 per cent).5 Youth demographic pressure defined as age group 15-24 divided by 15-64 is as follows:
1980 1985 1990(Percentage)
24.8 23.3 22.324.2 23.5 19.523.6 23.6 22.520.5 20.8 21.925.7 25.9 25.224.2 24.4 22.528.4 25.1 21.8
Source: World Population Prospects: Estimates and Projections as Assessed in 1984 (United Nations publication, Sales No. E. 86. XIII. 3).Thus, youth demographic pressure from the "baby-boomers" is expected to decline, except in Japan.
142
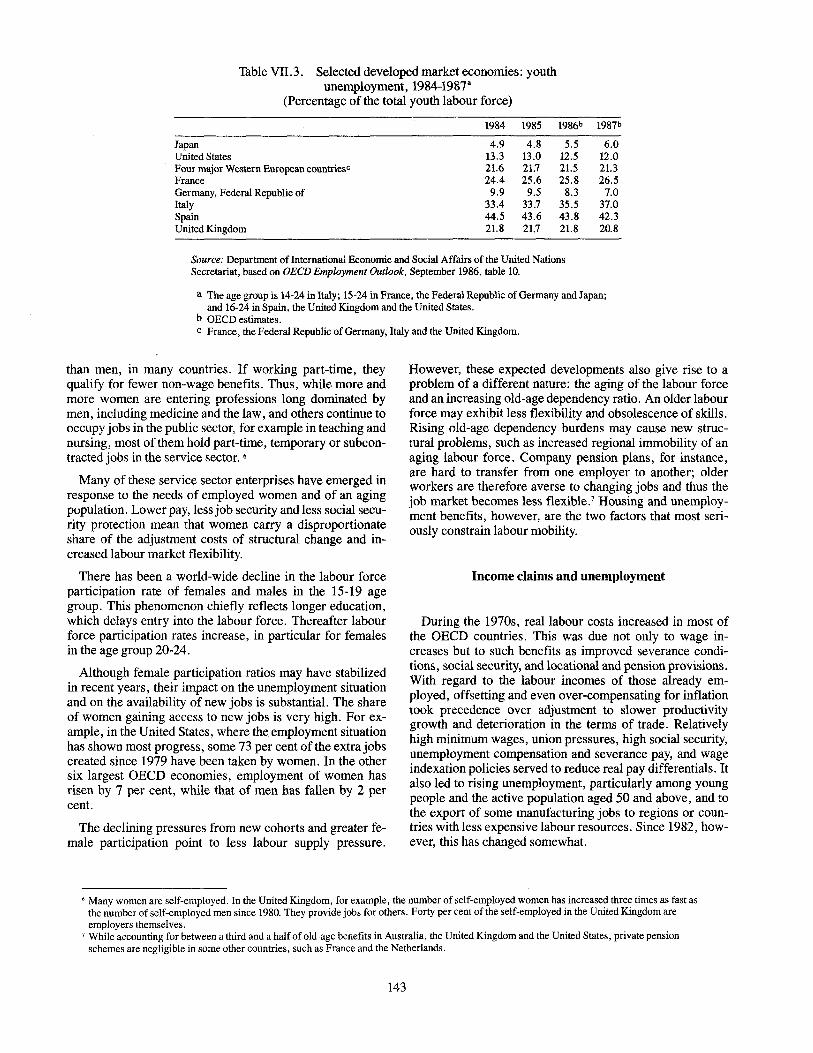
Table VII. 3. Selected developed market economies: youthunemployment, 1984-1987'
(Percentage of the total youth labour force)
1984 1985 1986b 1987b
Japan 4.9 4.8 5.5 6.0United States 13.3 13.0 12.5 12.0Four major Western European countriesc 21.6 21.7 21.5 21.3France 24.4 25.6 25.8 26.5Germany, Federal Republic of 9.9 9.5 8.3 7.0Italy 33.4 33.7 35.5 37.0Spain 44.5 43.6 43.8 42.3United Kingdom 21.8 21.7 21.8 20.8
Source: Department ofInternatiomu Economic and Social Affairs of the United NationsSecretariat, based on OEeD Employment Outlook, September 1986, table 10.
a The age group is 14-24 in Italy; 15-24 in France, the Federal Republic of Germany and Japan;and 16-24 in Spain, the United Kingdom and the United States.
b GEeD estimates.c France, the Federal Republic of Germany, Italy and the United Kingdom.
than men, in many countries. If working part-time, theyqualify for fewer non-wage benefits. Thus, while more andmore women are entering professions long dominated bymen, including medicine and the law, and others continue tooccupy jobs in the public sector, for example in teaching andnursing, most of them hold part-time, temporary or subcontracted jobs in the service sector. 6
Many of these service sector enterprises have emerged inresponse to the needs of employed women and of an agingpopulation. Lower pay, less job security and less social security protection mean that women carry a disproportionateshare of the adjustment costs of structural change and increased labour market flexibility.
There has been a world-wide decline in the labour forceparticipation rate of females and males in the 15-19 agegroup. This phenomenon chiefly reflects longer education,which delays entry into the labour force. Thereafter labourforce participation rates increase, in particular for femalesin the age group 20-24.
Although female participation ratios may have stabilizedin recent years, their impact on the unemployment situationand on the availability of new jobs is substantial. The shareof women gaining access to new jobs is very high. For example, in the United States, where the employment situationhas shown most progress, some 73 per cent of the extra jobscreated since 1979 have been taken by women. In the othersix largest OECD economies, employment of women hasrisen by 7 per cent, while that of men has fallen by 2 percent.
The declining pressures from new cohorts and greater female participation point to less labour supply pressure.
However, these expected developments also give rise to aproblem of a different nature: the aging of the labour forceand an increasing old-age dependency ratio. An older labourforce may exhibit less flexibility and obsolescence of skills.Rising old-age dependency burdens may cause new structural problems, such as increased regional immobility of anaging labour force. Company pension plans, for instance,are hard to transfer from one employer to another; olderworkers are therefore averse to changing jobs and thus thejob market becomes less flexible. 7 Housing and unemployment benefits, however, are the two factors that most seriously constrain labour mobility.
Income claims and unemployment
During the 1970s, real labour costs increased in most ofthe OECD countries. This was due not only to wage increases but to such benefits as improved severance conditions, social security, and locational and pension provisions.With regard to the labour incomes of those already employed, offsetting and even over-compensating for inflationtook precedence over adjustment to slower productivitygrowth and deterioration in the terms of trade. Relativelyhigh minimum wages, union pressures, high social security,unemployment compensation and severance pay, and wageindexation policies served to reduce real pay differentials. Italso led to rising unemployment, particularly among youngpeople and the active population aged 50 and above, and tothe export of some manufacturing jobs to regions or countries with less expensive labour resources. Since 1982, however, this has changed somewhat.
6 Many women are self-employed. In the United Kingdom, for example, the number of self-employed women has increased three times as fast asthe number of self-employed men since 1980. They provide jobs for others. Forty per cent of the self-employed in the United Kingdom areemployers themselves.
7 While accounting for between a third and a half of old-age benefits in Australia, the United Kingdom and the United States, private pensionschemes are negligible in some other countries, such as France and the Netherlands.
143

The pressures to keep real wages from rising come fromvarious sources. Competitiveness is a key criterion. Facedwith the choice of reducing costs or closing down, manyfirms adopted a firmer stance on wages. 8 Employers hopedthat slower wage rises would improve corporate cash flows,profits and competitiveness. With reallabom costs growingat or below the rate of labour productivity, competitivenessis likely to improve, thereby eliminating any tendency towards a net export of jobs from trade. Governments alsoviewed wage containment as essential to bring inflation under control and to keep employment and output Up.9 Labourunions have also had a role in keeping wages from growingat previous rates. In situations where the power of trade unions is on the decline,1O many unions have opted for improved job security for their members in exchange for wageconcessions. In a few cases, average wages have been reduced through the negotiation of two-tier agreementswhereby new workers are hired at lower wages in return forimprovements in pay and benefits for existing employees.
Although real unit wage costs have declined in manycountries, employers have often preferred to economize onlabour despite declining labour-to-capital factor costs.Whatever labour has been added has been part-time, temporary or subcontracted employment. II Employers have alsosought to make more efficient use of their existing workersby introducing more elastic working hours that permit moreintensive use of their plants and easier adjustment to shifts indemand.
Although precise, internationally comparable datathrough 1986 are not readily available, the evidence suggests that profit shares and rates of return on capital in majordeveloped market economies, particularly in the FederalRepublic of Germany and the United States, began to risesharply after the second oil shock. Thus, the profit share inmanufacturing in the United States and in four major Western European countries (France, the Federal Republic ofGermany, Italy and the United Kingdom) hovered around26-28 per cent in the period 1975-1978, and subsequentlydropped to just over 20 per cent in the United States and tojust over 25 per cent in Western Europe in 1980·-1982. Fromthen on, however, profit shares in manufacturing and therate of return on capital have risen steadily. Profit shares areat present above the levels observed in the 1960s, particularly in the United States. In 1985, for example, profitshares were 31-32 per cent in those same Western Europeancountries and the United States, compared with 31 per centin Western Europe and 26 per cent in the United States in1972. In the Federal Republic of Germany the share of netwages and salaries, including voluntary fringe benefits,
amounted to 38 per cent of national income in 1985, compared with 44 per cent in 1975 and 42 per cent in 1980.
Macro-economic policy makers expected this gain in corporate profits to stimulate investments and thereby expanddemand for labour sufficiently to re-employ a significantshare of workers laid off earlier and to absorb new entrantsinto the labour force. This has happened in only some countries, notably the United States. But even there, labour hasnot been able to reclaim its share in aggregate resources.Those laid offtemporarily had to settle for lower paying newjobs and many of the new jobs were available only on a parttime, temporary or subcontracting basis. In most other developed market economies, there has been a continuing risein the unemployment rate.
Although unemployment rates in Europe have apparentlystabilized, the prospects of a large increase in employmentlevels are not very encouraging. There have now been 16quarters of uninterrupted growth, yet no overall reduction inthe unemployment rate is in sight. Certainly, jobs have beencreated in most developed market economies, but at a ratethat has usually been slower than the rate of growth of thelabour force. As a result, unemployment, particularlyamong young people, has remained very high. Recent experience shows that, on balance, slow growth does not createjobs.
The fact that employment was not boosted by real wagecuts lingers over some of the critical policy dilemmas in developed market economies. Policy makers in most Europeancountries are still reluctant to engage in policies aimed atexpanding demand. This reluctance is based on the expectation that stimulating aggregate demand would chiefly translate into higher, and possibly accelerating, rates of priceinflation. Though there would also be a positive impact onoutput and employment from the demand stimulus, this isbelieved to be rather small. If demand does not drive upinflation, it is expected to spill over into imports and produce a current account deficit that may be difficult to financeat prevailing exchange and interest rates. Depreciation ofthe currency would again aggravate inflationary pressuresand might lead to a reversal of the macro-economic policystance, weakening the credibility of policy makers. Thesepolicy dilemmas play an important role ip explaining thepersistence of high unemployment in developed marketeconomies.
The structure oflabour markets, is therefore an importantdeterminant of the policy stance on employment. Job prospects are in part a function of labour market regulations,mobility of the labour force, both among and within sectors
• In the United States, airlines, railroads, meatpackers, and steel are soine of the industries that have renegotiated wages downwards or haveresorted to a two-tier system to hold on to their markets.
9 In France the indexation of wages was stopped in an effort to reduce inflation. In other countries, real minimum wages were allowed to be erodedby inflation; centralized bargaining was de-emphasized, as in Sweden, in the hope that more competitive wages could be obtained throughdecentralized negotiations; profit-sharing arrangements for workers have been encouraged.
10 For example, trade union membership declined in the United States by nearly 14 per cent during 1980-1984, despite a 5.4 per cent increase injobs.
11 The net result is that big established firms and industries are no longer creating many jobs. In Canada, for example, employment in the 100largest companies fell by 10 per cent between 1981 and 1984.
144

as well as within different regions or countries, and realwage rigidity. These factors can combine to price labour outof the market and raise unemployment. Rather than seekingto stimulate demand, economic policy could usefully beaimed first at curbing rigidities in the labour market. Itshould be remembered, however, that what may be rigiditiesfrom the policy point of view, may in fact represent muchvalued security for those affected. An appropriate balancemust be sought between security for those employed andflexibility to help the unemployed.
As noted, labour market rigidities rose substantially in the1970s, though there has been a marked increase in the degree of flexibility of labour markets in recent years. A critical policy question, therefore, is whether the functioning oflabour markets has improved sufficiently to allow a reduction in unemployment without risking more inflation or external imbalances. An associated question is whether therisks at the national level might be mitigated by co-ordinating macro-economic policies among key actors in the international economy. These issues are explored in greater depthbelow for seven developed market economies (Japan, theUnited States and the five largest Western European economies, namely France, the Federal Republic of Germany, Italy, Spain and the United Kingdom).
In comparing these economies, perhaps the single mostsurprising contrast is that whereas employment growth hasbeen stagnant in Western Europe and has risen strongly inthe United States (see figure VII.2), average annual GNPgrowth rates from 1973 to 1987 have been approximatelythe same. The explanation is that the growth of output perperson employed has been lower in the United States (0.5per cent from 1973 to 1987) than in Western Europe (2 percent) or Japan (3 per cent).
Though greater labour intensity of output helps to expandemployment at a time ofslow GNP growth, low productivityis not a solution. Higher labour productivity and, indeed,substitution away from labour in response to higher realwages stemming from productivity growth are at the heart ofthe economic development process. It is for this reason thatthe slow-down in productivity growth, which began twodecades ago in most developed market economies, has beenworrisome. The reason for this decline is not fully understood. The exhaustion of the shift oflabourers from low productivity agriculture to high productivity manufacturing andthe continuing movement towards the service sector, whichhas traditionally been viewed as having lower productivitygrowth than manufacturing activities may, in part, underliethe decline. It may also help to explain why labour productivity in the United States has been growing more slowlythan in Japan or Western Europe. A general drop in totalfactor productivity since 1973, owing to slack demand and arise in unused resources has also been suggested as a causeof the decline in labour productivity. 12
Whatever the reason, the paradox is that the technological
potential for productivity increases and employment growthtoday is great. Labour productivity has certainly been increasing rapidly in the electronics industry, in particular inthe fields of micro-electronics, computerization, roboticsand communication technology, which have been leading theway in the "information revolution". Employment growthin these branches has been brisk to the extent that some firmshave had difficulties in filling their vacancies. Unemployment is concentrated in the "sunset" industries, for exampletextiles, steel, ship-building and coal-mining. How to cometo grips with the structural adjustments that are called for bythese productivity differentials, with a minimum of unemployment and other dislocations, remains a major task ofmacro-economic policy.
Rapid technological change brings about severe dislocations and adjustment problems. Such change might thereforebe considered a prime candidate for explaining persistentunemployment. However, this type of structural changedoes not lead to a direct macro-economic trade-off or policydilemma. Instead, technological change conditions the verynature of the trade-off between price stability and employment because it affects the economic evaluation of labourand output itself. Trying to hold on to jobs that have becomeunproductive owing to technological change aggravates themisallocation of resources and results in losses for society asa whole.
Macro-economic causes of unemployment
Although they can offer only partial insights, importantpolicy implications can be derived from an assessment of thesignificance of competing theories that explain unemployment at specific points in time or in particular countries.With this aim in mind, three principal explanations of unemployment are reviewed below. The two traditional macroeconomic explanations of unemployment focus oninsufficient aggregate demand and rigid labour costs in aggregate supply. These are rather static rationalizations of thepolicy trade-offs involved. One dynamic explanation, thehysteresis hypothesis, has recently been offered: the pasthistory ofunemployment is an important conditioning factorof future unemployment and hence of future policy tradeoffs.
Classical unemployment
Neo-classical analysts maintain that unemployment stemsfrom rigidities in labour markets. In other words, mass unemployment stems primarily from excessively high realwages and related non-wage labour costs.
The neo-classical approach suggests that expansionary ag-
12 For a discussion of the productivity slow-down, see Economic Survey ofEurope in 1985-1986 (United Nations publication, Sales No. E.86.II.E.l),sects. 1.2 and 2.10.
145
gregate demand policies would not create employment, butwould instead raise inflation. The appropriate policy response, according to this framework, is to foster greaterwage flexibility and wage differentials and moderate nonwage labour costs, and reduce restrictions in labour markets. For a given capital stock and other non-labour factorinputs, unemployment would tend to decline because thereal cost of labour relative to that of other factors of production shrinks. Together with other conditions for higherprofit, such as low and stable inflation, this approach predicts faster capital stock accumulation in the medium term,therefore improving prospects for employment. This appears to have been a major consideration in recent policystances in key developed market economies, as discussedabove.
Putting it somewhat more technically, the neo-classicalapproach argues that a large part of the unemployment problem in developed market economies can be explained by unwarranted real wages that do not adjust when an adverseaggregate supply shock occurs, such as a jump in oil prices.At the prevailing real wage, the demand for labour wouldthen fall. The difference between the actual real wage andthe real wage warranted in order to clear the labour market(i.e., the real wage that would maintain full employment) isknown as the real wage gap. The larger the wage gap, themore unemployment there is likely to be. A correlation between high unemployment and high real wage gaps, therefore, might be taken as evidence of the existence of classicalunemployment.
Unfortunately, the warranted real wage level cannot beobserved and different empirical specifications of the realwage gap yield different measurements. None the less, themajority qf investigations support the view that real wagegaps are an important factor in explaining the rise of unemployment in Western Europe in the 1970s. 13 As an illustration of these findings, table VIlA presents estimates of thereal wage rate gap. This gap is here defined as the differencebetween the actual rate of growth of real wages and the rateof growth of labour productivity, which is taken as a proxyfor the growth of warranted wages. 14 The estimates are presented in the form of a graph in figure VII.3, which clearly
shows that Western Europe did experience large real wagerate gaps in comparison with the United States in the 1970s.By the 1980s, however, the gap in Western Europe hadturned negative, indicating a substantial easing ofreal wagesrelative to productivity growth. 15 This decline in the growthof real wages seems to have been followed by non-wagelabour costs. 16
The most striking feature about figure VII. 3 is that Japan,which has not had a major unemployment problem until veryrecently, has the largest real wage rate gap. The reason hasbeen the subject of much speculation. One explanation isthat Japan has a high degree ofreal wage flexibility, meaningthat for any given initial gap, Japan is well equipped to sustain adverse supply shocks without significant employment10ss.17 Table VIlA lends support to this view since it showsthat Japan has had the fastest deceleration of real wagesamong the major developed market economies. This findingcan also be confirmed by recent measures of real wage rigidity, which are shown in table VII.S.
The measures of real wage rigidity in table VII.S are derived from econometric estimations of the increase in unemployment that would be needed to offset a 1 per cent rise inreal wages in the short or the long run (the Phillips curve).The long-run estimates measure the total rise in unemployment. The short-run measures ignore the lagged effects onunemployment of a rise in real wages. Therefore a lowercoefficient, meaning that a 1 per cent change in real wageswould bring forth a "low" percentage increase in unemployment, implies greater flexibility.
As shown in table VII.S, Japan has the highest degree ofreal wage flexibility in both the short and the long run. 18 TheUnited States has a high degree of flexibility in the short run.This stems largely from nominal wage inertia. As nominalwage contracts are rewritten and as the total effect of a risein prices makes itself felt, however, the United States economy loses much of its flexibility. Indeed, in approximatelyfour years, both the United States and Western Europe appear to show a substantial amount of rigidity. The FederalRepublic of Germany on the other hand seems to be an exception since, according to the estimates, it shows a high
;, See OECD, Flexibility in the Labour Market, 1986 (Paris, 1986), for a review of the empirical evidence on the role of real labour costs.14 A better proxy of the warranted real wage would leave unit labour costs unchanged and initially clear the labour market at full employment.IS The actual wage level gap in the manufacturing sector in Western Europe has fallen below that recorded in the United States as of 1984 (see R.
Gordon, "Productivity, wages and prices inside and outside of manufacturing in the U. S., Japan and Europe" , National Bureau ofEconomicResearch Working Paper Series, No. 2070, November 1986).
16 Since the late 1970s, non-wage labour costs as a proportion of total labour costs have stabilized or fallen in most Western European economies,though not in the Federal Republic of Germany; the average proportions in Western Europe, however, are substantially higher than those ineither Japan or the United States (see OEeD Employment Outlook, September 1986, table 29).
17 See C. Adams et at., "Differences in employment behaviour among industrial countries" , StaffStudies for the World Economic Outlook(Washington, D.C., IMF, July 1986). However, other research contends that if the income share of labour is redefined to include householdentrepreneurial income with employee compensation, it virtually erases major differences among real wage gaps in Western Europe, Japan andthe United States at the aggregate level (see R. Gordon, loco cit., for details).
18 These estimates of real wage rigidity should be viewed with caution since they.are derived from Phillips curves, which are sensitive tospecification and the period of estimation. The results shown here, however, do accord with the estimates presented in the third column of tableVII.5 which are derived from a different methodology, using a simple structural macro-economic model of the labour market. In particular, theFederal Republic of Germany and Japan continue to display greater flexibility than the other selected Western European countries or the UnitedStates. The estimates in the third column of the table are reported as long-run wage elasticities in C. Bean, P. Layard and S. Nickell, "The rise inunemployment: a multi-country study", Economica, Supplement 1986, vol. 53, No. 21O(s), and are inverted in the table.
146
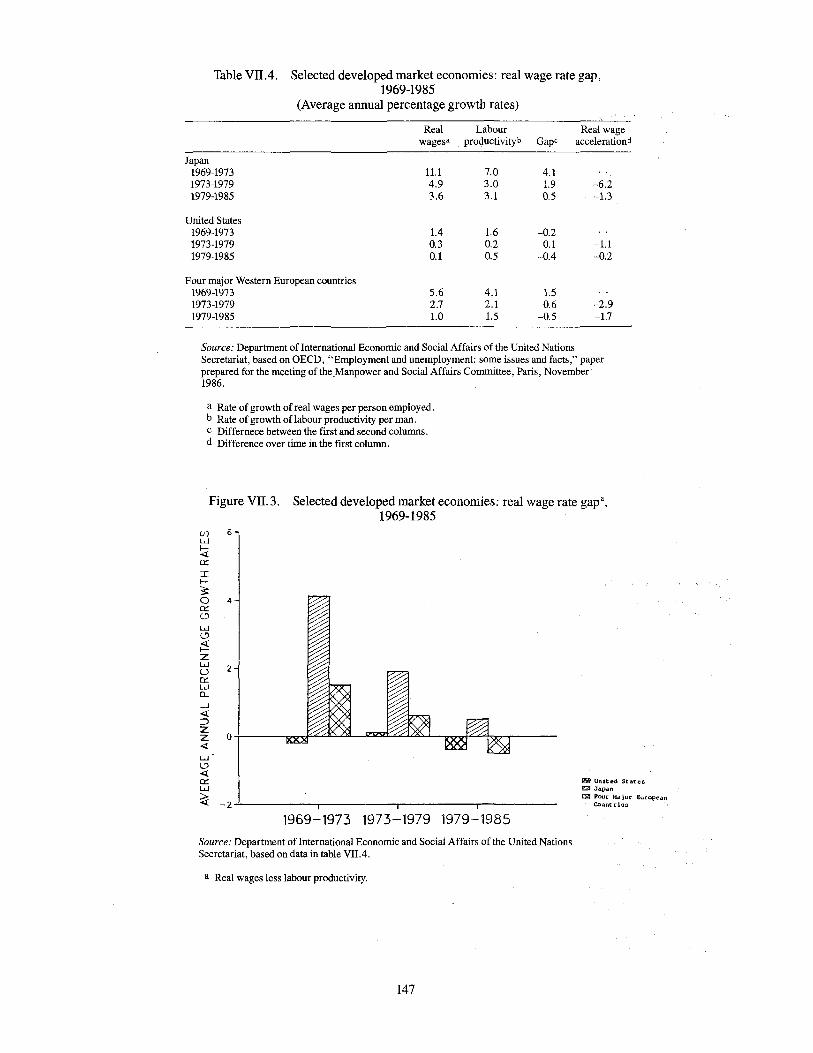
Table VIlA. Selected developed market economies: real wage rate gap,1969-1985
(Average annual percentage growth rates)
Real Labour Real wagewages' productivityb Gape accelerationd
Japan1969-1973 11.1 7.0 4.11973-1979 4.9 3.0 1.9 -6.21979-1985 3.6 3.1 0.5 -1.3
United States1969-1973 104 1.6 -0.21973-1979 0.3 0.2 0.1 -1.11979-1985 0.1 0.5 -004 -0.2
Four major Western European countries1969-1973 5.6 4.1 1.51973-1979 2.7 2.1 0.6 -2.91979-1985 1.0 1.5 -0.5 -1.7
Source: Department ofInternational Economic and Social Affairs of the United NationsSecretariat, based on GECD, "Employment and unemployment: some issues and facts," paperprepared for the meeting of the.Manpower and Social Affairs Committee, Paris, November1986.
a Rate of growth of real wages per person employed.b Rate of growth oflabour productivity per man.c Differnece between the first and second columns.d Difference over time in the first column.
Figure VII. 3. Selected developed market economies: real wage rate gap',1969-1985
4
2
6
~ UtHted StatesE:'2J Ja.pan.Ci2I Four Kajor European
CoUntries
(j)w~ex:r:l-Soex(:)
w(:)
~Zwuexwa...-l<{::l
~ o+-----.""""..I"=.c:.L.IC....=----'=;n;...~ta:>-L.._"..."...,.f":L4""....,...---4:w(:)4:exw
~ -2-'-------,-------,-------,-------1969-1973 1973-1979 1979-1985
Source: Department of International Economic and Social Affairs of the United NationsSecretariat, based on data in table VIlA.
a Real wages less labour productivity.
147

Table VII. 5. Selected developed market economies: estimates of real wagerigidity, 1967-1983
Short-run Long-run
Bean,Coeand Coeand LayardandGagliardi Gagliardi Nickell a
Japan 0.24 0.24 0.94
United States 0.67 3.06 2.08
Selected Western European countries
France 1.52 3.03 1.61
Germany, Federal Republic of 0.58 0.61 1.15
Italy 0.80 1.62 2.63
Spain 2.18
United Kingdom 1.94 5.82 1.59
Source: Department ofInternational Economic and Social Affairs of the United NationsSecretariat, based on D. Coo and F. Gagliardi, "Nominal wage determination in ten OECDcountries", aECD Working Paper, No. 19, March 1985, table 12; and C. R. Bean, P. R. G.Layard and S. J. Nickell, "The rise in unemployment: a multi-country study", Economica,Supplement 1986, vol. 53, No. 21O(s), tables 3 and 5. The short-run indicator for Spain is fromJ. Vifials, "Fiscal policy and the current account", Economic Policy, No.3, October 1986.
a Measuring the decrease in employment needed to lower the rate of growth of real wages by.I percentage point.
degree of flexibility in both the short and the long run. 19
These estimates suggest that real labour costs play a rolein determining employment outcomes in developed marketeconomies. The evidence is strongest for the 1970s, whenreal wage gaps (in terms of both levels and rates) were highest. Real wage flexibility also seems to matter in avoidingunemployment following adverse aggregate supply shocks.Japan and possibly the Federal Republic of Germany have ahigh degree of real wage flexibility in both the short and thelong run.
Keynesian unemployment
The analyses underlying table VII.5, which confirm the importance of real wages for unemployment, are unanimous inconcluding that other factors are also at work. 20 Amongthese factors, aggregate demand is particularly important.This is the main message of Keynesian analysis, which holdsthat high unemployment is due to insufficient aggregate demand. Expansionary macro-economic demand policieswould therefore increase output and employment.
Developed market economies have been buffeted by con-
tractionary aggregate demand shocks in the 1980s. Somewere intended. For example, in a bid to lower inflationrates, most Western European countries and Japan matchedthe tight monetary policies of the United States in the early1980s. Japan and Western European countries (especiallythe Federal Republic of Germany and the United Kingdom)also engaged in prolonged fiscal tightening. Since 1982,however, the United States has followed a strongly expansionary fiscal policy (see table VII.6). As shown in figureVII. 1, the United States managed to lower its rate of unemployment after 1982. The fact that the United States was ableto do this at a time when unemployment rates were risingmodestly in Japan and increasing rapidly in Western Europepoints to the significance of an expansionary aggregate demand policy in reducing high levels of unemployment.
Aggregate demand outside developed market economieshas also been weak in the 1980s, imparting a further contractionary effect world-wide. In the main, this has been dueto import compression in both developing and centrallyplanned economies. While the reasons for import compression vary greatly, the international debt overhang and thedecline in primary commodity prices have been principalfactors.
19 Allowance has been made for the effect of productivity growth on German nominal wages; without this correction, the Federal Republic ofGermany exhibits a high degree of real wage rigidity (see D. Coe and F. Gagliardi, "Nominal wage determination in ten OECD economies",aEeD Working Paper, No. 19, March 1985).
20 In addition to the references cited in table VII.5 see, for example, J. McCallum, "Unemployment in OECD countries in the 1980s", TheEconomic Journal, No. 96, December 1986; M. Bruno, ')\ggregate supply and demand factors in OECD unemployment: an update",Economica, Supplement 1986, vol. 53, No. 21O(s); J. J. Dolado et aI., "Spanish industrial unemployment: some explanatory factors",Economica, Supplement 1986, vol. 53, No. 21O(s); and O. Blanchard et aI., op. cit.
148

Hysteresis
While in theory it is easy to distinguish between unemployment stemming from insufficient demand or rigid labour supply regimes, in practice the highly complexrelationships among economic variables blur the distinction.One type of unemployment regime might also give way toanother. Thus, deflationary demand policies might turn classical into Keynesian unemployment. A prolonged period ofKeynesian unemployment might, in turn, give rise to classical unemployment. This could happen if depressed investment spending led to a reduction in labour productivity andreal wages did not fall, thereby generating unemployment.For most countries, therefore, neither demand nor supplypolicies will be likely to resolve the unemployment problemunless they are well co-ordinated. Moreover, the dynamicinteraction between unemployment and inflation is not adequately captured by either explanation.
- "---- -_._._-~----.--.----
The trade-off. between unemployment and inflation canchange for many reasons. One explanation that has attractedmuch attention recently is the hysteresis hypothesis, which
draws attention to the importance of the past history of unemployment for the "natural" rate of unemployment. Thepresence of hysteresis may be ascertained by tracing the unemployment t4at results from the structural characteristicsof an economy (the "natural" rate). At the natural rate, thelabour market is said to be in equilibrium since it does notexert inflationary pressure. This definition has evolved intoa doctrine of its own, known as the natural rate hypothesis,according to which there is no long-run trade-off betweeninflation and unemployment. Given a sufficiently long timehorizon and the absence of money illusion, an economy isassumed to naturally tend to gravitate back to the full-employment or natural level. Consequently, disi~flationary
policies will lead to no additional unemployment In t~e longrun. A lower rate of inflation and a temporary loss of outputand employment would be the only outcomes.
Although the natural rate hypothesis appears to have beenaccepted in the formulation of policy in most developedmarket economies, unemployment rates in many of thesecountries, especially in Western Europe, are now muchhigher than was considered normal in the past. In addition,
Table VII. 6. Selected developed market economies: change in theinflation-adjusted structural budget balance, 1984-1987"
(Percentage of nominal GNP/GDP)
1987b
0.2
1.2
Selected Western European countries
FranceGermany, Federal Republic ofItalySpainUnited Kingdom
Total, developedmarket economies
0.30.1
--3.50.4
-0.8
-0.2
0.50.5
-1.9-0.90.7
-0.3
-0.8-0.8-1.3
1.2-1.2
--0.4
0.2-0.1-1.8-0.4-0.5
0.4
Memorandum item:
Fiscal deficit (-) as a percentage of nominal GNP
1983
Germany, Federal Republic of -2.5Japan -3.7United States -3.8
1984
-1.9-2.2-2.7
1985
-1.1-1.4-3.4
1986
-1.0-1.5-3.4
1987
-0.9-1.4-2.3
Source: Department ofInternational Economic and Social Affairs of the United NationsSecretariat. based on OECD, Economic Outlook, No. 40 (December 1986), tables 4 and 5.
a General government financial balances. A minus sign indicates a demand impulse,
b OEeD estimates
c Average of Australia, Austria, Belgium, Canada, Denmark, Finland, France, the FederalRepublic of Gennany, Greece, Ireland, Italy, Japan, the Netherlands, Norway. Spam, Sweden,the United Kingdom and the United States.
149
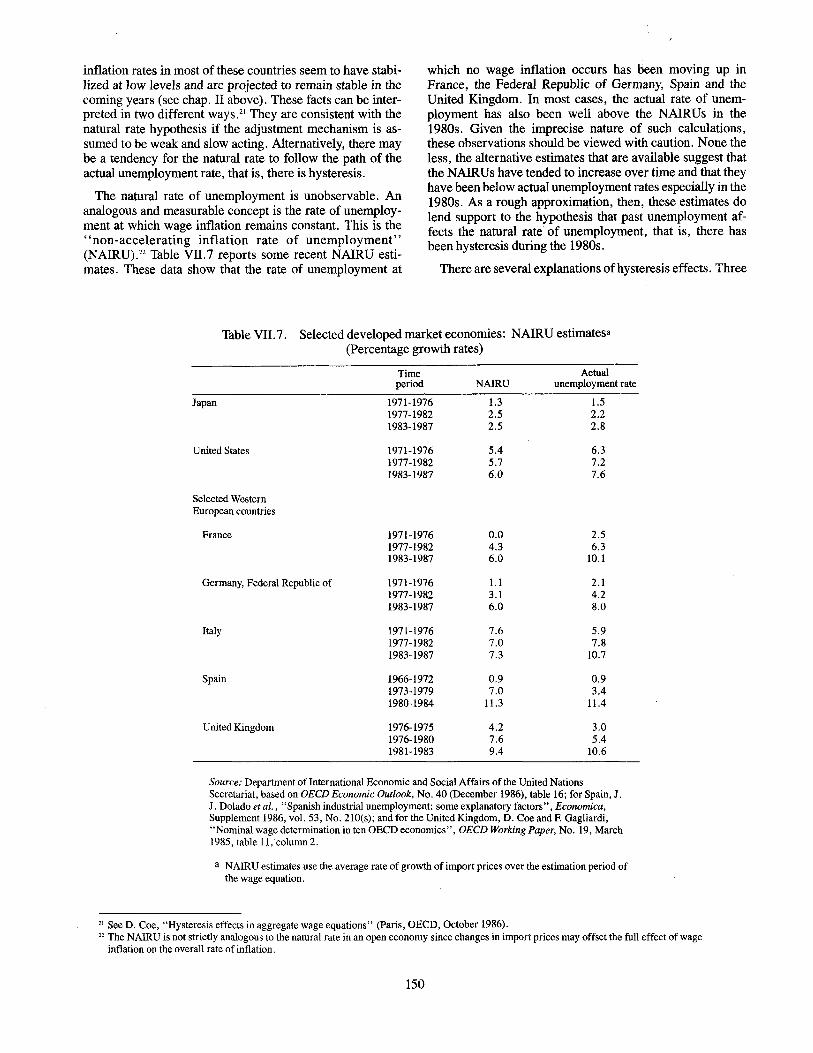
inflation rates in most of these countries seem to have stabilized at low levels and are projected to remain stable in thecoming years (see chap. II above). These facts can be interpreted in two different ways.21 They are consistent with thenatural rate hypothesis if the adjustment mechanism is assumed to be weak and slow acting. Alternatively, th~re maybe a tendency for the natural rate to follow the path of theactual unemployment rate, that is, there is hysteresis.
The natural rate of unemployment is unobservable. Ananalogous and measurable concept is the rate of unemployment at which wage inflation remains constant. This is the"non-accelerating inflation rate of unemployment"(NAlRU).22 Table VII.7 reports some recent NAlRU estimates. These data show that the rate of unemployment at
which no wage inflation occurs has been moving up inFrance, the Federal Republic of Germany, Spain and theUnited Kingdom. In most cases, the actual rate of unemployment has also been well above the NAIRUs in the1980s. Given the imprecise nature of such calculations,these observations should be viewed with caution. None theless, the alternative estimates that are available suggest thatthe NAlRUs have tended to increase over time and that theyhave been below actual unemployment rates especially in the1980s. As a rough approximation, then, these estimates dolend support to the hypothesis that past unemployment affects the natural rate of unemployment, that is, there hasbeen hysteresis during the 1980s.
There are several explanations ofhysteresis effects. Three
Table VII.7. Selected developed market economies: NAIRU estimates·(Percentage growth rates)
Time Actualperiod NAIRU unemployment rate
Japan 1971-1976 1.3 1.51977-1982 2.5 2.21983-1987 2.5 2.8
United States 1971-1976 5.4 6.31977-1982 5.7 7.21983-1987 6.0 7.6
Selected WesternEuropean countries
France 1971-1976 0.0 2.51977-1982 4.3 6.31983-1987 6.0 10.1
Germany, Federal Republic of 1971-1976 1.1 2.11977-1982 3.1 4.21983-1987 6.0 8.0
Italy 1971-1976 7.6 5.91977-1982 7.0 7.81983-1987 7.3 10.7
Spain 1966-1972 0.9 0.91973-1979 7.0 3.41980-1984 11.3 11.4
United Kingdom 1976-1975 4.2 3.01976-1980 7.6 5.41981-1983 9.4 10.6
Source: Department ofInternational Economic and Social Affairs of the United NationsSecretariat, based on OEeD Economic Outlook, No. 40 (December 1986), table 16; for Spain, J.J. Dolado et aI., "Spanish industrial unemployment: some explanatory factors", Economica,Supplement 1986, vol. 53, No. 21O(s); and for the United Kingdom, D. Coo and F. Gagliardi,"Nominal wage determination in ten OECD economies", OEeD Working Paper, No. 19, March1985, table 11, column 2.
a NAIRU estimates use the average rate of growth of import prices over the estimation period ofthe wage equation.
21 See D. Coe, "Hysteresis effects in aggregate wage equations" (Paris, OECD, October 1986).22 The NAIRU is not strictly analogous to the natural rate in an open economy since changes in import prices may offset the full effect of wage
inflation on the overall rate of inflation.
150

structural features that may be affected by a path of highunemployment are the stock of physical capital, the stock ofhuman capital and the distinction between "insiders" and"outsiders" in the labour market.
First, entrepreneurial aversion to capital formation mayresult from high unemployment which depresses sales expectations. Lower potential capital formation, in turn, leadsto lower output and therefore to a rise in the natural rate ofunemployment.
Second, human skills are acquired through education andjob experience. A prolonged bout of unemployment mightthen lead to the decay of human capital and to a worsening ofthe probability of finding a job. As a result, the natural ratetends to rise. Other things being equal, the more long-termunemployment there is, the more important this secondchannel is likely to be.
Third, hysteresis may arise from the wage-bargainingprocess. 23 In its simplest formulation, the argument is thatthose who take part in wage negotiations are principally concerned with their own real wages and job security. As adverse shocks occur and unemployment mounts in theeconomy, those that remain "inside" renegotiate theirwages to preserve their employment, in effect excludingthose that have become "outsiders" . In this case, real wagestend to be too high to allow employment for those who areoutside the negotiating process. A rise in the natural rate isthe outcome.
There may be other reasons why the natural rate of unemployment depends on the past rate. Indeed, the theoreticalpossibility of hysteresis is largely uncontroversial. But verifying its empirical significance and actual magnitude is adifferent matter, for which broad tests are only now beingconducted. Preliminary studies indicate, howev~r, that significant hysteresis effects "would have major implicationsfor demand management and labour market policies" .24 Theimplied policy dilemmas therefore must be faced for thereappears to be a real risk that the trade-off between unemployment and inflation may worsen.
Policy dilemmas
Recent reports on the unemployment problem have focused on the need to combine supply-side measures withdemand expansion. How these measures might be co-ordinated, however, is not completely clear. In particular, thethreat of accelerating prices lurks in the background. TableVII.7 embodies this central dilemma of policy makers. The
NAIRU has been moving up. Lowering inflation wouldtherefore seem to require more unemployment.
The actual rate of unemployment in the 1980s has generally exceeded the NAlRU, however, which suggests thatthere is some scope for following expansionary aggregatedemand policies without incurring more inflation. Moreover, if expansionary policies are not followed, the naturalrate will tend to move up towards the actual rate of unemployment in accordance with the hysteresis hypothesis. Ifthis effect is dominant, it will worsen the future trade-offbetween inflation and unemployment.
It might then appear that there is no policy dilemma ifeither the actual rate of unemployment is above the NAIRUor if hysteresis effects are dominant. Clearly, if only hysteresis effects are behind the rise in unemployment, then thereis no unique long-run NAIRU. In such an environment, policy makers can bring down the unemployment rate to anylevel with stable inflation, at least in the long run. If deflationary policies are pursued instead, inflation rates woulddecrease and eventually stabilize at a higher permanent rateof unemployment.
As noted above, there is mounting evidence that the longterm unemployed do not play any significant role in thewage-determination process. The evidence is strongest forWestern European economies, especially the United Kingdom. 25 This weakens the downward pressure on inflationthat might be expected to arise from a given rate of unemployment, and is consistent with a rise in the natural rate ofunemployment due to hysteresis effects operating througheither the second (human capital) or third (insider-outsider)channels mentioned in the preceding section. An uncontroversial but important macro-economic policy implicationthat follows is that employment programmes should beaimed at reducing long-term unemployment. For any givenlevel of unemployment, this will tend to lower inflationarywage pressure since the long-term unemployed are likely tobe more receptive to flexible wage conditions than thosewho are only temporarily unemployed (Le., for less than sixmonths).
As the actual rate ofunemployment has been far above theNAIRU in most developed market economies, there wouldappear to be scope for an aggregate demand expansion thatwould lower unemployment with a minimum of inflation.However, in the first place, NAIRU estimates must beviewed with caution because they are difficult to measure.26
In order to determine the precise scope for a demand expansion, additional information is also required, particularly oncountry-specific aspects of aggregate supply.
23 See O. Blanchard and L. Summers, "Hysteresis and the European unemployment problem", National Bureau ofEconomic Research WorkingPaper, No. 1950, June 1986, in which an "insider-outsider" model has been constructed, which shows that employment, in the presence ofshocks, follows a process similar to a random walk. In such a setting, employment and unemployment do not converge at the pre-shockequilibrium but are instead determined by the history of shocks.
24 OECD Economic Outlook, No. 40 (December 1986), p. 35.2S See the references cited in note 3. In addition, the OEeD's most recent and preferred specification of the nominal wage equation for the United
Kingdom incorporates hysteresis; as a result, no long-run relationship between the level of unemployment and wage inflation is detectable and aNAIRU cannot be calculated [see OECD Economic Outlook, No. 40 (December 1986»).
26 They are based on price and wage equations that are sensitive to specification and to the period of estimation.
151

YEAR1251 84fZ2 8SIC'I 86C 87
GNP DEFlATOR
FlSCAL OEF1C1T / GNP
CURRENT ACCOUNT DEFletT / GNP
Figure VIlA. Selected developed market economies:key macro-economic indicators, 1984-1987
15
5
10
15
-4
Source: Department oflntemational Economic and Social Affairs ofthe United Nations Secretariat, based on OEeD and Project LINK estimates.
Secondly, even if the natural rate of unemployment is wellbelow the actual rate, policy makers may still decide not toseek to close the gap for fear of encountering balance-ofpayments difficulties. If such difficulties arise, depreciationmay be required, which would exacerbate inflationary pressure. That this is a real possibility even for a large countryseeking unilateral demand-led expansion was vividly illustrated in 1982 in the case of France. To combat unemployment, it is crucial that macro-economic policies beco-ordinated across countries.
Scope for demand policies
The growth of both real wages and non-wage labour costsin the 1980s has been slowing down in most developed market economies. In fact, the trend of real wages relative toaverage labour productivity has been downwards. If this declining trend in real labour costs continues, which would notrule out increases in real wages, it will eventually price labour back into jobs. The important questions, then, arewhether current cost trends can continue and how long it willtake before a significant dent in unemployment can be made.
A concept closely related to the cost of labour is the degreeof flexibility of the labour market. The more flexible themarket, the more likely that labour market disequilibria willnot spillover into unemployment. The evidence on real wagerigidity reported above indicates that the degree of flexibility of the labour markets in the United States is about thesame as that found in Western Europe. These economieshave similar degrees of long-run real wage rigidity. In fact,the economies that appear to be most flexible in both theshort and the long run are the Federal Republic of Germanyand especially Japan. So long. as these traits can be preserved, or possibly improved upon, both countries are wellplaced to engage in expansionary demand policies.
Broadly similar conclusions can be reached in a differentway by considering progress in reaching principal objectives of macro-economic policy. For example, policymakers in most developed market economies have been preoccupied with reducing inflation and fiscal deficits since thelate 1970s; more recently, the need to lower current accountimbalances has received a great deal of attention. Whilethere is no unique way to measure. progress towards thesegoals, and indeed other goals might be considered as well,one possible yardstick can be built upon the basis of thesethree target variables and their desired values. Thus, Governments might desire balanced budgets and cun-ent accounts and a zero rate of inflation. These targets wouldchange over different phases of the business cycle and capacity utilization, and in the presence of shocks such as oilprice jumps. There may even be asymmetrical evaluation ofsurpluses and deficits of equal normalized values. But progress towards attaining these objectives is surely in the purview of policy makers.
Figure VIlA shows the magnitudes of the budget and current account deficits relative to gross national product aswell as gross national product deflators. The higher the val-
152
ues of these magnitudes, other things remaining equal, thesmaller the room for policy manoeuvre. Conversely, thecloser to zero these magnitudes are the greater the degree ofmanoeuvrability. Whether large budget and current accountsurpluses are evaluated as offering more room for manoeuvre depends on the subjective preferences of policy makers.But it might be conjectured that progress in eliminating fiscal deficits in combination with current account surplusesshould provide added room for expanding demand.
The indicators in figure VIlA suggest, first, that Japanand especially the Federal Republic of Germany have relatively more room for pursuing expansionary aggregate demand policies. Secondly, France has recuperated greatlyfrom the condition that forced it to reverse policy in 1983,and its present room for manoeuvre is higher. Thirdly, boththe United Kingdom and the United States have less roomfor manoeuvre. In the case of the United Kingdom, the deterioration compared with the position in 1986 stems from anexpected pick-up in inflation (by about 1 percentage point)and continued deterioration of the current account from virtual balance to a deficit equivalent to 0.8 per cent of grossdomestic product. Fourthly, neither Italy nor Spain havemuch room for manoeuvre although, on current policies, amove towards fiscal consolidation and lower inflation is detected in both countries in 1987.
It should be clear that these indicators have nothing to sayabout aggregate supply conditions, which do matter in determining the scope for aggregate demand expansion. But theeconomies with the greatest degree of real wage flexibilityalsoseem to have achieved significant progress towards stabilization.
Role of international co-ordination
The data in figure VIlA also show that the scope for demand expansion depends on factors that are not fully subjectto national control. This is especially the case for currentaccount imbalances, which in turn partly depend on exchange rates and the fiscal stances of large countries. Thus,until mid-1985, real depreciation of Western European currencies vis-it-vis the United States dollar added to inflationary pressure and contributed to a slower decline in inflationrates in Western Europe than in the United States. This mayhelp to explain why most Western European Governmentswere reluctant to engage in expansionary demand policies atthat time and instead followed contractionary macro-economic policies. These policies helped to slow down inflation, which was a major objective of policy, but at aconsiderable cost in terms of unemployment.
With the recent decline in the value of the dollar and in oilprices, Western European countries as a group will be ableto engage in expansionary policies without as great an inflationary risk as before. Individual countries in Western Europe would face balance-of-payments difficulties if theyattempted expansionary policies in isolation, but figure
VIlA indicates that there is some potential for a fruitful collaborative effort. For example, France and the Federal Republic of Germany could engage in expansionary policieswith little loss between them, whether in terms of departuresfrom stabilization objectives or in terms of leakages outsidetheir national boundaries, since they are each other's majortrading partners.
This potential for co-ordination of expansionary demandpolicy among Western European countries has been explored recently by the European Economic Community,27 asexamined in chapter II above. This co-operative strategyaims at lowering the rate of unemployment of the group by 4percentage points by 1990. The key ingredients of the strategy are faster growth through joint supply and demandactions under conditions of monetary stability. The supplyside measures include continued efforts at lowering real labour costs through a slowing of social securitycontributions. The demand-side actions incorporate reductions in direct taxation on households and increased levels ofpublic investment. Fiscal policy, therefore, has a major responsibility in achieving the co-operative strategy of theCommunity.
This is a promising strategy in the medium term, but itssuccess is by no means guaranteed. Among other factors, itis contingent on a sustained decline in the general government fiscal deficit of the United States and on annual growthin Japan of slightly under 4 per cent. A wider effort to coordinate policies should therefore be pursued.
Conclusion
There is a need to combine aggregate supply measureswith demand expansion to reduce unemployment in developed market economies. Improvements in aggregate supplyconditions and notably in the functioning of labour marketsare central to restoring full employment. Considerable progress has been made in this regard, but acontinuation of therecent trend is still necessary.
An aggregate demand stimulus is also needed to lowerhigh rates of unemployment. Because some countries haverelatively greater room for manoeuvre, they are in a betterposition than others to lead in an expansion of demand.Given slow growth and high unemployment, it is very likelythat expansion by these countries would be at least partlymatched by a stimulus from other developed market economies. Such initiatives would help to provide a badly neededboost to a depressed world economy. Moreover, the likelihood that these countries might encounter serious balanceof-payments difficulties or rekindle rapid inflation iscurrently quite small.
Reluctance on the part of policy makers to engage in expansionary aggregate demand policies is acting as a drag notonly on world economic growth but also on the employmentprospects of the developed market economies.
27 See Commission of the European Communities, Annual Economic Report 1986-1987 (Brussels, October 1986).
153

CHAPTERVIll
THE FAST-GROWING DEVELOPING COUNTRIES OF THE 198010
The rates of economic growth of the developing countrieshave diverged widely in recent years. Some countries haveachieved high rates of growth while others have stagnated orhave suffered an actual decline in income. The divergence ofgrowth rates is, of course, not a new phenomenon. What hasgiven the question added importance is the sharp deceleration ofgrowth of the developing countries as a whole duringthe 1980s and the international environment in which it tookplace. At a time when a large number of these economieshave been stagnating or declining, quite a few showed animpressive growth record. The present chapter examines thegrowth experience of 13 developing countries and territoriesand one planned economy with some major developingcountry characteristics (China) which had high rates ofgrowth of GDP during the period 1981-1985, and seeks toidentify factors that might have contributed to their relativesuccess.
Why some countries do better than others has often beendebated among economists and policy makers. The crucialrole of various factors in long-term economic developmenthas been much discussed and there is a certain amount ofagreement on what some of these factors are.
The focus of attention in this chapter is, however, the rateof economic growth of selected countries over a relativelyshort period of time, namely, 1981-1985, and not on factorsgenerally conducive to long-term economic growth. Theidea is not to propound a theory of economic growth but toexamine the circumstances under which some of the developing economies have recently done well compared with therest. These circumstances were extremely varied and included domestic factors, as well as the external economicenvironment and, in some cases, even fortuitous developments.
The factors selected as possible explanations of growth ofthe fast-growing countries during the period are meant toreflect their structure of production and trade, initial conditions, domestic priorities and policies, as well as changes inthe external economic environment. They are discussed under the following headings: share of agriculture in GDP andgrowth of agricultural production; export orientation of theeconomy; macro-economic performance; import capacityand growth of exports; and adverse external environment.
The approach used here for examination of the growthexperience of the developing countries compares, for eachof the above factors, the average experience of the fast-
growing countries with that of the other developing countries which have not fared well during the period 1981-1985.The methodology used is not meant to quantify the relativeimportance of the various factors in the explanation ofgrowth differentials.! It nevertheless sheds light on the difference between the sample group of fast-growing and otherdeveloping countries in respect of each of the factors selected as explanatory variables.
The fast-growing countries are defined as those which hadan average growth rate ofGDP of4.5 per cent or more and aper capita GDP growth of over 2.5 per cent during the period. The countries have been divided into net energy importers and net energy exporters and, for the purpose ofcomparison, other developing countries have been similarlygrouped. The 14 fast-growing countries and territories sodefined are, in alphabetic order: Burma, Cameroon, China,Congo, Hong Kong, India, Malaysia, Oman, Pakistan, Republic of Korea, Singapore, Sri Lanka, Thailand, and Turkey. 2
It would, of course, be futile to look for explanations ofhigh-growth performance that are valid for all countries.The importance of individual factors underlying the growthperformance varies greatly from country to country. Thegrowth ofagricultural output does not have the same significance for Singapore as for China. Neither does externaltrade have the same importance for India as for the Republicof Korea. Nevertheless, a number of factors emerge fromthe analysis as significant in suggesting why these countriesin general have fared better than other developing countries.At the same time, the experience of the high-growth countries themselves has been diverse. Such diversity shouldcaution against any sweeping generalization or prescriptionfor sustained growth which is applicable to all cases and circumstances.
It should also be pointed out that economic growth doesnot depend on economic factors alone. Social and politicalturmoil and armed conflict, perhaps perhaps more than anything else, have been responsible for poor economic performance in many countries in recent years. It should also bestressed that the choice of growth performance for investigation does not imply approbation of growth in preference toother policy objectives. Sometimes the record of socialprogress of individual countries has not matched theirgrowth performance. To focus on growth is not to deny theimportance of other national objectives such as equity andhuman rights.
I Such quantification would require the use of models, which would be much more complex than a decomposition exercise used, for example, inexamining the effects of external shocks of balance of payments (see, for example, Edmar L. Bacha, "External shocks and growth prospects: thecase of Brazil, 1973-89", World Development, vol. 14, No.8, 1986). It also requires a separate examination for each country. Such tasks havebeen considered too ambitious for the present purpose.
, The rate of economic growth of the province of Taiwan has been one of the highest in the world but has not been considered here.
155

The shrinking number of "success stories"
A striking fact about the countries which achieved highrates of growth during the 1980s is how few they are. Out ofa sample of over 80 countries for which at least some of therelevant data are available only 14 could be classified as fastgrowing during the first half of the 1980s. By contrast, 32countries were fast-growers during the 1970s (table VIII. 1).
For most developing countries, the rate of economicgrowth has fluctuated greatly. It has often come in a shortburst of high growth followed by a period of stagnation ordecline. As the table shows, "success stories" have oftensoured, and countries with poor economic performance inone period have achieved higher rates of growth in the next.Many of the success cases of the 1970s, including Brazil,Colombia, Cote d'Ivoire, Mexico, and the Philippines, have
experienced only slow growth or decline in income duringthe first half of the 1980s. Only rarely has a countryachieved high and stable economic growth over a substantialperiod of time. For the majority ofthe developing countries,the basis of sustained economic growth thus remains fragile.Even among the fast-growing countries selected here, therewas a sharp deceleration of growth in 1986 in a number ofcases, namely, Burma, Congo, Malaysia, Oman and Singapore.
That all the countries in Latin America have disappearedfrom the list of fast-growing developing economies and onlytwo from the African continent remain on it is due to thepervasive nature of the external shocks of the 19808. At thesame time, the geographic distribution of the high-growthcountries points to important features of their economieswhich distinguish those economies from others.
Table VIII. I. The changing number of success stories
Countries consideredhigh-growth in 1971-1980but low-growth in1981-1985a
AlgeriaBrazilColombiaCosta RicaCote d'IvoireDominican RepublicEcuadorEgyptGuatemalaIndonesiaJordanKenyaLibyan Arab JamahiriyaMaltaMexicoNigeriaParaguayPhilippinesQatarSaudi ArabiaSyrian Arab RepublicTunisiaUnited Arab EmiratesYugoslavia
Countries consideredhigh-growth in 1981-1985but low-growth in1971-1980b
BurmaCameroonCongoIndiaSri LankaTurkey
Countries consideredhigh-growth in both periods
ChinaHong KongMalaysiaOmanPakistanRepublic of KoreaSingaporeThailand
a Countries with a GDP growth of 5.5 per cent or more during the period 1971-1980 but below 4.5per cent during 1981-1985. (A lower growth rate was selected as a cut-off point for the1980s because of the deceleration in the overall rate of growth in the world economy.)
b Countries with a GDP growth of 4.5 per cent or more during the period 1981-1985 but less than5.5 per cent during 1971-1980.
The share of agriculture in GDP and growth ofagricultural output
Declining world prices of agricultural commodities during the first half ofthe 1980s certainly had an impact on real
agricultural income and GDP through changes in terms oftrade. The influence of movements in terms of trade will bediscussed later. It may be noted at the outset, however, thatagricultural production for domestic consumption constitutes, on the average, about 65 per cent of total agriculturaloutput of the developing countries. 3 For some of the largest
3 Based on 1980 data for 50 developing countries (simple average). For the fast-growing countries, the proportion was much lower (about 17 percent).
156

developing countries, the proportion is much higher. A largeproportion of the agricultural sector of those economies isthus relatively unaffected by international price changes, although individual countries are vulnerable to them.
There is no indispensable relationship between the growthofagriculture and the growth of GDP. But, given the relativeimportance of agriculture in the gross domestic product ofthe developing economies, and the fact that agro-industry
constitutes a large share of manufacturing output, efforts toincrease agricultural production naturally may be expectedto have contributed to the overall performance of the fastgrowing countries. However, the role of agriculture variesgreatly.
On the average, the importance of agriculture in the fastgrowing energy-importing countries is not very differentfrom that in the other energy importers (table VIII.2).4
Table VIII.2. Growth of GDP, share of agriculture in GDP and growth of agricultural output----_._---
Annual growthofGDP
(Percentage)
1981-1985 1986
Share ofagriculture
inGDPSPercentage)
1980
Growth ofagricultUral
output(Annual rales,
percentage)
1976- 1981-1980 1985
. Fast-growing countries
Net energy importers:
Republic of Korea 7.0 12.0Pakistan 6.4 7.0Singapore 6.1 1.5HOllgKong 5.9 7.0Burma 5.9 3.5Thailand 5.3 4.0Sri Lallka 5.0 3.5India 4.6 4.0Turkey 4.6 5.9
Mean 5.7 5.4
Net energy exporters:
Oman 12.7 3.2Cameroon 5.9 5.5Congo 5.6 -8.0Malaysia 5.0 0.5
Mean 7.3 0.3
China 9.5a 7.0a
Mean of other developingcountries:
Net energy importers 0.5 2.1
Net energy exporters --0.9 -0.9
16 0.4 2.431 3.1 3.8
11
46 3.6 6.225 2.9 3.828 4.8 4.037 1.5 4.023 1.7 2.1
23 2.6 3.8
32 0.3 2.112 1.8 1.224 2.8 3.3
23 1.6 2.2
31 7.4 8.1
32 1.6 2.0
14 1.2 3.1
Source: For GDP growth, Department of International Economic and Social Affairs of the United NationsSecretariat. Agricultural data are from the Food and Agricultural Organization of the United Nations andnational sources. Data on share of agriculture in GDP are from the World Bank, World Development Report1982.a Net material product.
Countries with a large share of agriculture in GDP appearedto be as likely to grow as those with a small share. The average share of agriculture in GDP was 23 per cent among theformer (29 per cent excluding Hong Kong and Singapore)and 32 per cent among the latter in 1980. Within the fastgrowing countries, tllere is a large difference in the share of
agriculture: Singapore and Hong Kong have practically noagricultural base, while in Burma the sector accounted for46 per cent of GDP. There was an inverse but rather weakcorrelation between those shares and the rates of growth ofGDP among the fast-growing countries.
4 Since the idea is to compare the individual experience of the fast-growing countries, and not the fast-growing countries as a whole, with the otherdeveloping countries, a simple rather than a weighted average has been used, except in table VlII.6.
157

Among the net energy-exporting countries other thanOman, which achieved high rates ofgrowth, the importanceof agriculture is about the same (23 per cent of GDP) as inthe net energy importers but substantially higher than in theother energy-exporting countries. Both Cameroon and Malaysia have a large agricultural sector and were thus lessdependent on oil than other oil-producing countries. Theyalso did not neglect agriculture despite their oil abundance.In Oman and the Congo oil production overshadows otherprimary and secondary sectors. Oman had already experienced a sharp deceleration of growth and the Congo a decline in GDP in 1986 as a result of a very large drop in oilprices.
A much sharper contrast between the high-growth countries and other developing countries arises in the growth ofagricultural production. Over the period 1981-1985, agricultural output among the fast-growing energy importers increased by about 4 per cent, compared to 2 per cent for theother developing countries in the group. Furthermore, thedifference in growth rates was higher during this period thanduring 1976-1980.
A notable aspect of agricultural growth in the fast-growing energy-importing countries is that, apart from HongKong and Singapore, the growth was higher than the average for the other developing countries in practically all thecountries in the group, including those where agricultureaccounted for only a small proportion ofGDP. Since agriculture constituted a large segment of the economy in the majority of the countries in the group, the growth of GDP wascrucially dependent on increase in agricultural output. InBurma, India, Pakistan, Sri Lanka and Thailand the growthofagriculture played a large part in the overall performance.To a lesser extent, this is also true of Malaysia. In China, thegrowth of the economy depended very much on a phenomenal increase in agricultural production.
The basis of increase in agricultural output in these countries, especially in Asia, was the importance attached to agriculture in their long-term development policy, with itsemphasis on the use of modern inputs and investment in infrastructure, especially irrigation.
A notable success of the agricultural policies of the Southand South- East Asian countries has been the diffusion ofnew high-yielding varieties. By the late 1970s, modern ricevarieties covered between 50 and 80 per cent of the cultivated land in China, Indonesia, Pakistan, the Philippines andSri Lanka, and modern wheat varieties accounted for twothirds of the total wheat area in India. Such diffusion wasmade possible by a large extension of the area under irrigation, which increased by 40 per cent its share of the totalagricultural land between 1966 and 1982, and by the use ofmodern fertilizers, the consumption of which in 1982 wasfour times the 1966 level in South Asia and six times inSouth-East Asia. Mainly as a result of such policies, the
level of self-sufficiency increased significantly in manycountries of the region. China, which had been a food importer during the 1970s, became more than self-sufficientduring the 1980s, Indonesia became self-sufficient in rice by1984, and India had surplus wheat production in 1985.5
The success of the Green Revolution in Asia had led manyto ask whether the same policies could be extended to otherareas, in particular to Africa. Unfortunately, the moisturelevels required for high-yielding varieties of cereals are notmet in most of Africa. Most of the continent's water resources are not in areas where aridity limits production or,when they are, their development is too costly to be directedat the cultivation of staple food crops. According to an FAOevaluation,6 for instance, the development of modern irrigation in Africa, with full water control, tends to cost two orthree times as much as in India. Climatic considerations are,however, only part of the story.
A broad comparison of public investment in agricultureand price policies at a regional level between the developingcountries of Africa, Asia and Latin America sheds light onthe difference in performance. An FAO survey of publicexpenditure in agriculture in a sample of developing countries gives some comparative data for the period 1978-1982.7
The share of public expenditure devoted to agriculture canbe taken as an indication of the priority given to agriculture.A significant point emerging from the FAG survey is thelarger number of countries in Asia which have allocated ahigh share ofpublic expenditure to agriculture. The analysisof the growth ofpublic expenditure in agriculture also showsthat African countries had often failed to increase plannedagricultural expenditure. In 11 of the 21 African countriescovered in the survey, planned agricultural expenditure declined over the period 1978-1982. In Latin America too, agricultural expenditure declined in real terms in manycountries. In Asia and the Pacific, on the other hand, of theeight countrie3 in the survey, only the Philippines showed adecline in real terms and five of the eight had growth rates ofmore than 10 per cent. Malaysia and Sri Lanka increasedpublic expenditure in agriculture by more than 15 per cent ayear.
Developing countries' agricultural price policies havebeen the subject of intense debate. However, there is generalagreement that in many third world countries both themacro-economic and sectoral policies have often resulted indisincentives to agricultural production.
In particular, price policies have often made producerprices too low, resulting in underproduction. According toan FAG study,S there is clear evidence that price policiesduring the period from 1969-1971 to 1981-1983 were lessfavourable to farmers in Africa than in other developing regions. This was particularly true of export crops, and wasattributable to government policy. As for producer prices of
5 World Bank, World Development Report, 1986.6 FAO, African Agriculture: The Next 25 Years, Rome, 1986.7 FAO, Public Expenditure on Agriculture in Developing Countries, 1978-88, Rome, 1984.• FAO, African Agriculture: The Next 25 Years
158

cereals between 1969-1971 and 1981-1983, they grew in realterms over the entire period by only 3 per cent in Africacompared with 18 per cent in Asia, 23 per cent in the MiddleEast and 30 per cent in Latin America. It should be pointedout, however, that agricultural pricing policies in Africa arealready changing.
Sustained growth of production also depends on the success in reducing the vulnerability ofagriculture to the vagaries of nature. The experience of the sub-Saharan Africancountries during the 1980s is a case in point. In the case ofmany South and South-East Asian countries, an essentialachievement of the policy mix pursued in the agriculturalsector has been the increased resilience of agricultural production to drought conditions. In India, agricultural development policies contributed to the relative stability of foodgrain production in the face of variable weather. 9 Similarly,the vulnerability of paddy production in Sri Lanka was significantly reduced by the increased use of modern inputs.
Export orientation of the economy
The growth of an economy in a difficult international economic situation would depend both on the degree of its orientation to international trade and on its ability to adjust tothe changing external environment. An economy which exports or imports little can pursue domestic policies with ahigh degree of independence of the external economic situation. The question is whether the fast-growing countries ofthe 1980s were relatively insulated from the internationaleconomy.
The high-growth energy-importing countries were, on theaverage, actually more export-oriented than other developing countries in this category. The share of exports in GDPin the fast-growing countries was about 41 per cent in 1980compared to 20 per cent for the other energy-importingeconomies (table VIII. 3). However, the degree of export
Thble VIII.3. Export orientation of the economy
Exports aspercentage
ofODP(1980)
Exports of manufactures as
percentage oftotal exports
(1980)
Exports ofmanufacturesas percentage
ofODP(1980)
Fast-growing countries
Net energy importers:
Republic of Korea 30 90 27Pakistan 9 48 4Singapore 171 (115) 48 82Hong Kong 98 ( 65) 92 90Burma 8Thailand 19 36 7Sri Lanka 25 19 5India 5 59 3Turkey 5 27 1
Mean 41 ( 31) 47 24
Net energy exporters:
Oman 67 3 2Cameroon 16 5 1Congo 56 7 4Malaysia 54 29 16
Mean 49 11 6
China 6 47 3
Mean of other developing countries:
Net energy importers 20 22 4
Net energy exporters 35 9 3
Source: Department of International Economic and Social Affairs of the United Nations Secretariat, based onthe 19841nternational Trade Statistics Yearbook (United Nations publications, Sales No. E/F.86.XVll.7). Datafor Hong Kong were derived from Commodity Trade Statistics, 1980 (ST/ESA/STAT/SER.D/87-3). Re-exportsfor Singapore were calculated from the Yearbook ofStatistics, Singapore, 1980/81.
Note: Figures within parentheses exclude re-exports of Singapore and Hong Kong.
9 World Bank, World Development Report, 1986.
159
orientation differed greatly within those countries: the export/GDP ratio was less than 10 per cent for Burma, India,Pakistan and Turkey, 30 per cent for the Republic of Koreaand more than 90 per cent for Hong Kong and Singapore.Apparently, within the group, economies with the lowest export/GDP ratio were as likely to grow fast, as the most export-oriented ones. The figures for Hong Kong andSingapore are particularly high, partly because of the importance of re-exports in their total exports. However, even after correcting for re-exports, the figures remain muchhigher than for other countries.
More significant than the degree of export orientation isits nature. For countries relying mainly on export ofprimarycommodities the world demand for which is stagnant andwhose prices have been declining during the 1980s, exportorientation implies a low or negative growth impulse fromtheir exposure to the world economy, while for those countries exporting manufactures, in which trade has been increasing, it means a positive contribution to growth. Sinceworld trade in commodities in general has weakened duringthe 1980s while trade in manufactures has been expanding,though at a slower rate than before, the distinction is crucial.
For the fast-growing energy-importing countries, the importance of manufactures in exports was much larger thanfor the other energy importers. On the average, 47 per centof these countries' exports were manufactures comparedwith 22 per cent for the other countries in the category. Expressing exports of manufactures as a proportion of GDP,the difference between the fast-growing countries, on theaverage, and the other countries becomes even more pronounced. For the fast-growing energy importers, exports ofmanufactures constituted, on the average, 24 per cent oftheir GDP, as against 4 per cent for other energy-importingcountries. This difference is a reflection of a difference inboth the structure of the economies and degree of their outward-looking orientation. Again, there is a wide differenceamong the fast-growing economies themselves. But, apartfrom Burma, most of these countries have substantial exports of manufactures.
The energy-exporting countries' dependence on exports isof course much greater than for the energy importers. Sincethe world market for oil was depressed for much of the period andexports of the energy exporters as a whole declined,the fast growth of some of them calls for an explanation.None of the fast-growing countries is a member of OPECand hence bound by the Organization's ceilings on total exports. Oman increased its production and export of crudepetroleum by about 80 per cent between 1980 and 1985. Itsexports earnings increased by 33 per cent between 1981,when the second large increase in oil prices had alreadytaken place, and 1985. Being a relatively small producer ofoil, it was able to increase output and export without producing an impact of its own on the international oil markets.Similar considerations apply to the Congo, which increasedits volume of exports by over 50 per cent during the period
1981-1985. For both countries, oil accounted for 90 per centof exports.
The importance of oil in the economy of Cameroon issmaller than in the Congo but it still accounts for 70 per centof exports. Output increased by about 140 per cent over theperiod 1981-1985. The volume of the other exportsof Cameroon, mainly cocoa beans, coffee and wO,od, was stagnant,but their prices increased. Malaysia has amuch more diversified economy than any of the other three in the group.Though primary commodities constitute a large proportionof its total export, they are distributed over a number ofmajor export items, namely, rubber, palm oil, tin, timberand oil. During the period 1981-1985, the country increasedthe volume of its total exports by 22 per cent, and exports ofoil and palm oil by 50 per cent and 40 per cent, respectively,more than compensating for the falling international pricesof some of its export products. Much of the strength of theeconomy thus lay in the relative diversity of its exports. Malaysia has also a small but rapidly growing industrial exportsector. By 1985, however, sharply declining export pricesled to a decline in GDP.
The above analysis suggests that it is not export orientation as such that is important in an examination of growthperformance; it is the nature of the orientation and the opportunities of trade facing an open economy. It was possiblefor a number of countries to substantially increase their exports because their structure of production and export orientation enabled them to export goods for which worlddemand had been increasing. It was also possible for a fewother countries to increase exports of a major primary commodity under depressed market conditions because theirshare of the world market was too small or when the largerproducers were in no position to resist a reduction in theirmarket share. There is also an example of a country (Malaysia) with a diversified export basket which consisted mostlyof primary commodities but also a significant volume ofmanufactures.
Large countries are generally less export-oriented. 10
There is also some evidence to suggest that large countrieshad a better growth performance thansmall countries duringthe first half of the 1980s. 11 However, the three largest developing countries, namely, Brazil, India and'Indonesia, andChina had a very different growth experience during the1980s. China grew very fast and India at a moderately highrate, and while the growth of Brazil and Indonesia wasabove the average for the developing countries, it was farbelow that ofthe other two countries. It may be useful to takea closer look at the contrasting experience of the four countries which account for a large proportion of the productionand population in the developing world. They greatly add tothe diversity of growth experience of the developing economies.
China, a country of continental size and with a populationof close to a billion in 1980,12 achieved a very high rate ofgrowth of income during the 1980s. Its net material product
10 The Spearman rank correlation between the size of popUlation of 84 countries and their degree of openness in the 1980s was -0.63.II See Note by the Secretariat on the world economy 1986-1988 (EIAC.54/1987/L.l).12 All comparisons between countries, except for growth rates, relate to the base year 1980.
160

(NMP) grew at an annual rate of 9.5 per cent during theperiod 1981-1985, a significant increase over the 7 per centof the second half of the 1970s. Much of this accelerationwas the result of a series of reforms initiated in 1978. Exports accounted for only about 6 per cent of total outputmaking it one of the least open economies. Slightly less thanhalf of its exports consisted of manufactures, a much higherratio than for the other developing economies. The source ofeconomic growth of China was overwhelmingly domestic,despite a significant opening up of the economy to foreigntrade and investment in recent years. Much of it came fromagriculture, which accounted for 31 per cent of the economy,and rural industries, which grew at a rate of over 20 per centannually during the period. Industrial output as a whole increased by about 12 per cent per year. The country's terms oftrade improved marginally over the period 1980-1984 andhad a miniscule impact on the economy.
India, with a population of 700 million, is also of continental proportion. The share of exports in GDP was about 6per cent, the same as for China, but the share of manufactures in exports was larger (57 per cent). The importance ofagriculture in total output was somewhat larger (37 per cent)than in China and a diversified manufacturing sector accounted for 16 per cent of GDP. With exports accounting foronly a small proportion of GDP, the sources of its growthwere, as in China, very largely domestic. But the economygrew at only half the rate of growth of the Chinese economyduring the 1980s. Between 1980 and 1984 its terms of tradeimproved by about 7 per cent.
Brazil, with a population of 120 million and an area comparable to that of China, is among the largest developingcountries and the biggest in terms of the size ofGDP. Its percapita income was more than six times higher than in Indiaor China. The share of exports in GDP (9 per cent) was notmuch higher than for India or China but the proportion ofexports of manufactures was significantly lower (39 percent). The structure of its domestic economy is in many respects different from that of the other two countries. Agriculture accounted for only 13 per cent of GDP, while thecontribution of manufacturing was about 26 per cent, morethan in India and probably China too. Services accounted foras much as 53 per cent ofGDP, compared with 37 per cent inIndia and 22 per cent in China. The economy grew at anannual rate of only 2 per cent during the period 1981-1985,after 8.5 per cent during the 1970s. Its terms of trade improved by 3 per cent over the period 1980-1984 but with asharp deterioration in 1981.
The archipelago of Indonesia is smaller in total area thansome of the other developing countries but, with a population of 145 million, it is one of the biggest. Its structure ofproduction is markedly different from that of the other three.Primary-producing sectors constitute a much larger share ofthe economy than in the other three countries. Agricultureaccounted for 26 per cent of GDP, and oil and gas for about20 per cent in 1980; manufacturing accounted for only about10 per cent. It is also a much more export-oriented economy,with exports accounting for 30 per cent of GDP. Almost 98per cent of the country's exports were primary commodities,with oil making up 70 per cent. Over the period 1981-1985
161
the economy grew at an annual rate of 4 per cent. Unlike inthe other three large countries, the terms of trade ofIndonesia showed a sharp improvement in 1981, more than compensating for the declines in the following three years.
Export orientation and size by themselves explain verylittle of the striking difference in growth rates for China,India and Brazil. Much more important have been differences in the structure of production and trade and in the economic policies followed. Its economic system and thereforms of the late 1970s set the economy of China apartfrom that of India. For Brazil, with agriculture accountingfor a small fraction of the economy, which is natural for acountry at a higher level of development than the otherthree, even a large increase in agricultural output could nothave made a significant difference in the rate of growth ofGDP. Furthermore, both the tradable sector and the share ofmanufactured exports are relatively small, which make itspolicy of debt accumulation over the 1970s look imprudentin retrospect. The high degree of its orientation towards international finance was not adequately matched by exportorientation of its production structure. The other large country, Indonesia, is much more export-oriented than the otherthree. Here again, it is the nature of its orientation ratherthan its degree which was critical. An almost total dependence on primary commodity exports exposed the Indonesian economy to the external environment to a much greaterdegree than the other large economies. However, it wasmuch less affected than Brazil by the sharp increase in interest rates in the international financial markets during theearly 1980s.
Domestic macro-economic performance
The macro-economic performance of an economy is notindependent of its external economic relations. For most developing countries, a sudden fall in exports and imports willaffect important macro-economic magnitudes such as government receipts and expenditure. A decline in import capacity can hurt investment and lower the investment ratio, ashas happened in some of the heavily indebted countries during the 1980s. On the other hand, macro-economic policiesplay a crucial role in adjustments to the changing externalsituation, as well as in long-term economic growth. Threerelated aspects of macro-economic performance of the fastgrowing countries are briefly discussed here: the investmentratio, the savings ratio and the rate of inflation.
The investment ratio. On the average, the fast-growingenergy- importing countries had a higher ratio of investmentto GDP than the other countries of the group (table VIII.4).For the period 1981-1985, the average for the fast-growingcountries was 26.1 per cent, compared with 19.5 per cent forthe other countries. Most of these countries fall within a 20to 28 per cent range, with the ratio of Singapore an exceptionally high 44.7 per cent. Within the high-growth countries, there is little correlation between the investment ratioand the growth of income during the period, reflecting differences in both the structure of the economies and efficiency of resource allocation.

Among the energy~exporting high-growth countries too,the investment ratio is higher (31 per cent) than in other developing countries in the group (24 per cent). It is alsohigher than the ratio for the fast-growing energy-importingcountries, largely a result of the capital-intensive nature ofinvestment in mining. The investment ratio of China{30 percent) is among the highest in the developing regions.
Domestic savings. The difference between the fast-growing countries and other developing countries was particularly sharp in the rate of domestic savings. For the
high-growth energy-importing countries, the average ratioof savings to GDP during 1981-1983 was about 21 per cent,compared with an average of 11 per cent among the othercountries of the group. All countries had a ratio of 10 percent or above, in a majority ofcases 15 per cent or above andin half the countries over 20 per cent. It should be noted thatthe fast-growing energy-importing countries had a smallersaving-investment gap than others and were able to finance ahigher investment ratio with less reliance on foreign savings.
Table VIllA. Domestic macro-economic performance
Ratio of investmenttoGDP
Average Average1976- 1981-1980 1985
Ratio of savingstoGDP
Average Average1976- 1981-1980 1983
Rate ofinflation
Average Average'1976- 1981-1980 1985
Fast-growing countries
Net energy importers:
Republic of Korea 30.3 27.9Pakistan 16.3 17.3Singapore 40.8 44.7Hong Kong 28.4Burma 17.1 22.3Thailand 26.8 22.4Sri Lanka 22.0 27.5India 23.0 24.0Turkey 23.0 20.2
Mean 24.9 26.1
Net energy exporters:
Oman 25.0 25.4Cameroon 22.4 27.5Congo 17.7 37.7Malaysia 28.4 32.8
Mean 23.4 30.9
China 33.3 30.3
Mean of other developingcountries:
Net energy importers 22.8 19.5Net energy exporters 27.3 23.7
26.2 23.3 17.4 7.313.4 13.9 8.7 7.331.4 36.5 3.7 3.332.1 30.3 9.0 9.214.0 18.1 4.3 4.620.9 18.5 9.8 5.015.4 11.0 10.3 12.222.1 21.4 4.2 9.317.0 17.1 51.7 38.7
21.4 21.1 13.2 10.8
18.8 20.7 9.4 10.721.2 40.8 10.6 11.329.5 26.9 4.5 4.7
23.2 29.1 8.2 8.9
33.2 30.0 3.3 3.5
11.3 11.2 23.6 34.831.6 31.4 15.4a 21.7a
Source: Department of International Economic and Social Affairs of the United Nations Secretariat; IMF,International Financial Statistics, Supplement on Economic Indicators, No. 10, 1985 and other issues; IMF,Government Financial Statistics Yearbook 1986, and other international and national sources.a Excluding Bolivia.
The savings ratio of the fast-growing energy exportingcountries was on the average considerably higher (29 percent) than for the energy-importing high-growth countries.But it was not significantly different from that of the otherenergy-exporting countries. For China, the domestic savings ratio is practically the same (30 per cent) as the investment ratio as investment was financed almost entirely fromdomestic savings.
The rate of inflation. Perhaps the most remarkable difference in macro-economic performance between the fastgrowing countries and others was in their rate of inflation.The average annual inflation rate in the high-growth energy-
162
importing countries during the period 1981-1985 was about11 per cent compared with 35 per cent for the other energyimporters. Apart from Turkey, which had a high rate of inflation, the rate of inflation in every fast-growing countryfor which there was data was lower than the average for theslow-growing countries. The inflation rate was also muchlower among the high-growth energy-exporting countriesthan in the other countries of the group. Despite a sharpacceleration of the rate of inflation in China in 1985, theaverage for the country for the period 1981-1985 remained at3.5 per cent.
It is worth noting that, in all three aspects of domestic

macro-economic behaviour, the performance of the fastgrowing energy-importing countries was better than that ofthe other energy importers not only during the first half ofthe 1980s but in the 1970s as well. The average investmentratio of these countries was only marginally higher than thatof the slow-growing energy importers during the period1976-1980 but their savings ratio (21 per cent) was muchhigher than that among the latter (11 per cent). Similarly, therate of inflation among the fast-growing countries was halfthe rate among the other countries. Furthermore, during thefirst half of the 1980s, the macro-economic performance ofthe fast-growing countries remained unchanged or was evenbetter than during the 1970s.
These facts suggest that the efforts of these countries during the 1970s to save and invest were important factors in thedifferential performance in the 1980s. At the same time, agreater price stability during the 1970s gave these countriesmore room for manoeuvre. Other energy-importing countries entered the 1980s with large domestic disequilibria.
Import capacity and growth of exports
The growth of the volume of imports of the developingcountries as a whole decelerated sharply during the 1980s,reflecting the slow growth of the world economy during the1980s, and contributing to the fall in the rate of growth ofthese countries. These imports were growing at about 5.5per cent annually during the period 1976-1980 but only 1.5per cent over the period 1981-1985.
Against this background of a general decline in importcapacity, the experience of the fast-growing energy-importing countries stands in sharp contrast to that of the otherdeveloping countries. For the period 1981-1985, the dollarvalue of imports of these countries increased only marginally, on the average, by about 2.4 per cent per year. Since theunit value of imports declined by about 3 per cent, the increase in import volume was of the order of 5.5 per cent.The value of imports of the other energy-importing countries declined by over 6.7 per cent and their volume by about
Table VIII.5. Growth of imports and exports, 1981-1985(In current dollar values)
(Annual rates)
Imports Exports
Fast-growing countries
Net energy importers:Republic of Korea 6.9 ILlPakistan 1.9 0.9Singapore 1.8 3.3Hong Kong 5.8 8.9Burma -1.0 -6.3Thailand 0.1 1.8Sri Lanka -Ll 4.6India -0.1 2.0Turkey 6.9 22.3
Mean 2.4 5.4
Net energy exporters:Oman 11.6 5.8Cameroon -2.6a 1.6Congo 3.0b 8.7Malaysia 2.7 3.6
Mean 3.7 4.9
China 16.4 8.6
Mean for other developing countries:Net energy importers -6.7 -5.3Net energy exporters -2.1 -5.4
Memorandum items:Unit Values
All net energy-importing developing countries -3.1 -3.8All net energy-exporting developing countries -3.7 -1.2
Source: IMF, International Financial Statistics, December 1986.a The Economist Intelligence Unit, Country Profiles-Cameroon, Central African Republic,
Chad, /986-87. The imports of Cameroon increased at a rapid pace during the 1970s, and theirlevel in the 1980s remained considerably higher than in the mid-1970s.
b 1981-1984.
163

3.5 per cent. Imports of the fast growing energy-exportingcountries increased at an annual rate of 3.7 per cent, whilethose of the other energy exporters declined by 2 per cent(table VIII.5). One of the major factors behind the poorgrowth record of many developing countries during the1980s is, undoubtedly, declining imports.
The maintenance of a reasonable import capacity amongthe fast-growing countries was largely due to a spectacularlybetter export performance. The dollar value ofexports fromthe high-growth energy-importing countries increased at anannual rate ofover 5 per cent. Exports from the other energyimporters, by contrast, declined at a rate of 5 per cent overthe period, partly reflecting the fall in prices of primarycommodities which have a large share of the total exports ofthese countries. The total export from this group of countries declined despite large increases of exports from someof the heavily indebted countries such as Brazil. Some of thelargest declines took place among the African countries. Inboth the fast-growing and slow-growing energy-importingcountries, imports did less well than exports, which reflectsthe tightening of the international financial situation and thecontraction of net transfer of resources.
The fast-growing energy-exporting countries increasedthe value of their exports by about 5 per cent on the average,compared with a decline of over 5 per cent among the otherenergy exporters.
An adverse external environment
The developing countries faced three sets of problemsduring the early 1980s: recession in the industrialized countries, and hence, a slow expansion of international trade, asubstantial decline in primary commodity prices, and risingreal interest rates and debt burdens. The differential impactof deterioration in terms of trade and increasing debt burdenis discussed below.
Terms of trade. For the fast-growing energy-importingcountries, the terms of trade showed an annual deteriorationof 0.7 per cent over the period 1981-1984,13 compared with adecline of 1.3 per cent for the other energy-importing countries. The impact of these changes on real income of the fastgrowers varied greatly from country to country, rangingfrom 2.2 per cent of GDP (Hong Kong) to -1.1 per cent(Thailand). For only less than half the countries was the impact clearly favourable, while in the other cases the changewas either negligible or adverse. On the whole, these countries had a favourable impact equivalent to 0.1 per cent ofGDP, compared to an adverse impact among the other energy importers equal to 0.4 per cent of their GDP (tableVIII.6). The gain in real income through terms of tradechanges in the former category looks relatively small, particularly when compared with their rate of growth of income. As exporters of manufactures and importers of oil,
they benefited from changes in the relative prices of theseproducts, but only marginally. The adverse impact on theslow-growing countries was larger (0.4 per cent per year),particularly when viewed in relation to the rate of growth ofincome of these countries during the period (0.5 per cent).
The impact of terms of trade changes among the fastgrowing energy exporters was significantly adverse (-0.5per cent), in contrast to a 0.1 per cent improvement amongthe other energy exporters. But the annual loss was fairlysmall when compared with their annual rate of growth ofincome.
Debt-servicing costs. The initial size of the debt burdendoes appear to have been much smaller among the fastgrowing countries than among the others (table VIII.6). Inthe energy-importing group, the external debtl GNP ratio in1980 was on the average lower (about 18 per cent) for thefast-growing countries than for other developing countries(about 28 per cent). A similar picture emerges when debt iscompared with export earnings. For the fast-growing countries, external debt amounted to a lower proportion of theirexports in 1980 (about 92 per cent) than for the other energyimporters (111 per cent). There was a large variation in bothratios among the fast-growers. Among the major debtors,the debt/GNP ratio was only about 11 per cent in India andover 30 per cent for the Republic of Korea, Pakistan and SriLanka. The debt/export ratio varied from 80 per cent for theRepublic of Korea to 428 per cent for Turkey.
A significant difference between the fast-growing andother energy-importing countries was that their exportswere growing much faster than their debt, and this was reflected in the decline in the debt/export ratio, from 183 percent to 92 per cent over the 1970s. For the slow-growingenergy importers, debt was accumulating much faster thannational income and the debt/GNP ratio increased from 19per cent in 1970 to 28 per cent in 1980, and reached 50 percent in 1984. Among the fast-growers, the ratio increasedfrom 16 per cent to 18 per cent and to 22 per cent over thesame period. An even more important sign of troubles aheadfor the slow-growing countries was that debt was increasingfaster than exports, and the debt/export ratio, unlike that ofthe fast-growing countries, was increasing. In other words,the capacity of these economies to transform domestic production into exports was already falling behind the rate oftheir absorption offoreign debt.
.For the fast-growing net energy-importing countries,debt-service amounted to a significantly smaller proportionof their GNP (2.3 per cent) than for the other energy importers (6.5 per cent) over the period 1980-1984. Undoubtedly, the shock from this source was thus much larger for theslow-growing countries. The debt-service/export ratio wassimilarly much larger (22.6 per cent) for these countriesthan for the fast-growing countries of the group (11.4 percent). Once again, there was a large variation among the
13 Data for 1985 are not available for most countries. Commodity prices declined by about 11 per cent in dollar terms in 1985 and the terms of tradeof the developing countries declined by about 1.3 per cent. However, data for the year should not materially alter the relative impact of terms oftrade on the fast-growing and other countries estimated here.
164

Table VIII.6. Impact of changes in terms of trade and debt burdens
DebtDebt service!
Impact of terms service! exportof trade on GNP ratio ratio
GDP, (Average (Average198H984a 1980-1984) 1980·1984)
(Annual rates, Debt!GNP ratio Debtlexportratio (Per cent (Per centper cent) 1970 1980 1984 1970 1980 1984 of GNP) of exports)
Fastcgrowing countriesNet energy importers
Republicof Korea 0.0 22.4 29.5 37.0 143.0 80.1 89.0 6.0 15.0
Pakistan -0.4 30.6 34.4 29.7 380.7 266.5 258.7 2.4 21.0Singaporeb 0.3 7.9 12.1 10.6 7.6 5.3 6.0 2.0 1.0Hong Kongb 2.2 0.1 1.8 0.9 0.1 1.8 '0.8c 0.3 0.3dBurma -0.2 4.7 25.2 34.9 77.9 293.7 517.4 2.3 27.7Thailand --Ll ILl 17.7 26.3 62.0 70.7 114.3 4.3 18.3Sri Lanka 0.7 16.1 33.7 41.9 83.7 100.6 137.1 2.8 9.5India 0.1 15.1 ILl 13.7 356.5 145.3 173.5 0.9 11.8Turkey -0.4 14.8 27.0 32.3 244.4 428.4 166.1 3.4 25.6
Mean 0.1 16.1 18.3 21.9 182.9 92.2 94.0e 2.3 l1.4eNet energy exporters
Oman 8.2 17.2 11.7 26.6 2.4 3.6Cameroon -1.2 13.0 33.6 31.3 50.3 106.1 94.0 4.2 13.6Congo 0.6 53.9 71.4 76.2 179.6 110.0 8.7 14.2d
Malaysia -1.0 10.0 16.8 39.4 21.3 26.1 62.1 3.0 5.0Mean -0.5 10.2 18.6 34.5 23.0 31.5 58.9 3.2 5.6 f
Mean of otherdeveloping countries
Net energyimporters -0.4 18.6 27.5 50.3 102.7 110.8 169.6c 6.5 22.6c
Net energyexporters 0.1 18.9 24.7 41.6 130.3 93.4 176.7 6.3 25.8
Source: World Bank, World Development Reports and World Debt Tables, 1985-1986.
a' Defined as percentage change in terms of trade multiplied by the ratio of exports to GDP.b Debt ratios cover only public and publicly guaranteed debt.c 1983.d 1980-1983.e Excluding Hong Kong.f Excluding Congo.
Note: The means, except for terms of trade, are weighted averages.
fast-growers in the debt-service/GNP ratio, ranging, amongthe major countries, from 0.9 per cent for India to 6.0 percent for the Republic of Korea, as well as in the debt-service/export ratio, which ranged from 10 per cent for Sri Lanka to26 per cent for Turkey.
Among the energy-exporting countries too, both the debt/GNP and the debt/export ratios were lower in 1980 for thefast-growers than for the other countries. As with the netenergy-importing countries, debt-service amounted to amuch larger proportion of GNP of the slow-growing countries (6.3 per cent) in this category than among the fastgrowing countries (3.2 per cent) during 1980-1984. Thedebt-service/export ratio is also much larger (22.6 per cent)
165
among the former than among the latter (5.6 per cent).
There is also evidence that the debt-shock arising from theincrease in interest rates hurt the slow-growing developingcountries more than it hurt the fast-growing countries. Notonly was the difference in interest payments as a proportionof GNP large between the fast-growing countries and othercountries but, among the energy importers, the differencewas larger than in total debt-service liabilities as a proportion of GNP, as table VIII.7 shows. This is consistent withthe fact that the proportion of commercial debt with variableinterest was higher among the most heavily indebted countries than among others.

Table VIII.7. The relative interest payment burden of the fast-growingand other countries
(a) Average for fast-growing energy ,importers
(b) Average for other energy importers
(b)/(a)
(c) Average for fast-growing energy exporters
(d) Average for other energy exporters
(d)/(c)
Ratio ofdebt-service
to GNP(Average 1981-1984)
2.30
6.50
2.83
3.15
6.25
1.98
Ratio ofinterest payment
to GNP(Average 1981-1984)
1.07
3.65
3.41
1.83
2.95
1.61
Concluding remarks
A number of factors that lay behind the fast growth of 14countries during the 1980s have been identified in the aboveanalysis. Although a quantification of the relative importance of the individual factors has not been attempted, somebroad conclusions emerge.
There is no doubt that external factors played a role in thepoor economic performance ofa large majority of the developing countries. The steep decline in the number of fastgrowing countries during the period is in itself indicative ofthe impact ofthe changing external environment. A comparison of the impact of an adverse external environment on thedifferent groups of countries does suggest that it was largerfor the slow-growing developing countries than for the fastgrowing ones. This is particularly true of the debt burden,which was smaller for the fast-growing countries. Changesin terms of trade also affected the slow-growing countriesmore adversely than the high-growth countries.
But this is only a part of a complex picture. The analysisalso suggests that there were significant differences betweenthe two groups of countries in the domestic policies followed, as well as in the structure of their production andtrade, with differing degrees of ability to respond to thechanging external situation.
The structure of production and trade among the fastgrowing countries was more favourable for growth in anadverse international situation. They were more export-oriented but with a more important difference that this orientation was of the type that enabled them to expand exports mostly manufactures - and increase imports even when totalworld trade was hardly growing.
The difference in the growth of agricultural production isone of the major factors underlying the difference in thegrowth of GDP between the two groups of countries. Thiswas not fortuitous but was, for most countries, the result ofthe pursuit of a long-term policy of agricultural development. On the average, countries in which agriculturalgrowth was higher during the 1980s also had a similarly highrate of growth during the 1970s.
It is worth noting that, among the fast-growing energy-
166
importing countries, the rate of growth of agricultural production was high in all cases where it mattered most foroverall economic growth in the short and medium term,namely, in economies where agriculture accounted for alarge proportion of GDP. The share was approximately thesame, on the average, as that among the slow-growing economies. Although there are economies among the latter groupwhere the importance of agriculture is smaller, and a highrate of growth of agricultural production would not havemade much difference to the growth of GDP, there weremany others where it made a crucial difference. A rate ofgrowth of agriculture among the slow-growing countriescomparable to that among the fast-growers would have significantly raised their average rate of growth ofGDP duringthe first half of the 1980s.
A sharp contrast arises between the two groups of countries in their domestic macro-economic performance. Boththe investment ratio and the savings ratio, especially the latter, were much higher among the fast-growing countries.The crucial importance of efforts at domestic resource mobilization comes through clearly. The rate of inflation wasalso much lower among the high-growth countries thanamong the other countries, which probably reflects theirhigher fiscal prudence and more sustained efforts to preventdomestic disequilibria to accumulate. Equally significant isthe fact that their macro-economic performance was betterduring the 1970s as well, which perhaps points to a greaterability or commitment to pursue long-term developmentgoals.
For many countries, tlle debt burden led, through compression of imports, to a sharp deceleration of GDP growth.The steep rise in interest rates and a virtual cessation of newcommercial finance to the heavily indebted countries, mostof which are among the slow-growing group, are certainlyimportant immediate causes of their declining imports. Butthe evolution of the debt burden itself has important domestic policy implications.
The choice of financing economic development throughdebt accumulation is a national one, though the availabilityand cost of international finance influence the choice. Financing of development through a large inflow of capital hasbeen a normal feature of economic development in not onlythe developing countries but in many developed economies
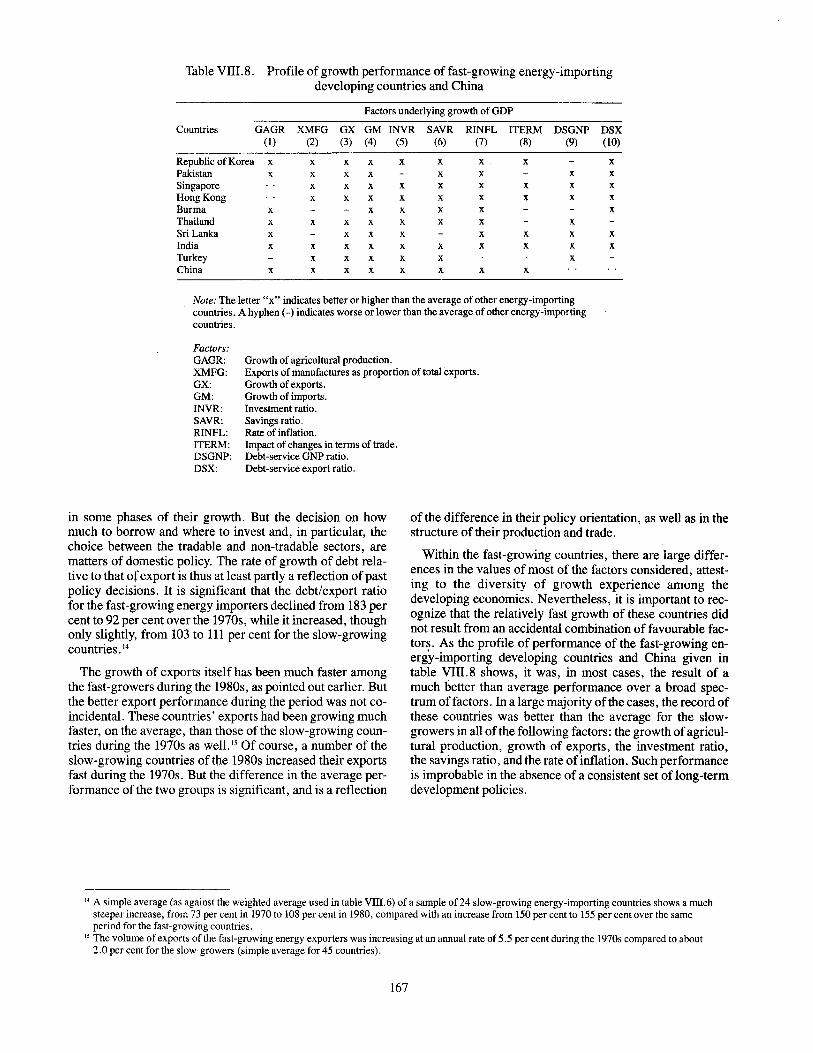
Table VIII. 8. Profile of growth performance of fast-growing energy-importingdeveloping countries and China
Factors underlying growth ofGDP
Countries GAGR XMFG GX GM INVR SAVR RINFL ITERM DSGNP DSX(1) (2) (3) (4) (5) (6) (7) (8) (9) (10)
Republic of Korea x x x x x x x x xPakistan x x x x x x x xSingapore x x x x x x x x xHong Kong x x x x x x x x xBurma x x x x x xThailand x x x x x x x xSri Lanka x x x x x x x xIndia x x x x x x x x x xTurkey x x x x x xChina x x x x x x x x
Note: The letter "x" indicates better or higher than the average of other energy-importingcountries. A hyphen (-) indicates worse or lower than the average of other energy-importingcountries.
Factors:GAGR:XMFG:GX:GM:INVR:SAVR:RINFL:ITERM:DSGNP:DSX:
Growth of agricultural production.Exports of manufactures as proportion of total exports.Growth of exports.Growth of imports.Investment ratio.Savings ratio.Rate of inflation.Impact of changes in terms of trade.Debt-service GNP ratio.Debt-service export ratio.
in some phases of their growth. But the decision on howmuch to borrow and where to invest and, in particular, thechoice between the tradable and non-tradable sectors, arematters of domestic policy. The rate of growth of debt relative to that ofexport is thus at least partly a reflection of pastpolicy decisions. It is significant that the debt/export ratiofor the fast-growing energy importers declined from 183 percent to 92 per cent over the 1970s, while it increased, thoughonly slightly, from 103 to 111 per cent for the slow-growingcountries. 14
The growth of exports itself has been much faster amongthe fast-growers during the 1980s, as pointed out earlier. Butthe better export performance during the period was not coincidental. These countries' exports had been growing muchfaster, on the average, than those of the slow-growing countries during the 1970s as well. 15 Of course, a number of theslow-growing countries of the 1980s increased their exportsfast during the 1970s. But the difference in the average performance of the two groups is significant, and is a reflection
ofthe difference in their policy orientation, as well as in thestructure of their production and trade.
Within the fast-growing countries, there are large differences in the values of most of the factors considered, attesting to the diversity of growth experience among thedeveloping economies. Nevertheless, it is important to recognize that the relatively fast growth of these countries didnot result from an accidental combination of favourable factors. As the profile of performance of the fast-growing energy-importing developing countries and China given intable VIII.8 shows, it was, in most cases, the result of amuch better than average performance over a broad spectrum offactors. In a large majority of the cases, the record ofthese countries was better than the average for the slowgrowers in all of the following factors: the growth ofagricultural production, growth of exports, the investment ratio,the savings ratio, and the rate of inflation. Such performanceis improbable in the absence of a consistent set oflong-termdevelopment policies.
14 A simple average (as against the weighted average used in table VIII. 6) of a sample of 24 slow-growing energy-importing countries shows a muchsteeper increase, from 73 per cent in 1970 to 108 per cent in 1980, compared with an increase from 150 per cent to 155 per cent over the sameperiod for the fast-growing countries.
15 The volume of exports of the fast-growing energy exporters was increasing at an annual rate of 5.5 per cent during the 1970s compared to about2.0 per cent for the slow-growers (simple average for 45 countries).
167


STATISTICAL
Contents
A.I. Developing countries: rates of growth of output, 1971-1987 170
A.2. Developing countries: annual rates of growth of real per capita gross domestic product, 1971-1986 . 170
A.3. Developed market economies: annual rates ofgrowth of real gross national product, 1971-1988. . . . 171
AA. Developing countries: rates of inflation, 1971-1986. . . . . . . . . . . . . . . . . . . . . . . . . . . . . . . . . . . . . . . 171
A.5. Developed market economies: rates of change of GNP deflator and consumer prices, 1971-1987 . . . 172
A.6. Selected developed market economies: unemployment rates, 1971-1986. . . . . . . . . . . . . . . . . . . . . . . 173
A.7. China and centrally planned economies of Europe: basic economic growth indicators, 1971-1990. . . 174
A. 8. Major developed market economies: ex post real short-term and long-term interest rates, 1975-1986 175
A.9. Nominal and real rates of interest, 1975-1986. . . . . . . . . . . . . . . . . . . . . . . . . . . . . . . . . . . . . . . . . . . . 176
A.lO. Indicators of fiscal policy in the major developed market economies, 1978-1986 . . . . . . . . . . . . . . . . 176
A.ll. Indicators of monetary policy in the major developed market economies, 1978-1986 . . . . . . . . . . . . . 177
A.12. Capital-importing developing countries: official reserves and ratios of reserves to currentexpenditures, 1980-1986 . . . . . . . . . . . . . . . . . . . . . . . . . . . . . . . . . . . . . . . . . . . . . . . . . . . . . . . . . . 178
A.l3. Net flow oflMF lending to the capital-importing developing countries, 1980-1986 . . . . . . . . . . . . . . 178
A.14. Multilateral development institutions: resource commitments, 1980-1986 179
A.15. Arab national and regional development institutions: development finance commitmentsfor developing countries, 1982-1986 180
A.16. World proven crude oil reserves 180
A.17. Stocks of oil on land in OECD member countries 181
A. 18. OPEC oil production quotas. . . . . . . . . . . . . . . . . . . . . . . . . . . . . . . . . . . . . . . . . . . . . . . . . . . . . . . . . . 181
A.19. Capital expenditures in petroleum by majority-owned foreign affiliates of United States companies,1982-1987. . . . . . . . . . . . . . . . . . . . . . . . . . . . . . . . . . . . . . . . . . . . . . . . . . . . . . . . . . . . . . . . . . . . . . 182
169

TableA.1. Developing countries: rates of growth of output, 1971-1987(Annual percentage change)
1971- 1981-1980 1986 1982 1983 1984 1985 1986" 1987b
Developing.countriesc 5.6 1.5 0.2 0.8 2.2 2.0 2.5 2.7
By analytical groupingNet energy exporters 6.4 -0.5 -0.2 -0.8 0.0 0.1 -1.6 0.4Net energy importers 5.0 2.8 0.6 2.1 3.8 3.4 5.5 4.3
By regionWestern hemisphere 5.5 1.0 -1.3 -2.5 3.2 2.7 3.5 3.3West Asia 6.5 -0.9 -0.8 2.6 -1.8 -1.8 0.3 -1.1South and East Asia 5.6 4.8 3.5 5.6 5.1 3.2 4.5 4.7Africa 4.9 -0.9 -1.0 -1.0 -1.6 1.7 -2.1 -0.2Mediterranean 5.3 2.9 2.6 1.0 3.7 2.8 4.4 3.0
Distribution of growth rates (Number of cases)Zero or below 4 22 40 33 29 25 200.1 - 2.5 15 31 18 17 17 20 192.6 -5.0 31 20 11 19 20 26 315.1 -7.5 18 9 9 9 10 8 97.6 and over 15 1 5 5 7 4 4
Source: Department of International Economic and Social Affairs of the United Nations Secretariat.
a Preliminary estimates.b Forecasts.c Country growth rates aggregated with 1980 output values in dollars.
TableA.2. Developing countries: annual rates of growth of real per capita grossdomestic product, 1971-1986"(Annual percentage change)
1971- 1981-1980 1986 1983 1984 1985 1986b
All developing countries 3.4 -0.9 -1.5 -0.1 -0.3 0.3
Western hemisphere 3.4 -1.3 -4.7 0.8 0.4 1.1West Asia 3.6 -4.1 -0.8 -5.0 -5.0 -2.9South and East Asia 3.3 2.6 3.4 2.9 1.1 2.5Africa 1.8 -3.8 -3.9 -4.4 -1.3 -5.0Mediterranean 3.6 1.2 -0.6 2.0 1.2 2.7
Memorandum item:All developed market economies 2.3 1.6 1.9 4.1 2.2 1.7
Source: Department of International Economic and Social Affairs of the United Nations Secretariat.
a Rate ofgrowth of real gross domestic product adjusted for rate of growth ofpopulation.Population growth rate is based on medium variant estimates from annual data for 1970-1985reported in World Population Prospects: Estimates and Projections as Assessed in 1984 (UnitedNations publication, Sales No. E.86.XIII.3).
b Based on preliminary data.
170

TableA.3. Developed market economies: annual rates of growth of real grossnational product, 1971-1988"(Annual percentage change)
1971- 1981-1980 1986 1983 1984 1985 1986b 1987c 1988c
All developed marketeconomies 3.1 2.2 2.6 4.7 2.9 2.4 2.6 3.0
Excluding United States 3.4 2.1 2.0 3.4 3.1 2.2 2.4 2.6
Major industrial countries 3.2 2.3 2.8 4.9 3.0 2.5 2.6 3.1
Canada 4.5 2.5 3.6 5.3 4.0 3.1 1.8 2.8France 3.6 1.3 0.7 1.5 1.4 2.5 2.2 2.2Germany, Federal
Republic of 2.7 1.5 1.8 3.0 2.5 2.1 2.0 2.5Italy 3.1 1.1 -0.4 2.6 2.3 2.5 2.7 3.0Japan 4.7 3.6 3.2 5.1 4.5 2.5 2.6 3.0United Kingdom 1.9 1.9 3.6 2.1 3.7 2.8 3.2 3.0United States 2.8 2.4 3.5 6.5 2.7 2.5 2.8 3.5
Smaller industrial countries 3.1 1.8 1.3 3.4 2.5 2.0 2.2 2.0
Source: Department of International Economic and Social Affairs of the United Nations Secretariat.
a Country growth rates aggregated with 1982 output values in United States dollars. For France,Italy, the United Kingdom and all the "smaller industrial countries," the measure used is GDP.
b Preliminary estimates.c Secretariat forecasts, based on Project LINK country projec!ions (March 1987) and other
institutional forecasts.
Table AA. Developing countries: rates of inflation, 1971-1986"(Annual percentage change)
1971- 1981·1980 1986 1982 1983 1984 1985 1986b
Developing countriesAll countries 18.0 58.3 40.0 65.2 93.7 125.9 49.2
(Median) (13.1) (11.5) (11.5) (11.5) (11.6) (10.5) (9.6)
Net energy exporters 13.5 28.4 22.8 36.4 34.9 97.1 34.4Net energy importers 21.3 79.8 52.4 85.9 136.0 146.7 59.8
Western hemisphere 23.9 120.4 79.0 135.8 198.4 287.5 103.9(Median) (13.0) (16.9) (11.8) (16.7) (20.4) (25.7) (20.7)
West Asia 14.1 18.1 17.8 19.4 33.0 24.3 5.6South and East Asia 11.4 8.4 8.0 8.8 10.1 5.7 5.2Africa 14.0 16.1 11.7 23.2 23.5 10.9 9.8Mediterranean 24.0 45.2 31.3 35.4 50.8 59.0 61.1
Frequency distributionc (Number of cases)5 per cent or lower 0 12 6 14 18 23 255.01 - 10 per cent 26 22 24 19 15 13 1410.01 - 20 per cent 41 20 26 22 16 15 1220.01 - 50 per cent 7 13 13 12 15 15 1350.01 -lOOper cent 2 4 4 2 7 4 8Over 100 per cent 0 5 3 7 5 6 4
Source: Department of International Economic and Social Affairs of the United Nations Secretariat,based on IMF, International Financial Statistics.
a Annual percentage change in consumer prices.b Preliminary estimates.c Number of cases from a sample of 76 countries.
171

Tab1eA.5. Developed market economies: rates of change of GNP deflator andconsumer prices, 1971-1987"(Annual percentage change)
1971- 1981-Country or country group 1980 1986 1983 1984 1985 1986b
GNP deflators
All developed market economies 8.3 5.8 5.2 4.8 4.4 4.0
Excluding United States 8.9 6.4 6.2 5.3 5.0 4.9
Major industrial countries 8.1 5.3 4.7 4.2 3.8 3.6Canada 8.8 5.7 4.9 3.6 3.4 2.8France 9.5 8.6 9.5 7.2 5.8 5.3Germany, Federal Republic of 5.3 3.2 3.3 1.9 2.2 3.3Italy 14.7 13.1 15.1 10.6 8.8 9.1Japan 7.6 1.8 0.8 1.3 1.4 2.0United Kingdom 13.6 6.6 5.6 4.6 5.5 3.6United States 7.4 5.0 3.8 3.9 3.4 2.6
Smaller industrial countries 9.7 8.4 8.1 7.6 7.0 8.0
North America 7.5 5.5 3.9 3.9 3.4 2.7Western Europe 9.3 8.0 7.8 6.3 5.7 5.3Others 8.2 3.5 2.7 3.1 3.5 5.1
Consumer prices
All developed market economies 8.7 6.2 5.6 5,4 4.9 2.7
Major industrial countries 8.5 5.5 4.8 4.8 4.1 2.0Canada 8.0 6.9 5.8 4.3 4.0 4.2France 9.6 8.4 9.6 7.4 5.8 2.2Germany, Federal Republic of 5.1 3.2 3.3 2.4 2.2 -0.3Italy 13.8 12.7 14.7 10.8 9.2 6.0Japan 9.0 2.4 1.8 2.3 2.1 0.5United Kingdom 13.7 6.5 4.6 5.0 6.1 3.4United States 7.8 4.9 3.2 4.3 3.5 1.9
Smaller industrial countries 9.6 9.3 9.4 8.4 8.0 7.5
Source: Department ofInternational Economic and Social Affairs of the United Nations Secretariat,based on IMP, International Financial Statistics, OECD, Economic Outlook and other officialnational and international sources.
a Country rates of change ofprices are aggregated by using 1980 values in dollars as weights.b Preliminary estimates.
172

TableA.6. Selected developed market economies: unemployment rates,1971-1986"
(Percentage)
1971- 1981-Country or country group 1980 1986 1982 1983 1984 1985 1986b
All developed market economies 4.1 8.1 8.0 8.9 8.3 8.2 8.1Major developed market economies 4.2 7.5 7.8 8.2 7.6 7.5 7.5
Canada 6.4 10.3 10.9 11.9 11.3 10.5 9.6France 4.0 9.5 8.1 8.8 9.9 10.4 10.7Germany, Federal Republic of 2.3 7.0 6.1 8.2 8.2 8. 8.0Italy 6.4 10.0 9.0 9.8 10.3 10.6 11.2Japan 1.6 2.5 2.4 2.7 2.7 2.6 2.8United Kingdom 3.1 11.3 11.3 11.6 11.8 11.7 11.6United States 5.8 8.5 9.5 9.6 7.5 7.2 7.0
Smaller developed market economies 4.0 10.0 9.5 10.8 11.5 11.6 11.3
North America 5.8 8.5 9.2 9.8 7.9 7.6 7.3
Western Europe 3.7 10.0 9.2 10.1 10.8 11.0 11.0
Memorandum item:Number of unemployed persons
(millions) 15.0 31.0 31.8 30.6 30.8 31.0
Source: Department ofInternational EconOlnic and Social Affairs of the United Nations Secretariat,based on OECD, OEeD Economic Outlook and Commission of the European Communities,Annual Economic Report.
a Number of unemployed persons as a percentage of the civilian labour force.b Preliminary estimates.
173

TableA.7. China and centrally planned economies of Europe: basic economicgrowth indicators, 1971-1990(Annual percentage changes)
1971- 1981- 1986-Country or country group 1980 1985- 1990b 1981 1982 1983 1984 1985 1986c 1987b
ChinaNet material product 5.8 9.1 6.7 4.9 8.3 9.8 12.0 12.3 7.0 7.0Gross industrial output 8.8 11.6 7.5 4.3 7.8 11.2 16.3 21.4 10.0Gross agricultural output 3.3 7.6 4.0 6.5 11.3 7.8 12.3 3.0 4.0Gross fixed investmentd 7.3 17.9 10.0 -1O.5e 26.6 12.6 33.9 35.0 15.0Export volume 23.2 f 13.3 8.1 16.0 13.3 3.4 17.6 12.0 17.0Import volume 23.7f 9.6 6.1 -8.6 -0.7 9.2 29.2 50.3 -20.0
Soviet UnionNet material product 5.0 3.7 4.3e 3.3 3.9 4.2 2.ge 3.5 4.1 3.9Gross industrial output 6.0 3.9 4.6 3.4 2.9 4.2 4.1 3.9 4.9 3.8Gross agricultural output 1.2 2.5 2.7g -1.0 5.5 6.2 -0.1 0.1 5.1 2.4Gross fixed investment 5.1 4.2 4.3g 3.7 3.5 5.6 1.9 3.0 8.0 5.0Export volume 4.9 2.4 1.9 4.5 3.3 2.5 -4.3 7.1Import volume 8.2 3.5 6.4 9.7 4.0 4.4 4.0 -8.0
Eastern EuropebNet material product 5.8 2.4 4.0e -1.9 0.1 3.9 5.3 3.7 4.7 4.7Gross industrial output 7.1 3.1 4.4 -0.5 1.2 4.4 4.8 4.1 4.8 4.1Gross agricultural output 2.3 2.2 2.7g 1.8 1.6 0.9 6.9 -1.3 5.1 3.2Gross fixed investment 6.7 0.1 3.4g -7.1 -4.4 2.4 2.2 4.0 2.6 4.8Export volumee 7.8 4.3 1.2 5.6 7.2 8.5 1.7 1.0Import volumee 6.7 1.5 -5.3 -6.3 3.2 5.9 5.7 6.5
Source: Department of International Economic and Social Affairs of the United Nations Secretariat,based on national statistical publications, plans and plan fulfilment reports.
a Preliminary estimates based on plan fulfilment reports and other partial information.b Medium-term and annual plan targets. In the case of planned ranges, the figure shown is the
mid-point.c Preliminary estimates.d State sector only and in current prices.e Estimate.f In current dollars.g Change in the five-year average output from the average of the preceding five years expressed as
an annual compound rate.h Bulgaria, Czechoslovakia, German Democratic Republic, Hungary, Poland and Romania.
174

Table A.8. Major developed market economies: ex post real short-term andlong-term interest rates, 1975-1986"
(Percentage)
Country 1975 1976 1981 1982 1983 1984 1985 1986b
CanadaShort-term -3.1 -0.5 6.9 3.6 4.0 8.3 6.6 5.9Long-term -1.6 -0.3 4.2 3.7 6.2 9.7 8.0 6.3
FranceShort-term -4.8 -1.1 3.0 1.8 2.6 4.1 3.8 2.5Long-term -2.6 -0.5 3.5 2.7 3.7 4.7 4.7 3.0
Germany, Federal Republic ofShort-term 1.7 0.8 7.5 3.8 2.4 4.0 3.2 1.8Long-term 3.9 4.3 5.8 5.6 4.5 5.8 4.7 2.7
ItalyShort-term -6.5 -1.0 1.6 1.9 2.6 5.8 5.6 2.0Long-term -5.2 -4.0 1.0 2.6 2.6 3.8 3.9 0.5
JapanShort-term 2.2 1.0 4.7 5.1 6.2 5.7 5.0 3.0Long-term 1.2 1.5 6.0 6.4 7.3 6.7 4.8 2.8
United KingdomShort-term -13.7 -1.0 3.0 4.7 4.6 5.5 5.7 7.1Long-term -10.5 -0.5 2.5 5.3 5.2 6.2 4.2 5.5
United StatesShort-term -3.2 -0.2 4.5 5.0 5.0 6.1 4.7 3.2Long-term -1.0 2.5 4.1 6.5 6.6 8.4 7.6 4.6
Memorandum item:Nominal rate of interest in theUnited States
Short-term 5.8 5.0 16.4 12.3 9.1 10.2 8.1 6.6Long-term 8.2 7.7 13.7 12.9 11.3 12.5 10.9 8.0
Source: Department oflnternational Economic and Social Affairs of the United Nations Secretariat,based on Morgan Guaranty Trust Company, World Financial Markets and IMF, InternationalFinancial Statistics.
a Both short-term and long-term rates are ex post real rates and are period averages net of thechange in the GNP deflator of the same period. The short-term rate is the bank rate in Canadaand the United Kingdom; the call money rate in France, the Federal Republic of Germany, Italyand Japan; and the federal funds rate in the United States. The long-term rate for the FederalRepublic of Germany is the yield on public authority bonds and, for others, the yield onlong-term government bonds.
b Preliminary estimates.
175

TableA.9. Nominal and real rates ofinterest, 1975-1986
Nominal Price deflator Real rate of interesterate of interest ,-----
Non-fuelUnited States commodities
LmORa primerateb GDFof exporteddeveloped by United States
market developing LmOR pdmerate
economiesc countdesd adjusted by - adjusted bL-...(1) (2) (1) (2) (I) (2)
Percentage Percentage change Percentage
1975 7.8 7.9 11.1 -19.0 -3.0 32.9 -2.9 33.11976 6.1 6.8 7.3 14.1 -1.1 -7.0 -0.5 -6.31977 6.3 6.8 7.2 26.0 -0.8 -15.7 -0.4 -15.21978 9.1 9.1 7.4 -7.6 1.6 18.1 1.5 18.01979 11.9 12.7 8.0 14.1 3.6 -1.9 4.3 -1.31980 14.0 15.3 9.3 13.4 4.3 0.6 5.5 1.71981 16.7 18.9 8.9 -15.5 7.2 38.0 9.2 40.61982 13.6 14.9 7.2 -15.1 6.0 33.7 7.1 35.21983 9.9 10.8 5.3 5.1 4.4 4.6 5.2 5.51984 11.3 12.0 4.6 1.2 6.4 10.0 7.1 10.71985 8.6 9.9 4.3 -10.7 4.1 21.7 5.6 23.11986f 6.8 8.3 4.0 5.5 2.7 1.2 4.1 2.6
Source: Department oflnternational Economic and Social Affairs of the United NationsSecretadat, based on IMF, International Financial Statistics, UNCTAD, Monthly (,ommodityPrice Bulletin, and other official national and international sources.
a Six-month London interbank offered rate on United States dollar deposits.b Interest rate that the largest Untied States banks charge their most creditworthy business
customers on short-term loans.c Implicit price deflator of aggregate GDP of developed market economies.d UNCTAD index of dollar prices of non-fuel commodities exported by developing countries.e One plus nominal rate of interest divided by one plus rate of change in the specified price
deflator.f Preliminary estimates.
TableA.10. Indicators of fiscal policy in the major developed market economies,1978-1986
(Percentage ofG~P/GDP)
1978-1979 1982 1983 1984 1985 1986a
Central govermnent fiscal balanceb
(deficit (-), surplus ( + »United States -1.6 -4.1 -5.6 -4.9 -5.1 -5.0Japan -5.6 -5.9 -5.6 -4.9 -4.1 -4.3Germany, Federal Republic of -1.9 -2.1 -2.0 -1.8 -1.1 -0.7All major industrialc economies -3.0 -4.6 -5.4 -5.0 -4.9 -4.6
Change in structurald budget balance(a move towards more deficit or expansion (-),
a move towards less deficit or restriction ( +»United States -1.0 -0.7 -0.5 -0.8 ,·0.1Japan +0.4 +0.5 +1.0 +0.5 +0.3Germany, Federal Republic of +1.4 +1.1 +0.2 +0.6 -0.3All major industrialc economies -0.2 -0.2 -0.1 -0.2 0.0
Source: Department of International Economic and Social Affairs of the United Nations Secretariat.Central government fmandaI balance figures are based on IMF, World Economic Outlook, 1986and 1987; changes in structural budget balance are based on OECD, OECD Economic Outlook,No. 40 (December 1986).
a Preliminary estimates.b ExclUding financial surplus or deficit oflocal (and state) governments.c Seven major developed market economies: Canada, France, the Federal Republic of Germany,
Italy, Japan, the United Kingdom, and the United States.d Change in cyclically adjusted component of government financial balance over the previous year
as percentage of GDP/GNP.
176

Table A.H. Indicators of monetary policy in the major developed marketeconomies, 1978-1986
OfficialAverage target
1978-1979 1982 1983 1984 1985 1986' in 1986
Percentage change
Money supply b
United States 8.4 9.3 12.5 7.9 9.1 8.0 6-9Japan 11.9 9.2 7.4 7.8 8.4 8.7 8-9Germany, Federal Republic of 9.5 6.5 6.6 3.9 4.9 6.1 3.5-5.5
VelocitycUnited States 4.0 -5.7 -4.9 2.5 -2.9 -2.6Japan -2.5 -4.2 -3.4 -1.4 -2.1 -4.0Germany, Federal Republic of -1.8 -6.5 -1.5 -1.6 -0.1 -0.3
Change inPercentage 1984-1986
Interest ratesNominal short termd
United States 9.7 12.3 9.1 10.4 8.0 6.5 -3.9Japan 5.5 7.1 6.7 6.3 6.7 5.1 -1.2Germany, Federal Republic of .5.1 8.8 5.7 6.0 5.4 4.6 -1.4
Nominal long-term e
United States 9.0 13.0 ILl 12.4 10.7 7.8 -4.6Japan 6.9 8.3 7.8 7.3 6.5 5.2 -2.1Germany, Federal Republic of 6.5 9.0 8.0 7.8 7.0 5.9 -1.9
Source: Department oflnternational Economic and Social Affairs of the United Nations Secretariat.IMF, International Financial Statistics and World Economic Outlook, 1986 and 1987.
a Preliminary estimates.b The "broad money" concept is used. Broad money is defmed as the sum of currency in
circulation, private demand deposits and private time deposits (quasi-money). This defmition isknown as M2. The M2 defmition is used for all countries except Japan (M2 plus certificates ofdeposits), the Federal Republic of Germany (Central Bank money) and the United Kingdom(sterling M3); end of period, year on year percentage changes.
c Annual percentage change in the ratio of nominal GNP to stock of broad money (see note b).d Interest rate on 90-day financial instruments (e.g., financial bills and certificates of deposit).e Yield on long-term government bonds.
177
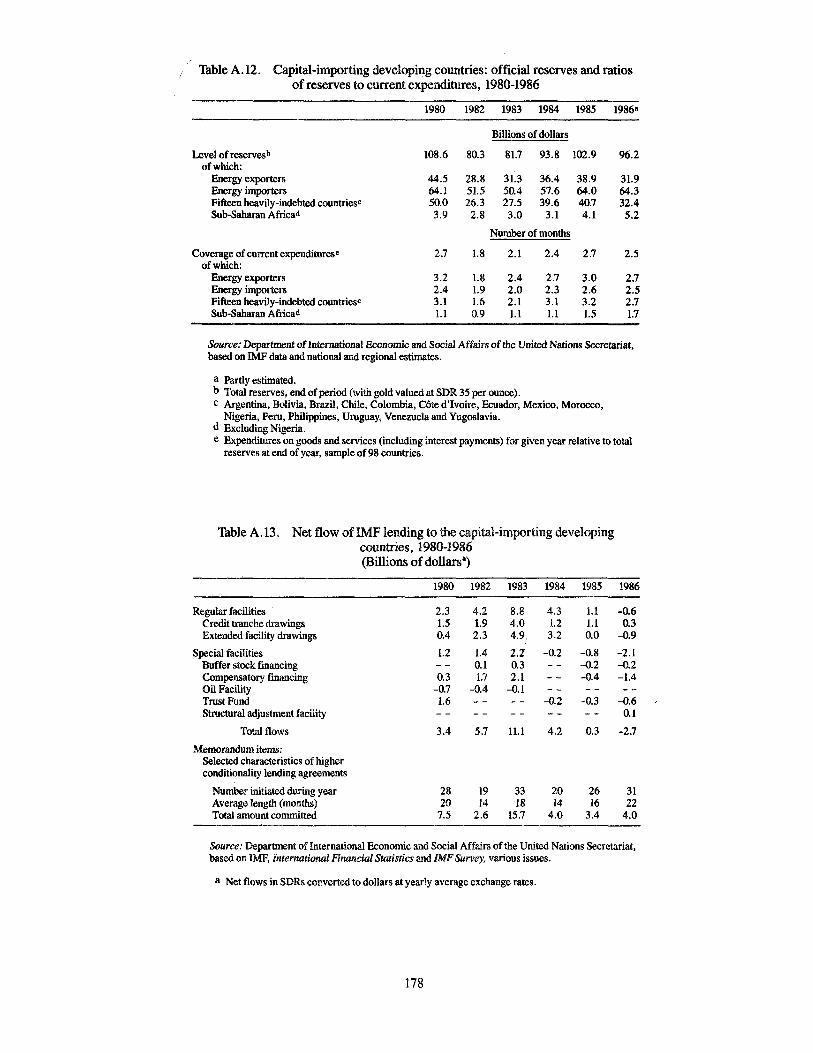
TableA.12. Capital-importing developing countries: official reserves and ratiosof reserves to current expenditures, 1980-1986
1980 1982 1983 1984 1985 1986"
Billions of dollars
Level of reservesb 108.6 80.3 81.7 93.8 102.9 96.2of which:
Energy exporters 44.5 28.8 31.3 36.4 38.9 31.9Energy importers 64.1 51.5 50.4 57.6 64.0 64.3Fifteen heavily-indebted countriesc 50.0 26.3 27.5 39.6 40.7 32.4Sub-Saharan Africad 3.9 2.8 3.0 3.1 4.1 5.2
Number of months
Coverage of current expenditurese 2.7 1.8 2.1 2.4 2.7 2.5of which:
Energy exporters 3.2 1.8 2.4 2.7 3.0 2.7Energy importers 2.4 1.9 2.0 2.3 2.6 2.5Fifteen heavily-indebted countriesc 3.1 1.6 2.1 3.1 3.2 2.7Sub-Saharan Africad 1.1 0.9 1.1 Ll 1.5 1.7
Source: Department ofInternational Economic and Social Affairs of the United Nations Secretariat,based on IMF data and national and regional estimates.
a Partly estimated.b Total reserves, end ofperiod (with gold valued at SDR 35 per ounce).c Argentina, Bolivia, Brazil, Chile, Colombia, Cote d'Ivoire, Ecuador, Mexico, Morocco,
Nigeria, Peru, Philippines, Uruguay, Venezuela and Yugoslavia.d Excluding Nigeria.e Expenditures on goods and services (inclUding interest payments) for given year relative to total
reserves at end ofyear, sample of98 countries.
TableA.13. Net flow ofIMF lending to the capital-importing developingcountries, 1980-1986(Billions ofdollars")
1980 1982 1983 1984 1985 1986
Regular facilities 2.3 4.2 8.8 4.3 1.1 -0.6Credit tranche drawings 1.5 1.9 4.0 1.2 1.1 0.3Extended facility drawings 0.4 2.3 4.9, 3.2 0.0 -0.9
Special facilities 1.2 1.4 2.i -0.2 -0.8 -2.1Buffer stock financing 0.1 0.3 -0.2 -0.2Compensatory fmancing 0.3 1.7 2.1 -0.4 -1.4Oil Facility -0.7 -0.4 -0.1Trust Fund 1.6 -0.2 -0.3 -0.6Structural adjustment facility 0.1
Total flows 3.4 5.7 ILl 4.2 0.3 -2.7
Memorandum items:Selected characteristics of higherconditionality lending agreements
Number initiated during year 28 19 33 20 26 31Average length (months) 20 14 18 14 16 22Total amount committed 7.5 2.6 15.7 4.0 3.4 4.0
Source: Department of International Economic and Social Affairs of the United Nations Secretariat,based on IMP, International Financial Statistics and IMF Survey, various issues.
a Net flows in SDRs converted to dollars at yearly average exchange rates.
178

TableA.14. Multilateral development institutions: resource commitments,1980-19868
(Millions ofdollars)
1980 1982 1983 1984 1985 1986
Financial institutions
African Development Bank 571 766 899 879 1154 1639Asian Development Bank 1929 1837 2089 2380 2093 2047Caribbean Development Bank 45 45 48 65 48 50Inter-American Development Bank 2341 2793 3099 3615 3102 3370International Fund for Agricultural
Development 396 373 279 202 137 129World Bank Group 13434 13098 16131 13528 17896 18294
World Bank (8802) (9801) (12066) (9721) (13 321) (13 882)International Development
Association (3817) (2832) (3112) (3222) (3541) (3373)International Finance Corporation (815) (465) (953) (585) (1034) (1039)
Subtotal 18716 18912 22545 20669 24430 25 529
Operational agencies ofthe United Nations
United Nations DevelopmentProgrammeb 550 746 513 519 478 548
United Nations Fund for PopulationActivities 146 115 117 134 141 116
United Nations Children's Fund 242 241 263 261 281 285World Food Programme 479 613 696 925 642 629
Subtotal 1417 1715 1589 1839 1542 1578
Total commitments 20133 20627 24134 22508 25972 27 107
Source: Annual reports and information supplied by individual institutions.
a Loans, grants, technical assistance and equity participation, as appropriate; all data on a calendaryear basis.
b Including UNDP-administered funds.
179
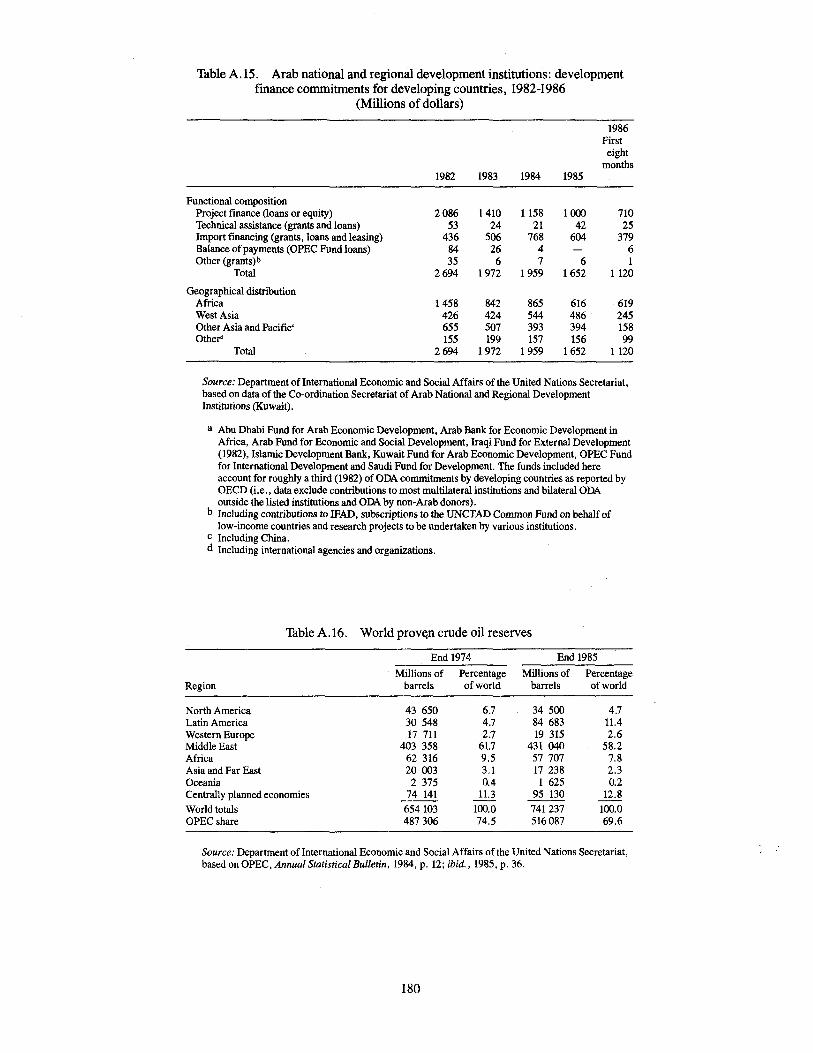
TableA.15. Arab national and regional development institutions: developmentfinance commitments for developing countries, 1982-1986
(Millions ofdollars)
1986Firsteight
months1982 1983 1984 1985
Functional compositionProject finance (loans or equity) 2086 1410 1158 1000 710Technical assistance (grants and loans) 53 24 21 42 25Import financing (grants, loans and leasing) 436 506 768 604 379Balance ofpayments (OPEC Fund loans) 84 26 4 6Other (grants)b 35 6 7 6 1
Total 2694 1972 1959 1652 1120
Geographical distributionAfrica 1458 842 865 616 619West Asia 426 424 544 486 245Other Asia and Pacifico 655 507 393 394 158Other' 155 199 157 156 99
Total 2694 1972 1959 1652 1120
Source: Department ofInternational Economic and Social Affairs of the United Nations Secretariat,based on data of the Co-ordination Secretariat of Arab National and Regional DevelopmentInstitutions (Kuwait).
a Abu Dhabi Fund for Arab Economic Development, Arab Bank for Economic Development inAfrica, Arab Fund for Economic and Social Development, Iraqi Fund for External Development(1982), Islamic Development Bank, Kuwait Fund for Arab Economic Development, OPEC Fundfor International Development and Saudi Fund for Development. The funds included hereaccount for roughly a third (1982) of ODA commitments by developing countries as reported byOECD (i.e., data exclude contributions to most multilateral institutions and bilateral ODAoutside the listed institutions and ODA by non-Arab donors).
b Including contributions to IFAD, subscriptions to the UNCTAD Common Fund on behalf oflow-income countries and research projects to be undertaken by various institutions.
c Including China.d Including international agencies and organizations.
TableA.16. World prov«n crude oil reserves
End 1974 End 1985
Millions of Percentage Millions of PercentageRegion barrels of world barrels of world
North America 43 650 6.7 34500 4.7Latin America 30 548 4.7 84 683 11.4Western Europe 17 711 2.7 19 315 2.6Middle East 403 358 61.7 431 040 58.2Africa 62 316 9.5 57 707 7.8Asia and Far East 20003 3.1 17 238 2.3Oceania 2 375 0.4 1 625 0.2Centrally planned economies 74 141 11.3 95 130 12.8
World totals 654103 100.0 741237 100.0OPEC share 487306 74.5 516087 69.6
Source: Department of International Economic and Social Affairs of the United Nations Secretariat,based on OPEC, Annual Statistical Bulletin, 1984, p. 12; ibid., 1985, p. 36.
180

TableA.17. Stocks ofoil on land in GECD member countries'
Companies Governments Total
Millions Millions Millionsofbarrels Daysb ofbarrels Daysb ofbarre1s Daysb
1974 2511 70 0 0 2511 701975 2913 81 0 0 2913 811976 2869 72 22 1 2891 231977 2921 70 29 1 2950 711978 3170 74 44 1 3221 751979 2950 68 161 4 3111 711980 3155 78 198 5 3353 841981 3287 89 242 6 3528 951982 3023 86 417 12 3440 981983 2818 87 476 15 3287 1011984 2547 75 564 17 3111 921985 2540 77 651 20 3192 961986 2408 73 710 21 3118 931987 2474 74 747 22 3221 96
Source: Department ofInternational Economic and Social Affairs of the United Nations Secretariat,based onIEA, Monthly Oi/Report, January 1987, p. 9.
a On the first day of the year.b Days of consumption at then current rates.
TableA.18. OPEC oil production quotas(Thousands of barrels per day)
March October September November First halfCountry 1983 1984 1986 1986 1987
Algeria 725 663 663 669 635Ecuador 200 183 183 221 210Gabon 150 137 137 160 152Indonesia 1300 1189 1189 1193 1133Iran (Islamic Republic of) 2400 2300 2300 2317 2255Iraq 1200 1200 1200a 1466a 1466aKuwait 1050 900 900b 999 948Libyan Arab Jamahiriya 1100 990 990 999 948Nigeria 1300 1300 1300 1304 1238Qatar 300 280 280 300 285Saudi Arabia 5000 4353 4353 4353 4133United Arab Emirates 1100 950 950 950 902Venezuela 1675 1555 1555 1574 1495
Total 17500 16000 16000a 16505a 15800a
Source: Department of International Economic and Social Affairs of the United Nations Secretariat,based on various OPEC press releases.
a Deemed production; no quota set for Iraq.b 921,000 barrels per day for November and 999,000 barrels per day for December 1986.
181

TableA.19. Capital expenditures in petroleum by majority-owned foreignaffiliates of United States companies, 1982-1987
(Millions of dollars)
Actual expenditures Latest plans
Area 1982 1983 1984 1985 1986 1987
Developed countries 11437 8939 8926 8733 7686 7368Australia 678 538 436 327 348 413Canada 3380 2375 2547 2665 2099 2147Western Europe 7252 7670 5822 5626 4995 4575
Dev\':loping countries 8270 6468 4928 4620 3880 3842Latin America 1915 996 822 950 807 668
2350 1778 1368 1421 1064 1065Middle East 638 661 571 437 382 396Asia and Pacific 3368 3032 2166 1813 1627 1712
All countries 20760 15915 14124 13 673 11 765 11381
Source: Department of International Economic and Social Affairs of the United Nations Secretariat,based on Ellen M. Herr, "Capital expenditures by majority-owned foreign affiliates of U.S .companies, 1986 and 1987," Survey ofCurrent Business (Washington, D.C., United StatesDepartment of Commerce, October 1986)
Litho in United Nations, New York40402-June 1987-6,125
02200ISBN 92-1-109113-6
United Nations publicationSales No. E.87.II.C.l
E/1987/62ST/ESA/197

CORRIGENDUM
Ref.: Sales No. E.87.II.C.l(E/1987/62-ST/ESA/197)
June 1987New York
WORLD ECONOMIC SURVEY 1987
Corrigendum
Page 2, left-hand column, fourth complete paragraph
In the fourth sentence, "trade flows" should read "capital flows".
Page 9, left-hand column, first paragraph
In the last sentence, "call-back provisions" should read "rollback provisions".
Page 87, left-hand column, first complete paragraph
Footnote number 30 should be inserted at the end of the second sentence, i.e.,after "operations".
Page 103, table V.l
l'he headings to the four columns should read "1973 1979 1985 1986".
Page 155, right-hand column, last paragraph
In the second sentence, one of the two words "perhaps" should be deleted.
Page 165, table VIII.6
In the penultimate row (Net energy importers), footnote c against thefigure 22.6 in the last column should be deleted.
Litho in United Nations, New York87-15582 2555c (E)
E/1987/62/Corr.lST/ESA/197/Corr.l