Wood decomposition after five years in anaerobic nitrate rich groundwaters: Implications for...
22
Wood decomposition after five years in anaerobic nitrate rich groundwaters: Implications for lifetime of Nitrex™ Permeable Reactive Barriers Daniel S. Feinberg 1,3 Collaborator: Brendan F. O’Leary 2,3 Advisor: Dr. Kenneth Foreman 3 20 December 2010 1 Hamilton College, Clinton, NY 13323 2 Allegheny College, Meadville, PA 16335 3 The Ecosystems Center, Marine Biological Laboratory, Woods Hole, MA 02543
-
Upload
washington -
Category
Documents
-
view
1 -
download
0
Transcript of Wood decomposition after five years in anaerobic nitrate rich groundwaters: Implications for...
Wood decomposition after five years in anaerobic nitrate rich groundwaters:
Implications for lifetime of Nitrex™ Permeable Reactive Barriers
Daniel S. Feinberg1,3
Collaborator: Brendan F. O’Leary2,3
Advisor: Dr. Kenneth Foreman3
20 December 2010
1Hamilton College, Clinton, NY 13323
2Allegheny College, Meadville, PA 16335
3The Ecosystems Center, Marine Biological Laboratory, Woods Hole, MA 02543
Feinberg 2
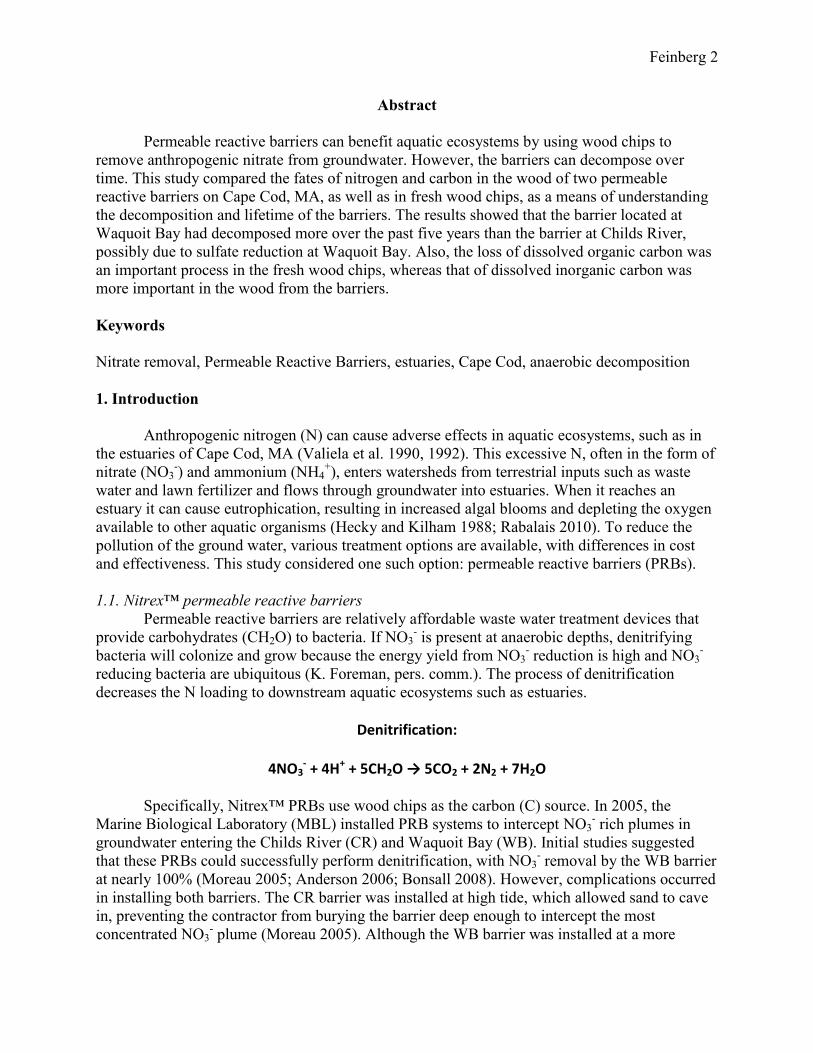
Abstract
Permeable reactive barriers can benefit aquatic ecosystems by using wood chips to
remove anthropogenic nitrate from groundwater. However, the barriers can decompose over
time. This study compared the fates of nitrogen and carbon in the wood of two permeable
reactive barriers on Cape Cod, MA, as well as in fresh wood chips, as a means of understanding
the decomposition and lifetime of the barriers. The results showed that the barrier located at
Waquoit Bay had decomposed more over the past five years than the barrier at Childs River,
possibly due to sulfate reduction at Waquoit Bay. Also, the loss of dissolved organic carbon was
an important process in the fresh wood chips, whereas that of dissolved inorganic carbon was
more important in the wood from the barriers.
Keywords
Nitrate removal, Permeable Reactive Barriers, estuaries, Cape Cod, anaerobic decomposition
1. Introduction
Anthropogenic nitrogen (N) can cause adverse effects in aquatic ecosystems, such as in
the estuaries of Cape Cod, MA (Valiela et al. 1990, 1992). This excessive N, often in the form of
nitrate (NO3-) and ammonium (NH4
+), enters watersheds from terrestrial inputs such as waste
water and lawn fertilizer and flows through groundwater into estuaries. When it reaches an
estuary it can cause eutrophication, resulting in increased algal blooms and depleting the oxygen
available to other aquatic organisms (Hecky and Kilham 1988; Rabalais 2010). To reduce the
pollution of the ground water, various treatment options are available, with differences in cost
and effectiveness. This study considered one such option: permeable reactive barriers (PRBs).
1.1. Nitrex™ permeable reactive barriers
Permeable reactive barriers are relatively affordable waste water treatment devices that
provide carbohydrates (CH2O) to bacteria. If NO3- is present at anaerobic depths, denitrifying
bacteria will colonize and grow because the energy yield from NO3- reduction is high and NO3
-
reducing bacteria are ubiquitous (K. Foreman, pers. comm.). The process of denitrification
decreases the N loading to downstream aquatic ecosystems such as estuaries.
Denitrification:
4NO3- + 4H+ + 5CH2O → 5CO2 + 2N2 + 7H2O
Specifically, Nitrex™ PRBs use wood chips as the carbon (C) source. In 2005, the
Marine Biological Laboratory (MBL) installed PRB systems to intercept NO3- rich plumes in
groundwater entering the Childs River (CR) and Waquoit Bay (WB). Initial studies suggested
that these PRBs could successfully perform denitrification, with NO3- removal by the WB barrier
at nearly 100% (Moreau 2005; Anderson 2006; Bonsall 2008). However, complications occurred
in installing both barriers. The CR barrier was installed at high tide, which allowed sand to cave
in, preventing the contractor from burying the barrier deep enough to intercept the most
concentrated NO3- plume (Moreau 2005). Although the WB barrier was installed at a more

Feinberg 3
effective depth to intercept NO3-, it was located in a position that received significant and
continuing saltwater inundation (O’Leary 2010, unpublished; K. Foreman, pers. comm.). This
process could allow sulfate (SO42-
) reduction to occur, causing an increase in the rate of wood
decomposition at the WB barrier.
Sulfate reduction:
SO42- + 2CH2O + 2H+ → 2CO2 + H2S + 2H2O
1.2. Questions addressed
Considerable research of wood has addressed its aerobic decomposition (Weedon 2009),
but little is known about its anaerobic decomposition. I excavated wood chips from the CR and
WB systems and sought to answer the following questions: How have the chips in these barriers
changed over the past five years? How do they compare to fresh wood chips in terms of
performance and size? What are the implications for installing barriers in the future?
1.3. Importance of this study
The effectiveness of PRBs is important to study for economic reasons; these barriers may
only cost a third as much as centralized wastewater treatment and could therefore save money for
towns looking to improve water quality (K. Foreman, pers. comm.). Having better water quality
might also reduce downstream algal blooms, allowing the water to support greater biodiversity
(Vitousek et al. 1997).
2. Methods
I conducted this study in November and December 2010, collecting samples at two field
sites and analyzing them at the Ecosystems Center.
2.1. Site descriptions and woodchip collection
I extracted wood chips from the CR and WB barriers, which are located in the Falmouth
region of Cape Cod (Figs. 1-3). This involved removing the overburden of sand to about 0.5 m
while using a trench box to prevent the sides from caving in, and then cutting away a layer of
geotextile cloth with a knife. I climbed into the trench box and used my hands to extract wood
chips and to place them in plastic storage buckets. I also used a pump to collect feed water in a
55-gallon plastic drum from a well away from the beach at Waquoit Bay National Estuarine
Research Reserve (WBNERR). I added some of the water to the buckets of wood chips to keep
the chips saturated in order to maintain anaerobic conditions for the microbial communities. I
also obtained “fresh” wood chips (FW) that had not been buried in a barrier but that came from
the same contractor as the barrier chips (Fig. 4).
2.2. Microcosm construction and water flow
The laboratory setup consisted of six microcosms with 20-L plastic carboys, serving as
replicates for three categories of data: WB, FW, and CR. Each microcosm employed the
Mariotte technique (McCarthy 1934) to drip groundwater through a PVC pipe containing wood
chips, ultimately delivering the water to a graduated cylinder (Fig. 5). I stored the microcosms in
a temperature-controlled room at 15°C to simulate field conditions for groundwater and allowed

Feinberg 4
the microbial communities in the wood chips to stabilize for a week. I performed nutrient
additions by adding 500 µM NO3- to the WB and FW carboys, and 200 µM NO3
- to the CR
carboys. In order to maintain constant flow rates, I measured the cumulative volume of water
that collected in the graduated cylinders, finding that the rates ranged from 2.11 to 2.36 L/d
among the three treatments (Fig. 6).
2.3. Laboratory procedures
I measured NO3- using 25 mm GF/F filters and a Lachat QuickChem, with samples from
three days of water that had been flowing into and out of the six microcosms. I used an Aurora
autosampler to analyze dissolved organic carbon (DOC) and created a time series from three
days’ data. Using a Shimadzu GC-14A gas chromatograph, I measured the dissolved inorganic
carbon (DIC) flowing into and out of the microcosms after collecting the water in 60 mL glass
BOD bottles (Staff 2010).
For 200 individual wood chips from each treatment (a total of 600 chips), I measured wet
mass. Then I dried 30 WB chips and 30 CR chips to solve for the dry:wet ratio of 0.2515 (Fig.
7). Using this ratio, I calculated the dry weights of the remaining WB and CR chips and
compared them to the weights of 200 dry FW chips.
To measure lignin, I ground wood chip samples with a Wiley Mill and analyzed them
using the acid solubility method (Effland 1977). I measured N content by using a WIG-L-BUG
amalgamator and running 5-6 mg samples through a Perkin-Elmer elemental analyzer. This
yielded % N, from which I obtained lignin : N ratios.
3. Results
3.1 Microcosms
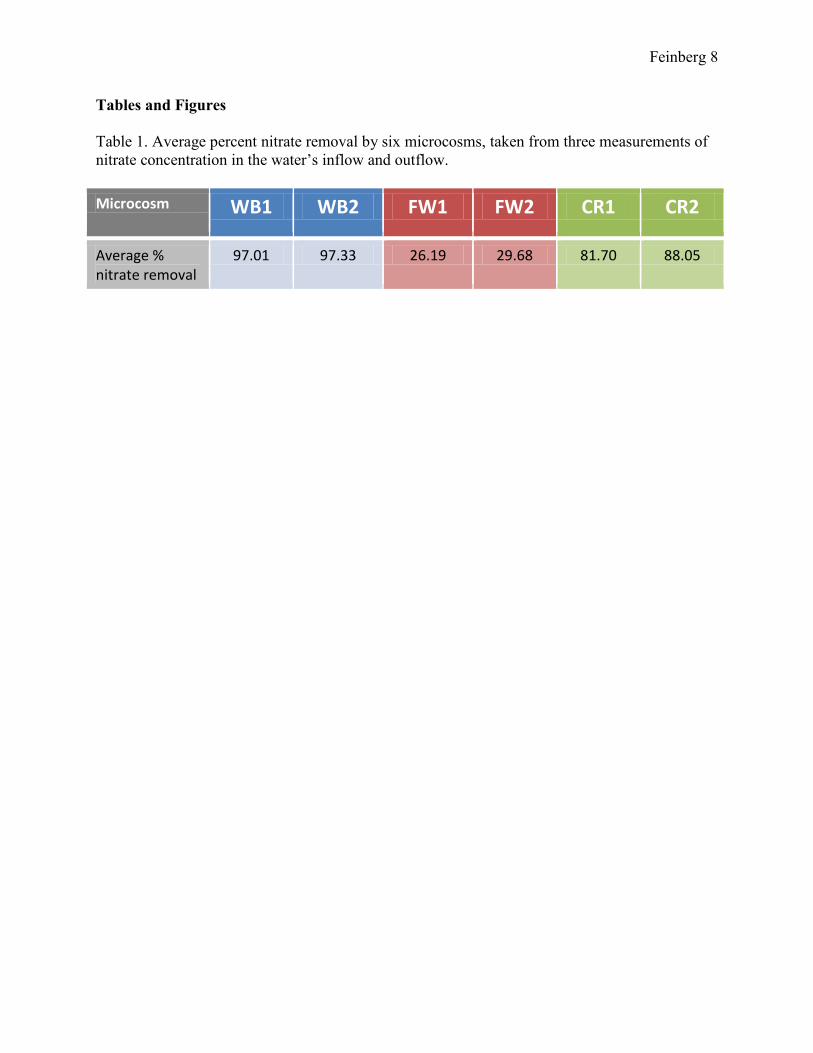
All six of the microcosms removed NO3- from the water, with the two WB microcosms
removing the greatest percentage of incoming NO3- at more than 97 percent and the two FW
microcosms removing the least at under 30 percent (Table 1). DOC production was nearly
constant for each microcosm and was greatest for FW with a rate of 76 mg C/d (Figs. 8, 9). All
of the microcosms produced DIC, with WB producing the most at an average of 30 mg/L and
FW producing the least at 4 mg/L (Fig. 10).
3.2 Additional chips
WB had the highest frequency of small wood chips, whereas CR and FW had more chips
in the large size classes (Fig. 11). The mean dry mass for WB chips was 0.17 g and that of CR
was nearly three times as great (Table 2). The WB chips had significantly higher % N than the
CR and FW chips (Fig. 12). WB had a significantly lower % lignin : % N ratio than the other
treatments of wood, with a ratio of 92 (Fig. 13).
4. Discussion
The data suggested that the chips in the WB barrier had been decomposing more quickly
than the CR and FW chips. These differences may have been due to saltwater input causing
SO42-
reduction at WB, as well as the complications that prevented the CR barrier from
intercepting the most concentrated NO3- plume.

Feinberg 5
4.1 Microcosms
The WB and CR microcosms had high NO3- removal, suggesting that these chips
contained microbial communities that performed denitrification. The FW chips, in contrast, had
not had time for the denitrifying communities to develop, so the FW microcosms exhibited
relatively low NO3- removal. This small amount of NO3
- removal may have been due to other
processes such as N-immobilization.
DOC production was more important in the fresh chips than in the barrier chips, but DIC
production was more important in the older chips that had been buried. The DOC results
suggested that the FW chips were leaching organic compounds such as sugars, tannins, and
phenols. These compounds may have already washed out of the CR and WB chips during their
time in the barriers. Since CO2 is a product of the denitrification reaction, the higher DIC
production from the barrier microcosms, particularly WB, corroborated the idea that these
systems were performing denitrification.
4.2 Additional chips
The WB chips appeared to have decomposed more than the other chips due to mass, % N,
and % lignin : % N ratios. The WB chips seemed to have lost more mass than the CR chips, as
evidenced in their smaller mean mass and the differences in size frequency among the three chip
types, with more WB chips in the smaller size classes. Also, the high % N and low lignin : N
ratio in the WB chips suggested greater decomposition in WB than in the other chips.
4.3 Future studies
I could strengthen this study by increasing the sample size and by calculating the
lifetimes of the barriers. Although I analyzed thousands of wood chips, I excavated them from
only one hole at each site. It would be valuable to look at chips from holes at different locations
along the barriers and at different depths because these variables might affect the characteristics
of the chips. To calculate the lifetimes of the barriers, I would need to determine the mass of
wood chips in each microcosm. With this information I could use a first order decay equation
such as Mt = Moe-kt
to solve for t, or the time that it would take for a given percentage of the
wood to decay.
If the MBL or other organizations install more barriers, I recommend doing so at low tide
so that the barriers can be deep enough to intercept the most concentrated NO3- plumes.
Furthermore, the barriers should be located where they are safe from saltwater inundation in
order to avoid excessive decomposition due to SO42-
reduction, which can remove CH2O that
would otherwise be available for denitrification. These installation techniques would help to
optimize NO3- removal and barrier lifetime, perhaps resulting in long-term economic savings.
Acknowledgments
I am grateful to Ken Foreman for advising this project and permitting me to extract wood
chips from his research sites at CR and WB. I also thank Rich McHorney, Will Daniels, and
Stefanie Strebel for assistance in the lab. Thanks to Chris Neill for inspiring me to consider the
value of denitrification. Additionally, I appreciate the collaboration with my classmates. Finally,
this project would not have been possible without guidance and encouragement from Hamilton
College, Friends School of Baltimore, and my family.
Feinberg 6
References
Anderson M (2006). Mechanisms of Nitrate removal by Permeable Reactive Barriers. San
Francisco State University (PowerPoint presentation)
Bonsall J (2008). Wood decomposition and N-immobilization in permeable reactive barriers.
MBL Semester in Environmental Science (unpublished)
Effland M (1977). Modified procedure to determine acid soluble lignin in wood and pulp. TAPPI
6:10
Foreman K (2010). Eutrophication & Innovative Cures. MBL Semester in Environmental
Science (PowerPoint presentation)
Hecky RE & P Kilham (1988). Nutrient limitation of phytoplankton in freshwater and marine
environments: A review of recent evidence on the effects of enrichment. Limnol. Oceanogr.
33:796-822
McCarthy EL (1934). Mariotte’s Bottle. Science 80:100
Moreau S (2005). Influence of a carbon-rich permeable reactive NITREX ® barrier on
groundwater flow paths and dissolved nitrogen and carbon concentrations. MBL Semester in
Environmental Science (unpublished)
O’Leary BF (2010). Effect of nutrient additions on bacteria and algae growth in groundwater
treated by permeable reactive barriers and sewage treatment facilities. MBL Semester in
Environmental Science (unpublished)
Rabalais NN, RJ Diaz, LA Levin, et al (2010). Dynamics and distribution of natural and human-
caused hypoxia. Biogeosciences 7: 585-619
Staff, SES (2010). Dissolved inorganic carbon (DIC) measured by gas chromatography.
Laboratory Methods for MBL Semester in Environmental Science
Valiela I, Costa J, K Foreman, et al (1990). Transport of groundwater-borne nutrients from
watersheds and their effects on coastal waters. Biogeochemistry Vol. 10 No. 3: 177-197
Valiela I, K Foreman, M LaMontagne, et al (1992). Couplings of Watersheds and Coastal
Waters: Sources and Consequences of Nutrient Enrichment in Waquoit Bay, Massachusetts.
Estuaries Vol. 15 No. 4: 443-457
Vitousek PM, JD Aber, RW Howarth, et al (1997). Human alteration of the global nitrogen
cycle: sources and consequences. Ecological Applications Vol. 7 No. 3: 737-750

Feinberg 7
Weedon JT, WK Cornwell, JHC Cornelissen, et al (2009). Global meta-analysis of wood-
decomposition rates: a role for trait variation among tree species? Ecology Letters Vol. 12
suppl. 1: 45-46
Feinberg 8
Tables and Figures
Table 1. Average percent nitrate removal by six microcosms, taken from three measurements of
nitrate concentration in the water’s inflow and outflow.
Microcosm WB1 WB2 FW1 FW2 CR1 CR2
Average % nitrate removal
97.01 97.33 26.19 29.68 81.70 88.05

Feinberg 9
Table 2. Mean dry mass of 200 wood chips from the three treatments, with dry masses calculated
for WB and CR from the chips’ respective wet masses.
Treatment WB FW CR
Mean dry mass (g) 0.17 0.38 0.45

Feinberg 10
Fig. 1. Maps of Cape Cod, MA, and barrier sites (K. Foreman 2010). Stars estimate the location
of PRBs at CR and WB, respectively.

Feinberg 11
Fig. 2. The first 30 of 200 individual CR chips analyzed.
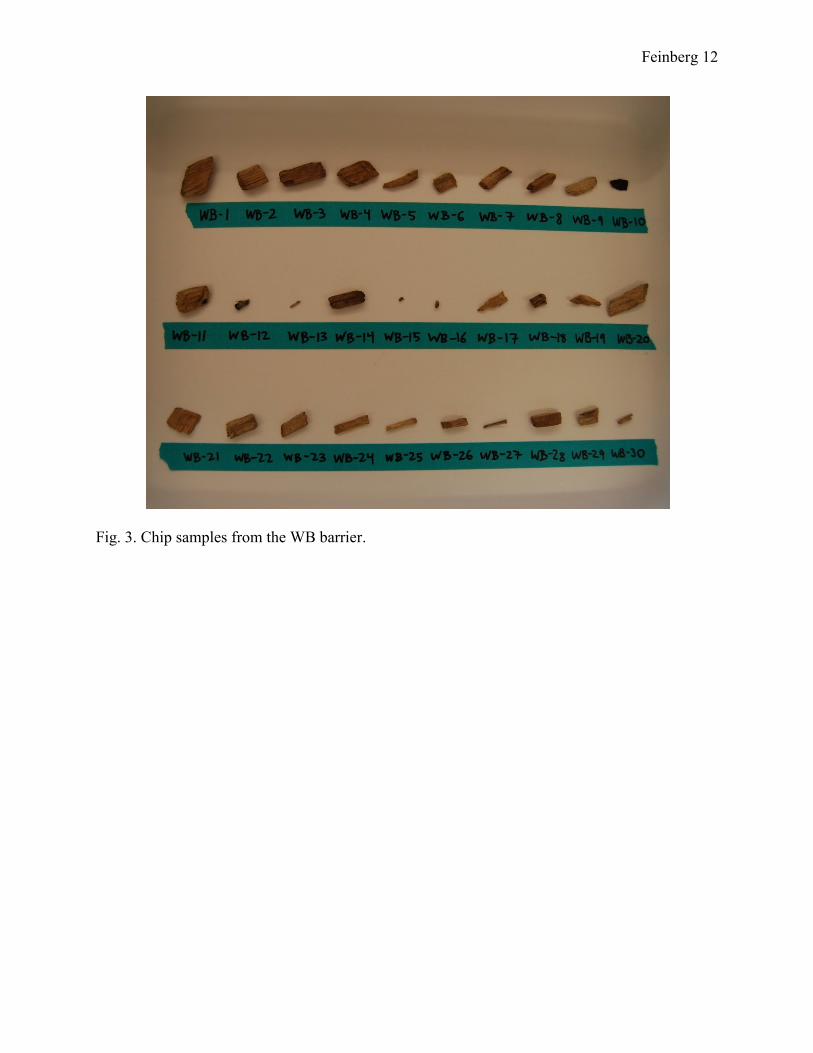
Feinberg 12
Fig. 3. Chip samples from the WB barrier.

Feinberg 13
Fig. 4. Thirty samples of fresh wood chips.

Feinberg 14
Fig. 5. Microcosm setup including the Mariotte bottle (carboy), tubing into the PVC pipe, the
pipe containing wood chips and sand, and tubing from the pipe into a graduated cylinder.

Feinberg 15
Fig. 6. Cumulative flow of groundwater through three treatments of wood chips.
y = 2.3573xR² = 0.9922
y = 2.1173xR² = 0.9912
y = 2.1091xR² = 0.9891
0
2
4
6
8
10
12
14
0 1 2 3 4 5
Cu
mu
lati
ve V
olu
me
(L)
Day
FW
CR
WB

Feinberg 16
Fig. 7. Dry vs. wet mass in WB and CR chips, yielding the ratio for conversion from wet mass to
dry.
y = 0.2515xR² = 0.9895
0.0
0.5
1.0
1.5
2.0
2.5
3.0
3.5
0 2 4 6 8 10 12 14
Dry
mas
s (g
)
Wet mass (g)
WB CR

Feinberg 17
Fig. 8. DOC flowing into and out of each treatment on three separate days.
0.0
0.5
1.0
1.5
2.0
2.5
3.0
3.5
4.0
Axi
s Ti
tle
0.0
0.5
1.0
1.5
2.0
2.5
3.0
3.5
4.0
mm
ol/
L
0.0
0.5
1.0
1.5
2.0
2.5
3.0
3.5
4.0
Axi
s Ti
tle
WB
FW
CR
outflow inflow
6 Dec 8 Dec
Date
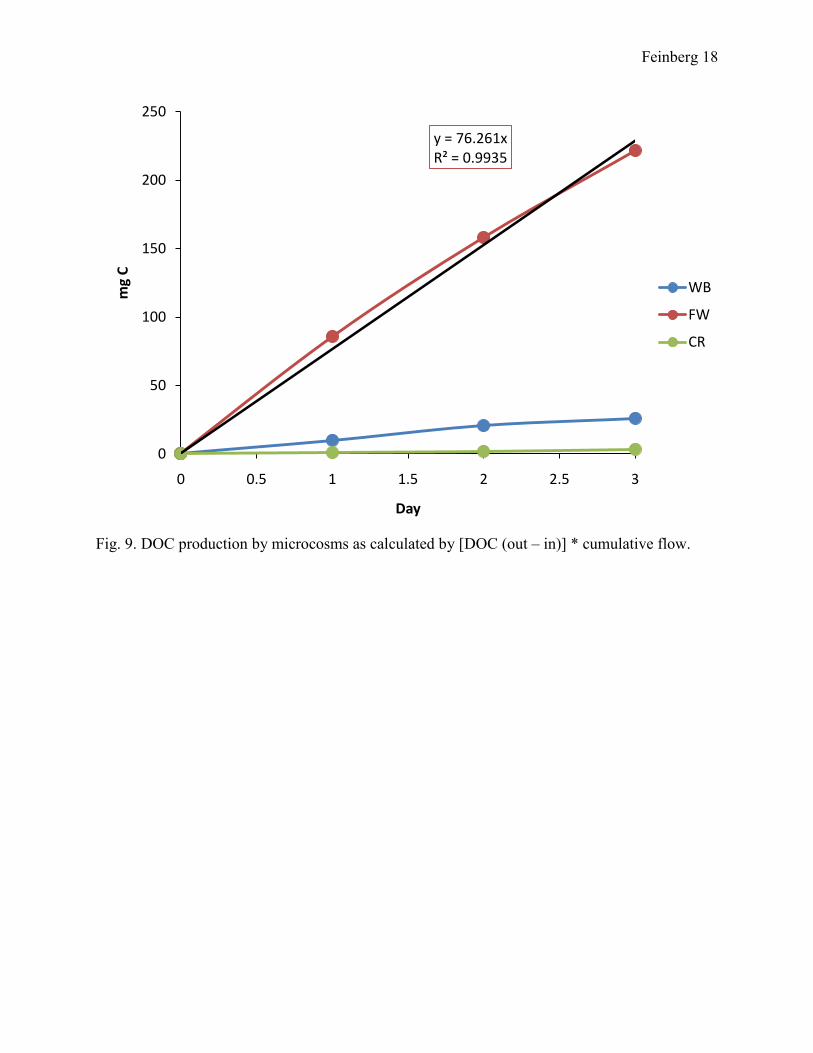
Feinberg 18
Fig. 9. DOC production by microcosms as calculated by [DOC (out – in)] * cumulative flow.
y = 76.261xR² = 0.9935
0
50
100
150
200
250
0 0.5 1 1.5 2 2.5 3
mg
C
Day
WB
FW
CR

Feinberg 19
Fig. 10. DIC (out – in) for replicates of three treatments, totaling six microcosms.
0
5
10
15
20
25
30
35
Microcosm
DIC
[o
ut
-in
] (m
g/L)
WB FW CR

Feinberg 20
Fig. 11. Size frequency of wood chips in the three treatments, as logarithms of dry mass.
0
10
20
30
40
50
Axi
s Ti
tle
0
10
20
30
40
50
Nu
mb
er o
f ch
ips
0
10
20
30
40
50
Axi
s Ti
tle
Log of mass
WB FW CR
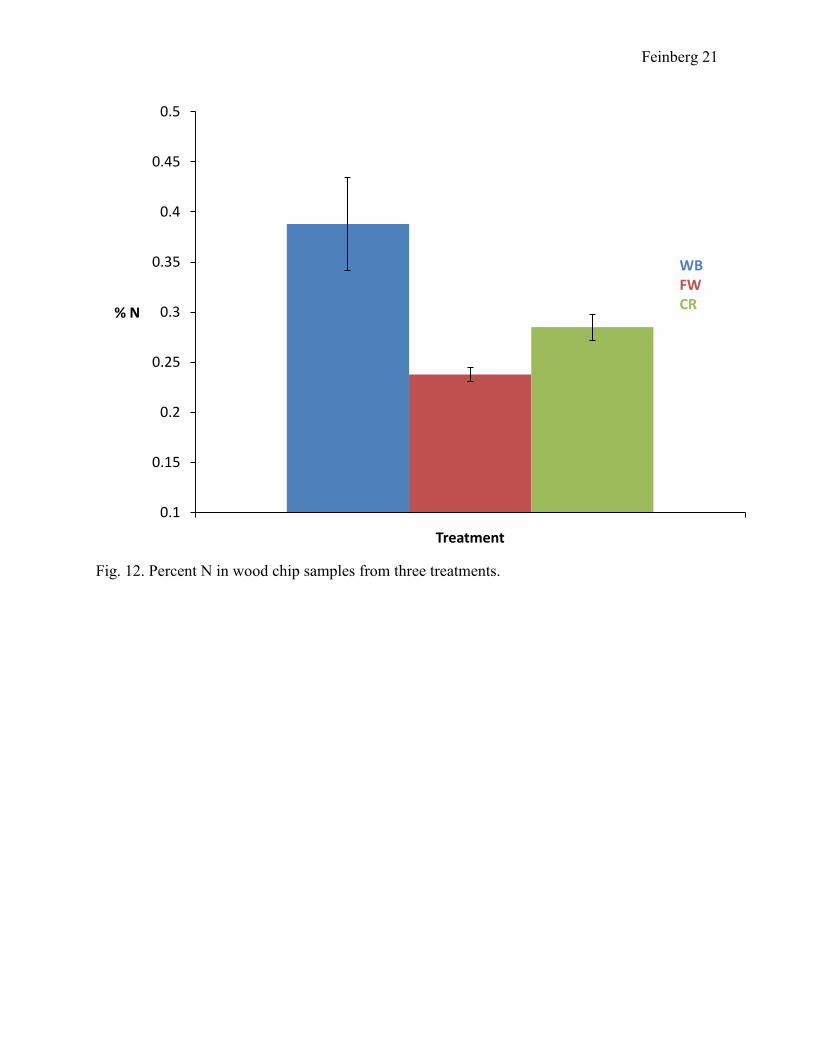
Feinberg 21
Fig. 12. Percent N in wood chip samples from three treatments.
0.1
0.15
0.2
0.25
0.3
0.35
0.4
0.45
0.5
Treatment
% N
WB FW CR

Feinberg 22
Fig. 13. Percent lignin : percent N ratios for the three wood chip types.
0
20
40
60
80
100
120
140
160
Treatment
Lign
in :
N R
atio WB
FW CR