Wind as a main driver of the net ecosystem carbon balance of a semiarid Mediterranean steppe in the...
16
Wind as a main driver of the net ecosystem carbon balance of a semiarid Mediterranean steppe in the South East of Spain ANA REY*, LUCA BELELLI-MARCHESINI † , ANA WERE*, PENELOPE SERRANO-ORTIZ*, GIUSEPPE ETIOPE ‡ § , DARIO PAPALE † , FRANCISCO DOMINGO* andEMILIANO PEGORARO* – *Department of Desertification and Geoecology, Experimental Station of Arid Zones (EEZA), High Spanish Scientific Council (CSIC), Almerı ´a, Spain, †Department for Innovation in Biological, Agro-Food and Forest Systems (DIBAF), University of La Tuscia, Viterbo, Italy, ‡Istituto Nazionale di Geofisica e Vulcanologia, Sezione Roma 2, Rome, Italy, §Faculty of Environmental Science and Engineering, Babes-Bolyai University, Cluj-Napoca, Romania Abstract Despite the advance in our understanding of the carbon exchange between terrestrial ecosystems and the atmo- sphere, semiarid ecosystems have been poorly investigated and little is known about their role in the global carbon balance. We used eddy covariance measurements to determine the exchange of CO 2 between a semiarid steppe and the atmosphere over 3 years. The vegetation is a perennial grassland of Stipa tenacissima L. located in the SE of Spain. We examined diurnal, seasonal and interannual variations in the net ecosystem carbon balance (NECB) in relation to biophysical variables. Cumulative NECB was a net source of 65.7, 143.6 and 92.1 g C m 2 yr 1 for the 3 years stud- ied, respectively. We separated the year into two distinctive periods: dry period and growing season. The ecosystem was a net source of CO 2 to the atmosphere, particularly during the dry period when large CO 2 positive fluxes of up to 15 lmol m 2 s 1 were observed in concomitance with large wind speeds. Over the growing season, the ecosystem was a slight sink or neutral with maximum rates of 2.3 lmol m 2 s 1 . Rainfall events caused large fluxes of CO 2 to the atmosphere and determined the length of the growing season. In this season, photosynthetic photon flux density controlled day-time NECB just below 1000 lmol m 2 s 1 . The analyses of the diurnal and seasonal data and preli- minary geological and gas-geochemical evaluations, including C isotopic analyses, suggest that the CO 2 released was not only biogenic but most likely included a component of geothermal origin, presumably related to deep fluids occurring in the area. These results highlight the importance of considering geological carbon sources, as well as the need to carefully interpret the results of eddy covariance partitioning techniques when applied in geologically active areas potentially affected by CO 2 -rich geofluid circulation. Keywords: alpha grass, carbon sequestration, ecosystem respiration, eddy covariance, geogas, geothermal activity, grasslands, net ecosystem carbon balance Received 20 May 2011 and accepted 25 July 2011 Introduction The carbon balance of a large array of ecosystems across biomes has been intensively studied since the establishment of the international network of eddy flux sites FLUXNET (with more than 400 towers worldwide, http://www.fluxnet.ornl.gov/fluxnet/index.cfm). As a result, our understanding of ecosystem functioning across a large range of climatic zones has improved considerably over the last decade (Baldocchi, 2008) and our confidence in the estimates of the biosphere carbon sink is much greater, amounting to 3 Gt C yr 1 (Le Que ´re ´ et al., 2009). However, arid and semiarid ecosys- tems have received much less attention in global terres- trial carbon estimates, and much less is known about their carbon balance and future changes in response to climate change (Schimel, 2010). Given their large exten- sion, indeed they constitute the largest biome in the world (Schimel, 2010), it is clear that a reliable estimate of the global carbon balance requires the inclusion of ecosystems located in semiarid and arid regions. So far, few long-term estimates of their current carbon seques- tration potential have been made (e.g. Hunt et al., 2004; Hastings et al., 2005; Luo et al., 2007; Rotenberg & ¶Deceased. Correspondence: A. Rey, Museo Nacional de Ciencias Naturales CSIC, Serrano 115 E-28006, Madrid, Spain, tel. + 34 917 822 101, fax + 34 915 640 800, e-mail: [email protected] © 2011 Blackwell Publishing Ltd 539 Global Change Biology (2012) 18, 539–554, doi: 10.1111/j.1365-2486.2011.02534.x
-
Upload
independent -
Category
Documents
-
view
0 -
download
0
Transcript of Wind as a main driver of the net ecosystem carbon balance of a semiarid Mediterranean steppe in the...

Wind as a main driver of the net ecosystem carbonbalance of a semiarid Mediterranean steppe in the SouthEast of SpainANA REY * , LUCA BELELL I -MARCHES IN I † , ANA WERE * , P ENELOPE SERRANO -ORT IZ * ,
G IUSEPPE ET IOPE ‡ § , DAR IO PAPALE † , F RANC I SCO DOMINGO* and EMILIANO
PEGORARO*–*Department of Desertification and Geoecology, Experimental Station of Arid Zones (EEZA), High Spanish Scientific Council
(CSIC), Almerıa, Spain, †Department for Innovation in Biological, Agro-Food and Forest Systems (DIBAF), University of La
Tuscia, Viterbo, Italy, ‡Istituto Nazionale di Geofisica e Vulcanologia, Sezione Roma 2, Rome, Italy, §Faculty of Environmental
Science and Engineering, Babes-Bolyai University, Cluj-Napoca, Romania
Abstract
Despite the advance in our understanding of the carbon exchange between terrestrial ecosystems and the atmo-
sphere, semiarid ecosystems have been poorly investigated and little is known about their role in the global carbon
balance. We used eddy covariance measurements to determine the exchange of CO2 between a semiarid steppe and
the atmosphere over 3 years. The vegetation is a perennial grassland of Stipa tenacissima L. located in the SE of Spain.
We examined diurnal, seasonal and interannual variations in the net ecosystem carbon balance (NECB) in relation to
biophysical variables. Cumulative NECB was a net source of 65.7, 143.6 and 92.1 g C m�2 yr�1 for the 3 years stud-
ied, respectively. We separated the year into two distinctive periods: dry period and growing season. The ecosystem
was a net source of CO2 to the atmosphere, particularly during the dry period when large CO2 positive fluxes of up
to 15 lmol m�2 s�1 were observed in concomitance with large wind speeds. Over the growing season, the ecosystem
was a slight sink or neutral with maximum rates of �2.3 lmol m�2 s�1. Rainfall events caused large fluxes of CO2 to
the atmosphere and determined the length of the growing season. In this season, photosynthetic photon flux density
controlled day-time NECB just below 1000 lmol m�2 s�1. The analyses of the diurnal and seasonal data and preli-
minary geological and gas-geochemical evaluations, including C isotopic analyses, suggest that the CO2 released was
not only biogenic but most likely included a component of geothermal origin, presumably related to deep fluids
occurring in the area. These results highlight the importance of considering geological carbon sources, as well as the
need to carefully interpret the results of eddy covariance partitioning techniques when applied in geologically active
areas potentially affected by CO2-rich geofluid circulation.
Keywords: alpha grass, carbon sequestration, ecosystem respiration, eddy covariance, geogas, geothermal activity, grasslands,
net ecosystem carbon balance
Received 20 May 2011 and accepted 25 July 2011
Introduction
The carbon balance of a large array of ecosystems
across biomes has been intensively studied since the
establishment of the international network of eddy flux
sites FLUXNET (with more than 400 towers worldwide,
http://www.fluxnet.ornl.gov/fluxnet/index.cfm). As a
result, our understanding of ecosystem functioning
across a large range of climatic zones has improved
considerably over the last decade (Baldocchi, 2008) and
our confidence in the estimates of the biosphere carbon
sink is much greater, amounting to 3 Gt C yr�1 (Le
Quere et al., 2009). However, arid and semiarid ecosys-
tems have received much less attention in global terres-
trial carbon estimates, and much less is known about
their carbon balance and future changes in response to
climate change (Schimel, 2010). Given their large exten-
sion, indeed they constitute the largest biome in the
world (Schimel, 2010), it is clear that a reliable estimate
of the global carbon balance requires the inclusion of
ecosystems located in semiarid and arid regions. So far,
few long-term estimates of their current carbon seques-
tration potential have been made (e.g. Hunt et al., 2004;
Hastings et al., 2005; Luo et al., 2007; Rotenberg &
¶Deceased.
Correspondence: A. Rey, Museo Nacional de Ciencias Naturales
CSIC, Serrano 115 E-28006, Madrid, Spain, tel. + 34 917 822 101,
fax + 34 915 640 800, e-mail: [email protected]
© 2011 Blackwell Publishing Ltd 539
Global Change Biology (2012) 18, 539–554, doi: 10.1111/j.1365-2486.2011.02534.x

Yakir, 2010; Scott et al., 2010) and the factors that
control it are not properly understood.
Contrary to what one may expect, arid and semiarid
ecosystems play an important role in the global carbon
cycle and potentially have important effects on the local
climate (Rotenberg & Yakir, 2010). Although net pri-
mary productivity (NPP) tends to be rather low com-
pared to other types of ecosystems, arid and semiarid
lands account for as much as 30% of the terrestrial NPP
(Field et al., 1998), and comprise approximately 24% of
the global organic carbon (Schlesinger, 1991) and 95%
of the inorganic carbon pool (Emmerich, 2003). A
proper quantification of these fluxes for the whole
annual ecosystem carbon balance has not been done,
although it appears that annual NPP, soil respiration
and net ecosystem exchange (NEE) are all well corre-
lated with annual rainfall in these type of ecosystems
(Huxman et al., 2004). As arid and semiarid ecosystems
would likely be more sensitive to changes in rainfall
and increasing temperature than other ecosystems
(Midgley et al., 2004), understanding the response of
their carbon balance to environmental variables is of
utmost importance (Buchmann & Schulze, 1999; Hunt
et al., 2002).
Furthermore, these ecosystems are often placed on
carbonate soils with considerable amounts of inorganic
carbon that can play a role in the net ecosystem carbon
balance (NECB) which refers to the net rate of carbon
accumulation or loss by an ecosystem including physi-
cal, biological and anthropogenic processes (Chapin
et al., 2006). When inorganic carbon enters or leaves the
ecosystem, or when other nonbiogenic sources of car-
bon are involved, the NECB differs from NEE. Some
arid ecosystems accumulate inorganic carbon (in desert
caliche at a typical estimated rate of 3–5 g C m�2 yr�1;
Schlesinger, 1985; Kuzyakov, 2006) associated with the
weathering of carbonate rocks (<3% of NPP; Andrews
& Schlesinger, 2001). Although the contribution at
annual scale is only marginal (Kuzyakov, 2006), inor-
ganic carbon must be taken into account in the NECB
of these ecosystems as carbonate weathering and pre-
cipitation processes occur at short-term time scales that
can affect daily NECB estimates (Serrano-Ortiz et al.,
2010). Therefore, it is clear that when semiarid ecosys-
tems are established on carbonate rocks, one has to be
cautious when interpreting standard eddy covariance
estimates of CO2 exchange with the atmosphere, as
other important sources of CO2 and other carbon com-
pounds may be involved. Indeed, the results of this
study will suggest the presence of yet another source of
carbon, i.e. deep geological carbon dioxide, related to
the geothermal environment of the investigated area.
Therefore, the study of semiarid ecosystems is impor-
tant not only because of the need to understand their
carbon and energy budgets and their relevance at glo-
bal scale, but because they may highlight other carbon
exchange processes that may be relevant also at global
scale and that have not been properly understood and
considered so far.
The main objective of this study was to understand
the mechanisms controlling the exchange of carbon,
water and energy over three consecutive years between
the atmosphere and an alpha grass steppe located in a
semiarid climate unique in Europe (Cabo de Gata Natu-
ral Park, Almerıa, Spain). The specific aims were: (1) to
quantify whether alpha grass steppes, widely distrib-
uted across the semiarid climate, act as a source or a
sink of carbon to the atmosphere, (2) to examine the
diurnal and seasonal variability of NECB in relation to
environmental variables in order to elucidate which
processes are most important and, (3) particularly to
understand what drives interannual variation in NECB
in these ecosystems.
Materials and methods
Site description
The study site (Balsablanca) is a natural alpha grass ecosystem
located in the Cabo de Gata Natural Park, in the province of
Almerıa (Andalucıa) in SE Spain (N36°56′26.0″, W2°01′58.8″)at 200 m a.s.l. The climate is dry subtropical semiarid, with
mean annual rainfall of ca. 200 mm yr�1, mean annual tem-
perature of around 18 °C and annual potential evapotranspi-
ration of around 1390 mm (local weather station, Nıjar). The
climate in this region is characterised by mild temperatures,
prolonged summer droughts and infrequent random rainfall
events, mostly occurring in spring and autumn. Geologically,
the region is characterised by a series of alluvial fans (glacis)
of gentle sloping (2–8%) with petrocalcic horizons (Weijer-
mars, 1991). Dominant soils are classified as Lithic leptosols
(WRB, 2006). Soils are thin (down to a maximum of ca. 30 cm,
but on average 10 cm), alkaline (pH above 8), saturated in car-
bonates with a moderate stone content and flourishing rock
crust. Sub-soil substratum is mainly characterised by marine
carbonate sediments (from sand, conglomerates to reef lime-
stones) and volcanic rocks belonging to the adjacent Miocene
volcanism of Cabo de Gata (Fernandez-Soler, 1996). The car-
bonate formation has high porosity and permeability values
with the presence of fissures and fractures.
The ecosystem presents sparse vegetation dominated by
Stipa tenacissima L. with an average height between 60 and
100 cm and soil coverage of 57%. However, other species of
scarce height and low soil coverage such as: Chamaerops humi-
lis, Rhamnus lycioides, Asparagus horridus, and Pistacia lentiscus
are also present. Stipa tenacissima L. is a tall perennial tussock
grass with long and narrow leaves, high root: shoot ratio and
shallow roots. The vegetation is physiologically active from
late autumn through early spring and mostly inactive during
the long summer; although alpha grass is known to rapidly
© 2011 Blackwell Publishing Ltd, Global Change Biology, 18, 539–554
540 A. REY et al.
respond to rainfall events (Pugnaire et al., 1996). Detail infor-
mation about the site is given elsewhere (Rey et al., 2011).
Micrometeorological measurements
The following micrometeorological variables were measured:
relative humidity (RH) and air temperature (Tair) (HMP45C
Vaisala Inc., Helsinki, Finland) at 4 m above the ground, net
radiation (Rnet) with a net radiometer (NRLite, Kipp and
Zonen, Delfi, the Netherlands) and photosynthetic photon flux
density (PPFD) with a quantum sensor (LI-190SA; Li-Cor Inc.,
Lincoln, NE, USA), both located at 2 m height on a separate
mast, and PPT with a tipping-bucket rain gauge (model 785 M;
Davis Instruments Corp., Hayward, CA, USA) placed at 1 m
height precipitation. Data were measured every 10 s and aver-
aged every 30 min, and then stored in a datalogger (CR23X;
Campbell Scientific Inc., Leiscester, UK). The equipment was
powered by a 12 VDC cycle battery, charged by a solar panel.
Four soil heat flux plates (HFP01SC; Campbell Sci. Inc.) were
placed at 8 cm depth, two under plant and two under bare soil,
and connected via multiplexer to a datalogger. The soil heat
flux at the surface was determined by adding the measured
heat flux at 8 cm (G) to the energy stored in the layer above the
heat plate estimated from soil temperature and soil moisture
measurements (following manual instructions). Soil tempera-
ture was measured using soil thermocouples (TCAV) at 2 and
6 cm depth adjacent to the heat flux plates. Soil volumetric
water content (SWC) was measured by time domain reflectom-
etry (CS616; Campbell Scientific Inc.) located at 4 cm in each set
of heat flux plates. Soil measurements were made every 10 s
and stored as 15 min averages. All sensors were connected to a
datalogger (CR23X; Campbell Scientific Inc.).
Eddy covariance measurements
InMay 2006, an eddy covariance flux towerwas installed and in-
strumented for continuous measurements of micrometeorologi-
cal variables and net exchange of CO2, H2O and energy between
the alpha grass ecosystem and the atmosphere (Baldocchi, 2003).
Measurementsweremade for three consecutive years, from June
2006 (DOY 154) to June 2009 (DOY 153). A fast response, three-
axis sonic anemometer (CSAT-3; Campbell Scientific Inc.) mea-
sured the three components of the wind velocity vector and
sonic temperature. An open-path gas analyser (IRGA) (Li-Cor
7500; Li-Cor) measured fluctuations in CO2 and H2O densities.
Both instruments were mounted on a mast 3.5 m above the
ground. Calibration was carried out monthly using a N2 stan-
dard for zero (purity of 99.999%) and a gas standard of 509.5
(±0.1) lmol mol�1 (CO2) for span. The IRGA was cleaned fre-
quently on a regular basis (Serrano-Ortiz et al., 2008).
Averaged 15 min values were calculated from 10 Hz data
as mean voltages and converted to densities using a datalog-
ger in-house program (CR10X; Campbell Scientific). Data pro-
cessing was done as described by Aubinet et al. (2000) and
included 2D coordinate rotations (McMillen, 1988; Wilczak
et al., 2001) of wind components and CO2 fluxes computation
as the mean covariance between fluctuations in the vertical
wind speed and CO2 densities over 30 min periods including
corrections for air density fluctuations (Webb et al., 1980). For
convention, fluxes of CO2 towards the vegetation surface
(photosynthesis) are negative, and fluxes away from the sur-
face to the atmosphere (‘respiration’) are positive.
A footprint analysis was performed to determine whether
the footprint of the eddy tower was within the ecosystem of
interest. The FSAM model (Schmid, 1994, 1997) estimated the
footprint for a range of stability atmospheric conditions,
according to the median of the stability index (z�d)/L, where z
is the measurement height, d is the displacement height and L
is the Monin-Obhukov length. We separated all data into day-
and night-time periods (according to a PPFD value of
50 lmol m�2 s�1). For the 3 years studied, the percentage of
day-time data that corresponded to unstable [(z�d)/
L < �0.01], neutral [�0.01 < (z�d)/L < 0.01] and stable
[(z�d)/L > 0.01] conditions corresponded to 84%, 12% and 4%,
respectively. The footprint analysis showed that during day-
time the downwind distance from the tower of the far end of
the source area was 53, 79 and 106 m for unstable, neutral and
stable conditions, respectively. Likewise, the distance of the
point of maximum source weight (Xmax in FSAM) was 28, 39
and 51 m, respectively. In the case of the night-time data, the
percentage of data corresponding to unstable, neutral and sta-
ble conditions was 6%, 26% and 67%, respectively. For these
data, the downwind distance of the far end of the source area
was 60, 82 and 126 m, while the distance of Xmax was 31, 41 and
59 m, for unstable, neutral and stable conditions, respectively.
These results showed that the footprint of the eddy tower is
within a 100 m radius, except for stable conditions occurring
mainly at night, where the footprint was larger, although it is
still included in the fetch of the ecosystem studied.
Data postprocessing
Data postprocessing was performed following FLUXNET
standard procedures and included despiking, night-time cor-
rection and gapfilling of half hourly mean fluxes. Data were
first despiked following Papale et al. (2006). Then, a year-to-
year variable critical friction velocity (u*) threshold ranging
0.09–0.11 m s�1 was used to exclude eddy covariance data
under calm wind conditions (Reichstein et al., 2005), which
corresponded mostly to night-time values as the site is near
the sea and thus subject to constant winds. By applying this
threshold values about 25% of night-time data were rejected.
Finally, a gapfilling procedure after Reichstein et al. (2005)
was applied. The percentage of eddy covariance data collected
over the 3 year period was around 80%. Missing data were
mainly the result of bad quality data during data processing
or instrumentation failure.
System performance and energy budget
System performance was assessed by examining the degree of
closure of the surface energy balance (Wilson, 2002). The daily
totals of latent heat flux (LE) and sensible heat flux (H) were
compared to measured net radiation (Rn) and heat flux (G).
Over the whole period of the study (2006/2009), the agree-
ment was 95% with an intercept value of 14.3 and a slope of
© 2011 Blackwell Publishing Ltd, Global Change Biology, 18, 539–554
WIND DRIVES CO2 EXCHANGE IN AN ARID ECOSYSTEM 541
0.93 (slope of 0.99 for an intercept zero with more than 90%
agreement), so the system performed very well at the site.
Biophysical control of NECB
To examine the dependence of NECB (lmol m�2 s�1) on vari-
ous environmental variables, we divided all half hour data set
into two distinctive periods: dry period (SWC < 0.05 m3 m�3,
Bowen ratio > 4 and Tair > 20 °C) excluding any possible rain-
fall events, and growing season (the rest), i.e. periods when
soil moisture was not so limiting as temperature was never a
limiting factor. While during the dry period the vegetation is
mostly dormant (Hasse et al., 1999), during the growing sea-
son plants are active.
Using day-time data, we analysed the dependence of NECB
on PPFD (lmol m�2 s�1) by binning the data into
100 lmol m�2 s�1 intervals of PPFD ranging from 50 to 2500
(day-time data). NECB was then averaged for each bin inter-
val of PPFD to reduce the uncertainty associated with the
measurements (Falge et al., 2001; Li et al., 2005).
The Michaelis-Menten equation, referred to as the rectangu-
lar hyperbola model (Michaelis & Menten, 1913), was used to
explore the relationship between PPFD and NECB for the
growing season:
NECB ¼ GPP�maxPPFD=ðkþ PPFDÞ þ RECO ð1Þ
where GPPmax is the gross primary productivity at infinitive
light (lmol m�2 s�1), PPFD is photosynthetic photon flux den-
sity (lmol m�2 s�1), RECO is ecosystem respiration and k is an
estimated parameter that indicates the level of PPFD at which
NECB is half of GPPmax. Note that CO2 assimilation is associ-
ated with negative sign of NECB and thus, in this case, GPP is
negative.
Using night-time data (PPFD < 50 lmol m�2 s�1), the rela-
tionship between soil temperature measured under bare soil
and NECB was analysed for the dry period and growing sea-
son using half hour data excluding rainfall events. Data were
binned by soil temperature (every 1 °C) and the exponential
equation:
NECBnight�time ¼ NECB0 eðbTsoilÞ ð2Þ
was fitted when possible (the relationship was positive).
NECB0 is the CO2 exchange rate at 0 °C, Tsoil is the soil tem-
perature at 4 cm under bare soil (°C) and b is a fitted parame-
ter related to the Q10 value (increase in NECB with 10 °Cincrease in temperature) according to the equation:
Q10 ¼ expð10bÞ ð3Þ
In addition, we examined the relationship between wind
speed and NECB. In this case, half hour data were binned by
wind speed (every 0.5 m s�1). We also analysed any possible
relationship with daily means (WS) and sums (NECB) to
determine the biophysical control of NECB over the season.
All statistical analyses were performed with the SAS soft-
ware 9.2 (SAS Software, Cary, NC, USA). Functional relation-
ships were analysed by nonlinear models (PROC NLIN).
Results
Seasonal and interannual variability inmicrometeorological conditions
There were no significant differences in weather condi-
tions between the 3 years of the study except for the
amount and distribution of rainfall (Fig. 1). The total
annual rainfall was: 210, 251 and 294 mm for the year
2006/2007, 2007/2008, and 2008/2009, respectively.
The 3 years had similar mean annual temperature (ca.
17 °C ± 0.1), mean annual maximum RH (ca. 88 ±0.4%) and similar net radiation (ca. 81 W m�2 ± 3).
Annual average SWC under bare soil (at 4 cm) was
30% and 46% higher in the year 2007/2008 and 2008/
2009 than in the first year, respectively.
The environmental variables showed strong season-
ality, with minimum day-time averages of Rn, Ta, Ts
and VPD in winter (94 W m�2, 8 °C, 19 °C and 11 hPa,
respectively) andmaxima in summer (241 W m�2, 33 °C,50 °C and 51 hPa, respectively). While the seasonal
means varied slightly among the study years, the sea-
sonal distribution of rainfall was markedly different
between years (see Fig. 1). In all years, rainfall occurred
mostly during the autumn/winter period with mini-
mum and small rainfall events during the summer
months (Fig. 1, Table 1). In the first year, spring was
the period with more rain. In the second year, begin-
ning of autumn was the period with highest rainfall
with a first moderate event after the summer drought
(19.4 mm) and another rainfall event in October of
66 mm (DOY 291). This single event was enough to
recharge the soil profile for the whole winter and raised
soil water content from 9.6% to over 20%. For this year
(2007/2008), the SWC was higher than 20% during all
winter. During the third year, it rained above average
during the autumn months reaching 170 mm, evenly
distributed from September to December 2008.
Seasonal and interannual variability in NECB
There was a strong seasonal variation in NECB with
some similar patterns each year. The ecosystem was a
net source of CO2 for most of the dry period when large
CO2 fluxes to the atmosphere were observed (up to
10.0 lmol m�2 s�1 or 4.8 g C m�2 day�1) (Fig. 1). The
dry period as defined in the Materials and methods sec-
tion, lasted almost 5 months: from June through the
end of October (148, 131 and 123 days the first, second
and third year, respectively). In all years, the amount of
carbon lost during the dry period was much more than
the amount of carbon fixed the rest of the year. As a
result, the ecosystem behaved as a carbon source to
the atmosphere (Table 1). The cumulative amount of
© 2011 Blackwell Publishing Ltd, Global Change Biology, 18, 539–554
542 A. REY et al.

carbon released to the atmosphere was 65.7, 136.8 and
90.7 g m�2 yr�1 in the years 2006//2007, 2007/2008
and 2008/2009, respectively (Fig. 2). The ecosystem
absorbed some carbon during the growing season
(autumn/winter months) but the negative fluxes
(maximum rates in winter 2008 of up to
6 7 8 9 10 11 12 1 2 3 4 5 6 7 8 9 10 11 12 1 2 3 4 5 6 7 8 9 10 11 12 1 2 3 4 5
2006 2007 2008 2009
T air/ T
soil (
o C)
0
10
20
30
40
50
NE
CB
(g C
m–2
day–1
)
–2–101234
Bow
en r
atio
5
10
15
20
SWC
(m3
m–3
)
0.0
0.1
0.2
0.3PP
FD (μ
mol
m–2s–1
)
500
1000
1500
2000
2500
ET
(kg
H2O
m–2
day
–1)
02468
101214
PPT
(mm
)
0
20
40
60
Month
Dry period Growing season
Year 1 Year 2 Year 3
Fig. 1 Temporal variation in mean air temperature (°C), mean soil temperature (°C), mean volumetric water content (m m�3), daily
precipitation (mm), maximum direct photosynthetic photon flux density (lmol m�2 s�1), total daily evapotranspiration
(kg H2O m�2 day�1), mean Bowen ratio and net ecosystem carbon balance (g C m�2 day�1). The dry period was defined as periods
where Tair was higher than 20 °C, SWC was <0.05 m3 m�3 and the Bowen ratio higher than 4.
© 2011 Blackwell Publishing Ltd, Global Change Biology, 18, 539–554
WIND DRIVES CO2 EXCHANGE IN AN ARID ECOSYSTEM 543

�1.85 g C m�2 day�1) were always much smaller than
the positive ones observed during the dry period. The
vegetation seemed to be most active in the winter (from
January through March). During the autumn, it
behaved as a slight sink in the first two years but NECB
was near 0 during the third year (Table 1). Variability
within days of the same period was large (Fig. 1).
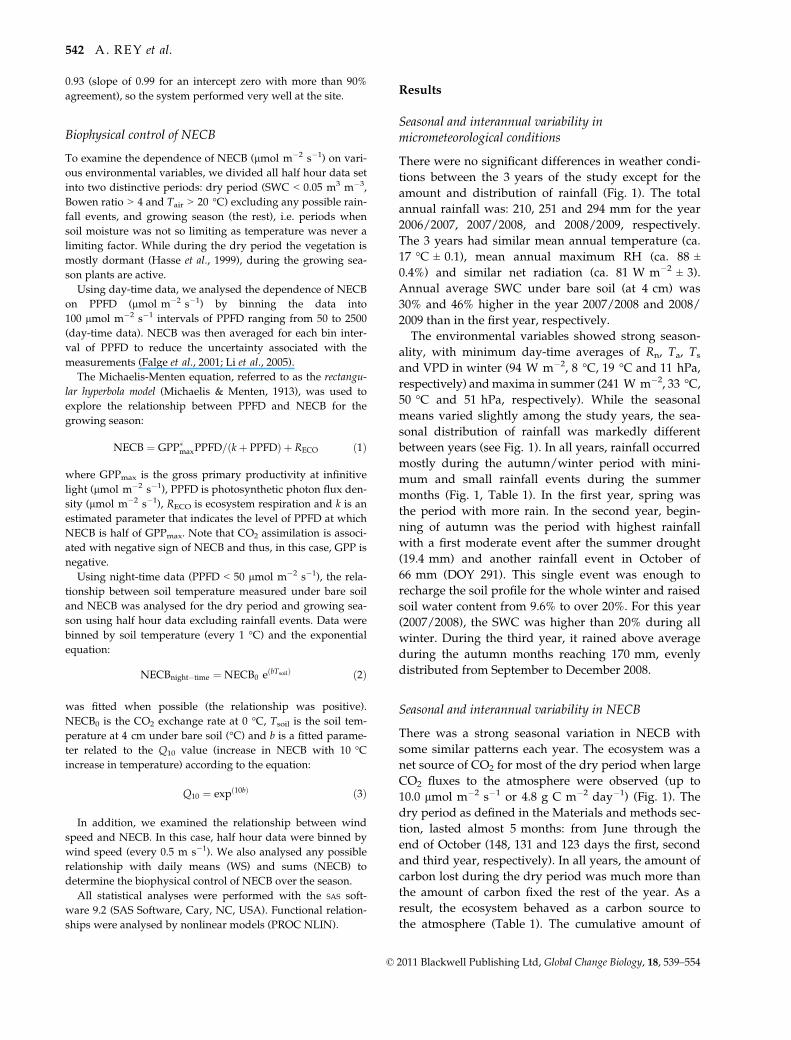
Diurnal variation in NECB
To examine the diurnal variation in NECB for each year
we analysed the data from the dry period and growing
season separately. The variability in daily averages was
similar between years and showed similar marked
diurnal patterns for the dry period (Fig. 3). The ecosys-
tem was a slight source of carbon during the night with
positive fluxes of around 0.5 lmol m�2 s�1 that
declined after sunrise between 6.00 and 8.30 when
fluxes were around zero, and then became a clear
source of carbon reaching maximum positive rates of
up to 2.5 lmol m�2 s�1 around 13.00, then decreased to
reach a minimum around 18.00, and from 21.00 on posi-
tive rates remained rather constant. In contrast, during
the growing season, although the diurnal pattern was
similar among years, with positive fluxes at night of
around 0.5 lmol m�2 s�1 and negative rates between
8.00 and 18.00, the sink strength varied between years.
The maximum negative values were always around
10.00 in the morning, and then the trend showed an
inflexion around 13.00. However, the ecosystem was a
much stronger sink in the first year than in the other
two years.
Table 1 Number of days, average daily Tair, Tsoil, wind speed (WS) and SWC, total precipitation (PPT), evapotranspiration (ET),
and net ecosystem carbon balance (NECB) of the dry period (DP) and the growing season (GS) over the three years of the study
(2006/2009)
Year Period Season no. days Tair (°C) Tsoil (°C)SWC
(m3 m�3)
PPT
(mm)
WS
(m s�1)
ET
(g m�2)
NECB
(g m�2)
1 DP Dry period 148 22.6 28.1 0.05 21 3.5 33.8 103.0
GS Autumn 67 13.8 13.3 0.10 60 2.6 23.4 �1.0
Winter 150 14.4 16.3 0.10 130 2.8 67.4 �36.7
Total 365 17.6 19.2 0.08 211 3.0 124.6 65.7
2 DP Dry period 131 23.1 30.2 0.05 39 3.4 20.8 131.3
GS Autumn 81 13.6 12.7 0.17 133 2.3 31.3 �14.0
Winter 153 14.2 16.7 0.11 79 3.3 45.7 19.5
Total 365 17.3 19.9 0.10 251 3.1 97.8 136.8
3 DP Dry period 123 23.6 31.2 0.05 13 3.4 16.8 94.4
GS Autumn 101 14.2 14.2 0.17 170 2.6 35.1 22.2
Winter 142 13.0 15.4 0.13 111 3.0 58.9 �26.9
Total 366 16.8 20.3 0.12 294 3.0 110.8 90.7
6 7 8 9 10 11 12 1 2 3 4 5 6 7 8 9 10 11 12 1 2 3 4 5 6 7 8 9 10 11 12 1 2 3 4 5Month
Cum
mul
ativ
e N
EC
B (g
C m
–2)
0
100
200
300
4002006 2007 2008 2009
Dry periodGrowing season
65.7 g C 136.8 g C 90.7 g C
Year 1 Year 2 Year 3
Fig. 2 Cumulative amounts of carbon exchanged (NECB) over the whole study period (2006–2009) (g C m�2 yr�1). The dry period is
marked with patterns.
© 2011 Blackwell Publishing Ltd, Global Change Biology, 18, 539–554
544 A. REY et al.
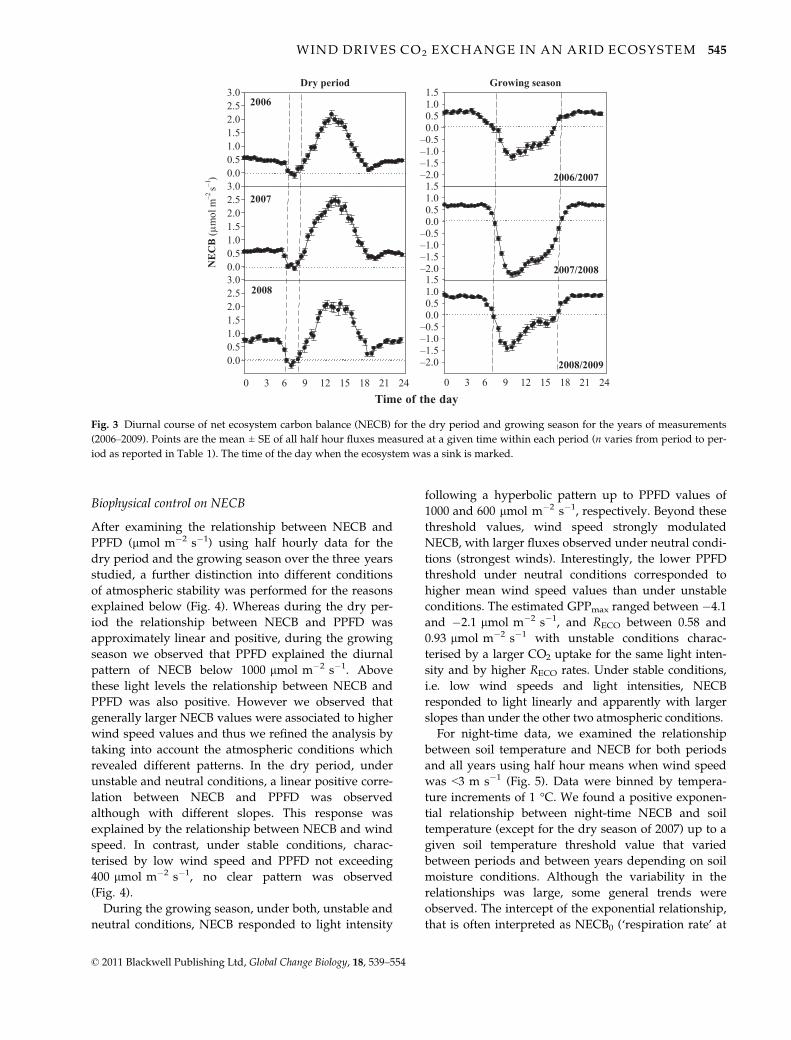
Biophysical control on NECB
After examining the relationship between NECB and
PPFD (lmol m�2 s�1) using half hourly data for the
dry period and the growing season over the three years
studied, a further distinction into different conditions
of atmospheric stability was performed for the reasons
explained below (Fig. 4). Whereas during the dry per-
iod the relationship between NECB and PPFD was
approximately linear and positive, during the growing
season we observed that PPFD explained the diurnal
pattern of NECB below 1000 lmol m�2 s�1. Above
these light levels the relationship between NECB and
PPFD was also positive. However we observed that
generally larger NECB values were associated to higher
wind speed values and thus we refined the analysis by
taking into account the atmospheric conditions which
revealed different patterns. In the dry period, under
unstable and neutral conditions, a linear positive corre-
lation between NECB and PPFD was observed
although with different slopes. This response was
explained by the relationship between NECB and wind
speed. In contrast, under stable conditions, charac-
terised by low wind speed and PPFD not exceeding
400 lmol m�2 s�1, no clear pattern was observed
(Fig. 4).
During the growing season, under both, unstable and
neutral conditions, NECB responded to light intensity
following a hyperbolic pattern up to PPFD values of
1000 and 600 lmol m�2 s�1, respectively. Beyond these
threshold values, wind speed strongly modulated
NECB, with larger fluxes observed under neutral condi-
tions (strongest winds). Interestingly, the lower PPFD
threshold under neutral conditions corresponded to
higher mean wind speed values than under unstable
conditions. The estimated GPPmax ranged between �4.1
and �2.1 lmol m�2 s�1, and RECO between 0.58 and
0.93 lmol m�2 s�1 with unstable conditions charac-
terised by a larger CO2 uptake for the same light inten-
sity and by higher RECO rates. Under stable conditions,
i.e. low wind speeds and light intensities, NECB
responded to light linearly and apparently with larger
slopes than under the other two atmospheric conditions.
For night-time data, we examined the relationship
between soil temperature and NECB for both periods
and all years using half hour means when wind speed
was <3 m s�1 (Fig. 5). Data were binned by tempera-
ture increments of 1 °C. We found a positive exponen-
tial relationship between night-time NECB and soil
temperature (except for the dry season of 2007) up to a
given soil temperature threshold value that varied
between periods and between years depending on soil
moisture conditions. Although the variability in the
relationships was large, some general trends were
observed. The intercept of the exponential relationship,
that is often interpreted as NECB0 (‘respiration rate’ at
0.00.51.01.52.02.53.0
2006
2007
2008
2006/2007
2007/2008
2008/20092009
Dry period
0.00.51.01.52.02.53.0
NE
CB
(μm
ol m
–2 s–1
)
0.00.51.01.52.02.53.0
–2.0–1.5–1.0–0.5
0.00.51.01.5
2D Graph 1
–2.0–1.5–1.0–0.5
0.00.51.01.5
Growing season
–2.0–1.5–1.0–0.5
0.00.51.01.5
0 3 6 9 12 15 18 21 24 0 3 6 9 12 15 18 21 24
2006
2007
2006/2007
2007/2008
2008/2009
Time of the day
Fig. 3 Diurnal course of net ecosystem carbon balance (NECB) for the dry period and growing season for the years of measurements
(2006–2009). Points are the mean ± SE of all half hour fluxes measured at a given time within each period (n varies from period to per-
iod as reported in Table 1). The time of the day when the ecosystem was a sink is marked.
© 2011 Blackwell Publishing Ltd, Global Change Biology, 18, 539–554
WIND DRIVES CO2 EXCHANGE IN AN ARID ECOSYSTEM 545
0
2
4
6
8
10
0 500 1000 1500 2000
0
2
4
6
8
10
Growing season
–2
0
2
4
6
8
10
NEC
B (µ
mol
m–2
s–1)
–2
0
2
4
6
8
10
0 500 1000 1500 20000
2
4
6
8
10
0 500 1000 1500 20000 500 1000 1500 2000
–2
0
2
4
6
8
10
2006/2007
Unstable Neutral StablePPFD (µmol m–2 s–1)
RECO = 0.58 (0.2)GPPmax = –3.9 (0.4)
RECO = 0.70 (0.1)GPPmax= –2.7 (0.4)
RECO = 0.86 (0.1)GPPmax = –4.1 (0.2)
RECO = 0.77 (0.2)GPPmax= –2.9 (0.2)
RECO = 0.80 (0.1)GPPmax= –2.2 (0.3)
RECO = 0.93 (0.2)GPPmax= –2.07(0.4)
2007/2008
2008/2009
R2 = 0.96
R2 = 0.98
R2 = 0.95
R2 = 0.96
R 2 = 0.91
R 2 = 0.95
Win
d sp
eed
(m s–1
)
0 500 1000 1500 200002468101214
02468101214
024681012142006
2008
0 500 1000 1500 2000
02468
1012
Dry period
02468
1012
2007
NEC
B (µ
mol
m–2
s–1)
02468
1012
Win
d sp
eed
(m s–1
)
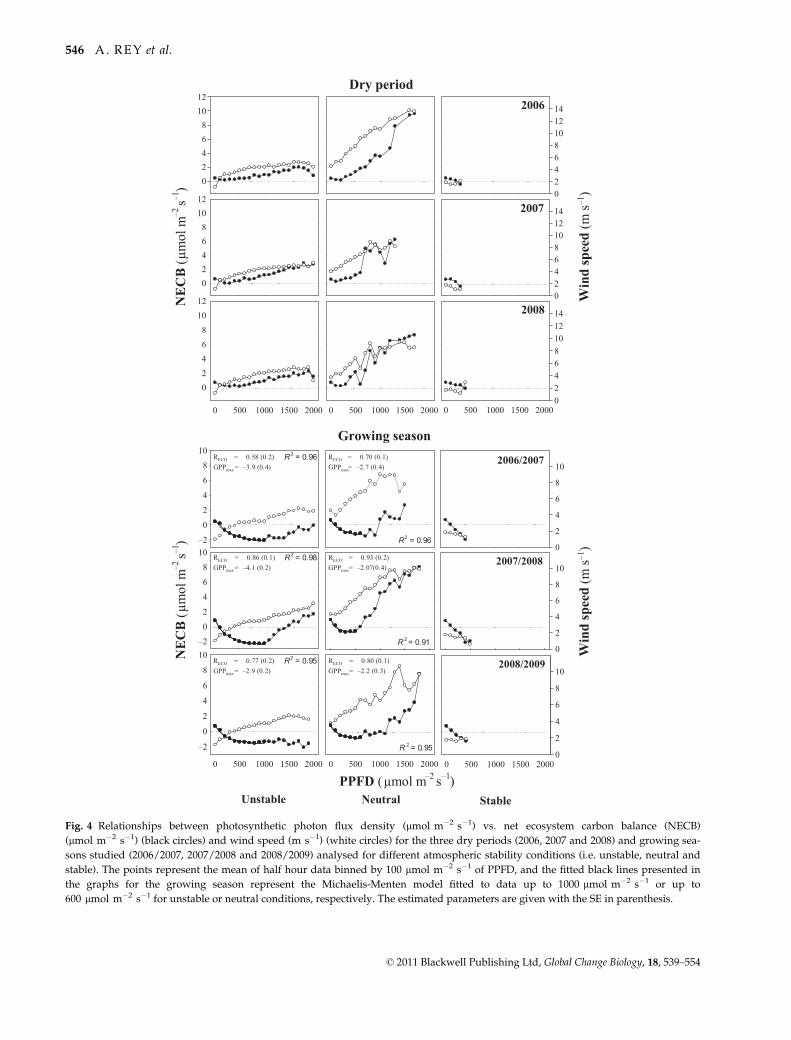
Fig. 4 Relationships between photosynthetic photon flux density (lmol m�2 s�1) vs. net ecosystem carbon balance (NECB)
(lmol m�2 s�1) (black circles) and wind speed (m s�1) (white circles) for the three dry periods (2006, 2007 and 2008) and growing sea-
sons studied (2006/2007, 2007/2008 and 2008/2009) analysed for different atmospheric stability conditions (i.e. unstable, neutral and
stable). The points represent the mean of half hour data binned by 100 lmol m�2 s�1 of PPFD, and the fitted black lines presented in
the graphs for the growing season represent the Michaelis-Menten model fitted to data up to 1000 lmol m�2 s�1 or up to
600 lmol m�2 s�1 for unstable or neutral conditions, respectively. The estimated parameters are given with the SE in parenthesis.
© 2011 Blackwell Publishing Ltd, Global Change Biology, 18, 539–554
546 A. REY et al.

zero degrees), was lower during the dry period than
during the growing season. The exponent of the expo-
nential function that can be related to the Q10 as
described in the Materials and methods section, was
lower during the growing season than during the dry
period. In all cases, the relationship between NECB and
soil temperature was negative above a given value of
soil temperature that varied between 15 and 30 °Cdepending on soil moisture conditions. Soil tempera-
ture and SWC were negatively correlated in all cases.
To examine whether the relationship between wind
speed and NECB explained the large fluxes observed
during the dry period, we plotted mean day-time
values of wind speed against NECB measured during
the dry period of the three years, and found that the
positive relationship holds (Fig. 6). The several days
selected as an example in Fig. 7 had similar radiation
input, similar air temperature and soil moisture values
and variable RH and show clearly that days with strong
winds exhibited larger emission rates than less windy
days. However, it was clear from Fig. 7, that wind only
caused large positive fluxes during the day-time but
not at night-time when respiratory fluxes were con-
stant. In order to examine the cause of the lack of
response to wind speed at night, we plotted the stability
parameter against wind speed, NECB and sensible heat
Dry period
Soil temperature at 4 cm (oC)
15 20 25 30 35 400.0
0.2
0.4
0.6
0.8
1.0
1.2
2008
15 20 25 30 35 40
NE
CB
(μm
ol m
–2 s–1
)
0.0
0.2
0.4
0.6
0.8
1.0
1.2
10 15 20 25 300.0
0.2
0.4
0.6
0.8
1.0
1.2
Growing season
10 15 20 25 300.0
0.2
0.4
0.6
0.8
1.0
1.2
10 15 20 25 300.0
0.2
0.4
0.6
0.8
1.0
1.2
2006 2006/2007R2 > 0.76R ECO = 0.07 e(–0.08 Tsoil)
R2 > 0.77RECO = 0.30 e(–0.06 Tsoil )
R2 > 0.95R
ECO = 0.03 e(–0.12 Tsoil)
2007/2008 R2 > 0.88R
ECO = 0.51 e(–0.04 Tsoil )
R2 > 0.84R
ECO = 0.41 e(–0.04 Tsoil)
2008/2009
2007
15 20 25 30 35 400.0
0.2
0.4
0.6
0.8
1.0
1.2
10 15 20 25 30
SWC
(m3 m
–3)
0.040.050.060.070.080.090.10
10 15 20 25 30 35 40SW
C (%
)0.0250.0300.0350.0400.0450.0500.055
10 15 20 25 30
SWC
(m3 m
–3)
0.040.060.080.100.120.140.16
10 15 20 25 30
swc(m
3 m–3
)
0.020.040.060.080.100.120.140.16
10 15 20 25 30 35 40
swc
(m3 m
–3)
0.038
0.040
0.042
0.044
0.046
0.048
10 15 20 25 30 35 40
SWC
(m3 m
–3)
0.0480.0500.0520.0540.0560.0580.0600.062
Fig. 5 Relationship between night-time soil temperature (°C) and net ecosystem carbon balance (NECB) (lmol m�2 s�1) for the dry
period of 2006, 2007 and 2008 (left) and for the growing season of 2006/2007, 2007/2008 and 2008/2009 (right) excluding any rainfall
events and half hour data for which wind speed was larger than 3 m s�1. The points represent the mean values for each degree bin
internal of soil temperature at 4 cm and the line is a fitted exponential equation to the points for which the relationship was positive.
The small graphs show the relationship between soil water content at 4 cm (m m�3) and soil temperature (°C).
© 2011 Blackwell Publishing Ltd, Global Change Biology, 18, 539–554
WIND DRIVES CO2 EXCHANGE IN AN ARID ECOSYSTEM 547

flux (Fig. 8). This analysis revealed that under stable
conditions wind speed was not a driver of CO2 fluxes.
Stable conditions occurred in 66% of all night-time data,
when increasing wind speed values did not correlate
with increasing positive values of NECB. Indeed, the
relationship between wind speed and NECB varied
according to the atmospheric conditions with no rela-
tionship observed under stable conditions neither in the
dry period nor in the growing season (Fig. 9).
Rainfall also caused large positive fluxes of CO2 to
the atmosphere (Fig. 1). We examined a few examples
of rainfall events on the CO2 fluxes both in the growing
season and during the dry period in the absence of
wind to make sure that the effects observed could be
attributed solely to changes in soil moisture (Fig. 10).
Rainfall events induced large respiratory fluxes in both
periods (Fig. 1).
Discussion
Annual carbon balance
The steppe ecosystem under study exhibits a semiarid
climate characterised by mild temperatures around the
year and extremely low and erratic rainfall, resulting in
a very long dry period from mid-spring through
autumn when the vegetation is mostly dormant (Hasse
Dry period
Mean daily wind speed (m s–1)0 2 4 6 8 10
NE
CB
(g C
m–2
day
–1)
0.0
0.5
1.0
1.5
2.0
2.5
Fig. 6 Relationship between mean wind speed (m s�1) and net
ecosystem carbon balance (NECB) (g C m�2 day�1) during the
dry period of 2006 (white), 2007 (grey) and 2008 (black). Points
are the average daily values binned by wind speed every
0.5 m s�1 for the entire period excluding rainfall events.
T soi
l(o C
)
510152025303540
RH
(%)
20
40
60
80
100
Dry period(2008)
WS
(m s–1
)
02468
1012
PPFD
(mm
ol m
–2 s–1
)
0
500
1000
1500
2000
NEC
B ( μ
mol
m–2
s–1)
0
4
8
12
16
100 101 102 103 104 105 106 107 108 109 110 111
DOY
(a)
(b)
(c)
Fig. 7 Time course of (a) soil temperature at 4 cm (°C) –dotted line- and relative humidity (RH) (%) –solid line-, (b) wind speed
(m s�1) –dotted line- and photosynthetic photon flux density (PPFD) –solid line- and (c) net ecosystem carbon balance (NECB)
(lmol m�2 s�1) over 11 days of the dry period 2008. Points represent half hour averaged data.
© 2011 Blackwell Publishing Ltd, Global Change Biology, 18, 539–554
548 A. REY et al.

et al., 1999). These semiarid features are rather unique
in Europe, and in general, few studies have been
reported in similar semiarid regions of the world. The
few examples of estimates of the NECB between semi-
arid ecosystems and the atmosphere are mostly located
in the United Estates, Israel and China and have
yielded contrasting results. Whereas in some studies,
the vegetation was a net source of carbon to the atmo-
sphere (Mielnick et al., 2005), other estimates report
NECB values (Wohlfahrt et al., 2008; Rotenberg &
Yakir, 2010) similar in magnitude to those reported for
many temperate forest and grassland ecosystems (Bal-
docchi et al., 2001; Falge et al., 2002), which are charac-
terised by a much higher NPP than deserts (Larcher,
1991). The few studies report estimates such as:
�63 g C m�2 (March–December only) by Scott et al.
(2006) for a semiarid riparian grassland in Arizona, �39
to �52 g C m�2 yr�1 found by Hastings et al. (2005) for
a desert shrub community in Baja California/Mexico,
�96 to �155 g C m�2 yr�1 during years with normal
weather conditions determined by Luo et al. (2007) for
a mature semiarid chaparral ecosystem in California
and �102 to �110 g C m�2 by Wohlfahrt et al. (2008) in
a Mojave Desert ecosystem. Other studies have found
that the ecosystem can switch from a carbon sink to a
carbon source during particularly dry years (i.e. Hunt
et al., 2004; Luo et al., 2007). In contrast, Mielnick et al.
(2005) found that a Chihuahuan desert grassland was a
consistent net source of carbon over the year amounting
up to 145 g C m�2. Emmerich (2003) also reported a
similar net annual loss of 144 g C m�2 in a semiarid
bush site in Arizona; however they attributed at least
part of the carbon released to the large pool of soil inor-
ganic carbon, particularly following rainfall events. In
this study, we found that the grassland ecosystem was
a consistent net source of carbon to the atmosphere of
similar magnitude over the three years studied (on
average 98.7 g C m�2 yr�1) which suggests that the
ecosystem under study is unsustainable. However, the
seasonal pattern of NECB in this study was different
from the observed pattern in other semiarid sites which
highlighted the possible presence of other nonbiological
CO2 sources that have not been identified before and
that are not related to the ecosystem activity.
The ecosystem was a net source mainly as a result of
large positive CO2 fluxes observed over the dry period
when the vegetation was mostly dormant. Therefore, it
is most unlikely that the CO2 released by the ecosystem
was the result of respiratory processes. For this reason,
it was not possible to use the standardised methods for
flux partitioning into gross primary productivity and
ecosystem respiration (Reichstein et al., 2005; Lasslop
et al., 2010) as other nonbiological processes were pres-
ent, or indeed, the production and release of CO2 did
not seem to be coupled in this ecosystem. Other studies
have recently identified such a problem when studying
2D Graph 1
(z-d)/L–1.0 –0.5 0.0 0.5 1.0
Win
d sp
eed
(m s–1
),N
EC
B (μ
mol
m–2
s– 1 )
–4
–2
0
2
4
6
H (W
m–2
)
–100
0
100
200
300
400
500
n
0200400600800
1000120014001600
Fig. 8 Relationship between mean wind speed (m s�1) -grey dots-, mean net ecosystem carbon balance (lmol m�2 s�1) –white dots-,
sensible heat flux (W m�2) –black dots- and the atmospheric stability parameter over the dry period. Data are binned by the stability
parameter (each 0.01). The top panel shows the data frequency distribution.
© 2011 Blackwell Publishing Ltd, Global Change Biology, 18, 539–554
WIND DRIVES CO2 EXCHANGE IN AN ARID ECOSYSTEM 549

ecosystems placed on carbonate substrates (e.g. Kowal-
ski et al., 2008; Serrano-Ortiz et al., 2009). In these stud-
ies the large fluxes of CO2 to the atmosphere are
attributed to geochemical processes associated with the
weathering–precipitation processes occurring in car-
bonate soils and to ventilation processes occurring in
karstic systems where large accumulation of CO2 in
caves are ventilated whenever the conditions are
favourable (Cuerva et al., 2011; Sanchez-Canete et al.,
2011). However, as pointed out by Serrano-Ortiz et al.
(2010) these processes alone cannot explain the large
fluxes observed during very dry periods. Particularly,
they could not explain the seasonal pattern observed at
the site under study since it is not karstic and there are
no caves present (Weijermars, 1991). We explored the
diurnal and seasonal variation of NECB to understand
the main biophysical factors controlling NECB in this
ecosystem and the possible origin of the CO2 emitted to
the atmosphere.
Diurnal variation in NECB
Daily CO2 fluxes varied markedly between seasons and
somewhat among years. During the dry period the eco-
system was a net source of CO2 following a clear diur-
nal pattern with an average value of 2.5 lmol m�2 s�1
and maximum values of over 14 lmol m�2 s�1 which
cannot be explained by respiratory activity alone given
that vegetation was mostly inactive and soil mineralisa-
tion is minimal at such soil moisture levels (Rey et al.,
2005; 2011). It is noteworthy that in the early hours of
the morning, around 6:00–8:00, the positive fluxes
decreased to near zero presumably as a result of photo-
synthetic activity possibly stimulated by the input of
water availability via high RH during the first hours of
the day. As vegetation was mostly inactive during the
dry period, it is possible that the biological crusts
expansion and growth of cryptobiotic crust organisms
(lichens, mosses and cyanobacteria) were activated by
the available water from the morning dew (common at
the site as measure with dew sensors) and contributed
somewhat to this effect. These organisms have been
neglected so far as significant carbon pools in semiarid
and desert ecosystems but their critical role in nutrient
and carbon cycling has recently been recognised (Grote
et al., 2010; Maestre et al., 2010; Castillo-Monroy et al.,
2011). Indeed, biological soil crusts cover nearly 20% of
the land cover at the site (Rey et al., 2011).
Negative daily CO2 fluxes were primarily confined to
the growing season, between November and March,
and were usually small in comparison with fluxes mea-
sured in other similar ecosystems (Mielnick et al., 2005;
Wohlfahrt et al., 2008). The sink capacity of the ecosys-
tem decreased in the middle hours of the day which
was mainly related to increased wind speed in these
hours. Although stomatal closure, which has been
shown to cause a decline in net CO2 uptake under mild
drought conditions (Chaves, 1991), may have caused
some of the observed reduction, the decline in NECB
was mostly related to increased wind speed around
mid hours of the day. As shown by the analyses done
on the relationship between wind speed and NECB (i.e.
positive fluxes measured at midday during the dry sea-
son were five times larger than at night, thus, they can-
not be attributed to biological activity alone), large
wind speeds promoted CO2 release from soils reducing
the ecosystem sink capacity.
During the growing season, photosynthetic photon
active radiation explained variations in NECB up to
certain threshold value under both, unstable and
neutral atmospheric conditions. Under neutral stability
Growing season(2006/2009)
Wind speed (m s–1)0 2 4 6 8 10 12 14
–6
–4
–2
0
2
4
6
8
10
Dry period(2006/2009)
NE
CB
(μm
ol m
–2 s–1
)
–2
0
2
4
6
8
10
12
StableNeutralUnstable
Fig. 9 Relationship between wind speed (m s�1) and net eco-
system carbon balance (NECB) (lmol m�2 s�1) for the dry per-
iod (2006–2008) and growing season (2006–2009) for different
atmospheric stability conditions (i.e. unstable, neutral and sta-
ble). The points represent the mean values for each 0.5 m s�1
binned interval of wind speed and the bars are standard devia-
tions.
© 2011 Blackwell Publishing Ltd, Global Change Biology, 18, 539–554
550 A. REY et al.

conditions, CO2 fluxes responded to a more limited var-
iation range of PPFD (0–600 μmol m�2 s�1) compared
to unstable atmospheric conditions (0–1000 μmol m�2
s�1) because radiation levels were generally associated
to larger wind speeds. Beyond these threshold values of
PPFD, there was a positive relationship between PPFD
and NECB, yet of variable magnitude across atmo-
spheric stability conditions and years, reflecting the dif-
ferent distribution patterns of wind speed along PPFD
classes. The observed increase in NECB with PPFD was
indeed the result of the correlation between higher val-
ues of PPFD and wind speed during the middle hours
of the day, both during the growing season and the dry
period for unstable or neutral atmospheric stability con-
ditions This suggests that there was a constant source
of CO2 from the soil unrelated to soil and plant activity
that was released by wind speed and turbulence. It is
likely that the actual rates of CO2 uptake by the ecosys-
tem were large. Indeed, leaf photosynthetic rates of up
to 16 μmol m�2 s�1 of alpha grass plants have been
reported in the area (Pugnaire & Hasse, 1996).
Another somewhat surprising result was the fact
that, in some cases, wind speed seemed to drive CO2
release from the soil only during the day-time but not
during the night-time. The atmospheric stability param-
eter, that estimates the weight of mechanical turbulence
over convective turbulence, explained very well the
lack of response to wind speed at night.
As already mentioned, night-time fluxes were associ-
ated most frequently to stable atmospheric conditions,
when sensible heat fluxes are negative (diurnal temper-
ature oscillations ranged from 25 to 40 °C between day
and night over the dry period) as a result of the thermal
inversion in the vertical profile of the surface layer. The
inversion develops after the rapid cooling of the soil,
through emission of long-wave radiation to the atmo-
sphere which causes lower air masses to subside while
cooling. At the same time, it also determines the devel-
opment of a downward increasing soil temperature
vertical profile. We suggest that the typical thermal
stratification occurring under stable atmospheric condi-
tions constitutes a physical barrier to the release of
large quantities of CO2 at the site, acting both, within
the soil and at the soil-atmosphere interface. In contrast,
Cuerva et al. (2011) attributed the variability of CO2
effluxes observed in Spain over two karstic systems to
the role of relative humidity (high in these environ-
ments near the sea), acting as a membrane or barrier
limiting soil gas exchange. As the authors explained,
adsorption and condensation processes that partially or
completely fill the soil porous system with water can at
times determine the intensity of the processes involved
in gas-phase connections in karstic systems. Although
relative humidity was often high at the study site reach-
ing values near saturation during the early hours of the
morning, the soil water content was very low, particu-
larly during the dry season (less than 5%, well below
saturation values), so it is unlikely that in this case, this
phenomenon explained the diurnal pattern observed in
CO2 release. Furthermore, during the night time, the
flux was kept constant despite large variation in rela-
tive humidity and virtually no changes in SWC. Indeed,
we did not observe any relationship between days with
high relative humidity and CO2 release nor between
nights with low relative humidity and CO2 release.
Under stable atmospheric conditions, wind speed never
induced large CO2 release at night regardless of relative
humidity conditions.
2D Graph 2
NE
CB
( μ
mol
m–2
s–1)
0
1
2
3
DOY126 128 130 132 134 136 138 140
PPT
(mm
)
010203040
Growing season(2008)
ET
(mm
ol m
–2 s–1
)
0.00.20.40.60.81.0
Dry period(2009)
SWC
(m3 m
–3)
0.000.050.100.150.200.250.30
260 262 264 266 268 270 272 274DOY
Fig. 10 Examples of the response of evapotranspiration and net ecosystem carbon balance to precipitation in the growing season and
the dry period. Bars are the daily totals.
© 2011 Blackwell Publishing Ltd, Global Change Biology, 18, 539–554
WIND DRIVES CO2 EXCHANGE IN AN ARID ECOSYSTEM 551

Other times (35% of the cases), night-time conditions
were characterised also by neutral atmospheric stability
when NECB was shown to be responsive to wind
speed, although only after an approximate threshold of
6.5 m s�1 irrespectively of the season of the year. Since
wind was generally weak at night, CO2 effluxes were
also minimal; however infrequent wind speed above
the above mentioned threshold would cause consider-
able fluxes (e.g. Fig. 7, DOY 110).
Wind and rainfall control on NECB
Two major factors caused large CO2 effluxes from the
ecosystem at daily and seasonal scales, wind and rain.
The soil CO2 efflux is the result of CO2 production
within the soil and CO2 transport from the soil to the
atmosphere. Biogenic CO2 is produced by roots (root
respiration), microbes (microbial decomposition), and
soil fauna and were minimal during the dry period
when plant and microbial activity is strongly limited by
water shortage at the site (Rey et al., 2011). Other pro-
cesses that may have produced CO2 are carbonic reac-
tions, rock weathering (Serrano-Ortiz et al., 2010) and
photodegradation that has recently been identified as a
potentially important source of carbon to the atmo-
sphere over the dry period in semiarid regions (Rutl-
edge et al., 2010). However, the fact that we found
wind as a main determinant of CO2 exchange over the
whole year irrespective of radiation, soil water content
or plant activity, suggests other carbon sources present
at the site.
The soil CO2 production occurs mostly at the soil sur-
face and decreases with depth (Rey et al., 2008). CO2
movement in soils occurs through a continuous network
of air-filled pores that connect the surface to deeper lay-
ers. Whereas CO2 transport along the soil profile is
determined primarily by diffusion, CO2 movement in
permeable, dry and fractured sub-soil and its release at
the soil surface are strongly influenced by pressure gra-
dients, gusts and turbulence (de Jong, 1973; Luo & Zhou,
2006). Diurnal changes in soil surface temperature and
velocity fluctuations strongly regulated the diurnal cycle
of soil respiration and consequently of NECB.
The variable pattern and magnitude of the relation-
ship between NECB and wind speed under different
atmospheric stability conditions implies also the role of
convective turbulence, proportional to the sensible heat
flux, in the regulation of CO2 exchange. If a stable atmo-
spheric stratification precludes CO2 effluxes, unstable
atmospheric conditions, characterised by large sensible
heat fluxes are more efficient than neutral conditions at
a given wind speed. This may also explain why under
unstable conditions wind acted as a driver of CO2
effluxes already at 2 m s�1 (in both seasons) while CO2
release became effective at higher wind speed values
under neutral conditions.
Rainfall was also a major driver of CO2 fluxes to the
atmosphere both in the growing season and during the
dry season. High respiratory losses after rainfall events
have often been reported (Rey et al., 2002; Jarvis et al.,
2007) including at the same site where soil moisture
was the sole limiting factor of soil respiration most of
the year (Rey et al., 2011). In addition, the temporal var-
iability of NECB was highly influenced by rainfall since
plant activity coincided with the period of rainfall
events over the autumn and winter months. However,
the interannual variability was not explained by rain-
fall, but instead it was determined by the amount of
CO2 released over the dry period and subsequently by
wind speed.
Possible origin of the CO2 emitted
Although we did not intend to discriminate the source
of carbon to the atmosphere, the results suggest a non-
biological origin of at least part of the CO2 emitted. The
origin of the CO2 stored in the soil, is typically from
organic (root and microbial respiration, which is mini-
mal during the dry period) and inorganic carbon pools.
The fact that large positive fluxes were found over the
dry period when plants are dormant and soil water
content is below 5%, presumably strongly limiting any
microbial activity (Rey et al., 2005), is a strong evidence
suggesting that the CO2 emitted is not from a biological
origin. Kowalski et al. (2008) found large amounts of
CO2 stored in subterranean cavities in an ecosystem
located in a karstic system that found their way out
during the dry period. In contrast with this study, we
also found a strong correlation between NECB and
wind speed over the growing season suggesting a con-
stant CO2 source present also during the active vegeta-
tive period. Accordingly, we further examined the
geological setting of the area and realised that the site is
actually located in correspondence with a large active
tectonic fault system, the Carboneras fault (Reicherter
& Reiss, 2001), belonging to the geothermal-volcanic
basin of Almerıa-Nıjar (Sanz de Galdeano et al., 1985).
Therefore, such a constant source could be related to a
natural degassing of CO2 of geological origin.
The escape of gases from the upper mantle, carbonate
bearing rocks in the crust, and hydrocarbon accumula-
tions, i.e. the degassing by extensional tectonism in sed-
imentary and metamorphic belts, has been identified as
an important source of carbon to the atmosphere (Mor-
ner & Etiope, 2002). It is known that, in general, the
migration of endogenic gases is mainly controlled by
advective processes (pressure gradients) through faults
and fractures (Etiope & Martinelli, 2002) and their
© 2011 Blackwell Publishing Ltd, Global Change Biology, 18, 539–554
552 A. REY et al.
escape to the atmosphere is modulated by wind, baro-
metric pressure changes and turbulence at the soil sur-
face (e.g. Hinkle, 1994). Surface winds and atmospheric
dispersion, in particular, are very effective at diluting
CO2 seepage fluxes (Oldenburg et al., 2003). We have
verified that actually geothermal CO2 occurs in the
groundwater, along the Carboneras fault, a few tens of
kilometres north of Balsablanca (Ceron et al., 1998). Pre-
liminary results of an ongoing study to elucidate the
origin of the CO2 released have shown the presence of13C-enriched CO2 (around –14 & VPDB) either in soil-
air or in groundwater at the study site and nearby hot
springs, respectively, which clearly supports the
hypothesis of a nonbiologic component (either from
shallow carbonates or deeper geothermal fluids). In any
case, the current study highlights the need to account
for other nonbiological sources of CO2 as well as other
main drivers controlling the net CO2 ecosystem carbon
balance in semiarid ecosystems occurring in geological
and geothermal active areas.
To summarise, in this study we hypothesise a new
source of carbon that may confound the biological car-
bon balance resulting from the vegetation activity and
the geochemical processes occurring in carbonate sub-
strates. When ecosystems are located on geothermal
active areas that release ‘geogas’ from deep crust,
upper mantle or thermal aquifers underneath (Etiope,
1999), this gas released may contribute to the NECB
and may confound the eddy covariance estimates
attributed to the ecosystem alone. Other eddy covari-
ance sites may be located in areas where ‘geogas’ mi-
croseepage may release carbon gases (CO2 and
methane in some cases; e.g. Etiope & Klusman, 2010)
that may not be as obvious as at the site under study.
Therefore, the FLUXNET community should be aware
of these fluxes and account for these important sources
that only recently have been included in regional green-
house gas balances (Schulze et al., 2009).
Acknowledgements
This study was funded by the Spanish Ministry of Science, pro-ject CARBOARID (CGL2005-00563), Ministry of Environment(INIA, project SUM2006-00018-C02-0) and Regional AndalucianGovernment (project BACAEMA). Dr Rey was granted a per-sonal Visiting Fellowship ‘Salvador de Madariaga’ by the SpanishMinistry of Science to the CNR Rome and The University of LaSapienza and a Visiting Exchange programme by the SpanishResearch Council (CSIC) and the Andalucian Government tovisit The University of La Tuscia. She also thanks the bilateralprogrammes Acciones Integradas Italy-Spain. She would like tothank Prof. Grace at Edinburgh University for supporting thisresearch in early stages, Prof. Valentini at University of La Tus-cia and Dr Cammarano and Dr Matteucci at the CNR in Rome,for advice with data analysis and interesting discussion on themanuscript. We thank the Cabo de Gata Natural Park for
supporting the research and Dr Kowalski at the University ofGranada for help with the instrumentation setup. The authorsthank two anonymous reviewers for useful comments on themanuscript. This work is dedicated to Emiliano Pegoraro whoenthusiastically planned and worked on this project until thevery last moment.
References
Andrews JA, Schlesinger WH (2001) Soil CO2 dynamics, acidification, and chemical
weathering in a temperate forest with experimental CO2 enrichment. Global Biogeo-
chemical Cycles, 15, 149–162.
Aubinet M, Grelle A, Ibrom A et al. (2000) Estimates of the annual net carbon and
water exchange of forest: the EUROFLUX methodology. Advances in Ecological
Research, 30, 113–175.
Baldocchi DD (2003) Assessing the eddy covariance technique for evaluating carbon
dioxide exchange rates of ecosystems: past, present and future. Global Change Biol-
ogy, 9, 479–492.
Baldocchi DD (2008) Breathing of the terrestrial biosphere: lessons learned from a net-
work of carbon dioxide flux measurement system. Turner Review num. 13. Austra-
lian Journal of Botany, 56, 1–26.
Baldocchi DD, Falge E, Cu L et al. (2001) FLUXNET: a new tool to study the tem-
poral and spatial variability of ecosystem-scale carbon dioxide, water vapor, and
energy flux densities. Bulletin of the American Meteorological, Society, 82, 2415–
2434.
Buchmann N, Schulze ED (1999) Net CO2 and H2O fluxes of terrestrial ecosystems.
Global Biogeochemical Cycles, 13, 751–760.
Castillo-Monroy AP, Maestre FT, Rey A et al. (2011) Biological soil crust microsites
are the main contributor to soil respiration in a semiarid ecosystem. Ecosystems, 14,
835–847.
Ceron JC, Pulido-Bosch A, Sanz de Galdeano C (1998) Isotopic identification of CO2
from a deep origin in thermomineral waters of south-eastern Spain. Chemical Geol-
ogy, 149, 251–258.
Chapin FS III, Woodwell GM, Randerson JT et al. (2006) Reconciling carbon-cycle
concepts, terminology, and methods. Ecosystems, 9, 1040–1050.
Chaves MM (1991) Effects of water deficits on carbon assimilation. Journal of Experi-
mental Botany, 42, 1–16.
Cuerva S, Fernandez-Cortes A, Benavente D et al. (2011) Short-term CO2 exchange
between a shallow karstic cavity and the external atmosphere during summers:
role of the surface soil layer. Atmospheric Environment, 45, 1418–1427.
Emmerich WE (2003) Carbon dioxide fluxes in a semiarid environment with high car-
bonate soils. Agricultural and Forest Meteorology, 116, 91–102.
Etiope G (1999) Subsoil CO2, and CH4 and their advective transfer from faulted grass-
land to the atmosphere. Journal of Geophysical Research, 104, 16889–16894.
Etiope G, Klusman RW (2010) Microseepage in drylands: flux and implications in the
global atmospheric source/sink budget of methane. Global Planetary Change, 72,
265–274.
Etiope G, Martinelli G (2002) Migration of carrier and trace gases in the geosphere: an
overview. Physics of the Earth and Planetary Interiors, 129, 185–204.
Falge E, Baldocchi DD, Olson RJ et al. (2001) Gap filling strategies for defensible
annual sums of net ecosystem exchange. Agricultural and Forest Meteorology, 107,
43–69.
Falge E, Tenhunen J, Baldocchi DD et al. (2002) Phase and amplitude of ecosystem
carbon release and uptake potential as derived from FLUXNET measurements.
Agricultural and Forest Meteorology, 113, 75–95.
Fernandez-Soler JM (1996) El volcanismo calco-alcalino en el Parque Natural de Cabo
de Gata-Nijar (Almerıa). Estudio volcanologico y metrologico. Monografias Medio
Natural, 2, 295.
Field CB, Behrenfeld MJ, Randerson JT et al. (1998) Primary production of the bio-
sphere: integrating terrestrial and oceanic components. Science, 281, 237–240.
Grote EE, Belnap J, Housman DC et al. (2010) Carbon exchange in biological soil crust
communities under differential temperatures and soil water content: implications
for global change. Global Change Biology, 16, 2763–2774.
Hasse P, Pugnaire FI, Clark SC et al. (1999) Environmental control of canopy dynam-
ics and photosynthetic rate in the evergreen tussock grass Stipa tenacissima. Plant
Ecology, 145, 327–339.
Hastings SI, Oechel WC, Muhlia-Melo A (2005) Diurnal, seasonal and annual varia-
tion in the net ecosystem exchange of a desert shrub community (Sarcocaulescent)
in Baja California, Mexico. Global Change Biology, 11, 927–939.
© 2011 Blackwell Publishing Ltd, Global Change Biology, 18, 539–554
WIND DRIVES CO2 EXCHANGE IN AN ARID ECOSYSTEM 553
Hinkle ME (1994) Environmental conditions affecting concentrations of He, CO2, O2
and N2 in soil gases. Applied Geochemistry, 9, 53–63.
Hunt JE, Kelliher FM, Mc Seveny TM et al. (2002) Evaporation and carbon dioxide
exchange between the atmosphere and a tussock grassland during a summer
drought. Agricultural and Forest Meteorology, 111, 65–82.
Hunt JE, Kelliher FM, McSeveny TM et al. (2004) Long-term carbon exchange in a
sparse, seasonally dry tussock grassland. Global Change Biology, 16, 1785–1800.
Huxman TE, Snyder KA, Tissue D et al. (2004) Precipitation pulses and carbon fluxes
in semiarid and arid ecosystems. Oecologia, 141, 254–268.
Jarvis PG, Rey A, Petsikos C et al. (2007) Drying and wetting of soils stimulates decom-
position and carbon dioxide emission: the “Birch Effect”.Tree Physiology, 27, 929–940.
de Jong E (1973) Evidence for significance of other-than-normal diffusion transport in
soil gas exchange – a discussion. Geoderma, 10, 251–253.
Kowalski AS, Serrano-Ortiz P, Janssens IA et al. (2008) Can flux tower research neglect
geochemical CO2 exchange?Agricultural and Forest Meteorology, 148, 1045–1054.
Kuzyakov Y (2006) Sources of CO2 efflux from soil and review of partitioning meth-
ods. Soil, Biology and Biochemistry, 38, 425–448.
Larcher W (1991) Physiological Plant Ecology. Springer-Verlag, Berlin and New York.
Lasslop G, Reichstein M, Papale D et al. (2010) Separation of net ecosystem exchange
into assimilation and respiration using a light response curve approach: critical
issues and global evaluation. Global Change Biology, 16, 187–208.
Le Quere C, Raupach MR, Canadell JG et al. (2009) Trends in the sources and sinks of
carbon dioxide. Nature Geosciences, 2, 831–836.
Li SQ, Asamuna J, Eugster W et al. (2005) Net ecosystem carbon dioxide exchange
over a grazed steppe in central Mongolia. Global Change Biology, 11, 1–15.
Luo Y, Zhou X (2006) Soil Respiration and the Environment. Academic Press/Elsevier,
San Diego, CA.
Luo HL, Oechel WC, Hasting SJ et al. (2007) Mature semiarid chaparral ecosystems
can be a significant sink for atmospheric carbon dioxide. Global Change Biology, 13,
386–396.
Maestre FT, Bowker M, Escolar C et al. (2010) Do biotic interactions modulate ecosys-
tem functioning along abiotic stress gradients? Insights from semi-arid Mediterra-
nean plant and biological soil crust communities. Philosophical Transactions of the
Royal Society, 365, 2057–2070.
McMillen RT (1988) An eddy correlation technique with extended applicability to
non-simple terrain. Boundary Layer Meteorology, 43, 231–245.
Michaelis L, Menten ML (1913) Die Kinetik der Invertinwirkung. Biochemistry Zeitsch-
rift, 49, 333–369.
Midgley GF, Aranibar JN, Mantlana KB et al. (2004) Photosynthetic and gas exchange
characteristics of dominant woody plants on a moisture gradient in an African
savanna. Global Change Biology, 10, 309–317.
Mielnick P, Dugas WA, Mitchell K et al. (2005) Long-term measurements of CO2 flux
and evapotranspiration in a Chihuahuan desert grassland. Journal of Arid Environ-
ments, 60, 423–436.
Morner NA, Etiope G (2002) Carbon degassing from the lithosphere. Global and Plane-
tary Change, 33, 185–203.
Oldenburg CM, Lewicki JL, Hepple RP (2003) Near-surface monitoring strategies for
geologic carbon dioxide storage verification. Lawrence Berkeley National Laboratory
Report LBNL-54089, Lawrence Berkeley National Laboratory, Berkeley, CA,
USA. Available at: http://www.escholarship.org/uc/item/1cg241jb (accessed 26
September 2011).
Papale D, Reichstein M, Aubinet M et al. (2006) Towards a standardized processing
of net ecosystem exchange measured with eddy covariance technique: algorithms
and uncertainty estimation. Biogeosciences, 3, 571–583.
Pugnaire F, Hasse P (1996) Comparative physiology and growth of two perennial tus-
sock grass species in a semi-arid environment. Annals of Botany, 77, 81–86.
Pugnaire FI, Haase P, Clark SC et al. (1996) Response of the tussock grass Stipa
tenacissima to watering in a semiarid environment. Functional Ecology, 10, 265–274.
Reicherter KR, Reiss S (2001) The Carboneras Fault Zone (South-eastern Spain) revis-
ited with ground penetrating radar-Quaternary structural styles from high-resolu-
tion images. Netherland Journal of Geosciences, 80, 129–138.
Reichstein M, Falge E, Baldocchi DD et al. (2005) On the separation of net ecosystem
exchange into assimilation and ecosystem respiration: review and improved algo-
rithm. Global Change Biology, 11, 1–16.
Rey A, Pegoraro E, Tedeschi V et al. (2002) Seasonal variability in soil respiration
and its components in a coppice oak forest in central Italy. Global Change Biology,
8, 1–8.
Rey A, Petsikos C, Jarvis PG et al. (2005) The effect of soil temperature and soil mois-
ture on carbon mineralisation rates in a Mediterranean forest soil. European Journal
of Soil Science, 56, 589–599.
Rey A, Pegoraro E, Jarvis PG (2008) Carbon mineralization rates at different soil
depths across a network of European forest sites (FORCAST). European Journal of
Soil Science, 59, 1049–1062.
Rey A, Pegoraro E, Oyonarte C et al. (2011) Impact of land degradation on soil respi-
ration in a steppe ecosystem in the SE of Spain. Soil Biology and Biochemistry, 43,
393–403.
Rotenberg E, Yakir D (2010) Contribution of semi-arid forests to the climate system.
Science, 22, 451–454.
Rutledge S, Campbell D, Baldocchi DD et al. (2010) Photodegradation leads to
increased CO2 losses from terrestrial organic matter. Global Change Biology, 16,
3065–3074.
Sanchez-Canete EP, Serrano-Ortiz P, Kowalski A et al. (2011) Subterranean CO2 venti-
lation and its role in the net ecosystem carbon balance of a karstic shrubland. Geo-
physical Research Letters, 38, L09802, doi: 10.1029/2011GL047077.
Sanz de Galdeano C, Rodriguez-Fernandez J, Lopez-Garrido AC (1985) A strike-slip
fault corridor within the Alpujarra Mountains (Betic Cordilleras, Spain). Geologi-
sche Rundschau, 74, 641–655.
Schimel DS (2010) Climate. Drylands in the Earth system. Science, 327, 418–419.
Schlesinger WH (1985) The formation of caliche in soils of the Mojave Desert, Califor-
nia. Geochimica et Cosmochima Acta, 49, 57–66.
Schlesinger WH (1991) Climate, environment and ecology. In: Climate Change: Science,
Impacts and Policy. Proceedings of the Second World Climate Conference (eds Jager J,
Ferguson HL), pp. 371–378. Cambridge University Press, San Diego.
Schmid HP (1994) Source areas for scalars and scalar fluxes. Boundary Layer Meteorol-
ogy, 67, 293–318.
Schmid HP (1997) Experimental design for flux measurements: matching scales of
observations and fluxes. Agricultural and Forest Meteorology, 87, 179–200.
Schulze ED, Luyssaert S, Ciais P et al. (2009) Importance of methane and nitrous
oxide for Europe′s greenhouse-gas balance. Nature Geoscience, 2, 842–850.
Scott RL, Huxman TE, Williams DG et al. (2006) Ecohydrological impacts of
woody-plant encroachment: seasonal patterns of water and carbon dioxide
exchange within a semiarid riparian environment. Global Change Biology, 12, 311–
324.
Scott RL, Hamerlynck EP, Jenerette GD et al. (2010) Carbon dioxide exchange in a
semidesert grassland through drought induced vegetation change. Journal of Geo-
physical Research, 115, G03026, doi: 03010.01029/02010JG001348.
Serrano-Ortiz P, Kowalski AS, Domingo F et al. (2008) Consequences of uncertainties
in CO2 density for estimating net ecosystem CO2 exchange by open-path eddy
covariance. Boundary-Layer Meteorology, 126, 209–218.
Serrano-Ortiz P, Domingo F, Cazorla A et al. (2009) Interannual CO2 exchange of a
sparse Mediterranean shrubland on a carbonaceous substrate. Journal of Geophysi-
cal Research, 114, G04015, doi: 10.1029/2009JG000983.
Serrano-Ortiz P, Roland M, Sanchez-Moral S et al. (2010) Hidden, abiotic CO2 flows
and gaseous reservoirs in the terrestrial carbon cycle: review and perspectives.
Agricultural and Forest Meteorology, 150, 321–329.
Webb EK, Pearman GI, Leuning R (1980) Correction of flux measurements for density
effects due to heat and water vapour transfer. Quarterly Journal of the Royal Meteoro-
logical Society, 106, 85–100.
Weijermars R (1991) Geology and tectonics of the Betic Zone, SE Spain. Earth Science
Reviews, 31, 153–236.
Wilczak JM, Oncley SP, Stage SA (2001) Sonic anemometer tilt correction algorithms.
Boundary-Layer Meteorolology, 99, 127–150.
Wilson A (2002) Energy balance closure at FLUXNET sites. Agricultural and Forest
Meteorology, 113, 223–243.
Wohlfahrt G, Fenstermaker LF, Arnone JA III (2008) Large annual net ecosystem CO2
uptake of a Mojave Desert ecosystem. Global Change Biology, 14, 1475–1487.
World Reference Base for Soil Resources (2006) World Soil Resources Reports 103. FAO,
Rome, Italy.
© 2011 Blackwell Publishing Ltd, Global Change Biology, 18, 539–554
554 A. REY et al.