Rainfall, topography and primary production relationships in a semiarid ecosystem
Upload
khangminh22Category
view
2download
0
sustainability
Case Report
Potential Uses of Treated Municipal Wastewater in aSemiarid Region of Mexico
Alfredo Valdes Ramos 1, Elsa N. Aguilera Gonzalez 1, Gloria Tobón Echeverri 2,Luis Samaniego Moreno 3, Lourdes Díaz Jiménez 4 and Salvador Carlos Hernández 4,*
1 Comimsa, Calle Ciencia y Tecnología No. 790, Saltillo 400, 25290 Saltillo, Coahuila, Mexico;[email protected] (A.V.R.); [email protected] (E.N.A.G.)
2 Asociación de Usuarios del Agua de Saltillo, A.C., 25000 Saltillo, Coahuila, Mexico; [email protected] Departamento de Riego y Drenaje, Universidad Autónoma Agraria Antonio Narro, Periférico Luis
Echeverría S/N, 25070 Saltillo, Coahuila, Mexico; [email protected] Cinvestav-Saltillo, SRNyE, Laboratorio de Revaloración de Residuos. Av. Industria Metalúrgica 1062,
Parque Industrial Saltillo-Ramos Arizpe, 25900 Ramos Arizpe, Coahuila, Mexico; [email protected]* Correspondence: [email protected]; Tel.: +52-844-4389600 (ext. 8524)
Received: 31 January 2019; Accepted: 9 April 2019; Published: 12 April 2019�����������������
Abstract: This paper presents an assessment of three potential applications of municipal treatedwastewater in a semiarid region of northern Mexico. The potential applications considered areagriculture, industry, and watering urban green areas. The results indicate that in the best scenario,the maximal application of treated wastewater is 150 L/s for industrial activities. Besides industrialapplications, this scenario would allow farmers and urban green areas to receive 980 L/s and70 L/s of treated wastewater respectively. Other issues and alternatives are also identified. Withthe implementation of this scenario, it is possible to improve the environmental, and even thesocioeconomic conditions, of the study region.
Keywords: wastewater reuse; groundwater depletion; irrigation of green areas; wastewaterin agriculture
1. Introduction
Water is one of the most important resources for promoting socioeconomic and industrialdevelopment of any society. In arid and semiarid regions, water relevance is even more remarkablesince economic activities can be limited by this resource. For example, the kind of agriculture, animalhusbandry, and industry depends directly on the availability of water. Furthermore, the managementof water is essential at all stages: extraction, distribution, wastewater gathering, treatment and use oftreated wastewater.
The utilization of treated wastewater implies benefits and risks as has been shown in manystudies. These benefits include: reducing both stress on water bodies and pollution of freshwater [1];decreasing fertilizer need since treated wastewater contains nutrients available for plants [2]; facilitatingconservation and management of freshwater resources, thus increasing the availability of water forurban use [3] and improving economics since the price of treated water is generally lower thanthat of fresh water [4]. On the other hand, different risks have also been identified. In irrigationapplications, it causes accumulation of chemical and biological contaminants in soil, which affects bothphysicochemical and microbiological properties of the soil, and subsequently its productivity andfertility [5,6]; certain persistent pollutants could also enter the food chain through crops irrigated withtreated water [5]. For some industrial applications, tertiary, and even quaternary, treatment processesshould be included, thus increasing the complexity of the treatment systems and their operation [3,7,8].
Sustainability 2019, 11, 2217; doi:10.3390/su11082217 www.mdpi.com/journal/sustainability
Sustainability 2019, 11, 2217 2 of 23
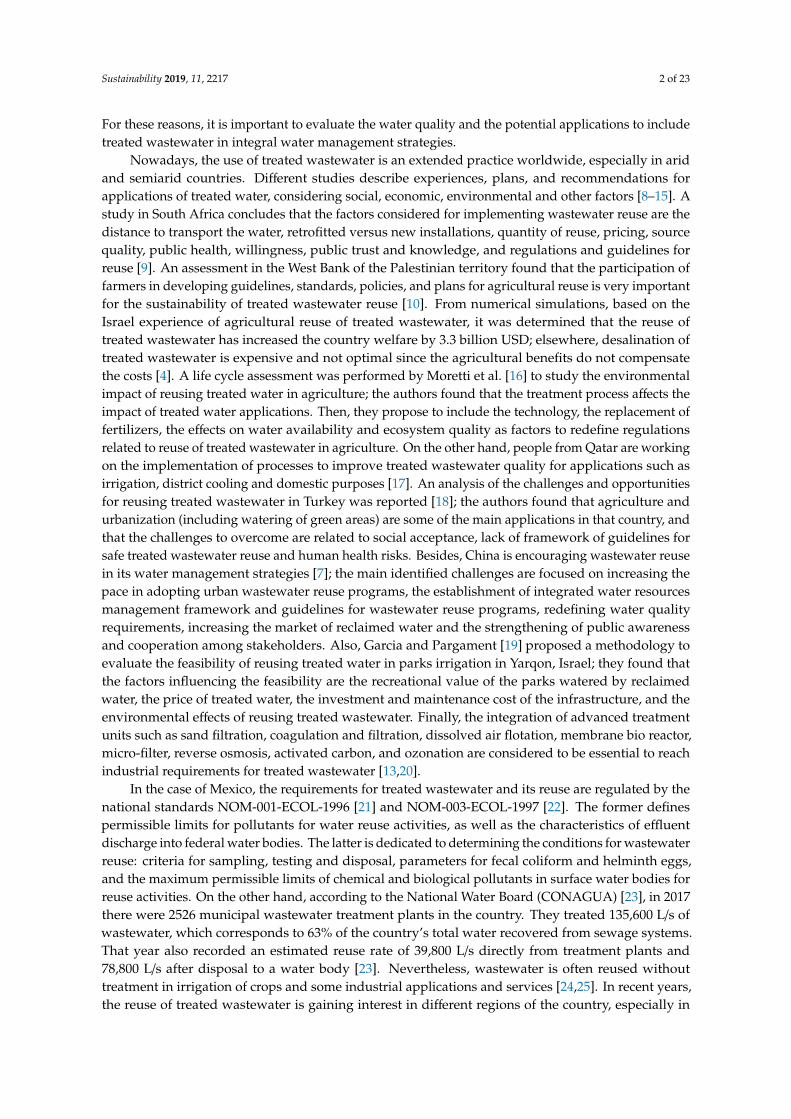
For these reasons, it is important to evaluate the water quality and the potential applications to includetreated wastewater in integral water management strategies.
Nowadays, the use of treated wastewater is an extended practice worldwide, especially in aridand semiarid countries. Different studies describe experiences, plans, and recommendations forapplications of treated water, considering social, economic, environmental and other factors [8–15]. Astudy in South Africa concludes that the factors considered for implementing wastewater reuse are thedistance to transport the water, retrofitted versus new installations, quantity of reuse, pricing, sourcequality, public health, willingness, public trust and knowledge, and regulations and guidelines forreuse [9]. An assessment in the West Bank of the Palestinian territory found that the participation offarmers in developing guidelines, standards, policies, and plans for agricultural reuse is very importantfor the sustainability of treated wastewater reuse [10]. From numerical simulations, based on theIsrael experience of agricultural reuse of treated wastewater, it was determined that the reuse oftreated wastewater has increased the country welfare by 3.3 billion USD; elsewhere, desalination oftreated wastewater is expensive and not optimal since the agricultural benefits do not compensatethe costs [4]. A life cycle assessment was performed by Moretti et al. [16] to study the environmentalimpact of reusing treated water in agriculture; the authors found that the treatment process affects theimpact of treated water applications. Then, they propose to include the technology, the replacement offertilizers, the effects on water availability and ecosystem quality as factors to redefine regulationsrelated to reuse of treated wastewater in agriculture. On the other hand, people from Qatar are workingon the implementation of processes to improve treated wastewater quality for applications such asirrigation, district cooling and domestic purposes [17]. An analysis of the challenges and opportunitiesfor reusing treated wastewater in Turkey was reported [18]; the authors found that agriculture andurbanization (including watering of green areas) are some of the main applications in that country, andthat the challenges to overcome are related to social acceptance, lack of framework of guidelines forsafe treated wastewater reuse and human health risks. Besides, China is encouraging wastewater reusein its water management strategies [7]; the main identified challenges are focused on increasing thepace in adopting urban wastewater reuse programs, the establishment of integrated water resourcesmanagement framework and guidelines for wastewater reuse programs, redefining water qualityrequirements, increasing the market of reclaimed water and the strengthening of public awarenessand cooperation among stakeholders. Also, Garcia and Pargament [19] proposed a methodology toevaluate the feasibility of reusing treated water in parks irrigation in Yarqon, Israel; they found thatthe factors influencing the feasibility are the recreational value of the parks watered by reclaimedwater, the price of treated water, the investment and maintenance cost of the infrastructure, and theenvironmental effects of reusing treated wastewater. Finally, the integration of advanced treatmentunits such as sand filtration, coagulation and filtration, dissolved air flotation, membrane bio reactor,micro-filter, reverse osmosis, activated carbon, and ozonation are considered to be essential to reachindustrial requirements for treated wastewater [13,20].
In the case of Mexico, the requirements for treated wastewater and its reuse are regulated by thenational standards NOM-001-ECOL-1996 [21] and NOM-003-ECOL-1997 [22]. The former definespermissible limits for pollutants for water reuse activities, as well as the characteristics of effluentdischarge into federal water bodies. The latter is dedicated to determining the conditions for wastewaterreuse: criteria for sampling, testing and disposal, parameters for fecal coliform and helminth eggs,and the maximum permissible limits of chemical and biological pollutants in surface water bodies forreuse activities. On the other hand, according to the National Water Board (CONAGUA) [23], in 2017there were 2526 municipal wastewater treatment plants in the country. They treated 135,600 L/s ofwastewater, which corresponds to 63% of the country’s total water recovered from sewage systems.That year also recorded an estimated reuse rate of 39,800 L/s directly from treatment plants and78,800 L/s after disposal to a water body [23]. Nevertheless, wastewater is often reused withouttreatment in irrigation of crops and some industrial applications and services [24,25]. In recent years,the reuse of treated wastewater is gaining interest in different regions of the country, especially in

Sustainability 2019, 11, 2217 3 of 23
the northern and mainly for agricultural activities [26–29]. But in general, the water infrastructuredoes not include reusing systems; in addition, the initiatives to expand the applications of treatedwater are still few. These situations imply important challenges which should be addressed in strengthcollaboration among government, industrialists, academic and social sectors.
The literature review points out the importance of treated wastewater as a new water source.Among the challenges and opportunities in the implementation of strategies for reusing treatedwastewater are the selection of applications, the technical and economic feasibility, the social acceptance,the local regulations and the environmental effects. The contribution of the paper presented here isrelated to the application of the methodology since most of the reviewed papers identify the possibleapplications of treated wastewater and focuses on one of them, e.g., agriculture, industry, urbanization,etc. Few studies have addressed the reuse of reclaimed water on simultaneous applications witha systematic perspective. Thus, the objective of this study is to assess three potential applicationsof treated wastewater in a semiarid region (Saltillo-Ramos Arizpe, Coahuila, Mexico): agriculturalactivities, industrial activities, and irrigation of urban green areas. These applications were selectedbased on their environmental, social, and economic relevance for the region. Agriculture has been ahistorically important activity, but for some years now, conditions for farmers have become worsened(e.g., the weather and reduced availability of water); the re-activation of this activity is important fromsocial and economic viewpoint for the region. Industrial development and promotion require copiousamounts of water. Lastly, urban green areas are an important element for quality of life according tothe World Health Organization (WHO) [30]. Some other non-drinking uses (laundry, cleaning, bathing,flushing toilets, etc.) are excluded since there is not infrastructure to distribute and reuse treated waterat homes and specific buildings, and implementing it becomes too expensive. An additional aim of thepaper is related to the integration and analysis of information and the assessment of potential scenariosfor wastewater treatment. Since this is the first study related to the potential of wastewater in theregion, it could be used as a guide to take decisions concerning the applications of treated wastewater,the kind of enterprises to be installed and even the location of new residential developments. In thiscontext, the analysis presented in the paper is directly related to the compromises of Mexico in theframe of the 2030 Agenda for Sustainable Development [31]. The Goal 6 (ensure availability andsustainable management of water and sanitation for all) includes as third target “to improve waterquality by reducing pollution eliminating, dumping and minimizing release of hazardous chemicalsand materials, halving the proportion of untreated wastewater and substantially increasing recyclingand safe reuse globally”. Then, this work proposes alternatives to contribute to fulfill this target,specifically in relation to the reuse of treated wastewater. Finally, this study allows the local researchesto select the more relevant topics since the main issues of treated wastewater have been identified.
2. Context of the Studied Region
The studied region is located at the southeast of Coahuila, Mexico, and comprises twomunicipalities: Saltillo and Ramos Arizpe (Figure 1). The total landmass is 557,860 ha and includesabout 780,000 inhabitants, most of whom live in urban areas. It is classified as a semiarid region sincethe annual precipitation is 370 mm, the annual average maximal temperature is around 38 ◦C andsome years more than 40 ◦C have been registered (according to data from the National MeteorologicalService). This is one of the most important industrial regions of the country and it is situated at 60 kmof Monterrey, the third-largest metropolis in Mexico.
In past decades, agriculture was one of the main economic activities on the Saltillo–RamosArizpe region. More than 4000 ha were designated to this activity being vegetables and fodderthe main products. This surface represents 0.72% of the landmass of the study region (557,860 ha)and is equivalent to ~15% of the urbanized area in accordance with the development program forthis metropolitan area [32]. The water required was provided from a natural stream called ArroyoLa Encantada, which was essential to the social development of the region. Around 1970, urbanwastewater was disposed of in that natural stream without any treatment. Water pollution caused

Sustainability 2019, 11, 2217 4 of 23
three main consequences: (i) natural recreational areas were lost, (ii) some species of fish disappeared,and (iii) CONAGUA forbade the irrigation of vegetables, and agriculture was reduced to growing onlyfodder crops (fodder oats, fodder barley, grass, sorghum, alfalfa, forage corn) and beans; currently,only around 2500 ha are dedicated to agricultural activities. The total surface water exploitation foragriculture is around 360 L/s [33]. A consequence of the decrease in vegetables production marked thebeginning of a shift in economic activities. Manufacturing of clay-based bricks, and tiles was a relevantsource of employment for people. Presently, this region is the site of the most important industrial parkin Coahuila State and is one of the most economically proficient areas in the country. In agreementwith the records of the National Institute of Statistics, Geography and Informatics (INEGI), more than170 industries are in the study region, consuming around 330 L/s of water [23,34]. New enterprises areestablished each year since the local government promotes industrial development. This implies thecreation of new employment opportunities and a dynamic economy, but it is also associated with anincreasing population and the subsequent need for more services such as energy, water, shopping, andcommunication. On the other side, according to the municipalities, an estimated of 6.6 m2 and 5 m2 ofurban green areas exist per inhabitant in Saltillo and Ramos Arizpe, respectively; however, there islittle information available concerning the amount of water used for irrigation.
Sustainability 2019, 11, x FOR PEER REVIEW 4 of 24
fodder crops (fodder oats, fodder barley, grass, sorghum, alfalfa, forage corn) and beans; currently, only around 2500 ha are dedicated to agricultural activities. The total surface water exploitation for agriculture is around 360 L/s [33]. A consequence of the decrease in vegetables production marked the beginning of a shift in economic activities. Manufacturing of clay-based bricks, and tiles was a relevant source of employment for people. Presently, this region is the site of the most important industrial park in Coahuila State and is one of the most economically proficient areas in the country. In agreement with the records of the National Institute of Statistics, Geography and Informatics (INEGI), more than 170 industries are in the study region, consuming around 330 L/s of water [23,34]. New enterprises are established each year since the local government promotes industrial development. This implies the creation of new employment opportunities and a dynamic economy, but it is also associated with an increasing population and the subsequent need for more services such as energy, water, shopping, and communication. On the other side, according to the municipalities, an estimated of 6.6 m2 and 5 m2 of urban green areas exist per inhabitant in Saltillo and Ramos Arizpe, respectively; however, there is little information available concerning the amount of water used for irrigation.
Figure 1. Geographic location of the study region.
According to official data, the renewable water resources (RWR) per capita is 0.032 L/s [26]; even if this value could fluctuate over the years, it is representative of the region. Water is extracted from four aquifers. In agreement with the data provided by the Secretariat of Environment and Natural Resources (SEMARNAT), three of these aquifers present deficit, as shown in Table 1 [35]. As for RWR, this situation characterizes well the condition of the region in this decade.
Table 1. Water balance of aquifers in the study region.
Aquifer Total Recharge (L/s) Total Discharge (L/s) Balance (L/s) Status Saltillo–Ramos Arizpe 2749.24 2948.69 −199.45 Deficit
Saltillo Sur 415.40 415.40 0.00 − Derramadero Canyon 570.78 904.68 −333.90 Deficit
Zapalinamé 1759.89 2024.99 −265.09 Deficit
On the other hand, the region is home to three municipal wastewater treatment plants (WWTPs), the locations of which are illustrated in Figure 2. The total installed capacity (1430 L/s) of these WWTPs is 1200 L/s, 70 L/s, and 160 L/s, respectively. The Saltillo principal plant (SPP) includes a tertiary system based on reverse osmosis, but it treats only 20 L/s of wastewater.
Figure 1. Geographic location of the study region.
According to official data, the renewable water resources (RWR) per capita is 0.032 L/s [26]; evenif this value could fluctuate over the years, it is representative of the region. Water is extracted fromfour aquifers. In agreement with the data provided by the Secretariat of Environment and NaturalResources (SEMARNAT), three of these aquifers present deficit, as shown in Table 1 [35]. As for RWR,this situation characterizes well the condition of the region in this decade.
Table 1. Water balance of aquifers in the study region.
Aquifer Total Recharge (L/s) Total Discharge (L/s) Balance (L/s) Status
Saltillo–Ramos Arizpe 2749.24 2948.69 −199.45 DeficitSaltillo Sur 415.40 415.40 0.00 −
Derramadero Canyon 570.78 904.68 −333.90 DeficitZapalinamé 1759.89 2024.99 −265.09 Deficit
On the other hand, the region is home to three municipal wastewater treatment plants (WWTPs),the locations of which are illustrated in Figure 2. The total installed capacity (1430 L/s) of these WWTPsis 1200 L/s, 70 L/s, and 160 L/s, respectively. The Saltillo principal plant (SPP) includes a tertiary systembased on reverse osmosis, but it treats only 20 L/s of wastewater.

Sustainability 2019, 11, 2217 5 of 23
Sustainability 2019, 11, x FOR PEER REVIEW 5 of 24
Figure 2. Location of the wastewater treatment plants: 1 Planta Principal de Saltillo (Saltillo principal plant-SPP), 2 Planta del Gran Bosque Urbano (big urban forest plant -BUFP), and 3 Planta Municipal de Ramos Arizpe (Ramos Arizpe municipal plant-RAMP).
3. Methods
The methodology used to perform this study was developed based on reported works. The determination of wastewater quality, the reuse alternatives selection, the social acceptance, the techno-economic feasibility, health and environmental effects, local regulation among other factors are usually considered in the strategies for treated wastewater management [4,7,9,10,36]. Most of these factors were taken into account to adapt reported frameworks to the case of study. A graphical representation of the resulting proposed methodology is divided in five steps; it is introduced in Figure 3 and explained below.
Figure 3. Flow diagram of methodology used in this study.
Step 1. Wastewater Production Analysis
A wastewater balance on the municipal sewage system was performed to determine the production and gathering of wastewater. It was assumed that each inhabitant uses 0.0021 L/s of water and produces 0.0018 L/s of wastewater. These values were estimated based on information from the
Figure 2. Location of the wastewater treatment plants: 1 Planta Principal de Saltillo (Saltillo principalplant-SPP), 2 Planta del Gran Bosque Urbano (big urban forest plant -BUFP), and 3 Planta Municipalde Ramos Arizpe (Ramos Arizpe municipal plant-RAMP).
3. Methods
The methodology used to perform this study was developed based on reported works. Thedetermination of wastewater quality, the reuse alternatives selection, the social acceptance, thetechno-economic feasibility, health and environmental effects, local regulation among other factorsare usually considered in the strategies for treated wastewater management [4,7,9,10,36]. Most ofthese factors were taken into account to adapt reported frameworks to the case of study. A graphicalrepresentation of the resulting proposed methodology is divided in five steps; it is introduced inFigure 3 and explained below.
Sustainability 2019, 11, x FOR PEER REVIEW 5 of 24
Figure 2. Location of the wastewater treatment plants: 1 Planta Principal de Saltillo (Saltillo principal plant-SPP), 2 Planta del Gran Bosque Urbano (big urban forest plant -BUFP), and 3 Planta Municipal de Ramos Arizpe (Ramos Arizpe municipal plant-RAMP).
3. Methods
The methodology used to perform this study was developed based on reported works. The determination of wastewater quality, the reuse alternatives selection, the social acceptance, the techno-economic feasibility, health and environmental effects, local regulation among other factors are usually considered in the strategies for treated wastewater management [4,7,9,10,36]. Most of these factors were taken into account to adapt reported frameworks to the case of study. A graphical representation of the resulting proposed methodology is divided in five steps; it is introduced in Figure 3 and explained below.
Figure 3. Flow diagram of methodology used in this study.
Step 1. Wastewater Production Analysis
A wastewater balance on the municipal sewage system was performed to determine the production and gathering of wastewater. It was assumed that each inhabitant uses 0.0021 L/s of water and produces 0.0018 L/s of wastewater. These values were estimated based on information from the
Figure 3. Flow diagram of methodology used in this study.

Sustainability 2019, 11, 2217 6 of 23
Step 1. Wastewater Production Analysis
A wastewater balance on the municipal sewage system was performed to determine the productionand gathering of wastewater. It was assumed that each inhabitant uses 0.0021 L/s of water and produces0.0018 L/s of wastewater. These values were estimated based on information from the companiesmanaging water resources in the study region as well as from an empirical analysis of the social habitsregarding water consumption in the region. Besides, in situ inspections of the municipal sewagesystems were performed in order to determine the water flow in the region.
Step 2. Characterization of Treated Wastewater
The quality of the treated wastewater was determined by physicochemical and microbiologicalanalyses. The Mexican standards were considered as reference to determine the water quality:NOM-001-ECOL-1996 [21] and NOM-003-ECOL-1997 [22]. Both standards are based on the guidelinesfor using treated wastewater in agriculture developed by the WHO [30]. The methodology and dataobtained were reported previously [37], and the main results are included in Section 4.2 of this paper.
Step 3. Determination of Treated Wastewater Demand
The main applications for treated wastewater, namely agriculture, industrial applications, andurban green areas, were selected based on the environmental, social, and economic relevance for theregion. Agriculture has been a historically important activity, but for some years now, conditions forfarmers have become worsened. Industrial development and promotion require copious amounts ofwater. Lastly, urban green areas are an important element for quality of life according to the WHO [30].The data used to determine treated wastewater volume required for the three applications wereobtained directly from the potential users. With this objective, six ad-hoc workshops were organizedconsidering the next general schedule:
• Opening remarks: workshop introduction, description of the motivation, objectives and daywork dynamics.
• Specific lectures: presentation related to the relevance of treated wastewater reuse in the regionby the team leader. Presentation of experiences in the industry, agriculture or urban greening byinvited people.
• Discussion: discussions related to the water requirement status and expressions of interest fortreated wastewater.
• Survey. The assistants completed a survey to identify the current consumption of fresh waterand treated wastewater as well as to know the perspectives for using treated wastewater. Thequestionnaire is available as Additional Material.
• Closing remarks.
The workshops were organized as follows:
• One industry workshop. An open invitation for industrialists was issued, and personalizedinvitations were sent to the largest industries in the region. This workshop was attended by 17representatives from industries (responsible of operations and people from the administrativedepartment) located at Ramos Arizpe, two from municipal authorities and two from the municipalwater managers. The assistance from industries was lower than expected; however, the largestenterprises in the region were represented. To complement the information, appointments werearranged by phone and the surveys were sent at that moment by email; this allowed the responsibleto collect the required information. The day of the appointment the survey was completed by amember of the authors together with the responsible of the industry. The industries for the surveyapplication were selected based on their size and their main activity.
• Four agriculture workshops. The first workshop was developed by the authors of this paper andmunicipal authorities to design the survey and to organize the other events. The second workshop

Sustainability 2019, 11, 2217 7 of 23
was a work meeting with commissaries of ejidos (communal lands). The third and four workshopswere mainly destined to the survey application, which has been performed as an interview. Thequestionnaire (available as additional material) was answered by 70% of the farmers.
• One urban workshop. Municipal authorities and people from the water management enterpriseswere invited. This workshop was attended by two municipal government representative and fourfrom the management enterprises. All the invited persons were represented in the work journey.
Concerning the application of treated water for urban greening, a virtual analysis using GoogleEarth™ software was performed to identify the number and distribution of green areas in Saltilloand Ramos Arizpe. Also, in situ inspections were conducted to verify the virtual information andidentify the type of vegetation and the status of the green areas. From the obtained information, itwas determined that each hectare of the green areas require 0.9 L/s of water to support vegetation andmaintain adequate living conditions.
Step 4. Scenarios Assessment
Three distribution scenarios were proposed based on the treated wastewater demand. Eachscenario supposes one application as the priority and the other two as secondary necessities. Afterthat, the idea is to supply first the demand on the priority application. The scenarios are called asfollows. Scenario 1: maximal application on agriculture, Scenario 2: maximal application on industry,and Scenario 3: maximal application on urban greening. They were assessed by considering economic,social and environmental factors. Next were the specific criteria to identify the best scenario:
• Coverage of the demand. The larger coverage, the better the scenario. This criterion is selectedsince it is supposed that a larger coverage of the demand implies more benefits related to wateravailability for the proposed applications.
• Cost of implementation. The lower cost and larger revenues, the better the scenario. The criterionis associated to the implementation complexity in terms of investment and money recoveringfrom the sale of treated wastewater. A lower cost was selected since, usually, this increases thepossibility to convince local authorities and stockholders to promote reuse of treated wastewater.
• Environmental protection. The more benefits, the better the scenario. The criterion corresponds toenvironmental benefits such as the protection to ecosystems, effect on water bodies, etc.; this isselected since water has a direct influence on the ecosystems environmental quality.
• Social benefits. The more benefits, the better the scenario. This criterion is selected due to its effecton life quality for farmers and urban inhabitants.
Step 5. Recommendations
Based on the findings on the previous steps, some key aspects for future works are identified andsome recommendations are presented to motivate wastewater reutilization in the region. An importantremark is that the study presented in this paper was limited to the actions described in the next lines:
• The estimation of the investment for infrastructure. Details about characteristics of the technology,costs for equipment and operation were not presented in order to ease the analysis andinterpretation of the included information. At the same time, an estimation of the economic andenvironmental benefits from the sale of wastewater was performed.
• Some other potential applications of treated wastewater such as purification for drinking, firecontrol, car washing, soil compression and non-drinking uses in household activities were notconsidered in this study due to the low volume required on the region for these applications andthe missing of infrastructure. However, it was possible to take them into account for future works.
• A specific assessment of the social acceptability was not performed but it was estimatedfrom surveys applied to farmers and industrialists and from the experience of the watermanagement enterprises.

Sustainability 2019, 11, 2217 8 of 23
4. Results and Discussion
4.1. Wastewater Production Analysis
From the water balance whereby 1322 L/s of wastewater was identified, which corresponds to 82%of the produced amount (Figure 4). The other 18% is lost through pipe leakages, evaporation, non-returnwater and irregular practices. An important remark is that non-treated wastewater represents 30%(400 L/s) of the returned water; this is due mainly to the incompleteness of the sewage systems and thenit is directly discharged on natural streams. This situation induces environmental and human healthimpacts. Due to the temperature of the region, polluted water could cause insect proliferation inducinghuman health risks. Besides, untreated wastewater on natural streams promotes eutrophicationaffecting aquatic biodiversity, even at the microorganism level [38]. Also, wastewater containspotentially harmful pathogens, antibiotic resistant bacteria and even toxic or biologically disruptivechemicals, which could affect human health for exposed population, as reported in Contreras et al. [39].Besides, emerging pollutants, such as pharmaceuticals, personal care products, hormones and othersare being detected in urban wastewater; these pollutants increase the risk of diseases [40].
Sustainability 2019, 11, x FOR PEER REVIEW 8 of 24
From the water balance whereby 1322 L/s of wastewater was identified, which corresponds to 82% of the produced amount (Figure 4). The other 18% is lost through pipe leakages, evaporation, non-return water and irregular practices. An important remark is that non-treated wastewater represents 30% (400 L/s) of the returned water; this is due mainly to the incompleteness of the sewage systems and then it is directly discharged on natural streams. This situation induces environmental and human health impacts. Due to the temperature of the region, polluted water could cause insect proliferation inducing human health risks. Besides, untreated wastewater on natural streams promotes eutrophication affecting aquatic biodiversity, even at the microorganism level [38]. Also, wastewater contains potentially harmful pathogens, antibiotic resistant bacteria and even toxic or biologically disruptive chemicals, which could affect human health for exposed population, as reported in Contreras et al., [39]. Besides, emerging pollutants, such as pharmaceuticals, personal care products, hormones and others are being detected in urban wastewater; these pollutants increase the risk of diseases [40].
Figure 4. Water balance in the study region.
On the other hand, municipal plants treat 66% (872 L/s) and private plants treat 4% (50 L/s) of the returned wastewater. The reuse of treated water represents 4.5% of the effluent from the municipal WWTP. This amount is like the corresponding in Monterrey (4%) and not too far from the one of Mexico City (10%). However, in Saltillo and Ramos Arizpe, this volume of reuse is low since the region is semi-arid and presents water scarcity. This situation represents important opportunities. In fact, due to the total installed capacity, it is possible to treat all the produced wastewater and then to increase the available volume to supply treated water to different applications as done in Mexico City.
4.2. Wastewater Characteristics
The parameters considered in determining the quality of treated wastewater from the three WWTPs are presented in Table 2. The guidelines proposed by the Food and Agriculture Organization (FAO) and by the United States Environmental Protection Agency (USEPA) are included for comparison purposes.
Elevated conductivity is mainly due to salts and can cause corrosion or encrustation on metallic surfaces. This affects the operation of industrial and domestic equipment such as boilers, pipelines, flushing mechanisms, washing machines, and others. In addition, water with high conductivity could negatively affect vegetal species and even cause the elimination of desirable plants. The SPP and big urban forest plant (BUFP) produce better treated water than the Ramos Arizpe municipal plant (RAMP) with respect to conductivity. The value obtained from the RAMP could limit the use of that treated water for industrial applications [13]. Nevertheless, it is possible to use tertiary
Figure 4. Water balance in the study region.
On the other hand, municipal plants treat 66% (872 L/s) and private plants treat 4% (50 L/s) of thereturned wastewater. The reuse of treated water represents 4.5% of the effluent from the municipalWWTP. This amount is like the corresponding in Monterrey (4%) and not too far from the one ofMexico City (10%). However, in Saltillo and Ramos Arizpe, this volume of reuse is low since the regionis semi-arid and presents water scarcity. This situation represents important opportunities. In fact, dueto the total installed capacity, it is possible to treat all the produced wastewater and then to increase theavailable volume to supply treated water to different applications as done in Mexico City.
4.2. Wastewater Characteristics
The parameters considered in determining the quality of treated wastewater from the three WWTPsare presented in Table 2. The guidelines proposed by the Food and Agriculture Organization (FAO) andby the United States Environmental Protection Agency (USEPA) are included for comparison purposes.

Sustainability 2019, 11, 2217 9 of 23
Table 2. Characterization of treated wastewater.
Parameter SPP BUFP RAMP NOM WHO 3
(FAO) 4 USEPA 5
BOD5 (mg/L) 30 6 30 150 1 (20, 30) 2 - 30TSS (mg/L) 19 4 8 150 1 (20, 30) 2 - 30
pH 7.4–8.0 7.1–8.0 6.3–7.5 (6.5–8) 6.5–8.5Conductivity (dS/m) 1.724 1.336 2.250 - (0.7–3) 0.7–3
Fecal coliforms (MPN/100 mL) 500 240 200 (240, 1000) 2 1000 200Helminth eggs (HH/L) 0 0 0 1 1 (1, 5) 2 1 1
Fat and grease <15 <15 10 (15, 15) 2 - -Nitrogen (mg/L) <40 <40 26.7 40 1 (5–30) 5–30
Phosphorous (mg/L) <20 <20 6.89 20 1 - -Heavy metals
Arsenic (mg/L) <0.2 <0.2 <0.2 0.2 1 (0.1) 0.1Cadmium (mg/L) <0.5 <0.5 <0.5 0.2 1 (0.01) 0.01Cyanide (mg/L) <2.0 <2.0 <2.0 1 1 - -Copper (mg/L) <4 <4 <4 4 1 (0.2) 0.2
Chromium (mg/L) <0.5 <0.5 <0.5 1 1 (0.1) 0.1Mercury (mg/L) <0.005 <0.005 <0.005 0.01 1 - -Nickel (mg/L) <2 <2 <2 2 1 (0.2) 0.2Lead (mg/L) <0.5 <0.5 <0.5 0.5 1 5 6 5 6
Zinc (mg/L) <10 <10 <10 10 1 (2) 2
SPP: Saltillo Principal Plant, BUFP: Big Urban Forest Plant, RAMP: Ramos Arizpe Municipal Plant, NOM: MexicanStandard, WHO: World Health Organization, FAO: Food and Agriculture Organzation, USEPA: United StatesEnvironmental Protection Agency. 1 NOM-001-ECOL-1996. 2 NOM-003-ECOL-1997 (human direct contact,human indirect contact). 3 Health guidelines for the use of wastewater in agriculture and aquaculture of theWHO. 4 Wastewater treatment and use in agriculture—FAO. 5 2012 Guidelines for Water Reuse of the USEPA.6 For irrigation.
Elevated conductivity is mainly due to salts and can cause corrosion or encrustation on metallicsurfaces. This affects the operation of industrial and domestic equipment such as boilers, pipelines,flushing mechanisms, washing machines, and others. In addition, water with high conductivitycould negatively affect vegetal species and even cause the elimination of desirable plants. The SPPand big urban forest plant (BUFP) produce better treated water than the Ramos Arizpe municipalplant (RAMP) with respect to conductivity. The value obtained from the RAMP could limit theuse of that treated water for industrial applications [13]. Nevertheless, it is possible to use tertiarytreatment processes, such as reverse osmosis, stabilization ponds, and membrane bioreactors, amongothers [41,42]. Furthermore, it has been reported that for specific industrial processes, some pollutantscould produce positive impacts [43]; freshwater replaced by wastewater (from a process producingmethanol) employing a mass flow exchange technique. This improves the absorption capacity of thestudied system; even if it is a very particular application, the methodology could be adapted to localconditions in semiarid regions.
Fecal coliform content is one of the main parameters that determines the viability of applyingtreated water to water food crops [44–47]. The presence of fecal coliform content does not restrictindustrial applications; however, treated water should have a minimal content. The SPP effluentdoes not fulfill the standard for urban greening in applications of direct human contact. But, thethree WWTPs fulfill the official standard of this parameter, which is 1000 MPN/100 mL. Biologicaloxygen demand (BOD) is an index of the presence of organic material in the treated water. The officialregulations state that the maximal permissible levels of organic pollutants in treated wastewater usedfor public services with indirect human contact must be less than 30 mg BOD/L and 20 mg BOD/L fordirect human contact. As such, for direct contact applications, only the BUFP fulfills the respectivestandard. However, the three effluent streams are suitable for agricultural activities and green areaswith indirect contact. Finally, the three WWTPs fulfill the permissible limits for total suspended solids(TSS). The SPP effluent has 19 mg/L, which could be restrictive for some applications. At present, a

Sustainability 2019, 11, 2217 10 of 23
tertiary treatment based on reverse osmosis decreases this parameter to 10 mg/L in the SPP; 20 L/s istreated in this way, and this volume is sold to an industry located about the SPP.
The treated wastewater fulfills the Mexican standards and most of the WHO, FAO and USEPAguidelines. Then, it can be deduced that the produced wastewater in the region is feasible to be reusedin several applications such as crops irrigation, green urban watering, laundry, cleaning, water bodiesrecharge, household applications and even some industrial processes.
4.3. Identification of Treated Wastewater Demand
4.3.1. Agriculture Sector
From the agriculture workshops, the current situation of agriculture sector was identified directlyfrom farmers. The main data of agriculture in the region are presented in Table 3.
Table 3. Highlights of the agriculture activities in the study region.
Description Amount Observations
Water flow in La Encantada ~1100 L/s Discharged from SPP and RAMP, untreatedhousehold wastewater, and industries
Concessions ~360 L/s Surface water exploitation
Land surface >4000 ha Available for agriculture
Active surface ~2500 ha Used to raise fodder crops (fodder oats, fodderbarley, grass, sorghum, alfalfa, and forage)
Production 5000 ton Crop yield: ~3.6 ton/ha
Production/water yield 0.13 kg/m3 Low production yield
Revenues 660,000 USD Economic yield: 133 USD/ton
Acceptance of treated wastewater ~70% Farmers expressed the willingness to integratean irrigation unit around La Encantada
The water flow in the Arroyo La Encantada was estimated based on measurements at differentpoints of width and depth of the water source, as well as the superficial speed of water, androughness [48]. It is worthwhile to remark that ninety percent of the flow rate is used for agricultureand farming without any control, leading to low efficiency and productivity. Another important remarkconcerns the concessions for surface water exploitation which reach only 11,400,000 m3/year (~360 L/s);this volume is less than 20% of the water required for fodder crops in a similar area. Assuming allthe available area was used to grow fodder plants, a water deficit of ~57 Mm3/year (~1800 L/s) isestimated. This value exceeds 100% of the wastewater volume generated in Saltillo and Ramos Arizpe.That means agricultural activities could easily utilize the entire effluent volume released by the threemunicipal WWTPs.
On the other hand, the low production yield could be due to the low efficiency of wateringtechniques and large leakages in the water conduction system owing to unlined canals. Besides, theeconomic yield is directly associated to the kind of crops. The farmers expressed their willingnessto raise crops with higher value which could increase revenues. It is worth mentioning that in otherregions of Mexico and other areas around the world that experience similar weather, the productionyields of fodder crops such as alfalfa, fodder oats, and fodder flower exceed 12 ton/ha [49–55]. As such,the results of the current study shed light on the need to improve the treated wastewater distributionsystem that supplies water to agricultural areas and to use better irrigation techniques. Implementingthese actions would help increase the production yield. If the product/surface relationship reaches10 ton/ha, the fodder production of the Ramos Arizpe region could rise to 13,730 ton, with a globalvalue of almost thrice the current production.
Sustainability 2019, 11, 2217 11 of 23
4.3.2. Industrial Sector
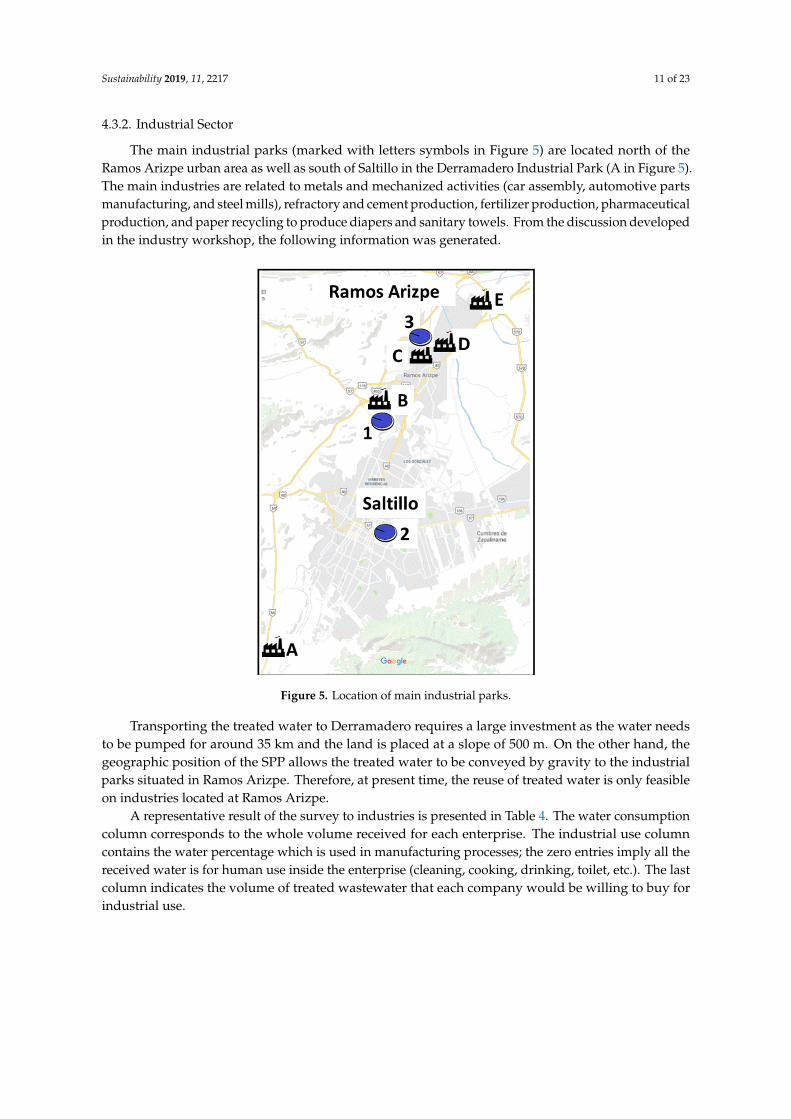
The main industrial parks (marked with letters symbols in Figure 5) are located north of theRamos Arizpe urban area as well as south of Saltillo in the Derramadero Industrial Park (A in Figure 5).The main industries are related to metals and mechanized activities (car assembly, automotive partsmanufacturing, and steel mills), refractory and cement production, fertilizer production, pharmaceuticalproduction, and paper recycling to produce diapers and sanitary towels. From the discussion developedin the industry workshop, the following information was generated.Sustainability 2019, 11, x FOR PEER REVIEW 12 of 24
Figure 5. Location of main industrial parks.
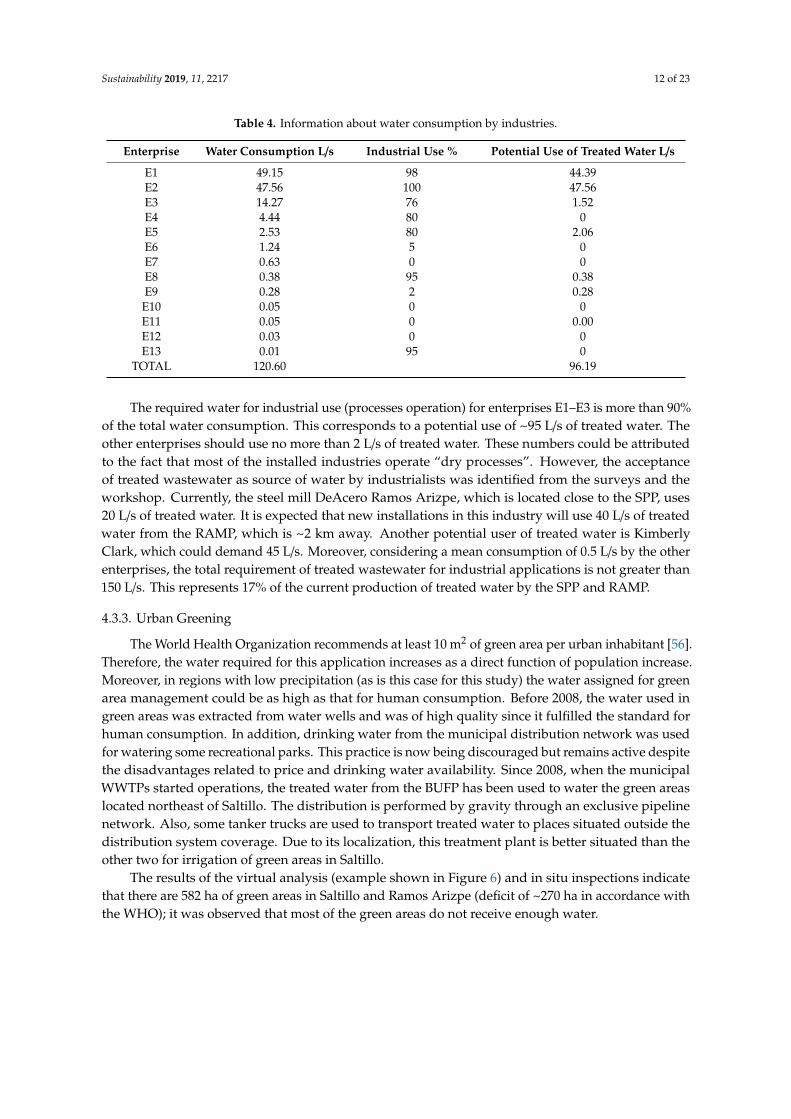
Table 4. Information about water consumption by industries.
Enterprise Water Consumption L/s Industrial Use % Potential Use of Treated Water L/s E1 49.15 98 44.39 E2 47.56 100 47.56 E3 14.27 76 1.52 E4 4.44 80 0 E5 2.53 80 2.06 E6 1.24 5 0 E7 0.63 0 0 E8 0.38 95 0.38 E9 0.28 2 0.28
E10 0.05 0 0 E11 0.05 0 0.00 E12 0.03 0 0 E13 0.01 95 0
TOTAL 120.60 96.19
The required water for industrial use (processes operation) for enterprises E1–E3 is more than 90% of the total water consumption. This corresponds to a potential use of ~95 L/s of treated water. The other enterprises should use no more than 2 L/s of treated water. These numbers could be attributed to the fact that most of the installed industries operate “dry processes.” However, the acceptance of treated wastewater as source of water by industrialists was identified from the surveys and the workshop. Currently, the steel mill DeAcero Ramos Arizpe, which is located close to the SPP, uses 20 L/s of treated water. It is expected that new installations in this industry will use 40 L/s of treated water from the RAMP, which is ~2 km away. Another potential user of treated water is Kimberly Clark, which could demand 45 L/s. Moreover, considering a mean consumption of 0.5 L/s by the other enterprises, the total requirement of treated wastewater for industrial applications is not
Figure 5. Location of main industrial parks.
Transporting the treated water to Derramadero requires a large investment as the water needsto be pumped for around 35 km and the land is placed at a slope of 500 m. On the other hand, thegeographic position of the SPP allows the treated water to be conveyed by gravity to the industrialparks situated in Ramos Arizpe. Therefore, at present time, the reuse of treated water is only feasibleon industries located at Ramos Arizpe.
A representative result of the survey to industries is presented in Table 4. The water consumptioncolumn corresponds to the whole volume received for each enterprise. The industrial use columncontains the water percentage which is used in manufacturing processes; the zero entries imply all thereceived water is for human use inside the enterprise (cleaning, cooking, drinking, toilet, etc.). The lastcolumn indicates the volume of treated wastewater that each company would be willing to buy forindustrial use.
Sustainability 2019, 11, 2217 12 of 23
Table 4. Information about water consumption by industries.
Enterprise Water Consumption L/s Industrial Use % Potential Use of Treated Water L/s
E1 49.15 98 44.39E2 47.56 100 47.56E3 14.27 76 1.52E4 4.44 80 0E5 2.53 80 2.06E6 1.24 5 0E7 0.63 0 0E8 0.38 95 0.38E9 0.28 2 0.28E10 0.05 0 0E11 0.05 0 0.00E12 0.03 0 0E13 0.01 95 0
TOTAL 120.60 96.19
The required water for industrial use (processes operation) for enterprises E1–E3 is more than 90%of the total water consumption. This corresponds to a potential use of ~95 L/s of treated water. Theother enterprises should use no more than 2 L/s of treated water. These numbers could be attributedto the fact that most of the installed industries operate “dry processes”. However, the acceptanceof treated wastewater as source of water by industrialists was identified from the surveys and theworkshop. Currently, the steel mill DeAcero Ramos Arizpe, which is located close to the SPP, uses20 L/s of treated water. It is expected that new installations in this industry will use 40 L/s of treatedwater from the RAMP, which is ~2 km away. Another potential user of treated water is KimberlyClark, which could demand 45 L/s. Moreover, considering a mean consumption of 0.5 L/s by the otherenterprises, the total requirement of treated wastewater for industrial applications is not greater than150 L/s. This represents 17% of the current production of treated water by the SPP and RAMP.
4.3.3. Urban Greening
The World Health Organization recommends at least 10 m2 of green area per urban inhabitant [56].Therefore, the water required for this application increases as a direct function of population increase.Moreover, in regions with low precipitation (as is this case for this study) the water assigned for greenarea management could be as high as that for human consumption. Before 2008, the water used ingreen areas was extracted from water wells and was of high quality since it fulfilled the standard forhuman consumption. In addition, drinking water from the municipal distribution network was usedfor watering some recreational parks. This practice is now being discouraged but remains active despitethe disadvantages related to price and drinking water availability. Since 2008, when the municipalWWTPs started operations, the treated water from the BUFP has been used to water the green areaslocated northeast of Saltillo. The distribution is performed by gravity through an exclusive pipelinenetwork. Also, some tanker trucks are used to transport treated water to places situated outside thedistribution system coverage. Due to its localization, this treatment plant is better situated than theother two for irrigation of green areas in Saltillo.
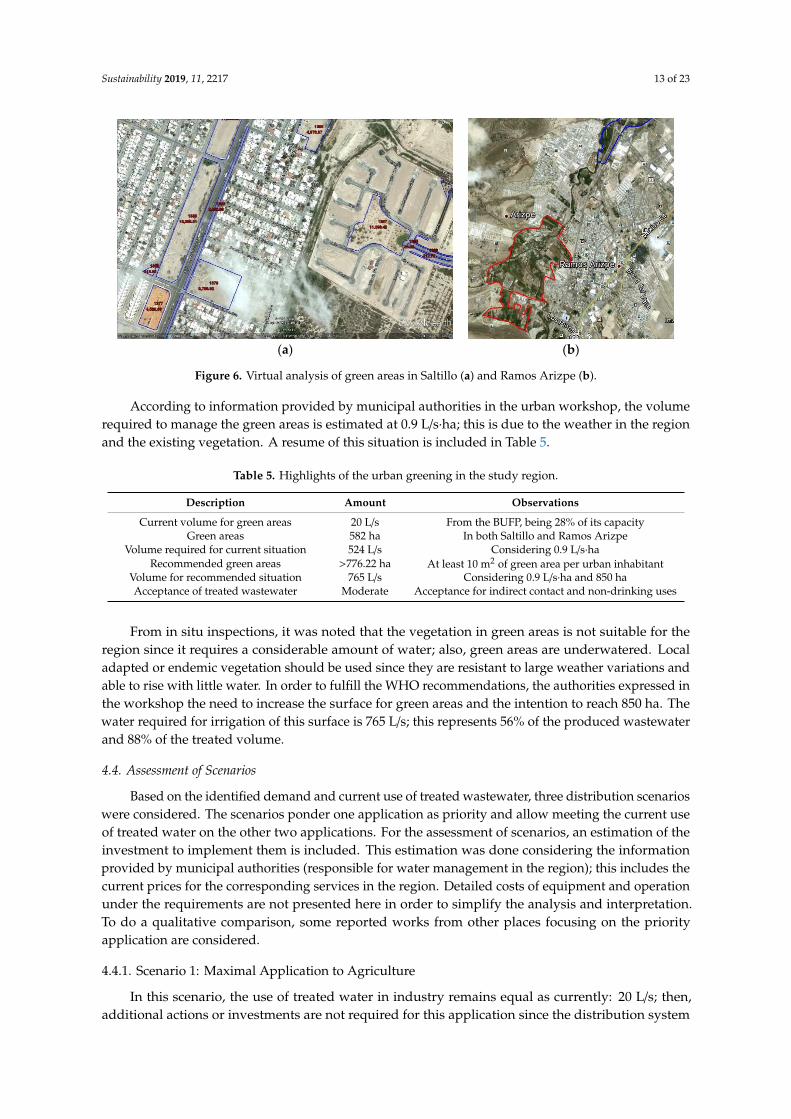
The results of the virtual analysis (example shown in Figure 6) and in situ inspections indicatethat there are 582 ha of green areas in Saltillo and Ramos Arizpe (deficit of ~270 ha in accordance withthe WHO); it was observed that most of the green areas do not receive enough water.
Sustainability 2019, 11, 2217 13 of 23
Sustainability 2019, 11, x FOR PEER REVIEW 13 of 24
greater than 150 L/s. This represents 17% of the current production of treated water by the SPP and RAMP.
4.3.3. Urban Greening
The World Health Organization recommends at least 10 m2 of green area per urban inhabitant [56]. Therefore, the water required for this application increases as a direct function of population increase. Moreover, in regions with low precipitation (as is this case for this study) the water assigned for green area management could be as high as that for human consumption. Before 2008, the water used in green areas was extracted from water wells and was of high quality since it fulfilled the standard for human consumption. In addition, drinking water from the municipal distribution network was used for watering some recreational parks. This practice is now being discouraged but remains active despite the disadvantages related to price and drinking water availability. Since 2008, when the municipal WWTPs started operations, the treated water from the BUFP has been used to water the green areas located northeast of Saltillo. The distribution is performed by gravity through an exclusive pipeline network. Also, some tanker trucks are used to transport treated water to places situated outside the distribution system coverage. Due to its localization, this treatment plant is better situated than the other two for irrigation of green areas in Saltillo.
The results of the virtual analysis (example shown in Figure 6) and in situ inspections indicate that there are 582 ha of green areas in Saltillo and Ramos Arizpe (deficit of ~270 ha in accordance with the WHO); it was observed that most of the green areas do not receive enough water.
(a) (b)
Figure 6. Virtual analysis of green areas in Saltillo (a) and Ramos Arizpe (b).
According to information provided by municipal authorities in the urban workshop, the volume required to manage the green areas is estimated at 0.9 L/s∙ha; this is due to the weather in the region and the existing vegetation. A resume of this situation is included in Table 5.
Table 5. Highlights of the urban greening in the study region.
Description Amount Observations Current volume for green areas 20 L/s From the BUFP, being 28% of its capacity
Green areas 582 ha In both Saltillo and Ramos Arizpe Volume required for current situation 524 L/s Considering 0.9 L/s∙ha
Recommended green areas >776.22 ha At least 10 m2 of green area per urban inhabitant Volume for recommended situation 765 L/s Considering 0.9 L/s∙ha and 850 ha Acceptance of treated wastewater Moderate Acceptance for indirect contact and non-drinking uses
From in situ inspections, it was noted that the vegetation in green areas is not suitable for the region since it requires a considerable amount of water; also, green areas are underwatered. Local adapted or endemic vegetation should be used since they are resistant to large weather variations
Figure 6. Virtual analysis of green areas in Saltillo (a) and Ramos Arizpe (b).
According to information provided by municipal authorities in the urban workshop, the volumerequired to manage the green areas is estimated at 0.9 L/s·ha; this is due to the weather in the regionand the existing vegetation. A resume of this situation is included in Table 5.
Table 5. Highlights of the urban greening in the study region.
Description Amount Observations
Current volume for green areas 20 L/s From the BUFP, being 28% of its capacityGreen areas 582 ha In both Saltillo and Ramos Arizpe
Volume required for current situation 524 L/s Considering 0.9 L/s·haRecommended green areas >776.22 ha At least 10 m2 of green area per urban inhabitant
Volume for recommended situation 765 L/s Considering 0.9 L/s·ha and 850 haAcceptance of treated wastewater Moderate Acceptance for indirect contact and non-drinking uses
From in situ inspections, it was noted that the vegetation in green areas is not suitable for theregion since it requires a considerable amount of water; also, green areas are underwatered. Localadapted or endemic vegetation should be used since they are resistant to large weather variations andable to rise with little water. In order to fulfill the WHO recommendations, the authorities expressed inthe workshop the need to increase the surface for green areas and the intention to reach 850 ha. Thewater required for irrigation of this surface is 765 L/s; this represents 56% of the produced wastewaterand 88% of the treated volume.
4.4. Assessment of Scenarios
Based on the identified demand and current use of treated wastewater, three distribution scenarioswere considered. The scenarios ponder one application as priority and allow meeting the current useof treated water on the other two applications. For the assessment of scenarios, an estimation of theinvestment to implement them is included. This estimation was done considering the informationprovided by municipal authorities (responsible for water management in the region); this includes thecurrent prices for the corresponding services in the region. Detailed costs of equipment and operationunder the requirements are not presented here in order to simplify the analysis and interpretation.To do a qualitative comparison, some reported works from other places focusing on the priorityapplication are considered.
4.4.1. Scenario 1: Maximal Application to Agriculture
In this scenario, the use of treated water in industry remains equal as currently: 20 L/s; then,additional actions or investments are not required for this application since the distribution system
Sustainability 2019, 11, 2217 14 of 23
is installed and operating. It is worthwhile to mention that the treated water is sold and generatesrevenues of ~170,000 USD. On the other hand, since the BUFP is far away from the agriculture zone,this scenario considers the whole effluent from BUFP (70 L/s) to be applied for the watering of greenurban areas. Presently, only 17 L/s is used for this application; the actual distribution system wouldhave to be extended in order to use the whole treated volume. Distribution with tanker trucks iscurrently done. However, it seems to be expensive, inefficient, and even negative for the environment:the trucks receive little maintenance, large volume of water is lost in the distribution, they use fossilfuels and then usually produce a large amount of CO2 emissions. Finally, the other 1100 L/s should bedestined to farmers. At present time, there are 35 km of unlined distribution canals to carry the waterto the communal farms.
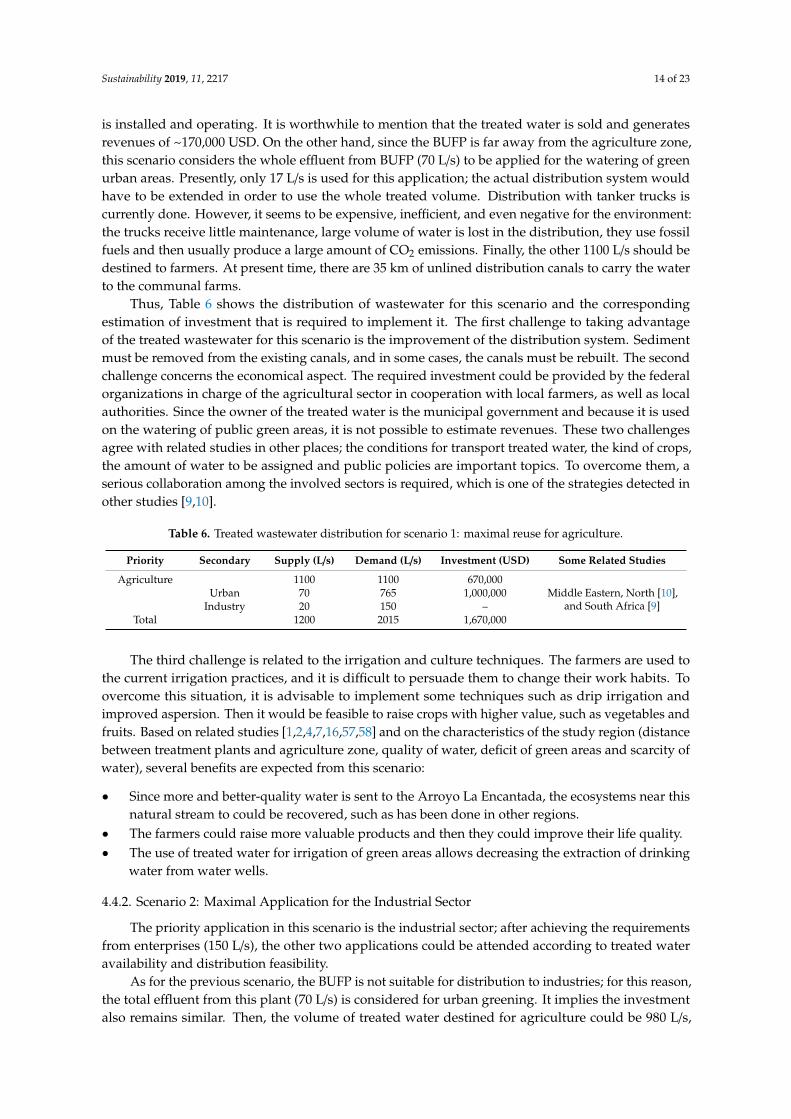
Thus, Table 6 shows the distribution of wastewater for this scenario and the correspondingestimation of investment that is required to implement it. The first challenge to taking advantageof the treated wastewater for this scenario is the improvement of the distribution system. Sedimentmust be removed from the existing canals, and in some cases, the canals must be rebuilt. The secondchallenge concerns the economical aspect. The required investment could be provided by the federalorganizations in charge of the agricultural sector in cooperation with local farmers, as well as localauthorities. Since the owner of the treated water is the municipal government and because it is usedon the watering of public green areas, it is not possible to estimate revenues. These two challengesagree with related studies in other places; the conditions for transport treated water, the kind of crops,the amount of water to be assigned and public policies are important topics. To overcome them, aserious collaboration among the involved sectors is required, which is one of the strategies detected inother studies [9,10].
Table 6. Treated wastewater distribution for scenario 1: maximal reuse for agriculture.
Priority Secondary Supply (L/s) Demand (L/s) Investment (USD) Some Related Studies
Agriculture 1100 1100 670,000Middle Eastern, North [10],
and South Africa [9]Urban 70 765 1,000,000
Industry 20 150 –Total 1200 2015 1,670,000
The third challenge is related to the irrigation and culture techniques. The farmers are used tothe current irrigation practices, and it is difficult to persuade them to change their work habits. Toovercome this situation, it is advisable to implement some techniques such as drip irrigation andimproved aspersion. Then it would be feasible to raise crops with higher value, such as vegetables andfruits. Based on related studies [1,2,4,7,16,57,58] and on the characteristics of the study region (distancebetween treatment plants and agriculture zone, quality of water, deficit of green areas and scarcity ofwater), several benefits are expected from this scenario:
• Since more and better-quality water is sent to the Arroyo La Encantada, the ecosystems near thisnatural stream to could be recovered, such as has been done in other regions.
• The farmers could raise more valuable products and then they could improve their life quality.• The use of treated water for irrigation of green areas allows decreasing the extraction of drinking
water from water wells.
4.4.2. Scenario 2: Maximal Application for the Industrial Sector
The priority application in this scenario is the industrial sector; after achieving the requirementsfrom enterprises (150 L/s), the other two applications could be attended according to treated wateravailability and distribution feasibility.
As for the previous scenario, the BUFP is not suitable for distribution to industries; for this reason,the total effluent from this plant (70 L/s) is considered for urban greening. It implies the investmentalso remains similar. Then, the volume of treated water destined for agriculture could be 980 L/s,

Sustainability 2019, 11, 2217 15 of 23
which represents almost 90% of the volume considered in scenario 1 for this application; however,the corresponding investment remains similar since the maintenance of canals is required. Table 7illustrates the respective distribution of treated wastewater.
Table 7. Treated wastewater distribution in scenario 2: maximal reuse in industries.
Priority Secondary Supply (L/s) Demand (L/s) Investment (USD) Related Studies
Industry 150 150 9,500,000Iran [13] Spain [8],
Jordan [14], Qatar [17]Agriculture 980 1100 670,000
Urban 70 765 1,000,000Total 1200 2015 11,170,000
Kimberly Clark is the main potential customer of treated water, since they expressed the intentionto use 45 L/s. There are two options to providing this volume: (i) from the SPP, and (ii) from theRAMP. The first alternative produces water with high quality but requires the construction of a pipelinesystem 14 km long. An advantage of this choice is that some other users could be supplied from thesame pipeline. The second option requires a 5 km pipeline; however, the treated water has a highconcentration of solids and could require a tertiary treatment, thus influencing the final price. Thesecond big customer is the new building of the DeAcero steel mill which is 1.6 km from the RAMP.This enterprise and the local authorities have signed an agreement to provide 40 L/s of treated water tothe steel mill. The enterprise is responsible for the construction of the distribution lines; the signedagreement stipulates that after some years the infrastructure will be given to the municipality.
It is important to remark that the quality of treated wastewater for industries depends on thekind of processes where the water is applied; in some cases, high quality is required and then, tertiarytreatments should be implemented [8,13,20]. The big industries operating in the study region requirestertiary treatment due to conductivity and even fecal coliforms content. However, most of industriesuse dry processes; then, the treated water could be used for other applications. Then, it is important toinvestigate particular specifications and tropicalize either methods or technology. Besides, even if themain industrial application of treated water in Mexico City is cooling, this is a good example for thestudy region; in addition, the sold of treated water represent good revenues in Monterrey, therefore, itis advisable to adapt its methodology which includes low price and fiscal benefits.
A challenge identified for this scenario is to persuade enterprises to use treated water and toconsolidate the ones which expressed their interest in the industry workshop. This could be done ifthe government states directives for the industrial sector related to the need to reuse the treated water.Besides, scenario 2 includes the environmental and social benefits identified for the first scenario;besides, economic advantages are forecasted: the treated water can be sold to enterprises, whichimplies revenues for the municipalities. It is worth mentioning that the price of the treated watershould be comparable to the current cost of the water used by the enterprise, which is estimated as~0.50 USD/m3. Furthermore, an additional environmental benefit is identified: the wastewater usedby industries could be interchanged by groundwater. Then it is possible to stop the extraction ofmore than 3 Mm3/year from the aquifers. This would be an interesting contribution to mitigating theoverexploitation of the aquifers of the region, specifically for the Saltillo–Ramos Arizpe aquifer.
4.4.3. Scenario 3: Maximal Application for Urban Greening
Green area watering is the priority in this scenario and the other two applications are consideredsecondary. On the other hand, the current volume (20 L/s) destined for industry remains similar in thisscenario; then, additional actions or investments are not required. Therefore, the amount of treatedwater available for agriculture is 415 L/s, which corresponds to 38% of the demand in this application.This volume is very low and could cause negative effects to the lifestyle of farmers. Besides, thecorresponding investment remains similar as for the previous scenarios since the improvement of
Sustainability 2019, 11, 2217 16 of 23
the distribution systems is strictly necessary for an efficient transportation even of this volume. Thedistribution of treated water and the estimated investment for this scenario is presented in Table 8.
Table 8. Treated wastewater distribution for scenario 3: maximal reuse in green areas.
Priority Secondary Supply (L/s) Demand (L/s) Investment (USD) Some Related Studies
Urban 765 765 11,000,000Turkey [18], Israel [19],
China [7]Agriculture 415 1100 670,000
Industry 20 150 –Total 1200 2015 11,670,000
This scenario presents more relevant challenges: (a) the geographic position of the three WWTP isnot well situated for an efficient distribution of treated water to urban areas; then, it is necessary toimplement a distribution strategy including pipelines and even tanker trucks, (b) the treated waterquality of the RAMP is not suitable for this application, advanced treatment should be implementedto reach a good water quality, (c) the implementation of new distribution pipelines could requirelong time and cause lot of disturbances on the cities circulation, and (d) maybe the most limitingchallenge is the required investment, which is very high. These challenges agree the reported in relatedstudies [7,15,18,19]. Besides, if all the produced wastewater was collected, the WWTP would be closeto its maximal operation condition. Also, the population is expected to increase by 250,000 people overthe next 10 years; this implies a wastewater increase of 400 L/s, which exceeds the current treatmentcapacity. In addition, the enlargement of green areas should be a direct consequence of the increase ofpopulation, according to WHO recommendations [30]. With this perspective, the construction of newtreatment plants would be required to fulfill the official standards to watering green areas. The totalcapacity of those WWTP should be at least 300 L/s and should be distributed to reach all the urbangreen areas. On the other hand, the main benefits of this scenario are social and environmental. The lifequality could be improved since green areas are recreational areas and help to regulate temperature onthe cities. Moreover, the use of treated water for watering green areas allows decreasing the extractionof water from wells.
4.4.4. Comparison of Scenarios
Based on the previous analysis, a comparison of the three considered scenarios is included inthis section (Table 9). From this comparison, it is concluded that the second scenario is the mostadequate. The demand from the three applications is quite satisfactory: even if the watering of greenareas is limited, it is possible to increase the current volume for this application. On the other side,considering the distribution for the other two applications, it is possible to re-activate agriculturalactivities, increasing the farmer revenues, recover the ecosystem near the Arroyo La Encantada, and toprovide wastewater for the potential demand of the industrial sector.
4.5. Environmental Assessment of the Maximal Application on Industrial Sector
The environmental performance of the second scenario is assessed by using the Battelle-Columbusmethod [59–61]. This technique was developed to evaluate water resource planning projects; it isbased on a hierarchical arrangement of environmental quality indicators. The major level is composedof four categories: ecology, environmental pollution, esthetics and human interest. Each categoryconsiders different environmental components and each component includes several environmentalparameters. These parameters are associated to specific characteristics of the studied project, such asland use, water quality, diversity of vegetation types, employment opportunities, etc.; then, they areexpressed in different measurement units. In addition, they have a specific level of importance which isdetermined by a parameter importance unit (PIU). It is worthwhile to mention that the optimal qualityof a studied environment counts 1000 units. The environmental quality index (EQI) is introduced asa transformation system in order to obtain homogeneous units for all parameters. These new units

Sustainability 2019, 11, 2217 17 of 23
are called environmental impact units (EIU) and allow global evaluation to be possible. The EIUsare computed for the situation with and without the project implementation; the difference betweenthe two scores represents the environmental change produced by the project, and the amplitude ofthis change allows generating a flag which indicate how fragile or strong the respective parameteris [60]. Next is a description of the methodology: (i) to obtain the EQI with and without the projectimplementation by using a transformation function, (ii) to compute the EIU with and without theproject implementation as follows: EIU = EQI × PIU; after that, the net change is obtained as: change =
(EIUwith − EIUwithout)/(EIUwithout), (iii) to assign a flag for each parameter. Concerning the Ecologycategory, a major flag is assigned if 0 < |change| and a minor flag is assigned if 5|change| < 10. For theother categories, a major flag is assigned if 30 < |change|, and a minor flag is assigned if 30 > |change|.
Table 9. Scenarios comparison.
Scenario 1 Scenario 2 Scenario 3
Treated waterdistribution
Agriculture: XXX Agriculture: XX Agriculture: X
Industry: XX Industry: XXX Industry: X
Green areas: X Green areas: X Green areas: XXX
Economic aspects
Investment: ~1.7 M USD. Investment: ~11 M USD. Highest investment: ~11.7 MUSD.
Low revenues: ~0.17 M USD. Better revenues: ~1.9 M USD. Low revenues: ~0.17 M USD.
Low revenues forthe counties. Treated water could be sold. Counties stop paying for the
extraction of water for irrigation.
Social aspects
Farmers acceptance forusing treated wastewater
All the identified for scenario 1Acceptance of industrialists forusing treated wastewater
Social acceptance fornon-drinking uses and indirecthuman contact applications
More availability of freshwater then less health risks
Better life quality inurbanizations for green areas
Farmers life qualityimproved due to betterconditions for agriculture
Life quality of farmersfew improved
Environmentalaspects
Moisture in La Encantada isadequate to maintainecosystems within 60 km.
Moisture in La Encantada isadequate to maintainecosystems within 60 km.
Improvement of actualgreen areas.
The regional aquifers arerecharged.
The regional aquifers arerecharged. Increase of green urban areas.
Extraction of groundwater isstill required.
Water extraction from wellsdiminishes.
Water extraction from wellsdiminishes.
Opportunities
Implementation of efficientirrigation techniques.
All the identified forscenario 1.
Design of logistics fordistribution of treated water.Study of optimal species forgreen areas.Design of new treatment plants.
Study of optimal crops. Study of advancedtreatment systems.
Assessment of ecosystemnear the Arroyo LaEncantada.
Identification of processes forapplication of treated water.
Identification of optimalspecies for green areas.
Design of profiles for newindustries.
Main challenges Improvement of municipal sewage systems, Improvement infrastructure for wastewater reuse,Access to funds to implement wastewater reuse projects
The environmental evaluation of the maximal application of wastewater on the industrial sector ispresented on Table 10. To ease the assessment, nine environmental parameters were selected from thefour categories as follows. Ecology: crops; environmental pollution: basins hydrologic loss and landuse; aesthetics: water appearance, wild animals and variety within vegetation types; human interest:recreation spaces, landscape. It is considered that these parameters are representative of the studiedenvironment. The transformation functions used to obtain the EQIs were taken from reference [60]. The

Sustainability 2019, 11, 2217 18 of 23
PIUs where determined based on the ones used by the Battelle Columbus method [59]; proportionalcoefficients where used according to the number of parameters on each category.
Table 10. Environmental assessment.
EQI EIU Evaluation
Parameters Without With PIU Without With Change Flag
Crops 0.8 0.9 240 192 216 12.5 MajorBasins hydrologic loss 0.9 0.95 370 333 351.5 6 Minor
Land use 1 0.8 32 32 25.6 −20 MinorWater appearance 0.6 0.9 105 63 94.5 50 Major
Wild animals 0.5 0.8 24 12 19.2 60 MajorVariety within vegetation types 0.6 0.7 24 14.4 16.8 17 Minor
Recreation spaces 0.2 0.6 51 10.2 30.6 200 MajorLandscape 0.2 0.6 51 10.2 30.6 200 Major
Employment opportunities 0.7 0.8 103 72.1 82.4 14 MinorTotal 1000 738.9 867.2
Only the land use presents a negative impact, this is mainly due to the enhancing of the currentdistribution system and the construction of new ones. The other parameters receive positive impacts.Major impact is observed on water appearance, wild animals, recreation spaces and landscape; this isa direct effect of the recovering of the ecosystem on the shore of the Arroyo La Encantada. Relatedto crops, even if the environmental quality is improved only in 0.1 EQI, the global impact is majorsince this parameter corresponds to the ecology category; in addition, this impact is related to theimprovement of the watering and the kind of crops which should be used. The minor impacts arerelated to basins hydrologic loss, variety within vegetation types and employment opportunities.The first one is the effect of stopping the extraction of water from aquifers as a consequence of thereutilization of treated wastewater. The second one is related to the recovery of ecosystem on the shoreof the Arroyo La Encantada. The third one corresponds to the employment of people on the agricultureactivities. On the other side, the environmental quality without the project (the current situation)is 738.9 EIU, meanwhile the maximal application of wastewater on industrial activities allows theenvironmental quality to be improved in 128.3 EUI, around 13%.
4.6. Recommendations for the Future Use of Wastewater
From the previous analysis, some recommendations related to the main challenges to implement acomplete strategy for the systematic use of wastewater in the study region considering the distributionproposed in scenario 2 are proposed:
(a) Improvement and supervision of municipal sewage systems:
Since the main reasons of the water lost are identified (pipeline leakages, incomplete sewage netand irregular practices), the water return could be increased by implementing the next strategies:
• The municipal sewage systems must be updated to enlarge the coverage of wastewater gathering.In addition, discharge of wastewater to the Arroyo La Encantada and irregular practices mustbe avoided.
• Stricter supervision of the sewage system is required; an alternative is to develop a system basedon telemetry including the logistic of supervision and the data acquisition as done for otherapplications [62–64].
• With these actions, the SPP and BUFP should reach 100% of their capacity, and the RAMP 70%.This allows a higher availability of treated wastewater and then a diversification of applications.
(b) Infrastructure for treated wastewater reuse:

Sustainability 2019, 11, 2217 19 of 23
• Monterrey owns a treated wastewater distribution 210 km long to carry 360 L/s (4%) and MexicoCity distributes more than 3700 L/s (~10%) for reuse. Meanwhile, Saltillo and Ramos Arizpereuse 40 L/s; even if the proportion (4.5%) is like the one in Monterrey and not too far from thecorresponding to Mexico City, the volume is low since the region has water scarcity: wastewatershould be better used.
• An important issue is the lack of infrastructure. Currently, the BUFP has a distribution system fortreated water ~15 km long and the SPP a system 1 km long which is especially used for a steel mill.Even if tanker trucks are also employed, the distributed volume by this way is low and inefficient.Thus, extension of the distribution systems requires to be done.
• The authorities should take advantage of the interest of Kimberly Clark to reuse treated water;this enterprise is the furthest from the SPP in Monterrey direction. Therefore, a pipeline from theSPP could distribute enough treated water to supply the industrial demand in north of Saltilloand Ramos Arizpe. On the other hand, infrastructure for the distribution of wastewater to theagricultural region must be also updated. As aforementioned, several unlined canals requiremaintenance and even re-construction. Since this kind of distribution is inefficient, better canalsshould be implemented.
• The BUFP is better situated for reusing on municipal green areas; therefore, the distributionpipeline should be extended. Also, future treatment plants should be implemented based on reuseof treated wastewater.
(c) Sector collaboration and social involvement:
• Regional collaborations are recommended in other places around the world. The involved parties(municipal authorities, federal organisms, nongovernmental organizations, users) should be wellcoordinated to solve issues in the different stages of the implementation of strategies for the use oftreated wastewater.
• The distribution system for industrial use could be developed in collaboration between themunicipalities and the interested enterprises. In fact, there is already an accord to build a pipelinefrom the RAMP to a steel mill; this could be used as a basis to develop additional projects. Theenterprises in the Ramos Arizpe industrial parks could provide most of the funds; consequently,they should receive water at low price and fiscal benefits.
• The required investment to carry treated water to agricultural lands could be provided by federalorganizations. According to the Mexican compromises regarding the 2030 Agenda for SustainableDevelopment, federal programs are being developed in order to promote cleaner production,including agriculture and ecosystems conservation. Besides, the current development program ofCoahuila state includes the ecosystem conservation and the water conservation. Therefore, projectsto reuse treated water on agriculture are susceptible to receive funds and even technical support.In addition, local farmers have expressed willingness to cooperate at least with workforce.
• The funds to complement the distribution of wastewater from the BUFP could be provided byfederal organizations or private entrepreneurs; the amortization could be charged to municipalauthorities and the final users (people and property developers). In addition, CONAGUA offersfunds for projects related to implementation of wastewater treatment plants and reuse of water.The study region could apply for this kind of program.
• Following the directives of the 2030 Agenda and the Development Program, it is advisable tocreate new laws to promote the integration of wastewater treatment process in the new buildings;the treated water could be employed to water green areas and even used in other applications inthe same building or in other close areas. Also, regulations to allow farmers to raise more valuablecrops are required.
• On the other hand, the region is home of universities and research centers with experience inthe management of natural resources. These institutions could provide their expertise to severalactivities such as evaluation of crops, irrigation techniques, study of species for green areas,
Sustainability 2019, 11, 2217 20 of 23
evaluation of tertiary systems for wastewater treatment, identification of industrial applicationsof treated water, sustainability assessment and some others.
• Finally, social involvement is also required. People could be involved in supervision of sewagesystems, distribution of wastewater and green areas. In this sense, communication programs toraise awareness on people concerning water relevance in the region are also an important aspect.
5. Conclusions
From the integration of information, it was determined that the study region municipal WWTPtreats 872 L/s of waste water which corresponds to 66% of the identified wastewater. By improvingthe wastewater gathering, it is possible to offer 1100 L/s for different applications. The quality of thetreated wastewater is suitable for different applications, which could be an alternative to the scarcity ofwater in the region. From the assessment of scenarios, it was found that the best distribution of treatedwater is: 150 L/s for industries, 980 L/s for agricultural activities and 70 L/s for watering green areas.
The main benefits associated to this distribution are: (a) 120 L/s of fresh water could be replacedby treated water, reducing aquifer exploitation, (b) it promotes the re-activation of agriculture andthe ecosystems near the Arroyo La Encantada may be preserved, (c) it promotes the application oflarger volumes of treated water to green areas. On the other hand, the more relevant issues to beovercome are: (a) improvement of municipal sewage systems and of the infrastructure for reusingwastewater, (b) implementing a strategy to get investment from national organisms, (c) ensuringregional collaboration including municipal and federal governments, industrialists, academic andsocial sectors. Even if the surveys and workshops allowed us to partially identify the social acceptanceof reuse of treated water in the region, an assessment specially focused on social acceptability isrequired. Also, among the future research on this field should be oriented to: (i) identify emergentpollutants in wastewater, (ii) determine specific industrial applications to develop methods to reachthe required quality of treated wastewater, (iii) evaluate the resistance of local species as elements ongreen urban areas, (iv) determine the best crops for the new conditions of agriculture sector.
Author Contributions: A.V.R. and E.N.A.G. developed the technical and economic analysis as well as theintegration of information. G.T.E. and L.S.M. conceived and applied the survey to farmers in order to obtainand analyze the information concerning the agriculture sector; in collaboration with A.V.R. they performed thegeneration of the information concerning urban greening. L.D.J. and S.C.H. conceived and applied the survey toindustries and analyzed the obtained information; also, they wrote the paper.
Funding: This research was funded by Coahuila State Council for Science and Technology (COECYT Coahuila)through project 149646.
Conflicts of Interest: The authors declare no conflict of interest.
References
1. Vergine, P.; Salerno, C.; Libutti, A.; Beneduce, L.; Gatta, G.; Berardi, G.; Pollice, A. Closing the water cycle inthe agro-industrial sector by reusing treated wastewater for irrigation. J. Clean. Prod. 2017, 164, 587–596.[CrossRef]
2. Trat, A.K.; Schwabe, K.A.; Jassby, D. Wastewater reuse for agriculture: Development of a Regional WaterReuse decision-support Model (RWRM) for cost-effective irrigation sources. Environ. Sci. Technol. 2016, 50,9390–9399. [CrossRef]
3. De Gisi, S.; Casella, P.; Cellamare, C.M.; Ferraris, M.; Petta, L.; Notarnicola, M. Wastewater reuse. Encycl.Sustain. Technol. 2017, 53–68. [CrossRef]
4. Reznik, A.; Feinerman, E.; Finkelshtain, I.; Fisher, F.; Huber-Lee, A.; Joyce, B.; Kan, I. Economic implicationsof agricultural reuse of treated wastewater in Israel: A statewide long-term perspective. Ecol. Econ. 2017,222–233. [CrossRef]
5. Becerra-Castro, C.; Lopes, A.R.; Vaz-Moreira, I.; Silva, E.F.; Manaia, C.M.; Nunes, O.C. Wastewater reusein irrigation: A microbiological perspective on implications in soil fertility and human and environmentalhealth. Environ. Int. 2015, 75, 117–135. [CrossRef] [PubMed]
Sustainability 2019, 11, 2217 21 of 23
6. Elgallal, M.; Fletcher, l.; Evans, B. Assessment of potential risks associated with chemicals in wastewaterused for irrigation in arid and semiarid zones: A review. Agric. Water Manag. 2016, 177, 419–431. [CrossRef]
7. Lyu, S.; Chen, W.; Zhang, W.; Fan, Y.; Jiao, W. Wastewater reclamation and reuse in China: Opportunitiesand challenges. J. Environ. Sci. 2016, 39, 86–96. [CrossRef] [PubMed]
8. Pintilie, P.; Torres, C.M.; Teodosiu, C.; Castells, F. Urban wastewater reclamation for industrial reuse: AnLCA case study. J. Clean. Prod. 2016, 139, 1–14. [CrossRef]
9. Adewumi, J.R.; Ilemobade, A.A.; Van Zyl, J.E. Treated wastewater reuse in South Africa: Overview, potentialand challenges. Resour. Conserv. Recycl. 2010, 55, 221–231. [CrossRef]
10. Mizyed, N.R. Challenges to treated wastewater reuse in arid and semi-arid areas. Environ. Sci. Policy 2013,25, 186–195. [CrossRef]
11. Kalavrouziotis, I.K.; Apostolopoulos, C.A. An integrated environmental plan for the reuse of treatedwastewater effluents from WWTP in urban areas. Build. Environ. 2007, 42, 1862–1868. [CrossRef]
12. Hophmayer-Tokich, S.; Kliot, N. Inter-municipal cooperation for wastewater treatment: Case studies fromIsrael. J. Environ. Manag. 2008, 86, 554–565. [CrossRef] [PubMed]
13. Piadeh, F.; Moghaddam, M.R.A.; Mardan, S. Present situation of wastewater treatment in the Iranianindustrial states: Recycle and reuse as a solution for achieving goals of eco-industrial parks. Resour. Conserv.Recycl. 2014, 92, 172–178. [CrossRef]
14. Ammary, B.Y. Wastewater reuse in Jordan: Present status and future plans. Desalination 2007, 211, 164–176.[CrossRef]
15. Chu, J.; Chen, J.; Wang, C.; Fu, P. Wastewater reuse potential analysis: Implications for China’s waterresources management. Water Res. 2004, 38, 2746–2756. [CrossRef] [PubMed]
16. Moreti, M.; Van Passel, S.; Camposoe, S.; Pedrero, F.; Dogot, T.; Lebailly, P.; Vivaldi, G.A. Modellingenvironmental impacts of treated municipal wastewater reuse for tree crops irrigation in the Mediterraneancoastal region. Sci. Total Environ. 2019, 660, 1513–1521. [CrossRef] [PubMed]
17. Jasim, S.Y.; Saththasivam, J.; Loganathan, K.; Ogunbiyi, O.O.; Sarp, S. Reuse of Treated Sewage Effluent (TSE)in Qatar. J. Water Process Eng. 2016, 11, 174–182. [CrossRef]
18. Maryam, B.; Büyükgüngör, H. Wastewater reclamation and reuse trends in Turkey: Opportunities andchallenges. J. Water Process Eng. 2017. [CrossRef]
19. Garcia, X.; Pargament, D. Reusing wastewater to cope with water scarcity: Economic, social and environmentalconsiderations for decision-making. Resour. Conserv. Recycl. 2015, 101, 154–166. [CrossRef]
20. Šrámková, M.V.; Diaz-Sosa, V.; Wanner, J. Experimental verification of tertiary treatment process in achievingeffluent quality required by wastewater reuse standards. J. Water Process Eng. 2018, 22, 41–45. [CrossRef]
21. Norma Oficial Mexicana. NOM-001-ECOL-1996 Límites Máximos Permisibles de Contaminantes en las Descargasde Aguas Residuales en y Bienes Nacionales; Diario Oficial de la Federación: Mexico City, Mexico, 1996.
22. Norma Oficial Mexicana. NOM-003-ECOL-1997 Límites Máximos Permisibles de Contaminantes para lasAguas Residuales Tratadas que se Reúsen en Servicios al Público; Diario Oficial de la Federación: Mexico City,Mexico, 1997.
23. CONAGUA. Statistics on Water in Mexico. 2018. Available online: https://www.gob.mx/conagua/acciones-y-programas/publicaciones-estadisticas-y-geograficas-60692 (accessed on 7 March 2019).
24. Jiménez-Cisneros, B. 2012 Guidelines for the Water Reuse. Available online: https://www3.epa.gov/region1/
npdes/merrimackstation/pdfs/ar/AR-1530.pdf (accessed on 7 March 2019).25. López-Morales, C.A.; Rodríguez-Tapia, L. On the economic analysis of wastewater treatment and reuse for
designing strategies for water sustainability: Lessons from the Mexico Valley Basin. Resour. Conserv. Recycl.2019, 140, 1–12. [CrossRef]
26. Escalante, V.; Cardoso, L.; Ramírez, E.; Moeller, G.; Mantilla, G.; Montecillos, J.; Servín, C.; Villavicencio, F. ElReuso del Agua Residual Tratada en México. Available online: www.bvsde.paho.org/bvsacd/agua2003/reus.pdf (accessed on 7 March 2019).
27. Romero, M.S.; Salazar, L.E.; Viau, E.; Peccia, J.; Mendoza, L.; Ruvalcaba, G.; Figueroa, M. Contaminacióny Medio Ambiente en Baja California. 2006. Available online: https://books.google.com.mx/books?isbn=
9707018593 (accessed on 7 March 2019).28. Lencioni, V.; Carranza, C.; Vega, A.; Vega, H. Water Reuse in Mexico. Mexico Water Report. 2011. Available
online: http://www.lgaconsulting.com/water/IE-MexicoWaterReport-2011Winter-WaterReuseInMexico.html(accessed on 7 March 2019).

Sustainability 2019, 11, 2217 22 of 23
29. Cohen, A.; Mamane, H.; Lester, Y. Reutilizacion de Aguas Residuales en México: Caso Sonora. 2015. Availableonline: http://www2.congreso.gob.pe/sicr/cendocbib/con5_uibd.nsf/EACED48F3063BA6D05258234005FDCE1/
$FILE/13.REUTILIZACIÓN-AR-SON.pdf (accessed on 7 March 2019).30. WHO. Guidelines for the Safe Use of Wastewater, Excreta and Grey Water. 2006. Available online:
http://whqlibdoc.who.int/publications/2006/9241546859_eng.pdf?ua=1 (accessed on 7 March 2019).31. ONU. Transforming Our World: The 2030 Agenda for Sustainable Development. 2015. Available online:
sustainabledevelopment.un.org/post2015/transformingourworld (accessed on 11 April 2019).32. CONAGUA. Programa Contra Contingencias Hidráulicas para la Zona Urbana de Ramos Arizpe, Coahuila.
2016. Available online: https://www.gob.mx/cms/uploads/attachment/file/281365/ZONA_URBANA_RAMOS_ARIZPE__COAH.pdf (accessed on 7 March 2019).
33. CONAGUA. Consulta a la Base de Datos del REPDA. 2019. Available online: https://app.conagua.gob.mx/
Repda.aspx (accessed on 7 March 2019).34. INEGI. 2019. Available online: https://www.inegi.org.mx/temas/manufacturasexp/default.html#Herramientas
(accessed on 7 March 2019).35. SEMARNAT. 2015. Available online: http://www.sema.gob.mx/SRN/SIIAEC/POETE/CUADROS/Cuadro_
41_Disponibilidad_media_anual.pdf (accessed on 7 March 2019).36. Akhoundi, A.; Nazif, S. Sustainability assessment of wastewater reuse alternatives using the evidential
reasoning approach. J. Clean. Prod. 2018, 195, 1350–1376. [CrossRef]37. Aguilera-González, E.N.; Valdés-Ramos, A.; Tobón-Echeverri, G.; Carlos-Hernández, S.; Samaniego-Moreno, L.;
Alvarez-Garza, M.A.; Díaz-Jiménez, L. Analysis of the Production and Treatment of Wastewater in the Southeastof Coahuila, Mexico. J. Agric. Environ. Sci. 2015, 4, 155–162. [CrossRef]
38. Martines Santos, M.; Lanzén, A.; Unda-Calvo, J.; Martín, I.; Garbisu, C.; Ruiz-Romera, E. Treated anduntreated wastewater effluents alter river sediment bacterial communities involved in nitrogen and sulphurcycling. Sci. Total Environ. 2018, 633, 1051–1061. [CrossRef]
39. Contreras, J.D.; Meza, R.; Siebe, C.; Rodríguez-Dozal, S.; López-Vidal, Y.A.; Castillo-Rojas, G.; Amieva, R.I.;Solano-Gálvez, S.G.; Mazari-Hiriart, M.; Silva-Magaña, M.A.; et al. Health risks from exposure to untreatedwastewater used for irrigation in the Mezquital Valley, Mexico: A 25-year update. Water Res. 2017, 123,834–850. [CrossRef]
40. Williams, M.; Kookana, R.S.; Mehta, A.; Yadav, S.K.; Tailor, B.L.; Maheshwari, B. Emerging contaminants in ariver receiving untreated wastewater from an Indian urban centre. Sci. Total Environ. 2019, 647, 1256–1265.[CrossRef]
41. Boeriu, L.M.; Cirstolovean, I.L.; Fratu, M.; Nastac, C. The tertiary treatment stage of wastewater. Bull. Transilv.Univ. Brasov. 2013, 6, 207–212. Available online: http://aspeckt.unitbv.ro/jspui/bitstream/123456789/1594/1/
01%20boieriu.pdf (accessed on 7 March 2019).42. Huang, L.Y.; Lee, D.J. Membrane bioreactor: A mini review on recent R&D works. Biores. Technol. 2015, 194,
383–388. [CrossRef]43. Kovac Kralj, A. The re-usage of wastewater within industry: The positive impacts of contaminants. J. Clean.
Prod. 2015, 95, 124–130. [CrossRef]44. Cooper, R.C. The hygienic aspects of wastewater reuse. Waste Manag. Res. 1991, 9, 373–377. [CrossRef]45. Liberti, L.; Notarnicola, M.; Petruzzelli, D. Advance treatment for municipal wastewater reuse in agriculture.
UV disinfection: Parasite removal and by-product formation. Desalination 2002, 152, 315–324. [CrossRef]46. Mutengu, S.; Hoko, Z.; Makoni, F.S. An assessment of the public health hazard potential of wastewater reuse
for crop production. A case of Bulawayo city, Zimbabwe. Phys. Chem. Earth 2007, 32, 1195–1203. [CrossRef]47. Al-Jassim, N.; Ansari, M.I.; Harb, M.; Hong, P.-Y. Removal of bacterial contaminants and antibiotic resistance
genes by conventional wastewater treatment processes in Saudi Arabia: Is the treated wastewater safe toreuse for agricultural irrigation? Water Res. 2015, 73, 277–290. [CrossRef]
48. Ruiz Morales, B. Valor de la Producción de las Actividades Agrícola-Ganaderas Realizadas con AguasResiduales Tratadas en Comunidades Ejidales y Pequeñas Propiedades del Municipio de Ramos Arizpe,Coahuila. Master’s Thesis, Universidad Autónoma Antonio Narro, Coah, Mexico, 2013. Available online:http://repositorio.uaaan.mx:8080/handle/123456789/5333 (accessed on 7 March 2019).
49. Sáenz Forero, R. Reuso de Aguas Residuales pre-Tratadas en Agricultura y Piscicultura. 1986. Availableonline: www.bvsde.paho.org/bvsacd/scan2/017891/017891.pdf (accessed on 7 March 2019).
Sustainability 2019, 11, 2217 23 of 23
50. Moscoso, J. Aspectos Técnicos de la Agricultura con Aguas Residuales. 1995. Available online: www.bvsde.ops-oms.org/bvsair/e/repindex/repi84/vleh/fulltext/acrobat/moscoso.pdf (accessed on 7 March 2019).
51. Zamora Guajardo, R. Utilización de Aguas Negras en el Cultivo de Triticale (X. Triticosecale Wittmack), VariedadAN-57 para la Producción de Forraje, Utilizando como Testigo Agua Normal. Master’s Thesis, UniversidadAutónoma Antonio Narro, Coah, Mexico, 1998. Available online: http://repositorio.uaaan.mx:8080/xmlui/handle/123456789/1/browse?value=ZAMORA+GUAJARDO%2C+RAMON&type=author (accessed on 7March 2019).
52. Cisneros Estrada, O.X.; Gonzalez Meraz, J.; Fuentes Ruiz, C. Perspectiva de Aprovechamiento de las AguasResiduales en la Agricultura. 2001. Available online: http://cenca.imta.mx/pdf/43978Pri.pdf (accessed on 7March 2019).
53. Murillo Amador, B.; Escobar, A.; Fraga Mancillas, H.; Pargas Lara, R. Rendimiento de grano y forraje delíneas de triticale y centeno en Baja California Sur, México. Rev. Fitotec. Mex. 2001, 24, 145–153. Availableonline: https://www.revistafitotecniamexicana.org/documentos/24-2/3r.pdf (accessed on 7 March 2019).
54. Plevich, J.O.; Delgado, A.R.S.; Saroff, C.; Tarico, J.C.; Crespi, R.J.; Barotto, O.M. El cultivo de alfalfa utilizandoagua de perforación, agua residual urbana y precipitaciones. Rev. Bras. Eng. Agric. Ambient 2012, 16,1353–1358. [CrossRef]
55. Montemayor Trejo, J.A.; Woo Reza, J.L.; Munguía López, J.; Román López, A.; Segura Castruita, M.A.; YescasCoronado, P.; Frías Ramírez, E. Producción de alfalfa (Medicago sativa L.) cultivada con riego sub-superficialy diferentes niveles de fósforo. Rev. Mex. Cienc. Agric. 2012, 3, 1321–1332. Available online: http://www.scielo.org.mx/scielo.php?script=sci_arttext&pid=S2007-09342012000700003&lng=es&nrm=iso (accessed on7 March 2019).
56. Grandjean, A.C. Water Requirements, Impinging Factors, and Recommended Intakes. Available online:www.who.int/water_sanitation_health/dwq/nutrientschap3.pdf (accessed on 7 March 2019).
57. Kumar, D.; Hiremath, A.M.; Asolekar, S.R. Integrated management of wastewater through Sewage FedAquaculture for Resource Recovery and Reuse of Treated Effluent: A case study. International Conferenceon Environmental Science and Development. APCBEE Procedia 2014, 10, 74–78. [CrossRef]
58. Rodenas, M.A.; Albacete, M. The River Segura: Reclaimed water, recovered river. J. Water. Reuse Desal. 2014,4, 50–57. [CrossRef]
59. Dee, N.; Baker, J.; Drobny, N.; Duke, K.; Whitman, I.; Fahringer, D. An environmental evaluation system forwater resource planning. Water Resour. Res. 1973, 9, 523–535. [CrossRef]
60. Conesa Fernández-Vítora, V. Methodological Guide for the Environmental Impact Assessment, 4th ed.; EdicionesMundi-Prensa: Madrid, Spain, 2003; pp. 253–300. (In Spanish)
61. Wagh, C.H.; Gujar, M.G. The environmental impact assessment by using the Battelle Method. Int. J. Sci. Res.2014, 3, 82–86.
62. Colomina, I.; Molina, P. Unmanned aerial systems for photogrammetry and remote sensing: A review. ISPRSJ. Photogramm. Remote Sens. 2014, 92, 79–97. [CrossRef]
63. Gago, J.; Douthe, C.; Coopman, R.E.; Gallego, P.P.; Ribas-Carbo, M.; Flexas, J.; Escalona, J.; Medrano, H. UAVschallenge to assess water stress for sustainable agriculture. Agric. Water Manag. 2015, 153, 9–19. [CrossRef]
64. Aries Rokhmana, C. The potential of UAV-based remote sensing for supporting precision agriculture inIndonesia. Procedia Environ. Sci. 2015, 24, 245–253. [CrossRef]
© 2019 by the authors. Licensee MDPI, Basel, Switzerland. This article is an open accessarticle distributed under the terms and conditions of the Creative Commons Attribution(CC BY) license (http://creativecommons.org/licenses/by/4.0/).
Copyright © 2022 FDOKUMEN