“Topography as Epitaph or Epitaph as Topography: Wordsworth’s Excursion”

ECOHYDROLOGYEcohydrol. (2010)Published online in Wiley InterScience(www.interscience.wiley.com) DOI: 10.1002/eco.123
Rainfall, topography and primary production relationships ina semiarid ecosystem
Tal Svoray1* and Arnon Karnieli2
1 Department of Geography and Environmental Development, Ben-Gurion University of the Negev, Beer-Sheva 84105, Israel2 The Remote Sensing Laboratory, Jacob Blaustein Institutes for Desert Research, Ben-Gurion University of the Negev, Beer-Sheva 84990, Israel
ABSTRACT
A series of 15 Satellite Pour l’Observation de la Terra XS images, which were acquired during a single growing season, wereused to study the spatial and temporal relationships between topography, rainfall and aboveground net primary production(ANPP) of annuals in a semiarid environment. A digital elevation model was used to locate five physiographic units: interfluve,shoulder, backslope, foot slope, and channel, along the slope catena. ANPP values were then surrogated by the normalizeddifference vegetation index (NDVI). Four phenological phases were interpreted from the seasonal NDVI profiles: germination,green-up, drying, and senescence. A significant difference between NDVI values of all physiographic units was found, mainlyduring the green-up phase. NDVI values at peak season were characterized as typical of semiarid ecosystems, except thoseof the footslope and the channel, which were found to have meaningfully high NDVI values, due to run-off distribution anda thick soil profile. The seasonal NDVI integral was related positively and linearly to model-derived water availability valuesfor all physiographic units and the NDVI was correlated to multiple-timescale rainfall data and the length of dry spells. The1-month rainfall data were found to have the highest correlation with the NDVI, indicating lag and cumulative effects ofrainfall on production. This implies that the time required for the plants to use the water for production is around a month. Itis concluded that studies of ecosystem functioning and capabilities in semiarid environments should consider not only meanannual rainfall amounts, but also the temporal rainfall distribution, mainly on a monthly scale, and the effect of physiographicunits. Copyright 2010 John Wiley & Sons, Ltd.
KEY WORDS annuals; normalized difference vegetation index; precipitation; primary production; pulse; SPOT
Received 30 December 2009; Accepted 16 February 2010
INTRODUCTION
Aboveground net primary production (ANPP) is one ofthe most important indicators of ecosystem capabilities,functioning, and resource utilization efficiency (Jobbagyet al., 2002; Cao et al., 2004). In dry environments, wateris the limiting factor for vegetation growth (Noy-Meir,1973; Rodriguez-Iturbe et al., 1999) and rainfall, as theprime water source, is considered to be a critical fac-tor that regulates ecosystem production. As the field ofecohydrology is aimed to improve understanding of pro-cesses at the interface between hydrology and ecology,information on the way through which rainfall and sur-face hydrology affect vegetation production is sought byecohydrologists studying semiarid areas (Turnbull et al.,2008; Lauenroth and Bradford, 2009).
Previous studies have tried to relate rainfall amount andsatellite-derived vegetation production empirically (e.g.Tucker et al., 1991; Paruelo and Lauenroth, 1997; Tuckerand Nicholson, 1999; Sannier et al., 2002; Hill andDonald, 2003; Hunt et al., 2003; Chhabra and Dadhwal,2004; Kogan et al., 2004), mainly by using data acquiredfrom low-to-moderate resolution images of the advancedvery high-resolution radiometer (AVHRR), Satellite Pour
* Correspondence to: Tal Svoray, Department of Geography and Environ-mental Development, Ben-Gurion University of the Negev, Beer-Sheva,84105, Israel. E-mail: [email protected]
l’Observation de la Terra (SPOT)-Vegetation, and themoderate resolution imaging spectroradiometer (MODIS)systems (Nagler et al., 2007). With spatial resolution ofa few hundred meters to a few kilometres, these systemsare characterized by a high temporal resolution of 1 daythat enables accurate temporal studies of ANPP along thegrowing season. Spatially speaking, research with suchimages provides good understanding of regional and evenglobal phenomena. However, consideration of soil andtopographic effects on rainfall–production relationship islimited. As a result, little has been concluded about theeffect of hydrological processes on spatial and temporalvariabilities in vegetation production, at the landscapescale of physiographic units (Imeson and Prinsen, 2004).
The physiographic unit is a well-established entity ingeomorphological studies. Generally, the slope is definedas a three-dimensional body extending from the inter-fluve to the channel bed (Conacher and Dalrymple, 1977).According to this partition, each point on a slope isallocated to one of nine physiographic units that havedistinct pedogenic characteristics, reflecting the influenceof soil–water–gravity interrelationships governed by sur-face forms. Based on the idea of possible links betweenphysiographic units, run-off and sediment flows, and soilformations, Park et al. (2001) developed a method, usinga digital elevation model (DEM), to predict six phys-iographic units: interfluve, shoulder (seepage slope and
Copyright 2010 John Wiley & Sons, Ltd.

T. SVORAY AND A. KARNIELI
convex creep slope), backslope (free face and transporta-tional midslope), footslope (colluvial footslope), toeslope(alluvial toeslope), and channel (channel bed and walls).These units can differ with geological conditions. In arecent paper, Svoray et al. (2008a) distinguished, at theLehavim Long Term Ecological Research (LTER) site,five physiographic units: interfluve, shoulder, backslope,footslope, and channel (Figure 1). On the scale of phys-iographic units, the effect of hydrological processes, suchas infiltration, percolation, and run-off, on soil waterstorage is highly complex. Rainfall and surface charac-teristics can affect the above hydrological processes andtherefore, water redistribution in space and time (Bevenand Kirkby, 1979). If antecedent soil water conditionsdo affect vegetation production, rainfall amount per seis not the only characteristic to control vegetation pat-terns at this scale. The question that arises, therefore, is:to what extent water redistribution between the physio-graphic units affects production processes? The answerto this question is not trivial (Wilcox et al., 2003) and isbeyond the scale of the coarse resolution images.
According to the pulse-reserves hypothesis (Noy-Meir,1973) there are ‘effective’ rainfall events that are moreimportant than others for vegetation growth—those thatstimulate plant growth, rather than the total, i.e. theaccumulated amount of rainfall in a given season. Thismodel applies mainly to grasslands, but it ignores theeffects of soil water conditions and rooting systems(Reynolds et al., 2004). Another paradigm that relatesrainfall to vegetation in arid areas is the Walter two-layerhypothesis (Walter, 1971), which predicts that seasonalrainfall characteristics determine large-scale patterns incommunity composition. To a large extent, compositionis determined by soil water conditions, and the co-existence of herbaceous vegetation and shrubs occursdue to the difference in their rooting systems. The maindilemma between the two hypotheses is the importanceof antecedent soil water to ecosystem productivity. Sofar, the two hypotheses were found to be imperfect whenconfronted with field observations, so there is still aneed to better understand the mechanism through which
Figure 1. The slope cross-section with the pedogeomorphic units alongthe catena.
rainfall characteristics and/or antecedent soil moistureconditions affect ANPP variation in the slopes of semiaridareas (Ogle and Reynolds, 2004).
The aim of this paper is to explore the effect ofphysiographic units and rainfall intervals on spatial andtemporal dynamics of normalized difference vegetationindex (NDVI) (as a surrogate for ANPP) at a semiaridenvironment. We use 15 high-resolution multispectralimages from the growing season 2002–2003 and askthe following two questions: (i) Do physiographic unitsaffect spatial variation in NDVI? (ii) What is the time lagof vegetation response to rainfall on this scale?
We hypothesize that (i) water distribution throughtopography substantially influence ANPP variation.Wetter physiographic units are expected to be more pro-ductive, whereas physiographic units with poor wateravailability will show lower NDVI values. And (ii)because soil moisture conditions are assumed to affectproduction, we assume that biomass growth response torainfall will not be immediate and that dry spells willhave a relatively low effect on NDVI.
METHODOLOGY
Study site
The LTER site at Lehavim (31°200N, 34°450E) is locatedin the Northern Negev area in Israel, with an averagerainfall of 270 mm per annum, falling in the winter. Themean annual temperature measured at the site is 20Ð5 °C,with a maximum and minimum of 27Ð5 and 12Ð5 °C,respectively (data obtained from the Meteorological Sur-vey of Israel). The terrain is hilly and the area is dividedby an east–west ephemeral stream. The dominant rockformations are Eocene limestone and chalk with patchesof calcrete. The soils are brown lithosols combined witharid brown loess. The vegetation is characterized byscattered dwarf shrubs and patches of herbaceous veg-etation, mostly annual, interspersed between rocks andthe dwarf shrubs (Ungar et al., 1999). The dwarf-shrubcommunity shows diffuse vegetation and the herbaceousvegetation appears shortly after the first rains and per-sists as green forage for 3–4 months. The herbaceousvegetation is highly diverse, comprising mostly annualspecies that form 56% of the regional flora (Danin andOrshan, 1990). Osem et al. (2002) reported on 130 annualspecies at Lehavim, of which 15 species contribute 85%of the total average abundance and aboveground biomassof the annuals. The predominant functional groups aregrasses (46% of total abundance and 51% of abovegroundbiomass) and legumes (9 and 21%, respectively).
Experiment design and sampling
This research is part of a long-term study of dynamics invegetation production at the Lehavim LTER site. Fielddata and data from water availability modelling wereacquired from previous studies (Svoray et al., 2008b).Experimental design and sampling in the current researchuse satellite data in the five physiographic units, each
Copyright 2010 John Wiley & Sons, Ltd. Ecohydrol. (2010)

RAINFALL, TOPOGRAPHY AND PRIMARY PRODUCTION RELATIONSHIPS
is dominated by annual herbaceous vegetation. Themodel by Park et al. (2001) and a contour-based DEM,with 25 and 10 m vertical and horizontal resolutions,respectively (Hall et al., 1993), were used for mappingfive physiographic units: interfluve, shoulder, backslope,footslope, and channel over the entire Lehavim area.
For each of the five physiographic units, five replicaplots, each located in different slope in the watershed,were selected to represent the intra-unit variation due tocharacteristics such as solar radiation flux, rock and stonecover, and soil properties. Each of the 25 replica plots iscomposed of several DEM cells (9 < n < 35). Replicasite selection was performed randomly in the areasdominated by herbaceous vegetation (stratified randomsampling), using the ARCGIS random function. Thesuitability of the Park et al. (2001) model for the Lehavimsite was tested against field data (n D 22 observations perunit), using confusion matrices that yielded an overallaccuracy of >75%.
Satellite data
Fifteen SPOT XS images, at 20 m spatial resolution, wereacquired at different dates throughout the growing seasonof 2002–2003. For the radiometric correction, digitalnumbers (DN) were converted to radiance L (W m�2
sr�1 µm�1) using Equation (1):
L D DN
aC b �1�
where a and b are the gain and offset calibrationcoefficients, respectively. In the SPOT data, the offsetis always equal to 0 and thus, only the gain, whichdepends on the system and changes with time, wasobtained for each band from the image header file. Foratmospheric correction, the second simulation of satellitesignal in the solar spectrum (6S) software (Vermote et al.,1997) was used. Sun and satellite geometry parameterswere acquired from the header file. Values of aerosoloptical thickness (AOT) at 550 nm and water vapourcontent were obtained from a sunphotometer located atthe Jacob Blaustein Institutes for Desert Research of Ben-Gurion University of the Negev (Sede Boker AERONETsite). The ozone content was derived from the totalozone mapping spectrometer (TOMS) sensor aboard theNimbus-7 spacecraft. Final product of the atmosphericcorrection procedure was an image in reflectance (�)values.
The geometric correction procedure was carried outwith the ERDAS IMAGINE software. As a first step,one image was registered to a 1 : 50 000 digital map,using ground control points (GCP), in the New IsraeliGrid projection, with a root-mean-square error (RMSE)of less than one pixel. The first corrected image was usedas the reference for the other images by image-to-imagecorrection techniques (with RMSE < 0Ð5). Following thepre-processing procedures, NDVI values were calculated,using the following equation:
NDVI D �B3 � �B2
�B3 C �B2�2�
where the subscripts represent the SPOT band 3 (nearinfrared) and band 2 (red), respectively. In the next stage,each of the 15 NDVI layers was overlapped with the25 physiographic plots and statistics were calculated foreach.
NDVI is used here as a surrogate for vegetationproduction, because the relationship between the twois well established both theoretically and empirically(Pettorelli et al., 2005). NDVI has shown consistentcorrelation with vegetation biomass and has been founduseful for the study of regional patterns in primaryproduction in, e.g. North American shrub lands andgrasslands (Paruelo et al., 1995; Paruelo and Lauenroth,1997). The relationship between rainfall and NDVI ofprairie and croplands in the Great Plains of Kansaswas successfully studied in a biweekly analysis between1989 and 1997 (Wang et al., 2003) and in SahelianAfrica (Tucker and Nicholson, 1999). Although othervegetation indices were developed, NDVI has had, andwill continue to have, a key role in future research ofecosystem dynamics. It is a useful tool to couple climateand vegetation distribution (Pettorelli et al., 2005). Inthe studied area, a strong linear correlation (R2 D 0Ð8,N D 22, P < 0Ð05) was observed between NDVI andbiomass harvests. We have also tried to use differentsoil adjusted vegetation indices but NDVI gave the bestpredictive results.
Vegetation cover
In this study, we focus on the response to water avail-ability of herbaceous vegetation only and therefore, weselected the 25 replica plots on slopes that are entirelydominated by herbaceous vegetation. The spatial mixturebetween shrubs and grasses in the studied area can be onthe scale of the sub-meter. Also, several assemblages ofplant species can produce a similar NDVI value and tem-poral trend (Nagendra, 2001). It is therefore difficult todifferentiate between species with the 20 m SPOT data.For that reason, we used very high-resolution aerial pho-tography to map surface covers and to select slopes andphysiographic units that are dominated by annual herba-ceous vegetation. The supervised maximum likelihoodclassification (MLC), which already proved useful inmapping soil and vegetation in a nearby study site (Svo-ray et al., 2007), was applied to identify three classes:herbaceous vegetation, shrubs, and bare soil. The datawere obtained from an RGBorthophoto, with sub-meterresolution, produced on 31 December 2004.
The training sets were derived using data collected inthe field while, to validate image classification, accuracyassessment was carried out using visual interpretation ofaerial photographs, followed by field observations. Anaccuracy assessment of the classification was carried outusing a visual interpretation of the orthophoto on a sampleof 200 pixels per class and field observations; accuracywas tabulated in a confusion matrix (a table within eachpredicted class is plotted against the observed class andthe number of items within each is compared). Overall
Copyright 2010 John Wiley & Sons, Ltd. Ecohydrol. (2010)

T. SVORAY AND A. KARNIELI
classification accuracy was >85%. As a second step, thezonal layer of the 25 replica plots was overlapped withthe classification layer, using a spatial joining operation tocalculate shrub and herbaceous vegetation percentages inthe grid cells, according to the ratios between the areascovered by these classes and the overall area of eachplot. The outcome is a layer that represents the shruband herbaceous vegetation cover percentages in each ofthe plots.
Statistical analysis
To test if a significant variation exists between NDVIvalues recorded in the physiographic units at any dateof observation, we used analysis of variance (ANOVA).As the samples were obtained from predefined plots, weadded the plot factor to the statistical model in a nestedmanner. The plot factor allows the effect of the uniquecharacteristics of the plots on the dependent variable tobe tested. Note that in this operation, we do not try toexplore the effect of the plots on the dependent variable,but try to assure that they do not act as a source of error.
To test the effect of rainfall on NDVI values recordedin the physiographic units at any date of observation,a stepwise regression model was applied, in which thedependent variable is NDVI and the independent vari-ables are defined as follows: Day, the amount of rainfalla day before the image acquisition; Three, the amountof rainfall in the 3 days before the measurement; Week,the amount of rainfall in the week before the measure-ment; Month, the amount of rainfall in the month beforethe measurement; Total, the amount of rainfall since thelast measurement (satellite data acquisition); Totsum, theamount of rainfall in the entire season until the day ofmeasurement; and, finally, Number, the number of dayswithout rainfall since the last measurement. The analy-sis was implemented using the statistical analysis system(SAS) package.
RESULTS
Overall rainfall in the 2002–2003 rainy season was196 mm, which is 66% of the mean annual rainfallmeasured at the Lehavim LTER site during the 18 seasonsbetween 1987 and 2005 with maximum D 528, minimumD 140, and standard deviation D 94Ð47. The dominanceof annual herbaceous vegetation, ¾50–60% cover, and
the low shrub cover, <5%, on the studied research plotsare shown in Table I. In accordance, bare soil (soilsnot covered by vegetation throughout the season) areaswere similar between the plots—¾35–45%. Despitethe relatively low amount of rainfall, NDVI valuesmeasured were typical of semiarid areas, as observed inprevious studies (Svoray and Shoshany, 2004) in wetteryears—except for the footslope and the channel, whichare typical of NDVI values from humid areas.
Figure 2 shows that the 196 mm dropped in this seasonwas distributed over seven events of effective rainfall(½10 mm, based on Noy-Meir, 1973) and, in addition,there were two consecutive rainfall events (#2ab inFigure 2) after event #2 of ¾7 mm each, which, due tothe low evaporation rate in winter, can be considered asan effective event. Accumulated effective rainfall depthin this growing season was 109 mm, whereas the other87 mm was distributed in very small events.
The minimum NDVI values in Figure 2 represent areascovered with bare stony soils or rock coverage withno vegetation all year long. As expected, these areasshow very low NDVI values with small variation, ifany, between the dates of observation along the growingseason. It is important to note that these areas are notcovered by biological crusts as previous studies haveshown that biological crusts increase NDVI values at thebeginning of the winter (Karnieli, 2003). The minimumNDVI time series is therefore a relatively flat line nearzero NDVI. This value is even lower than the NDVI¾0Ð15 shown by senescent vegetation during the summer(the four dates of observation in May and June, Figure 2).The curve of maximum NDVI values represents the mostproductive habitats on each date and, apparently, theyfollow the curve of mean values.
The curve of mean NDVI of Lehavim LTER siteis similar to other curves of NDVI measured on cleardays in the Negev (Karnieli, 2003) and in other placesin the world (Pettorelli et al., 2005). A detection oflife history trait with NDVI shows that NDVI increasesfrom germination to the peak of greening-up and thendecreases to the lowest value, in our case, towardsearly May–mid June. Senescence was found to occurfaster than greening-up with rate of increase in NDVIduring the winter: y D 0Ð0025x � 95Ð249, R2 D 0Ð92;and rate of decrease towards summer: y D �0Ð0033x C123Ð88, R2 D 0Ð94 where y is the NDVI and x isthe rainfall amount. The germination process occurs
Table I. Mean values (five replicas per unit) of surface covers in the five physiographic units of the Lehavim LTER site.
Physiographic unit
Channel Footslope Backslope Shoulder Interfluve
Herbaceous vegetation 51 61 59 58 64Shrub 5 4 3 3 2Bare soil 44 35 38 39 34Total cover in unit 100 100 100 100 100
The data are based on remotely sensed data classified with maximum likelihood with >90% accuracy. In all units, shrub cover <5%; herbaceousvegetation cover ¾50–60%; and bare soil (soils not covered by vegetation throughout the season) ¾35–45%.
Copyright 2010 John Wiley & Sons, Ltd. Ecohydrol. (2010)

RAINFALL, TOPOGRAPHY AND PRIMARY PRODUCTION RELATIONSHIPS
Figure 2. Daily rainfall data bars and minimum, mean, and maximum (squares) NDVI curves for the growing season 2002–2003. The numbersrepresent the effective rainfall events (>10 mm).
underground and therefore NDVI in this period is stilllowest. Then vegetation starts to grow aboveground(green-up) where NDVI increases up to the peak, andduring the drying phase, there is a decrease in NDVIdown to the senescence phase with low NDVI at the endof the season.
The mean NDVI curve also shows that vegetationresponse to rainfall is not immediate and it reflects thelife history traits of time to germination. Thus, nearlya month after the first effective rainfall event, whichoccurred on 31 October 2002, the observed NDVI wasstill very low until mid-December, when the first increaseof NDVI was observed (15 December 2002), with noeffective precedent rainfall event during the days beforethe rise. The increase in NDVI continued until mid-January, with no effective rainfall event during thatperiod. There was continuous growth in February, butin March and April, despite five effective rainfall events,NDVI did not increase but remained flat and even startedto decrease. In April, despite the contribution of one moreeffective event (event #7), NDVI continued to decrease.Apparently, the amount of rainfall in event #7 was notused by the vegetation for production.
Mean NDVI values of the five physiographic unitsand rainfall data for the growing season of 2002–2003are presented in Figure 3. The four phases are also dis-tinguished in all units and show a similar trend. Thefirst phase—germination—occurred between 15 Novem-ber and 6 December 2002, where mean NDVI val-ues of all physiographic units were very low for bothdates of observation and were similar to those usu-ally observed in dry vegetation surfaces (Svoray andShoshany, 2004). The second phase—green-up—wasobserved between 19 December 2002 and 19 March2003, reflecting a pronounced increase in NDVI val-ues, up to the peak on 19 March 2003. In the thirdphase—drying—between 3 April 2003 and mid-May,
there was a significant decrease in NDVI values, repre-senting the drying phase in the semiarid vegetation. Thefourth and last phase—senescence—occurred betweenmid-May and mid-June (this is the last date of observa-tion, as the summer dry season without vegetation growthis well established by this date). There was thus, a returnto the dry phase with low NDVI values.
The spatial variability within the site is shown inFigure 4, where, in the green phase, the channels andfootslopes are considerably greener than the interfluvesand the backslopes/shoulders. Based on the researchplots, on all observation dates, there is a significant sta-tistical difference between the NDVI values measured forthe footslope, the channel, the interfluve, and the shoul-der/backslope (Table II). This implies the fact that onecan detect subtleties of NDVI responses across a localterrain suggests a capacity for high precision analysisof large landscapes. The difference between the phys-iographic units seems to increase with increasing NDVIvalues, although it is important to note that F-values arerelatively low during the first phase and increase dramat-ically during the second phase; they then drop again inthe drying phase. As was shown earlier, there is a lag inthe response of production to rainfall supply that can bedue to the germination lag and lack of detection of smallplants as they grow. The fact that no differentiation bylandform is observed until later may suggest this.
This is also shown in the results of the stepwiseregression. The variable Month (rainfall amount in themonth prior to the image acquisition) explains the NDVIwith highest Pearson correlation coefficients (Table III).These findings are almost identical in all physiographicunits, thus further enhancing the validity of this statisticalmodel. Variables such as 3 days, the length of dryspell, and the total amount of rainfall until the date ofmeasurement were insignificant in explaining NDVI, butterms such as weekly rainfall and the amount of rainfall
Copyright 2010 John Wiley & Sons, Ltd. Ecohydrol. (2010)

T. SVORAY AND A. KARNIELI
Figure 3. ANPP of the five physiographic units at the Lehavim LTER site, estimated by the NDVI. Each data point represents the average value forthe date of measurement for five plots, each covering an area of a few tens of SPOT XS pixels.
Figure 4. The sequence of 15 SPOT XS-based NDVI images running from top to bottom and from left to right. The colour plates are unified torepresent the NDVI range from NDVI D 0 (brown) to NDVI D 0Ð8 (green). The images clearly show the seasonal growth, the four phases, and the
spatial variability within the site, where the channels and footslopes are considerably greener than the interfluves and the backslopes/shoulders.
Copyright 2010 John Wiley & Sons, Ltd. Ecohydrol. (2010)

RAINFALL, TOPOGRAPHY AND PRIMARY PRODUCTION RELATIONSHIPS
Table II. P-values and F-values of the difference between NDVIvalues in the different physiographic units.
Date F-value P-value
15 November 2002 25Ð73 <0Ð00016 December 2002 23Ð43 <0Ð000115 December 2002 25Ð82 <0Ð000130 December 2002 43Ð34 <0Ð000110 January 2003 36Ð89 <0Ð00011 February 2003 67Ð66 <0Ð00018 March 2003 59Ð55 <0Ð000117 March 2003 65Ð79 <0Ð00013 April 2003 60Ð09 <0Ð000117 April 2003 67Ð04 <0Ð000129 April 2003 24Ð65 <0Ð00018 May 2003 18Ð88 <0Ð000113 May 2003 15Ð18 <0Ð000111 June 2003 16Ð40 <0Ð000121 June 2003 15Ð53 <0Ð0001
This difference increases with increasing NDVI values; F-values arerelatively low at the dry phase and increase dramatically during thegreening-up phase; they then drop again in the senescence phase.
from the last satellite measurement, were found moreinfluential and near significant, although with a lowercoefficient of determination than that of the monthlyrainfall.
Table IV shows the slope of the regression linesbetween the beginning of the greening-up and the peak,representing the rate of greening-up; and between thepeak and the dry season, representing the rate of senes-cence. The results show that, similar to the average profilereported earlier, the rate of senescence is faster than therate of greening-up, for all physiographic units. In addi-tion (well illustrated in Figure 3), the speeds of increaseand decrease rise with the productivity of the physio-graphic unit. In the case of greening-up, the coefficientof determination also rises with the productivity of theunit.
During the green-up phase, there is a significantstatistical difference between the NDVI values measured
Table IV. The rate of increase and decrease in NDVI calculatedalong the 2002–2003 growing season in the five physiographic
units of the LehavimLTER site.
Rate of increase Rate of decrease
R2 Slope Intercept R2 Slope Intercept
Interfluve 0Ð85 0Ð0018 �66Ð72 0Ð91 �0Ð0025 94Ð85Shoulder 0Ð91 0Ð0024 �90Ð59 0Ð93 �0Ð0033 125Ð37Backslope 0Ð91 0Ð0027 �100Ð43 0Ð94 �0Ð0034 127Ð91Footslope 0Ð95 0Ð0033 �123Ð68 0Ð90 �0Ð0041 154Ð91Channel 0Ð99 0Ð0049 �184Ð05 0Ð92 �0Ð0059 220Ð57
This was calculated using a regression model calculated for all units. Therate of increase was calculated between early December (starting pointfor green-up) and mid-March (peak season). The rate of decrease wascalculated between mid-March and early June (dry season). As expected,the increase is slower than the rate of decrease in all units and ratesare higher in the wetter units than in the drier ones. This is especiallyenhanced in the channel. Values in boldface are significant in all cases>0.001.
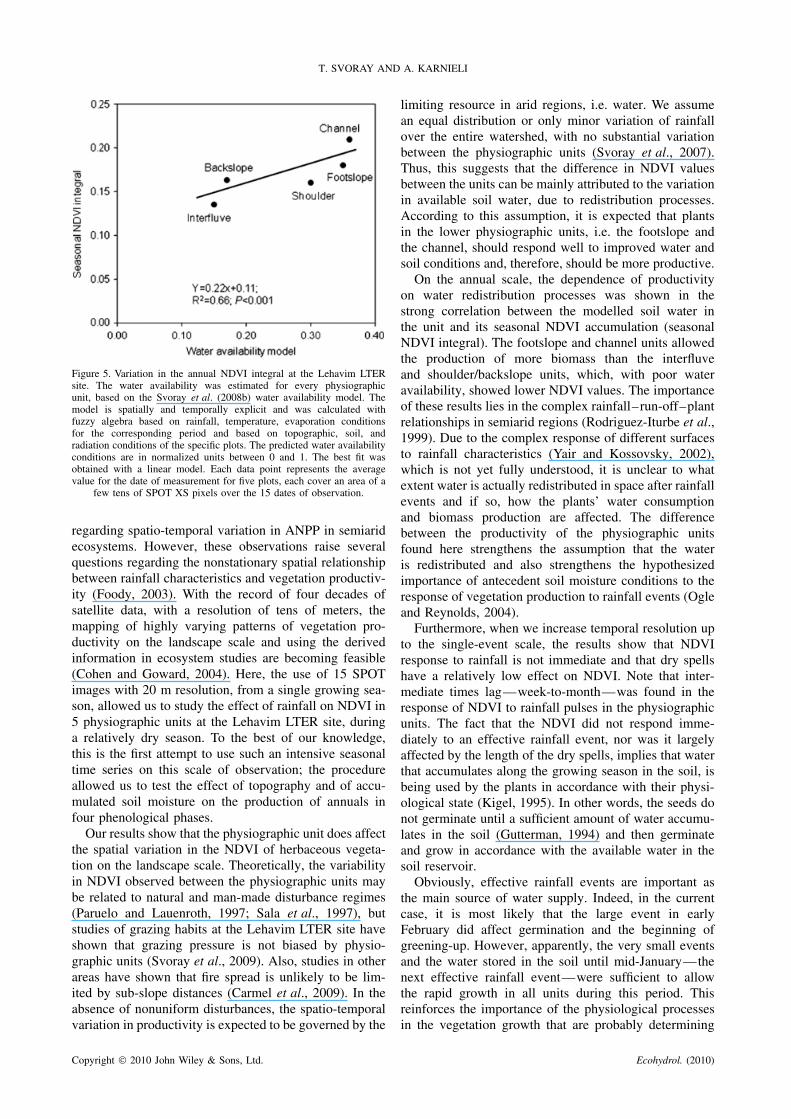
for the physiographic units. Yet, on several dates, theshoulder cannot be distinguished from the backslope,although these two can be distinguished from the otherunits. The difference between the physiographic unitsis well demonstrated using the seasonal NDVI integral(calculated on the basis of the trapezoidal rule) thatvaries between the five units as follows: Channel 0Ð21,Footslope 0Ð18, Backslope 0Ð16, Shoulder 0Ð16, andInterfluve 0Ð14. The difference between the units is intheir water availability conditions and this is probablythe reason for the difference in NDVI. Figure 5 showsa positive correlation between the seasonal NDVI of thedifferent physiographic units and the water availabilityconditions mapped for these physiographic units (Svorayet al., 2008a).
DISCUSSION
The use of satellite remote sensing for studying rainfall–productivity relationship has revealed so far new evidence
Table III. Pearson correlation coefficients and P-values for the stepwise regression of the effect of rainfall on NDVI of the fivephysiographic units at the Lehavim LTER site.
Physiographic unit
Channel Footslope Backslope Shoulder Interfluve
R P R P R P R P R P
DayThree 0Ð04 0Ð8818 �0Ð03 0Ð9241 0Ð001 0Ð9974 �0Ð03 0Ð9322 �0Ð03 0Ð9142Week 0Ð55 0Ð0511 0Ð52 0Ð0666 0Ð52 0Ð0705 0Ð52 0Ð0705 0Ð49 0Ð0914Month 0Ð89 0Ð0001 0Ð88 0Ð0002 0Ð87 0Ð0002 0Ð87 0Ð0002 0Ð83 0Ð0009Total 0Ð78 0Ð0018 0Ð74 0Ð0039 0Ð69 0Ð0088 0Ð69 0Ð0081 0Ð65 0Ð0173Totsum 0Ð19 0Ð5145 �0Ð07 0Ð9805 �0Ð06 0Ð9836 �0Ð04 0Ð8901 �0Ð13 0Ð6601Number 0Ð20 0Ð5046 0Ð06 0Ð8296 �0Ð02 0Ð9353 �0Ð03 0Ð9234 �0Ð12 0Ð7031
The analysis is based on NDVI data from the 15 dates of observation and the 25 replicas of physiographic units. The rainfall data used are presentedin Figure 1. Total, the amount of rainfall since last measurement; Three, the amount of rainfall 3 days before the measurement; Week, the amountof rainfall in the week before the current measurement; Month, the amount of rainfall in the month before the measurement; Totsum, the amountof rainfall in the entire season until the day of measurement; Number, the number of days without rainfall since the last measurement. The boldvariables are significant.
Copyright 2010 John Wiley & Sons, Ltd. Ecohydrol. (2010)
T. SVORAY AND A. KARNIELI
Figure 5. Variation in the annual NDVI integral at the Lehavim LTERsite. The water availability was estimated for every physiographicunit, based on the Svoray et al. (2008b) water availability model. Themodel is spatially and temporally explicit and was calculated withfuzzy algebra based on rainfall, temperature, evaporation conditionsfor the corresponding period and based on topographic, soil, andradiation conditions of the specific plots. The predicted water availabilityconditions are in normalized units between 0 and 1. The best fit wasobtained with a linear model. Each data point represents the averagevalue for the date of measurement for five plots, each cover an area of a
few tens of SPOT XS pixels over the 15 dates of observation.
regarding spatio-temporal variation in ANPP in semiaridecosystems. However, these observations raise severalquestions regarding the nonstationary spatial relationshipbetween rainfall characteristics and vegetation productiv-ity (Foody, 2003). With the record of four decades ofsatellite data, with a resolution of tens of meters, themapping of highly varying patterns of vegetation pro-ductivity on the landscape scale and using the derivedinformation in ecosystem studies are becoming feasible(Cohen and Goward, 2004). Here, the use of 15 SPOTimages with 20 m resolution, from a single growing sea-son, allowed us to study the effect of rainfall on NDVI in5 physiographic units at the Lehavim LTER site, duringa relatively dry season. To the best of our knowledge,this is the first attempt to use such an intensive seasonaltime series on this scale of observation; the procedureallowed us to test the effect of topography and of accu-mulated soil moisture on the production of annuals infour phenological phases.
Our results show that the physiographic unit does affectthe spatial variation in the NDVI of herbaceous vegeta-tion on the landscape scale. Theoretically, the variabilityin NDVI observed between the physiographic units maybe related to natural and man-made disturbance regimes(Paruelo and Lauenroth, 1997; Sala et al., 1997), butstudies of grazing habits at the Lehavim LTER site haveshown that grazing pressure is not biased by physio-graphic units (Svoray et al., 2009). Also, studies in otherareas have shown that fire spread is unlikely to be lim-ited by sub-slope distances (Carmel et al., 2009). In theabsence of nonuniform disturbances, the spatio-temporalvariation in productivity is expected to be governed by the
limiting resource in arid regions, i.e. water. We assumean equal distribution or only minor variation of rainfallover the entire watershed, with no substantial variationbetween the physiographic units (Svoray et al., 2007).Thus, this suggests that the difference in NDVI valuesbetween the units can be mainly attributed to the variationin available soil water, due to redistribution processes.According to this assumption, it is expected that plantsin the lower physiographic units, i.e. the footslope andthe channel, should respond well to improved water andsoil conditions and, therefore, should be more productive.
On the annual scale, the dependence of productivityon water redistribution processes was shown in thestrong correlation between the modelled soil water inthe unit and its seasonal NDVI accumulation (seasonalNDVI integral). The footslope and channel units allowedthe production of more biomass than the interfluveand shoulder/backslope units, which, with poor wateravailability, showed lower NDVI values. The importanceof these results lies in the complex rainfall–run-off–plantrelationships in semiarid regions (Rodriguez-Iturbe et al.,1999). Due to the complex response of different surfacesto rainfall characteristics (Yair and Kossovsky, 2002),which is not yet fully understood, it is unclear to whatextent water is actually redistributed in space after rainfallevents and if so, how the plants’ water consumptionand biomass production are affected. The differencebetween the productivity of the physiographic unitsfound here strengthens the assumption that the wateris redistributed and also strengthens the hypothesizedimportance of antecedent soil moisture conditions to theresponse of vegetation production to rainfall events (Ogleand Reynolds, 2004).
Furthermore, when we increase temporal resolution upto the single-event scale, the results show that NDVIresponse to rainfall is not immediate and that dry spellshave a relatively low effect on NDVI. Note that inter-mediate times lag—week-to-month—was found in theresponse of NDVI to rainfall pulses in the physiographicunits. The fact that the NDVI did not respond imme-diately to an effective rainfall event, nor was it largelyaffected by the length of the dry spells, implies that waterthat accumulates along the growing season in the soil, isbeing used by the plants in accordance with their physi-ological state (Kigel, 1995). In other words, the seeds donot germinate until a sufficient amount of water accumu-lates in the soil (Gutterman, 1994) and then germinateand grow in accordance with the available water in thesoil reservoir.
Obviously, effective rainfall events are important asthe main source of water supply. Indeed, in the currentcase, it is most likely that the large event in earlyFebruary did affect germination and the beginning ofgreening-up. However, apparently, the very small eventsand the water stored in the soil until mid-January—thenext effective rainfall event—were sufficient to allowthe rapid growth in all units during this period. Thisreinforces the importance of the physiological processesin the vegetation growth that are probably determining
Copyright 2010 John Wiley & Sons, Ltd. Ecohydrol. (2010)

RAINFALL, TOPOGRAPHY AND PRIMARY PRODUCTION RELATIONSHIPS
the relatively slow rate of greening-up during the winterand the rapid rate of drying in the end. The fact that thelength of the dry spell did not affect significantly NDVIvalues also implies that under the conditions of this year,even in the dry period, NDVI still increases if there isenough soil water that is available to the plant.
In general, the increase in NDVI may occur due toan increase in plant size (mainly height in the caseof annuals) or due to an increase in the number ofindividuals or by a change in the dominant species orspecies composition (Paruelo et al., 1997). We thereforeassume that the channel and the footslope, with a largecontributing area and thick soil profile, are dominated byspecies with high growth rates, due to the lower waterstress. For the poorer physiographic units, the dominanceof species with relatively low growth rates acts as a likelyconstraint on the response of ANPP to accumulatingrainfall.
This phenomenon was also observed at the LehavimLTER site by Osem et al. (2002), who found that har-vested dry biomass at peak season on the slopes was typ-ical of semiarid ecosystems with 10–200 g m�2 and onchannel shoulders (up to 700 g m�2), a value that reachesthe range of subhumid grassland ecosystems. Osem et al.(2002) also found that productivity in the studied arearises with richness in the variety of species. Increase inspecies richness may increase drought resistance, throughvariation in root structure and leaf area that affect photo-synthesis and growth rates. But, the large growth rate mayresult in an increase in competition for other resources,such as nitrogen and phosphorus. According to previ-ous studies, it is indeed expected that nutrient limitationwould increase relative to the rise in water availability(Menge et al., 2009).
Understanding spatial variations in production as afunction of physiography is essential as there are signif-icant differences in production across the landscape thataffects our estimations. An accurate monitoring systemwill help to indicate the status and change in ecosys-tem conditions between disturbance, recovery and dete-rioration (Cao et al., 2004); to predict carbon storageand the bio-geochemical dynamics of terrestrial ecosys-tems (Polly et al., 2005); to improve rangeland and live-stock productivity, as understanding changes in NDVIacross the slope catena may improve estimates of carry-ing capacity over extensive rangeland areas in dry hillyecosystems (Ungar et al., 1999); and to predict the effectof climate change on ecosystems (Coughenour and Chen,1997).
The results showed here also call attention to the needto study the sink–source effect on semiarid ecosystemsat multiple scales. For example, the effect of NDVIvariation in physiographic units on the analysis of NDVIdata from coarse resolution spaceborne systems (i.e.NOAA–AVHRR) in hilly and mountainous areas shouldbe addressed. Generalizing different physiographic units,in a lower resolution analysis, may lead to an unbalancedestimation of the ecosystem functioning, due to thenonlinear effect that small ‘hotspot’ areas of high NDVI
values, such as a channel and its banks, may have onthe mean value from a given area (Karnieli et al., 1996)and therefore may mislead interpretation of the analysisof mean values.
Future progress in working with such a detailedtime series of satellite data on the landscape scalecould be achieved through coupling these observationswith heuristic rainfall-production models (e.g. Ogle andReynolds, 2004; Svoray et al., 2008b) that explicitlyformalize, in time and space, how different functionaltypes respond to rainfall events through the use of rainfallthresholds and plant strategies. Such a coupling willallow better understanding of the effect of rainfall eventsand of soil moisture storage on ecosystem productivityin semiarid zones and eventually allow us to scale upproduction responses to the landscape level.
CONCLUSIONS
Our study shows that NDVI temporal profiles overthe Lehavim LTER site and the different physiographicunits can be explained by the four phenological phasesof semiarid annual vegetation. It reinforces the valueof using NDVI data in conjunction with topographicdata to study vegetation conditions in the heterogeneitythat occurs across landscapes. Furthermore, our resultsstrengthen the hypothesized importance of antecedentsoil moisture conditions to the response of ecosystemproductivity to rainfall events. More specifically, ourresults show that
1. The NDVI differ significantly in value between theinterfluve, slope shoulder and backslope (two units thatappeared indistinguishable), footslope and the channel.However, all of these showed a similar trend, with amoderate increase in growth, but much sharper declineduring the drying phase.
2. There is relatively late response of vegetation to rain-fall events. Monthly rainfall was much more significantin explaining NDVI than daily rainfall, total rainfall,and the length of dry spells. Ecosystem health monitor-ing and study should therefore consider not only meanrainfall, but also long-term effects of rainfall eventsand physiographic units.This evidence regarding the constraints on NDVI mag-
nitude by physiographic units allows better understandingof ecosystem responses to stress, as well as better gener-alization from plot to regional scale. Such generalizationcan be misleading, due to the neglect of surface hydro-logical processes at these scales.
ACKNOWLEDGEMENTS
This research was supported by the Israel Science Foun-dation (grant No. 692/06), the Advisory Board of RangeManagement of the Ministry of Agriculture and the Jew-ish National Fund (KKL). We thank Eitan Livne for hishelp with data processing, the Geological Survey of Israel
Copyright 2010 John Wiley & Sons, Ltd. Ecohydrol. (2010)

T. SVORAY AND A. KARNIELI
for providing the DEM, and the OASIS project and SPOTIMAGE for providing most of the images that were usedin this project.
REFERENCES
Beven K, Kirkby MJ. 1979. A physically-based, variable contributingarea model of basin hydrology. Hydrological Sciences Bulletin 24:1–10.
Cao M, Stephen DP, Small J, Goetz SJ. 2004. Remotely sensedinterannual variations and trends in terrestrial net primary productivity1981–2000. Ecosystems 7: 233–242.
Carmel Y, Paz S, Jahashan F, Shoshany M. 2009. Assessing fire riskusing Monte Carlo simulations of fire spread. Forest Ecology andManagement 257: 370–377.
Chhabra A, Dadhwal VK. 2004. Estimating terrestrial net primaryproductivity over India using satellite data. Current Science 86:269–271.
Cohen WB, Goward SN, 2004. Landsat’s role in ecological applicationsof remote sensing. Bioscience 54: 535–545.
Conacher AJ, Dalrymple JB. 1977. The nine unit landsurface model: anapproach to pedogeomorphic research. Geoderma 18: 1–153.
Coughenour MB, Chen D. 1997. Assessment of grassland ecosystemresponses to atmospheric change using linked plant-soil process model.Ecological Applications 7: 802–827.
Danin A, Orshan G. 1990. The distribution of Raunkier life-forms inIsrael in relation to the environment. Journal of Vegetation Science 1:41–48.
Foody GM. 2003. Geographical weighting as a further refinement toregression modelling: An example focused on the NDVI–rainfallrelationship. Remote Sensing of Environment 88: 283–293.
Gutterman Y. 1994. Strategies of seed dispersal and germination in plantsinhabiting deserts. Botanical Review 60: 373–425.
Hunt ER, Everitt JH, Ritchie JC, Moran MS, Booth DT, Anderson GL.2003. Applications and research using remote sensing for rangelandmanagement. Photogrammetric Engineering and Remote Sensing 69:675–693.
Hall J. 1993. The GSI digital terrain model (DTM) project completed.Geological Survey of Israel Current Research 8: 47–50.
Hill MJ, Donald GE. 2003. Estimating spatio-temporal patterns ofAgricultural productivity in fragmented landscapes using AVHRRNDVI time series. Remote Sensing of Environment 84: 367–384.
Imeson AC, Prinsen HAM. 2004. Vegetation patterns as biologicalindicators for identifying runoff and sediment source and sink areas forsemi-arid landscape in Spain. Agriculture, Ecosystem and Environment104: 333–342.
Jobbagy EG, Sala OE, Paruelo JM. 2002. Patterns and controls ofprimary production in the Patagonian steppe, a remote sensingapproach. Ecology 83: 307–319.
Karnieli A. 2003. Natural vegetation phenology assessment by groundspectral measurements in two semi-arid environments. InternationalJournal of Biometeorology 47: 179–187.
Karnieli A, Shachak M, Tsoar H, Zaady E, Kaufman Y, Danin A,Porter W. 1996. The effect of microphytes on the spectral reflectanceof vegetation in semi-arid regions. Remote Sensing of Environment 57:88–96.
Kigel J. 1995. Seed germination in arid and semiarid regions. In SeedDevelopment and Germination. Kigel J., Galili G (eds.) Marcel DekkerInc: New York.
Kogan F, Stark R, Gitelson A, Jargalsaikhan L, Dugrajav C, Tsooj S.2004. Derivation of pasture biomass in Mongolia from AVHRR-basedvegetation health indices. International Journal of Remote Sensing 25:2889–2896.
Lauenroth WK, Bradford JB. 2009. Ecohydrology of dry regions ofthe United States: precipitation pulses and intraseasonal drought.Ecohydrology 2: 173–181.
Menge DNL, Pacala SW, Hedin LO. 2009. Emergence and maintenanceof nutrient limitation over multiple timescales in terrestrial ecosystems.American Naturalist 173: 164–175.
Nagendra H. 2001. Using remote sensing to assess biodiversity.International Journal of Remote Sensing 22: 2377–2400.
Nagler P-L, Glenn E-P, Kim H, Emmerich W, Scott R-L, Huxmam T-E, Huete A-R. 2007. Relationship between evapotranspiration andprecipitation pulses in a semiarid rangeland estimated by moisture fluxtowers and MODIS vegetation indices. Journal of Arid Environments70: 443–462.
Noy-Meir I. 1973. Desert ecosystems, environment and producers.Annual Review of Ecology and Systematics 4: 25–51.
Ogle K, Reynolds JF. 2004. Plant responses to precipitation in desertecosystems: integrating functional types, pulses, thresholds, and delays.Oecologia 141: 282–294.
Osem Y, Perevolotsky A, Kigel J. 2002. Grazing effect on diversity ofannual plant communities in a semi-arid rangeland, interactions withsmall-scale spatial and temporal variation in primary productivity.Journal of Ecology 90: 936–946.
Park SJ, McSweeney K, Lowery B. 2001. Identification of the spatialdistribution of soil using a process-based terrain characterization.Geoderma 103: 249–272.
Paruelo JM, Epstein HE, Lauenroth WK, Burke IC. 1995. ANPPestimates from NDVI for the central grassland region of the UnitedStates. Ecology 78: 953–958.
Paruelo JM, Epstein HE, Lauenroth WK, Burke IC. 1997. ANPPestimates from NDVI for the Central Grassland region of the US.Ecology 78: 953–958.
Paruelo JM, Lauenroth WK. 1997. Regional patterns of NDVI in NorthAmerican shrublands and grasslands. Ecology 76: 1888–1898.
Pettorelli N, Vik JO, Mysterud A, Gaillard JM, Tucker CJ, Stenseth NC.2005. Using the satellite-derived NDVI to assess ecological responsesto environmental change. Trends in Ecology and Evolution 20:503–510.
Polly HW, Jonson HB, Derner JD. 2005. Increasing CO2 fromsubambient to superambient concentrations alters species compositionand increases above-ground biomass in C3/C4 grassland. NewPhytologist 160: 319–327.
Reynolds JF, Kemp PR, Ogle K, Fernandez RJ. 2004. Modifying the‘pulse-reserve’ paradigm for deserts of North America: precipitationpulses, soil water, and plant responses. Oecologia 141: 194–210.
Rodriguez-Iturbe I, D’Odorico A, Porporato E, Ridolfi L, 1999. On thespatial and temporal links between, vegetation, climate, and soilmoisture. Water Resources Research 35: 3709–3722.
Sala OE, Lauenroth WK, Golluscio RA. 1997. Plant functional types intemperate arid regions. In Plant functional types . Cambridge UniversityPress: Cambridge.
Sannier CAD, Taylor JC, Plessis WDu. 2002. Real-time monitoring ofvegetation biomass with NOAA–AVHRR in Etosha National Park,Namibia, for fire risk assessment. International Journal of RemoteSensing 23: 71–89.
Svoray T, Mazor S, Bar Kutiel P. 2007. How is shrub cover related tosoil moisture and patch geometry in the fragmented landscape of thenorthern Negev Desert? Landscape Ecology 22: 105–116.
Svoray T, Karnieli A, Dedieu G. 2008a. Satellite evidence of atopographic sink-source system in a small semiarid watershed.International Journal of Remote Sensing 29: 609–616.
Svoray T, Shafran-Nathan R, Henkin Z, Perevolotsky A. 2008b. Spa-tially and temporally explicit modeling of conditions for primary pro-duction of annuals in dry environments. Ecological Modelling 218:339–353.
Svoray T, Shafran-Nathan R, Ungar E-D, Arnon A, Perevolotsky A.2009. Integrating GPS technologies in dynamic spatio-temporal modelsto monitor grazing habits in dry rangelands. In Recent Advances inRemote Sensing and Geoinformation Processing for Land DegradationAssessment , Hill J, Roeder A (eds). Taylor and Francis: Leiden;302–312.
Svoray T, Shoshany M. 2004. SAR based analysis of intrinsic propertiesof four Mediterranean soil formations: Spatio-temporal patterns ofdrying rates. Remote Sensing of Environment 92: 233–246.
Tucker CJ, Newcomb WW, Los SO, Prince SD. 1991. Mean and inter-year variation of growing-season normalized difference vegetationindex for the Sahel 1981–1989. International Journal of RemoteSensing 12: 1133–1135.
Tucker CJ, Nicholson SE. 1999. Variations in the size of the SaharaDesert from 1980 to 1997. Ambio 28: 587–591.
Turnbull L, Wainwright J, Brazier, RE. 2008. A conceptual frameworkfor understanding semi-arid land degradation: ecohydrologicalinteractions across multiple-space and time scales. Ecohydrology 1:23–34.
Ungar ED, Perevolotsky A, Yonatan R, Barkai D, Hefets Y, Barham H.1999. Primary production of natural pastures of the hilly northernNegev—contributory factors and management implications. Ecologyand Environment 5: 130–140. (In Hebrew).
Vermote EF, Tanre D, Deuze JL, Herman M, Morcrette JJ. 1997. SecondSimulation of the Satellite Signal in the Solar Spectrum, 6S: an
Copyright 2010 John Wiley & Sons, Ltd. Ecohydrol. (2010)

RAINFALL, TOPOGRAPHY AND PRIMARY PRODUCTION RELATIONSHIPS
overview. IEEE Transactions on Geoscience and Remote Sensing 35:675–686.
Walter H. 1971. Ecology of Tropical and Sub Tropical Vegetation . Oliverand Boyd: Edinburgh.
Wang J, Rich PM, Price KP. 2003. Temporal responses of NDVI toprecipitation and temperature in the central Great Plains, USA.International Journal of Remote Sensing 24: 2345–2364.
Wilcox BPD, Breshears D, Allen CD. 2003. Ecohydrology of a resource-conserving semiarid woodland: effects of scale and disturbance.Ecological Monographs 73: 223–239.
Yair A, Kossovsky A. 2002. Climate and surface properties: hydrologicalresponse of small and semi-arid watersheds. Geomorphology 4: 43–57.
Copyright 2010 John Wiley & Sons, Ltd. Ecohydrol. (2010)
Copyright © 2022 FDOKUMEN