
Will investors change their superannuation fund given the choice?
17
Accounting and Finance 47 (2007) 267–283 © The Authors Journal compilation © 2007 AFAANZ Blackwell Publishing, Ltd. Oxford, UK ACFI Accounting and Finance 0810-5391 © The Authors Journal compilation © 2006 AFAANZ 47 1 ORIGINAL ARTICLE T. Fry et al./Accounting and Finance 47 (2006) 00–00 T. Fry et al./Accounting and Finance 47 (2006) 00–00 Will investors change their superannuation fund given the choice? Tim Fry, Richard Heaney, Warren McKeown School of Economics, Finance and Marketing, RMIT University, Melbourne, 3000, Australia Abstract A large number of Australian investors have been granted the right to choose where their superannuation fund contributions will be invested, but it is difficult to ascertain whether investors will exercise this choice. Although expected- utility-maximizing investors might tend to change their fund once given the choice, loss averse investors would favour the status quo. Using a survey of over 1600 Australian investors, conducted by FinaMetrica in early 2005, we find support for inertia (status quo) in our sample suggesting that, with respect to superan- nuation choice, individual Australian investors are loss averse. Key words: Choice of fund, Prospect theory, Superannuation JEL classification: D14, G11, G23 doi: 10.1111/j.1467-629x.2006.00203.x 1. Introduction Virtually all developed nations face the problem of ensuring adequate provision is made for an ageing population, and in some countries, including Australia, compulsory savings schemes have been set up to meet this need. In the 1980s the Australian Labor government expanded a rather limited government- and corporation-based superannuation system to create the present national super- annuation scheme. Generally, superannuation funds are established as trusts and the trustees of the fund are responsible for the investment and management of the assets of the fund. Initially, the ultimate beneficiaries had little say in where their contributions were invested. It was the employer or union group representatives, We acknowledge the use of the Personal Investor Survey data provided by FinaMetrica Ltd and we thank Geoff Davey, FinaMetrica Ltd CEO, and Nicki Chua, FinaMetrica Ltd Research and Technical Services, for their support. Received 11 April 2006; accepted 31 May 2006 by Robert Faff (Editor)
-
Upload
independent -
Category
Documents
-
view
0 -
download
0
Transcript of Will investors change their superannuation fund given the choice?

Accounting and Finance 47 (2007) 267–283
©
The AuthorsJournal compilation
©
2007 AFAANZ
Blackwell Publishing, Ltd.Oxford, UKACFIAccounting and Finance0810-5391© The Authors Journal compilation © 2006 AFAANZ471
ORIGINAL ARTICLE
T. Fry
et al./
Accounting and Finance 47 (2006) 00–00T. Fry
et al./
Accounting and Finance 47 (2006) 00–00
Will investors change their superannuation fund given the choice?
Tim Fry, Richard Heaney, Warren McKeown
School of Economics, Finance and Marketing, RMIT University, Melbourne, 3000, Australia
Abstract
A large number of Australian investors have been granted the right to choosewhere their superannuation fund contributions will be invested, but it is difficultto ascertain whether investors will exercise this choice. Although expected-utility-maximizing investors might tend to change their fund once given thechoice, loss averse investors would favour the status quo. Using a survey of over 1600Australian investors, conducted by FinaMetrica in early 2005, we find supportfor inertia (status quo) in our sample suggesting that, with respect to superan-nuation choice, individual Australian investors are loss averse.
Key words
: Choice of fund, Prospect theory, Superannuation
JEL classification
: D14, G11, G23
doi
: 10.1111/j.1467-629x.2006.00203.x
1. Introduction
Virtually all developed nations face the problem of ensuring adequate provisionis made for an ageing population, and in some countries, including Australia,compulsory savings schemes have been set up to meet this need. In the 1980sthe Australian Labor government expanded a rather limited government- andcorporation-based superannuation system to create the present national super-annuation scheme. Generally, superannuation funds are established as trusts andthe trustees of the fund are responsible for the investment and management ofthe assets of the fund. Initially, the ultimate beneficiaries had little say in where theircontributions were invested. It was the employer or union group representatives,
We acknowledge the use of the Personal Investor Survey data provided by FinaMetrica Ltdand we thank Geoff Davey, FinaMetrica Ltd CEO, and Nicki Chua, FinaMetrica LtdResearch and Technical Services, for their support.
Received 11 April 2006;
accepted 31 May 2006 by Robert Faff (Editor)
268 T. Fry
et al.
/
Accounting and Finance 47 (2007) 267–283
©
The AuthorsJournal compilation
©
2007 AFAANZ
acting as trustees, who were responsible for investment and management ofsuperannuation contributions. These rather complex principal/agent relationshipsare discussed in the academic literature (Drew and Stanford, 2003) althoughrarely identified in the financial press. One decision over which investors havegained some control is the right to choose where their superannuation contributionsare invested. Recent changes in Australian law have resulted in a large proportionof these beneficiaries being given the right to choose their superannuation fundrather than leave this decision to their employer or union.
1
The question that weaddress in the present paper concerns how individuals will react to the provision ofthis choice. Will they remain with their existing superannuation funds or willthey move their superannuation investments elsewhere?
It is difficult to argue that investors do not have enough information to makean informed super fund choice. There is extensive information provided in thedaily press and personal investment journals and specialist advice is availablefrom a range of professional advisers. Nevertheless, recent behavioural literatureindicates that investors might make relatively poor investment decisions, eveninvestors who spend considerable time on research such as those in share clubs(Barber and Odean, 2000, 2002; Barber
et al.
, 2003).The Australian Government is sensitive to the UK experience with privatization
of its superannuation schemes and it has moved to educate investors and to regulatefinancial advisers concerning their role in the introduction of personal choice tosuperannuation investment. The professional financial advisers are also awareof the importance of this change and their professional body has taken considerableaction to ensure that their members do not recommend unnecessary changes insuperannuation. Finally, the existing Australian funds that provide superannuationproducts are concerned about the introduction of choice. They could lose highnet wealth investors to other funds, particularly self-managed funds, if investorsare given choice and choose to exercise that choice.
2
Superannuation and superannuation choice have been the subject of researchin Australia, with particular emphasis on the choice that was offered to membersof the Australian Superannuation Scheme for Australian Universities (SSAU)(Clark-Murphy and Gerrans, 2001, 2004). This scheme offered its members aone-off choice between remaining with the existing defined benefit plan orselecting one of four investment accumulation accounts. The actual decision toremain with the defined benefit scheme, the status quo, was made by default(31.6 per cent) or by completion of the choice form (35.1 per cent), with theremainder choosing the investment accumulation accounts alternative (33.3 per
1
The Australian Government expect that 4.82 million of Australia’s 9.8 million employeeswill be eligible to choose their superannuation fund from 1 July 2005.
2
The recent dramatic growth in self-managed funds provides a particularly important super-annuation alternative for high net wealth investors. This alternative is less suitable forsmaller investors who would generally find self-managed funds too costly to set up andmanage.

T. Fry
et al.
/
Accounting and Finance 47 (2007) 267–283 269
©
The AuthorsJournal compilation
©
2007 AFAANZ
cent). Many of the respondents to a follow-up survey issued to the academicsstated that they felt that they did not understand the choices properly and thatthey found the decision quite difficult (Clark-Murphy and Gerrans, 2001; Clark-Murphy
et al.
, 2002). This lack of understanding is also apparent in the broadercommunity-based research (Beal and Delpachitra, 2004).
Yet, there is little attempt in this literature to explain these results in terms ofbehavioural models of decision-making. For example, why would a lack ofunderstanding lead investors to remain with their existing fund? Investors whosuffer from inadequate information or understanding could just as easily chooseto change their investment. Behavioural theory might improve our understandingof superannuation investment choice, particularly with respect to the inertia orstatus quo effect observed in recent Australian superannuation choice literature.Behavioural theory predicts that loss averse individuals prefer the status quowhen faced with decisions concerning the disposition of an endowment (Knetsch,1989; Kahneman
et al.
, 1991; Tversky and Kahneman, 1991) and that this inertiamight be reinforced as the complexity of the underlying decision increases(Sethi-Iyengar
et al.
, 2004).We analyse the impact of the introduction of individual investment choice in
the Australian superannuation industry using a unique questionnaire administeredby FinaMetrica to readers of an investment magazine (
Personal Investor
) in early2005 with 1647 useable responses. Most investors stated that they were not consi-dering exercising their right to change their superannuation fund and the resultsof our analysis support the status quo effect predicted by recent behavioural theory.Section 2 focuses on possible responses to this decision, drawing on recent behavi-oural theory. Section 3 discusses the survey responses, while Section 4 describesthe results of our analysis and Section 5 summarizes the results of the study.
2. The investor decision
Although there are a number of alternative theories of choice that could beapplied to analysis of this decision (Machina, 1987), we rely on recent behav-ioural theory (Kahneman and Tversky, 1979, 1984) to model how investors willrespond to the introduction of choice. This theory is found to explain manyindividual decisions that do not fit well with traditional theories of choice.Examples include consumer choice (Thaler, 1980), the disposition effect(Odean, 1998), labour supply (Camerer
et al.
, 1997), money illusion (Shafir
et al.
,1997), pricing decisions (Kahneman
et al.
, 1986) and an explanation of theequity premium (Benartzi and Thaler, 1995).
The Kahneman and Tversky theory is not driven by preferences over totalwealth, which is the case with the traditional expected-utility-based approaches.Choice is modelled in terms of gains or losses, where loss-averse individualsmake their decisions with respect to a particular reference point. Aversion tolosses is evident in a number of experiments, with individuals being found toweight losses over twice as much as they weight gains (Tversky and Kahneman,
270 T. Fry
et al.
/
Accounting and Finance 47 (2007) 267–283
©
The AuthorsJournal compilation
©
2007 AFAANZ
1992). There is also evidence that individuals do not weight probability in thelinear fashion assumed in expected-utility theory (Tversky and Fox, 1995).These differences help to explain the inconsistencies that have been noted betweenan individual’s observed behaviour and behaviour predicted by expected utility.We draw on prospect theory that models decision-making in terms of the product ofa value function and a non-linear probability weighting function (Kahneman andTversky, 1979). The prospects associated with different choices are calculatedusing the function:
(1)
The non-linear probability weighting function,
π
(
p
i
), is applied to probabil-ity,
p
i
, and the value function,
v
(
x
i
), is the function applied to payoff,
z
i
, relativeto the reference point,
r
, where
x
i
=
z
i
– r
. The value function is concave abovethe reference point and it is convex below the reference point. This function isexpressed in terms of gains, or losses, Furthermore,
and , with the value function havingthe steepest slope at the reference point (Kahneman and Tversky, 1979).
It is important to note that prospect theory refers to gains and losses withrespect to a particular reference point or benchmark. It does not imply thatwealthy investors will be any less concerned about superannuation fund choicethan other investors and it does not impose the same restrictions on risky choicethat expected utility theory imposes. Wealthy investors might be just as concernedabout losing an additional dollar as poor investors. In fact, they could be moreconcerned, depending on their unique utility function parameters.
An important prediction from this model is the disposition effect (Odean,1998), where investors tend to hold onto loss-making shares too long and sellprofitable investments too soon. Essentially, investors behave as if they are lossaverse. Let us assume that the investor’s reference point is their current shareportfolio and that they review their investment at a particular time. If a share ismaking losses, then the convex value function over losses predicts that aninvestor will prefer a gamble to a realized loss and, therefore, they will tend tocontinue to hold the share while there is still some probability of positivereturns in the future. The concave value function over profits predicts that theinvestor will prefer a sure gain to a gamble and so there is a tendency to sell theshares once gains are made rather than continue to hold the shares in the hopeof even greater future gains. As superannuation profits cannot be realized untilretirement, the opportunity to immediately realize gains is not available and,therefore, this will tend to exaggerate the already strong incentives for inertia.
Furthermore, the existence of mental accounting (Thaler, 1999) can lead tothe segregation of decisions according to the nature of the decision. Thalerargues that individuals treat money differently depending on how they allocateit to a particular use. Cash is generally used for immediate consumption unless it isallocated to saving or some particular future use. Individuals appear to bracket
π( ) ( ).p v xi ii
I
=∑ 1
x z ri i+ = − ≥ ,0 x z ri i
− = − < .0′ > ′′ <+ +v x v xi i( ) , ( ) 0 0 ′ < ′′ >− −v x v xi i( ) , ( ) 0 0
T. Fry
et al.
/
Accounting and Finance 47 (2007) 267–283 271
©
The AuthorsJournal compilation
©
2007 AFAANZ
particular types of investments into categories with losses and gains comparedonly for assets that fall within the particular category. Cash allocated to savingtends to remain untouched, whereas cash allocated for immediate consumption isused quickly. Assuming that this behaviour is common among Australian investorsthen these investors will tend to view long-term savings invested in a superan-nuation fund differently from cash available for immediate consumption.
The status quo effect is perhaps the most salient for the superannuation choiceliterature. It is found that when individuals are provided with a default choicethey are more likely to remain with the default and that the likelihood ofremaining with the default choice increases as the range of alternatives increases(Tversky and Kahneman, 1986; Kahneman
et al.
, 1991; Johnson
et al.
, 1992). Thisresult can be tied back to the prospect theory model of investor choice and inthis case the reference point is the current superannuation plan. The shape ofthe prospect theory value function suggests that the expected benefits fromchanging superannuation fund would need to be substantial, relative to theexpected losses, before an investor would choose to change funds. Yet, it isgenerally found that Australian superannuation funds’ returns are reasonablysymmetric in nature and do not appear to be correlated with past performance(Bird
et al.
, 1983; Hallahan, 1999; Drew and Stanford, 2003; Bilson
et al.
, 2004,2005). Therefore, the main prediction that can be drawn from recent behaviouraltheory is that investors, in general, will choose to remain with their existingfund, even when they might not be particularly happy with the performance oftheir fund. Hence, there is a tendency for inertia; investors prefer the status quo.This behaviour is also evident in the analysis of the SSAU choice (Clark-Murphyand Gerrans, 2001, 2004), although loss aversion has not been raised as a possibleexplanation for this behaviour in the literature. The Australian literature hasgenerally recommended improved education as a response to survey results (Clark-Murphy and Gerrans, 2001, 2004; Beal and Delpachitra, 2004), although there islittle attempt to explain the behaviour in terms of a decision-making theory,such as prospect theory.
Given the nature of superannuation, a loss averse investor will tend to donothing when given the choice to change funds. This is consistent with theweighting attached to losses being much greater than the weighting attached togains and it also ties in with the status quo effects that are noted in the literature.Furthermore, there is a tendency for investors to do nothing when faced with acomplex decision. The introduction of choice for superannuants suddenly places theindividual in a position of choosing among a bewildering array of investment alter-natives, each with differing levels of past investment performance, differing benchmarkportfolios and differing advertised objectives. Furthermore, in early survey workrespondents indicated that superannuation decisions were difficult (Clark-Murphy
et al.
, 2002). Inertia is expected in the face of such complexity (Sethi-Iyengar
et al.
, 2004). Finally, in Thaler’s model of individual financial accounting, it ispredicted that investors will separate their superannuation investment, isolatingthese investments from their normal consumption spending (Thaler, 1980).
272 T. Fry
et al.
/
Accounting and Finance 47 (2007) 267–283
©
The AuthorsJournal compilation
©
2007 AFAANZ
Although recent behavioural theory predicts that the introduction of choicewill be marked by investor inertia, there is one group of investors who might changetheir fund. These are investors who have changed their investment benchmarkor reference point. They might have selected a more ambitious reference pointrequiring transfer to a fund that is perceived to be more likely to meet their newfinancial goals for example. The young informed investors referred to in theSSAU study may fall within this group (Clark-Murphy and Gerrans, 2001). Thekey determinants of change in this group include investor knowledge of andexperience with financial assets as well as the identification of better performingfund/s that could replace the existing fund as a reference point. This group ofinvestors is of particular interest to regulators as there has been considerableeffort put into avoiding the situation that arose in the UK where financial advisersrecommended that investors change funds on the basis of inflated levels ofexpected fund performance. If financial advisers or competitor superannuationfunds can convince an investor that their current investment is underperformingand that they should update their investment reference point, then it is likelythat these investors will change their fund.
3. Data
The FinaMetrica questionnaire responses were obtained from readers of thebusiness magazine,
Personal Investor
. The FinaMetrica survey has been run fora number of years although the 2005 survey completed in March 2005 is thesubject of analysis because it specifically addresses investor attitude to theintroduction of superannuation choice. The questionnaire covers a wide rangeof topics, including investor attitude to risk, investment choice, financial planningand superannuation, although we focus on those questions that are most closelyrelated to the decision to change superannuation fund.
We rely on demographic information to gain a sense of the representativenessof the sample. Although only 54.46 per cent of the sample provided detaileddemographic information, of these 84.06 per cent of respondents were male,65.11 per cent had a university degree or higher qualification, 75.82 per centearned $A50 000 or more per annum and 85.18 per cent had net assets valuedat $A250 000 or more.
3
Virtually all of the participants (98 per cent) who completedthe demographics questions were married. This is unusual because the proportionof married participants who completed the demographic questions has generallybeen less, with 77, 74 and 79 per cent in 2002, 2003 and 2004, respectively(Table 1). FinaMetrica argue that the incidence of married individuals that com-pleted the demographic data was plausible. Certainly, there has been variation
3
Detailed frequency and descriptive statistics are available on request for responses to thequestions concerning demographics, attitude to investing, financial position, attitude tosuperannuation and the key question for this paper concerned with the investor’s attitude tochanging superannuation fund.

T. Fry
et al.
/
Accounting and Finance 47 (2007) 267–283 273
©
The AuthorsJournal compilation
©
2007 AFAANZ
in the response rates for the demographic questions over the last 4 years, withresponses to the marriage question standing at 52 per cent of the sample in2002, 82 per cent in 2003, 83 per cent in 2004, and 53 per cent in 2005. Inshort, completion of these questions is not compulsory and, hence, FinaMetricaargue that variation in the completion rate for demographic questions is to beexpected.
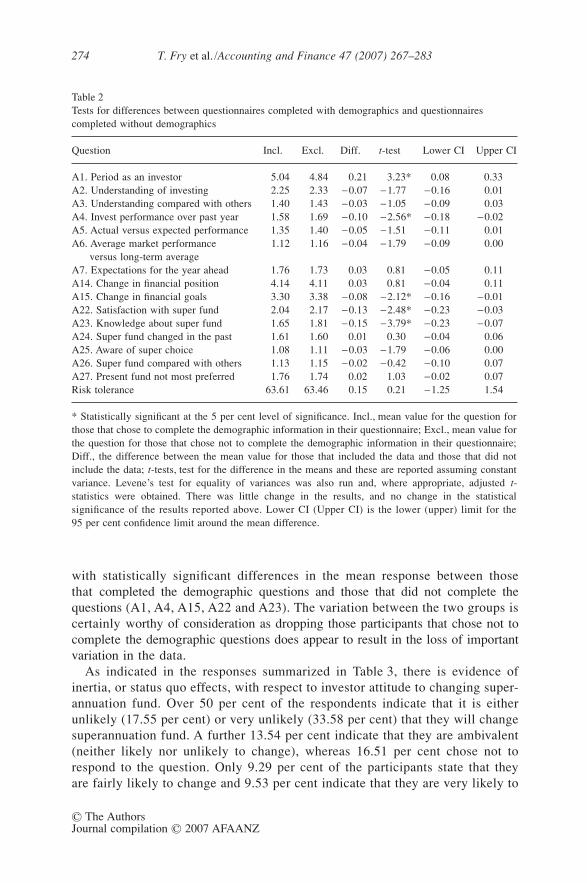
Table 2 gives some insight into the impact of the response to demographicquestions. A series of
t
-tests for differences in the non-demographic questionswere conducted and are reported in this table. The tests identify five questions
Table 1Demographics for the questionnaire since 2002
2002 (%) 2003 (%) 2004 (%) 2005 (%)
SexMale 0.80 0.81 0.76 0.84Female 0.20 0.19 0.24 0.16
EducationDid not complete high school 0.03 0.05 0.06 0.04Completed high school 0.11 0.11 0.10 0.09Trade or diploma qualification 0.20 0.22 0.20 0.22University degree or higher qualification 0.67 0.62 0.63 0.65
IncomeUnder $A30 000 0.09 0.11 0.13 0.08$A30 000–50 000 0.19 0.19 0.22 0.16$A50 000–100 000 0.43 0.43 0.41 0.40$A100 000–200 000 0.27 0.21 0.19 0.26Over $A200 000 0.03 0.06 0.05 0.09
Married or de factoYes 0.77 0.74 0.79 0.98No 0.23 0.26 0.21 0.02
Combined IncomeUnder $A30 000 0.01 0.04 0.05 0.03$A30 000–50 000 0.07 0.08 0.10 0.09$A50 000–100 000 0.33 0.36 0.38 0.31$A100 000–200 000 0.49 0.40 0.36 0.40Over $A200 000 0.11 0.12 0.11 0.16
Net assetsUnder $A10 000 0.01 0.02 0.02 0.01$A10 000–25 000 0.03 0.03 0.02 0.00$A25 000–50 000 0.04 0.05 0.03 0.02$A50 000–100 000 0.10 0.07 0.05 0.03$A100 000–150 000 0.05 0.07 0.05 0.02$A150 000–250 000 0.07 0.09 0.06 0.06$A250 000–500 000 0.25 0.19 0.17 0.14$A500 000–1 000 000 0.27 0.26 0.30 0.28$A1 000 000–2500 000 0.13 0.17 0.25 0.31Over $A2 500 000 0.03 0.04 0.06 0.13
274 T. Fry
et al.
/
Accounting and Finance 47 (2007) 267–283
©
The AuthorsJournal compilation
©
2007 AFAANZ
with statistically significant differences in the mean response between thosethat completed the demographic questions and those that did not complete thequestions (A1, A4, A15, A22 and A23). The variation between the two groups iscertainly worthy of consideration as dropping those participants that chose not tocomplete the demographic questions does appear to result in the loss of importantvariation in the data.
As indicated in the responses summarized in Table 3, there is evidence ofinertia, or status quo effects, with respect to investor attitude to changing super-annuation fund. Over 50 per cent of the respondents indicate that it is eitherunlikely (17.55 per cent) or very unlikely (33.58 per cent) that they will changesuperannuation fund. A further 13.54 per cent indicate that they are ambivalent(neither likely nor unlikely to change), whereas 16.51 per cent chose not torespond to the question. Only 9.29 per cent of the participants state that theyare fairly likely to change and 9.53 per cent indicate that they are very likely to
Table 2Tests for differences between questionnaires completed with demographics and questionnaires completed without demographics
Question Incl. Excl. Diff. t-test Lower CI Upper CI
A1. Period as an investor 5.04 4.84 0.21 3.23* 0.08 0.33A2. Understanding of investing 2.25 2.33 −0.07 −1.77 −0.16 0.01A3. Understanding compared with others 1.40 1.43 −0.03 −1.05 −0.09 0.03A4. Invest performance over past year 1.58 1.69 −0.10 −2.56* −0.18 −0.02A5. Actual versus expected performance 1.35 1.40 −0.05 −1.51 −0.11 0.01A6. Average market performance
versus long-term average1.12 1.16 −0.04 −1.79 −0.09 0.00
A7. Expectations for the year ahead 1.76 1.73 0.03 0.81 −0.05 0.11A14. Change in financial position 4.14 4.11 0.03 0.81 −0.04 0.11A15. Change in financial goals 3.30 3.38 −0.08 −2.12* −0.16 −0.01A22. Satisfaction with super fund 2.04 2.17 −0.13 −2.48* −0.23 −0.03A23. Knowledge about super fund 1.65 1.81 −0.15 −3.79* −0.23 −0.07A24. Super fund changed in the past 1.61 1.60 0.01 0.30 −0.04 0.06A25. Aware of super choice 1.08 1.11 −0.03 −1.79 −0.06 0.00A26. Super fund compared with others 1.13 1.15 −0.02 −0.42 −0.10 0.07A27. Present fund not most preferred 1.76 1.74 0.02 1.03 −0.02 0.07Risk tolerance 63.61 63.46 0.15 0.21 −1.25 1.54
* Statistically significant at the 5 per cent level of significance. Incl., mean value for the question forthose that chose to complete the demographic information in their questionnaire; Excl., mean value forthe question for those that chose not to complete the demographic information in their questionnaire;Diff., the difference between the mean value for those that included the data and those that did notinclude the data; t-tests, test for the difference in the means and these are reported assuming constantvariance. Levene’s test for equality of variances was also run and, where appropriate, adjusted t-statistics were obtained. There was little change in the results, and no change in the statisticalsignificance of the results reported above. Lower CI (Upper CI) is the lower (upper) limit for the95 per cent confidence limit around the mean difference.

T. Fry et al. /Accounting and Finance 47 (2007) 267–283 275
© The AuthorsJournal compilation © 2007 AFAANZ
change their superannuation fund with the introduction of choice. It is importantto note that these results are not too dissimilar from those reported by thesuperannuation administrators, SuperPartners, who found that only 9 per centof investors that they surveyed said that they would definitely change theirsuperannuation fund (Newspoint, 2005), with approximately 12 per cent indi-cating that they would probably change.
4. Analysis
The basic question addressed in this paper concerns whether investors willchoose to change their superannuation fund if given the opportunity. One questiondirectly addresses this issue (Table 3), but because of the nature of the questionthere are just five possible values that participants may choose: very likely,fairly likely, neither likely nor unlikely, fairly unlikely and very unlikely.Although these responses are naturally ordered, the responses are not continuous innature. Therefore, ordinary least-squares regression is not appropriate for analysisof this data and, hence, we draw on the ordered response model (Greene, 2003)designed to deal with naturally ordered or ranked dependent observations. Inthis model, we initially allocate numbers to each of the five categories such thatthe response to changing superannuation fund (yi) might be written as:
(2)
Although the dependent variable is not continuous, it is assumed that there isa continuous latent variable, , that underlies the observed ordinal dependentvariable, yi. The latent variable is modelled using a linear model, with coefficient vector, β, explanatory variable vector, xi, and residual, ei. Thelatent variable relates to the observed variable as follows:
Table 3Attitude to changing superannuation fund
Very likely
Fairly likely
Neither likely nor unlikely
Fairly unlikely
Very unlikely Total Missing Total
Frequency 157.00 153.00 223.00 289.00 553.00 1375.00 272.00 1647.00Percentage 9.53 9.29 13.54 17.55 33.58 83.49 16.51 100.00
This table summarizes the responses to the key question of the survey with respect to this study. Thisis question A28 and the question asked is ‘Over the next two years – 2005 and 2006 – how likely is itthat you will consider changing to another super fund?’. Both the frequency and the percentage responseto the five available responses to the question, very likely, fairly likely, neither likely nor unlikely, fairlyunlikely and very unlikely, are provided.
y
abcde
i
.=
−−−−−
very likelyfairly likelyneither likely nor unlikely =fairly unlikelyvery unlikely
12345
y i*y x ei i i* ,= +β

276 T. Fry et al. /Accounting and Finance 47 (2007) 267–283
© The AuthorsJournal compilation © 2007 AFAANZ
(3)
Given the usual assumptions, an ordered logit model can be identified (includingthe limit points µ2, µ3, µ4 and µ5) using maximum likelihood (Greene, 2003).Greene notes that interpretation of these models can be quite complex andso we focus our analysis on the underlying latent variable model (Berman andFry, 2001). We draw widely from the FinaMetrica questionnaire to explainparticipant attitude to superannuation change, with particular reference to thequestions that are listed in the Appendix. Some analysis also includes the demographicinformation.4
There were a number of questions that included the response ‘unsure’. Thesevalues were coded as zero. To assess the impact of the ‘unsure’ responses, wecoded an additional dummy variable with a value of 1 for those ‘unsure’ participantsand 0 otherwise. The dummy variable is named by appending ‘DUM’ to theunderlying question code. For example, if question A2 includes ‘unsure’ as oneof its valid responses, then there will be an accompanying variable entitledA2DUM to allow separate analysis of the impact of the ‘not sure/don’t know’response. We initially estimated the model using all of the questions listed inthe Appendix, but there were a number of questions that had little statisticalimpact on participant attitude to choice and so we applied general to specificmodel selection, based on likelihood ratio tests and z-tests, to focus on thosecharacteristics that were pertinent to the decision. This resulted in dropping anumber of the questions from the model as well as the restriction of the fivecategories in yi (question 28) to three categories. The responses fairly likely,neither likely nor unlikely, and fairly unlikely were not clearly differentiated inanalysis and so these categories (2, 3 and 4) were combined into one category.The final model takes the form:
(4)
The parameter estimates for this model are reported in Table 4 for both the fullsample and for the sample composed of those participants who responded to the
4 These are biased towards married investors (Table 1) and, as indicated in Table 2, there aresome statistically significant differences between those that completed the demographicquestions and those that did not complete the demographic information for some of thequestions. Finally, inclusion of the demographic information in the model will result in adecrease in the sample size from a maximum of 1647 participants to a maximum of 897participants.
y
y
y
y
y
y
i
i
i
i
i
i
*
*
*
*
*
.=
− <− < ≤− < ≤− < ≤− <
1
2
3
4
5
2
2 3
3 4
4 5
5
if
if
if
if
if
µµ µµ µµ µµ
A REDUCED A A A AA A
i i i i i
i i i
28 .
= + + ++ + +α α α α
α α ε1 15 22 23
26 27
1 15 22 2326 27

T. Fry et al./A
ccounting and Finance 47 (2007) 267–283
277
© T
he Authors
Journal compilation ©
2007 AFA
AN
Z
Table 4Ordered logit regression over the variable question A28, ‘Over the next two years – 2005 and 2006 – how likely is it that you will consider changing to another super fund?’
VariableFull sample coefficient z-statistic
Sample inc. dem. coefficient z-statistic
Sample inc. dem. and net assets coefficient z-statistic
A1. Period as an investor 0.135 2.86** 0.100 1.54 0.067 0.98A15. Current financial goals compared with a year ago −0.151 −1.94* −0.134 −1.15 −0.118 −1.00A22. Satisfaction with super fund −0.726 −8.56** −0.663 −6.04** −0.655 −5.97**A23. Knowledge about super fund −0.282 −2.92** −0.406 −3.06** −0.379 −2.81**A26. Super fund compared with others −0.256 −3.07** −0.224 −1.98** −0.228 −2.03**A27. Present fund not most preferred 1.797 10.11** 1.775 7.22* 1.761 7.16**Net assets 0.060 1.32Limit pointsLimit 2 −1.802 − 2.96** −1.900 0.02** − 1.521 0.07*Limit 3 1.651 2.73** 1.351 0.09* 1.734 0.04**LR statistic (6 d.f.) 525.43** 261.331** 262.822LR index (Pseudo-R2) 0.21 0.192 0.193Available observations 1647 897 897Number of observations used 1296 708 708
Note: Models are estimated using the full dataset (Full sample), the demographics dataset (Sample inc. dem.) and a model extended to include net assets (Sampleinc. dem. and net assets) is also fitted to the demographics dataset. The dependent variable is the response to question A28, ‘Over the next two years – 2005 and2006 – how likely is it that you will consider changing to another super fund?’. This was initially a five category variable although on further analysis of themodel only the very likely and very unlikely break points were consistently statistically significant. As a result, the middle categories (fairly likely, neither likelynor unlikely and fairly unlikely) were consolidated into one category, giving a new three category based variable for question 28 that is used in this analysis.Maximum likelihood estimation is used to estimate the ordered logit models and the number of ordered indicator values is three (3). Huber–White robustcovariance estimates are used in statistical tests. ** and * denote statistical significance at the 5 and 10 per cent levels, respectively.

278 T. Fry et al. /Accounting and Finance 47 (2007) 267–283
© The AuthorsJournal compilation © 2007 AFAANZ
demographic questions both including and excluding the variable, net assets.The estimated coefficients are of similar sign and magnitude across the threeregression models, although the coefficients for the questions A1 and A15 arenot statistically significant in the reduced sample based on those participantswho reported demographic data. Furthermore, the restriction on the number ofcategories allowed in the dependent variable (question 28), five or three, has littleimpact on the final analysis. We focus on the full dataset in the followingdiscussion.
The coefficient estimated for the response to question A1 concerning thelength of time that the participant had been an investor is statistically significantand positive. Apparently, the shorter the period that the participant has been aninvestor, the more they favour changing their superannuation fund.5 We believethat older loss-averse investors will better understand the inherent volatility offinancial markets and the losses that can be incurred. They will be less attractedto the argument that changing their fund will result in improved investmentperformance as this is by no means guaranteed, even though short-termexperience might suggest otherwise. These results provide some support for theinertia effect.
Question A15 asks the participant how their current financial goals compareto those of a year ago. In effect, this question asks whether the participant’sinvestment reference point has changed. The coefficient on this question isstatistically significant and negative, consistent with participants looking tochange their superannuation fund where they have taken on more ambitiousfinancial goals. Essentially, if their new financial goals are more ambitious, thenrecent behavioural theory predicts that the participants will tend to change theirfund.
Question A22 concerns how satisfied the participant is with their superannuationfund. The coefficient on this question is negative consistent with satisfiedparticipants expressing a preference to remain with their superannuation fund.Very few of the respondents express strong dissatisfaction with their superannua-tion fund (26 out of 1378 respondents), with the majority satisfied or verysatisfied (894 out of 1378), and the remainder ambivalent. The responses tothis question again provide support for recent behavioural theory in terms ofparticipant inertia.
It could be argued that the level of investor knowledge about their superan-nuation fund would have an impact on the decision to change superannuationfund. Question A23 asks how well informed the participant believes they areabout their superannuation fund. The negative coefficient for this questionsuggests that those investors with low levels of knowledge are more likely tochange their superannuation fund. Given the recent strong performance of the
5 A similar result was observed with the survey results reported for the SSAU investmentchoice where older investors were more likely to remain with their defined benefit scheme(Clark-Murphy and Gerrans, 2001).

T. Fry et al. /Accounting and Finance 47 (2007) 267–283 279
© The AuthorsJournal compilation © 2007 AFAANZ
Australian share market, this response is perhaps not surprising. Relativelyignorant investors might tend to underestimate the downside risk that sharemarkets offers. Therefore, the greater weighting that this theory attaches tolosses might not figure as heavily for uninformed investors as it would forbetter-informed investors. This lack of knowledge might limit the investor’sability to adequately identify the true return distribution that is offered bysuperannuation funds. Conversely, well-informed investors are quite aware ofthe underlying fund return distribution and, hence, are less likely to changefund. The results reported in recent questionnaires provide some support forthis argument (Clark-Murphy and Gerrans, 2001, 2004; Beal and Delpachitra,2004).
Participant comparison, between their current superannuation fund andalternative funds, is dealt with in questions A26 (How does your (main)superannuation fund compare to the best fund you could choose?) and A27 (Areyou aware of any superannuation fund(s) that you would prefer to your current(main) fund?). The positive coefficient for question A27 and the negativecoefficient for question A26 are consistent with participants expressing aninterest in changing their superannuation fund where they believe that there isa better performing fund available to them. In effect, their new reference pointis the alternative fund. If the performance of the alternative fund exceeds thecurrent fund’s performance by a sufficient amount, then investors will changetheir superannuation fund. Again, this result supports the predictions of recentbehavioural theory.
To gain some sense of how well the model fits the data, we compare thepredicted participant attitude to superannuation change from the specific modelreported in Table 4 with the responses to the three-category response variablefor question A28. The Spearman rank correlation between the actual andpredicted value is 0.515 and the cross-tabulation, reported in Table 5, betweenthe responses to question 28 (reduced to 3 categories) and the categoriespredicted by the model suggests a reasonable level of accuracy.
Table 5Comparison of model predictions with actual for attitude to changing superannuation fund (question A28)
A28 = 1 A28 = 2 A28 = 3 Total
Model prediction = 1 45 32 0 77Model prediction = 2 96 419 151 666Model prediction = 3 13 172 368 553Total 154 623 519 1296
Note: This table reports model prediction versus attitude to changing superannuation fund (question A28) cross-tabulations. The Spearman rank correlation between A28 and the predicted values from the model.

280 T. Fry et al. /Accounting and Finance 47 (2007) 267–283
© The AuthorsJournal compilation © 2007 AFAANZ
5. Comparison with traditional expected utility predictions
The most commonly used model of economic choice relies on maximizingexpected utility using Von Neuman Morgenstern preference functions. Simplyput, a risk averse expected-utility-maximizing investor changes their superan-nuation fund if the new fund increases their expected utility of wealth. In thepast employers were responsible for investment decisions, yet there was norequirement for them to invest in a way that maximized individual investorexpected utility. It is likely that a large proportion of the previously constrainedinvestors will choose to exercise their right to change their superannuation fundwhere their preferences are driven by expected utility, merely because the exist-ing fund choice is not tailored to maximize their personal utility function. Thesurvey responses reported in the Australian superannuation literature do notbear out this tendency. The majority of the respondents are either indifferent ornot interested in change.
Expected utility functions are generally assumed to be everywhere concaveand this implicitly assumes that investors are risk averse and that their level ofrisk aversion is decreasing in wealth. For example, given a utility function,U(W), that is everywhere concave, the first derivative is positive, U′(W) > 0, andthe second derivative is negative, U′′(W) < 0. That is, as the level of wealthincreases, the additional utility gained with an additional unit of wealthreduces. If we take a natural log utility function of the form U(W) = ln(W),then U ′(W) = 1/W then as W→∞ and so U′(W)→0. If it is assumed that investorsare reasonably homogeneous and differ in terms of wealth, then traditionalexpected utility theory suggests that extremely wealthy well-diversified investorswill be less concerned about a $1 change in total wealth than a less wealthyinvestor because they are located on a ‘flatter’ section of their preference function.Essentially, expected-utility theory predicts that wealthy investors will tend tobe less risk averse and so they will be less concerned about the decision tochange their superannuation fund than poorer investors (Bowman et al., 1999;Rabin, 2000).
The level of net assets that an investor holds is identified in the demographicinformation, completed as part of the survey, and so it is necessary to focus onthe reduced dataset that includes demographic information (last four columnsof Table 4). This reduced dataset is somewhat different from the full dataset, asdiscussed above, although the parameter estimates for the full sample and forthe demographics sample are found to be reasonably close in magnitude, if notalways with the same level of statistical significance. To test the impact of par-ticipant wealth on the fund choice decision, equation (4) is extended to includenet wealth and results from analysis of this model are reported in the last twocolumns of Table 4.
Although the other parameters in the model are little changed with the additionof net assets, it is apparent that the level of net assets has no statistically significantimpact on the superannuation choice decision. Furthermore, the coefficient is
T. Fry et al. /Accounting and Finance 47 (2007) 267–283 281
© The AuthorsJournal compilation © 2007 AFAANZ
positive. It would seem that as the level of participant net assets increases, theparticipant is less likely to change their superannuation fund. It is difficult toreconcile this result with the behaviour of an expected-utility-maximizinginvestor although these results are reasonably consistent with prospect theory.There is little evidence of tests similar to this in the literature and this is mostprobably the result of the difficulty of obtaining information on individualinvestor wealth.
6. Conclusion
The introduction of superannuation choice has raised considerable concernamong fund managers, investment advisers and regulators, yet recent behaviouraltheory suggests that this decision will be marked by investor inertia. The resultsof analysis of the FinaMetrica survey are consistent with this prediction withfew participants in the survey indicating that they are likely to change theirsuperannuation fund. Furthermore, changes in the superannuation fund choiceappear to be best explained in terms of a change in the participant’s referencepoint, with this change being driven by past experience with the current fundrelative to alternative funds.
A reduced dataset is used to test one prediction from traditional expectedutility theory. It is argued that, given reasonably homogeneous investors, awealthy expected-utility maximizer will be less concerned about changingtheir superannuation fund than a poorer expected-utility maximizer because ofthe reduction in the level of risk aversion with higher levels of wealth. Wefind that there is no statistically significant wealth effect on the decision tochange superannuation fund. Indeed, our estimated coefficient suggests thatwealthier investors are less likely to change their superannuation fund than poorerinvestors.
References
Barber, B. M., C. Heath, and T. Odean, 2003, Good reasons sell: reason-based choiceamong group and individual investors in the stock market, Management Science 49,1636–1652.
Barber, B. M., and T. Odean, 2000, Too many cooks spoil the profits: investment club per-formance, Financial Analysts Journal 56, 17–25.
Barber, B. M., and T. Odean, 2002, Online investors: do the slow die first? Review of Finan-cial Studies 15, 455–487.
Beal, D., and S. Delpachitra, 2004, Community understanding of superannuation, Agenda11, 127–142.
Benartzi, S., and R. H. Thaler, 1995, Myopic loss aversion and the equity premium puzzle,Quarterly Journal of Economics 110, 73–92.
Berman, G., and T. R. L. Fry, 2001, A charitable ranking, Economic Papers 20, 67–80.Bilson, C., A. Frino, and R. A. Heaney, 2004, Australian retail superannuation fund
performance, Accounting Research Journal 17, 43–56.Bilson, C., A. Frino, and R. A. Heaney, 2005, Australian retail superannuation fund
performance persistence, Accounting and Finance 45, 25–42.

282 T. Fry et al. /Accounting and Finance 47 (2007) 267–283
© The AuthorsJournal compilation © 2007 AFAANZ
Bird, R., H. Chin, and M. McCrae, 1983, The performance of Australian superannuationfunds, Australian Journal of Management 8, 49–69.
Bowman, D., D. Minehart, and M. Rabin, 1999, Loss aversion in a consumption-savingsmodel, Journal of Economic Behavior and Organisation 38, 155–178.
Camerer, C. F., L. Babcock, G. Loewenstein, and R. H. Thaler, 1997, Labor supply of NewYork city cab drivers one day at a time, Quarterly Journal of Economics 112, 407–441.
Clark-Murphy, M., and P. Gerrans, 2001, Choices and retirement savings: some preliminaryresults on superannuation fund member decisions, Economic Papers 20, 29–42.
Clark-Murphy, M., and P. Gerrans, 2004, Apparently contradictory superannuationchoices among younger fund members: a misunderstanding of risk? Economic Papers 23,101–113.
Clark-Murphy, M., I. Kristofferson, and P. Gerrans, 2002, What makes superannuationdecisions difficult? International Journal of Business Studies 10, 73–94.
Drew, M. E., and J. D. Stanford, 2003, Principal and agent problems in superannuationfunds, Australian Economic Review 36, 98–107.
Greene, W. H., 2003, Econometric Analysis, 5th edn (Prentice Hall, Upper Saddle River, NJ).Hallahan, T. A., 1999, The information content of portfolio performance history and
persistence in fund performance: an examination of rollover funds, Accounting andFinance 39, 255–274.
Johnson, E. J., J. Hershey, J. Meszaros, and H. Kunreuther, 1992, Framing, probabilitydistortions, and insurance decisions, Journal of Risk and Uncertainty 7, 35–51.
Kahneman, D., J. L. Knetsch, and R. H. Thaler, 1986, Fairness as a constraint on profitseeking entitlements in the market, American Economic Review 76, 728–741.
Kahneman, D., J. L. Knetsch, and R. H. Thaler, 1991, The endowment effect, loss aversion,and status quo bias, Journal of Economic Perspectives 5, 193–206.
Kahneman, D., and A. Tversky, 1979, An analysis of decision under risk, Econometrica 47, 263–291.Kahneman, D., and A. Tversky, 1984, Choices, values, and frames, American Psychologist
39, 341–350.Knetsch, J. L., 1989, The endowment effect and evidence of nonreversible indifference
curves, American Economic Review 79, 1277–1284.Machina, M., 1987, Choice under uncertainty: problems solved and unsolved, Journal of
Economic Perspectives 1, 121–154.Newspoint, 2005, Choice will change little: survey, Autumn, 3, Superpartners, Melbourne,
Vic. [online]. Available: http://www.superpartners.biz/superpartners/PressRoom.asp.Odean, T., 1998, Are investors reluctant to realise their losses? Journal of Finance 53,
1775–1798.Rabin, M., 2000, Risk aversion and expected-utility theory: a calibration theorem, Econometrica
68, 1281–1292.Sethi-Iyengar, S., G. Huberman and W. Jiang, 2004, How much choice is too much?
Contributions to 104 (k) retirement plans, in: O. S. Mitchell and S. P. Utkus, eds., PensionDesign and Structure (Oxford University Press, Oxford), 83–95.
Shafir, E., P. Diamond, and A. Tversky, 1997, Money illusion, Quarterly Journal of Economics112, 341–374.
Thaler, R. H., 1980, Toward a positive theory of consumer choice, Journal of EconomicBehavior and Organization 39, 39–60.
Thaler, R. H., 1999, Mental accounting matters, Journal of Behavioral Decision Making 12,183–206.
Tversky, A., and C. R. Fox, 1995, Weighting risk and uncertainty, Psychological Review102, 269–283.
Tversky, A., and D. Kahneman, 1986, Rational choice and the framing of decisions, Journal ofBusiness 59, 251–278.
Tversky, A., and D. Kahneman, 1991, Loss aversion in riskless choice: a reference-dependentmodel, Quarterly Journal of Economics 106, 1039–1061.

T. Fry et al. /Accounting and Finance 47 (2007) 267–283 283
© The AuthorsJournal compilation © 2007 AFAANZ
Tversky, A., and D. Kahneman, 1992, Cumulative representation of uncertainty, Journal ofRisk and Uncertainty 5, 297–323.
Appendix
Questionnaire items included in analysis
Panel A: Questions chosen to capture attitudes to investingA1. For how long have you been an investor? (valid responses: not an investor, <1 years, 1–
2 years, 2–5 years, 5–10 years, >10 years)A2. How would you rate your understanding of investing and investment markets? (valid
responses: very good, good, fair, poor, very poor, not sure/don’t know)A3. How do you think your understanding compares to that of others? (valid responses: above
average, about average, below average, not sure/don’t know)A4. How did your investments perform over the past year? (valid responses: no investments,
very well, well, OK, poorly, very poorly, not sure/don’t know)A5. How did this performance compare with the expectations you had at the start of the year?
(valid responses: no investments, better than, in line, worse than, not sure/don’t know)A6. How would you rate the performance of investment markets over the past year compared
to what you know about long-term averages? (valid responses: better than, about the same,worse than, not sure/don’t know)
A7. How do you think investment markets will perform in the year ahead? (responses: betterthan, about the same, worse than, not sure/don’t know)
A18. Are you now using a financial planner? (valid responses: yes, no)
Panel B: Questions chosen to capture financial positionA14. How does your current financial position compare to that of a year ago? (valid responses:
much worse, somewhat worse, about the same, somewhat better, much better)A15. How do your current financial goals compare to those of a year ago? (valid responses: sig-
nificantly less ambitious, somewhat less ambitious, more or less the same, somewhat moreambitious, significantly more ambitious)
Panel C: Questions chosen to capture attitude to SuperannuationA22. How satisfied are you with your superannuation fund (your main fund if you have more
than one)? (valid responses: very satisfied, fairly satisfied, neither satisfied nor dissatisfied,fairly dissatisfied, very dissatisfied)
A23. How well informed are you about your superannuation fund (your main fund if you havemore than one)? (valid responses: well informed, fairly well informed, fairly uninformed,very uninformed)
A24. Excluding changes forced on you by a change of employment, have you ever changedyour superannuation fund? (valid responses: yes, no)
A25. Were you aware that Super Choice was coming? (valid responses: yes, no)A26. How does your (main) superannuation fund compare to the best fund you could choose?
(valid responses: about the same, not quite as good, significantly worse, not sure/don’t know)A27. Are you aware of any superannuation fund(s) that you would prefer to your current (main)
fund? (valid responses: yes, no)
A28. Over the next 2 years – 2005 and 2006 – how likely is it that you will consider changingto another super fund? (valid responses: very likely, fairly likely, neither likely norunlikely, fairly unlikely and very unlikely)