The Impact of Children on Australian Women's and Men's Superannuation
24
The Economic and Labour Relations Review Vol. 18 No. 1, pp. 3–26 The Impact of Children on Australian Women’s and Men’s Superannuation Nick Parr * Shauna Ferris * Stéphane Mahuteau * Abstract Using data from Wave 2 of the Household Income and Labour Dynamics in Aus- tralia (HILDA) Survey, this article examines how superannuation savings by women and men vary according to the numbers of children they have. e results show that for women there is a clear inverse relationship between the value of superannuation and the number of their children. Moreover, this inverse relation- ship persists aſter controlling for an extensive range of variables which may affect both number of children and superannuation. e analysis also shows that level of education, migrant status, being an employer or self-employed, marital status, age and sex are significantly related to an individual’s level of superannuation. e implications of the results for Australia’s public debate and possible policy responses are discussed. Introduction is article examines how the retirement savings of Australian women and men vary according to the numbers of children they have. In Australia women have historically tended to participate in the labour force less and earn less income than men owing to a range of legal, economic and social barriers (Evans 1996). Despite the progressive removal of these barriers over time, women continue to earn less than men (ABS 2005). Women also have tended to have less super- annuation than men (ABS 2001; Ferris and Olsberg 2001; Kelly 2006). One of the contributory factors to women’s lack of superannuation has undoubtedly been their loss of earnings as a result of having children (Chapman et al. 2001; Breusch and Gray 2004). e value of superannuation is second in importance only to the value of home equity as a component of household wealth in Australia, accounting for 16 per cent of total net worth (Marks et al. 2005). As such it represents an im- portant source of financial security in old age. Superannuation has become a * Macquarie University
Transcript of The Impact of Children on Australian Women's and Men's Superannuation

The Economic and Labour Relations Review Vol. 18 No. 1, pp. 3–26
The Impact of Children on Australian Women’s and Men’s Superannuation
Nick Parr * Shauna Ferris * Stéphane Mahuteau *
AbstractUsing data from Wave 2 of the Household Income and Labour Dynamics in Aus-tralia (HILDA) Survey, this article examines how superannuation savings by women and men vary according to the numbers of children they have. The results show that for women there is a clear inverse relationship between the value of superannuation and the number of their children. Moreover, this inverse relation-ship persists after controlling for an extensive range of variables which may affect both number of children and superannuation. The analysis also shows that level of education, migrant status, being an employer or self-employed, marital status, age and sex are significantly related to an individual’s level of superannuation. The implications of the results for Australia’s public debate and possible policy responses are discussed.
IntroductionThis article examines how the retirement savings of Australian women and men vary according to the numbers of children they have. In Australia women have historically tended to participate in the labour force less and earn less income than men owing to a range of legal, economic and social barriers (Evans 1996). Despite the progressive removal of these barriers over time, women continue to earn less than men (ABS 2005). Women also have tended to have less super-annuation than men (ABS 2001; Ferris and Olsberg 2001; Kelly 2006). One of the contributory factors to women’s lack of superannuation has undoubtedly been their loss of earnings as a result of having children (Chapman et al. 2001; Breusch and Gray 2004).
The value of superannuation is second in importance only to the value of home equity as a component of household wealth in Australia, accounting for 16 per cent of total net worth (Marks et al. 2005). As such it represents an im-portant source of financial security in old age. Superannuation has become a
* Macquarie University

4 The Economic and Labour Relations Review
major determinant of post-retirement consumption patterns and of govern-ment outlays on means-tested aged pensions. The prospective rapid growth of Australia’s post retirement age population should further enhance its impor-tance in these respects (ABS 2006a).
The HILDA survey presents a unique opportunity to analyse the variation of superannuation by the number of children on a per person basis, after al-lowing for confounding variables which are also likely to affect superannuation savings. Previous studies have investigated the distribution of superannuation contributions and average superannuation balances by age and gender. These studies have been based on various data sources such as superannuation funds membership, life insurance account balances, statistical reports from the su-perannuation regulator,1 surveys from the Australian Bureau of Statistics, and data from the Australian Tax Office2 (Brown 1994; Rothman 1995; ABS 2001; Clare 2004). However, the compilation of accurate data on the distribution of superannuation assets for individuals has been problematic, because many Australians hold multiple superannuation accounts spread across different funds and there are difficulties in linking the records from separate funds (ABS 2001; Kelly 2003). Furthermore, many Australians (especially younger Austral-ians) have a poor knowledge of their own superannuation assets, which has led to significant under-reporting of superannuation assets in ABS surveys (ABS 2001, 2006b). Even where estimates of superannuation balances are available, there has previously been little information available on the distribution of as-sets according to social and demographic characteristics such as marital status, number of children, educational attainment, and migrant status.
This paper firstly outlines the structure and historical development of Aus-tralia’s superannuation schemes. A survey of the literature on the economic effects of children and the patterns of fertility in Australia is then presented. We develop hypotheses on the paths through which having children may affect the value of women’s and men’s superannuation. The selectivity of childbearing patterns in Australia is described. A description of the data and our choice of statistical methods follows. After a descriptive analysis of the variation in wom-en’s and men’s value of superannuation by their age and number of children, we then present the results of a multivariate analysis of the effects of children after controlling for a range of variables which are likely to affect both a person’s number of children and their superannuation. Finally we discuss the implica-tion of the results for public policy in Australia.
The Development of Australia’s Superannuation SystemAustralia’s current superannuation system operates through a complex combi-nation of mandatory requirements and incentive-enhanced voluntary schemes. It has undergone profound changes over recent decades. Since the levels of superannuation savings we study reflect an accumulation over time and, as such, have been affected by conditions of the past, in order to understand their distribution it is necessary to consider the development of Australia’s superan-nuation system over the working lifetimes of the respondents.

The Impact of Children on Australian Women’s and Men’s Superannuation 5
The Voluntary Superannuation SystemPrior to the 1980s, the provision of superannuation was not compulsory. How-ever government tax incentives made superannuation a particularly attractive form of remuneration for people subject to high marginal tax rates. Superan-nuation coverage was relatively low — and uneven. High income earners were much more likely to have superannuation than low-income earners. White col-lar workers were more likely to have superannuation than blue collar workers. Public servants were more likely to have superannuation than private sector workers. Full time workers were more likely to have superannuation than part time workers (Foster 1988).
Coverage rates were considerably lower for women than for men. In 1974, only 15 per cent of female employees were members of a superannuation scheme, compared to 41 per cent of men (Hancock et al. 1977). A government enquiry into the superannuation system in the late 1970s found that many su-perannuation funds discriminated against women, both directly and indirectly. Some schemes simply did not allow women to join at all — a 1972 survey re-ported that 21 per cent of all private sector schemes were confined to male employees. In some schemes, there were different eligibility rules for men and women — for example, men were allowed to join at age 21, but women were not allowed to join until age 25 (Hancock et al. 1977). In some public sector funds, only single women were allowed to join the fund. When a woman married, her employment status was changed to ‘temporary employee’; she would be paid a dowry benefit; and she would then be excluded from participation in the fund. Sometimes the rules were indirectly discriminatory — for example, many funds were set up for the benefit of full time employees only — part-timers (predomi-nantly women) were not allowed to join.
The Sex Discrimination Act was introduced in 1984, forbidding discrimina-tion based on sex or marital status; but initially there was a blanket exemption for superannuation funds (Commonwealth of Australia 1984). Regulations re-quiring equal treatment in the provision of superannuation only became effec-tive in the mid-1990s, subject to various transitional arrangements (although due to changes in social attitudes, many superannuation funds had already up-dated their rules before this date).
How would current superannuation assets be affected by the past history of the superannuation system? Even if women did have superannuation cover-age in the pre-compulsory era, it might not flow through to an increase in the current level of savings. At that time, fund members (whether male or female) would generally be entitled to withdraw their benefits in cash whenever they resigned from their job. However, people were generally only entitled to take a cash benefit on resignation, and, since they often left the workforce to look after children, women were especially likely to fall into this category. In 1987 the government introduced preservation requirements,3 which have been gradual-ly tightened over the years. The preservation requirements are designed to pre-vent people from taking superannuation benefits in cash prior to retirement.4

6 The Economic and Labour Relations Review
The Compulsory Superannuation SystemDuring the 1980s, the trade union movement became interested in obtaining superannuation benefits for their members. Some of the stronger unions began lobbying employers to provide superannuation benefits for blue-collar work-ers — even taking industrial action in support of their claims. At the time, the Labor Party (which had close ties to the union movement) was in government. They worked with the union movement to extend superannuation coverage. Essentially, this was done via the industrial relations system: industrial awards were negotiated which required employers to pay at least 3 per cent of wages into specified superannuation funds for most employees. Over the period from 1986 to 1991, superannuation coverage increased from about 40 per cent to about 80 per cent (Olsberg 1997).
In 1992, the Labor government introduced the Superannuation Guarantee Charge (SGC) (Commonwealth of Australia 1992). This made it compulsory for employers to provide superannuation contributions for nearly all employ-ees.5 The system was phased in over time. Initially, the minimum contribution was 3 per cent of salary or wages (for small employers) or 4 per cent (for large employers). However the rate was increased year by year until it reached 9 per cent in 2002.6 There are some exceptions. These include employees who earn less than $450 per month in one job,7 part-time workers under age 18, and self-employed people. The $450 limit is likely to have a stronger impact on women, especially women with children, since they are more likely to work part time.
There have been some concerns about compliance with the SGC require-ments: there is evidence that some employers simply do not make the contribu-tions which they should be making. The workers who are most vulnerable in this respect are those on the fringes of the labour market — people in low-paid and unskilled jobs, people in casual and part-time positions, people in jobs with high turnover (for example young people working in the hospitality in-dustry), and migrants: that is, people who may be unaware of their rights or re-luctant to complain for fear of losing their jobs. It seems likely that women, es-pecially those with children, would be over-represented in this group, although of course it is difficult to obtain reliable statistics on non-compliance (Senate Select Committee on Superannuation and Financial Services 2001). The Aus-tralian Tax Office, which is responsible for monitoring and enforcing compli-ance, has reported many cases of non-compliance, especially affecting women (ATO 1999a, 1999b). Unions have also been active in pursuing employers who are tardy in making payments.
Additional Voluntary ContributionsThe current superannuation system is a combination of the old voluntary system and the new compulsory system. Some employers pay more than the minimum 9 per cent contribution for their employees.8 The higher level of contributions may be negotiated as part of an Enterprise Agreement, or as part of an Aus-tralian Workplace Agreement. Most superannuation funds would also allow employees to make additional voluntary contributions, out of their own pock-

The Impact of Children on Australian Women’s and Men’s Superannuation 7
ets. In fact some of the long-established funds even require employees to make contributions, typically at say 3 per cent or 5 per cent of salaries. Most of the newer funds (e.g. those which have been established in the last decade) do not require employee contributions, but allow this as an option. However, relatively few people make additional voluntary contributions. Men are more likely to be making additional voluntary contributions than women (30.4 per cent of male jobholders were making personal contributions, compared to 21.4 per cent of women) (ABS 2001). The main reasons given for not making personal contribu-tions are: cost and affordability; disinterest and lack of consideration or motiva-tion; ineligibility; and preference for alternative investments or mortgages.
In recent years the government has attempted to encourage more voluntary employee contributions by providing co-contributions. Whenever an eligible employee makes a voluntary contribution, the government also makes its own contribution into the member’s account. The amount payable depends on the member’s income and the amount of the member’s contribution. The maxi-mum co-contribution is $1,500, which is payable when an eligible employee with income below $28,000 makes a contribution of $1,000. The amount of the co-contribution reduces to nil for a person with income above $58,000.9 The co-contribution (effective from 1 July 2003) was not introduced until after the wave of the HILDA survey which has been used in this research.
Spouse ContributionsIn 1996 the government decided to provide some tax incentives to encourage men to make provision for their stay-at-home (or low income) wives.10 Fund members who make Spouse Contributions are entitled to claim a tax deduction. The amount of the deduction depends on the amount of the superannuation contribution and the income level of the non-member spouse. The maximum tax deduction is $540, which applies when the contribution is $3,000 or more, and the spouse earns less than $11,800 per annum. No benefit is available if the spouse earns more than $13,800. When this policy was introduced, critics pointed out that this tax concession would be likely to be beneficial for the stay-at-home wives of high-income husbands. When the family income is low, then it is less likely that the family would be able to afford to make extra contribu-tions. The evidence to date suggests that this initiative has not been particularly effective in improving superannuation savings for women. The take up-rate has been quite low (Olsberg 2005).
The Implications of Children for Women’s and Men’s SuperannuationHaving children has a range of implications for family budgets and hence for superannuation contributions. Firstly, it reduces the wages and salaries earned by the family (it has ‘indirect costs’), particularly those of the female partner. According to Chapman et al. (2001) and Breusch and Gray (2004) the earnings women forego as a result of having children are substantial, with the majority of lost earnings being attributable to the first child. The reduction in women’s earnings resulting from having children would lead to reduced contributions
8 The Economic and Labour Relations Review
in absolute terms being paid into their superannuation schemes by their em-ployers and, where fund rules require employees to make personal contribu-tions into superannuation funds, to women making reduced employee con-tributions as well. Eligibility for tax incentives for spouse contributions and (since 2003) for government superannuation co-contributions may also result from the child-related reduction of earnings. In addition, when women switch to part-time work, their employers may become exempt from compulsory su-perannuation contributions (since employers are not required to contribute for those earning less than $450 per month). Secondly, substantial additional ex-penditure is required to provide for additional children (Percival and Harding 2002; Henman et al. 2007). In combination with the reduced income of (usu-ally) the female partner this reduces the funds available for other (non-child related) outlays including voluntary contributions into superannuation funds. Thirdly, parents of children may benefit from a complex range of government benefits which are payable. The more significant benefits are means tested on family income (Family Tax Benefit Part A) and on the income of the lower earning parent (Family Tax Benefit Part B) (McDonald 2001). There is also a means-tested benefit which partially covers the cost of childcare. With effect from July 2004, the Australian Federal Government introduced a substantial, flat-rate payment to the mothers of all newly-born children, known as the Ma-ternity Benefit, and increased the amounts and income thresholds for eligibility for Family Tax Benefits. In doing so, it phased out a tax rebate based on the reduction of income following the birth of the first child, known as the Baby Bonus (Commonwealth of Australia 2004). The values of child-related gov-ernment benefits, however, are considerably less than the direct and indirect costs which are incurred as a result of additional children. Fourthly, additional children may change a family’s preferences relating to the purchase of assets and to the risks presented by different investment strategies (Cobb-Clark and Hildebrand 2002). For example with a larger number of children a larger, more expensive house and family car may be preferred, life assurance may become a more attractive option, and there may be a preference for retaining funds in liquid assets which may be sold to cover future child-related outlays (educa-tion, weddings, etc.) rather than to have the funds locked up in superannuation. Fifthly, career breaks due to the arrival of children may lead to (unpreserved) superannuation benefits being cashed in.
The Selectivity of ChildbearingWhen comparing the superannuation amounts of people with different num-bers of children it should be remembered that different demographic subgroups of the population differ in their propensities to have children and, if they have children, in the numbers of children they have. In Australia there are differen-tials in fertility by birth cohort, socioeconomic status, ethnicity and marital sta-tus. Average numbers of children generally increase with age (Carmichael and McDonald 2003). Highly educated women tend to have fewer children on aver-age and are much more likely to remain childless (Carmichael and McDonald 2003; Parr 2005, 2007). Aboriginal and Torres Strait Islanders continue to have

The Impact of Children on Australian Women’s and Men’s Superannuation 9
a larger number of children on average than non Aboriginal and Torres Strait Islanders, although the gap has fallen markedly since the early 1970s (Gray and Tesfaghiorghis 1993; Taylor 2003). The average numbers of children of migrant women and Australia-born women differ little. However there is a wide vari-ation in fertility between different overseas regions of birth. Women born in the Middle East, the Pacific islands and some of the less developed nations of South-East Asia tend to have relatively large numbers of children, whilst the family sizes of migrants from Europe and East Asia tend to be relatively small (Carmichael and McDonald 2003). Although the fertility levels of the never married have risen considerably since the 1970s whilst those of the married have fallen, married women still have considerably more children than never married women. The differences in numbers of children between women who are currently married and those who are separated, divorced or widowed are relatively small (Carmichael and McDonald 2003).
DataTo investigate the impact of children on superannuation savings, we used data from Waves 1 and 2 of the Household, Income and Labour Dynamics in Aus-tralia Survey (or HILDA for short). Wave 1 of this nationwide, longitudinal survey was conducted in 2001 and Wave 2 between August 2002 and March 2003. The sample design employed a multi-stage cluster sample of households. Remote areas of the country were not sampled (Watson and Wooden 2002a, 2002b). Respondents were asked, firstly, for their various superannuation funds combined, to choose a range in which the valuation of their superannuation lies and then, secondly, to give a best estimate of the value within that range. The analysis presented here has been restricted to 3,833 males and 4,032 fe-males aged 25–54 last birthday on 30 June 2002 who had not retired. Those aged less than 25 were excluded from the analysis because many below this age have yet to complete education and establish themselves in the labour force. The over-55s were excluded because the superannuation of many above this age will have been affected by retirement.
MethodWe estimate censored regression (Tobit) models, since a significant number (13.5 per cent) of individuals aged between 25 to 55 report a superannuation value of zero, indicating that either they have not been employed in Australia since 1992, or that they have been self-employed or in one of the categories which are exempt for superannuation contributions, described previously. The latent underlying model is given by:
* 'i i iy X uβ= + , with ( )20,iu N σ:
where *iy is the (unobserved) value of superannuation and iX a set of covari-
ates, one of which the number of children. *iy is censored to the left at zero, i.e.
we observe *iy when the value is greater than 0 and 0 otherwise.

10 The Economic and Labour Relations Review
This censored regression model is estimated by maximum likelihood where the censoring in zero is accounted for in the following log likelihood function11:
*
' '
0
1log log logi i i
i i i
y y y
X y XL β βφσ σ σ= =
− −= Φ + ∑ ∑
Where ( ).Φ and ( ).φ are, respectively, the Normal cdf and density.
In view of the well documented differences between men and women in in-come, labour force participation and superannuation, we incorporate a number of interaction variables between sex and other explanatory variables, including number of children and education, into the regression in order to capture this heterogeneity. Since the effects of some explanatory variables are likely to cu-mulate with age (i.e. over time) we also include interaction terms between age and other explanatory variables. The estimated parameters of the model corre-spond to the impact of each of the variables on the conditional mean of the un-observed latent variable *
iy , that is *i iE y X . However, this is not our pri-
mary interest. Rather we focus on the effects of each variable on the conditional mean of the observed superannuation values, that is i iE y X . Greene (1999) shows that the marginal effect of each variable k associated to the conditional mean of the observed dependent variable is simply the coefficient obtained for the variable weighted by the probability that the observation is non-censored:
'
1i i ik k
ik
E y X XmeX
ββσ
∂ = = × −Φ − ∂
Because of the non-linearity of the Tobit model, the slope coefficients then de-pend on the value of the X variables. A common practice is to report their value evaluated at the sample mean of X. These are the marginal effects we report in the result tables for continuous variables. Concerning dichotomous and inter-action explanatory variables in the model, we recalculate the true marginal ef-fects by evaluating the conditional mean for the two alternative values taken by the variables and taking the differences. Indeed, for such variables, the sample mean is meaningless and so would be the marginal effects evaluated at such points. Formally, the marginal effects of dummy variables are computed as fol-lows and reported in the tables of results:
( )( ) ( ) ( ) ( )( ) ( ) ( )
1 0
1 1 1 1 0 0 0 0
Marginal effect=
1 ' 1 '
i i i i
i i i i i i i i i i
E y x E y x
L x L xα α β σλ α α α β σλ α
− = −Φ +Φ × + − −Φ +Φ × + ( )( ) ( ) ( ) ( )( ) ( ) ( )
1 0
1 1 1 1 0 0 0 0
Marginal effect=
1 ' 1 '
i i i i
i i i i i i i i i i
E y x E y x
L x L xα α β σλ α α α β σλ α
− = −Φ +Φ × + − −Φ +Φ × +

The Impact of Children on Australian Women’s and Men’s Superannuation 11
where 1ix is the vector of sample means of all the variables in the regression
where the value of the dummy variable of interest is restricted to 1 and 0ix the
vector of sample means of all the variables where the value of the dummy vari-able of interest is restricted to 0.
It is to be expected that much of the effect of the number of children (and other variables) on superannuation is due to its effect on income. Income earned prior to and during the childbearing ages may also have affected the number of children. The HILDA data only provide information on income for the last completed financial year before the interview (2001–02). In an at-tempt to assess the role of gross income (including its interactions with age and sex) as a factor mediating the effects of other variables we present two models. Model 1 represents estimated effects of the number of children on superannua-tion after controlling for the selectivity of childbearing. Model 2 represents our estimates of the effects of the income-related variables and of residual effects of the number of children and other variables on superannuation after controlling for the effects of income.
Results
Figure 1: Median Value of Superannuation by Age and Sex
Median Superannuation Value by Age and Sex: Australia 2002
0
10000
20000
30000
40000
50000
60000
70000
80000
25-29 30-34 35-39 40-44 45-49 50-54
Age
$ Male
Female

12 The Economic and Labour Relations Review
Figure 2: Median Value of Superannuation for Women by Age and Number of Children
Figure 3: Median Value of Superannuation for Men by Age and Number of Children
Exploratory AnalysisThe median value of men’s superannuation exceeds that for women at all ages in the 25 to 54 range (Figure 1). For men the median value of superannuation increases steeply throughout the age range analysed, with the increase becom-ing progressively steeper as age increases. In contrast for women the increase is much flatter, and, indeed, between the 30–34, 35–39, 40–44 and 45–49 age groups, there is no increase at all. This would reflect the cumulative effects over time of women’s lower labour force participation rates, lower incomes, the previously discriminatory superannuation system, and possibly the absence of
Median Superannuation Value by Age and Number of Children: Australian Females 2002
0
10000
20000
30000
40000
50000
60000
70000
80000
25-29 30-34 35-39 40-44 45-49 50-54
Age
$
0
1
2
3
4+
Median Superannuation Value by Age and Number of Children: Australian Men 2002
0
20000
40000
60000
80000
100000
120000
25-29 30-34 35-39 40-44 45-49 50-54
Age
$
012
34+

The Impact of Children on Australian Women’s and Men’s Superannuation 13
preservation requirements in the past having had a proportionately greater ef-fect on women’s superannuation savings.
For women within age groups there is a general decline in the median value of superannuation with an increase in the number of children (Figure 2). In each of the age groups considered, childless women have a higher median value of superannuation than women with other numbers of children. In each age group, women with four or more children have the lowest median. Indeed the median is zero or a little above zero for all ages. Whilst the median value of superannuation of women with one child is relatively high in the 30–39 age range, above the age of 45 it is relatively low. The variation within age groups in the median value of superannuation by the number of children is considerably less for men than for women (Figure 3). Moreover, for men there is no clear general pattern of variation with the number of children, except that in most age groups men with one child have a relatively low value.
Multivariate AnalysisThe HILDA data confirm the existence of the superannuation savings gender gap, as has been documented by other studies (Olsberg 2005). Average super-annuation savings for women are much lower than those for men. However, the discrepancy cannot be entirely explained by the traditional female role in child care. Even after controlling for a range of variables, including age, number of children, education, birthplace, and marital status, according to Model 1 women have on average $10,858 less superannuation than men. It is to be ex-pected that a major part of this residual effect of being a female may be attrib-uted to the cumulative effects of women’s past and continuing disadvantage in the labour market both in terms of pay levels and access to higher ranking jobs associated with larger superannuation contributions. Model 2 shows that when one controls for the gross income from wages and salaries in 2001–02, the dis-advantage of being a female is more than double that figure. Both women’s incomes and their superannuation contributions were lower in proportion to men’s in the past, and a control based only on current income is unable to cap-ture this effect.
The number of children is a strong determinant of the level of superannua-tion accumulated by women, as shown by the results of a test of the restricted model without the variables related to children against the unrestricted model with children. The first child reduces the superannuation value of both males and females, more so for females but not significantly more so. Starting from the second child, females bear the brunt of the cost in terms of considerably re-duced superannuation values. The loss of superannuation for women increases rapidly with the second and third children, amounting to more about $30,000. The results appear consistent with our hypothesised effects of children reducing a woman’s income and hence employer superannuation contributions, whilst voluntary contributions by both the woman and her spouse are reduced by the direct costs of children, preferences for assets other than superannuation, and cashing-in of unpreserved superannuation savings when women left the paid workforce in order to meet family responsibilities. Men with two or three

14 The Economic and Labour Relations Review
Tabl
e 1:
Tob
it E
stim
atio
ns o
n th
e Va
lue
of S
uper
annu
atio
n (M
argi
nal E
ffec
ts)
Mod
el 1
Mod
el 2
Vari
able
Coeffi
cien
tSt
anda
rd
Erro
rP-
Valu
eCo
effici
ent
Stan
dard
Er
ror
P-Va
lue
Num
ber o
f Chi
ldre
n:N
one
(ref
eren
ce)
One
-9,1
19.3
4*
4,60
2.40
0.04
8-6
,226
.62
4,46
3.98
0.16
3Tw
o73
8.88
4,24
4.82
0.86
243
0.80
4,12
7.99
0.91
7Th
ree
662.
624,
862.
250.
892
-1,9
21.6
24,
732.
670.
685
Four
or M
ore
-10,
913.
00+
5,82
8.12
0.06
1-9
,244
.72
5,63
8.93
0.10
1
Inte
ract
ion
of F
emal
e an
d N
umbe
r of C
hild
ren:
Non
e (r
efer
ence
)O
ne-8
,929
.92
6,40
3.36
0.16
3-1
,252
.51
6,37
6.52
0.84
4Tw
o-2
7,94
3.45
***
5,84
9.05
0.00
0-1
6,79
4.09
**5,
907.
370.
005
Thre
e-3
5,60
4.65
***
6,70
7.40
0.00
0-2
0,82
2.34
**6,
734.
560.
002
Four
or M
ore
-44,
440.
14**
*8,
123.
840.
000
-26,
866.
29**
*8,
097.
430.
001
Fem
ale
-10,
878.
58+
5,80
3.85
0.06
1-2
3,12
2.34
***
6,11
9.31
0.00
0Ba
chel
or’s
Deg
ree
-51,
386.
47**
*11
,403
.82
0.00
0-3
8,80
3.65
***
11,4
26.9
30.
001
Inte
ract
ion
of B
ache
lor’s
Deg
ree
and
Age
1,70
3.15
***
283.
870.
000
1,08
6.37
***
284.
580.
001
Year
12
-43,
744.
35**
13,6
02.9
10.
001
-33,
898.
97*
13,5
63.1
80.
012
Inte
ract
ion
of Y
ear 1
2 an
d Ag
e1,
568.
95**
*33
5.90
0.00
01,
175.
17**
*33
4.67
0.00
4In
tera
ctio
n of
Fem
ale
and
Year
12
55,8
19.6
4**
17,3
21.1
00.
001
38,1
77.6
5*
17,8
40.7
50.
032
Inte
ract
ion
of F
emal
e, Y
ear 1
2 an
d Ag
e-1
,564
.99
***
429.
490.
000
-1,0
59.8
4*
443.
330.
017
Mig
rant
43,0
46.8
5**
15,9
03.8
70.
007
46,1
57.7
2**
15,5
49.1
10.
003
***
p< 0
.001
, **
0.00
1 ≤
p <
0.0
1, *
0.0
1 ≤
p <
0.0
5 , +
0.0
5 ≤
p <
0.1
0

The Impact of Children on Australian Women’s and Men’s Superannuation 15
Tabl
e 1:
Tob
it E
stim
atio
ns o
n th
e Va
lue
of S
uper
annu
atio
n (M
argi
nal E
ffec
ts)
Mod
el 1
Mod
el 2
Vari
able
Coeffi
cien
tSt
anda
rd
Erro
rP-
Valu
eCo
effici
ent
Stan
dard
Er
ror
P-Va
lue
Inte
ract
ion
of M
igra
nt a
nd A
ge-1
,739
.62
***
382.
140.
000
-1,7
08.4
0**
*37
3.33
0.00
0In
tera
ctio
n of
Fem
ale
and
Mig
rant
-56,
142.
75*
22,3
45.2
70.
012
-48,
598.
38*
21,8
50.2
20.
026
Inte
ract
ion
of F
emal
e, M
igra
nt a
nd A
ge1,
634.
12**
543.
020.
003
1,34
4.56
*53
1.27
0.01
1M
arit
al S
tatu
s:Si
ngle
(not
pre
viou
sly
mar
ried)
refe
renc
eCu
rren
tly M
arrie
d2,
603.
0916
,037
.70
0.87
115
,671
.22
16,3
16.5
10.
337
Inte
ract
ion
of C
urre
ntly
Mar
ried
and
Age
309.
6343
3.36
0.47
5-3
25.3
744
2.36
0.46
2In
tera
ctio
n of
Cur
rent
ly M
arrie
d an
d Fe
mal
e34
,384
.62
*15
,863
.17
0.03
036
,435
.39
*16
,973
.33
0.03
2In
tera
ctio
n of
Cur
rent
ly M
arrie
d, A
ge a
nd F
emal
e-9
03.0
4*
393.
140.
022
-746
.37
+42
8.75
0.08
2D
e Fa
cto
73,0
82.8
9**
24,0
36.5
40.
002
75,0
92.9
7**
23,6
40.8
90.
001
Inte
ract
ion
of D
e Fa
cto
and
Age
-2,2
28.2
8**
686.
560.
001
-2,4
40.5
2**
*67
3.91
0.00
0In
tera
ctio
n of
De
Fact
o an
d Fe
mal
e-7
5,40
7.64
*33
,740
.13
0.02
5-6
0,36
0.44
+32
,859
.39
0.06
6In
tera
ctio
n of
De
Fact
o, A
ge a
nd F
emal
e2,
492.
37*
993.
050.
012
2,19
0.50
*96
4.33
0.02
3Fo
rmer
ly M
arrie
d57
,934
.12
*26
,728
.86
0.03
078
,581
.32
**26
,521
.57
0.00
3In
tera
ctio
n of
For
mer
ly M
arrie
d an
d Ag
e-1
,570
.50
*65
2.54
0.01
6-2
,314
.87
***
650.
390.
000
Inte
ract
ion
of F
orm
erly
Mar
ried
and
Fem
ale
-17,
291.
3729
,976
.57
0.56
4-9
,969
.76
30,4
02.9
70.
743
Inte
ract
ion
of F
orm
erly
Mar
ried,
Age
and
Fem
ale
699.
5669
8.31
0.31
658
9.59
715.
670.
410
Self
empl
oyed
-37,
255.
12**
*3,
869.
920.
000
-18,
756.
88**
*3,
936.
270.
000
Inte
ract
ion
of S
elf E
mpl
oyed
and
Fem
ale
15,2
02.2
2*
6,37
1.73
0.01
717
,266
.32
***
6,36
9.64
0.00
7Ag
e16
,483
.39
+8,
985.
840.
067
16,6
68.9
2**
*8,
754.
980.
057
***
p< 0
.001
, **
0.00
1 ≤
p <
0.0
1, *
0.0
1 ≤
p <
0.0
5 , +
0.0
5 ≤
p <
0.1
0

16 The Economic and Labour Relations Review
Tabl
e 1:
Tob
it E
stim
atio
ns o
n th
e Va
lue
of S
uper
annu
atio
n (M
argi
nal E
ffec
ts)
Mod
el 1
Mod
el 2
Vari
able
Coeffi
cien
tSt
anda
rd
Erro
rP-
Valu
eCo
effici
ent
Stan
dard
Er
ror
P-Va
lue
Age
squa
re-4
25.9
8+
230.
540.
065
-455
.35
*22
4.68
0.04
3Ag
e cu
bed
4.09
*1.
920.
033
4.37
7*
1.87
40.
020
Gro
ss In
com
e fr
om W
ages
and
Sal
arie
s 200
1-02
-0.9
16**
*0.
190
0.00
0In
tera
ctio
n an
nual
gro
ss w
age
in 2
001-
02 a
nd A
ge0.
038
***
0.00
50.
000
Inte
ract
ion
annu
al g
ross
wag
e in
200
1-02
and
Fem
ale
0.39
40.
361
0.27
6In
tera
ctio
n an
nual
gro
ss w
age
in 2
001-
02, A
ge a
nd F
emal
e0.
000
0.00
90.
962
Cons
tant
-207
,767
.65
+11
3,88
5.70
0.06
8-1
99,4
23.7
3+
110,
884.
380.
0721
No.
obs
:56
3551
80
Log
likel
ihoo
d:-6
3715
.19
-582
79
Rest
ricte
d Lo
gL:
-681
64.7
6-6
8164
.76
LR-s
tat (
rest
ricte
d m
odel
vs.
unre
stric
ted)
:88
99.1
3719
771.
53
p-va
lue:
0.00
0000
00.
0000
000
LR-s
tat o
f mod
el w
ith v
s. m
odel
with
out c
hild
ren
varia
bles
:76
04.1
6
p-va
lue:
0.
0000
000
***
p< 0
.001
, **
0.00
1 ≤
p <
0.0
1, *
0.0
1 ≤
p <
0.0
5 , +
0.0
5 ≤
p <
0.1
0
The Impact of Children on Australian Women’s and Men’s Superannuation 17
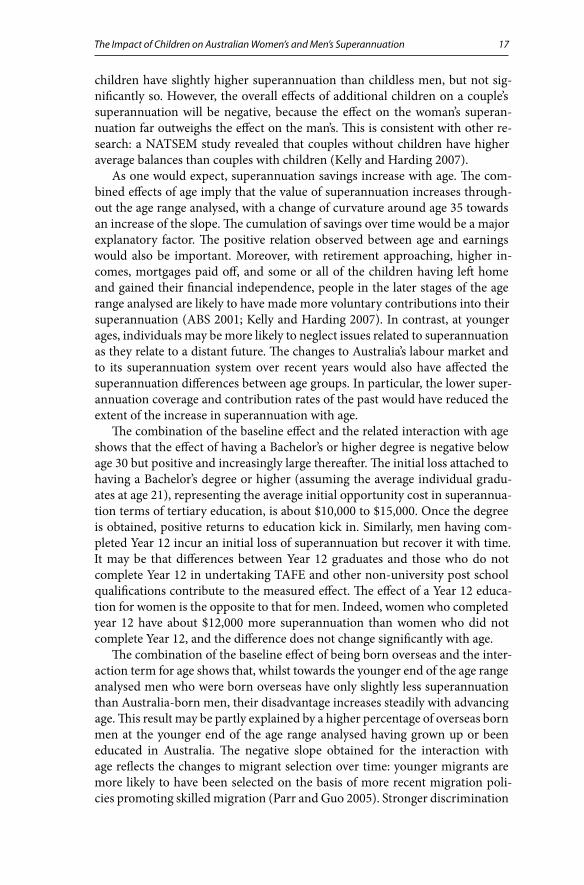
children have slightly higher superannuation than childless men, but not sig-nificantly so. However, the overall effects of additional children on a couple’s superannuation will be negative, because the effect on the woman’s superan-nuation far outweighs the effect on the man’s. This is consistent with other re-search: a NATSEM study revealed that couples without children have higher average balances than couples with children (Kelly and Harding 2007).
As one would expect, superannuation savings increase with age. The com-bined effects of age imply that the value of superannuation increases through-out the age range analysed, with a change of curvature around age 35 towards an increase of the slope. The cumulation of savings over time would be a major explanatory factor. The positive relation observed between age and earnings would also be important. Moreover, with retirement approaching, higher in-comes, mortgages paid off, and some or all of the children having left home and gained their financial independence, people in the later stages of the age range analysed are likely to have made more voluntary contributions into their superannuation (ABS 2001; Kelly and Harding 2007). In contrast, at younger ages, individuals may be more likely to neglect issues related to superannuation as they relate to a distant future. The changes to Australia’s labour market and to its superannuation system over recent years would also have affected the superannuation differences between age groups. In particular, the lower super-annuation coverage and contribution rates of the past would have reduced the extent of the increase in superannuation with age.
The combination of the baseline effect and the related interaction with age shows that the effect of having a Bachelor’s or higher degree is negative below age 30 but positive and increasingly large thereafter. The initial loss attached to having a Bachelor’s degree or higher (assuming the average individual gradu-ates at age 21), representing the average initial opportunity cost in superannua-tion terms of tertiary education, is about $10,000 to $15,000. Once the degree is obtained, positive returns to education kick in. Similarly, men having com-pleted Year 12 incur an initial loss of superannuation but recover it with time. It may be that differences between Year 12 graduates and those who do not complete Year 12 in undertaking TAFE and other non-university post school qualifications contribute to the measured effect. The effect of a Year 12 educa-tion for women is the opposite to that for men. Indeed, women who completed year 12 have about $12,000 more superannuation than women who did not complete Year 12, and the difference does not change significantly with age.
The combination of the baseline effect of being born overseas and the inter-action term for age shows that, whilst towards the younger end of the age range analysed men who were born overseas have only slightly less superannuation than Australia-born men, their disadvantage increases steadily with advancing age. This result may be partly explained by a higher percentage of overseas born men at the younger end of the age range analysed having grown up or been educated in Australia. The negative slope obtained for the interaction with age reflects the changes to migrant selection over time: younger migrants are more likely to have been selected on the basis of more recent migration poli-cies promoting skilled migration (Parr and Guo 2005). Stronger discrimination

18 The Economic and Labour Relations Review
against migrants in the past may have been another factor. The accumulation of migrant superannuation disadvantage with increasing age may also reflect the cumulative effect over time of migrant disadvantage in the labour force.
The superannuation disadvantage for female migrants is more pronounced than that for male migrants at younger ages. However, because of the positive interaction effect with age for females, in comparison to Australia-born women, migrant women’s superannuation deficit increases only slightly with increasing age. The reason we observe such a difference between male and female migrants is probably due to the fact that a larger proportion of the principal applicants for skilled migration are male, whilst a larger number of women migrate under fam-ily reunion schemes. Studies show that migrants entering Australia under Family or Refugee status fare relatively worse than other types of visa categories (Ma-huteau and Junankar 2005, 2007). It may also reflect differences in gender roles within the family, with migrant women being more likely than their Australia-born counterparts to withdraw from the labour force following childbirth.
Although there are no significant differences between the superannuation levels of men who are currently married and men who have never married (and who are not in a de facto union), for women an initially higher value of superannuation among the currently married reduces with increasing age. The superannuation advantage of the married (after controlling for the effects of children and other variables) may reflect that household economies of scale allow more saving, including superannuation contributions, and that marriage may encourage planning for the future, including retirement.
For men, the extent to which the separated, divorced and widowed (hence-forth ‘formerly married’) have less superannuation than the never married in-creases with age, starting from the mid-30s. For women, the contrast between the formerly married and the never married is not significantly different from that for men. This may reflect the balance between the past superannuation ad-vantage resulting from the marriage and disadvantageous effects of sole parent-hood on income and superannuation changing with increasing age. Surprisingly, there is no significant difference between the superannuation values of formerly married men and formerly married females. A broadly similar pattern to that of the formerly married is observed for men who are currently in a de facto relationship. The similarity may reflect that most of the men in the latter part of the age range considered who are in a de facto relationship have previously been married. The reverse pattern is evident for women in de facto relationships. Women in a de facto relationship start off with a disadvantage compared to sin-gles but recover from it by their late 20s. Since a large proportion of those in de facto relationships (whether males or females) have been married previously, the differential effect between females and males in a de facto relationship may reflect the shocks on superannuation following separations.
As expected, self-employed individuals have a significantly lower level of su-perannuation. The new policy adopted in 1992 imposed compulsory contributions for the wage earners, but not for the self-employed. Moreover, the self-employed experience greater variability and uncertainty in their income, and so may prefer to retain their savings in forms on which they may draw in the event of a crisis.

The Impact of Children on Australian Women’s and Men’s Superannuation 19
Model 2 introduces a control for the current gross annual income from wages and salaries. It shows that throughout the age range analysed superannuation increases with the gross income from wages and salaries in 2001–02, and the superannuation advantage of the higher paid increases with age. This pattern is common to both females and males. In the absence of information about each individual’s wage pattern throughout their active life, we rely on this latter vari-able as a proxy of the actual employment histories. The contrast between the results of Models 1 and 2 indicate that changes in superannuation with age are due to more than our measured relationship between age and income. Figure 4 illustrates the relationship between age and superannuation levels for the two models. Our ability to control for the effects of income is limited due to the fact that income is only observed once (i.e. in 2001–02). With a more complete time series of data on income a more elaborate estimation technique to consider the endogenous determination of superannuation and earnings would have been necessary. We tested for endogeneity of the gross income from wages and sala-ries in 2001–02 and found it to be exogenous.
Figure 4: Relationship Between Superannuation Levels and Age (Model 1: Without Control for Age vs. Model 2: With Controls)
Supe
rann
uatio
n
Age

20 The Economic and Labour Relations Review
DiscussionThe inadequacy of women’s superannuation savings has been well known for many years. The analysis in this paper illustrates that women’s deficit in the value of their superannuation increases steeply with the number of children they have. Moreover, even after controlling for a range of variables which are related to the selectivity of female childbearing, there are still substantial negative effects related to the number of children a woman has. Thus, whilst by no means all women’s superannuation deficit is child-related, within the female population the superannuation deficit of women with more children should be of particu-lar concern. Financial assistance targeted specifically at women with children may help to address this problem. In many other countries, women who are responsible for child care are given extra assistance from the government, in the provision of retirement income (Whitehouse 2007). In other countries which have social security systems administered by the government, child-care credits are awarded, boosting entitlements to old age pension benefits (Olsberg and Ferris 2001). This would be difficult to implement in Australia, under the cur-rent means-tested social security system. Options which might be considered in Australia are the addition of a government-paid superannuation contribution to the lower paid parent in families which receive child-related benefits, such as the Maternity Allowance (a ‘baby super bonus’) or Family Tax benefits.
The government has already introduced a number of initiatives to address women’s superannuation deficit, but with varying success. Some of these ini-tiatives were introduced after the collection of the data used in this research. Analysis of later waves of the survey will enable us to assess the impact of these more recent changes to the rules. The spouse contribution tax incentive (in-troduced in 1996) was designed to encourage voluntary contributions for low income women. The take up rate has been low (in the HILDA data only 2.6 per cent of partnered women and 0.7 per cent of partnered men reported receiving contributions into a super fund from their partner, with the average annual receipt being $74 per partnered female and $54 per partnered male). This may reflect, firstly, that the benefit is only available to low-income women. It seems likely the partners of non-working mothers would have a greater difficulty in making additional voluntary contributions than the partners of childless wom-en, due to the financial costs of their children. Secondly, it may be that many women are unaware of this benefit. Thirdly, the tax incentive is fairly low (a rebate of 18 per cent of the contributions).
The introduction of the government co-contribution (effective from 1 July 2003 — after the data analysed were collected) has provided an incentive for low and middle income workers to make voluntary contributions. Data re-leased by the ATO suggest that the co-contribution system has been partic-ularly beneficial to women: 63 per cent of co-contributions went to women (House of Representatives Standing Committee on Economics, Finance, and Public Administration 2006). The co-contribution is not targeted specifically at women; nor does it give special treatment to women who have child care re-sponsibilities. This benefit is not available to people who are not working (you must be an eligible employee in order to receive the co-contribution). Given

The Impact of Children on Australian Women’s and Men’s Superannuation 21
the problems identified in our research, this seems counter-productive — the people who are out of the workforce, caring for children, are the ones who most need assistance in saving for retirement. The Human Rights and Equal Op-portunity Commission has recently advocated changes to the co-contribution system — specifically that the Australian Government extend the Superannua-tion Co-contribution Scheme to individuals not in the paid workforce because of caring responsibilities including caring for dependent adults or children. An individual is to be eligible for government funded co-contributions if he or she is either eligible for Carer Payment, eligible for Parenting Payment or in receipt of Carer Allowance in addition to another income support payment for persons of working age (HREOC 2007). The House of Representatives Stand-ing Committee (2006) has made similar recommendations, and they went fur-ther, arguing that the compulsory superannuation system should be extended to women on maternity leave. The adoption of these recommendations would help to redress the superannuation deficits of women with children, although it seems likely the financial costs of children would limit the extent to which they could take advantage of such measures.
As women lose income as a result of time off from paid employment to fulfil family responsibilities (including the income they lose after returning to work due to their having less work experience, education and training and due to discrimination), they are likely to become more dependent on their partner for financial support in retirement. This can become an issue if a marriage breaks down. At the time the data we have analysed were collected, the Family Law rules were not at all clear about the treatment of superannuation assets on di-vorce. Technically, since superannuation funds are trust funds, the trustee was holding the assets in trust for the member. The superannuation money was not the property of the husband. There was considerable variation in the treatment of superannuation assets in divorce — often the wife would not receive a fair share of this benefit. With the introduction of the compulsory superannuation system, superannuation assets have become an increasingly significant com-ponent of the family’s assets. Therefore it became more important to ensure that there was a fairer system for dividing the superannuation entitlement in the event of divorce. Family Law was changed with effect from late 2002, and superannuation is now considered to be an asset which must be taken into ac-count when dividing assets on divorce. This does not necessarily mean that a wife will receive a share of her husband’s superannuation, because the division of assets is negotiated. There may be a trade-off; e.g. the wife might keep the family home and the husband might keep the superannuation assets. As yet, there is little information available on the impact of the new rules. It would be interesting to monitor the superannuation savings of divorced women relative to married women — and this would be an area for future research.
The adequacy of the superannuation of much of Australia’s population has been questioned — even for those working full time for thirty years, the ad-equacy of the existing system is arguable (since it depends on the definition of ‘adequate’) (Senate Select Committee on Superannuation 2002; Taylor and Lloyd 2004; House of Representatives Standing Committee 2006). For those

22 The Economic and Labour Relations Review
who spend a significant amount of time out of the workforce, or working part-time, the outlook may be especially bleak (Olsberg 2005). One of the reasons for this is that cohort life expectancies in the older ages have been increasing more rapidly than official estimates had forecast (Booth and Tickle 2004). The analysis in this paper suggests that the raising of fertility may be a secondary de-mographic threat to the adequacy of the nation’s superannuation and may also affect its gender equity (Cigno and Rosati 1996; ABS 2006c). However, rising fertility should also eventually result in a proportionately larger workforce and hence revenue base from which to fund the costs associated with population ageing. Australian Federal Treasurer Peter Costello’s much reported soundbite ‘If you can have children it’s a good thing to do — you should have one for the father, one for the mother and one for the country, if you want to fix the ageing demographic’. (Dodson 2004) recognizes the potential value of higher fertility as a response to the challenges posed by population ageing. However, as our analysis shows, women who contribute to ‘fixing the ageing demographic’ by having children face the prospect of a financially less comfortable retirement as a consequence of their doing so. If one accepts that higher fertility will benefit the nation financially by reducing the adverse fiscal consequences of popula-tion ageing, then rewarding the producers of that benefit (i.e. those who have had the children) would seem to be justified.
In order to understand the variation in superannuation better, further anal-ysis is needed to examine whether the effects of children on women’s super-annuation are purely the direct result of their compulsory contributions with more children or whether voluntary contributions to superannuation also are affected. Analysis is also needed of the variation in partner’s contributions with the number of children. Moreover work which examines the variation in asset portfolios more generally is needed to assess the extent to which the reduction in superannuation with increasing numbers of children is compensated for by changes in the other components of household wealth.
AcknowledgementEarlier versions of this paper were presented to the HILDA Survey Research Conference 2007 at the University of Melbourne 19–20 July 2007 and to the 15th Colloquium of Superannuation Researchers at the University of New South Wales, Sydney, 19–20 July 2007.
NotesThe current regulator is the Australian Prudential Regulation Authority 1. (APRA) and prior to 1998 it was the Insurance and Superannuation Com-missioner.Superannuation savings are subject to a range of tax deductions, rebates, 2. and taxes. Therefore the Australian Tax Office can be the source of data on various aspects of superannuation contributions and benefits.The preservation requirements were introduced under the regulations to 3. the Occupational Superannuation Standards Act 1987.
The Impact of Children on Australian Women’s and Men’s Superannuation 23
Initially the preservation requirements only applied to part of the benefit, 4. i.e. it was possible to take part of the benefit in cash on resignation. How-ever the rules were gradually tightened over the years — any benefits arising from contributions made after 1 July 1999 must be fully preserved. A pre-servable benefit cannot be taken out of the superannuation system unless the member meets a condition of release, e.g. death, total and permanent disability, retirement after age 55, etc. The rules are quite complicated and have changed frequently over the years.Technically, employers do not have to pay the superannuation contribu-5. tions. But if they don’t they are required to pay additional tax. The cost of the tax exceeds the cost of the superannuation contributions, so most em-ployers prefer to pay the contributions.From time to time there are proposals to increase the compulsory contribu-6. tion rate to 12 per cent or even 15 per cent, but this is contrary to the policy of the current government.Employer groups have suggested that this amount should be increased to 7. $800 per month, which would mean that many workers would no longer be eligible for the SGC. However at present this is not government policy.As an example, the Unisuper superannuation fund (which covers most Uni-8. versity staff) requires employer contributions of 17 per cent of salary.Originally self-employed people were not eligible for the co-contribution; 9. the rules were changed effective from 1 July 2007, to allow self-employed people to claim the co-contribution as well. Also, the calculation of income, for these purposes, is subject to special rules.The legislation has primarily been beneficial for wives of male fund mem-10. bers, but also provides tax deductions for female fund members who make contributions for their low-income husbands.The model is estimated using the Olsen’s (1978) transformation of the param-11. eters: 1θ σ= and ( )1γ β σ= , which leads to the following log likelihood:
( ) ( ) ( ) ( )( )2' 2 '
0 1
1log log log 2 log2
i i
i i id d
L X y Xγ π θ θ γ= =
= Φ − + − − + −
∑ ∑
ReferencesABS (Australian Bureau of Statistics) (2001) Superannuation: Coverage and Finan-
cial Characteristics, Catalogue Number 6360.6, Commonwealth of Australia, Canberra, available: http://www.abs.gov.au/ [accessed April 2007].
ABS (2005) Social Trends 2005, Catalogue Number 4102.0 Commonwealth of Aus-tralia, Canberra, available: http://www.abs.gov.au/ [accessed 5 April 2007].
ABS (2006a) Population Projections 2004–2101 Reissue, Catalogue Number. 3222.0, Commonwealth of Australia, Canberra, available, http://www.abs.gov.au/ [ac-cessed 10 August 2007].
ABS (2006b) Household Wealth and Wealth Distribution, Catalogue Number. 6554.0, Commonwealth of Australia, Canberra, available: http://www.abs.gov.au/ [ac-cessed 2 April 2007].
24 The Economic and Labour Relations Review
ABS (2006c) Births 2005, ABS Catalogue Number. 3301.0, Commonwealth of Aus-tralia, Canberra, available: http://www.abs.gov.au/ [accessed 10 January 2006].
Australian Council of Trade Unions (ACTU) (2007) ‘Women now earn $100 a week less than men: ACTU analysis shows widening gender pay gap’, Media Release, 7 March.
Australian Taxation Office (1999a) Super news for most, but women and contrac-tors still missing out, media release 99/09, available: http://www.ato.gov.au/ [ac-cessed April 2007].
Australian Taxation Office (1999b) Superannuation Guarantee compliance up — Women contractors and regional areas benefit, media release 99/87, avail-able: http://www.ato.gov.au [accessed 5 April 2007].
Booth, H. and Tickle, L. (2004) ‘Beyond three score years and ten: Prospects for longevity in Australia’, People and Place, 12(1), pp. 15–27.
Breusch, T. and Gray, E. (2004) ‘New estimates of mothers’ forgone earnings using HILDA data’, Australian Journal of Labour Economics 7(2), pp. 125–150.
Brown, C. (1994) The distribution of private sector superannuation assets by gender, age and salary of members, Paper presented to the Superannuation Researchers Colloquium, available: http://rim.treasury.gov.au/content/pubs.asp [accessed 2 April 2007].
Carmichael, G. and McDonald, P. (2003) ‘Fertility trends and differentials’, in S.E. Khoo and P. McDonald (eds) The Transformation of Australia’s Population, UNSW, Sydney. pp. 40–76.
Chapman, B., Dunlop, Y., Gray, M., Liu, A. and Mitchell, D. (2001) ‘The impact of children on the lifetime earnings of Australian women: evidence from the 1990s’, Australian Economic Record, 34(4), pp. 373–389.
Cigno, A. and Rosati, F. (1996) ‘Jointly determined saving and fertility: Theory and estimates for Germany, Italy, UK and USA’, European Economic Review, 40, pp. 1561–1589.
Clare, R. (2004) Why can’t a woman be more like a man: Gender differences in retirement savings, paper presented to Super: Saving 4 the Nation, the ASFA National Conference and Super Expo, Adelaide Convention Centre, 10–12 No-vember.
Cobb-Clark, D. and Hildebrand, V. (2002) The wealth and asset holdings of U.S.- born and Foreign-born Households: Evidence from SIPP Data, IZA Discussion Paper No. 674, available: http://www.iza.org/ [accessed 13 February 2007].
Commonwealth of Australia (1984) Sex Discrimination Act 1984 No. 4 — Section 41, available: http://www.austlii.edu.au/ [accessed 12 June 2007].
Commonwealth of Australia (1992) Superannuation Guarantee (Administration) Act 1992 No. 111, Section 20, available: http://www.austlii.edu.au/ [accessed 12 June 2007].
Commonwealth of Australia (2004) Budget 2004–05: More Help for Families, avail-able: http://www.budget.gov.au/2004-05/ [accessed 10 January 2007].
Dodson, L. 2004. ‘The mother of all spending sprees’, Sydney Morning Herald, 12 May, Budget Supplement, p. 1.

The Impact of Children on Australian Women’s and Men’s Superannuation 25
Evans, M. (1996) ‘Women’s labour force participation in Australia: recent research findings. Journal of the Australian Population Association, 13(1), pp. 67–92.
Ferris, S. and Olsberg, D. (2001) ‘Missing out? Women and retirement savings’, Macquarie University Department of Actuarial Studies Research Paper 2001.01.
Foster, C. (1988) ‘Towards a National Retirement Incomes Policy’, Social Security Review Issues Paper 6, Australian Government Publishing Service, Canberra.
Gray, A. and Tesfaghioghis, H. (1993) ‘Aboriginal population prospects’, Journal of the Australian Population Association, 10(2), pp. 81–100.
Greene, W. (1999) ‘Marginal effects in the censored regression model’, Economics Letters, 64(1), pp. 43–50.
Hancock, K., Hedley, K. and McCrossin, R. (1977) Occupational Superannuation in Australia, The Final Report of the National Superannuation Committee of Enquiry, Australian Government Publishing Service, Canberra.
Henman, P., Percival, R., Harding, A. and Gray, M. (2007) Costs of children: Re-search commissioned by the Ministerial Taskforce on Child Support, Occasion-al Paper No. 18. Australian Government Department of Families, Community Services and Indigenous Affairs, Canberra.
House of Representative Standing Committee on Economics, Finance and Public Administration (2006) Improving the superannuation savings of people under 40, The Parliament of the Commonwealth of Australia, available http://www.aph.gov.au/ [accessed April 2007].
HREOC (Human Rights and Equal Opportunity Commission) (2007) It’s about time: Women, men, work and family, available http://www.hreoc.gov.au/ [ac-cessed 3 April 2007].
Junankar, P. and Mahuteau, S. (2005) ‘Do Migrants get good jobs? New migrant set-tlement in Australia’, Economic Record, 81(S1 August), pp. S34–S46.
Kelly, S. (2003) ‘Forecasting wealth in an ageing Australia: An approach using dy-namic microsimulation, paper presented at the 7th Nordic Seminar on Micro-simulation Models, Helsinki 13 June, available: http://www.natsem.canberra.edu.au/ [accessed 3 April 2007].
Kelly, S. (2006) ‘Modelling the expected income streams’, Presentation to the 39th National Conference of the Australian Association of Gerontology, 22–24 No-vember, available: http://www.canberra.edu.au/centres/natsem/home/ [accessed 2 April 2007].
Kelly, S. and Harding, A. (2007) ‘Baby boomers — doing it for themselves’, AMP/NATSEM Income and Wealth Report Issue 16, March, available: http://www.amp.com.au/group/3column/ [accessed 3 April 2007].
Mahuteau, S. and Junankar, R. (2007) Do migrants succeed in the Australian labour market: Further evidence on job quality, IZA Discussion Paper, Bonn, Germa-ny.
Marks, G., Headey, B. and Wooden, M. (2005) ‘Household wealth in Australia: Its components, distribution and correlates’, Journal of Sociology, 41(1), pp. 47–68.
McDonald, P. (2001) ‘Family support policy in Australia: The need for a paradigm shift’, People and Place, 9(2), pp. 14–20.

26 The Economic and Labour Relations Review
Olsberg, D. (1997) Ageing and Money: Australia’s Retirement Revolution, Allen and Unwin, St Leonards.
Olsberg, D. (2005) ‘Women, superannuation, and retirement: Grim prospects de-spite policy changes’, Just Policy, 35, pp. 31–39.
Olsen, R. (1978) ‘Note on the uniqueness of the maximum likelihood estimator of the Tobit Model’, Econometrica, 46, pp. 1211–1215.
Parr, N. (2005) ‘Family background, schooling and childlessness in Australia’, Jour-nal of Biosocial Science, 37(2), pp. 229–243.
Parr, N. (forthcoming 2007) ‘Which women stop at one child in Australia’, Journal of Population Research, 24(2).
Parr, N. and Guo, F. (2005) ‘The occupational concentration and mobility of Asian immigrants in Australia’, Asian and Pacific Migration Review, 14(3), pp. 351–380.
Percival, R. and Harding, A. (2002) ‘All they need is love and around $450,000’, The AMP/NATSEM Income and Wealth Report Issue 3. Australia: AMP, available: http://www.canberra.edu.au/centres/natsem/publications/ [accessed December 2004].
Rothman, G. (1995) The distribution of superannuation by sector, account type and personal characteristics, paper presented to the Australian Colloquium of Superannuation Researchers, University of Melbourne, July.
Senate Select Committee on Superannuation (2002) ‘Superannuation and standards of living in retirement’, available: http://www.aph.gov.au/Senate/committee/ superannuation_ctte/completed_inquiries/2002-04/living_standards/report/contents.htm [accessed April 2007].
Senate Select Committee on Superannuation and Financial Services (2001) ‘Enforcement of the Superannuation Guarantee Charge’, Parliament of Australia, available: http://www.aph.gov.au/senate/committee/superfinan_ctte/completed_inquiries [accessed April 2007].
Taylor E. and Lloyd, R. (2004) ‘Superannuation — Finding the Balance?’, NATSEM Report prepared for CPA Australia, available: http://www.cpaaustralia.com.au/ [accessed April 2007].
Taylor, J. (2003) ‘Indigenous Australians: The first transformation’, in S. E. Khoo and P. McDonald (eds), The Transformation of Australia’s Population, UNSW, Sydney. pp. 17–39.
Watson, N. and Wooden, M. (2002a) The Household, Income and Labour Dynam-ics in Australia (HILDA) Survey: Wave 1 survey methodology, HILDA Project Technical Paper Series No 1/02, available: http://www.melbourneinstitute.com/hilda/ [accessed 2004].
Watson, N. and Wooden, M (2002b) Assessing the quality of the HILDA Survey Wave 1 data, HILDA Project Technical Paper Series No 4/02, available: http://www.melbourneinstitute.com/hilda/ [accessed 2004].
Whitehouse, E. (2007) Pensions Panorama: Retirement Income Systems in 53 Countries, World Bank, Washington D.C.