Superannuation Knowledge, Behaviour And Attitudes In Young Adults In Australia
126
* Associate Professor, Melbourne Law School, University of Melbourne. † Research Fellow, Melbourne Law School, University of Melbourne. ‡ Research Fellow and MPhil Candidate, Melbourne Law School, University of Melbourne. ⊗ Harold Ford Professor of Commercial Law and Director of the Centre for Corporate Law and Securities Regulation, Melbourne Law School, University of Melbourne. ∅ Senior Lecturer, Department of Finance, University of Melbourne. 1 SUPERANNUATION KNOWLEDGE, BEHAVIOUR AND ATTITUDES IN YOUNG ADULTS IN AUSTRALIA CENTRE FOR INTERNATIONAL FINANCE AND REGULATION RESEARCH REPORT PAUL ALI, * MALCOLM ANDERSON, † MARTIN CLARK, ‡ IAN RAMSAY, ⊗ AND CHANDER SHEKHAR ∅ AUGUST 2014 This report presents the results of a study examining superannuation knowledge, behaviour and attitudes in 994 young adult superannuation fund members (25–34 years old) in Australia. Respondents completed a 75 question online survey instrument which included questions on demographics and superannuation knowledge, behaviour and attitudes. It is the first large-scale study to focus exclusively on superannuation and the young adult population in Australia. The report concludes there are serious deficiencies in knowledge, behaviour and attitudes among young adults. Knowledge of basic facts about superannuation is poor. Young adults are unengaged by and uninterested in superannuation or retirement planning. Attitudes can be described as worried and sceptical. Key words: superannuation, retirement planning, financial literacy, young adults in Australia
Transcript of Superannuation Knowledge, Behaviour And Attitudes In Young Adults In Australia

* Associate Professor, Melbourne Law School, University of Melbourne.
† Research Fellow, Melbourne Law School, University of Melbourne.
‡ Research Fellow and MPhil Candidate, Melbourne Law School, University of Melbourne.
⊗ Harold Ford Professor of Commercial Law and Director of the Centre for Corporate Law and Securities Regulation, Melbourne Law School, University of Melbourne.
∅ Senior Lecturer, Department of Finance, University of Melbourne. 1
SUPERANNUATION KNOWLEDGE, BEHAVIOUR AND ATTITUDES IN YOUNG ADULTS IN AUSTRALIA
CENTRE FOR INTERNATIONAL FINANCE AND
REGULATION RESEARCH REPORT
PAUL ALI,* MALCOLM ANDERSON,† MARTIN CLARK,‡ IAN RAMSAY,⊗ AND CHANDER SHEKHAR∅
AUGUST 2014 This report presents the results of a study examining superannuation knowledge, behaviour and attitudes in 994 young adult superannuation fund members (25–34 years old) in Australia. Respondents completed a 75 question online survey instrument which included questions on demographics and superannuation knowledge, behaviour and attitudes. It is the first large-scale study to focus exclusively on superannuation and the young adult population in Australia. The report concludes there are serious deficiencies in knowledge, behaviour and attitudes among young adults. Knowledge of basic facts about superannuation is poor. Young adults are unengaged by and uninterested in superannuation or retirement planning. Attitudes can be described as worried and sceptical.
Key words: superannuation, retirement planning, financial literacy, young adults in Australia
2 CIFR Research Report — Ali, Anderson, Clark, Ramsay and Shekhar
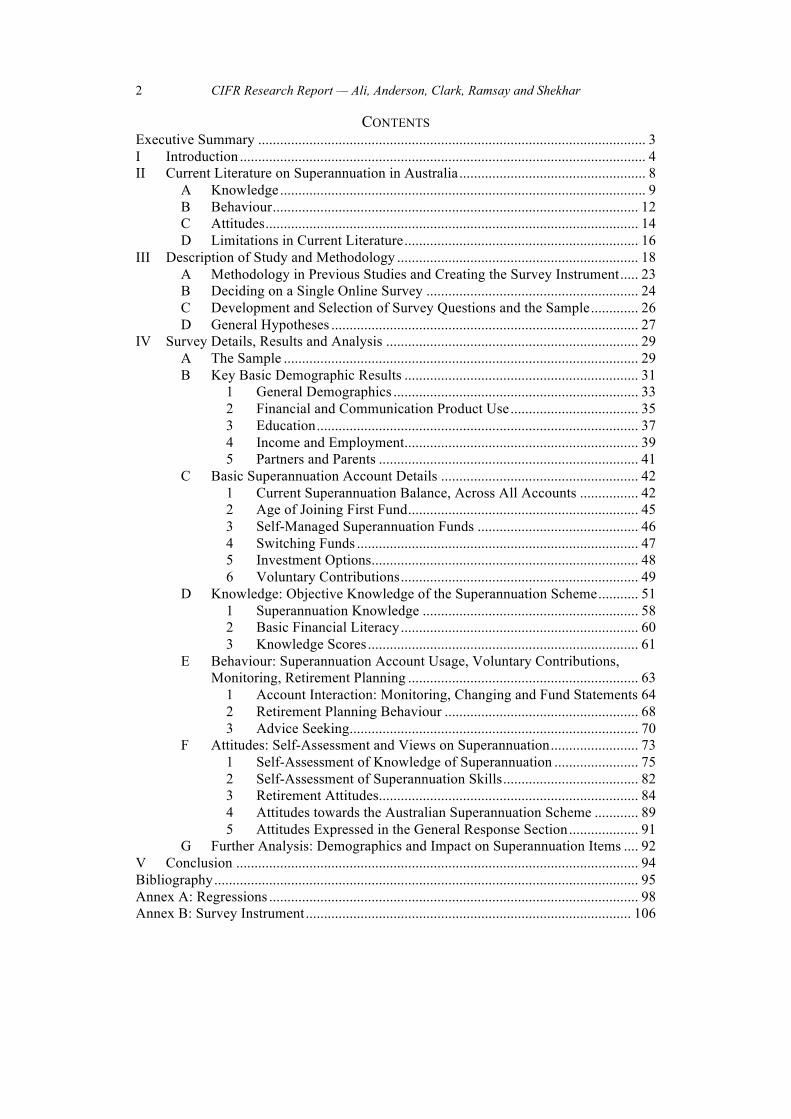
CONTENTS Executive Summary .......................................................................................................... 3 I Introduction ............................................................................................................... 4 II Current Literature on Superannuation in Australia ................................................... 8
A Knowledge .................................................................................................... 9 B Behaviour .................................................................................................... 12 C Attitudes ...................................................................................................... 14 D Limitations in Current Literature ................................................................ 16
III Description of Study and Methodology .................................................................. 18 A Methodology in Previous Studies and Creating the Survey Instrument ..... 23 B Deciding on a Single Online Survey .......................................................... 24 C Development and Selection of Survey Questions and the Sample ............. 26 D General Hypotheses .................................................................................... 27
IV Survey Details, Results and Analysis ..................................................................... 29 A The Sample ................................................................................................. 29 B Key Basic Demographic Results ................................................................ 31
1 General Demographics ................................................................... 33 2 Financial and Communication Product Use ................................... 35 3 Education ........................................................................................ 37 4 Income and Employment ................................................................ 39 5 Partners and Parents ....................................................................... 41
C Basic Superannuation Account Details ...................................................... 42 1 Current Superannuation Balance, Across All Accounts ................ 42 2 Age of Joining First Fund ............................................................... 45 3 Self-Managed Superannuation Funds ............................................ 46 4 Switching Funds ............................................................................. 47 5 Investment Options ......................................................................... 48 6 Voluntary Contributions ................................................................. 49
D Knowledge: Objective Knowledge of the Superannuation Scheme ........... 51 1 Superannuation Knowledge ........................................................... 58 2 Basic Financial Literacy ................................................................. 60 3 Knowledge Scores .......................................................................... 61
E Behaviour: Superannuation Account Usage, Voluntary Contributions, Monitoring, Retirement Planning ............................................................... 63
1 Account Interaction: Monitoring, Changing and Fund Statements 64 2 Retirement Planning Behaviour ..................................................... 68 3 Advice Seeking ............................................................................... 70
F Attitudes: Self-Assessment and Views on Superannuation ........................ 73 1 Self-Assessment of Knowledge of Superannuation ....................... 75 2 Self-Assessment of Superannuation Skills ..................................... 82 3 Retirement Attitudes ....................................................................... 84 4 Attitudes towards the Australian Superannuation Scheme ............ 89 5 Attitudes Expressed in the General Response Section ................... 91
G Further Analysis: Demographics and Impact on Superannuation Items .... 92 V Conclusion .............................................................................................................. 94 Bibliography .................................................................................................................... 95 Annex A: Regressions ..................................................................................................... 98 Annex B: Survey Instrument ......................................................................................... 106
Superannuation Knowledge, Behaviour and Attitudes in Young Adults in Australia 3
EXECUTIVE SUMMARY
This study examines superannuation knowledge, behaviour and attitudes in 994 young adult superannuation fund members (25–34 years old) in Australia. Respondents completed a 75 question online survey instrument which covered demographic questions, superannuation account balance and use details, basic knowledge of the superannuation system, basic financial literacy, behavioural and attitudinal questions on superannuation, retirement planning and financial advice, self-assessments of knowledge and confidence, and open ended questions on financial priorities, the operation of the superannuation system, and the difficulties of retirement planning.
Knowledge of basic facts about superannuation is low, but is particularly low in relation to age of access to superannuation and the definition of investment options. Stronger knowledge scores are seen in male, degree holding, urban and high income respondents. Studying commerce or finance related subjects at secondary school or university had the greatest impact in improving knowledge scores in respondents.
Young adults are unengaged by and uninterested in superannuation or retirement planning. Most respondents do not check their accounts regularly or change investment options, and only one third read their periodic statements. A very small number have planned for retirement.
Attitudes can be described as worried and sceptical. Only one third considered themselves well informed about superannuation. While confidence in skills and knowledge is generally low, males, language other than English (LOTE) speakers, high income and degree-holding respondents are overconfident relative to their knowledge scores. Most are not confident about retirement planning or prospects for retirement. Only one in five agreed that they trusted superannuation fund providers. Superannuation was widely regarded as not a major priority at this stage in the lives of respondents.
4 CIFR Research Report — Ali, Anderson, Clark, Ramsay and Shekhar
I INTRODUCTION
Australia’s compulsory superannuation scheme is barely twenty years old.1 Superannuation forms two of the three pillars of Australia’s current retirement income system — the superannuation guarantee (compulsory employer contributions) and voluntary superannuation contributions (made by individual fund members) — operating in conjunction with the third pillar of the age pension (funded by current taxpayers). While defined benefit superannuation plans have existed in Australia since Federation, it was only after the Superannuation Guarantee Charge was established in 1992 that coverage was extended to more than 90% of the Australian workforce.2 Today the Australian superannuation scheme is the fourth largest in the world.3 There are currently 30.7 million superannuation accounts in Australia.4 Total superannuation assets are currently valued at $1.8 trillion dollars, larger than Australia’s current yearly Gross Domestic Product, and those assets grew by 15.7% over the 2012/2013 financial year.5 Australia’s superannuation scheme is both a massive industry and an important instrument of modern social planning aimed at supporting and sustaining Australia’s increasingly aging and retiring population.
Yet like the superannuation system itself, superannuation knowledge, behaviour and attitudes among Australians remain immature. Australian studies on superannuation consistently lament a lack of basic knowledge about how the scheme operates, irrational behaviour in planning for retirement, and disinterest in a system that is nonetheless almost universally regarded by those same people as important and vital. Young adults in particular are not engaged in retirement
1 On the history of superannuation in Australia, see, eg, Australian Prudential Regulation
Authority, ‘A Recent History of Superannuation in Australia’ [2007] APRA Insight. 2 Isabel Gordon, ‘Superannuation in Society: What Are the Accountability Relationships and
Is There a Role for (Group) Accounting?’ (2012) 22 Australian Accounting Review 142, 144 (noting that workforce coverage was at 47.3% in 1986 and 32% in 1976).
3 Deloitte Actuaries and Consultants, ‘Dynamics of the Australian Superannuation System: The Next 20 Years: 2013-2033’ (September 2013) 1 (measured by pool of assets).
4 Australian Prudential Regulation Authority, ‘APRA Insight: Issue One 2014’ (2014) 16. 5 Australian Prudential Regulation Authority, ‘APRA Insight: Issue One 2014’, above n 4;
Deloitte Actuaries and Consultants, above n 3; Australian Prudential Regulation Authority, ‘Annual Superannuation Bulletin 2013 (revised 5 February 2014)’ (June 2013) 7 <http://www.apra.gov.au/Super/Publications/Documents/Revised%202013%20Annual%20Superannuation%20Bulletin%2005-02-14.pdf> The current structure of the fund types that make up the industry, by percentage of total assets, is self-managed superannuation funds (‘SMSFs’) (31.3%), retail funds (26.1%), industry funds (21%), public sector funds (15.9%) and corporate funds (3.8%). Average account balances of individual fund members differ widely depending on the type of fund: as at June 2013, the average balance for an SMSF member was $524,905, corporate fund members $119,711, public sector fund members $76,978, retail members $29,370 and industry fund members $28,172. Average account balances of individual fund members differ widely depending on the type of fund: as at June 2013, the average balance for an SMSF member was $524,905, corporate fund members $119,711, public sector fund members $76,978, retail members $29,370 and industry fund members $28,172. Contributions in 2012/2013 totalled $115.3 billion ($77.5 billion from employers, $36.5 billion from members, and $1.3 billion from government co-contributions or spousal contributions).

Superannuation Knowledge, Behaviour and Attitudes in Young Adults in Australia 5
planning. Intuitive explanations for this are that they do not know much about how to effectively plan for retirement or manage their superannuation, that their lack of knowledge and confidence prevents them from realising the importance of trying to do so, that they feel unable to affect an outcome that seems to be much more heavily influenced by fund manager decisions and the whims of uncertain global financial markets. Probably the most obvious likely explanation is lack of urgency: retirement is a long way off, and many more pressing financial concerns — food, clothing, transport, rent or mortgage payments —must be dealt with immediately.
This research report analyses and discusses the results of an empirical survey of young adult superannuation fund members in Australia. We focus on three major areas of superannuation interaction:
1. Knowledge: How do young adults understand their superannuation in the context of retirement savings planning? This aspect examined knowledge of objective facts about Australia’s superannuation scheme, and general financial literacy skills.
2. Behaviours: How do young adults interact with their superannuation accounts? What are their habits and behaviours in using superannuation: making voluntary contributions; changing investment settings; changing fund providers; reading fund-provided information and account statements? What elements of current superannuation information, including fund statements, product disclosure statements, and online services contribute to or hinder successful retirement savings planning?
3. Attitudes: How do young adults view the superannuation system and their own approach to it? How confident are they about retirement planning and superannuation? How do they self-assess their knowledge and behaviours? What do they see as major financial goals and their relationship to retirement priorities? What do they think of Australia’s retirement scheme?
The project sample was 994 25–35 year olds living in Australia who are members of one or more superannuation fund(s), weighted to reflect general census data on young people in Australia.6 Respondents completed a 75-question online survey instrument with questions covering in-depth demographics, superannuation account and fund membership details, objective knowledge of basic facts about superannuation, financial literacy, behaviour and use of superannuation accounts, views and attitudes towards their own knowledge and use of superannuation products, and views on the retirement scheme overall. Questions were posed in a number of formats, including multiple choice, Likert scale and open text responses. The online consumer and academic research
6 While there will be a small minority of 25–34 year olds in Australia who do not have a
superannuation fund, we thought it best to ensure that the characteristics of our sample was matched closely against the general young adult population.

6 CIFR Research Report — Ali, Anderson, Clark, Ramsay and Shekhar
company PureProfile distributed the survey instrument and collected the response data, which was then analysed by the research team.
Part II of the report reviews the literature on superannuation in Australia. Part III describes the present study and discusses its methodology. Part IV presents and discusses our key findings. Part V concludes. Appendix I contains various regression data, and Appendix II contains the full questionnaire completed by respondents. Our broad results indicated that:
• Poorer knowledge was present among year 10 or lower education; females and non-English speaking backgrounds: see Table 9.13
• Superannuation knowledge improved with longer work experience: regressions of those who began work after high school or began work after tertiary study were significant and positive determinants of better superannuation knowledge: see Table 9.13
• Although knowledge did differ between high and low income groups, with high income earners more likely to score higher (Table 9.12), the regressions between these variables indicate they are not significant (Appendix Table 5). This is probably because the driver of high knowledge scores is actually ‘degree holder’, and degree holding respondents generally had higher incomes (Table 9.13).
• Respondents who had studied at least one area relevant to finance or commerce demonstrated clearly better knowledge of superannuation: see Table 9.13. This was the most important indicator of better performance on almost all questions on the survey: see Table 19.2.
• Few respondents were able to correctly state the age at which they can begin to access their superannuation. Almost two thirds could not do so: 29.7% correctly stated that 60 is the earliest age (for people who are currently aged 25–34), and 37.2% responded either 60 or 65 (65 is the age at which you can access superannuation while still working).
• Short term financial goals took clear precedence over retirement planning: see Table 14.4. While less than a third disagreed with that statement, about one third were neutral or unsure about goal prioritisation.
• Most respondents over-estimated their knowledge of superannuation. Males were relatively over-confident compared to females: see Section 12, Chart A, Chart B and Table 14.1.
• Most respondents checked their superannuation very infrequently. Four in five hardly ever (or never) consider making changes to their investment options: see Table 10.1 and Table 10.2.
• Nearly a third read all or most of their periodic statements. The vast majority pay attention to balance and fees and charges. Only one-third agreed that reading and understanding a periodic statement was ‘easy’: see Table 11.1, Table 11.2 and Table 11.3. Only one-third think they paid sufficient attention to superannuation: Table 15.2.

Superannuation Knowledge, Behaviour and Attitudes in Young Adults in Australia 7
• Only 6.5% had made a plan for retirement: Table 12.1. Few respondents feel prepared for retirement and only one-third indicated they thought ‘everything will fall into place: see Table 14.1
• Only 35% considered themselves well informed about superannuation: Table 14.3. 40% were confident that they could assess the pros and cons of a superfund information back without any assistance.
• More than one-third cited frustration, lack of control and lack of knowledge as factors explaining the difficulty of planning for retirement: see Table 16.3, with 42% of male respondents citing these factors.
Knowledge of basic facts about superannuation is low, but is particularly low in relation to age of access to superannuation and the definition of investment options. Stronger knowledge scores are seen in male, degree holding, urban and high income respondents. Female, lower educated, regional and low income respondents generally had lower knowledge scores. Knowledge in young adults does not improve with age. Studying commerce or finance related subjects at secondary school or university had the greatest impact in improving knowledge scores in respondents.
Young adults are unengaged by and uninterested in superannuation or retirement planning. Most respondents do not check their accounts regularly or change investment options. Only one third read most or all of their periodic statements, and most extra material provided by superannuation funds is not read. A very small number have planned for retirement, and most have not considered the question at all so far. Young adults tend not to seek professional advice on financial issues including superannuation, and while they prefer to discuss these issues with partners, relatives or friends, those conversations usually relate to mortgages or other loans rather than retirement or superannuation.
Attitudes can be described as worried and sceptical. Only one third considered themselves well informed about superannuation, with male, degree holding, commerce educated and asset holding respondents showing higher levels of confidence in their knowledge, and females showing lower levels of confidence. When compared with actual scores attained in the knowledge component of the survey, males, LOTE, high income and degree-holding respondents are relatively overconfident. Confidence in superannuation skills (reading and understanding a fund statement, for example) was generally low. Only one-third agreed that they paid a sufficient amount of attention to superannuation. Most are not confident about retirement planning or prospects for retirement. Superannuation is rarely discussed with people respondents know. Only one in five agreed that they trusted superannuation fund providers. Superannuation was widely regarded as not a major priority at this stage in the lives of respondents.
8 CIFR Research Report — Ali, Anderson, Clark, Ramsay and Shekhar
II CURRENT LITERATURE ON SUPERANNUATION IN AUSTRALIA
A large Australian literature on superannuation knowledge, behaviour and attitudes has emerged in the last decade. In 2004, Beal and Delpachtira lamented that thus far there had been relatively limited research in the US and Canada on retirement planning, and that ‘no academic published papers examining Australians’ understanding of their superannuation system’ existed at that time.7 That evaluation was not entirely accurate — several Australian studies and reports had been published8 — but that literature was still very scant. Certainly no widespread studies had been conducted. Since then several dozen studies by academic, government and industry groups have directly examined superannuation knowledge, behaviour and attitudes in Australia.9 Wider surveys on general financial literacy now contain substantial superannuation components.10 What picture of the general population emerges from empirical work on superannuation knowledge, behaviours and attitudes? The studies — regardless of method, sample or how recently the study was conducted — take a bleak view of superannuation competency in Australia. Australian superannuation fund members generally have low levels of understanding about superannuation, and low financial literacy in general. The majority of Australians do not have adequate retirement plans and will not be able to support a ‘comfortable retirement lifestyle’.11
But while these surveys have examined both the general Australian population and specific demographic or geographical areas,12 no in-depth, large 7 Diana Beal and Sarath Delpachitra, ‘Community Understanding of Superannuation’ (2004)
11 Agenda 127, 129. 8 See John Dewar et al, Superannuation and Divorce in Australia (Australian Institute of
Family Studies, 1999); Kerry A Brown, Gerry T Gallery and Natalie Gallery, ‘Informed Superannuation Choice: Constraints and Policy Resolutions’ (2002) 32 Economic Analysis and Policy 71; Marilyn Clark-Murphy, Ingeborg Kristofferson and Paul Gerrans, ‘What Makes Superannuation Decisions Difficult?’ (2002) 10 International Journal of Business Studies 73 (examining resources used and self-assessments in making superannuation decisions); Natalie Gallery, ‘Superannuation Fund Choice: Opening Pandora’s Box’ [2002] Australian Review of Public Affairs <http://eprints.qut.edu.au/4930/>.
9 See also Association of Superannuation Funds of Australia, ‘Establishing an Academic Research Program with the Superannuation Sector’ (Association of Superannuation Funds of Australia, July 2012).
10 See, eg, The Social Research Centre, ‘ANZ Survey of Adult Financial Literacy in Australia’ (ANZ, December 2011); The Social Research Centre, ‘ANZ Survey of Adult Financial Literacy in Australia’ (ANZ, October 2008).
11 To use Ntalianis and Wise’s term. See, eg, Michael Ntalianis and Victoria Wise, ‘The Role of Financial Education in Retirement Planning’ (2011) 5 Australasian Accounting Business and Finance Journal 23; Beal and Delpachitra, ‘Community Understanding of Superannuation’, above n 7 examining higher educated/wealthier Australians who were presumed to have greater understandings of super, but nonetheless had serious gaps in knowledge, including in response to basic questions around compulsory employer contributions (see at 139-141 for results).
12 See, eg, Paul Gerrans, Marilyn Clark-Murphy and Keith Truscott, ‘Financial Literacy and Superannuation Awareness of Indigenous Australians: Pilot Study Results’ (2009) 44 Australian Journal of Social Issues 417.

Superannuation Knowledge, Behaviour and Attitudes in Young Adults in Australia 9
scale academic study focusing exclusively on superannuation knowledge, behaviour and attitudes among the general young adult population in Australia has been published. This review focuses principally on empirical studies published in scholarly journals, and research reports published by academic, industry and government bodies. Several smaller studies have examined particular aspects of superannuation — either knowledge or behaviour or attitudes — specifically in young Australians.13 Other studies use young respondents as a comparator group against an older cohort.14 Thus the bulk of the literature examined here is studies of the general population that comment on young people. It is grouped into knowledge, behaviour and attitudes according to the main focus of the study (though some overlap between these categories and focuses occurs).
A Knowledge The present literature on young people in Australia generally supports the
broad conclusions that they have lower levels of financial skill and knowledge than the general population,15 that they recognise the importance of long-term financial goals, yet do not know how to go about effectively planning for retirement, and feel forced to prioritise short term goals.16 In their review of the literature to date, Parrish and Delpachtira (2012) describe the general picture of young people emerging from studies into financial literacy and retirement planning:
Young investors may be vulnerable to factors leading them away from rational choices, as they may not possess the level of financial experience or knowledge of older generations. Bounded self-control may be more apparent given that they are further from retirement. Due to longer working lives and increased time until retirement, hyperbolic discounting and loss aversion may be more prominent among younger individuals (Gallery and Gallery, 2005). The effects of this are apparent in a study focusing on under 40s, in which Bateman (2006) found 82 per cent of respondents agreed that it was important to save for retirement, yet only 6 per cent felt prepared and 32 per cent felt some degree of preparedness. There was a stronger focus on short-term financial goals, particularly accommodation, rather than on retirement planning.17
13 See, eg, Tahlia Parrish and Sarath Delpachitra, ‘On Selection of Superannuation Fund:
Impact of Choice and Information’ (2012) 31 Economic Papers 369, 372 (noting that ‘[f]ew studies have examined young Australians and their superannuation decision making’ exclusively).
14 See, eg, Michelle Tustin, Adam Hinds and Adamedes-Schmid Songsil, ‘Gen Y & Superannuation: Why Won’t They Engage? Quantitative Report’ (Colmar Brunton, 2014).
15 See, eg, Andrew C Worthington, ‘Knowledge and Perceptions of Superannuation in Australia’ (2008) 31 Journal of Consumer Policy 349; Hazel Bateman et al, ‘Financial Competence and Expectations Formation: Evidence from Australia’ (13 April 2011) 11.
16 Debra Grace, Scott Weaven and Mitchell Ross, ‘Consumer Retirement Planning: An Exploratory Study of Gender Differences’ (2010) 13 Qualitative Market Research 174, 177.
17 Parrish and Delpachitra, above n 13, 372.
10 CIFR Research Report — Ali, Anderson, Clark, Ramsay and Shekhar
Only one study has focused on superannuation knowledge among young people. Cull and Whitton (2011) surveyed 472 students at the University of Western Sydney on basic superannuation knowledge. 70% of respondents reported that they had a superannuation fund but only 40% ‘claimed to know the name of their fund and the balance’.18 The generally poor knowledge score results tended to improve with age.19
More frequent, however, are comments on specific trends in the knowledge of younger respondents in studies of the general population examining superannuation. 20 Agnew, Bateman and Thorp (2013) examined the responses of 628 superannuation fund members between the ages of 25 and 65 to nine basic questions on superannuation knowledge.21 They noted that while basic knowledge was present, respondents ‘may not grasp the finer details’: for instance, 87% knew that employer contributions were mandatory, but only 67% could correctly identify the then rate of 9%. Agnew, Bateman and Thorp also indicated that knowledge of superannuation tax rates and incentives was poor.22 Strikingly, only 14% of the total sample knew the correct age at which they could begin accessing their superannuation (52% indicated they did, 48% indicated that they did not know). That study also examined correlations between financial literacy and retirement planning in the general population and found that of the respondents under 35 only 31% could correctly answer each of the
18 Michelle Cull and Diana Whitton, ‘University Students’ Financial Literacy Levels:
Obstacles and Aids’ (2011) 22 The Economic and Labour Relations Review 99, 106 (89 respondents (18.9%) were between 26-35).
19 Ibid 111 (but noting that it dropped to extremely low levels in students over 56). 20 ‘Young people’ in general population studies are often defined as 18–30 or 18–25. The
‘general population’ is usually people of ‘working age’ in Australia: 18–65 year olds. Some studies, usually focusing on particular factors in retirement planning, are skewed towards people close to retirement: see, eg, Deborah A Cobb-Clark and Steven Stillman, ‘The Retirement Expectations of Middle-Aged Australians’ (2009) 85 Economic Record 146; Nancy Humpel et al, ‘Ageing Baby Boomers in Australia: Evidence Informing Actions for Better Retirement’ (2009) 44 Australian Journal of Social Issues 399.
21 Julie Agnew, Hazel Bateman and Susan Thorp, ‘Financial Literacy and Retirement Planning in Australia’ (2013) 6 Numeracy; Julie Agnew et al, ‘Superannuation Knowledge and Plan Behaviour’ (2013); See also Deloitte Actuaries and Consultants, above n 3.
22 Agnew, Bateman and Thorp, above n 21, 4: ‘The respondents had more difficulty answering the multiple-choice question related to voluntary contributions limits. … In this case, only 26% of the total sample correctly responded that for most people there are no limits placed on their voluntary contributions, only tax consequences if they contribute beyond a certain amount. This is notable because misunderstanding important tax incentives could adversely affect retirement planning and savings behavior. … some individuals are unaware of the existence of preferential tax treatment for assets within superannuation accounts. Only 62% of respondents correctly indicated the following statement “For most people, superannuation is taxed at a higher rate than a similar investment outside superannuation” (Question 4) was false. Furthermore, nearly 1/3 of the sample indicated that they “did not know” the answer to this question. While the historically changing tax rates related to superannuation may have caused some respondent confusion, the survey results still highlight that more can be done to communicate with participants regarding tax incentives.’

Superannuation Knowledge, Behaviour and Attitudes in Young Adults in Australia 11
‘big three’ financial literacy questions,23 and over half answered ‘do not know’ to at least one question.24 Ntalianis and Wise (2011) note that young people are less likely to attempt to rectify their knowledge gaps by, for example, taking up fund-provided educational resources like seminars or written or internet-based information.25 Grace, Weaven and Anderson (2008) analysed superannuation consumer involvement, and noted that young respondents in particular failed to realize just how deficient their understandings of and engagement with superannuation were.26 Worthington (2008) analysed the ANZ Survey of Adult Financial Literacy of Australia 2004 results and noted a significant deficiency in basic understanding of superannuation among those aged under 30 (among other groups). That result ‘can indicate a lack of interest in (far off) retirement’ that Worthington concluded appeared to dissipate as people reach retirement.27 Worthington (2008) found that superannuation knowledge in Australia ‘is patchy, with good levels of knowledge in some areas and poor in others’, noting that the three areas with poorest performance were the ability to read and understand statements, retirement planning and knowledge of employer contributions.28 An earlier study by Worthington (2005) noted that ‘overall levels of knowledge obscure significant deficiencies in particular demographic and socioeconomic groups. Females, those from a non-English speaking background, those aged under thirty years, the currently unemployed and those with a Year 10 education or lower are particularly overrepresented in being unable to correctly respond to basic questions concerning superannuation.’29 In 23 The ‘big three’ questions are foundational questions on financial literacy that were
originally developed in 2004 by Lusardi and Mitchell: Annamaria Lusardi and Olivia Mitchell, ‘Financial Literacy and Retirement Preparedness: Evidence and Implications for Financial Education’ (2007) 42 Business Economics 35; These questions have since become known as the ‘big three’ on the basis that they ‘are parsimonious and have been widely replicated and adapted’ Justine S Hastings, Brigitte C Madrian and William L Skimmyhorn, ‘Financial Literacy, Financial Education, and Economic Outcomes’ (Working Paper 18412, National Bureau of Economic Research, January 2013) 347, 9–10 <http://www.nber.org/papers/w18412>.
24 Julie Agnew, Hazel Bateman and Susan Thorp, ‘Financial Literacy and Retirement Planning in Australia’ (2013) 6 Numeracy 8 (also noting that the chances of a respondent being classed as a ‘planner’ decreased by 11.3% for each ‘do not know response’ to the ‘’ financial literacy questions: at 13); See also Michael Kerry, Bruce Clayton and Marc Olynyk, ‘Evaluating the Impact of Financial Literacy Programs on the Retirement Savings of Superannuation Fund Members’ (2007) 3 International Review of Business Research Papers 73.
25 Ntalianis and Wise, above n 11, 35: ‘Females and younger individuals are the key groups identified as less likely to utilise the educational information offered to them by the retirement fund’.
26 Debra Grace, Scott Weaven and Sharlene Anderson, ‘An Examination of Involvement in Relation to Superannuation Consumption’ (2008) 12 Journal of Financial Services Marketing 311.
27 Worthington, ‘Knowledge and Perceptions of Superannuation in Australia’, above n 15, 367.
28 Ibid 368. 29 Andrew C Worthington, ‘Coverage, Knowledge and Perceptions of Superannuation in
Australia’ 13–14 <http://ro.uow.edu.au/commpapers/198/> (emphasis added).

12 CIFR Research Report — Ali, Anderson, Clark, Ramsay and Shekhar
an early study, Beal and Delpachtira (2004) tested ‘basic knowledge’ of superannuation via a reply-paid envelope questionnaire of 18 technical questions and 6 standard demographic questions, distributed in two upper-middle class Brisbane suburbs, and yielding 393 useable replies.30 The authors note that they took particular care to ensure that the complexity and difficulty of questions was not onerous, and did so by cross-checking question phrasing with basic information contained in readily-available government guides on superannuation. 78.3% of respondents were classed as ‘not very well informed’ or ‘not at all informed’.31
B Behaviour Compared to the scant literature focusing on knowledge of superannuation in
young people, there is slightly more material on superannuation behaviour (skills, account interaction, and so forth). Studies examining information and disclosure have been grouped here. Parrish and Delpachtira (2012) investigated behaviour and skills in fund and investment option selection, to assess how information on the selection of superannuation funds and investment options can be best presented to younger fund members to help them make optimal decisions, focusing specifically on information used to choose a fund and investment option.32 Respondents were undergraduate students at Flinders University (n=367, 92% were 18–30) who, after examining four survey instruments with varying layout and information, were tasked with selecting a superannuation fund and choosing from different investment options and with ranking eight fund characteristics in order of importance for their own decision-making.33 Parrish and Delpachtira found that the location of fee information affected which fund was selected and why; that risk labels (‘medium’ or ‘high’ risk) were more commonly relied upon than risk probabilities;34 that employers were ‘highly influential’ in fund selection; and that age did not appear to influence fund or investment option selection. That study suggested four major consumer information considerations when making superannuation investment option choices: performance of the fund, fees, length of time invested, and
30 Beal and Delpachitra, ‘Community Understanding of Superannuation’, above n 7. 31 Ibid 135. 32 See also Natalie Gallery, Cameron Newton and Chrisann Palm, ‘Framework for Assessing
Financial Literacy and Superannuation Investment Choice Decisions’ (2011) 5 Australasian Accounting Business and Finance Journal 3.
33 Parrish and Delpachitra, above n 13, 373ff. At 373 on methodology and results. Layouts at 373. Fund characteristics were: low fees, easy to join, recommended by peers, recommended by financial planner, performance, wide choice of investment options, simple to use, stability of fund. This project was informed by three sub questions: ‘Which factors influence young Australians in their choice of superannuation fund and investment options? To what extent do variations in labelling investment options, and being invested in an investment option, impact on the option young Australians select? To what extent does the presentation of fee, risk and return information determine the funds young Australians choose?’.
34 Risk expressed as years of negative returns.
Superannuation Knowledge, Behaviour and Attitudes in Young Adults in Australia 13
security.35 A 2011 study by Bateman et al of 1200 Australian superannuation fund members compared responses on broader numeracy, financial literacy and confidence with a respondent’s superannuation status (fund manager, total superannuation amount, and so forth), and noted that ‘[r]etirement accumulation and personal net worth tend … to rise with literacy’.36
Other studies have examined interaction with superannuation accounts and information, analysing the ways in which superannuation information, disclosures and educational materials (handbooks, seminars) affect consumer behaviour in making both choices about interacting with superannuation, and in retirement planning more generally. Most studies on communication examined education and information provided by superannuation funds, or by employers (through seminars, websites, and written communication). Ntalianis (2011) surveyed Australian university staff on fund-provided education and its impact on their decision-making procedures, finding that written communications were most used by respondents, followed by fund websites, educational seminars and fund-provided financial counselling.37 Respondents considered all types of educational material to be important in making superannuation decisions. In a study similar to Ntalianis (2011) and again focusing on Australian university staff, Ntalianis and Wise (2011) found that while most respondents did not attend seminars, respondents who did attend indicated that their confidence in their understandings of retirement issues had improved.38 The vast majority of Australians use the default investment fund option, though whether this is best explained by general apathy or disinterest in superannuation is disputed.39 A study by Clark-Murphy et al (2001) examined the information used by 2400 UniSuperannuation fund members in deciding between a defined contribution plan or defined benefit plan and examined attitudes informing perceptions of difficulty of making that decision. Although the discussion of results is brief, it notes that uncertainty among 18–34 respondents may be explained by apparent remoteness of retirement. 37% of 18–34 year olds cited frustration/lack of
35 Parrish and Delpachitra, above n 13, 372. 36 Bateman et al, ‘Financial Competence and Expectations Formation: Evidence from
Australia’, above n 15. 37 The precise demographics of Ntalianis’ study is not clear, though he notes that the
respondent demographics were ‘consistent with’ general Australian university staff demographics.
38 Ntalianis and Wise, above n 11, 34. 39 Gallery, Newton and Palm, above n 21, 4: ‘Industry data show that the vast majority of
individuals are in the default superannuation fund chosen by their employer, and the default investment option chosen by the trustee of the fund they joined (Superannuation Ratings 2006). Until recently, it has generally been assumed that all or most individuals in default investment options do not make an active choice. However, this assumption has been challenged by sectors of the superannuation industry, arguing that it is not the case. Whether fund members passively default into, or actively chosen the default investment option remains an empirical question’. See also Hazel Bateman et al, ‘Just Interested or Getting Involved? An Analysis of Superannuation Attitudes and Actions’ (2014) 90 Economic Record 160 (finding that non-default activity (making voluntary contributions, changing investment options) is not a reliable proxy for member engagement).

14 CIFR Research Report — Ali, Anderson, Clark, Ramsay and Shekhar
control and distrust as emotions informing the difficulty, and lack of knowledge as key reasons for the difficulty itself.40 Research on retirement planning behaviour suggests that the vast majority of people do not act rationally when it comes to making retirement decisions. Australian studies have noted that this trend is particularly severe in young people. This problem is exacerbated by the fact that young people generally have lower financial literacy levels, and consider retirement to be so distant that they either cannot do anything about it, do not consider it to be important, or believe that a comfortable retirement will simply ‘all work out’ as they move through their working lives.41
Often behaviour or attitudes is examined in the absence of a test of objective knowledge of superannuation account details. The recently published AIST quantitative report, ‘Gen Y & Superannuation: Why Won’t They Engage?’,42 compared responses of a ‘Gen Y’ group (n=344)43 and a group aged 55 or older (n=278) on expectations about engagement with superannuation fund providers (frequency of contact and reason for contact), total required retirement savings, use of superannuation, and both grouped and compared according to interest levels (determined by a set of questions on attention paid to superannuation). While that study only presents raw study results without analysis, it indicated that only 26% of young respondents were ‘quite interested’ in superannuation, 60% expected they would need between $30,000 and $60,000 per year in retirement, and on average stated that superannuation would fund 40% of their retirement. As with Parrish and Delpachtira, the AIST results focused on a specific aspect of engagement and attitudes without a knowledge component.
C Attitudes While many of the above studies examining knowledge were limited to
comprehension questions on financial literacy and superannuation,44 some combined comprehension questions with questions aimed at measuring attitudes, perceptions and behaviours. This combination of both comprehension and attitudinal investigations is particularly effective in the larger and more thoroughly analysed ANZ adult financial literacy surveys.45 In the ANZ surveys,
40 See Clark-Murphy, Kristofferson and Gerrans, above n 8, 85ff (for results tables). 41 See, eg, Ntalianis and Wise, above n 21, 35: ‘There are difficulties associated with getting
younger individuals to adequately engage with their retirement savings because they perceive retirement to be something that is far too distant to consider and therefore place less value on it’. This study noted that some 30–50 year old professionals made comments to the effect that ‘everything would fall into place’ or that ‘retirement would only differ from working life in that they would have more time for leisure and travel’.
42 Tustin, Hinds and Songsil, above n 14 (this study was published after our survey was distributed).
43 ‘Gen Y’ was not clearly defined in the quantitative report, but is commonly defined as those born between 1980 and 2000: as at 2014, 14–34 year olds.
44 Some were limited to as few as nine questions on superannuation: Agnew et al, above n 21. 45 The Social Research Centre, ‘ANZ Survey of Adult Financial Literacy in Australia’, above
n 10; The Social Research Centre, ‘ANZ Survey of Adult Financial Literacy in Australia’, above n 10.

Superannuation Knowledge, Behaviour and Attitudes in Young Adults in Australia 15
some superannuation questions were only asked of a reduced sample (approximately n=300–n=500, depending on the question). The data is, however, especially interesting because the survey asked respondents to detail their behaviour and give reasons for their actions or decisions without prompting by the interviewer. To take one example, respondents who did not consider other superannuation funds when choosing a fund were asked their reasons (unprompted, multiple responses allowed), which were later categorised as lack of time or interest (38%), took someone else’s advice (47%), lack of knowledge or information (3%), other (9%) and unsure or cannot recall (5%).46 Young respondents in general studies have low levels of interest in retirement planning and superannuation. The overall results in Agnew et al (2013) suggested that interest in retirement planning ‘gradually increase[ed] … starting in midlife’.47 The AIST Study noted that most Gen Y respondents were not particularly interested in superannuation: 26% said they were ‘quite interested’ and had compared their fund and other funds, 50% indicated they were not interested, but did skim read material sent to them by their fund, and 24% indicated that they were not interested beyond receiving employer payments.48 That study then split its other findings by ‘interest’ level and examined other behaviours and responses through attitude categories.
Many studies report over-confidence among respondents about their knowledge of superannuation and retirement savings. Beal and Delpachtira’s results on knowledge were measured against the respondent’s stated self-perception on how well informed they thought they were: 29 respondents under-estimated their knowledge, and 187 over-estimated it: ‘people overconfident of their superannuation knowledge came from all the groups represented — both male and female, all age groups, all education levels, all incomes and all wealth classes’.49 That finding is inconsistent with Grace, Weaven and Anderson’s (2008) observation that young respondents were more likely to fail to realize their inadequate knowledge.50 Other studies framed this inquiry in averages, asking respondents to classify themselves against what they perceived to be ‘average’ competency by indicating whether they thought they were above or below ‘average’.51 Some studies evaluated broader attitudes towards and confidence about retirement. A Citibank study (2010) of behaviours relating to a wide range of financial products indicated that people expressed the least confidence in their abilities and understanding in the area of retirement.52 While
46 The Social Research Centre, ‘ANZ Survey of Adult Financial Literacy in Australia’, above
n 10, 69 (these questions were asked of the small sub-set of respondents who did not consider other funds, n=138).
47 Agnew, Bateman and Thorp, above n 21, 13. 48 Tustin, Hinds and Songsil, above n 14, 12 (in comparison, of the 55+ group, 46% were
‘quite interested’, 35% were somewhat interested and 19% were uninterested). 49 Beal and Delpachitra, ‘Community Understanding of Superannuation’, above n 7, 136. 50 Grace, Weaven and Anderson, above n 26. 51 See, eg, Beal and Delpachitra, ‘Community Understanding of Superannuation’, above n 7. 52 Citibank Australia, ‘Evidence versus Emotion: How Do We Really Make Financial
Decisions?’ (December 2010).

16 CIFR Research Report — Ali, Anderson, Clark, Ramsay and Shekhar
only 9% of respondents evaluated themselves as having a ‘below average’ ability to understand financial products generally, when asked about saving for retirement 33% considered themselves below average and 30% believed themselves above average. These figures move towards lower confidence in younger respondents: 42% of 18–24 year old respondents and 36% of 25–34 year old respondents selected ‘below average’, while 22% and 23% respectively selected ‘above average’. Interestingly, the highest ‘below average’ assessment was seen in 35–44 year olds (44%). The Citibank study noted ‘a clear pattern of younger people having less confidence in their retirement preparations than older respondents. As is the case with all of the issues, men are more confident in their ability than women’.53
D Limitations in Current Literature For our purposes, a clear limitation with the current literature is that it does
not sample the general young adult population in Australia. Clearly enough, even large studies (n=1000) of the general population that comment on trends in younger respondents will be examining a sub-set of the sample in the n=300–n=500 range. And those studies that do exclusively examine young people sample from areas that are not representative of the general young population, particularly universities. Most are generally conducted with samples consisting entirely of currently enrolled university students, with low sample sizes (approximately n=200–n=400 useable responses), and with little to no indication of demographic information about the sample, whether respondents were selected or self-selecting, and whether the study body reflects the general population.54 While some studies do collect basic demographic data so as to make comparisons with the general population possible, none delve closely into analysis of trends linked to demographic information collected.55 Given the low sample sizes, this is understandable, though it remains a weakness. Those that do not use exclusively university students do not comment on the demographic representativeness of the sample, and often likewise use low sample sizes.56 Some of these studies may have proceeded on the unstated assumption that this is not a problem: university students are likely to be better educated (at a minimum they have completed year 12), are more likely to have come from privileged backgrounds, and therefore are perhaps likely to show ‘better’ results than the average population on financial and retirement knowledge.57 But beyond the clear issue that university students are not representative of young
53 Ibid 9. 54 This is also common in financial literacy surveys, particularly in the United States. 55 See, eg, Tustin, Hinds and Songsil, above n 14. 56 See, eg, ibid. 57 A similar assumption (that better educated and wealthier respondents would demonstrate
better understandings of superannuation) was explicitly noted in Beal and Delpachitra, ‘Community Understanding of Superannuation’, above n 7, however that assumption applied to a general population might be easier to justify than an assumption applied to a specific segment that are arguably less likely to have a wide range of world experiences, have in most instances not yet started their working lives, and so on.

Superannuation Knowledge, Behaviour and Attitudes in Young Adults in Australia 17
people as a whole, there is the risk that university students are probably less likely to have been exposed to factors that may be important in affecting superannuation knowledge, behaviour and attitudes, such as workforce involvement, experience with making long-term financial decisions (such as taking out a mortgage), or supporting a family. Moreover education in particular fields relevant to financial planning (business studies, economics, finance, accounting) may be more important than the general level of education completed in assessing superannuation knowledge, behaviour and attitudes (as it was in this study).

18 CIFR Research Report — Ali, Anderson, Clark, Ramsay and Shekhar
III DESCRIPTION OF STUDY AND METHODOLOGY
Our empirical study employed a 75 question online survey instrument distributed and managed by PureProfile. The instrument was first distributed on 12 December 2013, and ran until we obtained 994 useable responses on 3 March 2014.
The survey instrument is a combination of list selection or tick box questions, true/false/don’t know questions, multiple choice questions, Likert scale agreement questions, and open text box response questions. The instrument was developed after completion of the comprehensive literature review of current literature on empirical studies on superannuation, financial product use and financial literacy in Australia and overseas, detailed in Part II. That review paid particular attention to questions asked, sample size and characteristics, survey methodology and distribution, and results.

Superannuation Knowledge, Behaviour and Attitudes in Young Adults in Australia 19
The instrument was structured as follows: Survey Area Question (exact words in quote marks) Basic demographics 1. Year of birth58
2. Gender59 Region60
3. Languages spoken at home 4. Current relationship status 5. Children / dependents 6. Current living arrangements 7. Postcode
Product use 8. Communications devices Financial products
Education 9. Education completed 10. Current study commitments 11. Areas studied at secondary or tertiary level (mathematics, business
studies, economics, etc) Employment 12. Current yearly net income
13. Occupations / industries worked in 14. Current work commitments 15. Work history 16. Trade union membership
Partners information (if applicable)
17. Partner’s current net yearly income 18. Occupations / industries worked in 19. Current work commitments
Parents information 20. Parents’ work history (M/F) 21. Father’s occupations / industries 22. Mother’s occupations / industries 23. Parents current employment / personal situation (M/F) 24. Parents current use of financial products 25. Parent’s highest level of education (M/F)
58 PureProfile Screening Question: 25–35 years old (YOB: 1978–1987). 59 PureProfile Screening Question for balancing the sample 60 PureProfile Screening Question for balancing the sample

20 CIFR Research Report — Ali, Anderson, Clark, Ramsay and Shekhar
Survey Area Question (exact words in quote marks) Superannuation Details
26. Age of joining first superannuation fund 27. Details of current superannuation fund membership, estimated
balance, and certainty of estimation.61 28. Other superannuation accounts/ options if respondent cannot recall62 29. Partner’s estimated superannuation fund balance 30. Number of times changing accounts 31. Investment options currently in use
32. Number of times making a voluntary contribution63 33. Estimated total in voluntary contributions 34. Factors affecting decision to make/not make voluntary contributions
Basic knowledge of Superannuation (True / False / Don’t Know or multiple choice options or number entry)
35. ‘If you have superannuation you cannot receive the aged pension’ (T/F/DK)
36. ‘In general, is superannuation taxed at a lower, higher or same rate as other investments?’ (Multiple choice)
37. ‘What is the current minimum employer contribution rate for superannuation, as a percentage of salary?’ (Enter %; no minimum; no required contribution/DK)
38. ‘A “balanced” investment option for a superannuation fund is invested exclusively in safe assets like savings accounts, cash management accounts, and term deposits’ (T/F/DK)
39. ‘At what age can you begin to access your superannuation?’ (Enter age; Whenever you decide to retire; DK)
40. ‘The best indicator of superannuation fund performance is:’ (Multiple choice)
Basic financial literacy ‘big three’ questions.
41. ‘If you had $100 in a savings account, and the interest rate was 2% per year, then how much money would you have after 5 years (assuming you don’t withdraw anything from the account)?’ (More than $102; Exactly $102; Less than $102; DK)
42. ‘If the interest rate on your savings account was 1% per year, but inflation was 2% per year, after one year would you be able to buy:’ (More than today; exactly the same as today; less than today; DK)
43. ‘Buying shares in a single company is a less risky investment than putting money into a share investment fund’ (T/F/DK).
61 Q27/28 contained a table with options to include up to ten superannuation fund accounts,
with a searchable list of 300 major providers. 62 Q28 included options to select a self-managed superannuation funds, indicate another fund
not mentioned in the list, or indicate that the respondent cannot recall the name of the fund/s.
63 Q32 allowed response of ‘did not know that you could make voluntary contributions’.

Superannuation Knowledge, Behaviour and Attitudes in Young Adults in Australia 21
Survey Area Question (exact words in quote marks) Attitudes and Views on Financial Decisions and Superannuation Likert Scale
44. ‘How would you describe your knowledge of personal finance issues in general?’ (strong/moderate/weak/no knowledge)
45. ‘How well informed about superannuation would you say you were?’ (Very well/fairly well/not very well/not at all)
46. ‘I find that making financial decisions is not complicated’ 47. ‘I do a lot of research about different options before making a
financial decision’ 48. ‘I put off making financial decisions for as long as I can’ 49. ‘I stay up to date with financial news’
Retirement Planning Details
50. ‘How would you describe your retirement planning so far?’ (No thought; have considered but no plans; considered planning; have planned; have planned and revisited that plan; other (text box))
51. ‘Imagine that you have just retired today. How much money do you think you would need to live on, per year?’ (<$15k;$15–$24,999; $25k–$49,999; $50k–$74,999; $75k–$99,999;>$100k)
52. How much of your retirement funding will be made up of superannuation? (Number entry %)
Retirement Planning Views and Attitudes Likert Scale
53. ‘I feel like everything will fall into place for my retirement’ 54. ‘I don’t feel confident about how I should approach planning for
retirement’ 55. ‘The share market and superannuation fund managers have a much
greater impact on my overall superannuation balance than my own choices and decisions’
56. ‘It’s more important to focus on short term goals, like buying a car, buying a house, or making mortgage repayments, than saving for retirement’
Superannuation Account Interaction
57. Frequency of checking fund account. 58. Frequency of changing investment options 59. Financial advice received in last 12 months.

22 CIFR Research Report — Ali, Anderson, Clark, Ramsay and Shekhar
Survey Area Question (exact words in quote marks) Views on Superannuation Likert
60. ‘I am confident that if I had the information packs from several different superannuation fund providers, I could assess the pros and cons of each without asking for help’
61. ‘My partner takes care of most financial decision, including superannuation’
62. ‘Most people I know don’t talk about superannuation much’ 63. ‘I think the employer compulsory contribution level should be
increased’64 64. ‘I feel like the rules about superannuation change too much and/or
too often’ 65. ‘Superannuation funds, their fees/charges and the way they work are
not transparent enough’ 66. ‘I have trust in the superannuation industry’
Superannuation: Use of Statements and Fund-Provided Information
67. What proportion of your superannuation fund statement do you read? 68. What sections do you pay attention to? 69. If you don’t read any or all of the periodic statement, why not?
Superannuation: Use of Statements and Fund-Provided Information Likert
70. ‘I find that reading and understanding my periodic statement is easy’ 71. ‘I think I pay sufficient attention to my superannuation account’
Superannuation: Extended Response section
72. Explain up to 5 financial priorities and concerns at this point in your life.
73. What factors are important in choosing a superannuation fund? Did they influence your choice?
74. How, if at all, would you change how superannuation fund providers operate?
75. What do you find difficult about managing your superannuation and planning for retirement?
64 Q63: Increased by a lot/little/stay the same/decreased a little/lot/don’t know.
Superannuation Knowledge, Behaviour and Attitudes in Young Adults in Australia 23
A Methodology in Previous Studies and Creating the Survey Instrument This section comments on methodological issues arising from studies
examined in the literature review. In constructing the survey instrument, we drew upon the full range of studies
reviewed above in formulating both the structure of the questionnaire and the wording of individual questions. Many studies (including several studies closely relevant to this project) were explicitly based on earlier studies, by either evaluating the data collected in an earlier study, or using questions asked in earlier surveys. In particular, the ANZ Survey questions (2005, 2008, 2011) have been used either as a basis for investigation, or as a benchmark against which to assess results gleaned from new studies.65 Other studies have examined the data collected in the ANZ surveys.66 Using the ANZ studies and later interpretations of them as a benchmark allows us to assess the reliability of our own findings, and note possibly significant differences between the general population and young people.
Some studies incorporated self-evaluation of knowledge, with questions relating to how an individual rated his/her understanding of finance/economic matters generally, superannuation specifically, and so on. For example, as Grace, Weaven and Anderson note, consumer knowledge is comprised of subjective knowledge (what the consumer thinks she knows) and objective knowledge (what she actually knows, as measured by a test), and that these different types of knowledge influence people in different ways.67These self-evaluations are then matched against ‘objective’ tests of actual knowledge. Most superannuation studies that included self-assessments noted that respondents tended to overestimate their abilities and knowledge.68 We decided to take a similar approach of ensuring that objective knowledge, behaviour and conduct and self-assessment of abilities and conduct were included in the survey instrument.
We also considered the level of detail of questions and following up a general response with a question requiring more specific information. Agnew et al (2012) noted the importance of asking these specific follow up questions. In that survey, questions relating to access age led to respondents greatly overestimating their knowledge in self-evaluation.69 A central methodology problem that is not often canvassed directly by general financial literacy surveys is measures and
65 See, eg, Gerrans, Clark-Murphy and Truscott, above n 12, 429 (comparing indigenous
responses on superannuation with ANZ 2005 and 2008 survey results). 66 By, for example, Worthington, ‘Knowledge and Perceptions of Superannuation in
Australia’, above n 15; Australian Securities and Investments Commission, ‘Financial Literacy and Behavioural Change’ (Research Report 230, Australian Securities and Investments Commission, March 2011).
67 Grace, Weaven and Anderson, above n 26, 313: ‘…objective knowledge is more likely to influence the amount of information sought, whereas subjective knowledge is closely related to purchase-related behaviours and decision making’.
68 See, eg, Beal and Delpachitra, ‘Community Understanding of Superannuation’, above n 7. 69 Agnew et al, above n 21, 5.

24 CIFR Research Report — Ali, Anderson, Clark, Ramsay and Shekhar
indicators, and what counts as a respondent actually being ‘financially literate’.70 Similarly, what counts as being ‘knowledgeable’ or having a ‘good’ or ‘adequate understanding’ of superannuation may be difficult to accurately define. We used ‘number of correct answers’ to basic questions on objective facts about the superannuation system plus the ‘big three’ financial literacy questions to measure knowledge.71
Worthington has indicated that collecting financial demographics may be important for nuanced analysis. In contrast to earlier studies like Beal and Delpachtira (2003/4, who specified personal income alone), Worthington’s 2005 study paid attention to the financial variables of ‘income, household savings (including superannuation but excluding home values), household mortgage debt and household non-mortgage debt’.72 We collected detailed financial demographics, including of financial product use of respondents and their parents (Q8: a long tick box list of common financial products; Q24), detailed information about various superannuation fund holdings (Q27), and a series of questions on switching superannuation funds, investment options and making voluntary contributions (Q30–Q34).
B Deciding on a Single Online Survey We considered two types of methodology — a telephone survey of
approximately 20 minutes and a long written internet survey instrument managed by an internet survey company specialising in academic and market research.
Telephone surveys were frequently employed by researchers. Some have analysed data relevant to superannuation and retirement planning taken from the ANZ Adult Financial Literacy surveys (national telephone survey, usually with 3,000–4,000 respondents, taken every two years).73 As noted below, online surveys were also common. We decided to use a single written instrument distributed online for a number of reasons. First, the length and detail of a written survey was likely to be superior to a telephone survey: for instance the complex information about the current state of a respondent’s superannuation accounts could be presented in a table to be completed, instead of a lengthy set of questions a telephone operator would have had to run through. Secondly, the risk that precise and technically worded questions may be misunderstood when
70 Angelo Capuano and Ian Ramsay, ‘What Causes Suboptimal Financial Behaviour? An
Exploration of Financial Literacy, Social Influences and Behavioural Economics’ [2011] An Exploration of Financial Literacy, Social Influences and Behavioural Economics (March 23, 2011). U of Melbourne Legal Studies Research Paper 172 <http://www.masters.law.unimelb.edu.au/files/dmfile/FINANCIAL_LITERACY_PROJECT_RESEARCH_REPORT_MARCH_20111.pdf>, citing Huston’s assertion that 90% of the 71 studies she reviewed ‘did not provide an indicator of whether a respondent was financially literate’:; Sandra J Huston, ‘Measuring Financial Literacy’ (2010) 44 Journal of Consumer Affairs 296, 304.
71 On the ‘big three’ see above n 23. 72 Worthington, ‘Coverage, Knowledge and Perceptions of Superannuation in Australia’,
above n 29, 9. 73 Ibid 5.
Superannuation Knowledge, Behaviour and Attitudes in Young Adults in Australia 25
delivered orally is reduced: respondents are able to read and re-read a question before answering, and can easily amend their answers if needed after further consideration. Thirdly, questions were not limited by the number/complexity that could be fitted into a 20 or 25 minute phone conversation: although Pure Profile sets its payments based on estimated time to complete, respondents must complete all questions in the survey in order to receive payment. This also allowed us to ask detailed demographic questions. The length of time required to complete a single phone survey response may have limited our ability to ensure that all respondents answered all questions.74 Fourthly, any risk of operator error in delivering the question or entering responses is removed. Finally, the overall cost of running an n=1000, 75 question survey was far lower than an equivalent telephone survey. Although many respondents only left short responses, some elaborated on their views and attitudes at length, as might be expected from a roundtable discussion. Fifthly, several similar studies on superannuation had used online surveys and there is support for the value of this approach: Ntalianis (2011), who also employed an electronic questionnaire, cites Babbie (2008) as support for the proposition that the online survey approach is ‘regarded as the best method for gathering data from large unobservable populations’.75 Finally, the online survey allowed the inclusion of open-ended questions or listing exercises that might be difficult to conduct over the phone. After considering several options, we elected to use Pure Profile.76
Several similar studies used Pure Profile in some capacity, including: • Bateman et al, ‘An Experimental Survey of Investment Decisions for
Retirement Savings’ (3 July 2010).77 • Bateman et al, ‘Financial Competence and Expectations Formation – Evidence
from Australia’ (13 April 2011).78
74 The ANZ Surveys of Adult Financial Literacy did not ask all respondents all questions
(instead relying on random selection) resulting in responses for some questions: The Social Research Centre, ‘ANZ Survey of Adult Financial Literacy in Australia’, above n 10, 2: ‘For example, many of the questions about financial planners were asked of 33% of eligible respondents. Sample size was sufficiently large to enable this to occur while obtaining statistically robust results.’
75 Michael Ntalianis, ‘Preferred Sources of Financial Information and Communications for Superannuation Decisions’ (2012) 8 International Review of Business Research Papers 55, 58, citing E Babbie, The Basics of Social Research (Thomson Wadsworth, 4th ed, 2008).
76 On internet survey methodology and potential drawbacks, see, eg, MA Revilla and WE Saris, ‘A Comparison of the Quality of Questions in a Face-to-Face and a Web Survey’ (2013) 25 International Journal of Public Opinion Research 242; Katja Lozar Manfreda et al, ‘Web Surveys versus Other Survey Modes: A Meta-Analysis Comparing Response Rates’ (2008) 50 Journal of the Market Research Society 79; Didier Frippiat and Nicolas Marquis, ‘Web Surveys in the Social Sciences: An Overview’ (2010) 65 Population (english edition) 285; Nigel, Lee, Raymond M Fielding and Blank, The SAGE Handbook of Online Research Methods (SAGE, 2008).
77 Hazel Bateman et al, ‘An Experimental Survey of Investment Decisions for Retirement Savings’ (10 July 2010).
78 Bateman et al, ‘Financial Competence and Expectations Formation: Evidence from Australia’, above n 15.

26 CIFR Research Report — Ali, Anderson, Clark, Ramsay and Shekhar
• Agnew, Bateman and Thorp, ‘Superannuation Knowledge and Plan Behaviour’ (2013 – UNSW Australian School of Business Working Paper No 2012ACTL14).79
C Development and Selection of Survey Questions and the Sample The first stage of developing the instrument involved compiling a ‘complete’
list of all possible questions that we might want to ask of respondents if restrictions such as question or time limits or practicalities like respondent fatigue were not factors. This initial list numbered some 300 questions which were then further refined through discussions among the research team and further development and reflection of the hypotheses we sought to test. These were finally reduced to a 75 question instrument which was submitted to Pure Profile for development. We were then able to make various amendments to that draft instrument as Pure Profile’s software capabilities and limitations became clear. While the general thrust of the majority of questions remained the same, the level of detail in responses was improved significantly, in particular through the use of categorised lists of check box options.
Pure Profile’s method of sample selection operates on the basis of invitations to begin a survey, sent via email to Pure Profile members. Membership is open to the public at large and the registration process is completed online and is uncomplicated and quick. Members then fill in demographic information about themselves to allow targeting, although all surveys must contain their own specific demographic questions. Pure Profile has a database of approximately 600,000 members in Australia. The invitation to begin a survey does not disclose anything about the nature of the survey.80 Respondents are ‘screened out’ and removed from the survey if in responding to the three initial screening questions on age, gender and location they do not match the criteria required by the sample at that point. These criteria are not known to the respondent in advance and change based on completed responses: for example a person who enters a year of birth outside the required range is told that they are not eligible to complete the survey, and cannot go back and amend their answer with a false age. Similarly, if the quota for Sydney is already filled, a respondent who reports their location as Sydney will not know in advance that there are no further responses from that location needed. The invitations are sent to a member once only. The survey software automatically detects and removes respondents who appear to not be answering questions in good faith (for example, answering too quickly to have clearly considered a question, selecting options in automated patterns). Pure Profile employees also manually scrub the data to check for bad faith
79 Agnew et al, above n 21. 80 Though an initial screen does provide general information about the survey, with contact
details for both the researchers and The University of Melbourne if respondents wished to raise any ethical concerns. The research team did not receive any contact from respondents.

Superannuation Knowledge, Behaviour and Attitudes in Young Adults in Australia 27
responses.81 Pure Profile’s members are paid for completing surveys (approximately $8 for completing the 20 minute survey).
D General Hypotheses In light of the studies mentioned above, we developed a set of broad
hypotheses. Specific hypotheses based more closely on individual sections and questions are outlined below.
• Knowledge of superannuation will be generally poor, especially in the following groups:82
o Low education (year 12 completed or less) o Females o Non-English speaking backgrounds o Those who have spent less time in the workforce (due to long-
term unemployment, caring responsibilities, work disruptions). • Few respondents will feel prepared for retirement, and no more than a
third will indicate that they feel relatively prepared. • Short term financial goals like accommodation will take clear
precedence over retirement planning. • Many will over-estimate their knowledge of superannuation.83 • Fewer respondents will be able to correctly answer all of the ‘big
three’ questions on financial literacy.84 • Financial literacy ability will improve with longer work experience
and higher income.85 • Respondents who have studied at least one of the study areas relevant
to finance will demonstrate better knowledge of superannuation.86 • Few respondents will correctly state the age at which they can begin to
access their superannuation.87
81 22 responses were removed by Pure Profile after cleaning the data shortly before the study
was completed. 82 Worthington, ‘Knowledge and Perceptions of Superannuation in Australia’, above n 15,
368. 83 Cf Grace, Weaven and Anderson, above n 26; Beal and Delpachitra, ‘Community
Understanding of Superannuation’, above n 7. 84 Agnew, Bateman and Thorp, above n 21, 13. 85 Diana J Beal and Sarath B Delpachitra, ‘Financial Literacy among Australian University
Students’ (2003) 22 Economic Papers 65, 65. 86 Ibid (re university students who have taken at least a first year business related course). 87 Agnew et al, above n 21, 4. One clear difference between this sample and Agnew et al’s is
that the respondents in the latter had different preservation ages based on their year of birth. The preservation age for those born on or after 1 July 1964 is 60 (100% of our sample).

28 CIFR Research Report — Ali, Anderson, Clark, Ramsay and Shekhar
• Many respondents will cite frustration, lack of control and lack of knowledge as factors explaining the difficulty of planning for retirement and superannuation’s place in that plan.88
88 Clark-Murphy, Kristofferson and Gerrans, above n 8, 85ff.

Superannuation Knowledge, Behaviour and Attitudes in Young Adults in Australia 29
IV SURVEY DETAILS, RESULTS AND ANALYSIS
This Part combines both an explanation of the sample, the various topics surveyed, the hypotheses posited and tested, and the results and analysis in each of these areas.
A The Sample The population group we studied comprised Australian young adults aged 25–
34. As Table 1.1 shows, this group numbered just under 3.25 million in the survey year (2013), or about 14.2% of the total population (around 19% of all adults). This group is, of course, engaged highly in work-force participation, so it is likely that it comprises an even higher proportion of the overall labour force.
The survey firm aimed for 1000 respondents, and of this 994 complete and useable responses were suitable for the analysis. As Table 1.2 indicates, the survey under-sampled males (n=422) — while more easily filling the required quota of females (n=572). It was also more difficult to obtain willing respondents in the younger group of those aged 25 to 29 years (n=406), than the older, those aged 30 to 34 (n=588). Finally there was a slight under-sampling of rural and regional respondents (n=295) than their metropolitan (or ‘urban’) counterparts (n=699). In general terms, one in five respondents had a language other than English (‘LOTE’) background, one third are single, one third are married, more than third have dependent children (38%) and 29% have dependent children living with them.
We divided our sample on the basis of these three demographic characteristics (sex, age-group and urban or rural location) into eight distinct groups and weighted the sample so that it matched the breakdown of the adult population. Table 1.3 reports the weights applied to the sample. Table 1.1: Australian Population
Demographic Population Percent Age 25 to 29 1,648,568 7.18 Age 30 to 34 1,608,262 7.00
Table 1.2: Sample Characteristics (Unweighted) Data Respondents Percentage 25–29 years old 406 42.5% 30–35 years old 588 57.5% Male 422 42.5% Female 572 57.5% Urban 699 70.3% Rural 295 29.7% Total 994 100.0%
We then weighted this general sample to move it closer to the general demographics of the Australian population aged 25–34.

30 CIFR Research Report — Ali, Anderson, Clark, Ramsay and Shekhar
Table 1.3: Weighted Factors Demographic Weighting Male Urban Younger 1.47 Male Urban Older 0.79 Male Rural Younger 2.03 Male Rural Older 1.35 Female Urban Younger 1.04 Female Urban Older 0.73 Female Rural Younger 1.03 Female Rural Older 0.74

Superannuation Knowledge, Behaviour and Attitudes in Young Adults in Australia 31
B Key Basic Demographic Results As Pure Profile does not make any of the demographic information about its
members available to its clients directly, all demographic information had to be obtained through questions. Summary characteristics of the weighted sample are reported in the tables below. Being weighted, they thus estimate characteristics of the actual young adult population in Australia. Since we only surveyed 25–34 year olds, we do not venture comparisons with other age groups: a brief comment on the tables below serves only to highlight what might be typical (or possibly surprising) about our target group. A number of these demographic characteristics are tested as possible determinants of superannuation savings levels, as well as knowledge about and attitudes towards superannuation issues.
Table 2.1 shows that our sample, now weighted, is fairly typical of the young adult population in Australia as a whole. The most striking point to note is that while the urban (that is, metropolitan) location is home to 66.4% of all young adults, 76.5% of the degree-holders are also located there. Similarly, while 17.5% of the sample identified as having a LOTE background,89 relatively few of these (just 7.8%) are located in rural and regional areas (Table 2.2). Just under one third of the group are single (again, more likely in the urban locale); just over a third are married (38.3%), and a third have dependent children. Far more of the females (43.4%) than males (33.2%) in this age group are married (reflecting that the spouses of more of the females are in an older segment of the population). And while nearly 40% of females report having dependent children, the corresponding figure for males is just 30.6% (Table 2.3). These facts alert us to the notion that males and females of the same age are typically and actually, part of very different family structures.
Living arrangements also differ between both males and females, but more so between urban and regional respondents and between degree holders and those who reported not progressing in their education beyond year 12 (‘low education’) (Table 2.4). While 42.2% are currently repaying a mortgage, for example, this proportion is far higher for females (almost half) than males (just over a third). Degree-holders, also, are far more likely to be repaying a mortgage than those with low education (the latter far more likely to be renting). High internet access, as well as high smartphone and laptop ownership is characteristic of this age group (Table 2.5). Smartphones (with internet access) are used by nearly 92% of the female cohort.
89 We opted to examine English speaking or LOTE backgrounds rather than ethnicity directly.
One downside is that this meant we did not specifically identify indigenous respondents. Given the wide range of possible ethnic and indigenous identification and the comparatively small numbers in each group that would likely be contained in the sample, we would need to have amalgamated these groupings in order to run statistical tests that might suggest anything meaningful about those groups. We suspected that a strong indicating factor would be whether or not English is primarily spoken in the home, and opted to use that instead of ethic or indigenous identification. On indigenous people and superannuation, see Gerrans, Clark-Murphy and Truscott, above n 12.

32 CIFR Research Report — Ali, Anderson, Clark, Ramsay and Shekhar
Overall, some 60% of respondents reported having a high-interest savings account, 23% partake in share ownership, and nearly three quarters hold a credit card (Table 2.6). Males are twice as likely as females to own shares. Degree-holding is strongly characteristic of our young adult demographic (over 56%), including 16.3% with a higher degree (Table 2.7). Again there is a substantial disparity in degree-holding between urban and regional respondents. While just over 15% of young adults are still studying, a greater proportion (21.6%) are considering a return to study (Table 2.8).
An important aspect of the research project was to test the influence of specific knowledge as a determinant of superannuation behaviour and attitudes, namely, whether secondary or tertiary courses in commerce-related subjects impacted respondents. Table 2.9 presents the basic demographic data on these courses. One in four respondents took business studies in their secondary schooling, while altogether over one-third had studied a commerce-related subject (that is, business studies, accounting, or economics). Males (nearly one in five) were far more likely to have taken economics at secondary school than females (10.8%). Again, significant proportions of the young adult population have studied a commerce related subject at post-secondary level (Table 2.10), such as business (21.8%), accounting (12.1%), economics (10.8%), or finance (8.5%).
Table 2.11 reports income levels: mean income was $51,513 (median $50,000): salary levels were clearly disproportionate between males and females, and between those in urban and regional locales. Partly this is explained by work loads: Table 2.12 indicates males are far more likely to be employed full-time than females. In Table 2.13 we report the proportions in the highest occupational level (across any jobs they have had in their career). Finally, trade union membership in the young adult cohort was quite low — at just one in ten (Table 2.14), almost half the current national average of 17%.90
The following series of tables indicate sample characteristics of the weighted sample, further broken down into Male/Female, Urban/Regional and Degree/Low Education groupings. ‘Region’ includes all respondents who indicated they lived in regional or rural areas. ‘Degree’ indicates a post-secondary qualification: a TAFE, CAE, training college or vocational college certificate, completed apprenticeship, university degree, postgraduate degree or doctoral degree. ‘Low Ed’ covers all respondents who completed Year 12 or less. ‘Hi_Inc’ indicates high income: a current personal yearly income in the top one-third of the sample. ‘Low_Inc’ indicates low income: a current personal yearly income in the bottom one-third of the sample. English indicates that the respondent only speaks English at home, while LOTE indicates that the respondent speaks a non-English language at home.
90 Australian Bureau of Statistics, 6310.0 - Employee Earnings, Benefits and Trade Union
Membership, Australia, August 2013 (4 June 2014) Australian Bureau of Statistics <http://www.abs.gov.au/AUSSTATS/[email protected]/mf/6310.0>.
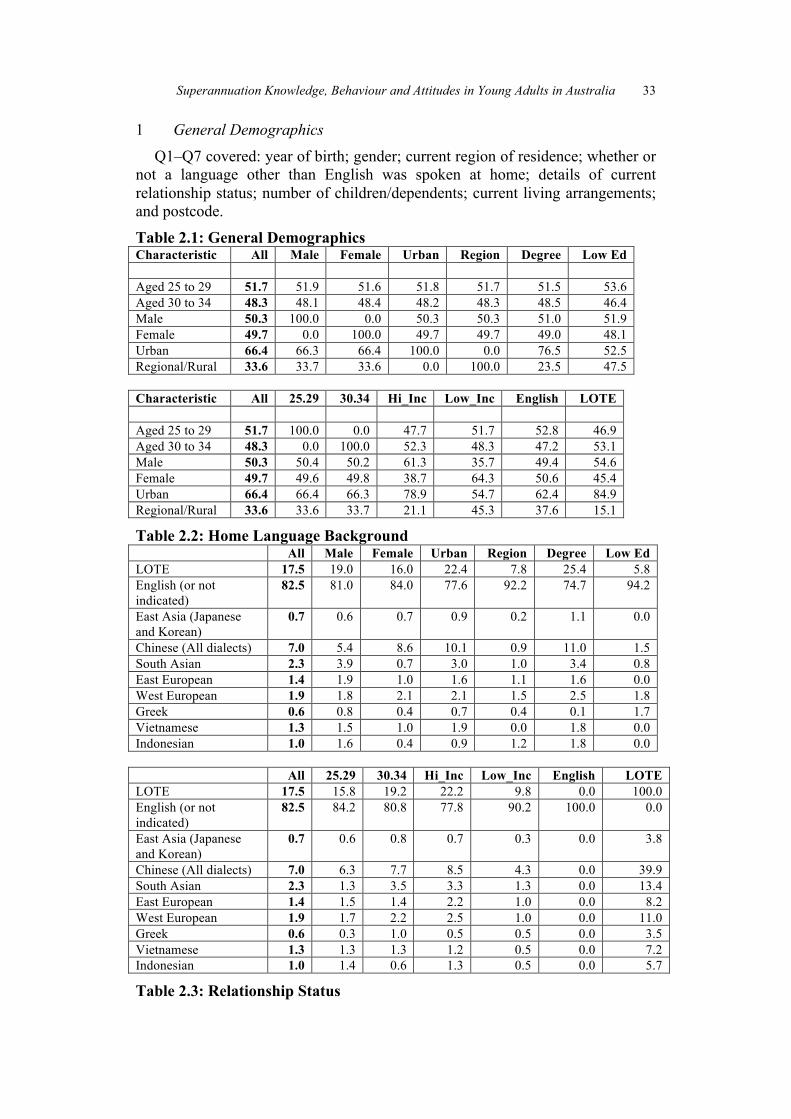
Superannuation Knowledge, Behaviour and Attitudes in Young Adults in Australia 33
1 General Demographics Q1–Q7 covered: year of birth; gender; current region of residence; whether or
not a language other than English was spoken at home; details of current relationship status; number of children/dependents; current living arrangements; and postcode.
Table 2.1: General Demographics Characteristic All Male Female Urban Region Degree Low Ed Aged 25 to 29 51.7 51.9 51.6 51.8 51.7 51.5 53.6 Aged 30 to 34 48.3 48.1 48.4 48.2 48.3 48.5 46.4 Male 50.3 100.0 0.0 50.3 50.3 51.0 51.9 Female 49.7 0.0 100.0 49.7 49.7 49.0 48.1 Urban 66.4 66.3 66.4 100.0 0.0 76.5 52.5 Regional/Rural 33.6 33.7 33.6 0.0 100.0 23.5 47.5
Characteristic All 25.29 30.34 Hi_Inc Low_Inc English LOTE Aged 25 to 29 51.7 100.0 0.0 47.7 51.7 52.8 46.9 Aged 30 to 34 48.3 0.0 100.0 52.3 48.3 47.2 53.1 Male 50.3 50.4 50.2 61.3 35.7 49.4 54.6 Female 49.7 49.6 49.8 38.7 64.3 50.6 45.4 Urban 66.4 66.4 66.3 78.9 54.7 62.4 84.9 Regional/Rural 33.6 33.6 33.7 21.1 45.3 37.6 15.1
Table 2.2: Home Language Background All Male Female Urban Region Degree Low Ed LOTE 17.5 19.0 16.0 22.4 7.8 25.4 5.8 English (or not indicated)
82.5 81.0 84.0 77.6 92.2 74.7 94.2
East Asia (Japanese and Korean)
0.7 0.6 0.7 0.9 0.2 1.1 0.0
Chinese (All dialects) 7.0 5.4 8.6 10.1 0.9 11.0 1.5 South Asian 2.3 3.9 0.7 3.0 1.0 3.4 0.8 East European 1.4 1.9 1.0 1.6 1.1 1.6 0.0 West European 1.9 1.8 2.1 2.1 1.5 2.5 1.8 Greek 0.6 0.8 0.4 0.7 0.4 0.1 1.7 Vietnamese 1.3 1.5 1.0 1.9 0.0 1.8 0.0 Indonesian 1.0 1.6 0.4 0.9 1.2 1.8 0.0 All 25.29 30.34 Hi_Inc Low_Inc English LOTE LOTE 17.5 15.8 19.2 22.2 9.8 0.0 100.0 English (or not indicated)
82.5 84.2 80.8 77.8 90.2 100.0 0.0
East Asia (Japanese and Korean)
0.7 0.6 0.8 0.7 0.3 0.0 3.8
Chinese (All dialects) 7.0 6.3 7.7 8.5 4.3 0.0 39.9 South Asian 2.3 1.3 3.5 3.3 1.3 0.0 13.4 East European 1.4 1.5 1.4 2.2 1.0 0.0 8.2 West European 1.9 1.7 2.2 2.5 1.0 0.0 11.0 Greek 0.6 0.3 1.0 0.5 0.5 0.0 3.5 Vietnamese 1.3 1.3 1.3 1.2 0.5 0.0 7.2 Indonesian 1.0 1.4 0.6 1.3 0.5 0.0 5.7
Table 2.3: Relationship Status

34 CIFR Research Report — Ali, Anderson, Clark, Ramsay and Shekhar
All Male Female Urban Region Degree Low Ed Single 29.1 32.9 25.2 31.6 24.2 31.3 29.6 In Relationship 22.0 23.5 20.4 22.2 21.6 21.7 24.3 Engaged 8.5 7.9 9.1 7.2 11.1 5.6 13.7 Married 38.3 33.2 43.4 36.8 41.3 40.2 30.8 Divorce or Separated 1.7 1.7 1.7 1.9 1.2 0.5 1.5 Have Dependent Children
35.0 30.6 39.4 31.2 42.5 28.6 43.4
Relationship (<12 mths)
3.8 4.4 3.3 3.7 4.0 4.4 3.5
Relationship (12–24 mths)
3.8 4.4 3.2 4.8 2.0 4.4 5.5
Relationship (24–48 mths)
4.7 5.8 3.7 5.0 4.3 5.5 3.2
Relationship (>48 mths)
9.6 8.9 10.2 8.7 11.3 7.4 12.1
All 25.29 30.34 Hi_Inc Low_Inc English LOTE Single 29.1 34.1 23.7 29.9 30.6 28.0 33.9 In Relationship 22.0 25.7 17.9 22.1 18.1 21.9 22.0 Engaged 8.5 9.9 7.1 6.3 8.2 9.3 4.8 Married 38.3 28.4 48.8 40.1 40.9 38.5 37.1 Divorce or Separated 1.7 1.6 1.8 1.2 1.5 1.7 1.7 Have Dependent Children
35.0 25.9 44.7 32.6 47.4 36.1 29.6
Relationship (<12 mths)
3.8 4.7 2.9 5.0 3.3 3.3 6.4
Relationship (12–24 mths)
3.8 4.0 3.7 5.6 1.7 3.8 4.0
Relationship (24–48 mths)
4.7 7.3 2.0 3.1 3.7 4.6 5.4
Relationship (>48 mths)
9.6 9.8 9.3 8.4 9.3 10.3 6.2
Table 2.4: Living Arrangements All Male Female Urban Region Degree Low Ed Living alone 12.7 13.5 11.8 14.0 9.9 15.8 9.8 Living with children/dependents
26.7 21.6 31.9 23.7 32.7 20.0 32.4
Living with sibling(s) 4.1 5.4 2.8 4.6 3.0 5.3 4.9 Living with parent(s) 13.6 16.1 11.1 15.4 10.1 12.9 12.6 Living in a share house / rooming house
9.0 11.6 6.5 9.4 8.3 10.8 8.0
Living with partner 54.7 49.1 60.3 51.1 61.8 52.0 59.6 Not paying rent 8.7 9.4 8.0 9.5 7.1 9.7 6.6 Paying rent / board / lodging
37.7 39.4 35.9 36.4 40.1 34.9 49.1
Renting but looking to buy
13.3 14.5 12.1 12.0 15.9 13.1 13.8
Currently repaying a mortgage
42.2 37.9 46.6 43.1 40.5 43.8 32.7
Home ownership 4.0 3.3 4.8 4.9 2.4 4.1 4.1
All 25.29 30.34 Hi_Inc Low_Inc English LOTE

Superannuation Knowledge, Behaviour and Attitudes in Young Adults in Australia 35
Living alone 12.7 12.7 12.6 16.9 8.6 12.2 14.8 Living with children/dependents
26.7 20.2 33.7 23.2 39.1 28.8 16.9
Living with sibling(s) 4.1 6.1 2.0 5.5 5.4 3.2 8.5 Living with parent(s) 13.6 17.3 9.7 10.9 14.0 11.3 24.5 Living in a share house / rooming house
9.0 12.3 5.6 5.7 9.0 8.7 10.6
Living with partner 54.7 49.3 60.5 53.9 57.3 57.7 40.3 Not paying rent 8.7 9.4 8.0 6.9 11.4 7.3 15.3 Paying rent / board / lodging
37.7 42.2 32.8 27.0 47.7 39.9 27.2
Renting but looking to buy
13.3 12.5 14.2 16.8 10.4 13.0 14.8
Currently repaying a mortgage
42.2 38.8 46.0 50.5 33.3 42.3 41.7
Home ownership 4.0 3.2 5.0 3.7 3.1 3.7 5.7
2 Financial and Communication Product Use Q8 examined use of financial and communications product use, with a column of check boxes for each. Table 2.5: Communication Devices
All Male Female Urban Region Degree Low Ed Home telephone 60.2 62.0 58.3 59.8 60.8 60.6 54.9 Home internet access 86.5 86.3 86.7 86.7 86.0 86.4 84.0 Mobile phone (no internet access)
13.6 15.8 11.4 14.3 12.2 13.6 14.3
Mobile/Smartphone (with internet access)
89.1 86.4 91.9 89.7 87.9 90.9 85.3
Desktop computer 51.2 56.7 45.7 50.0 53.6 48.7 55.1 Laptop computer 85.5 84.9 86.0 85.1 86.1 86.5 80.4 Tablet computer 54.2 54.5 54.0 56.8 49.2 56.9 47.7 All 25.29 30.34 Hi_Inc Low_Inc English LOTE Home telephone 60.2 58.3 62.1 58.1 66.7 58.9 66.2 Home internet access 86.5 84.7 88.4 85.3 87.3 87.0 84.1 Mobile phone (no internet access)
13.6 13.4 13.9 12.5 14.6 13.5 14.2
Mobile/Smartphone (with internet access)
89.1 89.8 88.4 91.0 83.8 89.0 89.7
Desktop computer 51.2 50.6 51.9 47.6 53.3 51.1 52.1 Laptop computer 85.5 86.4 84.5 88.3 85.0 85.2 86.7 Tablet computer 54.2 55.1 53.3 61.2 47.8 54.0 55.2
Table 2.6: Financial Product Use All Male Female Urban Region Degree Low Ed High Interest Savings 60.8 62.7 59.0 63.2 56.2 67.1 48.8

36 CIFR Research Report — Ali, Anderson, Clark, Ramsay and Shekhar
Account Term deposit 14.3 16.4 12.1 16.3 10.2 18.2 10.1 Shares 23.0 30.2 15.7 26.2 16.7 28.6 12.7 Investment fund 6.3 8.8 3.9 8.1 2.9 8.0 4.6 Bonds 1.5 2.0 1.1 1.9 0.8 2.1 1.5 Business loan 2.0 3.3 0.8 2.1 1.9 2.5 1.3 Investment loan 9.1 10.4 7.9 10.6 6.2 11.7 3.7 Personal loan (car, motorbike, truck)
21.4 21.0 21.8 18.7 26.7 16.5 26.4
Personal loan (renovations)
2.4 2.5 2.2 2.4 2.3 1.7 4.1
Personal loan (travel) 2.3 2.8 1.8 2.1 2.6 2.7 3.4 Personal loan (other) 5.2 5.9 4.5 3.8 7.9 3.4 10.9 Payday loan / cash advance
2.4 2.1 2.7 2.4 2.3 2.4 3.2
Credit card 72.7 74.0 71.4 74.9 68.4 77.7 61.9
All 25.29 30.34 Hi_Inc Low_Inc English LOTE High Interest Savings Account
60.8 62.3 59.3 67.3 54.2 59.9 65.4
Term deposit 14.3 13.8 14.8 21.0 8.0 12.2 24.0 Shares 23.0 20.0 26.2 32.6 14.8 21.4 30.8 Investment fund 6.3 5.1 7.6 9.6 3.0 5.5 10.3 Bonds 1.5 1.5 1.6 2.5 1.4 1.6 1.3 Business loan 2.0 1.8 2.3 3.6 1.6 1.7 3.9 Investment loan 9.1 7.7 10.6 14.9 4.1 7.9 14.8 Personal loan (for car, motorbike, truck)
21.4 22.0 20.7 22.7 19.9 22.7 15.0
Personal loan (renovations)
2.4 2.4 2.4 2.9 1.5 2.4 2.4
Personal loan (travel) 2.3 2.3 2.3 2.9 1.9 2.1 3.1 Personal loan (other) 5.2 5.3 5.1 7.2 4.3 5.4 4.0 Payday loan / cash advance
2.4 2.7 2.0 1.8 3.0 2.1 3.8
Credit card 72.7 70.9 74.7 85.5 57.5 71.3 79.7

Superannuation Knowledge, Behaviour and Attitudes in Young Adults in Australia 37
3 Education Q9–Q11 examined education. This section allowed respondents to
comprehensively record their educational history, including year 12 schooling (and type of school attended) and particular certificates or degrees obtained at postsecondary institutions. Many respondents only filled in the highest level of education obtained (as is common in many surveys) and the research team has limited our analysis to highest level of education achieved. Q10 allowed respondents to indicate their current study commitments, and whether they intended to return to study.
As expected, the sample size for specific types of degrees was too small to support any arguments based on statistical significance. The gaps in responses from many respondents filling in only the highest level of education achieved would have required assumptions about earlier degrees that the research team was not in a position to make. However, as Pure Profile’s software allowed specifications to be easily included, the team decided to retain these questions. Areas of education that are often thought to correlate with successful financial planning, such as the study of subjects related to mathematics, business and economics, were specifically asked about in Q11. Q11 divided into categories of study at secondary and tertiary levels. Respondents who did not select any boxes were required to tick a box affirming that they had not studied any of the areas listed.
Table 2.7: Educational Attainment All Male Female Urban Region Degree Low Ed Year 12 or less 18.0 18.6 17.4 14.3 25.4 0.0 100.0 Post Secondary Training / TAFE
25.7 24.3 27.1 20.9 35.3 0.0 0.0
Undergraduate Degree 40.0 42.7 37.2 45.3 29.4 71.0 0.0 Postgraduate Degree 16.3 14.4 18.2 19.6 9.9 29.0 0.0 Degree Holder 56.3 57.1 55.4 64.8 39.3 100.0 0.0 All 25.29 30.34 Hi_Inc Low_Inc English LOTE Year 12 or less 18.0 18.7 17.3 10.0 24.7 20.6 5.9 Post Secondary (VET) Training
25.7 25.4 26.1 16.5 34.7 28.5 12.5
Undergraduate Degree 40.0 41.1 38.7 50.0 31.7 37.4 52.2 Postgraduate Degree 16.3 14.9 17.8 23.5 8.9 13.5 29.4 Degree Holder 56.3 56.0 56.5 73.5 40.6 50.9 81.6
Table 2.8: Current Study Arrangements
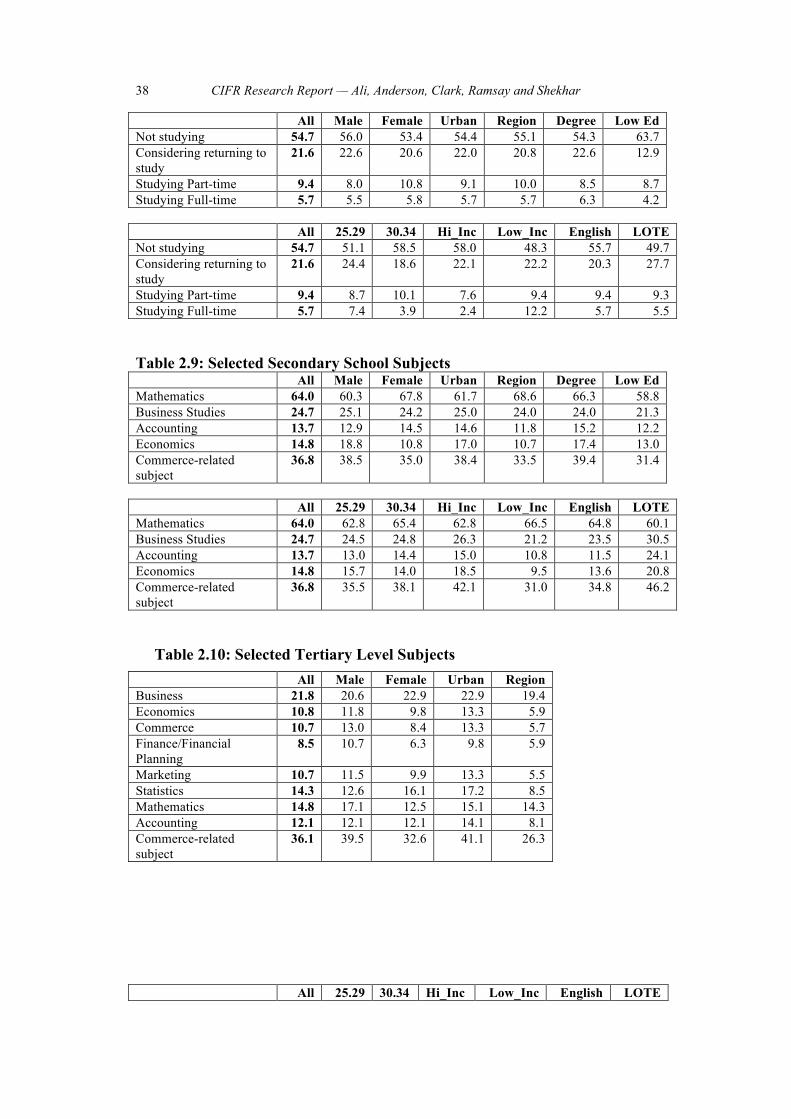
38 CIFR Research Report — Ali, Anderson, Clark, Ramsay and Shekhar
All Male Female Urban Region Degree Low Ed Not studying 54.7 56.0 53.4 54.4 55.1 54.3 63.7 Considering returning to study
21.6 22.6 20.6 22.0 20.8 22.6 12.9
Studying Part-time 9.4 8.0 10.8 9.1 10.0 8.5 8.7 Studying Full-time 5.7 5.5 5.8 5.7 5.7 6.3 4.2 All 25.29 30.34 Hi_Inc Low_Inc English LOTE Not studying 54.7 51.1 58.5 58.0 48.3 55.7 49.7 Considering returning to study
21.6 24.4 18.6 22.1 22.2 20.3 27.7
Studying Part-time 9.4 8.7 10.1 7.6 9.4 9.4 9.3 Studying Full-time 5.7 7.4 3.9 2.4 12.2 5.7 5.5
Table 2.9: Selected Secondary School Subjects All Male Female Urban Region Degree Low Ed Mathematics 64.0 60.3 67.8 61.7 68.6 66.3 58.8 Business Studies 24.7 25.1 24.2 25.0 24.0 24.0 21.3 Accounting 13.7 12.9 14.5 14.6 11.8 15.2 12.2 Economics 14.8 18.8 10.8 17.0 10.7 17.4 13.0 Commerce-related subject
36.8 38.5 35.0 38.4 33.5 39.4 31.4
All 25.29 30.34 Hi_Inc Low_Inc English LOTE Mathematics 64.0 62.8 65.4 62.8 66.5 64.8 60.1 Business Studies 24.7 24.5 24.8 26.3 21.2 23.5 30.5 Accounting 13.7 13.0 14.4 15.0 10.8 11.5 24.1 Economics 14.8 15.7 14.0 18.5 9.5 13.6 20.8 Commerce-related subject
36.8 35.5 38.1 42.1 31.0 34.8 46.2
Table 2.10: Selected Tertiary Level Subjects
All Male Female Urban Region Business 21.8 20.6 22.9 22.9 19.4 Economics 10.8 11.8 9.8 13.3 5.9 Commerce 10.7 13.0 8.4 13.3 5.7 Finance/Financial Planning
8.5 10.7 6.3 9.8 5.9
Marketing 10.7 11.5 9.9 13.3 5.5 Statistics 14.3 12.6 16.1 17.2 8.5 Mathematics 14.8 17.1 12.5 15.1 14.3 Accounting 12.1 12.1 12.1 14.1 8.1 Commerce-related subject
36.1 39.5 32.6 41.1 26.3
All 25.29 30.34 Hi_Inc Low_Inc English LOTE

Superannuation Knowledge, Behaviour and Attitudes in Young Adults in Australia 39
Business 21.8 19.4 24.3 25.8 17.3 20.5 28.0 Economics 10.8 10.3 11.5 16.5 6.8 9.8 15.6 Commerce 10.7 10.9 10.6 17.0 5.4 8.4 21.7 Finance/Financial Planning
8.5 10.1 6.8 10.7 6.1 7.3 14.5
Marketing 10.7 10.5 11.0 15.0 7.1 9.4 16.9 Statistics 14.3 15.5 13.0 18.4 14.5 13.5 18.1 Mathematics 14.8 15.6 14.0 19.6 12.5 13.9 19.1 Accounting 12.1 10.3 14.1 15.0 8.6 9.9 22.7 Commerce-related subject
36.1 33.1 39.4 45.5 25.7 31.8 56.3
4 Income and Employment Q12–Q16 examined income and employment. Respondents provided their
current yearly net personal income and whether they were currently full-time/part-time/casually employed or unemployed. Respondents could also indicate if they were looking for work, looking for an additional job/more hours, looking to change jobs/industries, and indicate other commitments such as volunteering, caring for a child, or caring for an ill/elderly relative. This section also included questions covering work history. Respondents were asked to describe the occupations and industries they have worked in, with enough space to give ten different occupation/industry combinations. These responses were then coded into managerial, professional, white collar, blue collar, unemployed, retired, or engaged in home duties. Respondents were also able to check boxes on work history that applied to them, including whether they generally had work, when they began working (and whether they worked while studying), and interruptions to their working lives (returning to study, caring for children/ill or elderly relative), and whether they planned to return to work or not. A general statement about changing jobs/industries several times and having significant breaks in employment due to, for example, unemployment or travel could also be selected.

40 CIFR Research Report — Ali, Anderson, Clark, Ramsay and Shekhar
Table 2.11: Income All Male Female Urban Region Degree Low Ed Current yearly net personal income (mean)
51,513 60,111 42,676 54,333 46,007 57,238 48,954
Current yearly net personal income (median)
50,000 52,000 43,420 50,000 42,000 55,000 40,000
0–19,999 14.5 7.9 21.2 12.4 18.7 10.3 21.0 20,000–39,999 16.6 15.2 18.0 14.1 21.6 12.6 21.0 40,000–59,999 30.4 31.9 28.9 28.4 34.2 28.3 35.6 60,000–79,999 20.2 23.1 17.1 23.1 14.4 25.1 9.6 80,000+ 12.9 17.1 8.6 16.2 6.3 18.0 8.7 All 25.29 30.34 Hi_Inc Low_Inc English LOTE Current yearly net personal income (mean)
51,513 50,167 52,959 85,706 17,506 49,738 59,946
Current yearly net personal income (median)
50,000 47,000 50,000 70,087 20,000 48,000 54,865
0–19,999 14.5 14.0 15.0 0.0 49.3 16.0 7.4 20,000–39,999 16.6 17.6 15.5 0.0 50.7 18.0 9.9 40,000–59,999 30.4 32.5 28.1 0.0 0.0 29.4 34.9 60,000–79,999 20.2 20.2 20.1 61.0 0.0 18.5 27.8 80,000+ 12.9 10.3 15.7 39.0 0.0 12.6 14.0
Table 2.12: Occupational Level All Male Female Urban Region Degree Low Ed Managerial 3.1 3.1 3.1 4.1 1.2 2.9 2.9 Professional 38.2 36.6 39.7 41.9 30.9 53.9 14.0 White Collar 33.2 28.2 38.2 34.2 31.1 28.4 34.3 Blue Collar 24.2 29.8 18.5 18.4 35.6 13.2 47.8 All 25.29 30.34 Hi_Inc Low_Inc English LOTE Managerial 3.1 3.6 2.5 4.4 2.1 3.4 1.6 Professional 38.2 38.0 38.4 49.8 29.2 36.4 46.4 White Collar 33.2 33.7 32.6 28.4 35.8 33.3 32.6 Blue Collar 24.2 23.9 24.5 16.7 31.6 25.6 17.6

Superannuation Knowledge, Behaviour and Attitudes in Young Adults in Australia 41
Table 2.13: Current Employment Status All Male Female Urban Region Degree Low Ed Full-time employed 65.4 76.5 54.2 70.4 55.4 75.8 50.8 Part-time employed 12.6 8.1 17.2 10.7 16.5 9.1 16.3 Casually employed 8.9 7.7 10.0 7.5 11.6 7.1 10.1 Unemployed 13.1 7.7 18.6 11.4 16.5 8.0 22.7 Not looking for work 18.3 19.4 17.2 19.1 16.8 18.2 18.5 All 25.29 30.34 Hi_Inc Low_Inc English LOTE Full-time employed 65.4 65.7 65.0 91.5 17.2 62.4 79.5 Part-time employed 12.6 12.7 12.5 4.0 26.8 13.3 9.2 Casually employed 8.9 8.1 9.7 3.1 20.5 9.7 4.8 Unemployed 13.1 13.5 12.8 1.4 35.5 14.5 6.5 Not looking for work 18.3 19.1 17.5 19.5 15.5 18.6 17.1
Table 2.14: Trade Union Membership All Male Female Urban Region Degree Low Ed Trade union member 9.9 12.3 7.4 7.2 15.1 9.8 9.2
All 25.29 30.34 Hi_Inc Low_Inc English LOTE Trade union member 9.9 9.7 10.0 14.1 5.6 10.2 8.1
5 Partners and Parents The survey also collected extensive data on the work history, employment
details and education of partners and parents. Q17–Q19 related to a partner’s current employment and work history (and should be read in conjunction with Q61: Likert ‘My partner takes care of most financial decisions, including superannuation’). These questions assist in establishing correlations between industries/income and superannuation knowledge and planning.
Q20–Q25 collected information on parents. This section required respondents to use multiple-tick options to describe each parent’s work history (including periods of interruption, career change, unemployment and care responsibilities); industries and occupations, current work/relationship situation, education and use of various financial products.91 Other studies on retirement planning indicate that parents’ income, education and profession are linked to their children’s financial literacy and understanding of retirement planning.92 We do not present the data gathered on partners and parents characteristics here in tables, given the complexity of the information gathered. Rather this data was used to run regressions against a number of hypotheses. These hypotheses and the results are examined in Part IV(D) on superannuation knowledge.
91 Where a parent is deceased, respondents could indicate that and answer as at time of death. 92 See, eg, Cathy Foulcon Bowen, ‘Financial Knowledge of Teens and Their Parents’ (2002)
13 Financial Counseling and Planning 93.

42 CIFR Research Report — Ali, Anderson, Clark, Ramsay and Shekhar
C Basic Superannuation Account Details This section examines responses to questions on basic superannuation account
details. It includes age of first joining a superannuation fund, detailed superannuation information covering funds, estimated balance, and the certainty of the estimate (‘quite certain’; ‘estimate’; ‘guess’). Q26 on the age of first joining a superannuation fund allows us to establish how long each respondent has been a superannuation consumer. This section also covers the number of times a respondent has switched superannuation funds and which investment options are currently used. Q32–Q34 cover voluntary contributions: how many times has the respondent made a voluntary contribution (with options for never, and ‘did not know you could make voluntary contributions’ also selectable); estimated total amount, and factors affecting the decision to contribute/not contribute.
1 Current Superannuation Balance, Across All Accounts What determines how much money individuals invest in superannuation?
Even though we have a good sample size, it was evident there was a huge variation of reported total superannuation balance: in general this renders mean-scores difficult to interpret (as well as interfering with statistical inferences). The mean-score amount of $40,271 is highly affected by extreme amounts at the higher end of superannuation fund holdings. Subsequently we focus on medians and trimmed means (a mean with 10% of amounts on both ends of the spectrum excluded). The trimmed mean is $22,509, the average of the ‘middle eighty percent’ of the sample, and more realistically attuned to the median (Table 3.1).
• The median superannuation balance was $20,000 ($22,000 for males, $18,000 for females).
• Nearly one quarter (24%) of males had under $10,000. • Nearly one third (32.4%) of females had under $10,000. • Five (relatively mature) years of earning makes a difference: The
median for 25–29 year olds was $15,132, for 30–34 year olds it was $25,000.
• Degree holders are far better off (median $23,000) than those who had not progressed beyond secondary school (median $14,000).
Regression analysis presents a more nuanced view of what determines superannuation funds. This regression is reported in full in Appendix Table 1, while the standardized coefficients of statistically significant explanatories are listed in Table 3.3.
While the characteristic of being female was a clear and frequent explanatory for a number of the attitudinal items, it does not, in itself, explain the relatively lower levels of superannuation accumulation. Rather, attention needs to be focussed on characteristics associated with the life-work cycle for women (part-time and casual work pattern; breaks in employment most probably due to child-bearing, and so forth). In fact while the median accumulation for men and

Superannuation Knowledge, Behaviour and Attitudes in Young Adults in Australia 43
women without dependents is the same ($20,000), the trimmed mean for women is slightly higher than that of their male counterparts.
Factoring out the obvious (and positive) determinants of age and income (and wealth), the greatest influence upon superannuation accumulation is the presence of ‘significant career breaks in employment’. This is closely followed by propensity for casual and part-time work, the fact of having dependent children, and by being ‘generally unemployed’: all of these characteristics negatively impact superannuation levels. The LOTE characteristic is also important, and negative.
While the standardized coefficients help rank the impact on average superannuation levels in a population, the final column (actual coefficients), may be read as the magnitude of impact upon individual superannuation levels (after factoring in all other characteristics). Since the dependent variable is in this case ‘total superannuation funds’ — and is expressed in dollars — the final column estimates the dollar amount difference contributed by the characteristic. (This is not exactly the case for ‘net personal income’ or age which are both measured in different units). So as a rough estimate, the addition of each year of age contributes $1,276 to superannuation accumulation, while each dollar of extra income boosts superannuation by 7.7 cents. But, on average, the cost of a ‘significant career break in employment’ is estimated at $7,189, casual employment status deducts $8,160 from a superannuation fund, and being ‘generally unemployed’ deducts $10,459.
As expected, superannuation balances increased with age (Table 3.1). Most respondents demonstrated significant uncertainty about their current balance figures: only 17.1% indicated they were ‘quite certain’, 43.2% ‘estimated’ their balances and 39.7% ‘guessed’ their balances. 63% have never switched superannuation funds.93 Most have never made a voluntary payment (only 17.4% have). While we expected that those who do would generally be high income earners, that was only indicative and not statistically significant.94 We expected that higher levels of education would lead to lower superannuation balances, on the basis that respondents who had spent more time in tertiary education would spend less time in the workforce. The results are nuanced. Those in the 25–29 age group did not show much difference in superannuation levels when divided into degree holders and non-degree holders. There was, however, an overall difference in superannuation balances between degree and low education groups in the 30–34 age bracket. Based on our regressions, the presence of a degree is not an important factor, but rather income levels, age, assets are the main positive impact drivers (Appendix Table 1). Table 3.1 Current superannuation balance, across all accounts
93 The Social Research Centre, ‘ANZ Survey of Adult Financial Literacy in Australia’, above
n 10, 68 (ANZ 2011 Result: 43% have chosen a superannuation fund, 57% have never chosen a superannuation fund.).
94 Ibid 73 (ANZ 2011 Result: on voluntary payments: do (35%); do not (64%); unsure (1%). Aged 18–44 (24%), those with household income of >$100,000 (41%); those with personal income of >$100,000 (50%)).

44 CIFR Research Report — Ali, Anderson, Clark, Ramsay and Shekhar
All Male Female Urban Region Degree LowEd Mean 40,271 55,611 * 24,594 37,504 45,946 53,407 * 23,142 Median 20,000 22,000 18,000 20,000 17,000 23,000 14,000
Trimmed Mean 22,509 23,949 * 21,153 22,700 22,119 23,585 * 20,407
All 25.29 30.34 Hi_Inc Low_Inc English LOTE Mean 40,271 31,160 49,903 56,059 ** 17,191 42,131 31,507 Median 20,000 15,132 25,000 30,000 10,000 20,000 20,000
Trimmed Mean 22,509 19,585 ** 25,811 27,845 ** 15,257 22,570 22,252
Note: statistically significant differences calculated using t-tests (reporting unequal variance test). One asterisk (*) indicates significant at the 0.05 level; two asterisks (**) significant at the 0.01 level. (No tests between medians)
Table 3.2 Current superannuation balance, across all accounts (Grouped) All Male Female Urban Region Degree LowEd <999 10.7 10.7 10.7 9.2 13.8 6.9 18.1 1,000–9,999 17.4 13.3 21.7 15.5 21.4 13.2 23.8 1,0000–19,999 17.1 15.9 18.3 17.8 15.7 17.2 15.1 20,000–29,999 17.4 18.2 16.5 18.8 14.4 21.0 13.1 30,000–39,999 11.6 11.9 11.4 12.1 10.7 11.1 11.8 40,000–49,999 7.3 7.5 7.1 7.5 6.9 8.1 7.4 >50,000 18.5 22.5 14.3 19.1 17.2 22.5 10.7 All 25.29 30.34 Hi_Inc Low_Inc English LOTE <999 10.7 12.3 9.0 6.0 14.7 12.1 4.2 1,000–9,999 17.4 19.2 15.6 7.0 34.8 18.0 14.8 1,0000–19,999 17.1 21.9 12.0 13.4 17.3 16.4 20.3 20,000–29,999 17.4 19.4 15.3 18.0 14.8 16.7 20.4 30,000–39,999 11.6 10.2 13.2 14.2 8.7 11.2 13.6 40,000–49,999 7.3 5.1 9.6 10.1 2.4 6.8 9.6 >50,000 18.5 12.0 25.3 31.4 7.4 18.7 17.2
Table 3.3 Leading influences on Superannuation Accumulation (After factoring out Age and Income Effects) Characteristic Beta Sign Have had significant career breaks in employment -0.1747 Negative Generally casually employed -0.1554 Negative Generally part-time work -0.1468 Negative Generally unemployed -0.0910 Negative Have dependent children -0.0856 Negative Studied commerce subjects at school/university +0.0754 Positive Language other than English -0.0704 Negative

Superannuation Knowledge, Behaviour and Attitudes in Young Adults in Australia 45
2 Age of Joining First Fund On average, respondents reported that they were 18.8 years of age when they
joined their first superannuation fund. The joining age appears to be lowering over time: (age 19.5 for first joining for those aged 30–34 — but just 18.2 years of age for younger respondents aged 25–29). LOTE respondents tended to join nearly three years later than those from an English speaking background (Table 4.1).
Regression analysis (Appendix Table 2) confirms that those in the younger age group tended to join earlier than their counterparts in the older age group. Degree-holders (as would be wholly expected) and those who began work after their tertiary education also tended to join a fund later. LOTE respondents were also late joiners. While those who described their work history as ‘generally unemployed’ also tended to join a superannuation fund later, those respondents who had experienced ‘significant career changes in jobs or industries’ tended to join earlier. However those respondents who have experienced ‘significant career breaks in employment’ tended to join a superannuation fund later. But how much later? Again the coefficients column in the regression output may (for most characteristics) be read in years. So, the characteristic of being a degree holder normally extends 0.702 of a year (approximately 8 months), plus another 0.839 of a year (approximately 10 months) if they tended to start work after completion of their tertiary qualification (as opposed to working throughout tertiary study). The characteristic of having a LOTE background adds 2.4 years (29 months) before finally joining a fund, while ‘being generally unemployed’ retards the beginning of superannuation accumulation by 1.8 years (22 months). Table 4.1 At What Age Did You Join Your First Superannuation Fund? All Male Female Urban Region Degree LowEd Age 18.8 19.0 18.6 19.0 ** 18.4 19.4 ** 17.6 All 25.29 30.34 Hi_Inc Low_Inc English LOTE Age 18.8 18.2 ** 19.5 19.0 18.7 18.3 ** 21.1

46 CIFR Research Report — Ali, Anderson, Clark, Ramsay and Shekhar
3 Self-Managed Superannuation Funds Very few of our respondents volunteered that they had a self-managed
superannuation fund (SMSF). Only 4% of respondents indicated they had an SMSF. As of the 2013 financial year, there were 509,362 SMSFs in Australia, compared against a total of 30.7 million superannuation accounts (1.65% of all accounts).95 SMSFs are the single largest type of fund in the superannuation industry, with 31.3% of total assets, and are generally popular with retirees with large accounts (due to taxation and estate planning benefits).96
We present the breakdown across leading demographics in Table 5.1 but caution that it is extrapolated from a low sample size. Given the prominence of SMSFs in the superannuation industry we had hoped to test this data and investigate the characteristics of young SMSF holders. Unfortunately, the data is not reliable. That is partly due to the very small sample size, but also due to wide variances in reported amounts: the mean accumulation was $187,114 but the median was $5000.
Table 5.1 Respondents with an SMSF All Male Female Urban Region Degree LowEd SMSF 4.06 3.97 4.15 4.39 3.41 3.52 6.38 All 25.29 30.34 Hi_Inc Low_Inc English LOTE SMSF 4.06 3.96 4.17 2.02 ** 6.05 3.85 5.06
95 Australian Prudential Regulation Authority, ‘Annual Superannuation Bulletin 2013 (revised
5 February 2014)’, above n 5, 6. We acknowledge that SMSFs are not precisely equivalent to individual superannuation accounts, and that up to five people may be part of an SMSF before it ceases to be classified as one. However, we could not find precise current figures on how many people in Australia had SMSFs beyond the general figure of how many of these funds exist. The broad description of their use is that only a handful of people in Australia have an SMSF, and they tend to be very wealthy and retired and therefore in the drawing stage of superannuation management.
96 Deloitte Actuaries and Consultants, above n 3, 6.

Superannuation Knowledge, Behaviour and Attitudes in Young Adults in Australia 47
4 Switching Funds To avoid any misunderstanding, switching funds was explicitly defined in the
survey instrument in the question text: ‘“Switching” means closing an account with a superannuation fund and transferring the balance to one or more other accounts with another superannuation fund’.97
The majority of respondents (63.2%) have never switched superannuation funds (Table 6.1). Of those who reported that they had switched funds, the average was 2.1 times; those from LOTE backgrounds tended to switch less than those from English-speaking backgrounds (Table 6.2). Those who have had several career changes tend to have switched funds more often (and this taking into account age and other characteristics — see Appendix Table 3a). But, as reported, many tend not to switch funds at all. Factoring in age, other characteristics that tend to influence not switching funds are males, urban location, low education, and low income (Appendix Table 3b). Table 6.1 How Many Times Have You Switched Superannuation funds? (Whole sample)
No of Times Frequency Percent 0 605 63.2 1 153 15.9 2 91 9.5 3 61 6.3 4 28 3.0 5 12 1.2 6 5 0.5 7 3 0.4
Table 6.2 How Many Times Have You Switched Superannuation funds? All Male Female Urban Region Degree LowEd No. of times 2.1 2.0 2.1 2.1 2.1 2.0 2.1 All 25.29 30.34 Hi_Inc Low_Inc English LOTE No. of times 2.1 1.9 * 2.2 2.1 2.1 2.2 ** 1.7
Note: statistically significant differences calculated using t-tests (reporting unequal variance test). One asterisk (*) indicates significant at the 0.05 level; two asterisks (**) significant at the 0.01 level.
97 The industry term is ‘roll-over’. We used switching because we thought respondents might
not be familiar with the term ‘roll-over’ and those who had in fact rolled over funds might mistakenly think that this did not apply to them.

48 CIFR Research Report — Ali, Anderson, Clark, Ramsay and Shekhar
5 Investment Options What is the investment structure of respondents’ superannuation funds? About
one third could not answer this question. Among females, this rises to nearly 44%. Among the low educated group, more than half (51%) did not know. However, just under a third nominated the default option. Males, degree-holders, high income earners and LOTE respondents tended to score high in proportions nominating the growth option (Table 7.1). The logistic regression reported in Appendix Table 4 confirms that degree-holders, males (that is, negative for females), and those with financial assets tend to favour the growth option for their superannuation funds. Those respondents who studied commerce-related subjects at secondary or tertiary level or a finance subject at tertiary level also tended to favour the growth option. Table 7.1 Which Investment Options do you Currently Use with Your Superannuation Fund(s)? All Male Female Urban Region Degree LowEd Default 30.7 33.1 28.3 31.9 28.3 32.8 * 23.6 Growth 19.8 25.3 ** 14.1 22.1 ** 15.2 25.3 ** 14.1 Balanced 14.4 16.4 12.5 15.3 12.7 16.6 ** 7.6 Conservative 3.4 3.8 3.0 3.6 2.9 2.8 3.9 Cash only 2.3 2.8 1.9 2.7 1.6 2.1 3.7 Other: 2.1 3.0 * 1.1 1.9 2.4 3.0 0.8 Don’t know / Can’t say
34.5 25.4 ** 43.7 31.0 ** 41.4 24.9 ** 51.4
All 25.29 30.34 Hi_Inc Low_Inc English LOTE Default 30.7 33.1 28.1 31.9 33.3 31.2 28.5 Growth 19.8 17.9 21.8 26.3 ** 11.1 18.0 *
* 28.2
Balanced 14.4 11.5 ** 17.6 20.1 ** 8.0 12.9 **
21.7
Conservative 3.4 4.0 2.7 2.8 2.9 2.9 5.4 Cash only 2.3 1.1 ** 3.7 2.1 2.2 1.9 * 4.6 Other: 2.1 2.5 1.6 3.1 1.6 1.9 2.9 Don’t know / Can’t say
34.5 37.2 31.6 22.8 ** 43.7 36.3 **
25.9
Note: statistically significant differences calculated using chi-square tests. One asterisk (*) indicates significant at the 0.05 level; two asterisks (**) significant at the 0.01 level

Superannuation Knowledge, Behaviour and Attitudes in Young Adults in Australia 49
6 Voluntary Contributions This section lays out the basic statistics on voluntary contributions. A later
section analyses these results in terms of what they indicate about superannuation behaviour. Nearly two-thirds of respondents (62.6%) have never made a voluntary contribution to their superannuation fund. While nearly one in five do make voluntary contributions overall, among the lower educated group this proportion plummets to just one in eight (Table 8.1). Of those respondents who do voluntarily contribute, 13.7% of total contributions to their superannuation fund are voluntary contributions (median however is just 8.8%). However as these amounts reflect calculations of estimates from memory — and considering that the sample size (n=160) is on the low side — no firm conclusions ought be drawn from these figures (Table 8.2).
Table 8.1 Voluntary Contribution to Superannuation funds All Male Female Urban Region Degree LowEd Have made one or more VCs
17.4 18.2 16.5 17.3 17.5 21.2 ** 9.9
VC regularly 19.2 19.8 18.6 19.9 17.9 22.9 ** 12.1 Have never made VC
62.6 57.6 ** 67.6 60.9 65.9 59.6 * 69.0
Did not know VC were possible
5.4 7.5 ** 3.3 5.8 4.7 5.2 6.7
Don’t know if VC has been made
15.4 17.6 13.1 16.8 12.6 14.9 15.1
Estimated percentage of balance made up of VCs98
13.7 15.9 11.1 14.3 12.6 14.7 * 9.4
All 25.29 30.34 Hi_Inc Low_Inc English LOTE Have made one or more VCs
17.4 13.1 ** 22.0 21.2 15.1 17.9 15.0
VC regularly 19.2 15.3 ** 23.4 22.3 18.0 19.2 19.4 Have never made VC
62.6 67.9 ** 56.9 60.7 65.4 63.0 60.7
Did not know VC were possible
5.4 7.4 ** 3.2 6.7 6.1 4.7 * 8.6
Don’t know if VC has been made
15.4 12.6 * 18.4 12.3 14.2 14.7 18.7
Estimated percentage of balance made up of VCs
13.7 12.3 14.8 16.9 14.0 13.9 12.9
Note: statistically significant differences calculated using chi-square tests. One asterisk (*) indicates significant at the 0.05 level; two asterisks (**) significant at the 0.01 level
Table 8.2 Percentage of contributions to Superannuation funds that are voluntary
98 If and only if a respondent had a balance in their voluntary amount, this amount was divided
by their total superannuation funds and expressed as a percentage.

50 CIFR Research Report — Ali, Anderson, Clark, Ramsay and Shekhar
All Male Female Urban Region Degree LowEd Mean 13.7 15.9 11.1 14.3 12.6 14.7 * 9.4 Median 8.8 9.9 8.0 10.0 6.8 9.3 7.2 All 25.29 30.34 Hi_Inc Low_Inc English LOTE Mean 13.7 12.3 14.8 16.9 14.0 13.9 12.9 Median 8.8 8.3 9.7 10.0 10.0 8.4 9.8 Note: statistically significant differences calculated using chi-square tests. One asterisk (*) indicates significant at the 0.05 level; two asterisks (**) significant at the 0.01 level. (No tests between medians). Caution: relatively low sample sizes (n=160)

Superannuation Knowledge, Behaviour and Attitudes in Young Adults in Australia 51
D Knowledge: Objective Knowledge of the Superannuation Scheme This section included two ‘objective knowledge’ components. The first
component tested superannuation knowledge and comprised six multiple choice questions responding to statements about superannuation (Q35–Q40). The second tested financial literacy and comprised the ‘big three’ questions on financial literacy, which relate to basic principles of simple interest, inflation and risk diversification (Q41–Q43). These questions have been shown to be reliable indicators of basic financial literacy skills.99
The research team elected not to ask several very basic questions about superannuation contained in earlier studies on the basis that the correct response rate to those questions was often quite high. For example, in Agnew, Bateman and Thorp’s 2012 study of 628 superannuation fund members, 87% of respondents correctly answered that employer contributions were mandatory, but only two in three of that number were able to identify the correct rate.100 Consequently, the question on mandatory contributions required respondents to indicate the rate rather than just whether or not such a rate existed (though options for ‘employers are not required to make contributions’ and ‘don’t know/can’t say’ were available).
Each question also allowed respondents to indicate ‘don’t know / can’t say’, and the instructions directed respondents to use this option if it applied to them. We also formulated responses as multiple choice where possible, to reduce the likelihood that respondents might guess the correct answer.
Hypotheses about knowledge
• Knowledge scores will increase with age.
• Regional respondents will have lower superannuation knowledge scores.
• Respondents who are involved in co-habiting long term relationships, engaged or married will have higher knowledge scores.
• Respondents who are either renting but looking to buy, currently repaying a mortgage, or own their own home will have higher knowledge scores.
• Respondents living in inner urban areas will have higher knowledge scores.
• Respondents with investments will have higher knowledge scores.
• Respondents who had studied subjects listed in Q11 will have higher knowledge scores.
99 On the ‘big three’ see above n 23. 100 Agnew et al, above n 21.
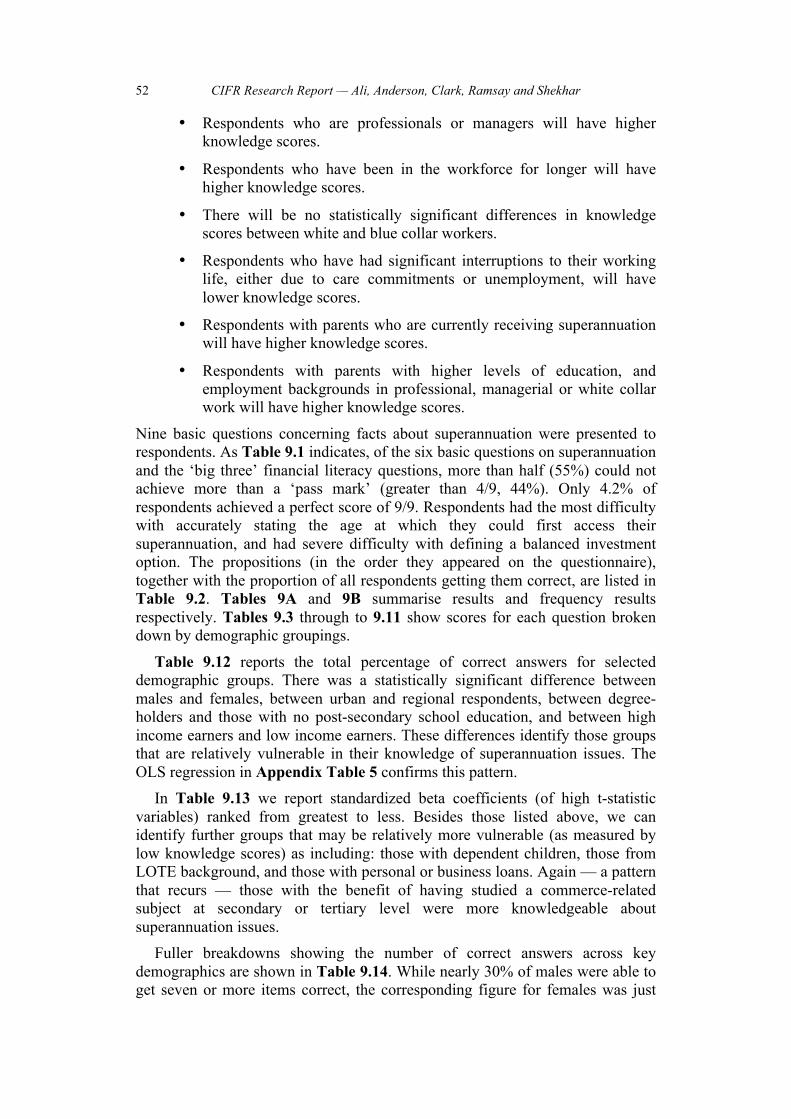
52 CIFR Research Report — Ali, Anderson, Clark, Ramsay and Shekhar
• Respondents who are professionals or managers will have higher knowledge scores.
• Respondents who have been in the workforce for longer will have higher knowledge scores.
• There will be no statistically significant differences in knowledge scores between white and blue collar workers.
• Respondents who have had significant interruptions to their working life, either due to care commitments or unemployment, will have lower knowledge scores.
• Respondents with parents who are currently receiving superannuation will have higher knowledge scores.
• Respondents with parents with higher levels of education, and employment backgrounds in professional, managerial or white collar work will have higher knowledge scores.
Nine basic questions concerning facts about superannuation were presented to respondents. As Table 9.1 indicates, of the six basic questions on superannuation and the ‘big three’ financial literacy questions, more than half (55%) could not achieve more than a ‘pass mark’ (greater than 4/9, 44%). Only 4.2% of respondents achieved a perfect score of 9/9. Respondents had the most difficulty with accurately stating the age at which they could first access their superannuation, and had severe difficulty with defining a balanced investment option. The propositions (in the order they appeared on the questionnaire), together with the proportion of all respondents getting them correct, are listed in Table 9.2. Tables 9A and 9B summarise results and frequency results respectively. Tables 9.3 through to 9.11 show scores for each question broken down by demographic groupings.
Table 9.12 reports the total percentage of correct answers for selected demographic groups. There was a statistically significant difference between males and females, between urban and regional respondents, between degree-holders and those with no post-secondary school education, and between high income earners and low income earners. These differences identify those groups that are relatively vulnerable in their knowledge of superannuation issues. The OLS regression in Appendix Table 5 confirms this pattern.
In Table 9.13 we report standardized beta coefficients (of high t-statistic variables) ranked from greatest to less. Besides those listed above, we can identify further groups that may be relatively more vulnerable (as measured by low knowledge scores) as including: those with dependent children, those from LOTE background, and those with personal or business loans. Again — a pattern that recurs — those with the benefit of having studied a commerce-related subject at secondary or tertiary level were more knowledgeable about superannuation issues.
Fuller breakdowns showing the number of correct answers across key demographics are shown in Table 9.14. While nearly 30% of males were able to get seven or more items correct, the corresponding figure for females was just

Superannuation Knowledge, Behaviour and Attitudes in Young Adults in Australia 53
under 20%. The proportion getting three or less correct was high for females (46.8%), those in rural and regional areas (almost half of all respondents), and those in the lower income groups (nearly 52%).
Table 9.1 Responses to factual questions on superannuation: Number of correct answers (out of 9) Number correct percent zero 7.3 1 9.6 2 13.4 3 13.1 4 11.8 5 9.7 6 11.2 7 9.7 8 10.0 9 4.2
Table 9.2 Responses to factual questions on superannuation Proposition Percent
correct Q35 If you have superannuation you cannot receive the aged pension. 46.0 Q36 In general, is superannuation taxed at a lower, higher or same rate as other similar investments
39.3
Q37 Current minimum employer contribution rate for superannuation, as a percentage of salary
43.7
Q38 A Balanced investment option is invested in safe assets 30.0 Q39 At what age can you begin to access your superannuation - Years of age
37.2
Q40 The best indicator of superannuation fund performance is: 43.4 Q41 If you had $100 in a savings account, and the interest rate was 2% per year, then how much money would you have after 5 years
77.5
Q42 If the interest rate on your savings account was 1% per year, but inflation was 2% per year, after one year, would you be able to buy
59.7
Q43 Buying shares in a single company is a less risky investment than putting money into a share investment fund
47.6
While we expected that both knowledge of and positive attitudes towards superannuation might increase with age, the results did not support those conclusions. Table 9.12 and Appendix Table 5 show that knowledge scores were independent of age. There was also no evidence that the youngest band of respondents (25–26) have poorer knowledge scores.
Regional respondents scored lower on knowledge and positive self-assessment of knowledge, but this can be explained by other characteristics: see Table 9.12 and Appendix Table 5, and Table 14.8 and Appendix Table 6.
Respondents who were involved in long term co-habiting relationships, engaged or married were more likely to show a better knowledge of superannuation. While respondents who were currently repaying a mortgage showed a significant and positive relation with better superannuation knowledge, there was no evidence that those who were renting and looking to buy or who owned their own home had superior knowledge of superannuation than those

54 CIFR Research Report — Ali, Anderson, Clark, Ramsay and Shekhar
who were living with parents or renting. Our expectation that financial product use would have some significance for better superannuation knowledge was borne out. Those we classified as holding ‘assets’ (bonds, shares) and/or credit cards had better knowledge of superannuation (Table 9.13). It was clear that respondents who had studied one or more subjects listed in Q11 were much more likely to show better knowledge of superannuation (Table 9.13).
We had hypothesised that respondents who were professionals or managers were likely to show better knowledge. That was true, but regressions showed that this was not due to occupational status but rather factors like being a degree holder, being male and having assets. While regressions showed that the occupation of ‘manager’ was significant and positive for better attitudes, the sample size for managers was very low (n=31). As noted above, respondents who have been in the workforce for longer had better superannuation knowledge. Interestingly, and contrary to our hypotheses, there was no evidence that respondents with significant breaks in their working life, either due to care commitments or unemployment, had lower levels of superannuation knowledge (see Appendix Table 5 and Appendix Table 6).
Respondents with partners working in professional, managerial or white collar occupations showed better knowledge of superannuation.
Both hypotheses on the impact of having parents currently drawing on superannuation payments and education or work backgrounds turned out to be unsupportable. There was no evidence that respondents with parents receiving superannuation, or parents with higher education levels, professional, managerial or white collar occupation backgrounds showed higher levels of superannuation knowledge.
When compared with responses in studies of the general population, our sample of young adults was much less well informed. Q36 on the rate of taxation of superannuation returned a much lower score (39.3%) than the ANZ Adult Financial Literacy result (59%),101 and Q40 on best indicators of fund performance likewise saw a much lower score of 43.4% compared with 66% in the ANZ study.102 In both of these instances, young people scored approximately 20% worse than the general population surveyed in the ANZ study. In Agnew, Bateman and Thorp’s (2013) study, 67% of respondents identified the (then) correct rate of 9% for the required minimum employee contribution rate, 4% of respondent selected the future minimum rate of 12%, and 29% either chose an incorrect rate, did not know a rate existed, or did not identify a specific percentage.103 As Table 9.5a and Table 9.5b show, our results were much worse: only 17.5% could identify the now correct rate of 9.25%. Even counting the old rate of 9% as a ‘correct’ answer as well (as we did), the percentage of
101 The Social Research Centre, ‘ANZ Survey of Adult Financial Literacy in Australia’, above
n 10, 64 (ANZ 2011 Result: Lower (59%); Higher (3%); Same (11%); Unsure (27%).). 102 Ibid 67 (ANZ 2011 Result: return after fees/taxes (66%); return (10%); per unit cost (3%);
fees (2%); can’t say (19%).). 103 Agnew et al, above n 21, 4.

Superannuation Knowledge, Behaviour and Attitudes in Young Adults in Australia 55
‘correct’ only rises to 43.7%. It is understandable to expect that far fewer people would correctly choose 9.25%, given that the 9% rate had been fixed since 2002, and the increase to 9.25% only occurred on 1 July 2013.104 Nonetheless, given that for most respondents the 9% rate has been set for either most of or the entirety of their working lives, that only 43.7% could name the figure is a startling and very poor result, and is almost 25% lower than Agnew, Bateman and Thorp’s result. Contrary to Cull and Whitton (2011), who found that superannuation knowledge of students increased with age,105 we found no significant improvements in knowledge in older respondents.
104 Australian Prudential Regulation Authority, ‘A Recent History of Superannuation in
Australia’, above n 1, 4. 105 Cull and Whitton, above n 18, 111 (but noting that it dropped to extremely low levels in
students over 56).

56 CIFR Research Report — Ali, Anderson, Clark, Ramsay and Shekhar
Table 9A Basic: Data on Superannuation Knowledge Percentage correct All Male Female Urban Region Degree LowEd Q35: Superannuation and the Age Pension
46.0 46.8 45.2 48.0 42.1 51.3 ** 39.1
Q36: Taxation of Super
39.3 44.3 ** 34.2 43.9 ** 30.2 50.2 ** 24.3
Q37: Current Employer Rate
43.7 43.7 43.8 45.9 39.5 49.0 ** 28.6
Q38: Balanced Option
30.0 36.6 ** 23.2 33.1 ** 23.8 38.4 ** 18.7
Q39: Age of Access 60
29.7 29.5 29.8 30.7 27.6 30.8 26.1
Q40: Age of access (Response: 60 or 65)
37.2 36.7 37.8 38.7 34.4 40.4 * 30.9
Q40: Performance indicator
43.4 46.1 40.8 45.7 * 39.0 51.6 ** 28.6
Q41: FL1 Basic interest
77.5 79.6 75.4 78.8 74.9 79.9 75.0
Q41: FL2 Inflation
59.7 67.2 ** 52.1 63.2 ** 52.8 70.1 ** 43.8
Q42: FL3 Risk 47.6 53.5 ** 41.6 50.4 * 42.0 57.4 ** 35.0 Knowledge Score 47.2 50.5 ** 43.8 49.7 ** 42.1 54.2 ** 36.0
All 25.29 30.34 Hi_Inc Low_Inc English LOTE Q35: Superannuation and the Age Pension
46.0 49.3 * 42.5 48.7 41.8 47.9 **
37.1
Q36: Taxation of Super
39.3 38.0 40.7 49.2 ** 29.1 39.4 38.8
Q37: Current Employer Rate
43.7 42.8 44.7 49.1 ** 32.8 41.5 **
54.2
Q38: Balanced Option
30.0 28.7 31.3 37.0 ** 18.7 29.2 33.5
Q39: Age of Access 60
29.7 29.1 30.3 36.1 ** 25.0 31.0 * 23.4
Q39: Age of access (Response: 60 or 65)
37.2 37.2 37.3 44.3 ** 31.7 37.7 35.0
Q40: Performance indicator
43.4 40.3 * 46.8 48.3 ** 38.0 44.0 40.6
Q41: FL1 Basic interest
77.5 78.4 76.5 79.6 75.5 77.3 78.5
Q41: FL2 Inflation
59.7 58.7 60.9 65.5 ** 53.1 57.9 * 68.3
Q42: FL3 Risk 47.6 45.2 50.1 57.6 ** 39.2 46.5 52.5 Knowledge Score 47.2 46.5 47.9 53.3 ** 40.0 46.8 48.7
Note: statistically significant differences calculated using chi-square tests. One asterisk (*) indicates significant at the 0.05 level; two asterisks (**) significant at the 0.01 level.
Table 9B: Q35–Q43 Responses: Highlight indicates correct response

Superannuation Knowledge, Behaviour and Attitudes in Young Adults in Australia 57
Value Label % selecting Q35: Superannuation and Age Pension True 12.5 False 46.0 Don’t know/can’t say 41.4 Q36: Taxation of Superannuation Lower 39.3 Higher 5.8 Same rate 10.8 It is not taxed 6.2 Don’t know/can’t say 37.9 Q37: Current Employer Rate Indicated a percentage figure 62.4 9.00% 26.2 Employers must contribute 6.7 9.25% 17.5 Employers are not obligated to contribute 2.5 9.00% or 9.25% 43.7 Don’t know/can’t say 28.4 Incorrect figure 18.7 Q38: Meaning of ‘Balanced’ Option True 20.4 False 30.0 Don’t know/can’t say 49.6 Q39: Age of Access Answered 51.0 60 29.5 Whenever you decide 15.4 65 7.7 Don’t know/can’t say 33.6 Incorrect figure 13.8 Q40: Performance Indicator High overall returns 19.2 Low overall fees 9.9 Returns minus fees and charges 43.4 Don’t know/can’t say 27.4 Q41: FL1 Basic Interest More than $102 77.5 Exactly $102 5.4 Less than $102 3.7 Don’t know/can’t say 13.4 Q42: FL2 Inflation More than today 5.8 Exactly the same as today 7.2 Less than today 59.7 Don’t know/can’t say 27.3 Q43: FL3 Risk True 7.7 False 47.6 Don’t know/can’t say 44.7

58 CIFR Research Report — Ali, Anderson, Clark, Ramsay and Shekhar
1 Superannuation Knowledge The following tables indicate the percentage of respondents who correctly
answered this question. The correct answer follows the question.
Table 9.3: Q35: ‘If you have superannuation you cannot receive the aged pension’: False. All Male Female Urban Region Degree LowEd Correct (%) 46.0 46.8 45.2 48.0 42.1 51.3 ** 39.1 All 25.29 30.34 Hi_Inc Low_Inc English LOTE Correct (%) 46.0 49.3 * 42.5 48.7 41.8 47.9 ** 37.1
Note: statistically significant differences calculated using chi-square tests. One asterisk (*) indicates significant at the 0.05 level; two asterisks (**) significant at the 0.01 level.
Table 9.4: Q36: ‘In general, is superannuation taxed at a lower, higher or same rate as other similar investments’: lower. All Male Female Urban Region Degree LowEd Correct (%) 39.3 44.3 ** 34.2 43.9 ** 30.2 50.2 ** 24.3 Correct (%) All 25.29 30.34 Hi_Inc Low_Inc English LOTE 39.3 38.0 40.7 49.2 ** 29.1 39.4 38.8
Note: statistically significant differences calculated using chi-square tests. One asterisk (*) indicates significant at the 0.05 level; two asterisks (**) significant at the 0.01 level.
Table 9.5a: Q37: ‘Current minimum employer contribution rate for superannuation, as a percentage of salary’: 9% or 9.25%106 All Male Female Urban Region Degree LowEd Correct (%) 43.7 43.7 43.8 45.9 39.5 49.0 ** 28.6 Correct (%) All 25.29 30.34 Hi_Inc Low_Inc English LOTE 43.7 42.8 44.7 49.1 ** 32.8 41.5 ** 54.2
Note: statistically significant differences calculated using chi-square tests. One asterisk (*) indicates significant at the 0.05 level; two asterisks (**) significant at the 0.01 level.
Table 9.5b: Q37: ‘Current minimum employer contribution rate for superannuation, as a percentage of salary’: responses by value Value Label Value % 1.00 .1 2.00 .1 3.00 .3
106 We accepted 9% or 9.25% as correct answers, because the increase only occurred very
recently. 260 respondents (26.2%) selected 9.00%, while 174 (17.5%) selected 9.25%. 44 respondents opted for 9.50%. 283 respondents (28.4%) selected ‘do not know’.

Superannuation Knowledge, Behaviour and Attitudes in Young Adults in Australia 59
4.25 .1 5.00 .5 7.00 1.6 7.50 .3 8.00 1.1 8.25 .1 8.50 .2 9.00 26.2 9.10 .2 9.15 .1 9.25 17.5 9.30 .1 9.40 .1 9.50 4.5 9.70 .1 9.90 .1 10.00 2.1 11.00 1.3 12.00 2.9 12.50 .3 13.00 .3 14.00 .1 15.00 .7 16.00 .1 17.00 .4 18.00 .1 18.50 .1 20.00 .2 25.00 .1 30.00 .3 33.00 .1 No minimum 6.7 Not obliged 2.5 Do not know 28.4 Totals 100.0
Table 9.6: Q38: ‘A balanced investment option is exclusively in safe assets’: false. All Male Female Urban Region Degree LowEd Correct (%) 30.0 36.6 ** 23.2 33.1 ** 23.8 38.4 *
* 18.7
Correct (%) All 25.29 30.34 Hi_Inc Low_Inc English LOTE 30.0 28.7 31.3 37.0 ** 18.7 29.2 33.5

60 CIFR Research Report — Ali, Anderson, Clark, Ramsay and Shekhar
Note: statistically significant differences calculated using chi-square tests. One asterisk (*) indicates significant at the 0.05 level; two asterisks (**) significant at the 0.01 level.
Table 9.7a: Q39: ‘At what age can you begin to access your superannuation’: (Answer: 60) All Male Female Urban Region Degree LowEd Correct (%) 29.7 29.5 29.8 30.7 27.6 30.8 26.1 Correct (%) All 25.29 30.34 Hi_Inc Low_Inc English LOTE 29.7 29.1 30.3 36.1 ** 25.0 31.0 * 23.4
Note: statistically significant differences calculated using chi-square tests. One asterisk (*) indicates significant at the 0.05 level; two asterisks (**) significant at the 0.01 level.
Table 9.7b: Q39: ‘At what age can you begin to access your superannuation’: (Responding: 60 or 65) All Male Female Urban Region Degree LowEd Correct (%) 37.2 36.7 37.8 38.7 34.4 40.4 * 30.9 Correct (%) All 25.29 30.34 Hi_Inc Low_Inc English LOTE 37.2 37.2 37.3 44.3 ** 31.7 37.7 35.0
Note: statistically significant differences calculated using chi-square tests. One asterisk (*) indicates significant at the 0.05 level; two asterisks (**) significant at the 0.01 level.
Table 9.8: Q40: ‘The best indicator of superannuation fund performance is’: returns minus fees and charges All Male Female Urban Region Degree LowEd Correct (%) 43.4 46.1 40.8 45.7 * 39.0 51.6 ** 28.6 Correct (%) All 25.29 30.34 Hi_Inc Low_Inc English LOTE 43.4 40.3 * 46.8 48.3 ** 38.0 44.0 40.6
Note: statistically significant differences calculated using chi-square tests. One asterisk (*) indicates significant at the 0.05 level; two asterisks (**) significant at the 0.01 level.
2 Basic Financial Literacy Respondents generally performed well on the first two questions and
relatively poorly on the final question on risk and diversification. Table 9.9: Q41: ‘If you had $100 in a savings account, and the interest rate was 2% per year, then how much money would you have after 5 years?’: more than $102. All Male Female Urban Region Degree LowEd Correct (%) 77.5 79.6 75.4 78.8 74.9 79.9 75.0 Correct (%) All 25.29 30.34 Hi_Inc Low_Inc English LOTE

Superannuation Knowledge, Behaviour and Attitudes in Young Adults in Australia 61
77.5 78.4 76.5 79.6 75.5 77.3 78.5
Note: statistically significant differences calculated using chi-square tests. One asterisk (*) indicates significant at the 0.05 level; two asterisks (**) significant at the 0.01 level.
Table 9.10: Q42: ‘If the interest rate on your savings account was 1% per year, but inflation was 2% per year, after one year, would you be able to buy’: less than today. All Male Female Urban Region Degree LowEd Correct (%) 59.7 67.2 ** 52.1 63.2 ** 52.8 70.1 ** 43.8 Correct (%) All 25.29 30.34 Hi_Inc Low_Inc English LOTE 59.7 58.7 60.9 65.5 ** 53.1 57.9 * 68.3
Note: statistically significant differences calculated using chi-square tests. One asterisk (*) indicates significant at the 0.05 level; two asterisks (**) significant at the 0.01 level.
Table 9.11: Q43: ‘Buying shares in a single company is a less risky investment than putting money into a share investment fund’: false. All Male Female Urban Region Degree LowEd Correct (%) 47.6 53.5 ** 41.6 50.4 * 42.0 57.4 ** 35.0 Correct (%) All 25.29 30.34 Hi_Inc Low_Inc English LOTE 47.6 45.2 50.1 57.6 ** 39.2 46.5 52.5
Note: statistically significant differences calculated using chi-square tests. One asterisk (*) indicates significant at the 0.05 level; two asterisks (**) significant at the 0.01 level.
3 Knowledge Scores Table 9.12 Knowledge Score (Between zero and 100) All Male Female Urban Region Degree LowEd Correct (%) 47.2 50.5 ** 43.8 49.7 ** 42.1 54.2 ** 36.0 Correct (%) All 25.29 30.34 Hi_Inc Low_Inc English LOTE 47.2 46.5 47.9 53.3 ** 40.0 46.8 48.7
Note: statistically significant differences calculated using chi-square tests. One asterisk (*) indicates significant at the 0.05 level; two asterisks (**) significant at the 0.01 level.
Table 9.13 Leading determinants of superannuation knowledge (Standardized beta coefficients for all characteristics with statistically significant t-statistics). Characteristic Beta Sign Studied commerce subjects at school/university +0.2297 Positive Degree Holder +0.2003 Positive
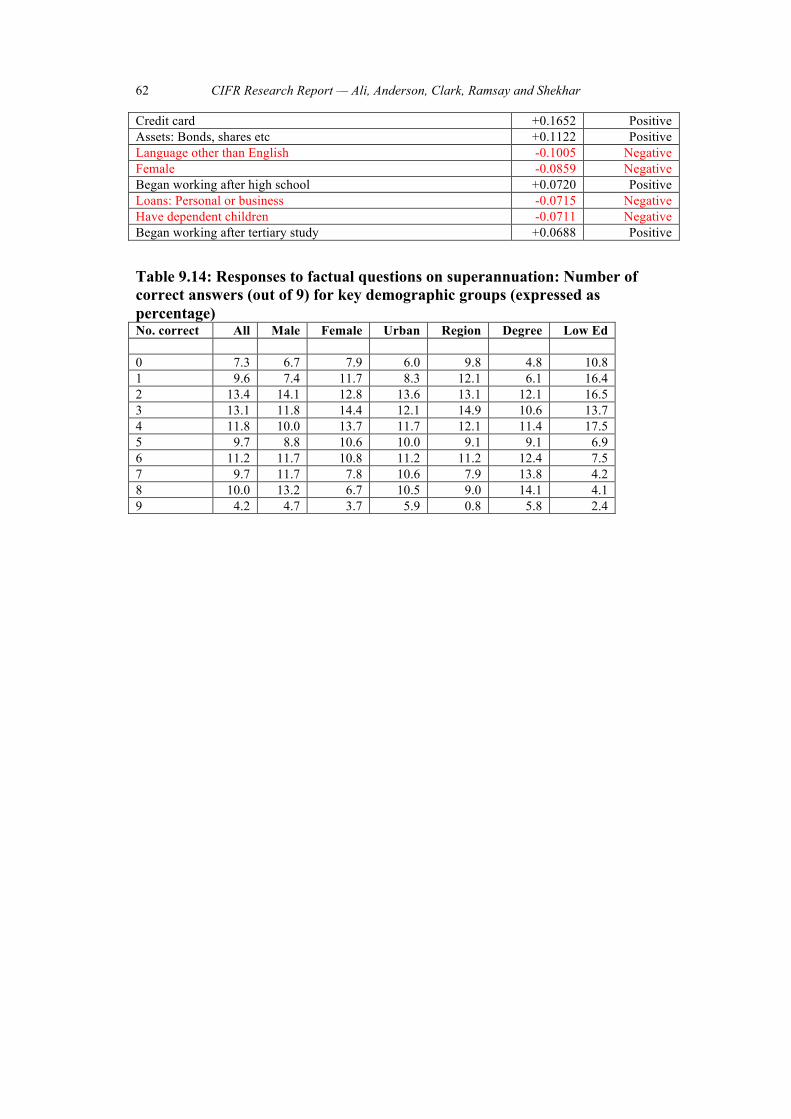
62 CIFR Research Report — Ali, Anderson, Clark, Ramsay and Shekhar
Credit card +0.1652 Positive Assets: Bonds, shares etc +0.1122 Positive Language other than English -0.1005 Negative Female -0.0859 Negative Began working after high school +0.0720 Positive Loans: Personal or business -0.0715 Negative Have dependent children -0.0711 Negative Began working after tertiary study +0.0688 Positive Table 9.14: Responses to factual questions on superannuation: Number of correct answers (out of 9) for key demographic groups (expressed as percentage) No. correct All Male Female Urban Region Degree Low Ed 0 7.3 6.7 7.9 6.0 9.8 4.8 10.8 1 9.6 7.4 11.7 8.3 12.1 6.1 16.4 2 13.4 14.1 12.8 13.6 13.1 12.1 16.5 3 13.1 11.8 14.4 12.1 14.9 10.6 13.7 4 11.8 10.0 13.7 11.7 12.1 11.4 17.5 5 9.7 8.8 10.6 10.0 9.1 9.1 6.9 6 11.2 11.7 10.8 11.2 11.2 12.4 7.5 7 9.7 11.7 7.8 10.6 7.9 13.8 4.2 8 10.0 13.2 6.7 10.5 9.0 14.1 4.1 9 4.2 4.7 3.7 5.9 0.8 5.8 2.4
Superannuation Knowledge, Behaviour and Attitudes in Young Adults in Australia 63
E Behaviour: Superannuation Account Usage, Voluntary Contributions, Monitoring, Retirement Planning
This section presents results on respondents’ superannuation behaviour. Within the survey instrument, questions relevant to superannuation fund behaviour were spread throughout the questionnaire. Basic usage was examined in Q30–34 (switching funds, investment options, voluntary contributions) and account interaction was examined in Q57–58 (monitoring and changes to investment options) and Q67–69 (periodic statements). Our hypotheses on behaviour included:
• Respondents who are involved in co-habiting long term relationships, engaged or married are more likely to have planned for retirement, and are more likely to have made voluntary contributions.
• Respondents who have children are more likely to have planned for retirement.
• Respondents with multiple devices capable of accessing the internet are likely to monitor their superannuation more frequently, will change fund options more often, and will have greater certainty about their estimated fund balance.
• Very few respondents will have made any retirement plan at all.107
Our findings indicate that respondents who are involved in co-habiting long term relationships, engaged or married were not significantly more likely to have planned for retirement (approximately p=0.0725). They were no more likely to have made voluntary contributions to their superannuation funds. Contrary to our expectations, respondents with children were no more likely to have planned for retirement: Appendix Table 7. Respondents with financial products, specifically those who hold assets, were more likely to have planned for retirement (Table 13.3).
107 The Social Research Centre, ‘ANZ Survey of Adult Financial Literacy in Australia’, above
n 10(ANZ 2011 Results: on retirement planning: identified a figure (26%); have not identified a figure (73%); can’t say (1%).).

64 CIFR Research Report — Ali, Anderson, Clark, Ramsay and Shekhar
1 Account Interaction: Monitoring, Changing and Fund Statements This section comprised three questions on monitoring superannuation balance
and changing investment options (Q57–Q58) and five questions on how respondents interact with fund-provided statements and information, and their attitudes towards that information. Qs 67–69 dealt with what proportion of a statement is read by the respondent, the sections to which the respondent pays the most attention, and, if applicable, reasons why a respondent does not read the entire statement.
Respondents check their superannuation account infrequently (a quarter ‘hardly ever’ or never), a fifth only when they receive their statement (Table 10.1). Four in five hardly ever (or never) reconsider making changes to their superannuation fund investment options (Table 10.2). We hypothesised that respondents with multiple devices capable of accessing the internet were more likely to monitor their superannuation more frequently, would change investment options more often, and would have greater certainty about their estimated fund balance. The evidence did not support any of these hypotheses, and there was some evidence that respondents with smartphones or home internet access tended to make changes ‘hardly ever’ or ‘never’, and smartphone users were less likely to be certain of fund balances.
Table 10.1: Q57: How often do you check your superannuation account? All Male Female Urban Region Degree LowEd When receive statement
21.4 18.2 * 24.7 20.1 24.0 18.4 ** 28.3
Daily or Weekly 4.9 6.0 3.8 5.5 3.8 6.8 3.0 Monthly to six monthly
39.6 45.6 ** 33.5 40.0 38.7 43.9 ** 29.4
Yearly 9.8 8.9 10.7 10.4 8.5 11.5 6.6 Hardly ever or never
24.3 21.4 * 27.3 24.0 25.0 19.3 ** 32.7
All 25.29 30.34 Hi_Inc Low_Inc English LOTE When receive statement
21.4 21.3 21.5 18.4 * 25.8 23.1 ** 13.3
Daily or Weekly 4.9 4.8 5.1 6.9 * 3.3 3.9 ** 9.7 Monthly to six monthly
39.6 38.4 40.8 47.4 ** 29.3 39.0 42.2
Yearly 9.8 8.7 10.9 10.8 8.9 10.0 8.7 Hardly ever or never
24.3 26.8 21.7 16.5 ** 32.8 23.9 26.2
Note: statistically significant differences calculated using chi-square tests. One asterisk (*) indicates significant at the 0.05 level; two asterisks (**) significant at the 0.01 level.
Table 10.2: Q58: How often do you make changes to your
superannuation fund investment options? All Male Female Urban Region Degree LowEd When receive statement
3.5 4.4 2.7 3.5 3.6 2.7 4.6

Superannuation Knowledge, Behaviour and Attitudes in Young Adults in Australia 65
Daily or Weekly 1.7 2.5 0.9 1.6 1.9 1.9 2.4 Monthly to six monthly
9.3 13.1 ** 5.5 11.0 * 6.1 12.7 * 5.9
Yearly 6.4 6.3 6.4 6.5 6.0 7.7 5.7 Hardly ever or never
79.1 73.8 ** 84.4 77.4 82.4 75.1 81.5
All 25.29 30.34 Hi_Inc Low_Inc English LOTE When receive statement
3.5 2.9 4.2 4.4 3.2 3.8 2.5
Daily or Weekly 1.7 1.9 1.5 2.1 1.2 1.1 ** 4.4 Monthly to six monthly
9.3 10.0 8.6 14.1 ** 4.8 8.4 * 13.8
Yearly 6.4 5.3 7.5 7.6 4.2 6.1 7.7 Hardly ever or never
79.1 79.9 78.2 71.8 ** 86.6 80.6 ** 71.7
Note: statistically significant differences calculated using chi-square tests. One asterisk (*) indicates significant at the 0.05 level; two asterisks (**) significant at the 0.01 level.
A good proportion (nearly a third) of respondents read all or most of their periodic superannuation fund statement (Table 11.1), with the greater majority paying attention to the balance (91%) and to the fees and charges (72.1%) (Table 11.2). The overwhelming majority of booklets or guides often accompanying the statement are not read. A little over a third of all respondents agree that ‘reading and understanding my periodic statement is easy’ — for women this drops to under 30% (Table 11.3).
These results should be read in conjunction with the responses to Q71 which asked respondents if they agreed with the statement ‘I think I pay sufficient attention to my superannuation account’. As Table 15.2 below shows, only 30.3% of respondents selected ‘agree’ or ‘strongly agree’ in response to that statement
Compared to earlier surveys of the general population, the young adults in our
study performed well in paying attention to superannuation fund statements. In the ANZ 2011 Financial Literacy survey 69% of respondents received and read their statements, 20% received but did not read them and 11% did not recall receiving them.108 In contrast, only 5.7% of our respondents did not read any of
108 Ibid 65 (ANZ 2011 Results: on receipt: 11% don’t recall receiving statements; 20% received
statements but did not read them; 69% receive them and read them).

66 CIFR Research Report — Ali, Anderson, Clark, Ramsay and Shekhar
it, and 77.3% read anything between the key figures and all of it. Our results on what is read by respondents differ markedly from the ANZ surveys; for example 91% of our respondents cited ‘the balance’ as something they read, whereas only 14% of ANZ respondents did.109 This can most likely be explained by the fact that the ANZ question was unprompted, while ours involved a prompt to the respondent by the tick box.
Table 11.1 Information, Superannuation Statements and Retirement Savings: Read periodic superannuation fund statement? Percent Read all or most of it 30.6 Read part or key figures 46.7 Read only the balance 13.5 Don’t read any of it 5.7
Table 11.2 Sections you pay attention to: Percent Letter from the Superannuation fund manager(s) 20.3 Handbooks / booklets / guides provided in the envelope 14.2 Balance 91.0 Fees and charges 72.1 Past performance statistics 39.0 Information about investment options 17.7 Other (please specify) 0.8
Table 11.3: Q67: When you receive your periodic superannuation fund statement in the mail, what proportion of it do you read? (Select one) All Male Female Urban Region Degree LowEd All or most 30.6 36.9 ** 24.3 29.6 32.8 33.9 * 25.6 Key figures 46.7 41.9 ** 51.6 48.2 43.6 47.4 43.7 Balance only 13.5 13.8 13.2 13.0 14.5 11.3 ** 20.4 None of it 5.7 4.0 * 7.4 5.7 5.6 4.8 5.3
109 Ibid 66 ANZ (2011) on things examined (unprompted question, multiple responses
allowed): ‘value of investment’ (37%); ‘investment return/performance’ (32%); ‘balance of account’ (14%); ‘management fees’ (18%)’; ‘exit fees’ (3%); ‘to check everything is right’ (19%); ‘break down of investments’ (6%); ‘details of fund beneficiaries’ (<1%); ‘insurance information/benefits’ (2%); ‘employer contributions’ (10%); ‘personal contributions (7%); all other things (5%); nothing in particular/don’t know (2%)).

Superannuation Knowledge, Behaviour and Attitudes in Young Adults in Australia 67
All 25.29 30.34 Hi_Inc
Low_Inc
English LOTE
All or most 30.6 27.1 * 34.5 37.5 ** 25.0 29.8 34.5 Key figures 46.7 48.9 44.4 45.9 44.9 48.1 40.2 Balance only 13.5 14.3 12.7 10.8 * 17.1 13.1 15.5 None of it 5.7 6.7 4.7 4.2 * 8.1 6.1 3.9
Table 11.4: Q68: What sections do you pay attention to? (Select all that apply) All Male Female Urban Region Degree LowEd Letter from fund 20.3 23.0 * 17.4 20.4 20.0 21.8 15.7 Handbooks / booklets / guides
14.2 17.0 * 11.1 12.8 16.8 15.8 12.6
Balance 91.0 90.6 91.5 91.2 90.6 90.1 90.1 Fees and charges 72.1 68.9 * 75.4 71.1 74.0 74.3 * 64.0 Past performance statistics
39.0 42.0 35.8 39.8 37.4 43.5 ** 27.4
Info on invest options
17.7 20.9 ** 14.2 17.3 18.4 19.4 14.1
Other 0.8 1.0 0.7 0.9 0.7 0.9 1.3
All 25.29 30.34 Hi_Inc Low_Inc English LOTE Letter from fund 20.3 19.4 21.3 20.4 20.0 20.5 19.3 Handbooks / booklets / guides
14.2 12.8 15.6 15.8 11.3 13.8 15.7
Balance 91.0 89.5 92.7 90.2 94.0 91.2 90.3 Fees and charges 72.1 72.9 71.2 70.3 73.1 73.4 * 65.5 Past performance statistics
39.0 34.2 ** 44.1 42.4 * 33.7 38.8 39.8
Info on invest options
17.7 16.0 19.4 21.9 * 13.8 17.4 19.1
Other 0.8 0.5 1.2 0.7 1.1 0.8 0.9
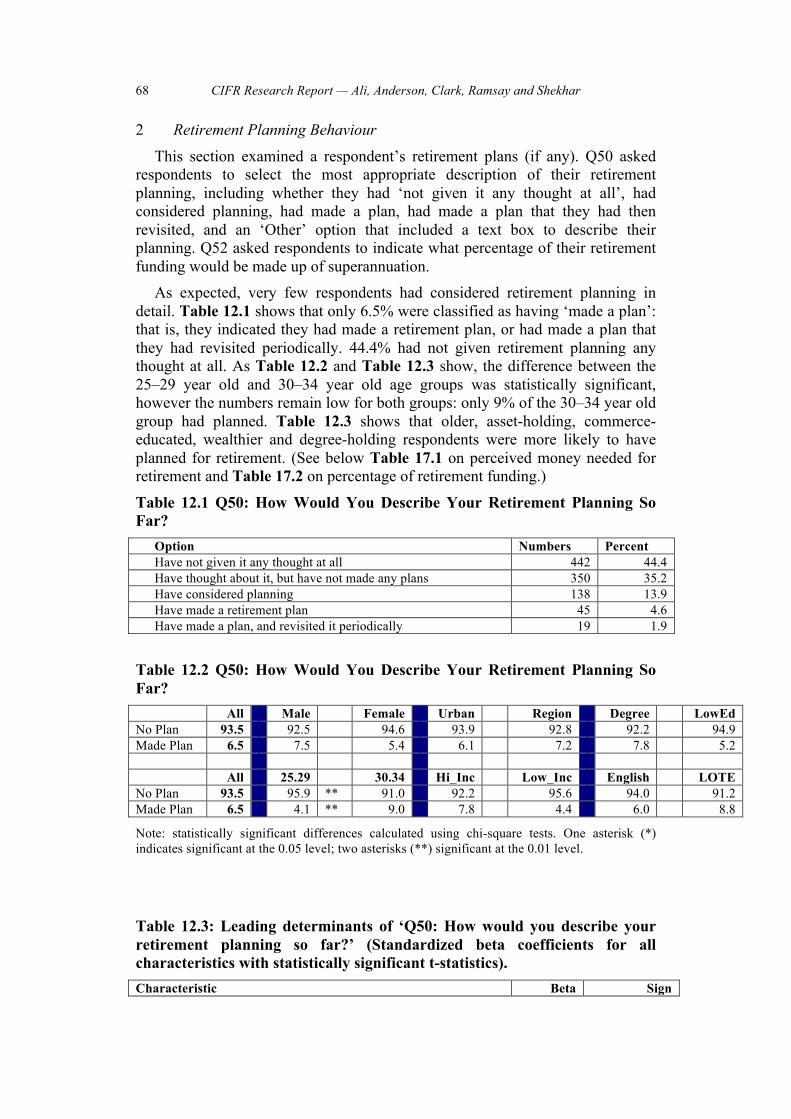
68 CIFR Research Report — Ali, Anderson, Clark, Ramsay and Shekhar
2 Retirement Planning Behaviour This section examined a respondent’s retirement plans (if any). Q50 asked
respondents to select the most appropriate description of their retirement planning, including whether they had ‘not given it any thought at all’, had considered planning, had made a plan, had made a plan that they had then revisited, and an ‘Other’ option that included a text box to describe their planning. Q52 asked respondents to indicate what percentage of their retirement funding would be made up of superannuation.
As expected, very few respondents had considered retirement planning in detail. Table 12.1 shows that only 6.5% were classified as having ‘made a plan’: that is, they indicated they had made a retirement plan, or had made a plan that they had revisited periodically. 44.4% had not given retirement planning any thought at all. As Table 12.2 and Table 12.3 show, the difference between the 25–29 year old and 30–34 year old age groups was statistically significant, however the numbers remain low for both groups: only 9% of the 30–34 year old group had planned. Table 12.3 shows that older, asset-holding, commerce-educated, wealthier and degree-holding respondents were more likely to have planned for retirement. (See below Table 17.1 on perceived money needed for retirement and Table 17.2 on percentage of retirement funding.)
Table 12.1 Q50: How Would You Describe Your Retirement Planning So Far?
Option Numbers Percent Have not given it any thought at all 442 44.4 Have thought about it, but have not made any plans 350 35.2 Have considered planning 138 13.9 Have made a retirement plan 45 4.6 Have made a plan, and revisited it periodically 19 1.9
Table 12.2 Q50: How Would You Describe Your Retirement Planning So Far? All Male Female Urban Region Degree LowEd No Plan 93.5 92.5 94.6 93.9 92.8 92.2 94.9 Made Plan 6.5 7.5 5.4 6.1 7.2 7.8 5.2 All 25.29 30.34 Hi_Inc Low_Inc English LOTE No Plan 93.5 95.9 ** 91.0 92.2 95.6 94.0 91.2 Made Plan 6.5 4.1 ** 9.0 7.8 4.4 6.0 8.8
Note: statistically significant differences calculated using chi-square tests. One asterisk (*) indicates significant at the 0.05 level; two asterisks (**) significant at the 0.01 level.
Table 12.3: Leading determinants of ‘Q50: How would you describe your retirement planning so far?’ (Standardized beta coefficients for all characteristics with statistically significant t-statistics). Characteristic Beta Sign

Superannuation Knowledge, Behaviour and Attitudes in Young Adults in Australia 69
Age 0.1246 Positive Assets: Bonds, shares etc 0.1213 Positive Studied commerce subjects at school/university 0.1184 Positive Net personal income 0.0959 Positive Degree Holder 0.0840 Positive Urban Location -0.0724 Negative

70 CIFR Research Report — Ali, Anderson, Clark, Ramsay and Shekhar
3 Advice Seeking Q59 asked respondents to tick all sources/types of financial advice they had
sought in the last 12 months (professionals, the internet, family, friends on mortgages, superannuation, and so on).
Young adults are far more likely to have sought advice (in the past 12 months) on mortgages than superannuation (Table 13.1). Respondents are far more likely to have talked to a spouse, a relative or a friend about superannuation than actually actioned professional advice.
Table 13.1 Advice Seeking: Advice in the last 12 months: Action percent Paid for professional financial advice about mortgages or investments 5.1 Paid for professional financial advice about retirement or superannuation 3.3 Attended a financial education seminar (employer provided) 4.4 Attended a financial education seminar (superannuation fund provided) 1.8 Attended a financial education seminar (own motivation) 2.7 Sought advice from my bank about mortgages 13.0 Sought advice from my bank about investments 4.4 Sought advice from my bank about superannuation 3.7 Sought advice from my superannuation fund about superannuation or retirement 3.5 Sought advice from my union about financial planning 0.4 Visited an internet site for advice on superannuation 6.4 Read a newspaper or magazine article on superannuation 4.5 Read a business-focused newspaper, magazine, website or blog 3.3 Talked to parent(s) about mortgages 24.7 Talked to parent(s) about investments 16.0 Talked to parent(s) about superannuation and retirement 13.2 Talked to sibling(s)/other family member about mortgages 10.4 Talked to sibling(s)/other family member about investments 7.7 Talked to sibling(s)/other family member about superannuation and retirement 3.8 Talked to friend(s) about mortgages 20.0 Talked to friend(s) about investments 14.8 Talked to friend(s) about superannuation and retirement 9.7 Talked to spouse/partner about mortgages 35.1 Talked to spouse/partner about investments 21.4 Talked to spouse/partner about superannuation and retirement 20.0 Have investigated/talked about superannuation (those ticking ANY of the superannuation advice items asterisked above)
46.4
Table 13.2: Advice Seeking: Advice in the last 12 months: All Male Female Urban Region Degree LowEd

Superannuation Knowledge, Behaviour and Attitudes in Young Adults in Australia 71
Paid professional: mortgages/invest
5.1 4.3 6.0 5.5 4.4 6.2 2.8
Paid professional: retirement/super
3.3 3.3 3.3 3.1 3.7 3.4 3.4
Financial seminar (employer)
4.4 5.1 3.6 4.5 4.1 5.7 2.3
Financial seminar (superfund)
1.8 2.1 1.4 1.5 2.3 2.1 1.3
Financial seminar (own motivation)
2.7 2.7 2.7 2.9 2.5 3.6 * 0.6
Bank: mortgage 13.0 12.7 13.3 13.7 11.7 14.0 10.7 Bank: investments 4.4 5.0 3.8 4.5 4.2 4.7 6.2 Bank: super 3.7 4.4 2.9 3.5 4.1 3.8 1.9 Superfund: super/retirement
3.5 3.8 3.2 3.1 4.2 2.9 ** 7.6
Union: financial planning
0.4 0.3 0.4 0.4 0.3 0.6 0.0
Internet: super 6.4 7.8 5.0 5.6 8.0 8.1 4.0 Newsmedia: super 4.5 4.3 4.8 4.8 4.1 5.6 3.0 Business Media: super
3.3 4.2 2.4 3.7 2.5 4.4 1.4
Parents: mortgage 24.7 23.8 25.6 25.0 24.0 27.8 * 18.7 Parents: investments
16.0 18.7 * 13.2 18.4 ** 11.3 19.4 ** 10.3
Parents: super 13.2 13.8 12.7 11.7 * 16.2 13.8 14.5 Other family: mortgages
10.4 9.8 10.9 10.1 10.9 11.5 7.7
Other family: investments
7.7 9.4 * 5.9 7.9 7.2 10.6 ** 3.9
Other family: super/retirement
3.8 4.4 3.2 3.3 4.8 3.2 4.8
Friends: mortgages
20.0 20.9 19.0 21.6 16.8 22.3 16.0
Friends: investments
14.8 19.2 ** 10.2 16.4 * 11.4 18.2 ** 9.8
Friends: super/ retirement
9.7 10.6 8.8 10.1 8.9 11.7 7.4
Partner: mortgages
35.1 30.5 ** 39.8 33.2 38.9 35.3 29.1
Partner: investments
21.4 19.4 23.5 22.3 19.7 24.5 ** 14.6
Partner: super/ retirement
20.0 19.3 20.6 18.4 23.0 19.8 15.7
Have investigated super
46.4 48.4 44.3 45.2 48.6 46.8 46.3
Note: statistically significant differences calculated using chi-square tests. One asterisk (*) indicates significant at the 0.05 level; two asterisks (**) significant at the 0.01 level.
All 25.29 30.34 Hi_Inc Low_Inc English LOTE Paid professional: mortgages/invest
5.1 4.2 6.2 8.2 ** 2.6 5.4 4.0
Paid professional: 3.3 3.9 2.7 6.1 * 2.1 2.4 ** 7.6

72 CIFR Research Report — Ali, Anderson, Clark, Ramsay and Shekhar
retirement/super Financial seminar (employer)
4.4 4.1 4.6 6.8 ** 2.0 3.6 * 8.0
Financial seminar (superfund)
1.8 1.1 2.5 1.3 1.1 1.4 * 3.6
Financial seminar (own motivation)
2.7 3.1 2.3 2.9 2.1 2.0 ** 6.1
Bank: mortgage 13.0 11.1 15.1 16.2 ** 7.6 13.2 12.3 Bank: investments 4.4 4.0 4.7 4.6 3.4 4.2 5.2 Bank: super 3.7 3.3 4.1 6.4 * 2.8 3.2 6.0 Superfund: super/retirement
3.5 3.4 3.5 2.7 5.0 3.9 1.5
Union: financial planning
0.4 0.7 0.0 0.8 0.0 0.4 0.0
Internet: super 6.4 6.8 6.0 7.3 4.3 5.9 8.9 Newsmedia: super 4.5 4.3 4.8 6.0 * 2.1 4.4 5.3 Business Media: super
3.3 1.9 ** 4.9 4.2 2.5 2.8 5.7
Parents: mortgage 24.7 26.9 22.3 27.0 ** 17.6 24.7 24.7 Parents: investments
16.0 16.5 15.4 19.2 14.7 14.6 ** 22.6
Parents: super 13.2 13.9 12.5 12.7 14.5 14.7 ** 6.1 Other family: mortgages
10.4 10.3 10.4 11.7 8.4 11.3 * 6.0
Other family: investments
7.7 7.1 8.3 9.4 7.7 7.2 9.9
Other family: super/retirement
3.8 4.1 3.4 2.9 5.8 4.2 1.8
Friends: mortgages
20.0 18.0 22.1 23.0 ** 13.0 19.2 23.5
Friends: investments
14.8 14.7 14.8 19.9 ** 7.9 12.7 ** 24.3
Friends: super/ retirement
9.7 10.0 9.4 9.5 8.3 9.2 12.1
Partner: mortgages
35.1 32.0 * 38.5 34.7 33.6 36.6 * 28.1
Partner: investments
21.4 20.7 22.2 24.6 18.4 20.3 26.8
Partner: super/ retirement
20.0 18.0 22.1 20.0 21.2 19.8 20.5
Have investigated super
46.4 46.6 46.1 46.4 48.1 45.8 49.0
Note: statistically significant differences calculated using chi-square tests. One asterisk (*) indicates significant at the 0.05 level; two asterisks (**) significant at the 0.01 level.
Superannuation Knowledge, Behaviour and Attitudes in Young Adults in Australia 73
F Attitudes: Self-Assessment and Views on Superannuation This Part canvasses several areas of attitudes and views towards financial
issues, superannuation and financial/retirement planning. The first section examines self-assessment of knowledge of superannuation. It present trends in self-assessment of knowledge scores, and also presents a comparison of each respondent’s self-assessment against their actual score. The second section looks at self-assessment of superannuation skills such as reading fund statements and assessing different fund options. The third section examines attitudes towards retirement and retirement planning. The fourth section canvasses generally attitudes towards the Australian superannuation scheme. The final section involved factor listing and open-ended questions on financial priorities, factors in choosing a fund, changes to how superannuation funds operate, and general difficulties of superannuation management and financial planning.
Our hypotheses on attitudes were:
• Respondents who had studied subjects listed in Q11 will have better attitudes towards superannuation and retirement planning, and be more confident about their knowledge.
• Males, degree-holders and white collar workers will have higher confidence in their superannuation knowledge.
• Most respondents will over-estimate their knowledge score.
• Few respondents will agree that reading their superannuation statement is easy.
• Few respondents will think they pay sufficient attention to superannuation.
• Overall, attitudes towards retirement planning will be generally negative. Respondents will generally disagree that everything will work out in retirement (Q53), will not express much confidence in their own retirement planning activities (Q54) or their control over superannuation balances (Q55). This negative attitude will be particularly pronounced among females, those in the low education category, and those in the low income category.
• Most respondents will agree that short term goals are more important than saving for retirement.
• Responses on expected retirement total savings required and expected percentage of superannuation to make up that figure will vary widely, on the basis that very few respondents will have considered the question before.110
110 Ibid 72 (note that the question in this survey was unprompted. Our survey gave respondents
categories) ANZ 2011 Results: ANZ (2011) on expected retirement funding per year from those who have identified an amount (n=440): $15,000 to $24,999: 3%; $25,000 to $49,999: 29%; $50,000 to $74,999: 41%; $75,000 to $99,999: 9%; More than $100,000: 10%; Unsure: 8%.

74 CIFR Research Report — Ali, Anderson, Clark, Ramsay and Shekhar
Our hypotheses here were generally confirmed. Higher confidence was seen in those who had studied commerce subjects, but also in those who held assets (bonds, shares, and so forth). Males, LOTE respondents, high income earners and degree holders tended to be overconfident in comparison to their received knowledge scores. Superannuation skills were generally low: most found reading statements difficult, only 40% thought they could assess the pros and cons of a superannuation fund based on fund-provided information. Retirement attitudes were generally poor: the vast majority have not made or considered making a plan, though planning behaviour improves with age. Most are not confident that retirement will work itself out, and many do not feel they know how to approach retirement planning. Respondents on average estimate that superannuation will make up just over half of their total retirement funding. Superannuation is not discussed by people the respondent knows, and there is a low level of trust in the superannuation industry, as well as scepticism about transparency and the frequency of rule changes.

Superannuation Knowledge, Behaviour and Attitudes in Young Adults in Australia 75
1 Self-Assessment of Knowledge of Superannuation A module of six items probed self-assessment of knowledge about
superannuation, retirement and finance (Q44–Q49, Table 14.1).
While half of all respondents reported being well informed about financial matters in general — this dropped to one in three who thought themselves well informed about superannuation issues. While more than a half (56%) reported that they tended to do a lot of research about different options before making a financial decision, only one in three thought making financial decisions was ‘not complicated’. Few stayed up to date with financial issues (just 23%). Tables 14.2 through to 14.7 report selected demographic breakdowns for each of these items. Consistently, males are more positive and confident in their self-assessment, females less so. This is true also for higher income earners and those with degrees.
On Factor Analysis these six items line up on the one factor, a scale (averaging the items and expressing out of 100) was created (Q48 was reversed in the scale). Selected demographic breakdowns for this ‘positive self-assessment’ score are reported in Table 14.8, while the standardized beta coefficients are ranked in Table 14.9 (as based on the regression in Appendix Table 6). Table 14.8 and Appendix Table 6 show that positive attitudes were independent from age.
Specific and background knowledge are revealed as important determinants of personal confidence about superannuation and financial issues — positive (and statistically significant) signs are associated with degree holders, and with those who have studied commerce-related subjects or finance. Table 14.1 Self-assessment items of knowledge about superannuation, retirement and finance (Percent agreeing to propositions)
Proposition Percent agree
Q44: How would you describe your knowledge of personal financial issues in general 50.0 Q45: How well informed about superannuation would you say you were 35.5 Q46: I find that making financial decisions is not complicated 36.3 Q47: I do a lot of research about different options before making a financial decision 56.3 Q48: I put off making financial decisions for as long as I can. 33.8 Q49: I stay up to date with financial news. 23.2 Note: For most propositions the sum of the agrees is reported; for the first item (Q44), it is the sum of ‘strong knowledge’ and ‘moderate knowledge’; for the second item (Q45) it is the sum of ‘very well informed’ and ‘fairly well informed’.
Table 14.2 How would you describe your knowledge of personal financial issues in general? (Sum of percent reporting ‘strong knowledge’ or ‘moderate knowledge’) All Male Female Urban Region Degree LowEd % knowledge 50.0 57.6 ** 42.4 53.1 ** 44.1 59.6 ** 36.0

76 CIFR Research Report — Ali, Anderson, Clark, Ramsay and Shekhar
All 25.29 30.34 Hi_Inc Low_Inc English LOTE % knowledge 50.0 49.5 50.6 60.0 ** 41.0 48.1 ** 59.0
Note: statistically significant differences calculated using chi-square tests. One asterisk (*) indicates significant at the 0.05 level; two asterisks (**) significant at the 0.01 level.
Table 14.3 How well informed about superannuation would you say you were? (Sum of percent reporting ‘very well informed’ or ‘fairly well informed’) All Male Female Urban Region Degree LowEd % informed 35.5 46.7 ** 24.1 37.4 31.6 41.7 ** 25.1 All 25.29 30.34 Hi_Inc Low_Inc English LOTE % informed 35.5 33.3 37.8 44.7 ** 29.0 34.6 39.4
Note: statistically significant differences calculated using chi-square tests. One asterisk (*) indicates significant at the 0.05 level; two asterisks (**) significant at the 0.01 level.
Table 14.4 I find that making financial decisions is not complicated. (Sum of percent reporting ‘strongly agree’ or ‘agree’) All Male Female Urban Region Degree LowEd % agree 36.3 43.9 ** 28.6 36.4 36.2 38.9 32.5 All 25.29 30.34 Hi_Inc Low_Inc English LOTE % agree 36.3 35.6 37.2 42.0 ** 30.6 35.2 41.8
Note: statistically significant differences calculated using chi-square tests. One asterisk (*) indicates significant at the 0.05 level; two asterisks (**) significant at the 0.01 level.
Table 14.5 I tend to do a lot of research about different options before making a financial decision (Sum of percent reporting ‘strongly agree’ or ‘agree’) All Male Female Urban Region Degree LowEd % agree 56.3 57.4 55.3 57.8 53.4 64.1 ** 41.1 All 25.29 30.34 Hi_Inc Low_Inc English LOTE % agree 56.3 56.5 56.2 64.4 ** 52.2 55.3 61.1
Note: statistically significant differences calculated using chi-square tests. One asterisk (*) indicates significant at the 0.05 level; two asterisks (**) significant at the 0.01 level.
Table 14.6 I tend to put off making financial decisions for as long as I can. (Sum of percent reporting ‘strongly agree’ or ‘agree’) All Male Female Urban Region Degree LowEd % agree 33.8 34.2 33.5 33.7 34.1 31.7 36.0 All 25.29 30.34 Hi_Inc Low_Inc English LOTE % agree 33.8 36.8 * 30.7 30.4 37.7 33.9 33.6
Note: statistically significant differences calculated using chi-square tests. One asterisk (*) indicates significant at the 0.05 level; two asterisks (**) significant at the 0.01 level.

Superannuation Knowledge, Behaviour and Attitudes in Young Adults in Australia 77
Table 14.7 I stay up to date with financial news. (Sum of percent reporting ‘strongly agree’ or ‘agree’) All Male Female Urban Region Degree LowEd % agree 23.2 30.9 ** 15.4 26.6 ** 16.6 30.1 ** 13.1 All 25.29 30.34 Hi_Inc Low_Inc English LOTE % agree 23.2 23.2 23.2 34.3 ** 15.2 20.3 ** 36.9
Note: statistically significant differences calculated using chi-square tests. One asterisk (*) indicates significant at the 0.05 level; two asterisks (**) significant at the 0.01 level.
Table 14.8 Positive self-assessment score (Average for each of the six items in the ‘positive self-assessment scale’) (Expressed as out of 100) All Male Female Urban Region Degree LowEd Score 49.4 53.1 ** 45.7 50.4 ** 47.4 52.9 ** 43.6 All 25.29 30.34 Hi_Inc Low_Inc English LOTE Score 49.4 48.8 50.1 53.5 ** 45.8 48.6 ** 53.2
Note: statistically significant differences calculated using chi-square tests. One asterisk (*) indicates significant at the 0.05 level; two asterisks (**) significant at the 0.01 level.
Table 14.9 Leading determinants of Positive self-assessment score (Standardized beta coefficients for all characteristics with statistically significant t-statistics). Characteristic Beta Sign Assets: Bonds, shares etc +0.2352 Positive Studied commerce subjects at school/university +0.2090 Positive Female -0.1526 Negative Degree Holder +0.1273 Positive Have studied finance at university +0.0929 Positive Credit card +0.0695 Positive Significant career changes in jobs/industries +0.0661 Positive Loans: Personal or business +0.0601 Positive
If we take the ‘superannuation knowledge’ results outlined above to be
indicative of real knowledge of superannuation and financial matters, is it the case that this knowledge expresses itself in confidence about financial issues generally (such as making decisions)? In other words what is the relationship between getting the questions in Table 9.2 correct, with the ‘positive self-assessment’ items in Table 14.1? Commentary on this relationship is probably subjective to some extent. But we may rightly be concerned that there is a group of respondents (about one in ten) who believe they have strong (or moderate) knowledge of personal financial issues — and yet are unable to get four or more of the superannuation knowledge questions correct. Nevertheless we may be more objective about identifying groups that are relatively over-confident in their

78 CIFR Research Report — Ali, Anderson, Clark, Ramsay and Shekhar
positive self-assessment (given the level of objective knowledge they reveal in Table 9.2).
Chart A plots the superannuation knowledge scores of all respondents against their self-assessment scores. A regression line is then calculated and shown as an upward sloping line. There is clearly a relationship between the two indices (the slope is statistically significant and positive). Those respondents who are more confident about financial and superannuation issues (relative to what their actual knowledge levels are) appear above (and to the left) of the regression. Those who are less confident relative to their knowledge levels appear below (and to the right) of the regression line. In Chart B this regression line is superimposed on the means of selected demographic groups – again, for both self-assessed confidence and actual knowledge levels.
It is clear that males, LOTE respondents, those with relatively high incomes, and degree-holders, are relatively overconfident about their self-assessed knowledge. The extent that groups (or individuals) are well above the regression line is probably indicative of potentially troubling over-confidence levels. These would be individuals who score poorly in the factual knowledge tests, yet believe their knowledge levels to be ‘strong’. In Chart A, the observations have been labelled according to whether male or female. Normally there would be approximately as many observations above the line as below (in actuality, 48.5% are above the regression line): but as Chart A indicates, there are many more male respondents above the line (in fact, 58.3%) than below (see also Table 15.1).

Superannuation Knowledge, Behaviour and Attitudes in Young Adults in Australia 79
Chart A: Positive Self-Assessment Scores of All Respondents Plotted Against Their Knowledge Level Scores (Male and Female Respondents Indicated)
Notes: ‘Positive self-assessment scale’ (vertical axis) is calculated by averaging the six items in Table 14.1 (noting that one item is ‘reverse scored’) and expressed out of 100. The ‘Knowledge’ scale is calculated by averaging the number of correct answers to propositions in Table 9.2 (so, all questions correct expressed as a score of 100). Solid circles are males; plain circles are females.
0
10
20
30
40
50
60
70
80
90
100
0 10 20 30 40 50 60 70 80 90 100 Knowledge
0
10
20
30
40
50
60
70
80
90
100
0 10 20 30 40 50 60 70 80 90 100

80 CIFR Research Report — Ali, Anderson, Clark, Ramsay and Shekhar
Chart B: Positive Self-Assessment Scores of Selected Demographic Groups Plotted Against Their Knowledge Level Scores
Notes: ‘Positive self-assessment scale’ (vertical axis) is calculated by averaging the six items in Table 14.1 (noting that one item is ‘reverse scored’) and expressed out of 100. The ‘Knowledge’ scale is calculated by averaging the number of correct answers to propositions in Table 9.2 (so, all questions correct expressed as a score of 100).
42
44
46
48
50
52
54
36 38 40 42 44 46 48 50 52 54 56 Knowledge
Male
Female
Urban
Regional
Degree
Low Education
Age25.29
Age30.34
High income
Low income
English
Lote
42
44
46
48
50
52
54
36 38 40 42 44 46 48 50 52 54 56
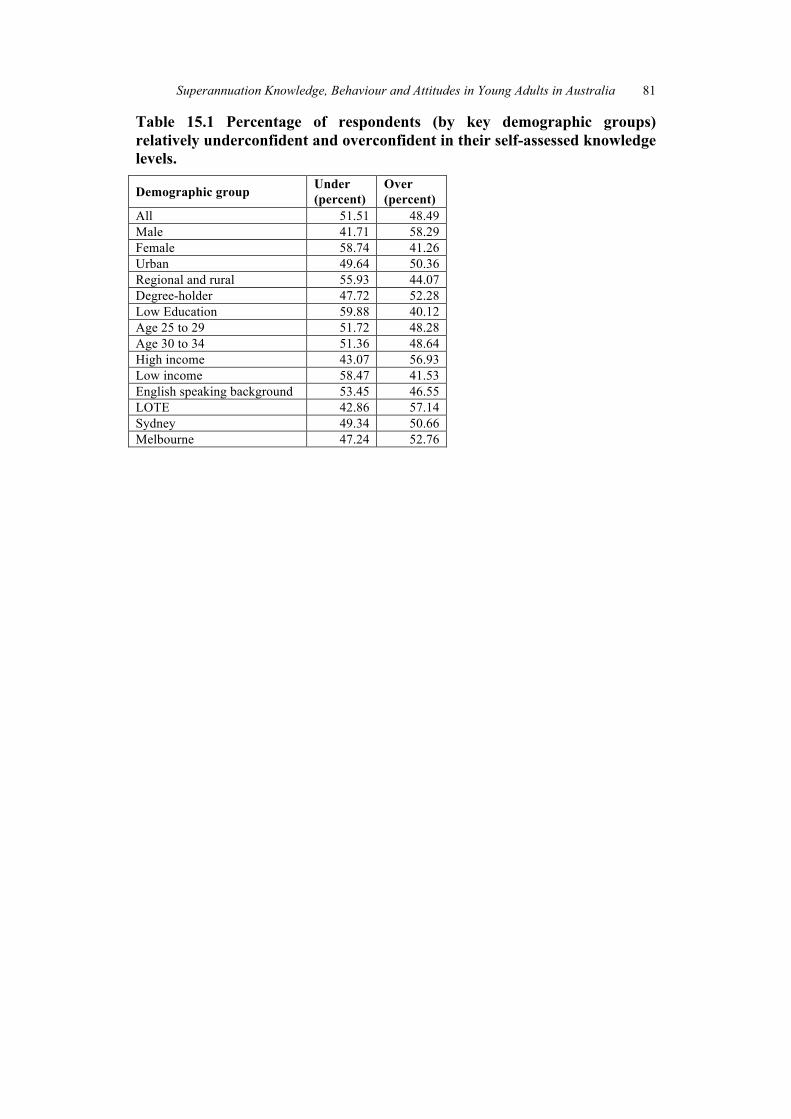
Superannuation Knowledge, Behaviour and Attitudes in Young Adults in Australia 81
Table 15.1 Percentage of respondents (by key demographic groups) relatively underconfident and overconfident in their self-assessed knowledge levels.
Demographic group Under (percent)
Over (percent)
All 51.51 48.49 Male 41.71 58.29 Female 58.74 41.26 Urban 49.64 50.36 Regional and rural 55.93 44.07 Degree-holder 47.72 52.28 Low Education 59.88 40.12 Age 25 to 29 51.72 48.28 Age 30 to 34 51.36 48.64 High income 43.07 56.93 Low income 58.47 41.53 English speaking background 53.45 46.55 LOTE 42.86 57.14 Sydney 49.34 50.66 Melbourne 47.24 52.76
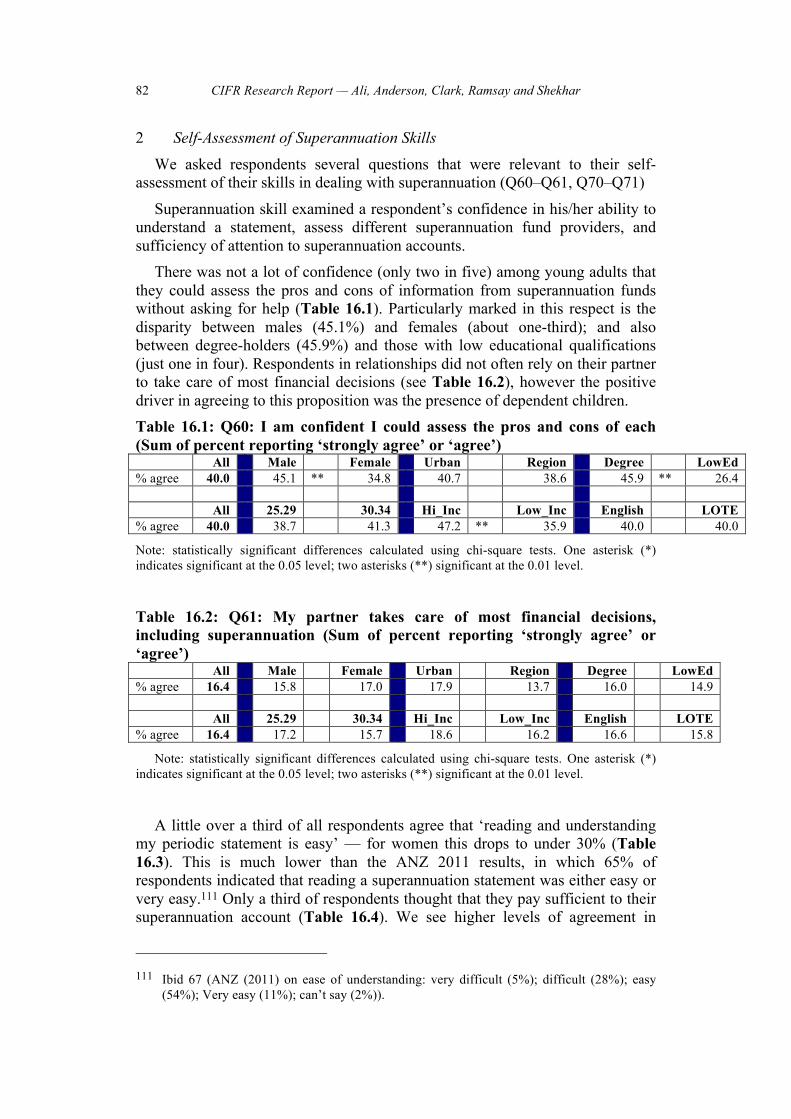
82 CIFR Research Report — Ali, Anderson, Clark, Ramsay and Shekhar
2 Self-Assessment of Superannuation Skills We asked respondents several questions that were relevant to their self-
assessment of their skills in dealing with superannuation (Q60–Q61, Q70–Q71)
Superannuation skill examined a respondent’s confidence in his/her ability to understand a statement, assess different superannuation fund providers, and sufficiency of attention to superannuation accounts.
There was not a lot of confidence (only two in five) among young adults that they could assess the pros and cons of information from superannuation funds without asking for help (Table 16.1). Particularly marked in this respect is the disparity between males (45.1%) and females (about one-third); and also between degree-holders (45.9%) and those with low educational qualifications (just one in four). Respondents in relationships did not often rely on their partner to take care of most financial decisions (see Table 16.2), however the positive driver in agreeing to this proposition was the presence of dependent children. Table 16.1: Q60: I am confident I could assess the pros and cons of each (Sum of percent reporting ‘strongly agree’ or ‘agree’) All Male Female Urban Region Degree LowEd % agree 40.0 45.1 ** 34.8 40.7 38.6 45.9 ** 26.4 All 25.29 30.34 Hi_Inc Low_Inc English LOTE % agree 40.0 38.7 41.3 47.2 ** 35.9 40.0 40.0
Note: statistically significant differences calculated using chi-square tests. One asterisk (*) indicates significant at the 0.05 level; two asterisks (**) significant at the 0.01 level.
Table 16.2: Q61: My partner takes care of most financial decisions, including superannuation (Sum of percent reporting ‘strongly agree’ or ‘agree’) All Male Female Urban Region Degree LowEd % agree 16.4 15.8 17.0 17.9 13.7 16.0 14.9 All 25.29 30.34 Hi_Inc Low_Inc English LOTE % agree 16.4 17.2 15.7 18.6 16.2 16.6 15.8
Note: statistically significant differences calculated using chi-square tests. One asterisk (*) indicates significant at the 0.05 level; two asterisks (**) significant at the 0.01 level.
A little over a third of all respondents agree that ‘reading and understanding my periodic statement is easy’ — for women this drops to under 30% (Table 16.3). This is much lower than the ANZ 2011 results, in which 65% of respondents indicated that reading a superannuation statement was either easy or very easy.111 Only a third of respondents thought that they pay sufficient to their superannuation account (Table 16.4). We see higher levels of agreement in
111 Ibid 67 (ANZ (2011) on ease of understanding: very difficult (5%); difficult (28%); easy
(54%); Very easy (11%); can’t say (2%)).
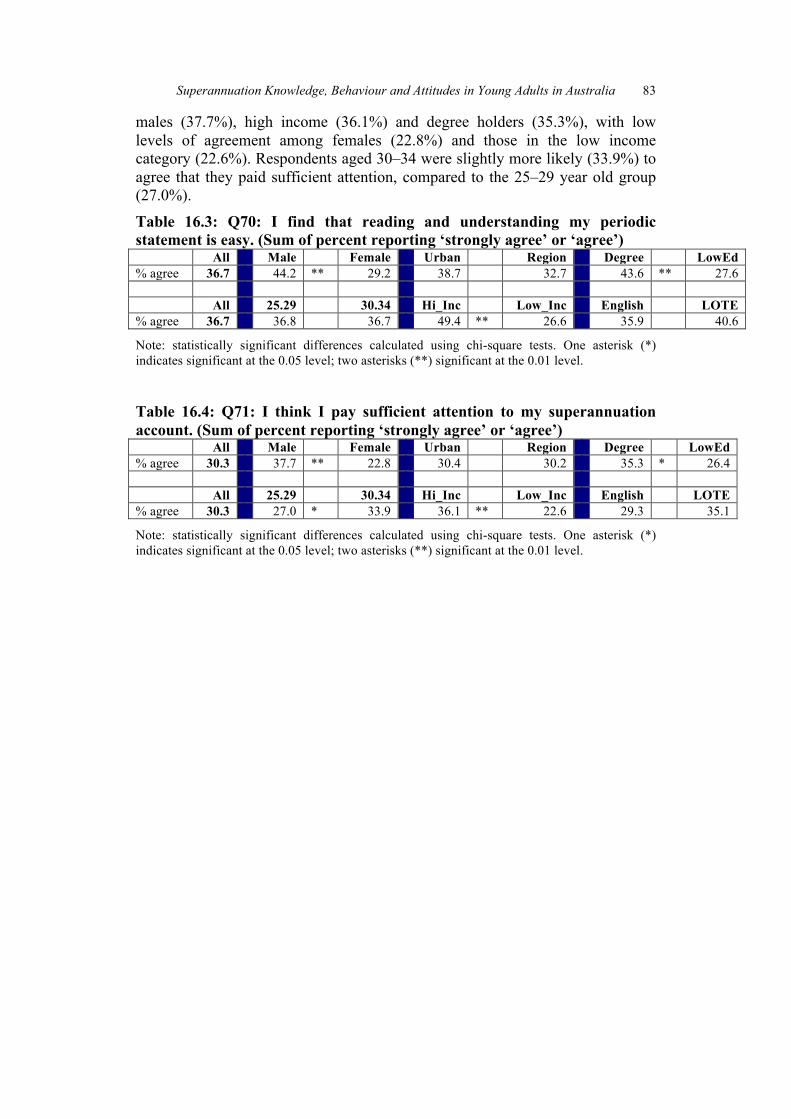
Superannuation Knowledge, Behaviour and Attitudes in Young Adults in Australia 83
males (37.7%), high income (36.1%) and degree holders (35.3%), with low levels of agreement among females (22.8%) and those in the low income category (22.6%). Respondents aged 30–34 were slightly more likely (33.9%) to agree that they paid sufficient attention, compared to the 25–29 year old group (27.0%).
Table 16.3: Q70: I find that reading and understanding my periodic statement is easy. (Sum of percent reporting ‘strongly agree’ or ‘agree’) All Male Female Urban Region Degree LowEd % agree 36.7 44.2 ** 29.2 38.7 32.7 43.6 ** 27.6 All 25.29 30.34 Hi_Inc Low_Inc English LOTE % agree 36.7 36.8 36.7 49.4 ** 26.6 35.9 40.6
Note: statistically significant differences calculated using chi-square tests. One asterisk (*) indicates significant at the 0.05 level; two asterisks (**) significant at the 0.01 level.
Table 16.4: Q71: I think I pay sufficient attention to my superannuation account. (Sum of percent reporting ‘strongly agree’ or ‘agree’) All Male Female Urban Region Degree LowEd % agree 30.3 37.7 ** 22.8 30.4 30.2 35.3 * 26.4 All 25.29 30.34 Hi_Inc Low_Inc English LOTE % agree 30.3 27.0 * 33.9 36.1 ** 22.6 29.3 35.1
Note: statistically significant differences calculated using chi-square tests. One asterisk (*) indicates significant at the 0.05 level; two asterisks (**) significant at the 0.01 level.

84 CIFR Research Report — Ali, Anderson, Clark, Ramsay and Shekhar
3 Retirement Attitudes This section involved Likert-scale questions of views and attitudes towards
retirement (Q53–Q56). Questions canvassed confidence in retirement outcomes, confidence towards approaching planning for retirement, and whether a respondent thought that their overall superannuation balance would be determined by factors outside their control, and whether it was more important to focus on short term financial goals rather than retirement.
Retirement, of course, is a long way off for the young adults surveyed for this study. Nevertheless it might be hypothesized that some would have at least thought about their planning for the future. As noted above in Table 12.1, the vast majority — 93.5% — have made no retirement plans at all. Some 44% have ‘not given it any thought at all’. While a number have at least given it some thought, relatively speaking, only a handful have actually made a plan (6.5%).
What is clear — and not unexpected — is that the likelihood of investigating, or putting into place a retirement plan, correlates with age (Table 12.2 and Chart C). In addition to age, what else might determine the likelihood that an individual young adult might think more proactively about retirement? The important (and significant) influences reported in the regression in Appendix Table 7 are condensed in Table 12.3. Besides age, other positive determinants centre on assets and income, and on specific knowledge, in this case, having studied a commerce-related subject in either schooling or tertiary setting, or being a degree-holder. Urban locale respondents tend to be negative in terms of retirement planning (in comparison with their rural and regional counterparts).
Chart C: Average ‘Planning Index’ across age groups

Superannuation Knowledge, Behaviour and Attitudes in Young Adults in Australia 85
Notes: This chart plots the ‘planning index’ for each age group from 25–34. The ‘planning index’ is simply the average score for the question ‘How would you describe your retirement planning so far?’ The values are: 1 (‘have not given it any thought at all’); 2 (‘have thought about it, but have not made any plans’), 3 (‘have considered planning’); 4 (have made a retirement plan’); and 5 (‘Have made a plan, and revisited it periodically’).
In current dollars, what does a young adult think he or she will need annually
for effective retirement? Q51 required respondents to select from several ranges (rather than enter in their own figure). As Table 17.1 shows, just over half believe they will not need more than $50,000 per year to survive in retirement. The main difference here concerns current income levels: those in higher income brackets clearly believe they need more to retire — perhaps to support the level of comfort to which they have become accustomed. The other difference concerns location: rural respondents feel they will not need as much as their urban counterparts. Table 17.2 shows a fairly even spread across the scale of percentage of retirement funding respondents expected would be made up of superannuation. The average response was 54%, with most respondents giving an estimate in the 26%–50% category. The clearest difference was between high and low income earners: high income earners on average expected that 56.6% of their retirement funding would be made up of superannuation, while low income earners indicated they expected only 48%. Nearly a third (or 28.7%) foresee that superannuation will provide more than 75% of their retirement income.
Table 17.1: Q51: ‘Imagine that you have just retired today. How much money do you think you would need to live on, per year?’
All Male Female Urban Region Degree LowEd <$25k 15.6 16.0 15.2 15.0 16.7 14.8 14.0
25 26 27 28 29 30 31 32 33 341
1.5
2
2.5
3
Age
No thoughtat all
Not madeany plans
Considered planning

86 CIFR Research Report — Ali, Anderson, Clark, Ramsay and Shekhar
$25k–$49k 36.7 37.0 36.4 34.7 40.7 35.2 39.4 $50k–$74k 31.4 30.4 32.5 31.8 30.6 32.9 31.8 >$75k 16.3 16.6 16.0 18.5 ** 11.9 17.1 14.8
All 25.29 30.34 Hi_Inc Low_Inc English LOTE <$25k 15.6 15.7 15.4 7.7 ** 27.6 14.9 18.9 $25k–$49k 36.7 35.9 37.6 29.6 36.7 37.7 32.2 $50k–$74k 31.4 32.7 30.0 37.8 ** 24.3 31.8 29.7 >$75k 16.3 15.6 17.0 24.9 ** 11.4 15.7 19.2
Table 17.2: Q52: What Percentage of your Retirement Funding will be made up of Superannuation? All Male Female Urban Region Degree LowEd S % of RF 54.0 54.6 53.4 54.7 52.7 55.1 * 48.4 0% 2.5 2.0 3.0 1.7 * 4.2 1.4 ** 5.6 1%–25% 21.0 20.0 21.9 19.5 23.7 19.9 ** 29.3 26%–50% 31.3 32.7 30.0 33.1 28.0 32.9 ** 21.1 51%–75% 16.5 17.1 16.0 17.5 14.5 15.8 20.8 76%–99% 18.2 17.9 18.4 17.9 18.8 20.3 15.3 100% 10.5 10.3 10.7 10.3 10.8 9.7 7.9 All 25.29 30.34 Hi_Inc Low_Inc English LOTE S % of RF 54.0 55.1 52.8 56.6 ** 48.0 55.1 * 49.1 0% 2.5 3.0 2.0 0.6 ** 5.1 2.8 1.3 1%–25% 21.0 17.5 ** 24.6 17.3 ** 26.7 19.9 26.1 26%–50% 31.3 31.8 30.8 32.8 31.8 30.0 * 37.8 51%–75% 16.5 18.3 14.6 19.0 14.1 17.4 12.3 76%–99% 18.2 19.8 16.4 20.2 * 12.9 18.8 14.9 100% 10.5 9.6 11.5 10.2 9.5 11.1 7.5
Note: statistically significant differences calculated using chi-square tests. One asterisk (*) indicates significant at the 0.05 level; two asterisks (**) significant at the 0.01 level.
Overall, it is clear that young adults — many focused on short-term goals (Table 17.6) — are not altogether confident about how their retirement plans will eventuate. Less than one in three (29.9%) ‘feel like everything will fall into place for my retirement’ (Table 17.3) while 45.3% do not ‘feel confident about how I should approach planning for retirement’ (Table 17.4). Chart D shows the disparity between responses to these questions — and especially between males and females. Just over one in ten of all respondents agree with both propositions: they do not know what to do about retirement planning — but they do think it will all fall into place when the time comes (for the LOTE group, this rises to 17%). Males and those in the high income group are more likely to agree that the ‘sharemarket and superannuation fund managers have a much greater impact than my decisions’ (Table 17.5).

Superannuation Knowledge, Behaviour and Attitudes in Young Adults in Australia 87
Table 17.3: I feel like everything will fall into place for my retirement All Male Female Urban Region Degree LowEd % agree 29.9 34.4 ** 25.3 31.7 26.3 33.8 ** 22.4 All 25.29 30.34 Hi_Inc Low_Inc English LOTE % agree 29.9 31.4 28.2 35.2 ** 24.2 28.5 * 36.4
Note: statistically significant differences calculated using chi-square tests. One asterisk (*) indicates significant at the 0.05 level; two asterisks (**) significant at the 0.01 level.
Table 17.4: I don’t feel confident about how I should approach planning for retirement All Male Female Urban Region Degree LowEd % agree 45.3 41.3 * 49.4 44.0 47.7 41.1 47.7 All 25.29 30.34 Hi_Inc Low_Inc English LOTE % agree 45.3 47.6 42.8 40.5 * 50.4 44.5 49.2
Note: statistically significant differences calculated using chi-square tests. One asterisk (*) indicates significant at the 0.05 level; two asterisks (**) significant at the 0.01 level.
Chart D: Percentage responses to retirement questions (key demographics)
Notes: On the left, percentage agreeing with the proposition ‘I don’t feel confident about how I should approach planning for retirement’; on the right, percentage agreeing to the proposition ‘I feel like everything will fall into place for my retirement’
50 40 30 20 10 0
Not confident
LOTE
English speaking background
Low Education
Degree-holder
Female
Male
0 10 20 30 40 50
Everything will fall into place
percent percent

88 CIFR Research Report — Ali, Anderson, Clark, Ramsay and Shekhar
Table 17.5: Share market and superannuation fund managers have a much greater impact than my decisions All Male Female Urban Region Degree LowEd % agree 37.5 42.4 ** 32.5 38.7 35.1 39.8 35.2 All 25.29 30.34 Hi_Inc Low_Inc English LOTE % agree 37.5 36.8 38.2 46.4 ** 29.5 36.8 40.8
Note: statistically significant differences calculated using chi-square tests. One asterisk (*) indicates significant at the 0.05 level; two asterisks (**) significant at the 0.01 level.
Table 17.6: More important to focus on short term goals All Male Female Urban Region Degree LowEd % agree 36.4 34.8 37.9 36.4 36.2 36.7 * 28.3 All 25.29 30.34 Hi_Inc Low_Inc English LOTE % agree 36.4 40.3 ** 32.1 37.1 37.1 35.3 41.3
Note: statistically significant differences calculated using chi-square tests. One asterisk (*) indicates significant at the 0.05 level; two asterisks (**) significant at the 0.01 level.

Superannuation Knowledge, Behaviour and Attitudes in Young Adults in Australia 89
4 Attitudes towards the Australian Superannuation Scheme Four in five young adults report that most people they know just ‘don’t talk
about superannuation’ (Table 18.1). Most respondents would like to see an increase in employer contributions to their (own) superannuation (Table 18.2). About one third of respondents agree that the ‘rules about superannuation change too much and/or too often’ (Table 18.3). There is a low degree of trust in the superannuation industry (Table 18.5 — only 22.9% espousing trust in the industry), while well over half indicate that superannuation fees are not transparent enough (Table 18.4).
Table 18.1: Q62: Most people I know don’t talk about superannuation (Sum of percent reporting ‘strongly agree’ or ‘agree’) All Male Female Urban Region Degree LowEd % agree 79.0 74.9 ** 83.1 78.8 79.4 76.2 80.4 All 25.29 30.34 Hi_Inc Low_Inc English LOTE % agree 79.0 81.3 76.5 74.0 ** 82.8 80.2 * 73.2
Note: statistically significant differences calculated using chi-square tests. One asterisk (*) indicates significant at the 0.05 level; two asterisks (**) significant at the 0.01 level.
Table 18.2: Q63: Increase or decrease employer compulsory contribution All Male Female Urban Region Degree LowEd Increase a lot 19.3 19.0 19.6 17.9 22.0 17.8 21.6 Increase a little 44.0 40.6 * 47.5 44.7 42.8 45.8 * 35.2 Stay the same 20.2 23.3 * 17.1 21.8 17.2 21.7 20.3 Decrease a little 1.7 2.5 1.0 1.8 1.5 2.1 1.1 Increase a lot 0.8 1.5 * 0.1 1.3 * 0.0 1.2 0.0 Cannot say 13.9 13.2 14.7 12.6 16.5 11.4 ** 21.7 All 25.29 30.34 Hi_Inc Low_Inc English LOTE Increase a lot 19.3 17.6 21.1 15.8 21.7 19.3 19.4 Increase a little 44.0 46.8 41.1 49.3 ** 38.8 44.3 42.7 Stay the same 20.2 19.3 21.2 22.9 17.4 19.4 23.9 Decrease a little 1.7 2.2 1.2 2.3 1.7 1.8 1.7 Increase a lot 0.8 0.9 0.8 2.3 * 0.3 0.9 0.5 Cannot say 13.9 13.3 14.6 7.4 ** 20.1 14.4 11.8
Note: statistically significant differences calculated using chi-square tests. One asterisk (*) indicates significant at the 0.05 level; two asterisks (**) significant at the 0.01 level.
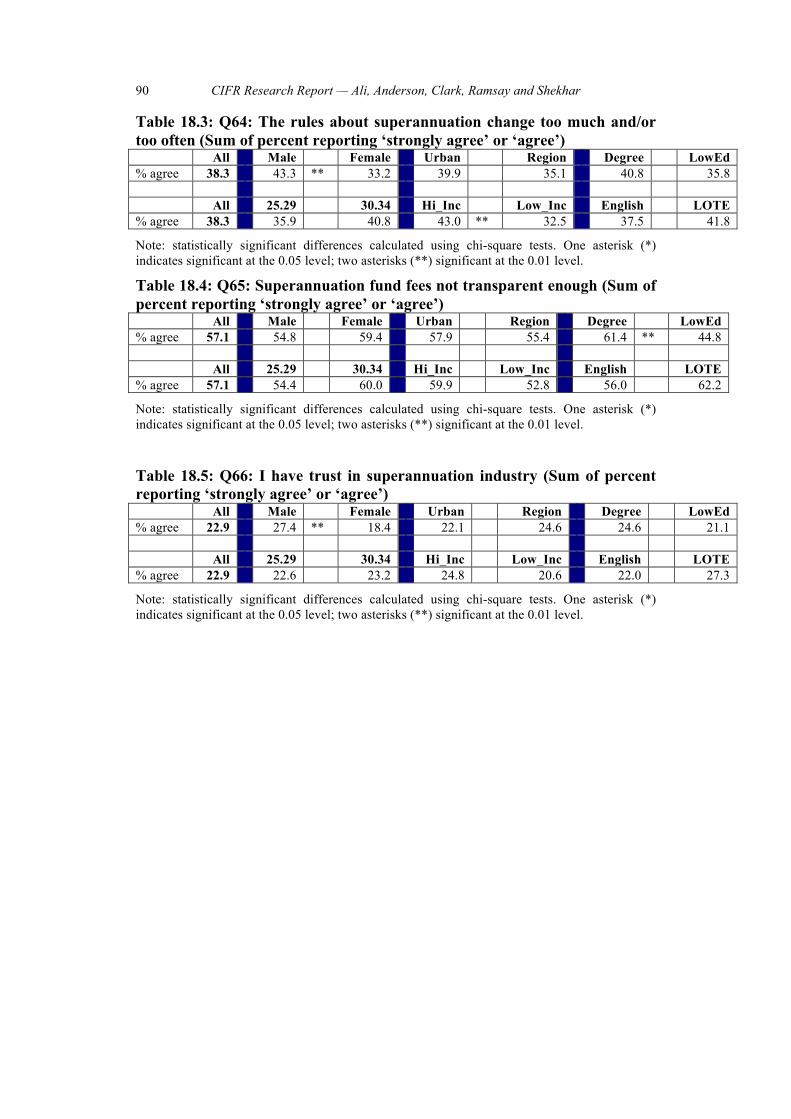
90 CIFR Research Report — Ali, Anderson, Clark, Ramsay and Shekhar
Table 18.3: Q64: The rules about superannuation change too much and/or too often (Sum of percent reporting ‘strongly agree’ or ‘agree’) All Male Female Urban Region Degree LowEd % agree 38.3 43.3 ** 33.2 39.9 35.1 40.8 35.8 All 25.29 30.34 Hi_Inc Low_Inc English LOTE % agree 38.3 35.9 40.8 43.0 ** 32.5 37.5 41.8
Note: statistically significant differences calculated using chi-square tests. One asterisk (*) indicates significant at the 0.05 level; two asterisks (**) significant at the 0.01 level. Table 18.4: Q65: Superannuation fund fees not transparent enough (Sum of percent reporting ‘strongly agree’ or ‘agree’) All Male Female Urban Region Degree LowEd % agree 57.1 54.8 59.4 57.9 55.4 61.4 ** 44.8 All 25.29 30.34 Hi_Inc Low_Inc English LOTE % agree 57.1 54.4 60.0 59.9 52.8 56.0 62.2
Note: statistically significant differences calculated using chi-square tests. One asterisk (*) indicates significant at the 0.05 level; two asterisks (**) significant at the 0.01 level.
Table 18.5: Q66: I have trust in superannuation industry (Sum of percent reporting ‘strongly agree’ or ‘agree’) All Male Female Urban Region Degree LowEd % agree 22.9 27.4 ** 18.4 22.1 24.6 24.6 21.1 All 25.29 30.34 Hi_Inc Low_Inc English LOTE % agree 22.9 22.6 23.2 24.8 20.6 22.0 27.3
Note: statistically significant differences calculated using chi-square tests. One asterisk (*) indicates significant at the 0.05 level; two asterisks (**) significant at the 0.01 level.

Superannuation Knowledge, Behaviour and Attitudes in Young Adults in Australia 91
5 Attitudes Expressed in the General Response Section This final section allowed respondents the opportunity to give longer text
responses to questions on superannuation. Q72 asked respondents to list their top five financial priorities and concerns at this point in their life. Q73–Q75 were open-ended text box response questions which asked respondents to discuss factors influencing their choice of superannuation fund, how, if at all, would they change the way superannuation funds operate, and what they found difficult about managing superannuation and retirement planning.
The vast majority of respondents listed at least one financial priority, and 428 listed three. In general terms, most respondents put housing at the top of their priorities: either buying a house, repaying a mortgage, or paying rent on a leased property. The second most important priority was day to day expenses: food, clothing, utility bills and covering family costs. Lower on the priorities list were investments, retirement, saving money/paying off debts, cars, holidays. Retirement and superannuation were common as a third priority. Common factors associated with fund choice included fee rates (ranking quite highly), employer choice (very common), and interest rates, high returns and low fees as common factors. Many respondents put ‘don’t know’. Regarding possible changes to the way superannuation funds operate, common responses related to improving transparency, reducing fees, making fund provided information easier to understand, and providing more information. Some indicated that they would not change anything about superannuation and that the system worked well. ‘Don’t know’, however, was the most common response. Finally, when asked to articulate what respondents found difficult about retirement planning and superannuation, ‘don’t know’ was a common response. Those who were more specific indicated difficulties in understanding, confusion about the system, that the system was complicated or difficult, including some responses indicating ‘all of it’ or ‘everything’. Assuming that these responses are reliable indicators of the respondent’s immediate reaction to these questions, the high recurrence of ‘don’t know’ and ‘unsure’ responses does seem to fit with other more targeted questions in the survey relevant to superannuation engagement, retirement planning and confidence. One explanation is that most respondents have not considered these questions in any detail. Given that so many have a deficient knowledge of the basic facts about superannuation, it is little wonder that few can express an opinion about what they would look for in a superannuation fund or what they would change about the system. And given the lack of thought that has gone into retirement planning, it seems understandable that few respondents can articulate much about what makes retirement planning hard beyond it being confusing and complicated.

92 CIFR Research Report — Ali, Anderson, Clark, Ramsay and Shekhar
G Further Analysis: Demographics and Impact on Superannuation Items Overall, what actually affects superannuation knowledge, behaviour and
attitudes among this group of young adults? As a rough summary measure, we report the results of statistically significant differences between selected pairs of demographic sub-groups on the basis of multiple questionnaire items. These broad attitudinal items — some 72 in number — cover questionnaire items such as: amount of funds in superannuation, self-assessed knowledge of superannuation, the extent to which retirement planning has commenced (or been investigated), confidence about retirement planning, whether advice about financial planning was sought, attitudes to the current National Superannuation Scheme, and whether respondents understand their superannuation statements. The selected pairs of demographic sub-groups are listed in Table 19.1 (sorted from the greatest number of statistically significant differences to the least).
The clearest difference was seen between the high income group (top third of earners) versus the low income group (bottom third of earners). There were statistically significant differences between these high and low income groups for 38 of the items (or 52.8% of the 72 total items). Next came differences between the degree-holder and low-education groups: there were statistically significant differences between these two groups on just over a third of the items (37.5%), followed closely by differences between male and female respondents (34.7%). Age groups were not as important (less than one in ten of the items), and the differences between the two big urban centres of Sydney and Melbourne were negligible.
While Table 19.1 alerts us to disparities in opinion and knowledge between groups (for example, females versus males), it does not exactly reveal whether the explanation lies in the characteristic itself (such as gender). It may be the case that these disparities are due to particular characteristics of the group in question (for example, the tendency to prefer part-time work – which is more characteristic of women than men). In consequence, an even better way to provide a rough summary measure of the leading explanatory characteristics of superannuation knowledge and behaviour among young adults, is to look at the number of times these characteristics appear as (statistically) significant in regression equations. We ran 36 regressions on a range of the attitudinal and knowledge questionnaire items, ensuring that a good suite of possible explanatory demographics (age, sex, education levels, income, share ownership etc) were included in each. Table 19.2 presents a summary of the number of times these characteristics returned high t-statistics over the 36 regressions.
The characteristic that had the greatest influence was a practical knowledge aspect: whether a respondent had taken a commerce related subject at either secondary or tertiary level. For 23 out of the 36 regressions, this characteristic returned a high t-statistic. Financial capacity characteristics including 'assets' (bonds, high-interest savings, share ownership), credit card ownership, and income also scored highly. Age (13/36) was also important — not at all unexpected — but included mainly so as to factor it out. Being female (17/36) was also obviously key — and this after we have factored for work patterns (such as part-time, casual, or ‘significant breaks in employment’). ‘Having
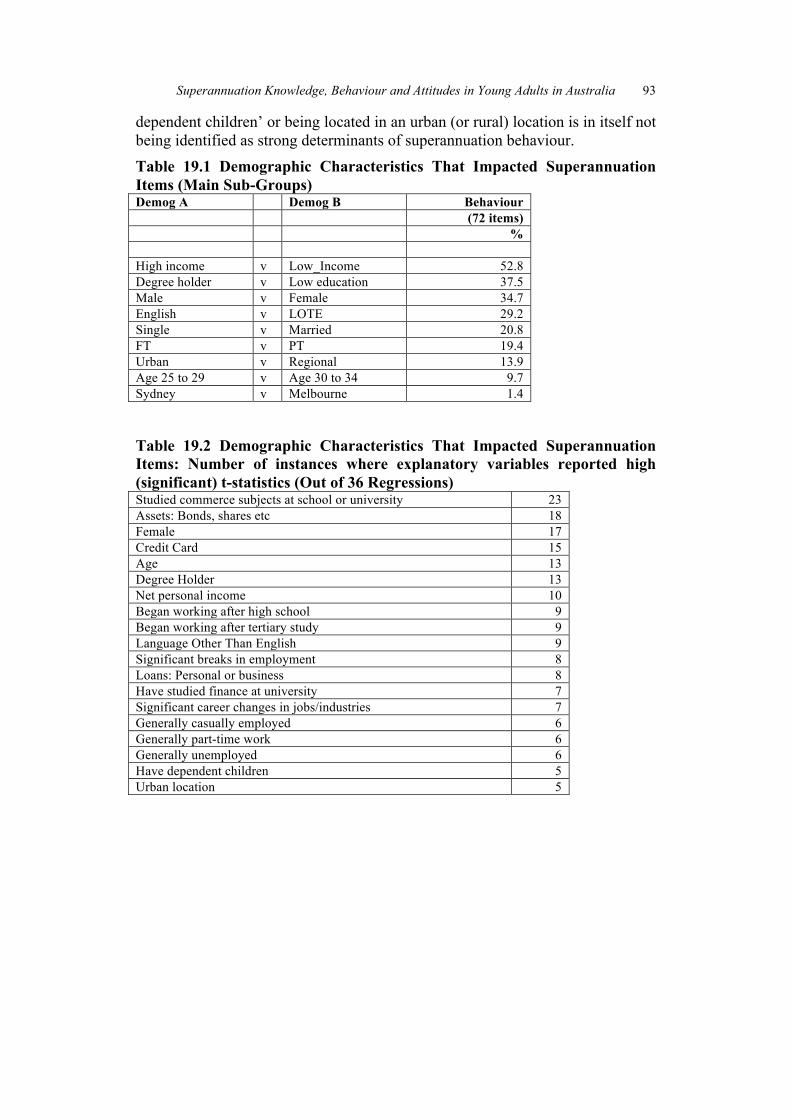
Superannuation Knowledge, Behaviour and Attitudes in Young Adults in Australia 93
dependent children’ or being located in an urban (or rural) location is in itself not being identified as strong determinants of superannuation behaviour. Table 19.1 Demographic Characteristics That Impacted Superannuation Items (Main Sub-Groups) Demog A Demog B Behaviour (72 items) % High income v Low_Income 52.8 Degree holder v Low education 37.5 Male v Female 34.7 English v LOTE 29.2 Single v Married 20.8 FT v PT 19.4 Urban v Regional 13.9 Age 25 to 29 v Age 30 to 34 9.7 Sydney v Melbourne 1.4
Table 19.2 Demographic Characteristics That Impacted Superannuation Items: Number of instances where explanatory variables reported high (significant) t-statistics (Out of 36 Regressions) Studied commerce subjects at school or university 23 Assets: Bonds, shares etc 18 Female 17 Credit Card 15 Age 13 Degree Holder 13 Net personal income 10 Began working after high school 9 Began working after tertiary study 9 Language Other Than English 9 Significant breaks in employment 8 Loans: Personal or business 8 Have studied finance at university 7 Significant career changes in jobs/industries 7 Generally casually employed 6 Generally part-time work 6 Generally unemployed 6 Have dependent children 5 Urban location 5

94 CIFR Research Report — Ali, Anderson, Clark, Ramsay and Shekhar
V CONCLUSION
Our study suggests a number of important conclusions about the knowledge, behaviour and attitudes of young adults in Australia with regards to superannuation.
Knowledge about Australia’s superannuation system is generally very poor. Young people are particularly poorly informed about the age at which they can access superannuation and the definition of superannuation investment options. Stronger knowledge scores are seen in male, degree holding, urban and high income respondents. Female, lower educated, regional and low income respondents generally had lower knowledge scores. There was little difference in knowledge scores between the 25–29 year old segment and the 30–34 year old segment, indicating that knowledge does not greatly improve over time in young adults. Overall, studying commerce or finance related subjects at secondary school or university had the greatest impact in improving knowledge scores in respondents.
At the risk of overgeneralising respondent behaviour, young adults appear to be unengaged by and uninterested in their superannuation accounts or retirement. Most respondents do not check their accounts regularly or change investment options. One third read most or all of their periodic statements and the majority check the balance of their account on these statements. Most extra material provided by superannuation funds is not read. A very small number have planned for retirement, and most have not considered the question at all so far. Those who have planned for retirement tend to be older, asset-holding, commerce educated, high income degree holders. On average, respondents expected superannuation would fund 54% of their total retirement spending and nearly a third expect it will fund 75% or more. Young adults tend not to seek professional advice on financial issues including superannuation, and while they prefer to discuss these issues with partners, relatives or friends, those conversations usually relate to mortgages or other loans rather than retirement or superannuation.
It is difficult to describe in broad terms the attitudes of the respondents, but perhaps the closest description is worried and sceptical. Only one third consider themselves well informed about superannuation, with male, degree holding, commerce educated and asset holding respondents showing higher levels of confidence in their knowledge, and females showing lower levels of confidence. When compared with actual scores attained in the knowledge component of the survey, males, LOTE, high income and degree-holding respondents are relatively overconfident. Confidence in superannuation skills (reading and understanding a fund statement, for example) was generally low. Only one-third agreed that they paid a sufficient amount of attention to superannuation. Most are not confident about retirement planning or prospects for retirement itself. Superannuation is rarely discussed with people respondents know. Only one in five agreed that they trusted superannuation fund providers, and more than half wanted more transparency on fee payments. Superannuation was widely regarded as not a major priority at this stage in the lives of respondents.

Superannuation Knowledge, Behaviour and Attitudes in Young Adults in Australia 95
BIBLIOGRAPHY Agnew, Julie et al, ‘Superannuation Knowledge and Plan Behaviour’ (2013)
Agnew, Julie, Hazel Bateman and Susan Thorp, ‘Financial Literacy and Retirement Planning in Australia’ (2013) 6 Numeracy
Association of Superannuation Funds of Australia, ‘Establishing an Academic Research Program with the Superannuation Sector’ (Association of Superannuation Funds of Australia, July 2012)
Australian Prudential Regulation Authority, ‘A Recent History of Superannuation in Australia’ [2007] APRA Insight
Australian Prudential Regulation Authority, ‘Annual Superannuation Bulletin 2013 (revised 5 February 2014)’ (June 2013) <http://www.apra.gov.au/Super/Publications/Documents/Revised%202013%20Annual%20Superannuation%20Bulletin%2005-02-14.pdf>
Australian Prudential Regulation Authority, ‘APRA Insight: Issue One 2014’ (2014)
Australian Securities and Investments Commission, ‘Financial Literacy and Behavioural Change’ (Research Report 230, Australian Securities and Investments Commission, March 2011)
Bateman, Hazel et al, ‘An Experimental Survey of Investment Decisions for Retirement Savings’ (10 July 2010)
Bateman, Hazel et al, ‘Financial Competence and Expectations Formation: Evidence from Australia’ (13 April 2011)
Bateman, Hazel et al, ‘Just Interested or Getting Involved? An Analysis of Superannuation Attitudes and Actions’ (2014) 90 Economic Record 160
Beal, Diana and Sarath Delpachitra, ‘Community Understanding of Superannuation’ (2004) 11 Agenda 127
Beal, Diana J and Sarath B Delpachitra, ‘Financial Literacy among Australian University Students’ (2003) 22 Economic Papers 65
Bowen, Cathy Foulcon, ‘Financial Knowledge of Teens and Their Parents’ (2002) 13 Financial Counseling and Planning 93
Brown, Kerry A, Gerry T Gallery and Natalie Gallery, ‘Informed Superannuation Choice: Constraints and Policy Resolutions’ (2002) 32 Economic Analysis and Policy 71
Capuano, Angelo and Ian Ramsay, ‘What Causes Suboptimal Financial Behaviour? An Exploration of Financial Literacy, Social Influences and Behavioural Economics’ [2011] An Exploration of Financial Literacy, Social Influences and Behavioural Economics (March 23, 2011). U of Melbourne Legal Studies Research Paper <http://www.masters.law.unimelb.edu.au/files/dmfile/FINANCIAL_LITERACY_PROJECT_RESEARCH_REPORT_MARCH_20111.pdf>
Citibank Australia, ‘Evidence versus Emotion: How Do We Really Make Financial Decisions?’ (December 2010)
Clark-Murphy, Marilyn, Ingeborg Kristofferson and Paul Gerrans, ‘What Makes Superannuation Decisions Difficult?’ (2002) 10 International Journal of Business Studies 73

96 CIFR Research Report — Ali, Anderson, Clark, Ramsay and Shekhar
Cobb-Clark, Deborah A and Steven Stillman, ‘The Retirement Expectations of Middle-Aged Australians’ (2009) 85 Economic Record 146
Cull, Michelle and Diana Whitton, ‘University Students’ Financial Literacy Levels: Obstacles and Aids’ (2011) 22 The Economic and Labour Relations Review 99
Deloitte Actuaries and Consultants, ‘Dynamics of the Australian Superannuation System: The Next 20 Years: 2013-2033’ (September 2013)
Dewar, John et al, Superannuation and Divorce in Australia (Australian Institute of Family Studies, 1999)
Fielding, Nigel, Lee, Raymond M and Blank, The SAGE Handbook of Online Research Methods (SAGE, 2008)
Frippiat, Didier and Nicolas Marquis, ‘Web Surveys in the Social Sciences: An Overview’ (2010) 65 Population (english edition) 285
Gallery, Natalie, ‘Superannuation Fund Choice: Opening Pandora’s Box’ [2002] Australian Review of Public Affairs <http://eprints.qut.edu.au/4930/>
Gallery, Natalie, Cameron Newton and Chrisann Palm, ‘Framework for Assessing Financial Literacy and Superannuation Investment Choice Decisions’ (2011) 5 Australasian Accounting Business and Finance Journal 3
Gerrans, Paul, Marilyn Clark-Murphy and Keith Truscott, ‘Financial Literacy and Superannuation Awareness of Indigenous Australians: Pilot Study Results’ (2009) 44 Australian Journal of Social Issues 417
Gordon, Isabel, ‘Superannuation in Society: What Are the Accountability Relationships and Is There a Role for (Group) Accounting?’ (2012) 22 Australian Accounting Review 142
Grace, Debra, Scott Weaven and Sharlene Anderson, ‘An Examination of Involvement in Relation to Superannuation Consumption’ (2008) 12 Journal of Financial Services Marketing 311
Grace, Debra, Scott Weaven and Mitchell Ross, ‘Consumer Retirement Planning: An Exploratory Study of Gender Differences’ (2010) 13 Qualitative Market Research 174
Hastings, Justine S, Brigitte C Madrian and William L Skimmyhorn, ‘Financial Literacy, Financial Education, and Economic Outcomes’ (Working Paper 18412, National Bureau of Economic Research, January 2013) 347 <http://www.nber.org/papers/w18412>
Humpel, Nancy et al, ‘Ageing Baby Boomers in Australia: Evidence Informing Actions for Better Retirement’ (2009) 44 Australian Journal of Social Issues 399
Huston, Sandra J, ‘Measuring Financial Literacy’ (2010) 44 Journal of Consumer Affairs 296
Kerry, Michael, Bruce Clayton and Marc Olynyk, ‘Evaluating the Impact of Financial Literacy Programs on the Retirement Savings of Superannuation Fund Members’ (2007) 3 International Review of Business Research Papers 73
Lusardi, Annamaria and Olivia Mitchell, ‘Financial Literacy and Retirement Preparedness: Evidence and Implications for Financial Education’ (2007) 42 Business Economics 35
Manfreda, Katja Lozar et al, ‘Web Surveys versus Other Survey Modes: A Meta-Analysis Comparing Response Rates’ (2008) 50 Journal of the Market Research Society 79

Superannuation Knowledge, Behaviour and Attitudes in Young Adults in Australia 97
Ntalianis, Michael and Victoria Wise, ‘The Role of Financial Education in Retirement Planning’ (2011) 5 Australasian Accounting Business and Finance Journal 23
Ntalianis, Michael, ‘Preferred Sources of Financial Information and Communications for Superannuation Decisions’ (2012) 8 International Review of Business Research Papers 55
Parrish, Tahlia and Sarath Delpachitra, ‘On Selection of Superannuation Fund: Impact of Choice and Information’ (2012) 31 Economic Papers 369
Revilla, MA and WE Saris, ‘A Comparison of the Quality of Questions in a Face-to-Face and a Web Survey’ (2013) 25 International Journal of Public Opinion Research 242
The Social Research Centre, ‘ANZ Survey of Adult Financial Literacy in Australia’ (ANZ, October 2008)
The Social Research Centre, ‘ANZ Survey of Adult Financial Literacy in Australia’ (ANZ, December 2011)
Tustin, Michelle, Adam Hinds and Adamedes-Schmid Songsil, ‘Gen Y & Superannuation: Why Won’t They Engage? Quantitative Report’ (Colmar Brunton, 2014)
Worthington, Andrew C, ‘Coverage, Knowledge and Perceptions of Superannuation in Australia’ <http://ro.uow.edu.au/commpapers/198/>
Worthington, Andrew C, ‘Knowledge and Perceptions of Superannuation in Australia’ (2008) 31 Journal of Consumer Policy 349
Australian Bureau of Statistics, 6310.0 - Employee Earnings, Benefits and Trade Union Membership, Australia, August 2013 (4 June 2014) Australian Bureau of Statistics <http://www.abs.gov.au/AUSSTATS/[email protected]/mf/6310.0>

98 CIFR Research Report — Ali, Anderson, Clark, Ramsay and Shekhar
ANNEX A: REGRESSIONS
Appendix Table 1: Current superannuation balance, across all accounts (Trimmed Sample): OLS regression results on selected explanatory variables Variable Coefficient Std Err B Beta T-stat Sig T Age 1276.190 191.161 0.2230 6.676 0.0000 ** Net personal income 0.077 0.018 0.1536 4.208 0.0000 ** Female 721.723 1051.830 0.0229 0.686 0.4928 Urban Location -1804.991 1114.029 -0.0540 -1.620 0.1056 Degree Holder -335.447 1158.173 -0.0106 -0.290 0.7722 Generally part-time work -7089.591 1629.307 -0.1453 -4.351 0.0000 ** Generally casually employed -8160.016 1874.993 -0.1470 -4.352 0.0000 ** Generally unemployed -10459.105 4170.525 -0.0822 -2.508 0.0124 * Language other than English -3408.592 1338.528 -0.0850 -2.547 0.0111 * Loans: Personal or business 4604.781 1658.460 0.0907 2.777 0.0056 ** Assets: Bonds, shares etc 5040.259 1109.569 0.1522 4.543 0.0000 ** Credit card 3427.298 1162.702 0.0974 2.948 0.0033 ** Significant career breaks in employment
-7189.159 1571.737 -0.1586 -4.574 0.0000 **
Significant career changes in jobs/industries
1045.444 1312.495 0.0281 0.797 0.4260
Began working after high school
1297.989 1350.582 0.0361 0.961 0.3368
Began working after tertiary study
1290.617 1317.873 0.0337 0.979 0.3278
Have dependent children -2971.144 1127.618 -0.0898 -2.635 0.0086 ** Studied commerce subjects at school/university
47.493 25.824 0.0617 1.839 0.0663
Have studied finance at university
2182.812 2900.967 0.0246 0.752 0.4520
Constant -19440.890 5816.915 -3.342 0.0009 Notes: OLS regression for Overall superannuation funds (Dependent Variable); F-Stat for whole regression 14.74206; Significant F-Score 0.0000; Degrees of freedom: 19 (Regression) 721 (Residual); Adjusted r-square: 0.26089

Superannuation Knowledge, Behaviour and Attitudes in Young Adults in Australia 99
Appendix Table 2 At what age did you join your first superannuation fund: OLS regression results on selected explanatory variables Variable Coefficient Std Err B Beta T-stat Sig T Age 0.190 0.041 0.1449 4.664 0.0000 ** Net personal income 0.000 0.000 -0.0365 -1.143 0.2533 Female -0.416 0.224 -0.0577 -1.860 0.0633 Urban Location 0.260 0.238 0.0342 1.092 0.2752 Degree Holder 0.702 0.249 0.0967 2.816 0.0050 ** Generally part-time work 0.612 0.359 0.0532 1.704 0.0888 Generally casually employed 0.246 0.401 0.0196 0.614 0.5391 Generally unemployed 1.872 0.780 0.0738 2.398 0.0167 * Language other than English 2.481 0.297 0.2610 8.342 0.0000 ** Loans: Personal or business -0.848 0.360 -0.0713 -2.358 0.0186 * Assets: Bonds, shares etc 0.232 0.243 0.0305 0.955 0.3397 Credit card -0.598 0.255 -0.0729 -2.349 0.0190 * Significant career breaks in employment
0.275 0.340 0.0263 0.807 0.4197
Significant career changes in jobs/industries
-1.015 0.279 -0.1200 -3.636 0.0003 **
Began working after high school
-0.606 0.285 -0.0745 -2.124 0.0339 *
Began working after tertiary study
0.839 0.291 0.0929 2.888 0.0040 **
Have dependent children 0.349 0.238 0.0462 1.463 0.1438 Studied commerce subjects at school/university
0.000 0.006 -0.0014 -0.043 0.9661
Have studied finance at university
-0.843 0.592 -0.0437 -1.423 0.1551
Constant 12.971 1.240 10.464 0.0000 Notes: OLS regression for Q26 (Dependent Variable); F-Stat for whole regression 11.51209; Significant F-Score 0.0000; Degrees of freedom: 19 (Regression) 917 (Residual); Adjusted r-square: 0.17582
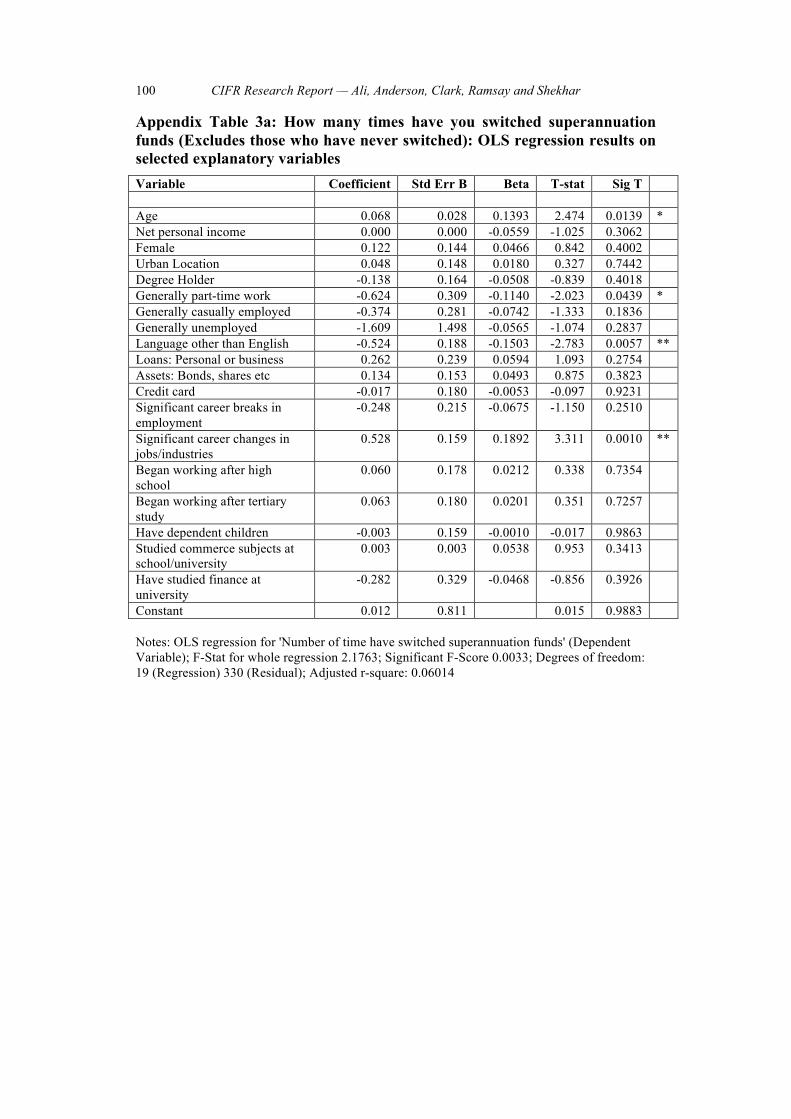
100 CIFR Research Report — Ali, Anderson, Clark, Ramsay and Shekhar
Appendix Table 3a: How many times have you switched superannuation funds (Excludes those who have never switched): OLS regression results on selected explanatory variables Variable Coefficient Std Err B Beta T-stat Sig T Age 0.068 0.028 0.1393 2.474 0.0139 * Net personal income 0.000 0.000 -0.0559 -1.025 0.3062 Female 0.122 0.144 0.0466 0.842 0.4002 Urban Location 0.048 0.148 0.0180 0.327 0.7442 Degree Holder -0.138 0.164 -0.0508 -0.839 0.4018 Generally part-time work -0.624 0.309 -0.1140 -2.023 0.0439 * Generally casually employed -0.374 0.281 -0.0742 -1.333 0.1836 Generally unemployed -1.609 1.498 -0.0565 -1.074 0.2837 Language other than English -0.524 0.188 -0.1503 -2.783 0.0057 ** Loans: Personal or business 0.262 0.239 0.0594 1.093 0.2754 Assets: Bonds, shares etc 0.134 0.153 0.0493 0.875 0.3823 Credit card -0.017 0.180 -0.0053 -0.097 0.9231 Significant career breaks in employment
-0.248 0.215 -0.0675 -1.150 0.2510
Significant career changes in jobs/industries
0.528 0.159 0.1892 3.311 0.0010 **
Began working after high school
0.060 0.178 0.0212 0.338 0.7354
Began working after tertiary study
0.063 0.180 0.0201 0.351 0.7257
Have dependent children -0.003 0.159 -0.0010 -0.017 0.9863 Studied commerce subjects at school/university
0.003 0.003 0.0538 0.953 0.3413
Have studied finance at university
-0.282 0.329 -0.0468 -0.856 0.3926
Constant 0.012 0.811 0.015 0.9883 Notes: OLS regression for 'Number of time have switched superannuation funds' (Dependent Variable); F-Stat for whole regression 2.1763; Significant F-Score 0.0033; Degrees of freedom: 19 (Regression) 330 (Residual); Adjusted r-square: 0.06014
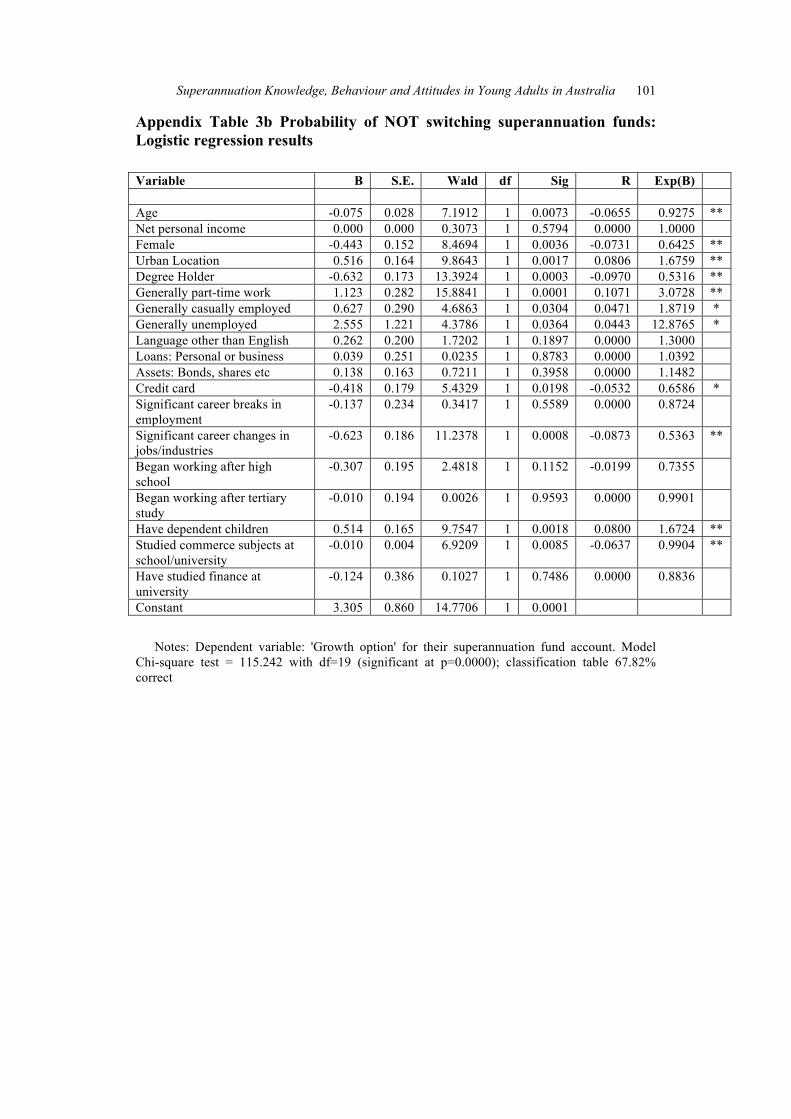
Superannuation Knowledge, Behaviour and Attitudes in Young Adults in Australia 101
Appendix Table 3b Probability of NOT switching superannuation funds: Logistic regression results Variable B S.E. Wald df Sig R Exp(B) Age -0.075 0.028 7.1912 1 0.0073 -0.0655 0.9275 ** Net personal income 0.000 0.000 0.3073 1 0.5794 0.0000 1.0000 Female -0.443 0.152 8.4694 1 0.0036 -0.0731 0.6425 ** Urban Location 0.516 0.164 9.8643 1 0.0017 0.0806 1.6759 ** Degree Holder -0.632 0.173 13.3924 1 0.0003 -0.0970 0.5316 ** Generally part-time work 1.123 0.282 15.8841 1 0.0001 0.1071 3.0728 ** Generally casually employed 0.627 0.290 4.6863 1 0.0304 0.0471 1.8719 * Generally unemployed 2.555 1.221 4.3786 1 0.0364 0.0443 12.8765 * Language other than English 0.262 0.200 1.7202 1 0.1897 0.0000 1.3000 Loans: Personal or business 0.039 0.251 0.0235 1 0.8783 0.0000 1.0392 Assets: Bonds, shares etc 0.138 0.163 0.7211 1 0.3958 0.0000 1.1482 Credit card -0.418 0.179 5.4329 1 0.0198 -0.0532 0.6586 * Significant career breaks in employment
-0.137 0.234 0.3417 1 0.5589 0.0000 0.8724
Significant career changes in jobs/industries
-0.623 0.186 11.2378 1 0.0008 -0.0873 0.5363 **
Began working after high school
-0.307 0.195 2.4818 1 0.1152 -0.0199 0.7355
Began working after tertiary study
-0.010 0.194 0.0026 1 0.9593 0.0000 0.9901
Have dependent children 0.514 0.165 9.7547 1 0.0018 0.0800 1.6724 ** Studied commerce subjects at school/university
-0.010 0.004 6.9209 1 0.0085 -0.0637 0.9904 **
Have studied finance at university
-0.124 0.386 0.1027 1 0.7486 0.0000 0.8836
Constant 3.305 0.860 14.7706 1 0.0001
Notes: Dependent variable: 'Growth option' for their superannuation fund account. Model Chi-square test = 115.242 with df=19 (significant at p=0.0000); classification table 67.82% correct

102 CIFR Research Report — Ali, Anderson, Clark, Ramsay and Shekhar
Appendix Table 4: What determines choice of the ‘growth option’ for a superannuation fund?: Logistic regression results Variable B S.E. Wald df Sig R Exp(B) Age 0.031 0.034 0.8512 1 0.3562 0.0000 1.0318 Net personal income 0.000 0.000 0.1245 1 0.7242 0.0000 1.0000 Female -0.528 0.186 8.0838 1 0.0045 -0.0805 0.5895 ** Urban Location 0.115 0.204 0.3137 1 0.5754 0.0000 1.1213 Degree Holder 0.490 0.215 5.2192 1 0.0223 0.0586 1.6330 * Generally part-time work -0.338 0.356 0.8991 1 0.3430 0.0000 0.7133 Generally casually employed -0.226 0.386 0.3444 1 0.5573 0.0000 0.7975 Generally unemployed 0.007 0.781 0.0001 1 0.9928 0.0000 1.0071 Language other than English 0.190 0.220 0.7415 1 0.3892 0.0000 1.2087 Loans: Personal or business -0.018 0.295 0.0039 1 0.9501 0.0000 0.9817 Assets: Bonds, shares etc 0.956 0.185 26.8386 1 0.0000 0.1627 2.6018 ** Credit card 0.067 0.223 0.0904 1 0.7636 0.0000 1.0693 Significant career breaks in employment
-1.110 0.395 7.8987 1 0.0049 -0.0793 0.3297 **
Significant career changes in jobs/industries
0.070 0.240 0.0848 1 0.7710 0.0000 1.0724
Began working after high school
0.210 0.247 0.7210 1 0.3958 0.0000 1.2337
Began working after tertiary study
-0.075 0.233 0.1040 1 0.7471 0.0000 0.9275
Have dependent children 0.022 0.196 0.0129 1 0.9097 0.0000 1.0225 Studied commerce subjects at school/university
0.011 0.004 7.9462 1 0.0048 0.0796 1.0114 **
Have studied finance at university
1.029 0.395 6.7870 1 0.0092 0.0714 2.7981 **
Constant -3.162 1.043 9.1911 1 0.0024 Notes: Dependent variable: ‘Growth option’ for their superannuation fund account. Model Chi-square test = 121.506 with df=19 (significant at p=0.0000); classification table 80.26% correct
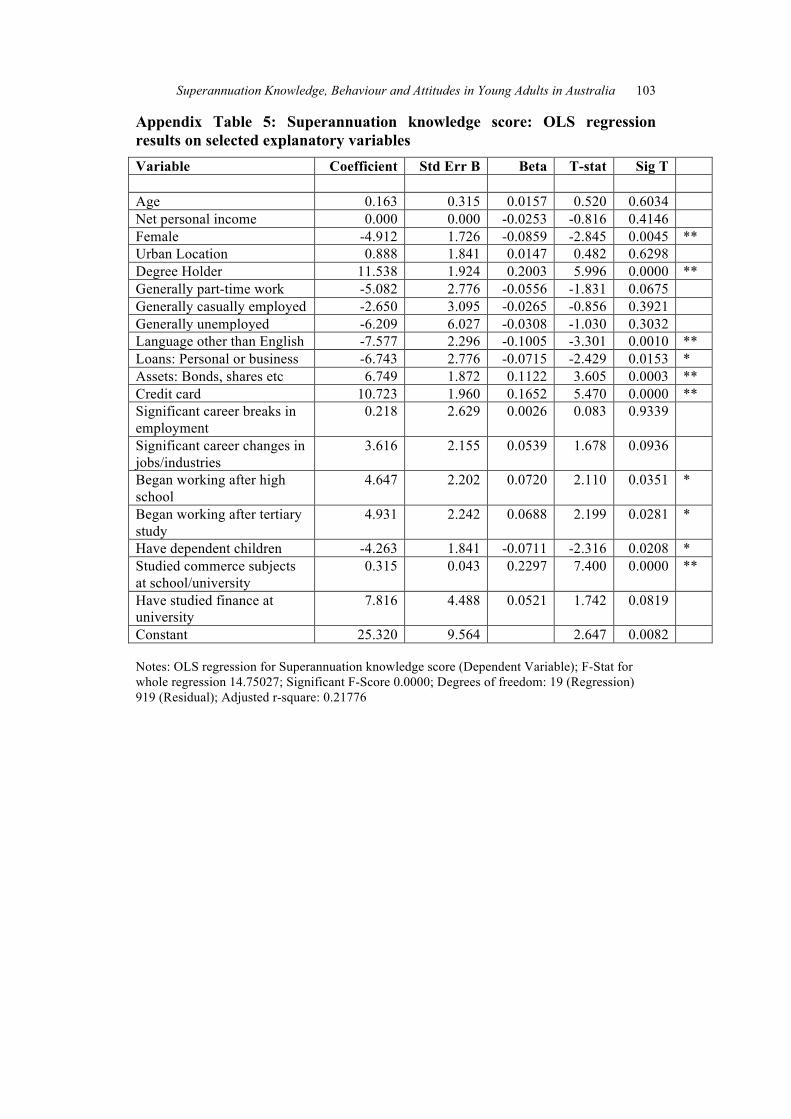
Superannuation Knowledge, Behaviour and Attitudes in Young Adults in Australia 103
Appendix Table 5: Superannuation knowledge score: OLS regression results on selected explanatory variables
Variable Coefficient Std Err B Beta T-stat Sig T Age 0.163 0.315 0.0157 0.520 0.6034 Net personal income 0.000 0.000 -0.0253 -0.816 0.4146 Female -4.912 1.726 -0.0859 -2.845 0.0045 ** Urban Location 0.888 1.841 0.0147 0.482 0.6298 Degree Holder 11.538 1.924 0.2003 5.996 0.0000 ** Generally part-time work -5.082 2.776 -0.0556 -1.831 0.0675 Generally casually employed -2.650 3.095 -0.0265 -0.856 0.3921 Generally unemployed -6.209 6.027 -0.0308 -1.030 0.3032 Language other than English -7.577 2.296 -0.1005 -3.301 0.0010 ** Loans: Personal or business -6.743 2.776 -0.0715 -2.429 0.0153 * Assets: Bonds, shares etc 6.749 1.872 0.1122 3.605 0.0003 ** Credit card 10.723 1.960 0.1652 5.470 0.0000 ** Significant career breaks in employment
0.218 2.629 0.0026 0.083 0.9339
Significant career changes in jobs/industries
3.616 2.155 0.0539 1.678 0.0936
Began working after high school
4.647 2.202 0.0720 2.110 0.0351 *
Began working after tertiary study
4.931 2.242 0.0688 2.199 0.0281 *
Have dependent children -4.263 1.841 -0.0711 -2.316 0.0208 * Studied commerce subjects at school/university
0.315 0.043 0.2297 7.400 0.0000 **
Have studied finance at university
7.816 4.488 0.0521 1.742 0.0819
Constant 25.320 9.564 2.647 0.0082 Notes: OLS regression for Superannuation knowledge score (Dependent Variable); F-Stat for whole regression 14.75027; Significant F-Score 0.0000; Degrees of freedom: 19 (Regression) 919 (Residual); Adjusted r-square: 0.21776

104 CIFR Research Report — Ali, Anderson, Clark, Ramsay and Shekhar
Appendix Table 6 Positive Self-Assessment Score: OLS regression results on selected explanatory variables
Variable Coefficient Std Err B Beta T-stat Sig T Age 0.000 0.189 0.0001 0.002 0.9982 Net personal income 0.000 0.000 -0.0009 -0.030 0.9759 Female -5.263 1.038 -0.1526 -5.071 0.0000 ** Urban Location -0.524 1.107 -0.0144 -0.473 0.6362 Degree Holder 4.424 1.157 0.1273 3.825 0.0001 ** Generally part-time work -1.937 1.669 -0.0351 -1.161 0.2461 Generally casually employed 0.160 1.860 0.0027 0.086 0.9315 Generally unemployed -3.810 3.623 -0.0314 -1.052 0.2933 Language other than English -0.649 1.380 -0.0143 -0.470 0.6382 Loans: Personal or business 3.422 1.669 0.0601 2.051 0.0406 * Assets: Bonds, shares etc 8.536 1.125 0.2352 7.585 0.0000 ** Credit card 2.722 1.178 0.0695 2.310 0.0211 * Significant career breaks in employment
-0.847 1.580 -0.0169 -0.536 0.5922
Significant career changes in jobs/industries
2.674 1.295 0.0661 2.064 0.0393 *
Began working after high school
0.193 1.324 0.0050 0.146 0.8841
Began working after tertiary study
-0.472 1.348 -0.0109 -0.350 0.7262
Have dependent children -1.038 1.106 -0.0287 -0.938 0.3483 Studied commerce subjects at school/university
0.173 0.026 0.2090 6.757 0.0000 **
Have studied finance at university
8.405 2.698 0.0929 3.115 0.0019 **
Constant 42.398 5.749 7.375 0.0000 Notes: OLS regression for POS.SA (Dependent Variable); F-Stat for whole regression 15.20155; Significant F-Score 0.0000; Degrees of freedom: 19 (Regression) 919 (Residual); Adjusted r-square: 0.22332

Superannuation Knowledge, Behaviour and Attitudes in Young Adults in Australia 105
Appendix Table 7 Retirement planning: ‘How would you describe your retirement planning so far?’: OLS regression results on selected explanatory variables Variable Coefficient Std Err B Beta T-stat Sig T Age 1.091 0.286 0.1246 3.821 0.0001 ** Net personal income 0.000 0.000 0.0959 2.866 0.0042 ** Female -1.531 1.567 -0.0318 -0.977 0.3289 Urban Location -3.679 1.672 -0.0724 -2.201 0.0280 * Degree Holder 4.075 1.747 0.0840 2.333 0.0199 * Generally part-time work -4.409 2.520 -0.0573 -1.750 0.0805 Generally casually employed -1.348 2.809 -0.0160 -0.480 0.6314 Generally unemployed 9.444 5.471 0.0557 1.726 0.0847 Language other than English -1.773 2.084 -0.0279 -0.851 0.3952 Loans: Personal or business 2.066 2.520 0.0260 0.820 0.4126 Assets: Bonds, shares etc 6.140 1.699 0.1213 3.613 0.0003 ** Credit card 1.554 1.780 0.0284 0.873 0.3828 Significant career breaks in employment
-1.392 2.387 -0.0199 -0.583 0.5600
Significant career changes in jobs/industries
1.304 1.956 0.0231 0.667 0.5050
Began working after high school
1.480 1.999 0.0272 0.740 0.4592
Began working after tertiary study
1.124 2.036 0.0186 0.552 0.5811
Have dependent children 1.507 1.671 0.0299 0.902 0.3673 Studied commerce subjects at school/university
0.137 0.039 0.1184 3.539 0.0004 **
Have studied finance at university
6.000 4.074 0.0475 1.473 0.1412
Constant -18.653 8.682 -2.149 0.0319 Notes: OLS regression for ‘Planning’ (Dependent Variable); F-Stat for whole regression 5.90838; Significant F-Score 0.0000; Degrees of freedom: 19 (Regression) 919 (Residual); Adjusted r-square: 0.09039
106 CIFR Research Report — Ali, Anderson, Clark, Ramsay and Shekhar
ANNEX B: SURVEY INSTRUMENT Superannuation Survey Instrument – 29 November 2013 NOTE: Respondents are unable to select conflicting answers (eg, single and married) Check box (€) indicates multiple checks available (except where answers would conflict) White bullet point (o) indicates one choice available only
Page 1: Pure Profile Pro Forma Text
Thank you for participating in our survey today. Our client requested that we speak to a certain sub-section of the population. To do this we usually ask a few screening questions at the beginning of the survey. In this instance you were not eligible for the survey. Thank you for considering our survey. Your opinions are important to us and we hope that you will be able to offer them to us via our online surveys in the future. Please click " >> " to submit your survey...
Page 2: Pure Profile Pro Forma Text
Thanks for agreeing to participate in our survey! We wish to reassure you that this is genuine academic research and as always your individual survey responses will remain confidential and anonymous at all times. In the unlikely event of any technical difficulties please click on the technical support e-mail link. If you wish to take a break, just close the survey browser. You can restart the survey at a later time by going to your history tab within your account. Please Keep In Mind... Do not use your Back or Forward browser buttons while you are taking this survey. Once you answer a question, you will not be able to go back and change your answer. Before we go through to the main study we would like to ask you a number of questions to make sure we are interviewing a good cross section of people. Please click " >> " to start the survey... Page 3: Instructions to Survey Participants from MLS Research Team Dear participant, This survey is about superannuation and retirement planning for young Australians who are members of one or more superannuation funds.
Instructions
It is important that you base your answers on your own recollections and, where necessary, estimation. If you don’t know the answer to a question, please use the ‘don’t know/can’t say’ option. If you have any concerns
The study is being conducted by researchers at the Melbourne Law School at the University of Melbourne for a project entitled ‘Financial Literacy and Innovation in Superannuation Product Disclosure: Improving the Retirement Savings of Australians’. The Principal Researcher is

Superannuation Knowledge, Behaviour and Attitudes in Young Adults in Australia 107
Professor Ian Ramsay and the Other Researchers are Associate Professor Paul Ali, and Martin Clark.
The project has received clearance from the Human Research Ethics Committee at the University of Melbourne. The project ID is 134059. If you have any concerns about the conduct of this research project or the questionnaire, you may contact the Executive Officer, Human Research Ethics, the University of Melbourne on (03) 8344 2073 or via http://orei.unimelb.edu.au/content/contact-human-ethics. If you have any trouble understanding the questions and would like clarification, please feel free to email Martin Clark at [email protected] and he will respond to your query
Q1 - Q1 This section contains basic demographic questions about you, your partner and your parents. In what year were you born? Please type in the box below in the format (YYYY) If outside date range: (Pro Forma text from Pure Profile
Thank you for participating in our survey today. Our client requested that we speak to a certain sub-section of the population. To do this we usually ask a few screening questions at the beginning of the survey. In this instance you were not eligible for the survey. Thank you for considering our survey. Your opinions are important to us and we hope that you will be able to offer them to us via our online surveys in the future. Please click " >> " to submit your survey...
Q1a - Q1a Are you a member of one or more superannuation funds? Please select ONE o Yes o No
If no (Pro Forma text from Pure Profile):
Thank you for participating in our survey today.
Our client requested that we speak to a certain sub-section of the population. To do this we usually ask a few screening questions at the beginning of the survey. In this instance you were not eligible for the survey. Thank you for considering our survey. Your opinions are important to us and we hope that you will be able to offer them to us via our online surveys in the future.

108 CIFR Research Report — Ali, Anderson, Clark, Ramsay and Shekhar
Q2 - Q2
What is your gender? Please select ONE o Male o Female o Rather not say
If outside gender quotas (Pro Forma text from Pure Profile)
Thank you for participating in our survey today. Our client requested that we speak to a certain sub-section of the population. To do this we usually ask a few screening questions at the beginning of the survey. In this instance you were not eligible for the survey. Thank you for considering our survey. Your opinions are important to us and we hope that you will be able to offer them to us via our online surveys in the future.
Region - Region Where do you live? Please select ONE o Sydney o NSW regional o Melbourne o VIC regional o Brisbane o QLD regional o Adelaide o SA regional o Perth o WA regional o Hobart o TAS regional o Darwin o NT regional o ACT
If outside region quotas (Pro Forma text from Pure Profile)
Thank you for participating in our survey today. Our client requested that we speak to a certain sub-section of the population. To do this we usually ask a few screening questions at the beginning of the survey. In this instance you were not eligible for the survey. Thank you for considering our survey. Your opinions are important to us and we hope that you will be able to offer them to us via our online surveys in the future.
Q3 - Q3 If you speak a language other than English at home, what is it? (Write more than one if
necessary). Please select ONE o Yes____________ o I speak only English at home
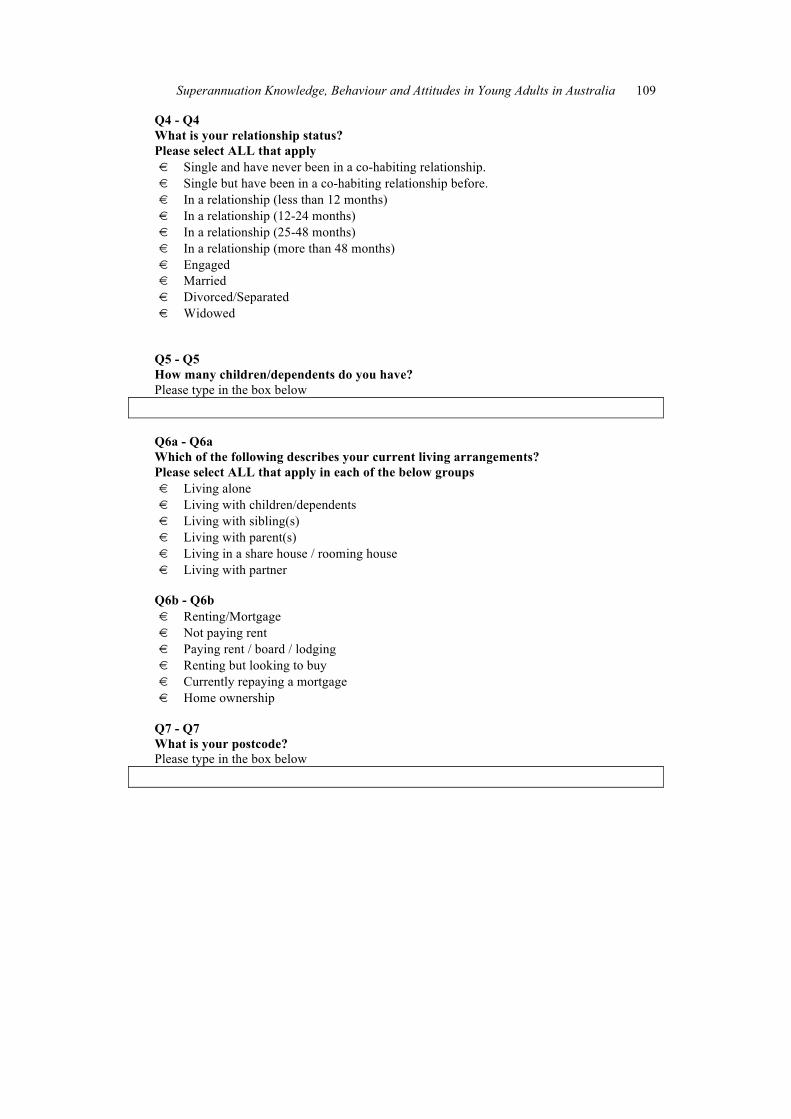
Superannuation Knowledge, Behaviour and Attitudes in Young Adults in Australia 109
Q4 - Q4 What is your relationship status? Please select ALL that apply € Single and have never been in a co-habiting relationship. € Single but have been in a co-habiting relationship before. € In a relationship (less than 12 months) € In a relationship (12-24 months) € In a relationship (25-48 months) € In a relationship (more than 48 months) € Engaged € Married € Divorced/Separated € Widowed
Q5 - Q5 How many children/dependents do you have? Please type in the box below Q6a - Q6a Which of the following describes your current living arrangements? Please select ALL that apply in each of the below groups € Living alone € Living with children/dependents € Living with sibling(s) € Living with parent(s) € Living in a share house / rooming house € Living with partner
Q6b - Q6b € Renting/Mortgage € Not paying rent € Paying rent / board / lodging € Renting but looking to buy € Currently repaying a mortgage € Home ownership
Q7 - Q7 What is your postcode? Please type in the box below

110 CIFR Research Report — Ali, Anderson, Clark, Ramsay and Shekhar
Q8 - Q8 Which of the following do you have? Please select ALL that apply € Communications € Home telephone € Home internet access € Mobile phone (no internet access) € Mobile/Smartphone (with internet
access) € Desktop computer € Laptop computer € Tablet computer € Other communications device (please
specify)____________
€ Financial Products € High Interest Savings Account € Term deposit € Shares € Investment fund € Bonds € Business loan € Investment loan € Personal loan (for car, motorbike,
truck) € Personal loan (renovations) € Personal loan (travel) € Personal loan (other) € Payday loan / cash advance € Credit card € Other financial product (please
specify)____________
Q9 - Q9 Which of the following education programs have you completed? (Tick all that apply,
and specify the type of degree(s) (eg, HSC, Cert III Hospitality Management, BEc, PhD (History)) ‘
o Did not complete Year 10 Secondary School € Year 10 Secondary School € Year 12 Secondary School (State Education Certificate – eg, HSC, VCE, etc)
(specify)____________
Specify the type of high school you attended: € Government/state school € Catholic school € Independent/private school
€ TAFE / CAE / Training College Certificate / Apprenticeship (specify)____________ € Vocational Graduate Certificate / Diploma (specify)____________
€ Undergraduate degree (specify)____________ € Undergraduate degree (with 4th year / Honours year) (specify)____________ € Postgraduate degree (Diploma) (specify)____________ € Postgraduate degree (Masters) (specify)____________ € Doctoral degree (specify)____________

Superannuation Knowledge, Behaviour and Attitudes in Young Adults in Australia 111
Q10 - Q10 Which of the following describes your current study commitments? Please select ONE o Not studying o Considering returning to study o Will return to study within 12 months o Part-way through a course, but will not return to study within 12 months o Studying less than half time (single subject, trade certificate, night school, etc) o Studying half-time o Studying full-time o Other (please specify)____________
Q11 - Q11 Which of the following areas did you study at a secondary or tertiary level? Please select ALL that apply Secondary School € Mathematics (Secondary) € Business Studies (Secondary) € Accounting (Secondary) € Economics (Secondary)
Tertiary Level € Business (Tertiary) € Economics (Tertiary) € Commerce (Tertiary) € Finance/Financial Planning (Tertiary) € Marketing (Tertiary) € Statistics (Tertiary) € Mathematics (Tertiary) € Accounting (Tertiary)
o Did not study any of the topic areas listed above at either secondary or tertiary level
Q12 - Q12 What is your current yearly net personal income (ie, after tax)? Please type in the box below Q13 - Q13 Describe the occupations / industries that you have worked in? (Eg, nurse/healthcare,
sales clerk/retail) Please type in the boxes provided 1. ______________________________ 2. ______________________________ 3. ______________________________ 4. ______________________________ 5. ______________________________ 6. ______________________________ 7. ______________________________ 8. ______________________________ 9. ______________________________ 10. ______________________________

112 CIFR Research Report — Ali, Anderson, Clark, Ramsay and Shekhar
Q14a - Q14a Which of the following describes your current work commitments? Please select ALL that apply o Full-time employed o Part-time employed o Casually employed o Unemployed
Q14b - Q14b € Not looking for work € Looking for an additional job / more hours € Looking to change jobs / industries € Volunteering € Caring for a child € Caring for an ill / elderly relative
Q15 - Q15 Which of the following describes your work history Please select ALL that apply € Generally full-time work € Generally part-time work € Generally casually employed € Generally unemployed and looking for work € Generally unemployed and not looking for work.
€ Began working after high school € Began working after tertiary study € Generally worked casual/part-time throughout tertiary study
€ Stopped working to return to study € Stopped working to care for children € Stopped working to care for ill/elderly family member € Do not plan to return to work € Plan to return to work
€ Have changed jobs and/or industries several times in my career € Have had significant breaks in employment in my career due to, eg, unemployment,
travel, care responsibilities Q16 - Q16 Are you a member of a trade union? Please select ONE o Yes (please specify)____________ o No
Q17 - Q17 Respondents who were involved in co-habiting long-term relationships, but are now single,
should enter details for their immediate last co-habiting partner. What is your partner’s current net yearly income (ie, after tax)? (Estimate if necessary) Please select ONE o ____________ o Don’t know

Superannuation Knowledge, Behaviour and Attitudes in Young Adults in Australia 113
Q18 - Q18 Describe the occupations and/or industries that your partner has worked in: Please type in the boxes provided 1. ______________________________ 2. ______________________________ 3. ______________________________ 4. ______________________________ 5. ______________________________ 6. ______________________________ 7. ______________________________ 8. ______________________________ 9. ______________________________ 10. ______________________________ Q19a - Q19a Which describes your partner’s current work commitments? Please select ALL that apply o Full-time employed o Part-time employed o Casually employed o Unemployed
Q19b - Q19b € Not looking for work € Looking for an additional job / more hours € Looking to change jobs / industries € Volunteering € Caring for a child € Caring for an ill / elderly relative
Q20a - Q20a Which describes your parents’ work history? Please select ALL that apply FATHER € Generally full-time € Generally part-time € Generally casually employed € Generally unemployed € Self-employed / business-owner
€ Stayed in same occupation / industry for all or most of his life € Had one major career change € Had multiple career changes € Spent significant period(s) unemployed and looking for work € Spent significant period(s) unemployed but not looking for work € Spent a significant period of time out of work to care for children € Spent a significant period of time out of work to care for an ill/elderly relative

114 CIFR Research Report — Ali, Anderson, Clark, Ramsay and Shekhar
Q20b - Q20b MOTHER € Generally full-time € Generally part-time € Generally casually employed € Generally unemployed € Self-employed / business-owner
€ Stayed in same occupation / industry for all or most of her life € Had one major career change € Had multiple career changes € Spent significant period(s) unemployed and looking for work € Spent significant period(s) unemployed but not looking for work € Spent a significant period of time out of work to care for children € Spent a significant period of time out of work to care for an ill/elderly relative
Q21 - Q21 Describe the occupations and/or industries your father worked in Please type in the boxes provided 1. ______________________________ 2. ______________________________ 3. ______________________________ 4. ______________________________ 5. ______________________________ Q22 - Q22 Describe the occupations and/or industries your mother worked in Please type in the boxes provided 1. ______________________________ 2. ______________________________ 3. ______________________________ 4. ______________________________ 5. ______________________________ Q23a - Q23a Which of the following describes your parents’ situation? (if one/both deceased, answer
as at time of death, but check the ‘deceased’ option Please select ALL that apply € Still married / de facto € Divorced / separated € Remarried
Q23b1 - Q23b1 FATHER o Working full-time o Working part-time but not semi-retired o Working part-time and semi-retired o Unemployed (looking for work) o Unemployed (not retired, but not looking for work) o Retired
Q23b2 - Q23b2 € Receiving superannuation € Receiving aged pension € Receiving disability pension € Deceased

Superannuation Knowledge, Behaviour and Attitudes in Young Adults in Australia 115
Q23c1 - Q23c1 MOTHER o Working full-time o Working part-time but not semi-retired o Working part-time and semi-retired o Unemployed (looking for work) o Unemployed (not retired, but not looking for work) o Retired
Q23c2 - Q23c2 € Receiving superannuation € Receiving aged pension € Receiving disability pension € Deceased
Q24 - Q24 Do your parents currently have any of the following? (if one/both deceased, answer as at
time of death) Please select ALL that apply € Shares € Investment fund € Bonds € Investment property € Mortgage € Business loan € Investment loan € Personal loan o Don’t know/Can’t say
Q25a - Q25a Which describes your parents’ highest level of education? Please select ONE FATHER o Did not complete Year 10 o Completed Year 10 o Completed Year 12 (Secondary school certificate) o TAFE / Apprenticeship / Professional Qualification o Undergraduate Degree o Post-graduate Degree
Q25b - Q25b MOTHER o Did not complete Year 10 o Completed Year 10 o Completed Year 12 (Secondary school certificate) o TAFE / Apprenticeship / Professional Qualification o Undergraduate Degree o Post-graduate Degree

116 CIFR Research Report — Ali, Anderson, Clark, Ramsay and Shekhar
Q26 - Q26 This section contains questions about your current superannuation arrangements. At
what age did you join your first superannuation fund? Please type in the box below Q27 - Q27 Which of the following superannuation funds do you have an account with? Please select from the drop downs below Q272 - Q272 Q27e - Estimated
balance in the superannuation fund (you can enter numbers with commas)
Q27f - Certainty of the estimation Quite Certain
Estimate
Guess
Fund 1 m m m Fund 2 m m m Fund 3 m m m Fund 4 m m m Fund 5 m m m Fund 6 m m m Fund 7 m m m Fund 8 m m m Fund 9 m m m Fund 10 m m m I have a self-managed
superannuation fund ______ m m m
Other retail fund (specify name/s)____________ ______ m m m
Other industry fund (specify name/s)____________ ______ m m m
Other corporate fund (specify name/s)____________ ______ m m m
Other public sector fund (specify name/s)____________ ______ m m m
Other fund (specify name/s____________ ______ m m m
NOTE: Each fund option is selected via drop down, searchable menu with over 300
Australian superannuation funds, with notes of fund type, compiled from various lists of superannuation funds.112
Q27b - Q27b o I have one fund, but I can’t recall its name o I have more than one fund, but I can’t recall any of their names € I have named the fund(s) that I can remember above, but I have another fund / other
funds that I can’t recall the name of NOTE: Question 27 counted as two questions.
112 Compiled from: SuperGuide Superannuation Funds Guide — Search Results (SuperGuide)
<http://www.superguide.com.au> (searching for all categories of funds); ASFA Member Directory (ASFA: The Voice of Super) http://www.superannuation.asn.au/about-asfa/member-directory/alphabetical-listing.

Superannuation Knowledge, Behaviour and Attitudes in Young Adults in Australia 117
Q29 - Q29 From your own memory, what is your partner’s superannuation balance? (estimate if
needed) Please select ONE o ____________ o Don’t know / can’t say o No partner
Q30 - Q30 How many times have you switched superannuation funds? (‘Switching’ means closing
an account with a superannuation fund and transferring the balance to one or more other accounts with another superannuation fund).
Please select ONE o ____________ o Never changed o Don’t know / can’t say
Q31 - Q31 Which of the following investment options do you currently use with your
superannuation fund/s? Please select ALL that apply € Default option € Growth option € Balanced option € Conservative option € Cash only option € Other:____________ o Don’t know / can’t say
Q32 - Q32 How many times have you made a voluntary contribution to your superannuation fund? Please select ONE € ____________ € Have never made a voluntary contribution € Did not know that you could make voluntary contributions o Don’t know / can’t say
Q33 - Q33 If you do voluntary contribute, in total, how much money do you think you have
voluntarily contributed to your superannuation fund(s)? Please select ONE o ____________ o Do not voluntarily contribute
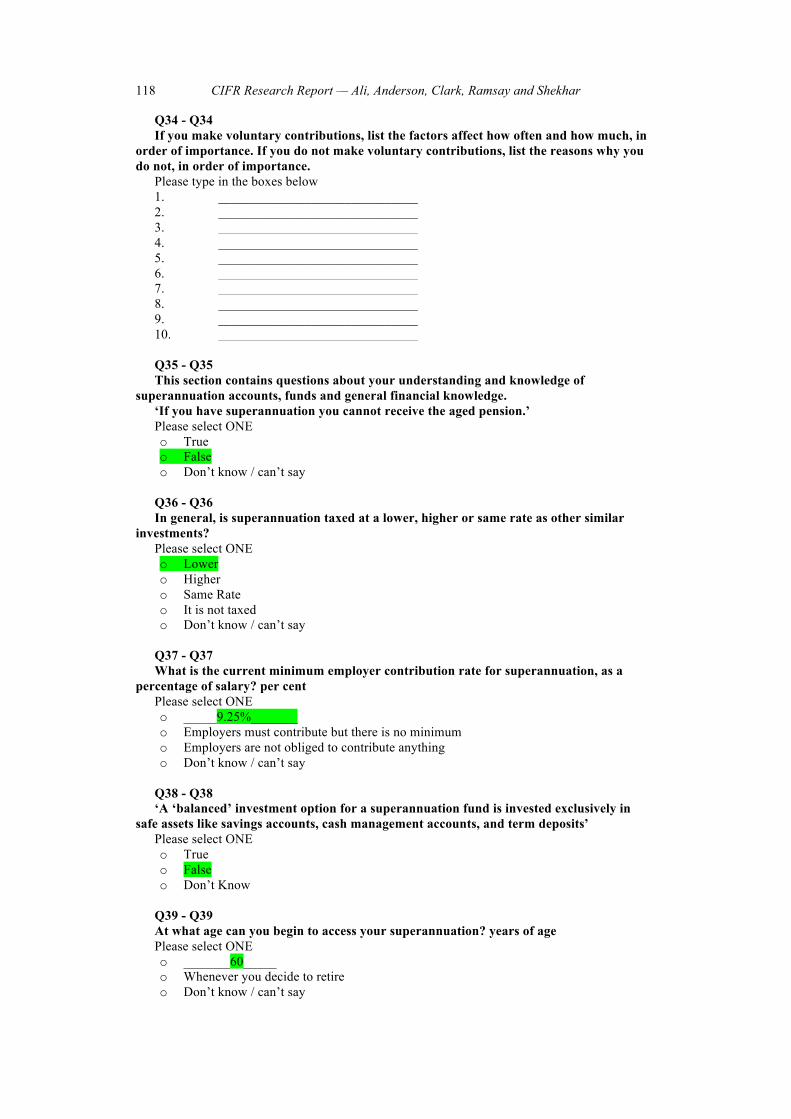
118 CIFR Research Report — Ali, Anderson, Clark, Ramsay and Shekhar
Q34 - Q34 If you make voluntary contributions, list the factors affect how often and how much, in
order of importance. If you do not make voluntary contributions, list the reasons why you do not, in order of importance.
Please type in the boxes below 1. ______________________________ 2. ______________________________ 3. ______________________________ 4. ______________________________ 5. ______________________________ 6. ______________________________ 7. ______________________________ 8. ______________________________ 9. ______________________________ 10. ______________________________ Q35 - Q35 This section contains questions about your understanding and knowledge of
superannuation accounts, funds and general financial knowledge. ‘If you have superannuation you cannot receive the aged pension.’ Please select ONE o True o False o Don’t know / can’t say
Q36 - Q36 In general, is superannuation taxed at a lower, higher or same rate as other similar
investments? Please select ONE o Lower o Higher o Same Rate o It is not taxed o Don’t know / can’t say
Q37 - Q37 What is the current minimum employer contribution rate for superannuation, as a
percentage of salary? per cent Please select ONE o _____9.25%_______ o Employers must contribute but there is no minimum o Employers are not obliged to contribute anything o Don’t know / can’t say
Q38 - Q38 ‘A ‘balanced’ investment option for a superannuation fund is invested exclusively in
safe assets like savings accounts, cash management accounts, and term deposits’ Please select ONE o True o False o Don’t Know
Q39 - Q39 At what age can you begin to access your superannuation? years of age Please select ONE o _______60_____ o Whenever you decide to retire o Don’t know / can’t say

Superannuation Knowledge, Behaviour and Attitudes in Young Adults in Australia 119
Q40 - Q40 The best indicator of superannuation fund performance is: Please select ONE o High overall returns o Low overall fees and charges. o Returns minus fees and charges o Don’t know / can’t say
Q41 - Q41 If you had $100 in a savings account, and the interest rate was 2% per year, then how
much money would you have after 5 years (assuming that you don’t withdraw anything from the account)?
Please select ONE o More than $102 o Exactly $102 o Less than $102 o Don’t know / can’t say
Q42 - Q42 If the interest rate on your savings account was 1% per year, but inflation was 2% per
year, after one year, would you be able to buy: Please select ONE o More than today o Exactly the same as today o Less than today o Don’t Know / can’t Say
Q43 - Q43 ‘Buying shares in a single company is a less risky investment than putting money into a
share investment fund’ Please select ONE o True o False o Don’t know / can’t say
Q44 - Q44 This section contains questions about your attitudes and views on superannuation and
retirement. How would you describe your knowledge of personal financial issues in general? Please select ONE o Strong knowledge o Moderate knowledge o Weak knowledge o No knowledge
Q45 - Q45 How well informed about superannuation would you say you were? Please select ONE o Very well informed o Fairly well informed o Not very well informed o Not informed at all
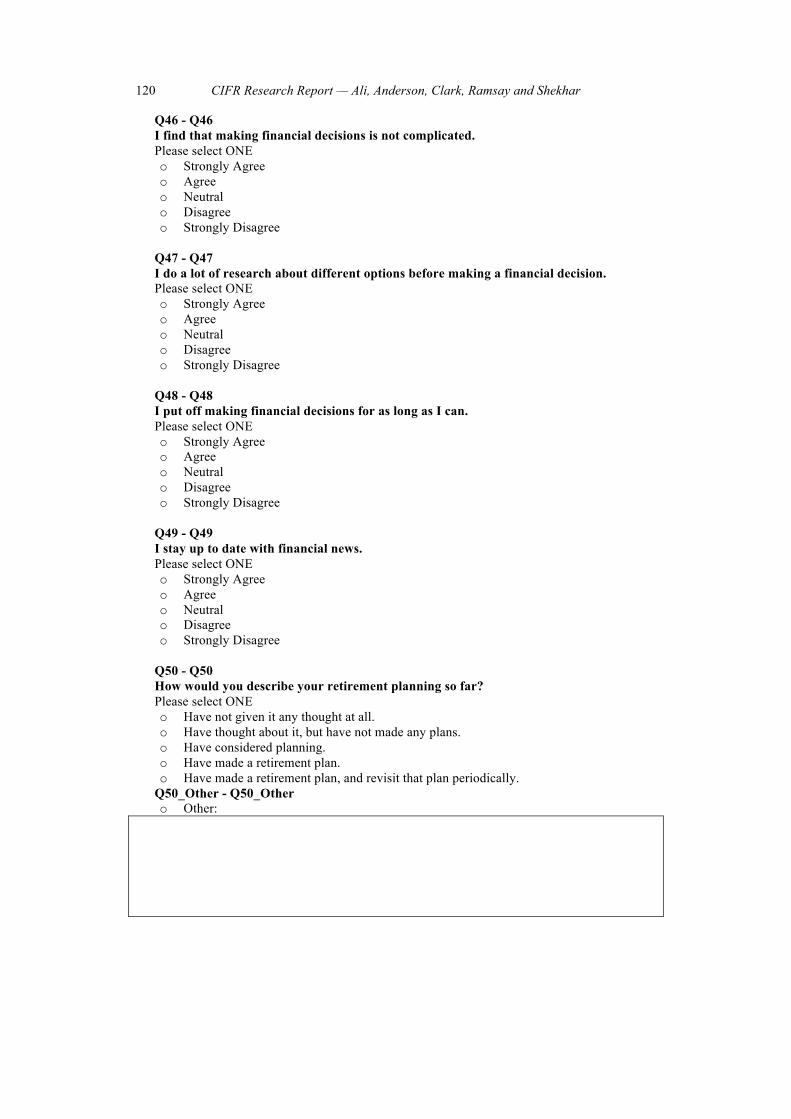
120 CIFR Research Report — Ali, Anderson, Clark, Ramsay and Shekhar
Q46 - Q46 I find that making financial decisions is not complicated. Please select ONE o Strongly Agree o Agree o Neutral o Disagree o Strongly Disagree
Q47 - Q47 I do a lot of research about different options before making a financial decision. Please select ONE o Strongly Agree o Agree o Neutral o Disagree o Strongly Disagree
Q48 - Q48 I put off making financial decisions for as long as I can. Please select ONE o Strongly Agree o Agree o Neutral o Disagree o Strongly Disagree
Q49 - Q49 I stay up to date with financial news. Please select ONE o Strongly Agree o Agree o Neutral o Disagree o Strongly Disagree
Q50 - Q50 How would you describe your retirement planning so far? Please select ONE o Have not given it any thought at all. o Have thought about it, but have not made any plans. o Have considered planning. o Have made a retirement plan. o Have made a retirement plan, and revisit that plan periodically.
Q50_Other - Q50_Other o Other:
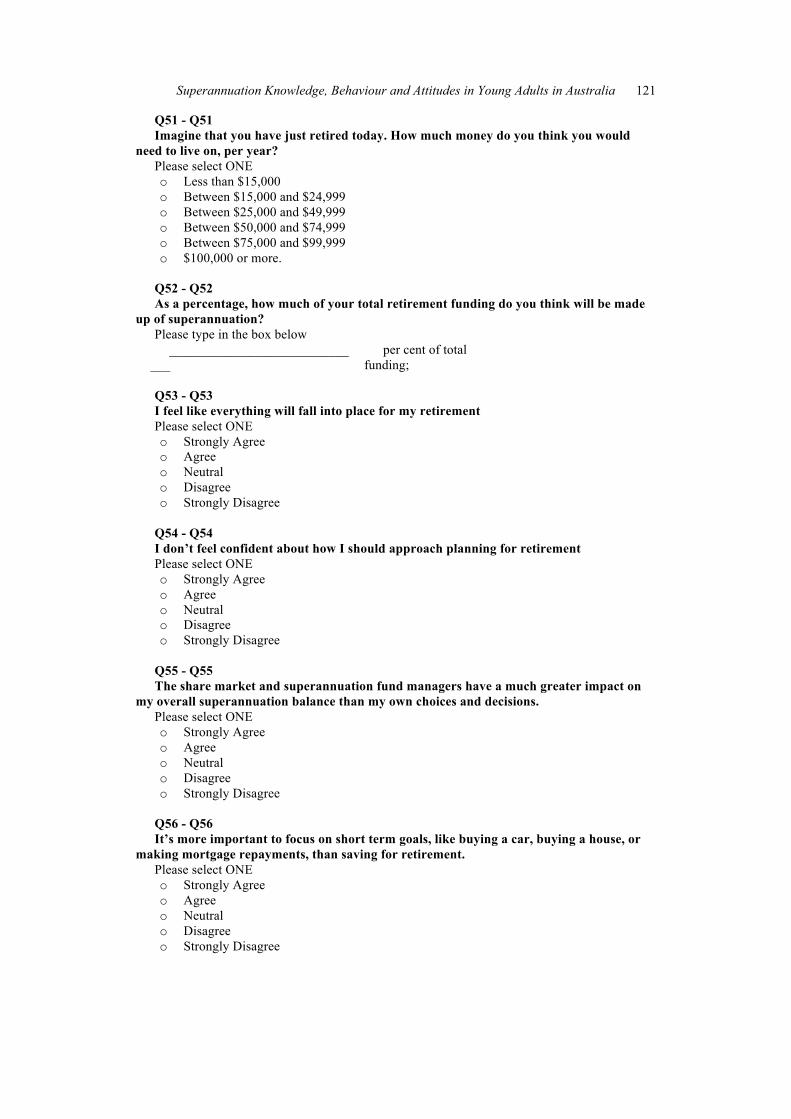
Superannuation Knowledge, Behaviour and Attitudes in Young Adults in Australia 121
Q51 - Q51 Imagine that you have just retired today. How much money do you think you would
need to live on, per year? Please select ONE o Less than $15,000 o Between $15,000 and $24,999 o Between $25,000 and $49,999 o Between $50,000 and $74,999 o Between $75,000 and $99,999 o $100,000 or more.
Q52 - Q52 As a percentage, how much of your total retirement funding do you think will be made
up of superannuation? Please type in the box below ___________________________
___ per cent of total
funding; Q53 - Q53 I feel like everything will fall into place for my retirement Please select ONE o Strongly Agree o Agree o Neutral o Disagree o Strongly Disagree
Q54 - Q54 I don’t feel confident about how I should approach planning for retirement Please select ONE o Strongly Agree o Agree o Neutral o Disagree o Strongly Disagree
Q55 - Q55 The share market and superannuation fund managers have a much greater impact on
my overall superannuation balance than my own choices and decisions. Please select ONE o Strongly Agree o Agree o Neutral o Disagree o Strongly Disagree
Q56 - Q56 It’s more important to focus on short term goals, like buying a car, buying a house, or
making mortgage repayments, than saving for retirement. Please select ONE o Strongly Agree o Agree o Neutral o Disagree o Strongly Disagree

122 CIFR Research Report — Ali, Anderson, Clark, Ramsay and Shekhar
Q57 - Q57 This section contains additional questions on how you interact with your
superannuation account(s), advice you might have sought about superannuation and finance generally, and your views on the current superannuation scheme. How often do you check your superannuation account?
Please select ONE o Only when I receive a statement. o Daily o Weekly o Monthly o Every few months o Every six months o Yearly o Hardly ever o Never have
Q58 - Q58 How often do you make changes to your superannuation fund investment options? Please select ONE o Only when I receive a statement o Daily o Weekly o Monthly o Every few months o Every six months o Yearly o Hardly ever o Never have
Q59 - Q59 Which of the following forms of financial advice have you received in the last 12
months? Please select ALL that apply € Paid for professional financial advice about mortgages or investments € Paid for professional financial advice about retirement or superannuation € Attended a financial education seminar (employer provided) € Attended a financial education seminar (superannuation fund provided) € Attended a financial education seminar (own motivation)
€ Sought advice from my bank about mortgages € Sought advice from my bank about investments € Sought advice from my bank about superannuation € Sought advice from my superannuation fund about superannuation or retirement € Sought advice from my union about financial planning
€ Visited an internet site for advice on superannuation (please specify the
site/sites)____________ € Read a newspaper or magazine article on superannuation (please specify the
publication/s)____________ € Read a business-focused newspaper, magazine, website or blog (please specify the
publication/s)____________ € Talked to parent(s) about mortgages € Talked to parent(s) about investments € Talked to parent(s) about superannuation and retirement
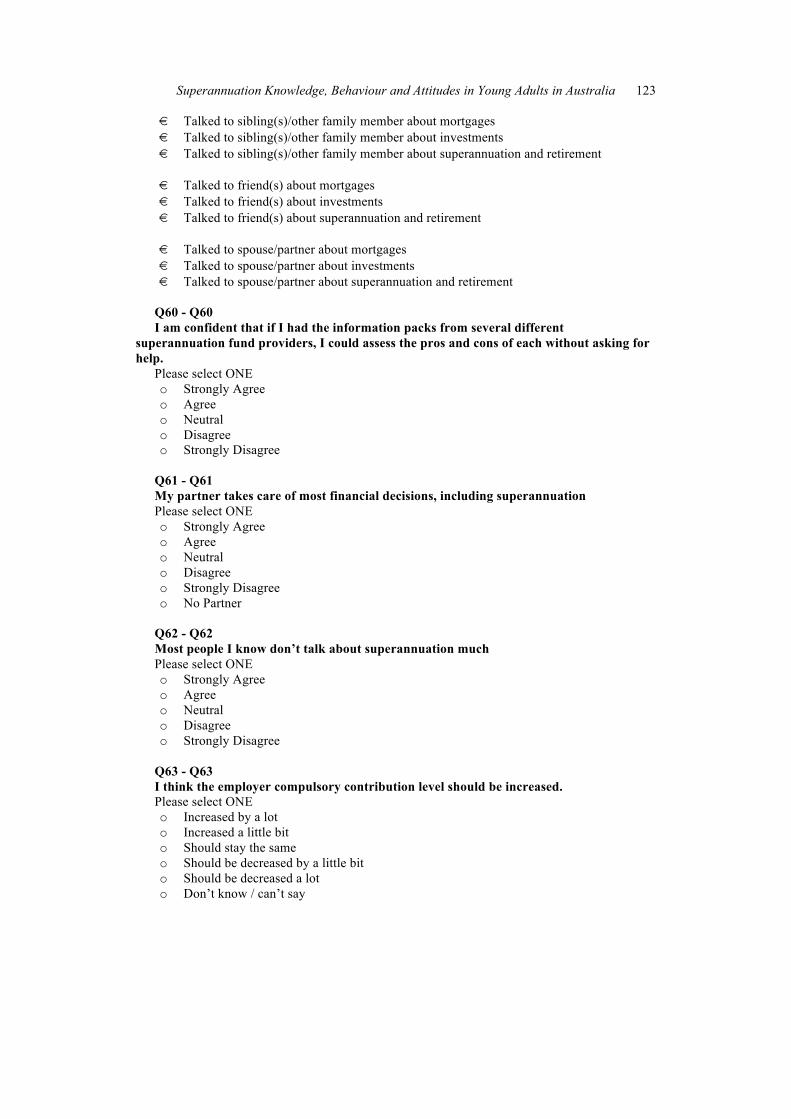
Superannuation Knowledge, Behaviour and Attitudes in Young Adults in Australia 123
€ Talked to sibling(s)/other family member about mortgages € Talked to sibling(s)/other family member about investments € Talked to sibling(s)/other family member about superannuation and retirement
€ Talked to friend(s) about mortgages € Talked to friend(s) about investments € Talked to friend(s) about superannuation and retirement
€ Talked to spouse/partner about mortgages € Talked to spouse/partner about investments € Talked to spouse/partner about superannuation and retirement
Q60 - Q60 I am confident that if I had the information packs from several different
superannuation fund providers, I could assess the pros and cons of each without asking for help.
Please select ONE o Strongly Agree o Agree o Neutral o Disagree o Strongly Disagree
Q61 - Q61 My partner takes care of most financial decisions, including superannuation Please select ONE o Strongly Agree o Agree o Neutral o Disagree o Strongly Disagree o No Partner
Q62 - Q62 Most people I know don’t talk about superannuation much Please select ONE o Strongly Agree o Agree o Neutral o Disagree o Strongly Disagree
Q63 - Q63 I think the employer compulsory contribution level should be increased. Please select ONE o Increased by a lot o Increased a little bit o Should stay the same o Should be decreased by a little bit o Should be decreased a lot o Don’t know / can’t say
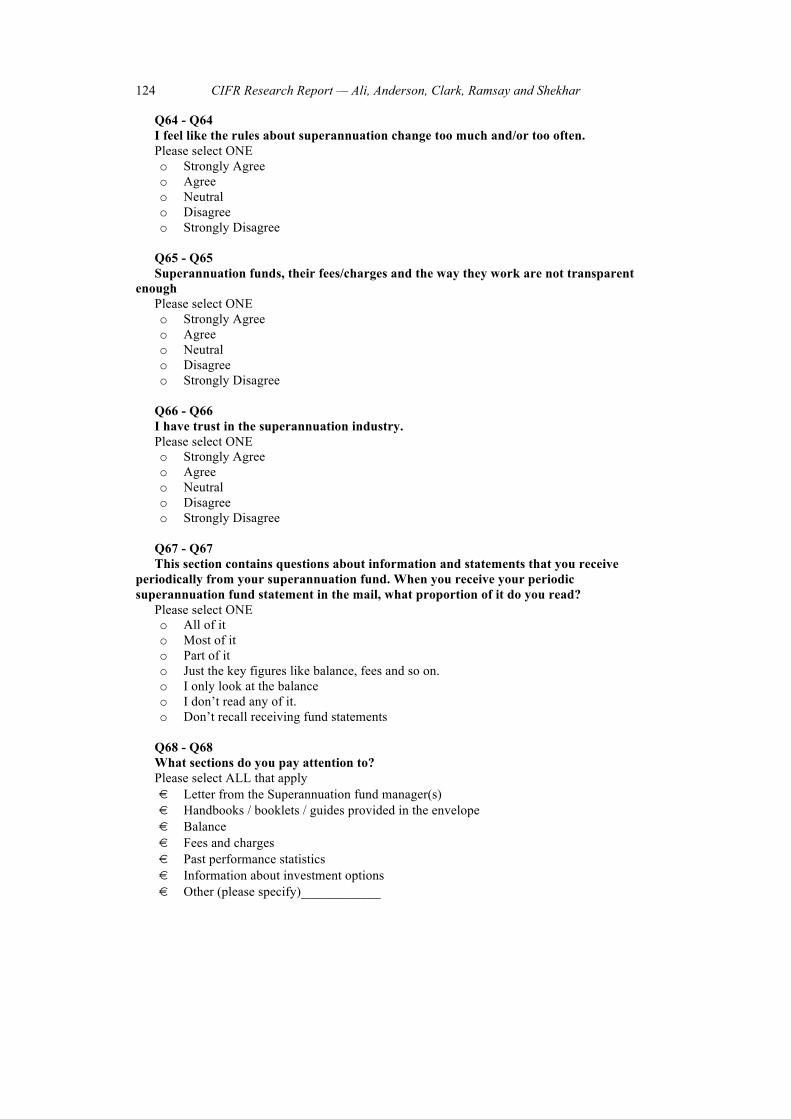
124 CIFR Research Report — Ali, Anderson, Clark, Ramsay and Shekhar
Q64 - Q64 I feel like the rules about superannuation change too much and/or too often. Please select ONE o Strongly Agree o Agree o Neutral o Disagree o Strongly Disagree
Q65 - Q65 Superannuation funds, their fees/charges and the way they work are not transparent
enough Please select ONE o Strongly Agree o Agree o Neutral o Disagree o Strongly Disagree
Q66 - Q66 I have trust in the superannuation industry. Please select ONE o Strongly Agree o Agree o Neutral o Disagree o Strongly Disagree
Q67 - Q67 This section contains questions about information and statements that you receive
periodically from your superannuation fund. When you receive your periodic superannuation fund statement in the mail, what proportion of it do you read?
Please select ONE o All of it o Most of it o Part of it o Just the key figures like balance, fees and so on. o I only look at the balance o I don’t read any of it. o Don’t recall receiving fund statements
Q68 - Q68 What sections do you pay attention to? Please select ALL that apply € Letter from the Superannuation fund manager(s) € Handbooks / booklets / guides provided in the envelope € Balance € Fees and charges € Past performance statistics € Information about investment options € Other (please specify)____________

Superannuation Knowledge, Behaviour and Attitudes in Young Adults in Australia 125
Q69 - Q69 If you don’t read any or all of the periodic statement, why not? Please type in the box below
Q70 - Q70 I find that reading and understanding my periodic statement is easy Please select ONE o Strongly Agree o Agree o Neutral o Disagree o Strongly Disagree
Q71 - Q71 I think I pay sufficient attention to my superannuation account Please select ONE o Strongly Agree o Agree o Neutral o Disagree o Strongly Disagree
Q72 - Q72 In order of importance, what are your top financial priorities/concerns, at this point in
your life? Please type in the boxes below 1. ______________________________ 2. ______________________________ 3. ______________________________ 4. ______________________________ 5. ______________________________ Q73 - Q73 In choosing a superannuation fund, what factors do you think are important? Did those
factors influence your current fund choice? If you didn’t consider particular factors, why not?
Please type in the box below

126 CIFR Research Report — Ali, Anderson, Clark, Ramsay and Shekhar
Q74 - Q74 How, if at all, would you change the way superannuation fund providers operate? (If
you would change nothing or very little, what do you think superannuation fund providers do well, and why?)
Please type in the box below
Q75 - Q75 What do you find difficult about managing your superannuation and planning for
retirement? (If you find managing superannuation and retirement planning easy, please outline what your planning involved).
Please type in the box below
Feedback - Survey Feedback (Pure Profile pro forma text)
That is all the questions we have for you today. Before you finish, we would like to ask for any feedback or suggestions you have on our online survey. Any comments are appreciated and will help us to improve our future surveys.
Please answer in the textbox given below.