ARIZONA ANGLERS' OPINIONS, ATTITUDES, AND ...
183
ARIZONA ANGLERS’ OPINIONS, ATTITUDES, AND EXPENDITURES IN THE STATE Conducted for the Arizona Game and Fish Department by Responsive Management 2014
-
Upload
khangminh22 -
Category
Documents
-
view
2 -
download
0
Transcript of ARIZONA ANGLERS' OPINIONS, ATTITUDES, AND ...
ARIZONA ANGLERS’ OPINIONS, ATTITUDES, AND EXPENDITURES IN THE STATE
Conducted for the Arizona Game and Fish Department
by Responsive Management
2014

ARIZONA ANGLERS’ OPINIONS, ATTITUDES, AND EXPENDITURES IN THE STATE
2014
Responsive Management National Office Mark Damian Duda, Executive Director
Martin Jones, Senior Research Associate Tom Beppler, Research Associate
Steven J. Bissell, Ph.D., Qualitative Research Associate Andrea Criscione, Research Associate Patrick Doherty, Research Associate
Gregory L. Hughes, P.E., Research Associate Eva Meadows, Survey Center Manager
Alison Lanier, Business Manager
130 Franklin Street Harrisonburg, VA 22801
Phone: 540/432-1888 Fax: 540/432-1892 E-mail: [email protected]
www.responsivemanagement.com
Acknowledgments
Responsive Management would like to thank Loren Chase, Todd Pringle, Chris Cantrell, and Marianne Cox of the Arizona Game and Fish Department for their input, support, and guidance
on this project.

Arizona Anglers’ Opinions, Attitudes, and Expenditures in the State i
EXECUTIVE SUMMARY INTRODUCTION AND METHODOLOGY This study was conducted for the Arizona Game and Fish Department (hereinafter referred to as
the Department) to determine anglers’ opinions on various regulations, their satisfactions and
dissatisfactions with fishing in Arizona, their fishing locations and methods typically used, and
their fishing-related expenditures in Arizona in 2013. The study entailed a multi-modal survey
of Arizona anglers.
The survey obtained data from a scientifically selected random sample, stratified by county,
using telephone and Internet modes. The survey questionnaire was developed cooperatively by
Responsive Management and the Department. Responsive Management conducted pre-tests of
the questionnaire to ensure proper wording, flow, and logic in the survey.
The database of Arizona anglers was obtained from the Department, from which the sample was
randomly drawn, stratified by county. The sample was representative of all anglers who bought
a license in each county, as well as those from outside the state. After the sample database
(licensed anglers in Arizona) had been obtained, the first step in the survey process was to
remove duplicate people from the sample database (e.g., the same person who bought two types
of licenses), update the information in the database (updating incorrect addresses when a
forwarding address or correct address could be found and removing invalid addresses), and
acquire valid telephone numbers through a professional service that matches telephone numbers
to addresses.
The researchers then chose the survey sample from the sample database, stratified among the
counties, but randomly chosen within the counties. The survey sample was stratified among the
counties to attempt to reach specified goals for each county. Only after the sample was selected
were potential respondents given the choice of survey modes.
Simultaneous to the work being done to prepare the survey sample, the researchers designed a
postcard to be sent to respondents asking for their participation in the survey. The postcard
featured the Department logo, the Internet address for the online survey, a quick response (QR)

ii Responsive Management
code to access the survey from mobile devices, a toll-free telephone number to take the survey
by telephone, and Spanish instructions with a number to take the survey in Spanish. The
postcard also told of a drawing for a lifetime license as an incentive for respondents to complete
the survey.
The first wave of postcards was sent to the survey sample that had been chosen. The postcard
encouraged participation in the survey and offered two modes (telephone and Internet) for
completing the survey. A month after the first wave was sent, a second wave of postcards was
sent, and it included anglers who had received the first mailing. This second sample was also
apportioned among the counties to obtain the specified goal of completed interviews in each
county in Arizona, and it was increased over the first sample to account for the high number of
invalid records in the database obtained from the Department.
After the second wave of postcards, Responsive Management called those who had been
contacted in one or both of the waves but had not completed the survey. During these calls, the
interviewer encouraged participation through the Internet or offered to conduct the survey by
telephone at that time. In addition, Spanish interviews were completed at this time, based on
those in the survey sample who had called the Spanish telephone contact number.
For the telephone portion of the survey, eligible surveying times were Monday through Friday
from 9:00 a.m. to 9:00 p.m., Saturday from noon to 5:00 p.m., and Sunday from 5:00 p.m. to
9:00 p.m., local time. The Internet surveys, obviously, could be completed at any time of the day
convenient for the respondent.
The software used for telephone data collection was Questionnaire Programming Language. The
Internet portion of the survey used a commercial site that specializes in survey research for the
data collection.
The survey was conducted from November 25, 2013, to January 14, 2014. At the conclusion of
the survey period, Responsive Management had obtained 6,414 total completed surveys. The
analysis of data was performed using Statistical Package for the Social Sciences as well as

Arizona Anglers’ Opinions, Attitudes, and Expenditures in the State iii
proprietary software developed by Responsive Management. Throughout this report, findings of
the telephone survey are reported at a 95% confidence interval. For the entire statewide sample
of Arizona anglers, the sampling error is at most plus or minus 1.21 percentage points.
SPECIES FISHED AND SPECIES INFORMATION One of the first questions in the survey asked anglers in the database (licensed anglers) if
they had fished in 2013: 88% had done so. These 88% are hereinafter referred to as “active
anglers.”
The most popular species fished, by far, are trout and bass. Among active anglers, 69%
fished for trout overall (68% for non-native such as rainbow, and 17% for native trout) and
63% fished for bass (58% for largemouth or smallmouth bass, and 21% for striped bass).
• Also of importance are catfish (30% overall, 26% for channel, and 15% for flathead),
crappie (21%) and sunfish (13%).
An analysis was run based on three questions: the species fished, the days fished, and the
percent of time spent fishing for each species.
• Bass and trout account for the most fishing days: smallmouth/largemouth bass were
fished for on 39.7% of angler days, and non-native trout were fished for 36.8% of angler
days in 2013.
o In multiplying the mean number of days by the number of anglers, the analysis finds
that anglers spent 2.55 million days fishing for smallmouth/largemouth bass, and 2.36
million days fishing for non-native trout in 2013.
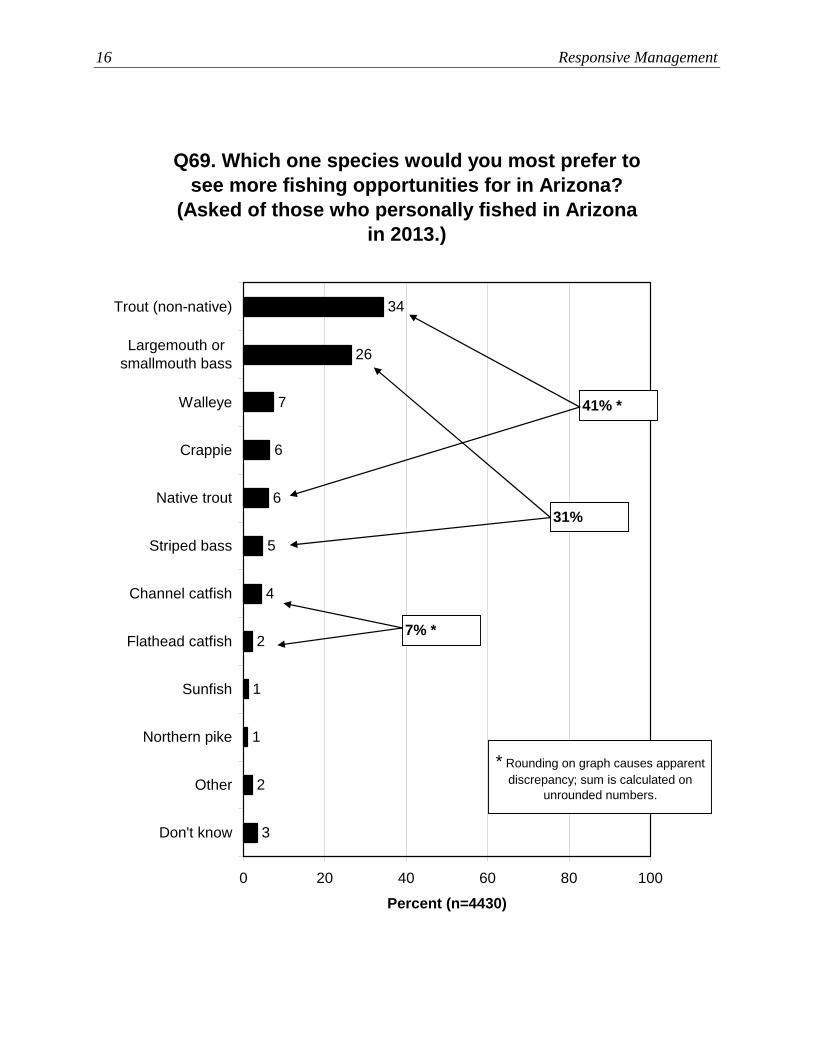
Finally, the survey asked active anglers to name their one preferred species to fish for in
Arizona. The most preferred species in the top tier are trout (41%) and bass (31%). In a
second tier are catfish (7%), walleye (7%), and crappie (6%).
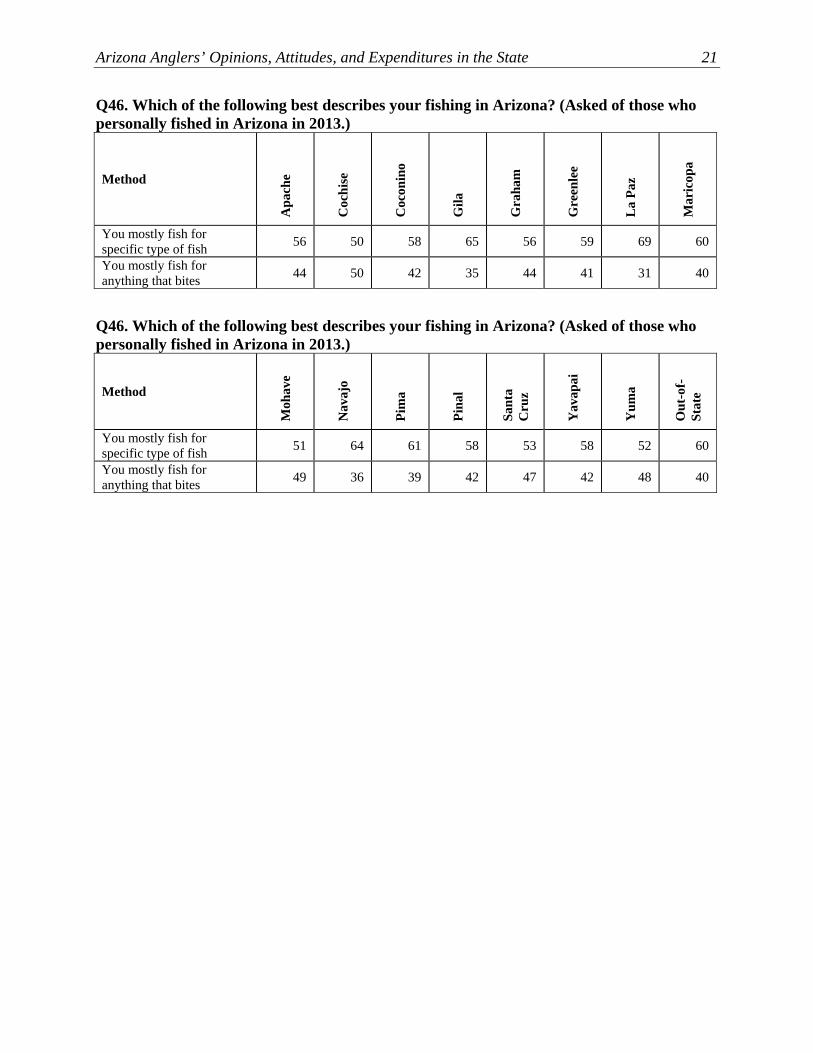
FISHING METHODS USED A majority of active anglers (59%) say that they mostly fish for specific types of fish rather
than anything that bites.
iv Responsive Management
Those active anglers who indicated that they “mostly fish for specific types of fish” (rather
than “anything that bites”) were asked to name all the various methods that they had used for
fishing in Arizona in 2013. Leading the list is lures (used by 73%), followed by live bait
(59%), other bait (50%), and flies (34%).
The survey asked those who had used live bait to indicate the percentage of time that they
spent using each of the four live types (worms/mealworms, minnows/other fish, waterdogs,
and crickets). Two live bait types account for the most live bait use: worms/mealworms
(used a mean of 76.1 percent of the time when using live bait) and minnows/other fish (mean
of 20.1 percent of the time when using live bait).
Anglers were asked about the six primary bait/equipment methods that they would prefer to
see more opportunities for in Arizona. The top one is live bait (33%), followed by lures
(26%), flies (16%), and other bait such as powerbait and cheese (10%).
Another question asked about catch-and-release, asking active anglers the percent of the fish
that they catch that they typically release. The mean percent of their responses is 61.0
percent, and this includes those 19% who release all their catch and 25% who keep all of
their catch. (Note that this does not mean that 61.0% of all fish that are caught are released,
because all respondents do not catch the same amount of fish.)
FISHING LOCATIONS Seven locations had nearly 10% or more of active anglers fishing there at some point in
2013: Roosevelt Lake (18.4%), Lake Pleasant (14.2%), Big Lake (12.3%), Canyon Lake
(9.8%), Bartlett Lake (9.6%), Woods Canyon Lake (9.6%), and Saguaro Lake (9.4%).
SATISFACTIONS AND DISSATISFACTIONS WITH FISHING IN ARIZONA A large majority of active anglers (83%) were satisfied with their overall 2013 fishing
experiences in Arizona; however, 11% were dissatisfied.

Arizona Anglers’ Opinions, Attitudes, and Expenditures in the State v
A series of questions asked about satisfaction or dissatisfaction with a variety of aspects of
fishing in Arizona, such as the amount of fish caught, the size of fish caught, or access to the
waters.
• The greatest satisfaction is with the variety of fish available (84% are satisfied), followed
by three more aspects with at least two-thirds being satisfied with it: level of access
(78%), consumption safety (69%), and availability of waters where bait can be used
(68%).
o The greatest dissatisfaction is with the number of fish caught (28% are dissatisfied)
and the size of the fish caught (22%). However, for each aspect, satisfaction leads
dissatisfaction, even for these with relatively high dissatisfaction.
Three questions asked active anglers about satisfaction or dissatisfaction with aspects of their
most recent fishing trip in Arizona.
• The most basic of the three questions asked active anglers about satisfaction or
dissatisfaction with their most recent fishing trip in Arizona overall: 74% were satisfied,
while 18% were dissatisfied.
• Another question asked about satisfaction or dissatisfaction with the number of fish
caught on their most recent trip: just more than half (52%) were satisfied, but more than
a third (37%) were dissatisfied.
• A final question about the most recent trip asked active anglers about their satisfaction or
dissatisfaction with the size of the fish they caught on their most recent trip: 53% were
satisfied, while 28% were dissatisfied.
PERCEPTIONS OF CROWDING AT FISHING AREAS Four questions asked about crowding overall in Arizona in 2013 when active anglers were
fishing. In general, ratings of crowding were relatively low (no higher than 3.31 on a 0 to 10
scale, with 0 being not at all crowded and 10 being extremely crowded). Nonetheless, not
insubstantial percentages gave a rating of higher than the midpoint (ranging from 13% to
19%). The highest mean rating was for crowding from other anglers (3.31); the highest
percentage above the midpoint was for crowding from personal watercraft (referred to as
PWC) operators (19% above the midpoint).

vi Responsive Management
Another question asked about crowding on active anglers’ most recent fishing trip in
Arizona. The mean rating was well below the midpoint, at 3.40. More than a fifth of active
anglers (22%) gave the question the lowest rating of 0, and a large majority (64%) gave a
rating below the midpoint. However, 21% gave a rating above the midpoint.
Three additional questions asked active anglers about their most recent fishing trip: the first
asked them how many other anglers not in their fishing party that they saw each day, the
second asked how many other anglers they expected to see, and the third asked them how
many other anglers would have been acceptable.
• Regarding the number of other anglers that they saw, the answers range widely from no
other anglers to more than 50. The mean number is 17.8 other anglers, and the median
answer is 10 other anglers.
• It would appear that active anglers saw about the number of other anglers that they
expected to see: the mean is 18.7 other anglers, and the median is 10 other anglers.
• Although active anglers saw about the number of anglers they expected to see, it is worth
noting that the number they saw, in general, is close to their threshold. When asked
about the number of other anglers that would be acceptable to see, the mean is 21.6 other
anglers, and the median is 12 other anglers, not much greater than what active anglers
actually saw.
• An analysis put two of these questions together, finding that 18% saw more other anglers
than their threshold, 29% saw the same as their threshold, and 42% saw fewer other
anglers than their threshold.
Another question specific to active anglers’ last trip found that they were about evenly split
regarding whether other anglers not in their fishing party were using or wanted to use the
same fishing area that they (the respondents) were using. When presented with the
statement, “Other anglers not in my fishing party wanted to use or were using the same
fishing areas that I was using during my fishing trip to * ”, 43% of active anglers
agreed, while 37% disagreed—a difference of only 6 percentage points.
• * The survey inserted the name of the location of each angler’s most recent fishing trip in
the question, based on his/her earlier answer in the survey about the location.

Arizona Anglers’ Opinions, Attitudes, and Expenditures in the State vii
OPINIONS ON REGULATIONS IN GENERAL AND THE REGULATIONS BOOKLET Anglers were asked about the restrictiveness of Arizona’s fishing regulations, and the large
majority are fine with the level of restrictiveness: 74% say the regulations should be about
the same as they currently are vis-à-vis restrictiveness. Otherwise, 5% say that they should
be more restrictive while 15% say that they should be less restrictive.
The clarity of the regulations does not seem to be a problem, as 89% of anglers agree that the
regulations are clear and easy to understand. Only 4% disagree.
The questions above were about the regulations themselves; one question, however,
specifically asked about the ease of use of the regulations booklet. A large majority of
anglers (83%) agree that the regulations booklet is easy to use, while only 3% disagree.
Two open-ended questions (in which no answer set was given but to which respondents
could have given any response that came to mind) asked about the things that are most liked
about the regulations booklet and the things that are least liked (i.e., disliked).
• The most liked thing about the regulations booklet is the layout/that it is easy to read (the
top-named item at 38%). Other responses include the specific information about water
bodies/maps (11%), that it is easily accessible, including online (9%), that it is thorough
(9%), and the information about fish species (8%).
• Regarding the least liked things about the regulations booklet, no item was named by
more than 8% of anglers. The top item is that it is perceived as too long/wordy.
OPINIONS ON BAG LIMITS
Trout anglers were asked about their support for or opposition to various trout bag limits.
The trout anglers were randomly assigned into six groups; each group was given one of the
potential limits from 0 (allowing none to be kept) to 5, after being told that the current limit
is 6 trout.
• For trout bag limits of 0 through 3, opposition far exceeds support. At a limit of 4 trout,
support and opposition are about the same. At the limit of 5 trout, support far exceeds

viii Responsive Management
opposition. Based on the data, any limit of less than 4 trout will be met with much
opposition.
In a similar fashion, catfish anglers were asked about various catfish limits, after being told
that the current limit is 25 per day. They were asked about limits of 5, 10, 15, and 20 catfish.
• At the lowest limit of 5 catfish, support and opposition are the same (both at 38%). At
higher limits, support far exceeds opposition, with a majority supporting each limit over 5
(limits of 10, 15, and 20). At the highest limit of 20, only 2% of catfish anglers are in
opposition.
Finally, the survey asked about crappie limits (currently there is no limit). The survey asked
about possible limits of 10, 15, 20, and 25 crappie.
• Opposition just slightly exceeds support at the lowest limit asked about (10 crappie). At
all higher limits, support far exceeds opposition, with a majority in support of each limit
above 10 crappie. At the highest limit of 25 crappie, only 7% oppose.
OPINIONS ON MANAGEMENT STRATEGY The survey asked active anglers if they would prefer catching a few larger fish (i.e., manage
for quality over quantity) or catching many smaller fish (i.e., manage for quantity over
quality) when they go fishing. The former is preferred by a majority: 71% say that they
would rather go fishing where they can catch a few larger fish.
THE DEPARTMENT’S FISHING REPORT Just about half of Arizona’s anglers (52%) have used the Fishing Report on the Department’s
website. • Of those who have used the Fishing Report, a little under half (43%) find it very useful,
and another 52% find it somewhat useful. Only 5% say that it has no utility.
Arizona Anglers’ Opinions, Attitudes, and Expenditures in the State ix
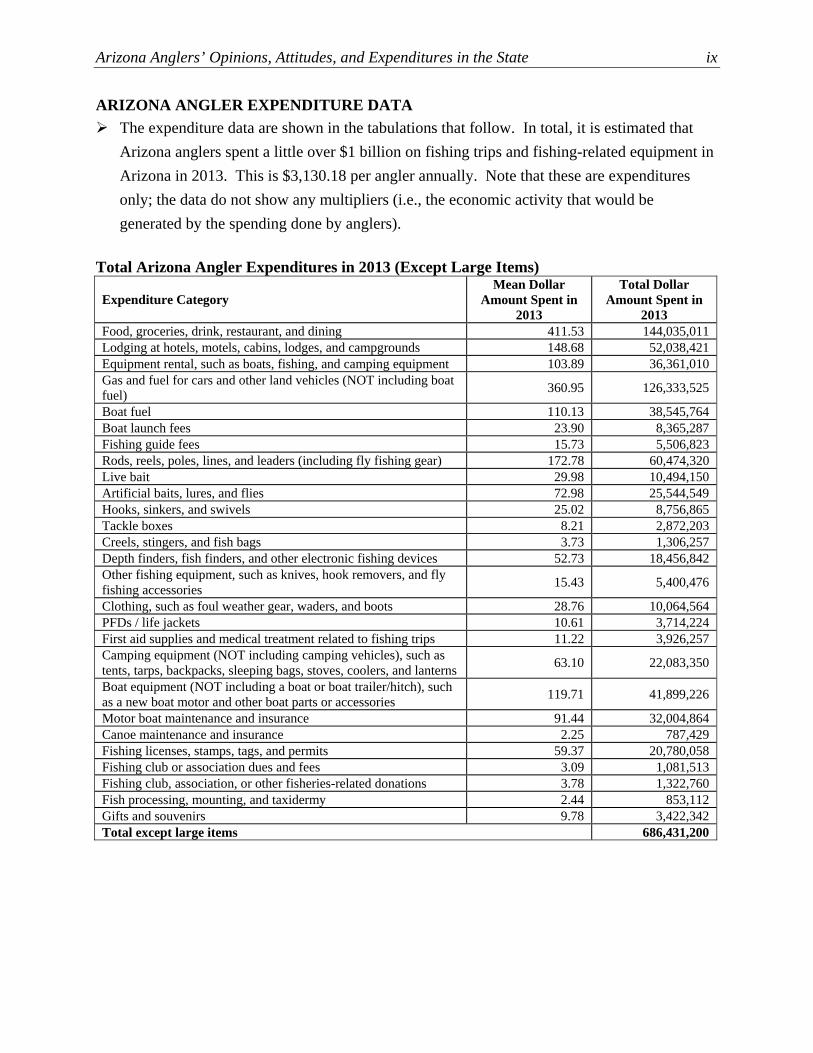
ARIZONA ANGLER EXPENDITURE DATA The expenditure data are shown in the tabulations that follow. In total, it is estimated that
Arizona anglers spent a little over $1 billion on fishing trips and fishing-related equipment in Arizona in 2013. This is $3,130.18 per angler annually. Note that these are expenditures only; the data do not show any multipliers (i.e., the economic activity that would be generated by the spending done by anglers).
Total Arizona Angler Expenditures in 2013 (Except Large Items)
Expenditure Category Mean Dollar
Amount Spent in 2013
Total Dollar Amount Spent in
2013 Food, groceries, drink, restaurant, and dining 411.53 144,035,011 Lodging at hotels, motels, cabins, lodges, and campgrounds 148.68 52,038,421 Equipment rental, such as boats, fishing, and camping equipment 103.89 36,361,010 Gas and fuel for cars and other land vehicles (NOT including boat fuel) 360.95 126,333,525
Boat fuel 110.13 38,545,764 Boat launch fees 23.90 8,365,287 Fishing guide fees 15.73 5,506,823 Rods, reels, poles, lines, and leaders (including fly fishing gear) 172.78 60,474,320 Live bait 29.98 10,494,150 Artificial baits, lures, and flies 72.98 25,544,549 Hooks, sinkers, and swivels 25.02 8,756,865 Tackle boxes 8.21 2,872,203 Creels, stingers, and fish bags 3.73 1,306,257 Depth finders, fish finders, and other electronic fishing devices 52.73 18,456,842 Other fishing equipment, such as knives, hook removers, and fly fishing accessories 15.43 5,400,476
Clothing, such as foul weather gear, waders, and boots 28.76 10,064,564 PFDs / life jackets 10.61 3,714,224 First aid supplies and medical treatment related to fishing trips 11.22 3,926,257 Camping equipment (NOT including camping vehicles), such as tents, tarps, backpacks, sleeping bags, stoves, coolers, and lanterns 63.10 22,083,350
Boat equipment (NOT including a boat or boat trailer/hitch), such as a new boat motor and other boat parts or accessories 119.71 41,899,226
Motor boat maintenance and insurance 91.44 32,004,864 Canoe maintenance and insurance 2.25 787,429 Fishing licenses, stamps, tags, and permits 59.37 20,780,058 Fishing club or association dues and fees 3.09 1,081,513 Fishing club, association, or other fisheries-related donations 3.78 1,322,760 Fish processing, mounting, and taxidermy 2.44 853,112 Gifts and souvenirs 9.78 3,422,342 Total except large items 686,431,200

x Responsive Management
Total Arizona Angler Expenditures in 2013
All Expenditures in Total Total Dollar
Amount Spent in 2013
All except large items (from first table in this section) 686,431,200 Boats (except Canoes/Kayaks) 98,684,828 Trailers 38,060,367 Campers 78,885,156 ATVs 4,570,855 Trucks/Jeeps 152,598,455 Cabins 11,256,497 Canoes/Kayaks 2,895,162 Motors/Vehicle Parts 3,002,219 Other 9,115,313 Total 1,085,500,052 Mean per Angler* 3,130.18 *Based on approximately 350,000 licensed anglers who may make fishing-related purchases in the state
PARTICIPATION IN OUTDOOR RECREATION IN GENERAL An open-ended question asked anglers to indicate other outdoor recreation activities that they
enjoy. The most common are hunting (51% participate), hiking/backpacking (25%), and
camping (20%). A second tier consists of golf (8%), ATVing/off-roading (8%), boating
(6%), bicycling (6%), and shooting (5%).
• Anglers were asked to compare the importance of fishing to their other recreation
activities. For a majority of anglers (60%), fishing is either their most important
recreational activity or one of their most important activities.

Arizona Anglers’ Opinions, Attitudes, and Expenditures in the State xi
TABLE OF CONTENTS Introduction and Methodology ........................................................................................................1
Survey Modes..........................................................................................................................1 Questionnaire Design ..............................................................................................................1 Survey Sample.........................................................................................................................1 Survey Administration and Data Management .......................................................................2
Preparation of Database ..................................................................................................2 Postcards .........................................................................................................................3 Contacting the Sample ....................................................................................................3 Polling and Data Management Facilities ........................................................................4 Administering the Survey and Quality Control ..............................................................4
Data Analysis...........................................................................................................................5 Sampling Errors and Response Rate .......................................................................................7 Additional Information About the Presentation of Results in the Report ...............................8
Species Fished and Species Information........................................................................................10 Fishing Methods Used ...................................................................................................................18 Fishing Locations...........................................................................................................................44 Satisfactions and Dissatisfactions With Fishing in Arizona ..........................................................67 Perceptions of Crowding at Fishing Areas ....................................................................................86 Opinions on Regulations in General and the Regulations Booklet..............................................109 Opinions on Bag Limits ...............................................................................................................120 Opinions on Management Strategy..............................................................................................130 The Department’s Fishing Report................................................................................................132 Arizona Angler Expenditure Data ...............................................................................................136 Participation in Outdoor Recreation in General...........................................................................140 Characteristics of Anglers............................................................................................................149 Demographic Data .......................................................................................................................158 About Responsive Management ..................................................................................................168

Arizona Anglers’ Opinions, Attitudes, and Expenditures in the State 1
INTRODUCTION AND METHODOLOGY This study was conducted for the Arizona Game and Fish Department (hereinafter referred to as
the Department) to determine anglers’ opinions on various regulations, their satisfactions and
dissatisfactions with fishing in Arizona, their fishing locations and methods typically used, and
their fishing-related expenditures in Arizona in 2013. The study entailed a multi-modal survey
of Arizona anglers. Specific aspects of the research methodology are discussed below.
SURVEY MODES The survey obtained data by telephone and the Internet. This approach allowed for a large
number of anglers to be surveyed while still maintaining the representativeness of the sample.
The multi-modal approach is also the most convenient for the respondents.
QUESTIONNAIRE DESIGN The survey questionnaire was developed cooperatively by Responsive Management and the
Department, based on the research team’s familiarity with fishing, outdoor recreation, and
natural resources. Responsive Management conducted pre-tests of the questionnaire to ensure
proper wording, flow, and logic in the survey.
In some places in the survey, a subset was randomly taken from the entire sample and asked
certain questions; other subsets were asked other questions. This allowed for an extensive
survey without any single respondent having to go through the entire survey, which would have
been prohibitively long. Note that other questions were asked of everybody in the survey.
SURVEY SAMPLE The sample of Arizona anglers was obtained from the Department. The sample was
representative of all anglers who bought a license in the state, and it included both resident and
nonresident licenses. The sample was stratified by county (for residents by their county of
residence) with the goal being a large enough sample size in each county to be statistically valid.
A sample of nonresidents was also surveyed. The tabulation on the following page shows
sampling goal for each county and for nonresidents.

2 Responsive Management
Sampling Goal in Each County County Goal County Goal County Goal Apache 317 Greenlee 317 Pima 599Cochise 317 La Paz 317 Pinal 384Coconino 384 Maricopa 679 Santa Cruz 317Gila 317 Mohave 384 Yavapai 384Graham 317 Navajo 384 Yuma 384Statewide Goal 5,801Nonresident Goal 599Total Resident and Nonresident Sample Goal 6,400
SURVEY ADMINISTRATION AND DATA MANAGEMENT As mentioned above, after the sample was chosen, the survey was administered in two ways: by
telephone and by Internet. Both survey modes used a named respondent method (i.e., a person
was chosen in the sampling plan rather than a random number) to ensure that the sample
remained representative of all anglers in Arizona. The representativeness of the sample was
maintained by including telephones as a mode of surveying in addition to the Internet.
Preparation of Database After obtaining the sample database (licensed anglers in Arizona), the initial steps in the survey
process were to remove duplicate people from the sample database (e.g., the same person who
bought two types of licenses), update the information in the database (updating incorrect
addresses when a forwarding address or correct address could be found and removing invalid
addresses), and acquire valid telephone numbers through a professional service that matches
telephone numbers to addresses. Responsive Management conducted the de-duplication process
and contracted firms that specialize in providing scientifically valid samples for surveys to assist
with the two latter procedures.
The researchers then chose a scientifically valid survey sample of 20,000 names from the sample
database, stratified among the counties, but randomly chosen within the counties. The survey
sample was stratified among the counties to attempt to reach the aforementioned goals for each
county. Note that the sample was chosen to be representative of anglers with no regard for the
survey mode that would be used. Only after being selected in the sample were potential
respondents contacted and given the choice of survey modes.

Arizona Anglers’ Opinions, Attitudes, and Expenditures in the State 3
Postcards Simultaneous to the work being done to prepare the survey sample, the researchers designed a postcard to be sent to respondents asking for their participation in the survey. The postcard featured the Department logo, the Internet address for the online survey, a quick response (QR) code to access the survey from mobile devices, a toll-free telephone number to take the survey by telephone, and Spanish instructions with a number to take the survey in Spanish. The postcard also told of a drawing for a lifetime license as an incentive for respondents to complete the survey. Contacting the Sample The first wave of 20,000 postcards were sent to the survey sample that had been selected. The postcard encouraged participation in the survey and offered two modes (telephone and Internet) for completing the survey. A month after the first wave was sent, a second wave of postcards was sent to 30,000 respondents, stratified among the counties, but randomly generated within each county. The second wave sample was increased over the first wave because of the high rate of invalid addresses discovered after the first wave, and the researchers wanted to ensure that they would obtain enough completed interviews in each county for valid results. This second wave included anglers who had received the first mailing, but it excluded those who had already taken the survey. This second sample was also apportioned among the counties to obtain the aforementioned goal of completed interviews in each county in Arizona, with the end result being a sample that was statistically valid in each county. To ensure that only people chosen for the survey sample took the survey, and as a way to enter them into the drawing for a lifetime license, each respondent was assigned a survey identification number. In addition to being used to enter the respondent in the drawing, this number allowed the researchers to determine who had taken the survey after the first wave so that they were not sent the second wave postcard and to prevent respondents from submitting duplicate or multiple surveys in an attempt to be entered into the drawing more than once. After the second wave of postcards, Responsive Management called those who had been contacted in one or both waves but had not completed the survey. During these calls, the interviewer encouraged participation through the Internet or offered to conduct the survey by telephone at that time. In addition, Spanish interviews were completed at this time, based on those in the survey sample who had called the Spanish telephone contact number.

4 Responsive Management
Polling and Data Management Facilities A central polling and data management site at the Responsive Management office allowed for rigorous quality control over the telephone interviews and data collection. Responsive Management maintains its own in-house telephone interviewing and data management facilities, staffed with interviewers who have been trained according to the standards established by the Council of American Survey Research Organizations. Its staff is experienced in conducting computer-assisted telephone interviews and managing Internet surveys on the subjects of fishing, outdoor recreation, and natural resources. Administering the Survey and Quality Control The Survey Center Managers and other professional staff conducted a project briefing with the interviewers prior to the administration of this survey. Interviewers were instructed on type of study, study goals and objectives, handling of survey questions, interview length, termination points and qualifiers for participation, interviewer instructions within the survey questionnaire, reading of the survey questions, skip patterns, and probing and clarifying techniques necessary for specific questions on the survey questionnaire. The integrity of the Internet portion of the survey data was ensured by using survey software that allowed proper flow and skip-outs in the questionnaire, according to the responses provided by the angler. Furthermore, the use of the identification number to take the survey ensured that only those anglers randomly chosen for the survey would be represented in the final data. For the telephone portion of the survey, eligible surveying times were Monday through Friday from 9:00 a.m. to 9:00 p.m., Saturday from noon to 5:00 p.m., and Sunday from 5:00 p.m. to 9:00 p.m., local time. The Internet surveys, obviously, could be completed at any time of the day convenient for the respondent. The software used for telephone data collection was Questionnaire Programming Language (QPL). The survey data were entered into the computer as each telephone interview was being conducted, eliminating manual data entry after the completion of the survey and the concomitant data entry errors that may occur with manual data entry. The survey questionnaire was programmed so that QPL branched, coded, and substituted phrases in the survey based on previous responses to ensure the integrity and consistency of the data collection.
Arizona Anglers’ Opinions, Attitudes, and Expenditures in the State 5
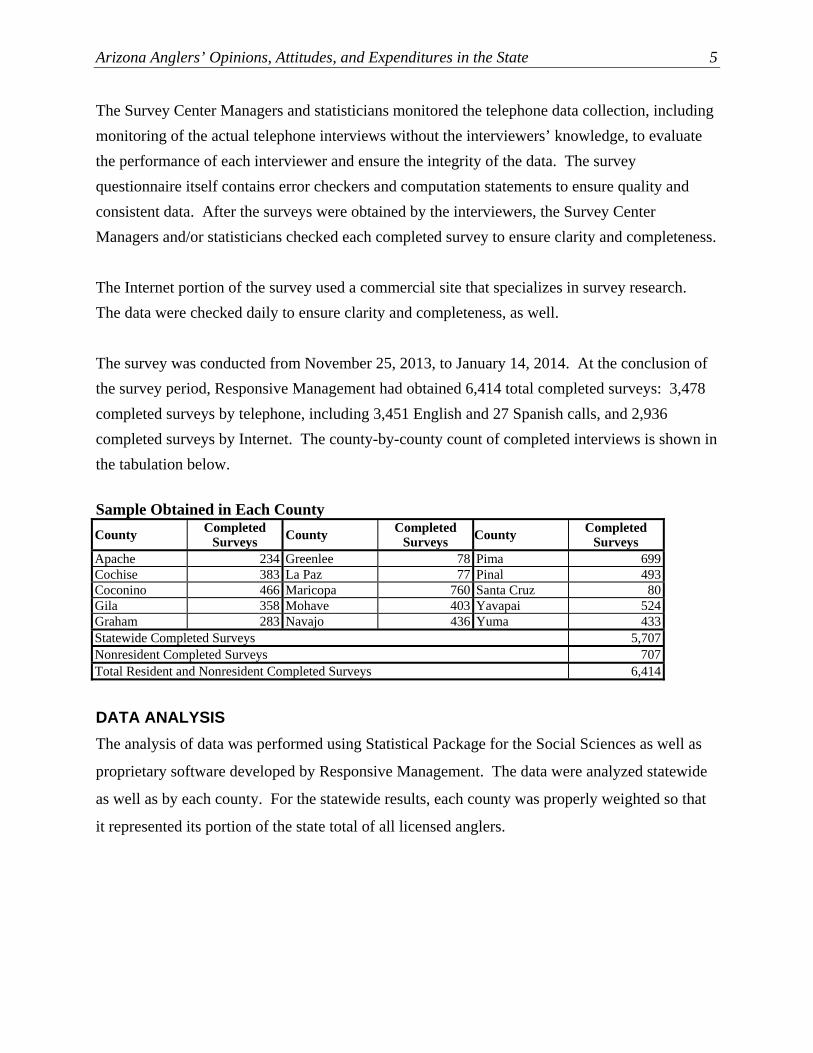
The Survey Center Managers and statisticians monitored the telephone data collection, including monitoring of the actual telephone interviews without the interviewers’ knowledge, to evaluate the performance of each interviewer and ensure the integrity of the data. The survey questionnaire itself contains error checkers and computation statements to ensure quality and consistent data. After the surveys were obtained by the interviewers, the Survey Center Managers and/or statisticians checked each completed survey to ensure clarity and completeness. The Internet portion of the survey used a commercial site that specializes in survey research. The data were checked daily to ensure clarity and completeness, as well. The survey was conducted from November 25, 2013, to January 14, 2014. At the conclusion of the survey period, Responsive Management had obtained 6,414 total completed surveys: 3,478 completed surveys by telephone, including 3,451 English and 27 Spanish calls, and 2,936 completed surveys by Internet. The county-by-county count of completed interviews is shown in the tabulation below. Sample Obtained in Each County County Completed
Surveys County Completed Surveys County Completed
Surveys Apache 234 Greenlee 78 Pima 699Cochise 383 La Paz 77 Pinal 493Coconino 466 Maricopa 760 Santa Cruz 80Gila 358 Mohave 403 Yavapai 524Graham 283 Navajo 436 Yuma 433Statewide Completed Surveys 5,707Nonresident Completed Surveys 707Total Resident and Nonresident Completed Surveys 6,414
DATA ANALYSIS The analysis of data was performed using Statistical Package for the Social Sciences as well as
proprietary software developed by Responsive Management. The data were analyzed statewide
as well as by each county. For the statewide results, each county was properly weighted so that
it represented its portion of the state total of all licensed anglers.

6 Responsive Management
The entire sample included some anglers in the database who had not fished in Arizona in 2013,
and some questions were asked of the entire sample. Other questions were asked only of those
who had fished in 2013; this sample will be referred to as “active anglers” in the report to
distinguish them from anglers in the entire database.
One aspect of the data analysis was a look at locational information, which included obtaining
data about the water body in Arizona in which the angler last fished. The survey used a list of
water bodies provided by the Department of 93 water bodies or sections of water bodies, as
shown in the tabulation below. When an angler was unsure of the name of the water body, the
survey asked the respondent to describe the location using local landmarks. In most instances,
this allowed one of the data analysts to meticulously locate and assign the proper water body to
that respondent for the analyses, a painstaking process that took several days.
Arizona Bodies of Water for Angler Survey 1. Alamo Lake 32. Fain Lake 63. Parker Canyon Lake 2. Alvord Lake 33. Fool Hollow Lake 64. Patagonia Lake 3. Apache Lake 34. Fortuna Pond (Moser Pond) 65. Pena Blanca Lake 4. Arivaca Lake 35. Francis Short Pond 66. Phoenix Area Canals 5. Ashurst Lake 36. Frye Mesa Reservoir 67. Rainbow Lake 6. Bartlett Lake 37. Gila River – Phoenix Area 68. Red Mountain Lake 7. Bear Canyon Lake 38. Gila River – Safford Area 69. Redondo Lake 8. Becker Lake 39. Goldwater Lake 70. Riggs Flat Lake 9. Big Lake 40. Granite Basin Lake 71. Roosevelt Lake 10. Black Canyon Lake 41. Green Valley Lake 72. Roper Lake 11. Black River, East Fork 42. Greer Area Lakes – Bunch, River,
Tunnel 73. Rose Canyon Lake 12. Black River, West Fork 43. Kaibab Lake 74. Saguaro Lake 13. Canyon Creek 44. Kennedy Lake 75. Salt River (above Roosevelt) 14. Canyon Lake 45. Kinnikinick Lake 76. Salt River (below Saguaro) 15. Carnero Lake 46. Knoll Lake 77. Show Low Lake 16. Cataract Lake 47. Lake Havasu 78. Silver Creek 17. Chaparral Lake 48. Lake Mary (Lower) 79. Silverbell Lake 18. Chevelon Lake 49. Lake Mary (Upper) 80. Surprise Lake 19. Christopher Creek 50. Lake Mead 81. Tempe Town Lake 20. Clear Creek Reservoir 51. Lake Mohave 82. Tonto Creek (Salt River Drainage) 21. Cluff Ranch Ponds 52. Lake Pleasant 83. Verde River (Sullivan Lake to
Perkinsville) 22. Colorado River – Lees Ferry 53. Lake Powell 84. Verde River (Sycamore Creek to
Childs) 23. Colorado River – Topock Area 54. Lee Valley Lake 85. Verde River (Bartlett Dam to Fort
McDowell Indian Reservation) 24. Colorado River – Parker Strip Area 55. Little Colorado River (Sheep’s
Crossing) 86. Veterans Oasis Lake 25. Colorado River – Ehrenberg/ Blythe to Yuma 56. Little Colorado River (Greer) 87. Watson Lake 26. Cortez Lake 57. Lyman Lake 88. Whitehorse Lake 27. Council Park Pond (Somerton) 58. Luna Lake 89. Willow Springs Lake 28. Crescent Lake 59. Lynx Lake 90. Woodland Reservoir 29. Dead Horse Lake 60. Mittry Lake 91. Woods Canyon Lake 30. Dogtown Reservoir 61. Nelson Reservoir 92. Yuma Area Canals 31. East Verde River 62. Oak Creek 93. Yuma West Wetlands Pond

Arizona Anglers’ Opinions, Attitudes, and Expenditures in the State 7
On questions that asked respondents to provide a number (e.g., number of days), the graph shows
ranges of numbers rather than the precise numbers. Nonetheless, in the survey each respondent
provided a precise number, and the dataset includes this precise number, even if the graph only
shows ranges of numbers. Note that the calculation of means and medians used the precise
numbers that the respondents provided.
SAMPLING ERRORS AND RESPONSE RATE Throughout this report, findings of the telephone survey are reported at a 95% confidence
interval. For the entire statewide sample of Arizona anglers, the sampling error is at most plus or
minus 1.21 percentage points. In each county, the sampling errors are shown in the tabulation
below.
County Sample Population Sampling Error Apache 234 3,798 6.21 Cochise 383 7,636 4.88 Coconino 466 16,478 4.48 Gila 358 8,112 5.06 Graham 283 4,867 5.65 Greenlee 78 1,745 10.85 La Paz 77 1,272 10.83 Maricopa 760 167,567 3.55 Mohave 403 17,083 4.82 Navajo 436 11,281 4.60 Pima 699 38,415 3.67 Pinal 493 12,178 4.32 Santa Cruz 80 1,343 10.63 Yavapai 524 19,472 4.22 Yuma 433 10,555 4.61 Out-of-State 707 28,199 3.64 Total 6,414 350,000* 1.21
The sampling errors were calculated using the formula described below.
Sampling Error Equation
( )( )96.1
1
25.25.
⎟⎟⎟⎟
⎠
⎞
⎜⎜⎜⎜
⎝
⎛
−
−=
p
s
p
NN
N
B
Derived from formula: p. 206 in Dillman, D. A. 2000. Mail and Internet Surveys. John Wiley & Sons, NY.
Note: This is a simplified version of the formula that calculates the maximum sampling error using a 50:50 split (the most conservative calculation because a 50:50 split would give maximum variation).
Where: B = maximum sampling error (as decimal) NP = population size (i.e., total number who could be surveyed) NS = sample size (i.e., total number of respondents surveyed)

8 Responsive Management
The response rate was an estimated 30%. Calculating the response rate on multi-modal surveys
entails first determining the rate of returned/invalid contacts for all modes. For this survey,
because the initial database of potential contacts provided by the Department contained many
invalid contacts and/or addresses (and even though that database was updated as best as could be
done), there was a relatively high rate of invalid contacts. Furthermore, the survey period ended
before a final call status determination could be made for all those who had received a mailing.
For determining the response rate, the calculation used 21,384 as the estimated number of valid
contacts for which a final call status determination could be made and 6,414 completed
interviews.
ADDITIONAL INFORMATION ABOUT THE PRESENTATION OF RESULTS IN THE REPORT In examining the results, it is important to be aware that the questionnaire included several types
of questions:
• Open-ended questions are those in which no answer set is read to the respondents; rather, they can respond with anything that comes to mind from the question.
• Closed-ended questions have an answer set from which to choose. • Single or multiple response questions: Some questions allow only a single response,
while other questions allow respondents to give more than one response or choose all that apply. Those that allow more than a single response are indicated on the graphs with the label, “Multiple Responses Allowed.”
• Scaled questions: Many closed-ended questions (but not all) are in a scale, such as excellent-good-fair-poor.
• Series questions: Many questions are part of a series, and the results are primarily intended to be examined relative to the other questions in that series (although results of the questions individually can also be valuable). Typically, results of all questions in a series are shown together.
The entire sample of anglers includes those who did not fish in Arizona in 2013, referred to
simply as “anglers” in the report. Some questions were asked of those who had fished in
Arizona in 2013, and they are referred to as “active anglers” in the report.
The “n-value” on the graphs shows the number of respondents who were asked the question.
Note that in some places the sample was randomly split, with some random subgroups getting
some questions and other subgroups getting other questions, thereby allowing an extensive
survey to be administered without any one respondent having to go through the entire survey.

Arizona Anglers’ Opinions, Attitudes, and Expenditures in the State 9
Other questions are simply follow-up questions asked only of those who meet certain criteria
(e.g., only those who used minnows for bait are asked about whether they mostly purchase or
mostly catch minnows for bait). For this reason, the n-value on some graphs may be less than
the total sample.
Some graphs show an average, either the mean or median (or both). The mean is simply the sum
of all numbers divided by the number of respondents. Because outliers (extremely high or low
numbers relative to most of the other responses) may skew the mean, the median may be shown.
The median is the number at which half the sample is above and the other half is below. In other
words, a median of 150 means that half the sample gave an answer of more than 150 and the
other half gave an answer of less than 150.
Most graphs show results rounded to the nearest integer; however, all data are stored in decimal
format, and all calculations are performed on unrounded numbers. For this reason, some results
may not sum to exactly 100% because of this rounding on the graphs. Additionally, rounding
may cause apparent discrepancies of 1 percentage point between the graphs and the reported
results of combined responses (e.g., when “strongly support” and “moderately support” are
summed to determine the total percentage in support).
The survey results are broken down thematically (for instance, the first theme is species fished)
rather than presented sequentially by question number. Each section of the report includes a
summary page of the results pertaining to that theme, followed by all the graphs and tabulations
that were discussed in summary. In general, for each question in the survey, a graph of the
statewide results is presented followed by a tabulation of the county-by-county results for that
question.

10 Responsive Management
SPECIES FISHED AND SPECIES INFORMATION One of the first questions in the survey asked anglers in the database (licensed anglers) if
they had fished in 2013: 88% had done so. These 88% are hereinafter referred to as “active
anglers.”
The most popular species fished, by far, are trout and bass. Among active anglers, 69%
fished for trout overall (68% for non-native such as rainbow, and 17% for native trout) and
63% fished for bass (58% for largemouth or smallmouth bass, and 21% for striped bass).
• Also of importance are catfish (30% overall, 26% for channel, and 15% for flathead),
crappie (21%) and sunfish (13%). Less than 10% fished for walleye, northern pike, or
other species.
An analysis was run based on three questions: the species fished, the days fished, and the
percent of time spent fishing for each species.
• Bass and trout account for the most fishing days: smallmouth/largemouth bass were
fished for on 39.7% of angler days, and non-native trout were fished for 36.8% of angler
days in 2013.
o In multiplying the mean number of days by the number of anglers, the analysis finds
that anglers spent 2.55 million days fishing for smallmouth/largemouth bass, and 2.36
million days fishing for non-native trout in 2013.
Finally, the survey asked active anglers to name their one preferred species to fish for in
Arizona. The most preferred species in the top tier are trout (41% overall, 34% for
non-native such as rainbow, and 6% for native trout—rounding causes the apparent
discrepancy in sum) and bass (31% overall, 26% for largemouth or smallmouth bass, and 5%
for striped bass). In a second tier are catfish (7% overall, 4% for channel catfish, and 2% for
flathead catfish—rounding causes the apparent discrepancy in sum), walleye (7%), and
crappie (6%). The graph shows the full listing.

Arizona Anglers’ Opinions, Attitudes, and Expenditures in the State 11
Q22. Have you personally fished in Arizona in 2013?
Less than 0.5%
12
88
0 20 40 60 80 100
Yes
No
Don't know
Percent (n=6414)

12 Responsive Management
Q22. Have you personally fished in Arizona in 2013?
Apa
che
Coc
hise
Coc
onin
o
Gila
Gra
ham
Gre
enle
e
La
Paz
Mar
icop
a
Yes 88 87 90 92 85 95 93 88 No 12 13 10 8 15 5 7 12
Q22. Have you personally fished in Arizona in 2013?
Moh
ave
Nav
ajo
Pim
a
Pina
l
Sant
a C
ruz
Yav
apai
Yum
a
Out
-of-
Stat
e
Yes 92 91 86 83 89 87 92 84 No 8 9 14 17 11 12 7 16 Don't know 0 0 0 0 0 0 1 0

Arizona Anglers’ Opinions, Attitudes, and Expenditures in the State 13
Q49. Which of the following species have you fished for in Arizona in 2013? (Among active
anglers who indicated that they "mostly fish for specific types of fish" rather than "anything
that bites.")
6
13
15
68
58
26
21
21
17
5
1
0 20 40 60 80 100
Trout, such as rainbow or brown troutbut not including native trout
Largemouth or smallmouth bass
Channel catfish
Crappie
Striped bass
Native trout, such as Apache trout orGila trout
Flathead catfish
Sunfish, such as bluegill or red-ear
Walleye
Northern pike
Other
Mul
tiple
resp
onse
s al
low
ed
Percent (n=3287)
Any trout: 69%
Any bass: 63%
Any catfish: 30%

14 Responsive Management
Q49. Which of the following species have you fished for in Arizona in 2013? (Asked of those who personally fished in Arizona in 2013.)
Species
Apa
che
Coc
hise
Coc
onin
o
Gila
Gra
ham
Gre
enle
e
La
Paz
Mar
icop
a
Trout, such as rainbow or brown trout but not including native trout 90 68 80 68 80 73 28 72
Largemouth or smallmouth bass 46 59 49 58 49 64 70 60 Channel catfish 23 30 23 20 47 59 36 22 Crappie 28 29 28 40 32 18 20 20 Striped bass 3 9 21 9 8 2 28 21 Native trout, such as Apache trout or Gila trout 23 15 14 21 25 23 2 19
Flathead catfish 14 25 8 17 33 48 30 13 Sunfish, such as bluegill or red-ear 7 25 8 6 14 9 16 12 Walleye 9 4 18 7 2 0 0 5 Northern pike 3 2 20 3 1 2 0 4 Other 0 1 0 1 0 0 8 1
Q49. Which of the following species have you fished for in Arizona in 2013? (Asked of those who personally fished in Arizona in 2013.)
Species
Moh
ave
Nav
ajo
Pim
a
Pina
l
Sant
a C
ruz
Yav
apai
Yum
a
Out
-of-
Stat
e
Trout, such as rainbow or brown trout but not including native trout 40 89 71 67 89 80 37 44
Largemouth or smallmouth bass 63 50 55 56 63 59 78 49 Channel catfish 35 24 36 39 45 32 50 9 Crappie 16 25 21 28 13 21 16 17 Striped bass 76 10 8 10 8 23 26 25 Native trout, such as Apache trout or Gila trout 6 32 21 17 21 15 3 8
Flathead catfish 14 8 20 22 18 16 33 5 Sunfish, such as bluegill or red-ear 22 8 18 11 34 9 31 8 Walleye 2 15 3 5 3 10 0 3 Northern pike 2 4 3 2 5 13 0 1 Other 1 1 1 1 3 1 0 2

Arizona Anglers’ Opinions, Attitudes, and Expenditures in the State 15
Days Fished for Various Species Species Days Fished Percent of
Days* Total 6,416,171 Largemouth or smallmouth bass 2,546,619 39.7% Striped bass 569,728 8.9% Trout, such as rainbow or brown trout but not including native trout 2,361,227 36.8% Native trout, such as Apache trout or Gila trout 231,001 3.6% Channel catfish 557,924 8.7% Flathead catfish 322,857 5.0% Crappie 379,132 5.9% Sunfish, such as bluegill or red-ear 222,438 3.5% Walleye 82,973 1.3% Northern pike 51,804 0.8%
*Because anglers can fish for more than one species in a day, the percents will sum to more than 100%. Days estimates based on 350,000 licensed Arizona anglers.
16 Responsive Management
Q69. Which one species would you most prefer to see more fishing opportunities for in Arizona?
(Asked of those who personally fished in Arizona in 2013.)
3
2
1
5
6
6
7
26
34
4
2
1
0 20 40 60 80 100
Trout (non-native)
Largemouth orsmallmouth bass
Walleye
Crappie
Native trout
Striped bass
Channel catfish
Flathead catfish
Sunfish
Northern pike
Other
Don't know
Percent (n=4430)
41% *
* Rounding on graph causes apparent discrepancy; sum is calculated on
unrounded numbers.
7% *
31%

Arizona Anglers’ Opinions, Attitudes, and Expenditures in the State 17
Q69. Which one species would you most prefer to see more fishing opportunities for in Arizona? (Asked of those who personally fished in Arizona in 2013.)
Species
Apa
che
Coc
hise
Coc
onin
o
Gila
Gra
ham
Gre
enle
e
La
Paz
Mar
icop
a
Trout 41 35 39 32 37 35 15 37 Native trout 6 7 7 7 5 2 3 7 Largemouth or smallmouth bass 17 22 24 21 22 24 37 28
Striped bass 1 2 4 2 3 5 8 2 Channel catfish 5 6 4 4 12 19 5 3 Flathead catfish 2 3 2 4 3 7 5 2 Crappie 12 14 4 14 8 5 7 5 Sunfish 0 0 1 0 1 0 0 1 Northern pike 2 2 2 2 2 0 0 1 Walleye 12 4 8 10 2 2 15 9 Other 1 2 2 2 2 0 2 2 Don't know 0 1 1 3 4 2 3 3
Q69. Which one species would you most prefer to see more fishing opportunities for in Arizona? (Asked of those who personally fished in Arizona in 2013.)
Species
Moh
ave
Nav
ajo
Pim
a
Pina
l
Sant
a C
ruz
Yav
apai
Yum
a
Out
-of-
Stat
e
Trout 18 45 33 36 38 34 22 28 Native trout 3 5 7 5 8 7 3 5 Largemouth or smallmouth bass 29 16 26 21 25 23 38 27
Striped bass 29 2 2 4 6 4 7 11 Channel catfish 3 3 7 7 4 6 7 3 Flathead catfish 3 3 2 4 2 2 7 0 Crappie 4 11 8 10 6 7 5 9 Sunfish 0 0 2 1 0 1 1 3 Northern pike 1 1 1 1 4 3 1 1 Walleye 5 10 5 7 4 7 4 4 Other 3 1 2 2 6 2 3 2 Don't know 2 3 5 3 0 3 2 8

18 Responsive Management
FISHING METHODS USED A majority of active anglers (59%) say that they mostly fish for specific types of fish rather
than anything that bites.
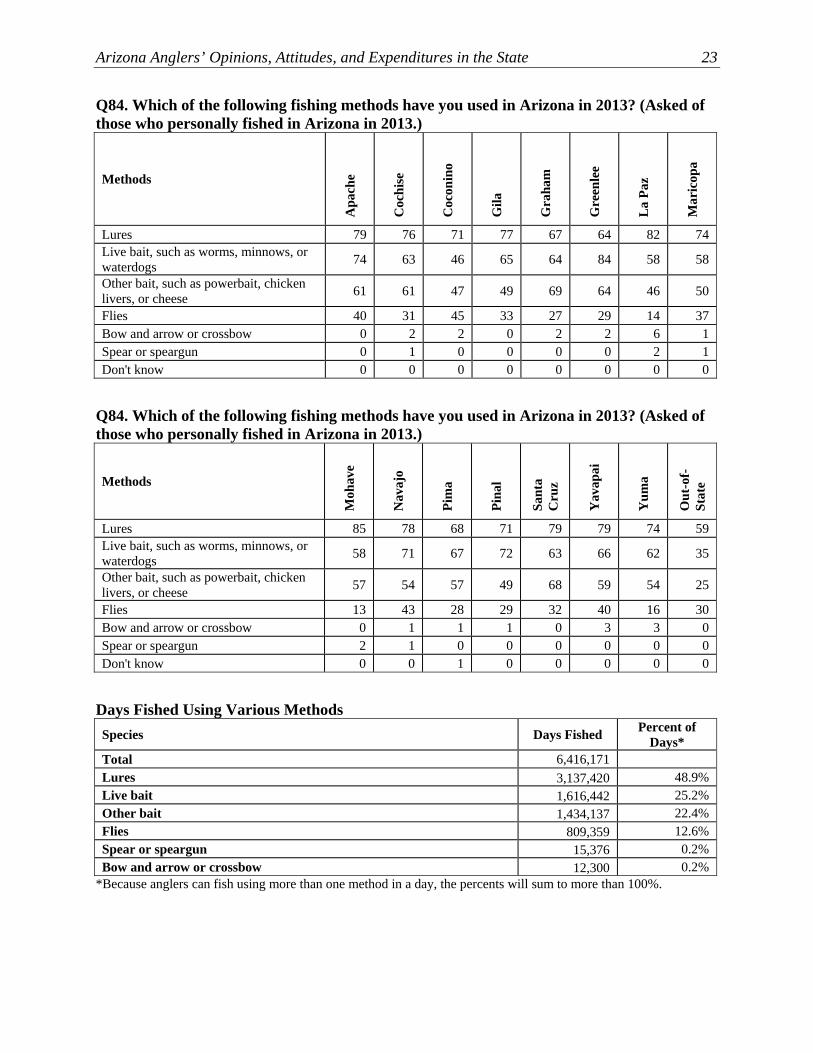
Those active anglers who indicated that they “mostly fish for specific types of fish” (rather
than “anything that bites”) were asked to name all the various methods that they had used for
fishing in Arizona in 2013. Leading the list is lures (used by 73%), followed by live bait
(59%), other bait (50%), and flies (34%).
• An analysis found the number of days that anglers fished using various methods, along
with the percent of their days that they used each method.
o Lures as a method accounts for almost half of fishing days: they are used 48.9% of
fishing days, which is approximately 3.14 million days. Live bait (25.2%,
1.62 million days) and other bait (22.4%, 1.43 million days) are also used for
substantial numbers of days.
The survey asked those who had used live bait to indicate the percentage of time that they
spent using each of the four live types (worms/mealworms, minnows/other fish, waterdogs,
and crickets). Two live bait types account for the most live bait use: worms/mealworms
(used a mean of 76.1 percent of the time when using live bait) and minnows/other fish (mean
of 20.1 percent of the time when using live bait). The other two types have means of no
more than 2.2 percent of the time. In fact, a majority of those who used live bait (51%) used
worms/mealworms exclusively, while 6% used minnows/other fish exclusively.
• A follow-up question found that the majority of those who used minnows or other fish for
live bait in Arizona in 2013 said that they mostly purchased the bait (64%) rather than
mostly caught the bait themselves (24%). In the middle, 10% purchase and catch bait
fish about equally.
o A further follow-up was asked of those who caught their own bait fish at least half the
time. Among these respondents, 88% mostly catch the bait fish at their fishing site,
but 6% mostly catch their bait fish somewhere else and bring them to their fishing
site. In the middle, 7% do both about equally.

Arizona Anglers’ Opinions, Attitudes, and Expenditures in the State 19
• Again in follow-up, those who used waterdogs for live bait were asked about purchasing
them or catching them. The large majority of those using waterdogs mostly purchase
them (81%) rather than mostly catch them (6%), with 5% in the middle doing both about
equally.
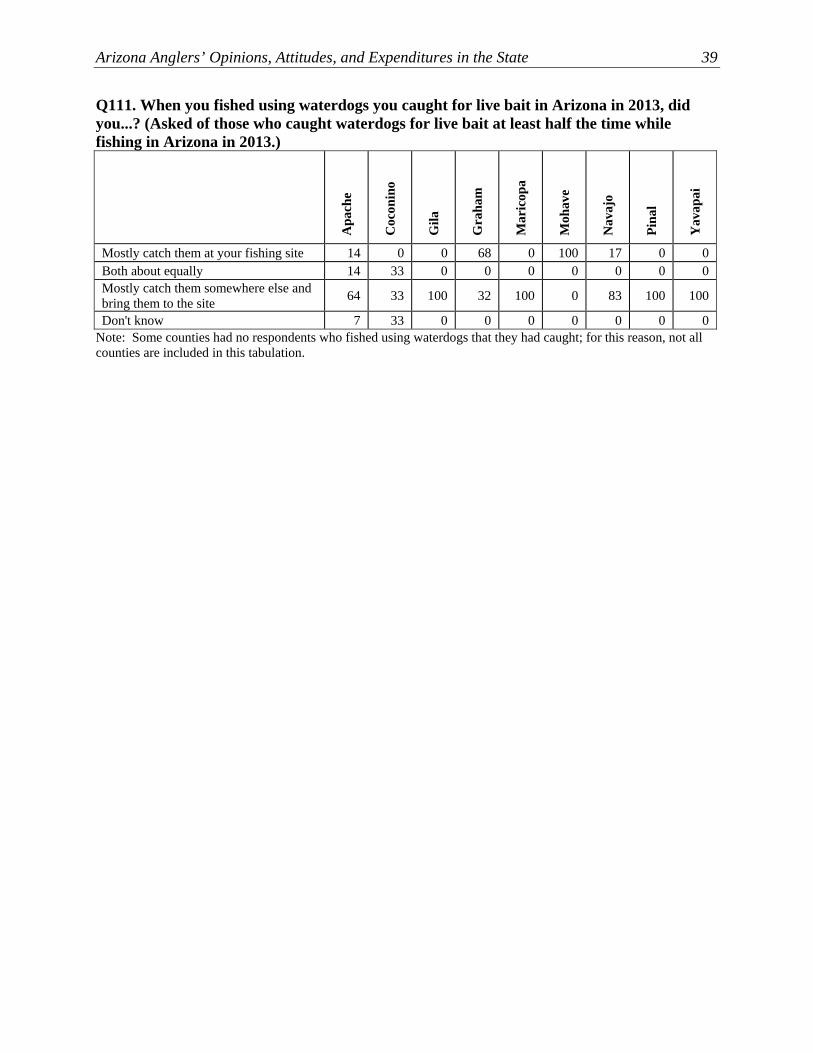
o Also in follow-up, those who caught waterdogs at least half the time were asked
about where they catch them: 15% mostly catch them at their fishing site, while 72%
mostly catch them elsewhere (7% are in the middle, doing both about equally).
Anglers were asked about the six primary bait/equipment methods that they would prefer to
see more opportunities for in Arizona. The top one is live bait (33%), followed by lures
(26%), flies (16%), and other bait such as powerbait and cheese (10%).
Another question asked about catch-and-release, asking active anglers the percent of the fish
that they catch that they typically release. The mean percent of their responses is 61.0
percent, and this includes those 19% who release all their catch and 25% who keep all of
their catch. (Note that this does not mean that 61.0% of all fish that are caught are released,
because all respondents do not catch the same amount of fish.)

20 Responsive Management
Q46. Which of the following best describes your fishing in Arizona? (Asked of those who personally
fished in Arizona in 2013.)
41
59
0 20 40 60 80 100
You mostly fish fora specific type of
fish
You mostly fish foranything that bites
Percent (n=5637)
Arizona Anglers’ Opinions, Attitudes, and Expenditures in the State 21
Q46. Which of the following best describes your fishing in Arizona? (Asked of those who personally fished in Arizona in 2013.)
Method
Apa
che
Coc
hise
Coc
onin
o
Gila
Gra
ham
Gre
enle
e
La
Paz
Mar
icop
a
You mostly fish for specific type of fish 56 50 58 65 56 59 69 60
You mostly fish for anything that bites 44 50 42 35 44 41 31 40
Q46. Which of the following best describes your fishing in Arizona? (Asked of those who personally fished in Arizona in 2013.)
Method
Moh
ave
Nav
ajo
Pim
a
Pina
l
Sant
a C
ruz
Yav
apai
Yum
a
Out
-of-
Stat
e
You mostly fish for specific type of fish 51 64 61 58 53 58 52 60
You mostly fish for anything that bites 49 36 39 42 47 42 48 40

22 Responsive Management
Q84. Which of the following fishing methods have you used in Arizona in 2013? (Asked of those who
personally fished in Arizona in 2013.)
Less than 0.5%
73
59
50
34
1
1
0 20 40 60 80 100
Lures
Live bait, such asworms, minnows,
or waterdogs
Other bait, such aspowerbait, chickenlivers, or cheese
Flies
Bow and arrow orcrossbow
Spear or speargun
Don't know
Mul
tiple
resp
onse
s al
low
ed
Percent (n=3287)
Arizona Anglers’ Opinions, Attitudes, and Expenditures in the State 23
Q84. Which of the following fishing methods have you used in Arizona in 2013? (Asked of those who personally fished in Arizona in 2013.)
Methods
Apa
che
Coc
hise
Coc
onin
o
Gila
Gra
ham
Gre
enle
e
La
Paz
Mar
icop
a
Lures 79 76 71 77 67 64 82 74 Live bait, such as worms, minnows, or waterdogs 74 63 46 65 64 84 58 58
Other bait, such as powerbait, chicken livers, or cheese 61 61 47 49 69 64 46 50
Flies 40 31 45 33 27 29 14 37 Bow and arrow or crossbow 0 2 2 0 2 2 6 1 Spear or speargun 0 1 0 0 0 0 2 1 Don't know 0 0 0 0 0 0 0 0
Q84. Which of the following fishing methods have you used in Arizona in 2013? (Asked of those who personally fished in Arizona in 2013.)
Methods
Moh
ave
Nav
ajo
Pim
a
Pina
l
Sant
a C
ruz
Yav
apai
Yum
a
Out
-of-
Stat
e
Lures 85 78 68 71 79 79 74 59 Live bait, such as worms, minnows, or waterdogs 58 71 67 72 63 66 62 35
Other bait, such as powerbait, chicken livers, or cheese 57 54 57 49 68 59 54 25
Flies 13 43 28 29 32 40 16 30 Bow and arrow or crossbow 0 1 1 1 0 3 3 0 Spear or speargun 2 1 0 0 0 0 0 0 Don't know 0 0 1 0 0 0 0 0
Days Fished Using Various Methods Species Days Fished Percent of
Days* Total 6,416,171 Lures 3,137,420 48.9% Live bait 1,616,442 25.2% Other bait 1,434,137 22.4% Flies 809,359 12.6% Spear or speargun 15,376 0.2% Bow and arrow or crossbow 12,300 0.2%
*Because anglers can fish using more than one method in a day, the percents will sum to more than 100%.

24 Responsive Management
Q102. What percentage of the time you used live bait while fishing in Arizona in 2013 have you used worms or mealworms? (Asked of those who used
live bait while fishing in Arizona in 2013.)
7
4
6
8
12
51
8
5
0 20 40 60 80 100
100%
76%-99%
51%-75%
50%
26%-49%
1%-25%
0%
Don't know
Percent (n=1987)
Mean: 76.1

Arizona Anglers’ Opinions, Attitudes, and Expenditures in the State 25
Q102. What percentage of the time you used live bait while fishing in Arizona in 2013 have you used worms or mealworms? (Asked of those who used live bait while fishing in Arizona in 2013.)
Percent of Time
Apa
che
Coc
hise
Coc
onin
o
Gila
Gra
ham
Gre
enle
e
La
Paz
Mar
icop
a
100% 54 52 50 33 56 57 17 49 76%-99% 14 14 16 9 12 8 10 12 51%-75% 8 9 6 10 6 19 7 10 50% 7 12 5 14 8 5 17 4 26%-49% 6 2 4 9 5 3 10 3 1%-25% 5 7 11 9 7 3 7 7 0% 4 3 6 10 3 3 14 8 Don't know 2 1 2 5 3 3 17 6
Q102. What percentage of the time you used live bait while fishing in Arizona in 2013 have you used worms or mealworms? (Asked of those who used live bait while fishing in Arizona in 2013.)
Percent of Time
Moh
ave
Nav
ajo
Pim
a
Pina
l
Sant
a C
ruz
Yav
apai
Yum
a
Out
-of-
Stat
e
100% 45 57 71 52 54 49 41 33 76%-99% 17 16 5 13 13 13 22 9 51%-75% 5 7 4 11 9 7 9 3 50% 8 5 5 8 4 8 12 11 26%-49% 5 3 3 3 4 5 3 2 1%-25% 11 4 4 5 9 5 7 10 0% 5 5 5 5 7 4 25 Don't know 5 3 4 2 9 6 3 8

26 Responsive Management
Q103. What percentage of the time you used live bait while fishing in Arizona in 2013 have you used minnows or other fish? (Asked of those who used
live bait while fishing in Arizona in 2013.)
14
7
5
2
5
6
56
5
0 20 40 60 80 100
100%
76%-99%
51%-75%
50%
26%-49%
1%-25%
0%
Don't know
Percent (n=1987)
Mean: 20.1

Arizona Anglers’ Opinions, Attitudes, and Expenditures in the State 27
Q103. What percentage of the time you used live bait while fishing in Arizona in 2013 have you used minnows or other fish? (Asked of those who used live bait while fishing in Arizona in 2013.)
Percent of Time
Apa
che
Coc
hise
Coc
onin
o
Gila
Gra
ham
Gre
enle
e
La
Paz
Mar
icop
a
100% 2 3 4 8 2 3 7 6 76%-99% 1 2 4 6 5 3 7 6 51%-75% 1 5 4 6 6 0 10 1 50% 8 10 3 11 8 3 17 3 26%-49% 8 6 4 12 3 13 7 9 1%-25% 12 14 16 17 12 16 14 15 0% 65 59 63 35 61 60 21 54 Don't know 2 1 2 5 3 3 17 6
Q103. What percentage of the time you used live bait while fishing in Arizona in 2013 have you used minnows or other fish? (Asked of those who used live bait while fishing in Arizona in 2013.)
Percent of Time
Moh
ave
Nav
ajo
Pim
a
Pina
l
Sant
a C
ruz
Yav
apai
Yum
a
Out
-of-
Stat
e
100% 5 4 5 3 0 6 4 24 76%-99% 10 3 2 5 4 2 5 7 51%-75% 4 3 3 1 4 2 4 3 50% 8 6 4 6 4 7 11 10 26%-49% 4 4 2 9 4 6 3 2 1%-25% 19 12 6 16 17 15 26 10 0% 46 64 75 59 59 57 45 36 Don't know 5 3 4 2 9 6 3 8

28 Responsive Management
Q104. What percentage of the time you used live bait while fishing in Arizona in 2013 have you used
waterdogs? (Asked of those who used live bait while fishing in Arizona in 2013.)
5
1
1
Less than 0.5%
Less than 0.5%
Less than 0.5%
87
5
0 20 40 60 80 100
100%
76%-99%
51%-75%
50%
26%-49%
1%-25%
0%
Don't know
Percent (n=1987)
Mean: 2.2

Arizona Anglers’ Opinions, Attitudes, and Expenditures in the State 29
Q104. What percentage of the time you used live bait while fishing in Arizona in 2013 have you used waterdogs? (Asked of those who used live bait while fishing in Arizona in 2013.)
Percent of Time
Apa
che
Coc
hise
Coc
onin
o
Gila
Gra
ham
Gre
enle
e
La
Paz
Mar
icop
a
100% 0 0 1 0 0 0 0 0 76%-99% 0 0 1 0 0 0 0 0 51%-75% 2 0 1 1 0 0 0 0 50% 0 1 3 4 2 0 0 2 26%-49% 5 1 1 1 0 0 3 2 1%-25% 15 5 13 12 5 5 7 3 0% 75 92 79 78 90 92 72 88 Don't know 2 1 2 5 3 3 17 6
Q104. What percentage of the time you used live bait while fishing in Arizona in 2013 have you used waterdogs? (Asked of those who used live bait while fishing in Arizona in 2013.)
Percent of Time
Moh
ave
Nav
ajo
Pim
a
Pina
l
Sant
a C
ruz
Yav
apai
Yum
a
Out
-of-
Stat
e
100% 0 0 0 1 0 1 0 0 76%-99% 0 0 1 0 0 1 0 0 51%-75% 0 1 0 1 0 1 0 0 50% 0 1 0 2 0 1 1 0 26%-49% 2 0 0 1 0 1 2 0 1%-25% 0 8 2 13 0 8 5 1 0% 94 87 93 80 91 83 90 91 Don't know 5 3 4 2 9 6 3 8

30 Responsive Management
Q105. What percentage of the time you used live bait while fishing in Arizona in 2013 have you used crickets? (Asked of those who used live bait while
fishing in Arizona in 2013.)
4
1
1
Less than 0.5%
Less than 0.5%
Less than 0.5%
89
5
0 20 40 60 80 100
100%
76%-99%
51%-75%
50%
26%-49%
1%-25%
0%
Don't know
Percent (n=1987)
Mean: 1.6

Arizona Anglers’ Opinions, Attitudes, and Expenditures in the State 31
Q105. What percentage of the time you used live bait while fishing in Arizona in 2013 have you used crickets? (Asked of those who used live bait while fishing in Arizona in 2013.)
Percent of Time
Apa
che
Coc
hise
Coc
onin
o
Gila
Gra
ham
Gre
enle
e
La
Paz
Mar
icop
a
100% 0 0 1 0 0 0 3 0 76%-99% 0 1 0 0 0 0 0 0 51%-75% 0 0 0 0 0 0 0 0 50% 0 0 1 0 0 0 0 0 26%-49% 0 0 1 1 0 0 3 1 1%-25% 9 9 10 7 9 3 3 3 0% 88 89 86 88 87 95 72 89 Don't know 2 1 2 5 3 3 17 6
Q105. What percentage of the time you used live bait while fishing in Arizona in 2013 have you used crickets? (Asked of those who used live bait while fishing in Arizona in 2013.)
Percent of Time
Moh
ave
Nav
ajo
Pim
a
Pina
l
Sant
a C
ruz
Yav
apai
Yum
a
Out
-of-
Stat
e
100% 0 0 0 0 0 0 0 2 76%-99% 0 0 0 0 0 0 1 0 51%-75% 0 0 0 0 0 1 0 0 50% 0 0 1 1 0 2 1 1 26%-49% 1 1 0 0 9 1 0 0 1%-25% 5 7 2 8 4 8 3 3 0% 89 89 92 90 79 84 92 86 Don't know 5 3 4 2 9 6 3 8

32 Responsive Management
Q108. When you fished using minnows or other fish for live bait in Arizona in 2013, did you...?
(Asked of those who used minnows or other fish for live bait while fishing in Arizona in 2013.)
2
24
10
64
0 20 40 60 80 100
Mostly purchasethem yourself
Both aboutequally
Mostly catch themyourself
Don't know
Percent (n=811)
74%
34%
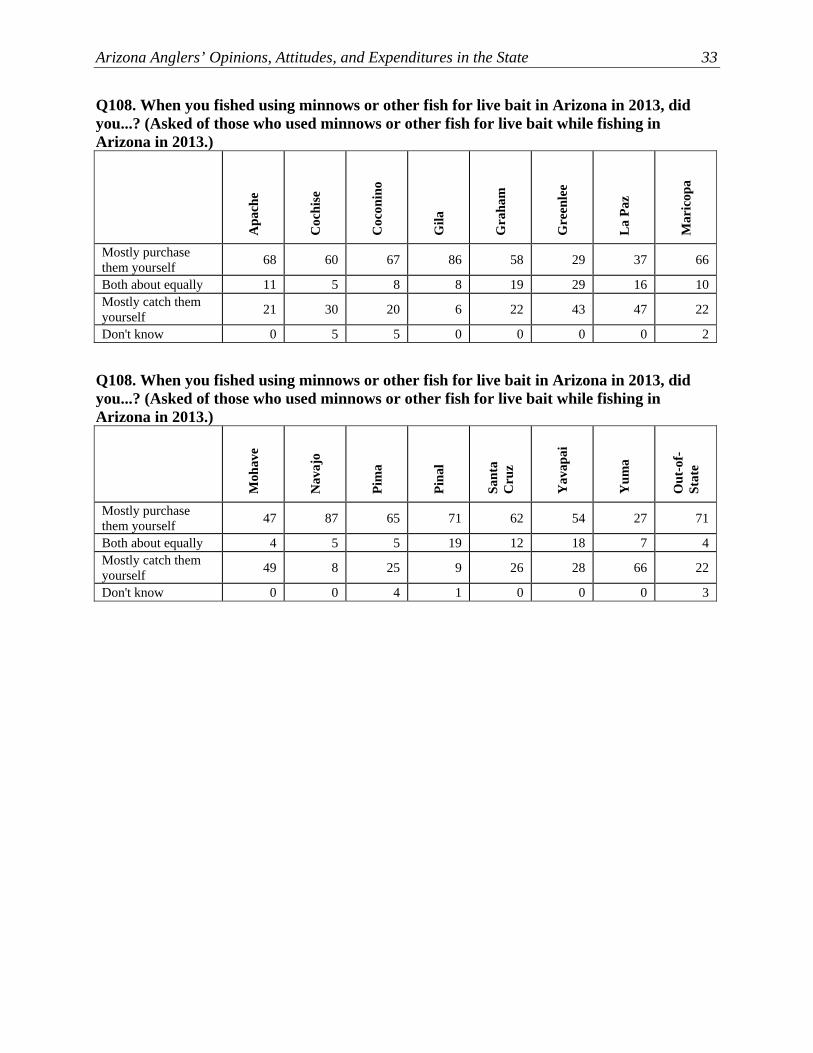
Arizona Anglers’ Opinions, Attitudes, and Expenditures in the State 33
Q108. When you fished using minnows or other fish for live bait in Arizona in 2013, did you...? (Asked of those who used minnows or other fish for live bait while fishing in Arizona in 2013.)
Apa
che
Coc
hise
Coc
onin
o
Gila
Gra
ham
Gre
enle
e
La
Paz
Mar
icop
a
Mostly purchase them yourself 68 60 67 86 58 29 37 66
Both about equally 11 5 8 8 19 29 16 10 Mostly catch them yourself 21 30 20 6 22 43 47 22
Don't know 0 5 5 0 0 0 0 2
Q108. When you fished using minnows or other fish for live bait in Arizona in 2013, did you...? (Asked of those who used minnows or other fish for live bait while fishing in Arizona in 2013.)
Moh
ave
Nav
ajo
Pim
a
Pina
l
Sant
a C
ruz
Yav
apai
Yum
a
Out
-of-
Stat
e
Mostly purchase them yourself 47 87 65 71 62 54 27 71
Both about equally 4 5 5 19 12 18 7 4 Mostly catch them yourself 49 8 25 9 26 28 66 22
Don't know 0 0 4 1 0 0 0 3

34 Responsive Management
Q109. When you fished using minnows or other fish you caught for live bait in Arizona in 2013, did you...? (Asked of those who caught minnows or other fish for live bait at least half the time while
fishing in Arizona in 2013.)
6
7
88
0 20 40 60 80 100
Mostly catch themat your fishing site
Both aboutequally
Mostly catch themsomewhere elseand bring them to
the site
Percent (n=289)
94% *
12% *
* Rounding on graph causes apparent discrepancy; sum is calculated on unrounded
numbers.

Arizona Anglers’ Opinions, Attitudes, and Expenditures in the State 35
Q109. When you fished using minnows or other fish you caught for live bait in Arizona in 2013, did you...? (Asked of those who caught minnows or other fish for live bait at least half the time while fishing in Arizona in 2013.)
Apa
che
Coc
hise
Coc
onin
o
Gila
Gra
ham
Gre
enle
e
La
Paz
Mar
icop
a
Mostly catch them at your fishing site 56 100 82 84 77 80 50 94
Both about equally 11 0 0 8 15 10 16 3 Mostly catch them somewhere else and bring them to the site 33 0 18 8 7 10 34 3
Q109. When you fished using minnows or other fish you caught for live bait in Arizona in 2013, did you...? (Asked of those who caught minnows or other fish for live bait at least half the time while fishing in Arizona in 2013.)
Moh
ave
Nav
ajo
Pim
a
Pina
l
Sant
a C
ruz
Yav
apai
Yum
a
Out
-of-
Stat
e
Mostly catch them at your fishing site 79 100 94 90 100 80 75 84
Both about equally 7 0 6 5 0 17 12 16 Mostly catch them somewhere else and bring them to the site 14 0 0 5 0 3 14 0

36 Responsive Management
Q110. When you fished using waterdogs for live bait, did you...? (Asked of those who used
waterdogs for live bait while fishing in Arizona in 2013.)
8
6
5
81
0 20 40 60 80 100
Mostly purchasethem
Both aboutequally
Mostly catch them
Don't know
Percent (n=201)
11%
86%

Arizona Anglers’ Opinions, Attitudes, and Expenditures in the State 37
Q110. When you fished using waterdogs for live bait, did you...? (Asked of those who used waterdogs for live bait while fishing in Arizona in 2013.)
Apa
che
Coc
hise
Coc
onin
o
Gila
Gra
ham
Gre
enle
e
La
Paz
Mar
icop
a
Mostly purchase them 26 86 82 81 50 50 67 84 Both about equally 11 0 9 0 0 0 0 5 Mostly catch them 63 0 4 4 50 0 0 0 Don't know 0 14 4 15 0 50 33 11
Q110. When you fished using waterdogs for live bait, did you...? (Asked of those who used waterdogs for live bait while fishing in Arizona in 2013.)
Moh
ave
Nav
ajo
Pim
a
Pina
l
Yav
apai
Yum
a
Out
-of-
Stat
e
Mostly purchase them 25 60 100 97 90 100 50 Both about equally 25 15 0 0 0 0 0 Mostly catch them 0 25 0 3 10 0 0 Don't know 50 0 0 0 0 0 50

38 Responsive Management
Q111. When you fished using waterdogs you caught for live bait in Arizona in 2013, did you...?
(Asked of those who caught waterdogs for live bait at least half the time while fishing in Arizona
in 2013.)
6
72
7
15
0 20 40 60 80 100
Mostly catch themat your fishing site
Both aboutequally
Mostly catch themsomewhere elseand bring them to
the site
Don't know
Percent (n=32)
80% *
22%
* Rounding on graph causes apparent discrepancy; sum is
calculated on unrounded numbers.
Arizona Anglers’ Opinions, Attitudes, and Expenditures in the State 39
Q111. When you fished using waterdogs you caught for live bait in Arizona in 2013, did you...? (Asked of those who caught waterdogs for live bait at least half the time while fishing in Arizona in 2013.)
Apa
che
Coc
onin
o
Gila
Gra
ham
Mar
icop
a
Moh
ave
Nav
ajo
Pina
l
Yav
apai
Mostly catch them at your fishing site 14 0 0 68 0 100 17 0 0 Both about equally 14 33 0 0 0 0 0 0 0 Mostly catch them somewhere else and bring them to the site 64 33 100 32 100 0 83 100 100
Don't know 7 33 0 0 0 0 0 0 0 Note: Some counties had no respondents who fished using waterdogs that they had caught; for this reason, not all counties are included in this tabulation.

40 Responsive Management
Q113. Which one of the following methods of fishing would you most prefer to see more fishing opportunities for in Arizona? (Asked of those who
personally fished in Arizona in 2013.)
1
3
10
16
26
33
1
10
0 20 40 60 80 100
Live bait, such as worms, minnows,or waterdogs
Lures
Flies
Other bait, such as powerbait,chicken livers, or cheese
Bow and arrow or crossbow
Spear or speargun
Other
Don't know
Percent (n=686)

Arizona Anglers’ Opinions, Attitudes, and Expenditures in the State 41
Q113. Which one of the following methods of fishing would you most prefer to see more fishing opportunities for in Arizona? (Asked of those who personally fished in Arizona in 2013.)
Method
Apa
che
Coc
hise
Coc
onin
o
Gila
Gra
ham
Gre
enle
e
La
Paz
Mar
icop
a
Live bait, such as worms, minnows, or waterdogs 48 29 18 39 37 44 51 37
Lures 12 34 38 29 29 11 37 21 Flies 12 17 25 10 8 22 0 15 Other bait, such as powerbait, chicken livers, or cheese 8 10 9 10 12 0 0 10
Bow and arrow or crossbow 0 2 0 0 3 22 0 4 Spear or speargun 0 0 1 0 0 0 0 1 Other 0 0 1 0 3 0 0 0 Don't know 20 7 7 12 8 0 12 11
Q113. Which one of the following methods of fishing would you most prefer to see more fishing opportunities for in Arizona? (Asked of those who personally fished in Arizona in 2013.)
Method
Moh
ave
Nav
ajo
Pim
a
Pina
l
Sant
a C
ruz
Yav
apai
Yum
a
Out
-of-
Stat
e
Live bait, such as worms, minnows, or waterdogs 30 37 32 38 42 28 29 27
Lures 39 24 22 27 8 26 34 33 Flies 2 22 18 17 34 10 10 20 Other bait, such as powerbait, chicken livers, or cheese 14 7 13 6 0 16 10 10
Bow and arrow or crossbow 2 0 3 4 0 4 10 0 Spear or speargun 0 0 0 0 8 0 0 0 Other 5 0 1 0 0 0 2 1 Don't know 9 10 11 8 8 16 5 9

42 Responsive Management
Q45. Approximately what percentage of all the fish you catch do you release back into the water when fishing in Arizona? (Asked of those who personally
fished in Arizona in 2013.)
13
3
10
7
21
19
25
1
0 20 40 60 80 100
100%
76%-99%
51%-75%
50%
26%-49%
1%-25%
0%
Don't know
Percent (n=3548)
Mean: 61.0Median: 75

Arizona Anglers’ Opinions, Attitudes, and Expenditures in the State 43
Q45. Approximately what percentage of all the fish you catch do you release back into the water when fishing in Arizona? (Asked of those who personally fished in Arizona in 2013.)
Percent released
Apa
che
Coc
hise
Coc
onin
o
Gila
Gra
ham
Gre
enle
e
La
Paz
Mar
icop
a
100% 9 15 14 11 10 4 18 21 76%-99% 18 12 18 19 14 21 25 23 51%-75% 9 6 9 6 11 9 7 7 50% 8 10 10 12 14 13 11 9 26%-49% 1 5 2 4 7 9 4 3 1%-25% 25 14 13 12 20 17 14 11 0% 28 36 33 36 22 28 18 24 Don't know 1 3 0 0 3 0 2 1
Q45. Approximately what percentage of all the fish you catch do you release back into the water when fishing in Arizona? (Asked of those who personally fished in Arizona in 2013.)
Percent released
Moh
ave
Nav
ajo
Pim
a
Pina
l
Sant
a C
ruz
Yav
apai
Yum
a
Out
-of-
Stat
e
100% 13 7 16 10 16 13 19 37 76%-99% 20 13 23 16 31 17 21 17 51%-75% 8 9 7 7 10 8 9 5 50% 8 13 12 12 12 12 10 9 26%-49% 4 3 4 7 4 3 3 1 1%-25% 19 24 13 17 4 16 11 10 0% 25 30 22 29 22 29 27 18 Don't know 1 1 2 2 2 1 1 3

44 Responsive Management
FISHING LOCATIONS Seven locations had nearly 10% or more of active anglers fishing there at some point in
2013: Roosevelt Lake (18.4%), Lake Pleasant (14.2%), Big Lake (12.3%), Canyon Lake
(9.8%), Bartlett Lake (9.6%), Woods Canyon Lake (9.6%), and Saguaro Lake (9.4%). (Note
that respondents could give multiple responses; they were asked to name all the locations in
which they had fished in Arizona in 2013.)
• The survey then asked active anglers to name the most recent location they visited.
Those bodies named above are the top water bodies “last visited,” albeit in a slightly
different order.
o Graphs are shown with the bodies of water ranked from most popular to least; these
are followed by the locations in alphabetical order for those readers seeking
information about a specific body of water.
A tabulation shows the mean and median number of days fishing at various locations and the
mean and median number of trips taken to those locations.

Arizona Anglers’ Opinions, Attitudes, and Expenditures in the State 45
Q117-Q141. Percent of active anglers who fished in each of the following locations. (Asked of those
who personally fished in Arizona in 2013.) (Part 1.)
3.83.73.43.33.13.13.02.92.92.82.72.72.72.62.42.32.32.22.22.22.12.12.12.02.01.91.91.81.81.81.7
6.98.49.4
18.414.2
12.39.89.69.6
5.75.75.65.54.74.3
0 20 40 60 80 100
Roosevelt LakeLake Pleasant
Big LakeCanyon LakeBartlett Lake
Woods Canyon LakeSaguaro Lake
Willow Springs LakeApache Lake
Patagonia LakeColorado River - Lees Ferry
Alamo LakeLake HavasuLake Powell
Salt River (below Saguaro)Lake Mary (Upper)
Ashurst LakeParker Canyon Lake
Fool Hollow LakeShow Low Lake
Oak CreekBlack River, East Fork
Crescent LakeLynx Lake
Colorado River - Topock AreaLake Mohave
Colorado River - Ehrenberg / Blythe to YumaBear Canyon Lake
Black Canyon LakeDead Horse Lake
Kaibab LakeTonto Creek (Salt River Drainage)
Tempe Town LakeKnoll LakeLake Mead
Dogtown ReservoirCanyon Creek
Nelson ReservoirLake Mary (Lower)
Red Mountain LakeColorado River - Parker Strip Area
Christopher CreekMittry Lake
Rose Canyon LakeSalt River (above Roosevelt)
Goldwater Lake
Mul
tiple
resp
onse
s al
low
ed
Percent (n=5637)
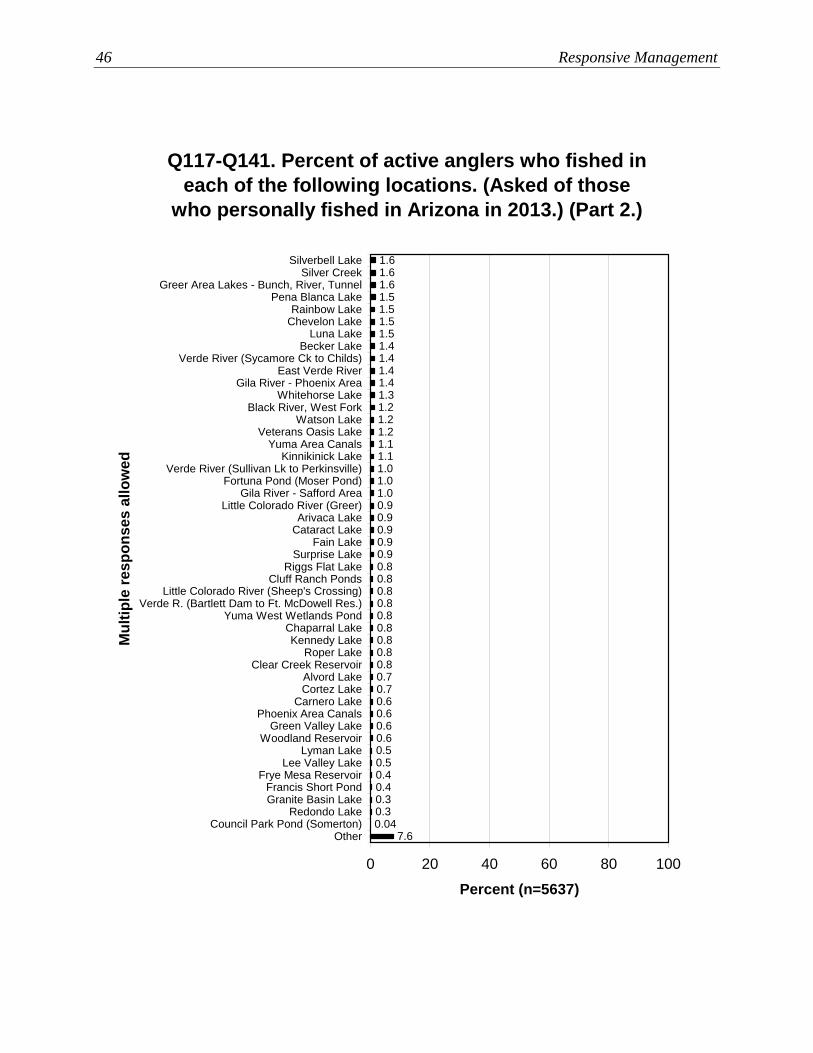
46 Responsive Management
Q117-Q141. Percent of active anglers who fished in each of the following locations. (Asked of those
who personally fished in Arizona in 2013.) (Part 2.)
1.11.11.01.01.00.90.90.90.90.90.80.80.80.80.80.80.80.80.80.70.70.60.60.60.60.50.50.40.40.30.3
7.60.04
1.41.41.5
1.61.61.61.51.51.5
1.41.41.31.21.21.2
0 20 40 60 80 100
Silverbell LakeSilver Creek
Greer Area Lakes - Bunch, River, TunnelPena Blanca Lake
Rainbow LakeChevelon Lake
Luna LakeBecker Lake
Verde River (Sycamore Ck to Childs)East Verde River
Gila River - Phoenix AreaWhitehorse Lake
Black River, West ForkWatson Lake
Veterans Oasis LakeYuma Area Canals
Kinnikinick LakeVerde River (Sullivan Lk to Perkinsville)
Fortuna Pond (Moser Pond)Gila River - Safford Area
Little Colorado River (Greer)Arivaca Lake
Cataract LakeFain Lake
Surprise LakeRiggs Flat Lake
Cluff Ranch PondsLittle Colorado River (Sheep's Crossing)
Verde R. (Bartlett Dam to Ft. McDowell Res.)Yuma West Wetlands Pond
Chaparral LakeKennedy Lake
Roper LakeClear Creek Reservoir
Alvord LakeCortez Lake
Carnero LakePhoenix Area Canals
Green Valley LakeWoodland Reservoir
Lyman LakeLee Valley Lake
Frye Mesa ReservoirFrancis Short PondGranite Basin Lake
Redondo LakeCouncil Park Pond (Somerton)
Other
Mul
tiple
resp
onse
s al
low
ed
Percent (n=5637)

Arizona Anglers’ Opinions, Attitudes, and Expenditures in the State 47
Q117-Q141. Percent of active anglers who fished in each of the following locations. (Asked of those
who personally fished in Arizona in 2013.) (Part 1, alphabetically.)
0.90.81.51.9
0.80.8
2.75.7
1.92.8
0.70.0
2.92.42.11.40.9
3.31.00.40.41.41.01.7
0.30.61.62.3
0.81.12.2
5.5
12.31.42.7
5.60.7
6.90.9
3.79.6
2.63.0
1.22.1
9.80.6
0 20 40 60 80 100
Alamo LakeAlvord Lake
Apache LakeArivaca LakeAshurst LakeBartlett Lake
Bear Canyon LakeBecker Lake
Big LakeBlack Canyon Lake
Black River, East ForkBlack River, West Fork
Canyon CreekCanyon LakeCarnero LakeCataract Lake
Chaparral LakeChevelon Lake
Christopher CreekClear Creek Reservoir
Cluff Ranch PondsColorado River - Ehrenberg /Colorado River - Lees Ferry
Colorado River - Parker StripColorado River - Topock Area
Cortez LakeCouncil Park Pond (Somerton)
Crescent LakeDead Horse Lake
Dogtown ReservoirEast Verde River
Fain LakeFool Hollow Lake
Fortuna Pond (Moser Pond)Francis Short Pond
Frye Mesa ReservoirGila River - Phoenix AreaGila River - Safford Area
Goldwater LakeGranite Basin LakeGreen Valley Lake
Greer Area Lakes - Bunch,Kaibab Lake
Kennedy LakeKinnikinick Lake
Knoll LakeLake Havasu
Mul
tiple
resp
onse
s al
low
ed
Percent (n=5637)

48 Responsive Management
Q117-Q141. Percent of active anglers who fished in each of the following locations. (Asked of those
who personally fished in Arizona in 2013.) (Part 2, alphabetically.)
3.45.7
1.50.61.52.0
0.30.8
18.40.81.8
9.41.8
4.33.1
1.61.60.92.22.3
0.81.01.41.21.21.3
8.40.6
9.61.10.8
7.60
0.80.90.5
2.03.8
2.22.7
14.24.7
1.50.5
2.91.82.13.1
0 20 40 60 80 100
Lake Mary (Lower)Lake Mary (Upper)
Lake MeadLake Mohave
Lake PleasantLake Powell
Lee Valley LakeLittle Colorado River (Greer)
Little Colorado River (Sheep's Crossing)Luna Lake
Lyman LakeLynx Lake
Mittry LakeNelson Reservoir
Oak CreekParker Canyon Lake
Patagonia LakePena Blanca Lake
Phoenix Area CanalsRainbow Lake
Red Mountain LakeRedondo Lake
Riggs Flat LakeRoosevelt Lake
Roper LakeRose Canyon Lake
Saguaro LakeSalt River (above Roosevelt)
Salt River (below Saguaro)Show Low Lake
Silver CreekSilverbell LakeSurprise Lake
Tempe Town LakeTonto Creek (Salt River Drainage)
Verde R. (Bartlett Dam to Ft. McDowellVerde River (Sullivan Lk to Perkinsville)
Verde River (Sycamore Ck to Childs)Veterans Oasis Lake
Watson LakeWhitehorse Lake
Willow Springs LakeWoodland ReservoirWoods Canyon Lake
Yuma Area CanalsYuma West Wetlands Pond
Other
Mul
tiple
resp
onse
s al
low
ed
Percent (n=5637)

Arizona Anglers’ Opinions, Attitudes, and Expenditures in the State 49
Q117-Q141. Percent of active anglers who fished in each of the following locations. (Asked of those who personally fished in Arizona in 2013.) (Part 1, alphabetically.)
Bodies of Water
Apa
che
Coc
hise
Coc
onin
o
Gila
Gra
ham
Gre
enle
e
La
Paz
Mar
icop
a
Alamo Lake 1.0 2.7 1.2 2.4 1.2 1.3 31.9 6.6 Alvord Lake 0.0 0.0 0.0 0.0 0.0 0.0 0.0 1.4 Apache Lake 3.9 3.9 4.3 22.2 7.9 4.0 0.0 7.7 Arivaca Lake 0.0 0.9 0.2 0.0 0.0 0.0 0.0 0.2 Ashurst Lake 0.0 0.3 28.6 0.3 0.4 0.0 0.0 3.0 Bartlett Lake 0.0 2.4 2.9 2.1 0.0 0.0 1.4 17.1 Bear Canyon Lake 1.0 0.6 1.2 5.2 0.0 0.0 0.0 3.9 Becker Lake 13.5 1.2 1.0 1.2 0.8 4.0 0.0 1.1 Big Lake 67.1 15.9 6.2 10.1 32.5 44.6 1.4 10.1 Black Canyon Lake 1.4 0.3 0.0 4.6 0.8 0.0 0.0 3.9 Black River, East Fork 13.0 7.8 1.4 1.2 7.1 17.5 1.4 2.9 Black River, West Fork 6.8 2.7 1.4 2.1 5.0 4.0 0.0 0.5 Canyon Creek 0.0 0.0 1.0 3.7 0.0 0.0 0.0 3.6 Canyon Lake 2.9 1.2 1.0 2.4 2.1 1.3 0.0 16.5 Carnero Lake 0.5 0.3 0.2 0.3 0.0 0.0 0.0 0.9 Cataract Lake 0.0 0.3 9.1 0.3 0.0 0.0 0.0 0.2 Chaparral Lake 0.0 0.0 0.0 0.0 0.4 0.0 0.0 1.5 Chevelon Lake 0.0 0.6 1.4 4.0 0.0 0.0 0.0 2.1 Christopher Creek 0.0 0.3 0.7 4.9 0.4 0.0 0.0 2.9 Clear Creek Reservoir 0.0 0.0 1.7 0.3 0.0 0.0 1.4 0.6 Cluff Ranch Ponds 1.0 1.5 0.0 0.0 40.8 20.2 0.0 0.2 Colorado River - Lees Ferry 2.9 1.8 20.8 1.8 0.4 0.0 8.4 4.8 Colorado River - Parker Strip Area 1.0 0.9 1.0 0.9 0.4 0.0 48.6 1.1 Colorado River - Topock Area 0.5 0.0 1.2 0.0 1.7 0.0 4.1 0.5 Colorado River - Ehrenberg / Blythe to Yuma 1.4 1.5 0.2 0.9 1.2 0.0 16.7 0.8
Cortez Lake 0.0 0.0 0.0 0.0 0.0 0.0 1.4 1.4 Council Park Pond (Somerton) 0.5 0.0 0.0 0.0 0.0 0.0 1.4 0.0 Crescent Lake 20.8 5.4 2.4 2.4 9.6 6.7 0.0 1.8 Dead Horse Lake 0.0 0.0 2.6 0.9 0.4 0.0 1.4 2.3 Dogtown Reservoir 0.0 0.0 8.4 0.3 0.0 0.0 5.6 1.5 East Verde River 0.5 0.3 0.7 11.3 0.8 0.0 0.0 1.7 Fain Lake 0.0 0.0 0.0 0.0 0.0 0.0 0.0 0.0 Fool Hollow Lake 8.2 1.8 0.0 2.8 2.9 2.7 0.0 2.3 Fortuna Pond (Moser Pond) 0.0 0.0 0.0 0.3 0.4 0.0 0.0 0.0 Francis Short Pond 0.0 0.0 7.9 0.0 0.0 0.0 0.0 0.0 Frye Mesa Reservoir 0.5 1.5 0.0 0.0 18.3 4.0 0.0 0.2 Gila River - Phoenix Area 1.4 0.6 0.2 0.3 2.1 9.4 0.0 2.0 Gila River - Safford Area 1.4 2.4 0.0 1.2 32.9 22.9 1.4 0.2 Goldwater Lake 0.0 0.0 0.0 0.0 0.0 0.0 0.0 1.1
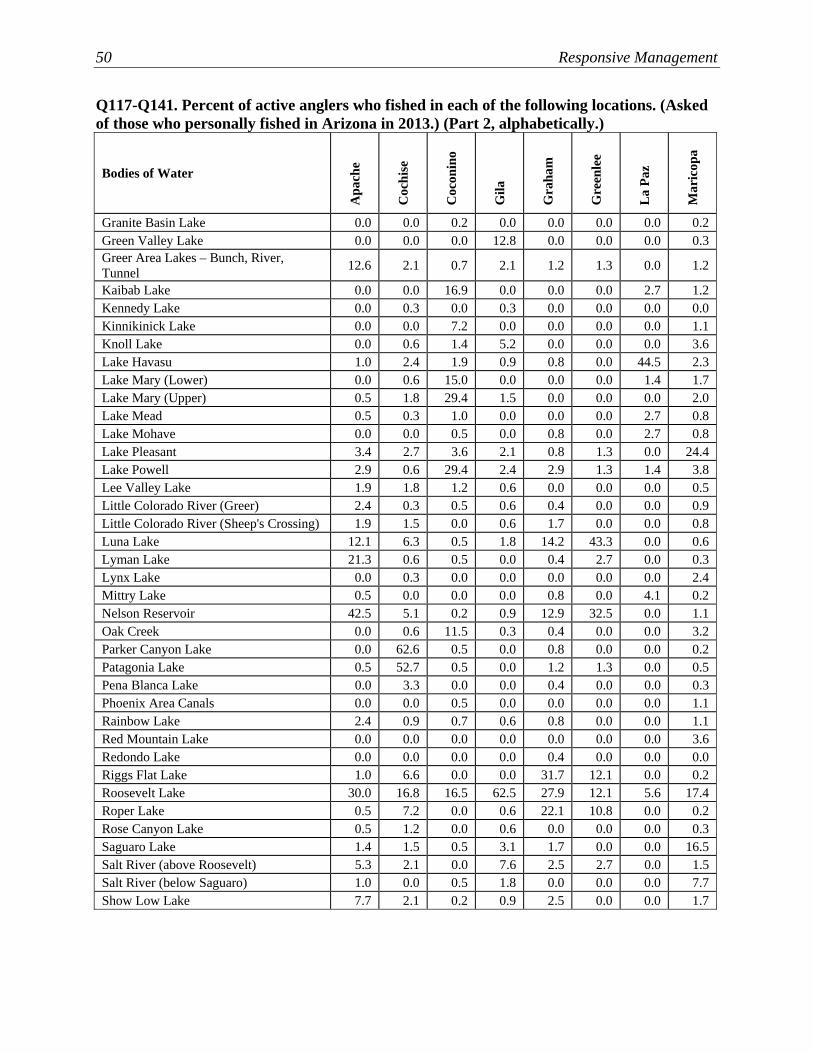
50 Responsive Management
Q117-Q141. Percent of active anglers who fished in each of the following locations. (Asked of those who personally fished in Arizona in 2013.) (Part 2, alphabetically.)
Bodies of Water
Apa
che
Coc
hise
Coc
onin
o
Gila
Gra
ham
Gre
enle
e
La
Paz
Mar
icop
a
Granite Basin Lake 0.0 0.0 0.2 0.0 0.0 0.0 0.0 0.2 Green Valley Lake 0.0 0.0 0.0 12.8 0.0 0.0 0.0 0.3 Greer Area Lakes – Bunch, River, Tunnel 12.6 2.1 0.7 2.1 1.2 1.3 0.0 1.2
Kaibab Lake 0.0 0.0 16.9 0.0 0.0 0.0 2.7 1.2 Kennedy Lake 0.0 0.3 0.0 0.3 0.0 0.0 0.0 0.0 Kinnikinick Lake 0.0 0.0 7.2 0.0 0.0 0.0 0.0 1.1 Knoll Lake 0.0 0.6 1.4 5.2 0.0 0.0 0.0 3.6 Lake Havasu 1.0 2.4 1.9 0.9 0.8 0.0 44.5 2.3 Lake Mary (Lower) 0.0 0.6 15.0 0.0 0.0 0.0 1.4 1.7 Lake Mary (Upper) 0.5 1.8 29.4 1.5 0.0 0.0 0.0 2.0 Lake Mead 0.5 0.3 1.0 0.0 0.0 0.0 2.7 0.8 Lake Mohave 0.0 0.0 0.5 0.0 0.8 0.0 2.7 0.8 Lake Pleasant 3.4 2.7 3.6 2.1 0.8 1.3 0.0 24.4 Lake Powell 2.9 0.6 29.4 2.4 2.9 1.3 1.4 3.8 Lee Valley Lake 1.9 1.8 1.2 0.6 0.0 0.0 0.0 0.5 Little Colorado River (Greer) 2.4 0.3 0.5 0.6 0.4 0.0 0.0 0.9 Little Colorado River (Sheep's Crossing) 1.9 1.5 0.0 0.6 1.7 0.0 0.0 0.8 Luna Lake 12.1 6.3 0.5 1.8 14.2 43.3 0.0 0.6 Lyman Lake 21.3 0.6 0.5 0.0 0.4 2.7 0.0 0.3 Lynx Lake 0.0 0.3 0.0 0.0 0.0 0.0 0.0 2.4 Mittry Lake 0.5 0.0 0.0 0.0 0.8 0.0 4.1 0.2 Nelson Reservoir 42.5 5.1 0.2 0.9 12.9 32.5 0.0 1.1 Oak Creek 0.0 0.6 11.5 0.3 0.4 0.0 0.0 3.2 Parker Canyon Lake 0.0 62.6 0.5 0.0 0.8 0.0 0.0 0.2 Patagonia Lake 0.5 52.7 0.5 0.0 1.2 1.3 0.0 0.5 Pena Blanca Lake 0.0 3.3 0.0 0.0 0.4 0.0 0.0 0.3 Phoenix Area Canals 0.0 0.0 0.5 0.0 0.0 0.0 0.0 1.1 Rainbow Lake 2.4 0.9 0.7 0.6 0.8 0.0 0.0 1.1 Red Mountain Lake 0.0 0.0 0.0 0.0 0.0 0.0 0.0 3.6 Redondo Lake 0.0 0.0 0.0 0.0 0.4 0.0 0.0 0.0 Riggs Flat Lake 1.0 6.6 0.0 0.0 31.7 12.1 0.0 0.2 Roosevelt Lake 30.0 16.8 16.5 62.5 27.9 12.1 5.6 17.4 Roper Lake 0.5 7.2 0.0 0.6 22.1 10.8 0.0 0.2 Rose Canyon Lake 0.5 1.2 0.0 0.6 0.0 0.0 0.0 0.3 Saguaro Lake 1.4 1.5 0.5 3.1 1.7 0.0 0.0 16.5 Salt River (above Roosevelt) 5.3 2.1 0.0 7.6 2.5 2.7 0.0 1.5 Salt River (below Saguaro) 1.0 0.0 0.5 1.8 0.0 0.0 0.0 7.7 Show Low Lake 7.7 2.1 0.2 0.9 2.5 0.0 0.0 1.7

Arizona Anglers’ Opinions, Attitudes, and Expenditures in the State 51
Q117-Q141. Percent of active anglers who fished in each of the following locations. (Asked of those who personally fished in Arizona in 2013.) (Part 3, alphabetically.)
Bodies of Water
Apa
che
Coc
hise
Coc
onin
o
Gila
Gra
ham
Gre
enle
e
La
Paz
Mar
icop
a
Silver Creek 1.0 1.2 0.7 1.2 0.8 0.0 0.0 1.4 Silverbell Lake 0.0 1.2 0.0 0.3 0.0 0.0 0.0 0.0 Surprise Lake 0.5 0.6 0.0 0.6 0.0 0.0 0.0 1.5 Tempe Town Lake 0.0 0.0 0.2 0.0 0.0 0.0 1.4 4.2 Tonto Creek (Salt River Drainage) 0.0 0.3 0.5 11.0 0.0 0.0 0.0 3.6 Verde River (Bartlett Dam to Fort McDowell Indian Reservation) 0.0 0.3 0.2 0.9 0.8 0.0 0.0 1.1
Verde River (Sullivan Lake to Perkinsville) 0.0 0.0 1.0 0.9 0.0 0.0 0.0 0.6
Verde River (Sycamore Ck to Childs) 0.0 0.0 2.6 0.6 0.0 0.0 0.0 1.2 Veterans Oasis Lake 0.0 0.0 0.0 0.0 0.0 0.0 0.0 2.1 Watson Lake 0.0 0.3 0.7 0.0 0.0 0.0 0.0 0.6 Whitehorse Lake 0.0 0.3 7.2 0.3 0.0 0.0 4.1 0.8 Willow Springs Lake 1.9 1.2 0.7 29.9 0.4 0.0 0.0 12.9 Woodland Reservoir 1.0 0.0 0.2 0.3 0.0 0.0 0.0 0.5 Woods Canyon Lake 1.9 1.2 1.2 21.3 0.8 1.3 0.0 15.6 Yuma Area Canals 0.0 0.3 0.0 0.3 0.0 0.0 1.4 0.2 Yuma West Wetlands Pond 0.0 0.3 0.2 0.0 0.0 1.3 1.4 0.3 Other 6.3 5.7 9.3 7.3 9.1 32.5 5.6 7.7

52 Responsive Management
Q117-Q141. Percent of active anglers who fished in each of the following locations. (Asked of those who personally fished in Arizona in 2013.) (Part 1, alphabetically.)
Bodies of Water
Moh
ave
Nav
ajo
Pim
a
Pina
l
Sant
a C
ruz
Yav
apai
Yum
a
Out
-of-
Stat
e
Alamo Lake 8.1 0.3 1.7 3.4 1.4 13.1 7.0 5.2 Alvord Lake 0.3 0.0 0.0 0.2 0.0 0.0 0.0 0.7 Apache Lake 0.5 4.8 11.2 13.7 7.0 3.7 1.0 1.7 Arivaca Lake 0.0 0.0 6.5 1.0 7.0 0.0 0.0 0.5 Ashurst Lake 1.6 2.5 1.2 1.7 0.0 8.5 0.2 0.3 Bartlett Lake 0.5 1.0 1.2 6.4 1.4 9.0 0.2 3.7 Bear Canyon Lake 0.0 4.8 1.7 4.9 0.0 1.1 0.5 0.0 Becker Lake 0.0 6.8 2.3 1.2 0.0 0.2 0.5 1.3 Big Lake 3.5 42.2 19.6 17.6 11.2 7.9 2.7 3.7 Black Canyon Lake 0.0 7.8 1.0 4.2 0.0 0.4 1.0 0.0 Black River, East Fork 0.3 6.8 4.7 2.7 1.4 1.3 0.7 0.8 Black River, West Fork 0.0 5.3 2.8 1.5 0.0 1.3 0.2 0.5 Canyon Creek 0.0 1.8 0.2 2.4 1.4 0.7 0.2 0.3 Canyon Lake 0.0 0.5 5.0 24.0 0.0 0.9 0.7 3.4 Carnero Lake 0.3 2.0 0.7 0.5 0.0 0.0 0.0 0.0 Cataract Lake 1.9 0.0 0.0 0.2 0.0 4.6 0.0 0.2 Chaparral Lake 0.0 0.3 0.0 0.2 0.0 0.2 0.0 0.5 Chevelon Lake 0.0 6.8 0.3 0.5 0.0 0.4 0.2 0.2 Christopher Creek 0.5 0.7 0.7 2.7 0.0 1.3 0.0 0.5 Clear Creek Reservoir 0.0 6.0 0.3 0.0 0.0 1.8 0.5 0.3 Cluff Ranch Ponds 0.0 1.0 0.2 0.0 1.4 0.0 0.5 0.0 Colorado River - Lees Ferry 7.3 5.0 2.5 1.2 2.9 7.6 3.2 10.5 Colorado River - Parker Strip Area 8.1 0.0 0.8 0.7 0.0 2.6 3.2 3.9 Colorado River - Topock Area 35.3 0.0 0.7 0.5 1.4 2.0 1.5 5.7 Colorado River - Ehrenberg / Blythe to Yuma 0.5 0.0 0.5 1.0 4.3 1.3 52.0 4.4
Cortez Lake 0.3 0.0 0.0 0.0 0.0 0.2 0.2 0.0 Council Park Pond (Somerton) 0.0 0.0 0.0 0.0 0.0 0.0 0.5 0.2 Crescent Lake 0.8 11.8 4.3 4.6 1.4 1.3 1.0 2.0 Dead Horse Lake 0.5 0.7 0.5 0.7 0.0 16.4 0.5 1.0 Dogtown Reservoir 6.7 0.7 0.5 0.7 0.0 9.0 0.7 0.2 East Verde River 0.0 0.5 0.7 0.7 0.0 2.8 0.0 0.0 Fain Lake 0.0 0.0 0.0 0.2 0.0 15.5 0.2 0.2 Fool Hollow Lake 1.3 30.2 4.3 5.6 0.0 3.1 0.7 0.7 Fortuna Pond (Moser Pond) 0.0 0.0 0.2 0.0 0.0 0.2 28.5 0.2 Francis Short Pond 0.0 0.0 0.0 0.0 0.0 0.4 0.0 0.0 Frye Mesa Reservoir 0.0 0.3 0.2 0.0 0.0 0.0 0.0 0.2 Gila River - Phoenix Area 0.0 0.3 0.5 2.2 0.0 0.0 3.7 0.8 Gila River - Safford Area 0.0 0.3 0.8 1.5 0.0 0.0 1.5 0.3 Goldwater Lake 0.0 0.3 0.2 0.7 0.0 20.1 0.2 0.0
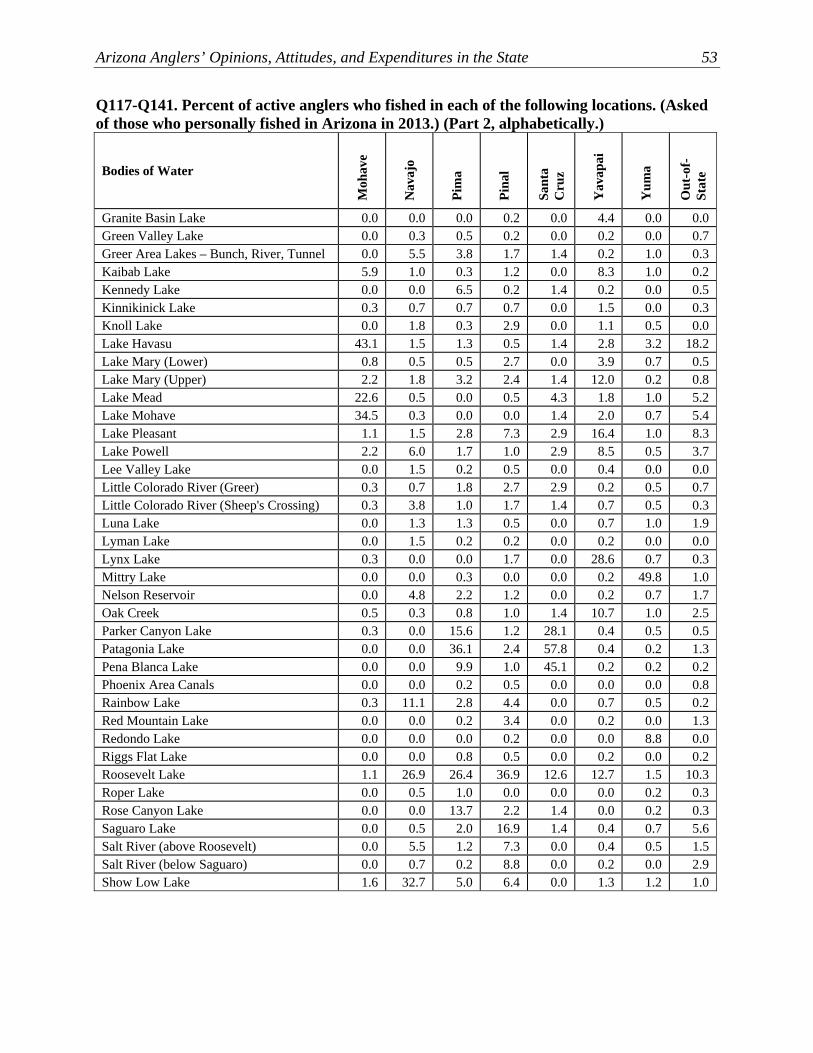
Arizona Anglers’ Opinions, Attitudes, and Expenditures in the State 53
Q117-Q141. Percent of active anglers who fished in each of the following locations. (Asked of those who personally fished in Arizona in 2013.) (Part 2, alphabetically.)
Bodies of Water
Moh
ave
Nav
ajo
Pim
a
Pina
l
Sant
a C
ruz
Yav
apai
Yum
a
Out
-of-
Stat
e
Granite Basin Lake 0.0 0.0 0.0 0.2 0.0 4.4 0.0 0.0 Green Valley Lake 0.0 0.3 0.5 0.2 0.0 0.2 0.0 0.7 Greer Area Lakes – Bunch, River, Tunnel 0.0 5.5 3.8 1.7 1.4 0.2 1.0 0.3 Kaibab Lake 5.9 1.0 0.3 1.2 0.0 8.3 1.0 0.2 Kennedy Lake 0.0 0.0 6.5 0.2 1.4 0.2 0.0 0.5 Kinnikinick Lake 0.3 0.7 0.7 0.7 0.0 1.5 0.0 0.3 Knoll Lake 0.0 1.8 0.3 2.9 0.0 1.1 0.5 0.0 Lake Havasu 43.1 1.5 1.3 0.5 1.4 2.8 3.2 18.2 Lake Mary (Lower) 0.8 0.5 0.5 2.7 0.0 3.9 0.7 0.5 Lake Mary (Upper) 2.2 1.8 3.2 2.4 1.4 12.0 0.2 0.8 Lake Mead 22.6 0.5 0.0 0.5 4.3 1.8 1.0 5.2 Lake Mohave 34.5 0.3 0.0 0.0 1.4 2.0 0.7 5.4 Lake Pleasant 1.1 1.5 2.8 7.3 2.9 16.4 1.0 8.3 Lake Powell 2.2 6.0 1.7 1.0 2.9 8.5 0.5 3.7 Lee Valley Lake 0.0 1.5 0.2 0.5 0.0 0.4 0.0 0.0 Little Colorado River (Greer) 0.3 0.7 1.8 2.7 2.9 0.2 0.5 0.7 Little Colorado River (Sheep's Crossing) 0.3 3.8 1.0 1.7 1.4 0.7 0.5 0.3 Luna Lake 0.0 1.3 1.3 0.5 0.0 0.7 1.0 1.9 Lyman Lake 0.0 1.5 0.2 0.2 0.0 0.2 0.0 0.0 Lynx Lake 0.3 0.0 0.0 1.7 0.0 28.6 0.7 0.3 Mittry Lake 0.0 0.0 0.3 0.0 0.0 0.2 49.8 1.0 Nelson Reservoir 0.0 4.8 2.2 1.2 0.0 0.2 0.7 1.7 Oak Creek 0.5 0.3 0.8 1.0 1.4 10.7 1.0 2.5 Parker Canyon Lake 0.3 0.0 15.6 1.2 28.1 0.4 0.5 0.5 Patagonia Lake 0.0 0.0 36.1 2.4 57.8 0.4 0.2 1.3 Pena Blanca Lake 0.0 0.0 9.9 1.0 45.1 0.2 0.2 0.2 Phoenix Area Canals 0.0 0.0 0.2 0.5 0.0 0.0 0.0 0.8 Rainbow Lake 0.3 11.1 2.8 4.4 0.0 0.7 0.5 0.2 Red Mountain Lake 0.0 0.0 0.2 3.4 0.0 0.2 0.0 1.3 Redondo Lake 0.0 0.0 0.0 0.2 0.0 0.0 8.8 0.0 Riggs Flat Lake 0.0 0.0 0.8 0.5 0.0 0.2 0.0 0.2 Roosevelt Lake 1.1 26.9 26.4 36.9 12.6 12.7 1.5 10.3 Roper Lake 0.0 0.5 1.0 0.0 0.0 0.0 0.2 0.3 Rose Canyon Lake 0.0 0.0 13.7 2.2 1.4 0.0 0.2 0.3 Saguaro Lake 0.0 0.5 2.0 16.9 1.4 0.4 0.7 5.6 Salt River (above Roosevelt) 0.0 5.5 1.2 7.3 0.0 0.4 0.5 1.5 Salt River (below Saguaro) 0.0 0.7 0.2 8.8 0.0 0.2 0.0 2.9 Show Low Lake 1.6 32.7 5.0 6.4 0.0 1.3 1.2 1.0
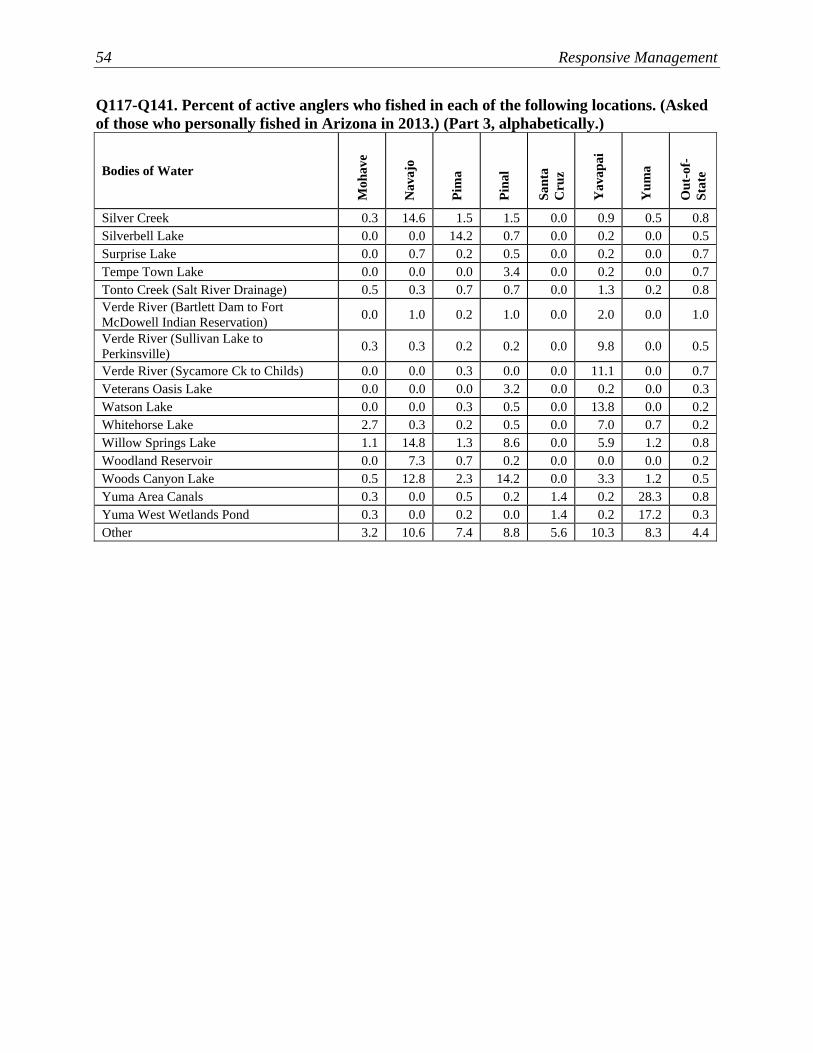
54 Responsive Management
Q117-Q141. Percent of active anglers who fished in each of the following locations. (Asked of those who personally fished in Arizona in 2013.) (Part 3, alphabetically.)
Bodies of Water
Moh
ave
Nav
ajo
Pim
a
Pina
l
Sant
a C
ruz
Yav
apai
Yum
a
Out
-of-
Stat
e
Silver Creek 0.3 14.6 1.5 1.5 0.0 0.9 0.5 0.8 Silverbell Lake 0.0 0.0 14.2 0.7 0.0 0.2 0.0 0.5 Surprise Lake 0.0 0.7 0.2 0.5 0.0 0.2 0.0 0.7 Tempe Town Lake 0.0 0.0 0.0 3.4 0.0 0.2 0.0 0.7 Tonto Creek (Salt River Drainage) 0.5 0.3 0.7 0.7 0.0 1.3 0.2 0.8 Verde River (Bartlett Dam to Fort McDowell Indian Reservation) 0.0 1.0 0.2 1.0 0.0 2.0 0.0 1.0
Verde River (Sullivan Lake to Perkinsville) 0.3 0.3 0.2 0.2 0.0 9.8 0.0 0.5
Verde River (Sycamore Ck to Childs) 0.0 0.0 0.3 0.0 0.0 11.1 0.0 0.7 Veterans Oasis Lake 0.0 0.0 0.0 3.2 0.0 0.2 0.0 0.3 Watson Lake 0.0 0.0 0.3 0.5 0.0 13.8 0.0 0.2 Whitehorse Lake 2.7 0.3 0.2 0.5 0.0 7.0 0.7 0.2 Willow Springs Lake 1.1 14.8 1.3 8.6 0.0 5.9 1.2 0.8 Woodland Reservoir 0.0 7.3 0.7 0.2 0.0 0.0 0.0 0.2 Woods Canyon Lake 0.5 12.8 2.3 14.2 0.0 3.3 1.2 0.5 Yuma Area Canals 0.3 0.0 0.5 0.2 1.4 0.2 28.3 0.8 Yuma West Wetlands Pond 0.3 0.0 0.2 0.0 1.4 0.2 17.2 0.3 Other 3.2 10.6 7.4 8.8 5.6 10.3 8.3 4.4

Arizona Anglers’ Opinions, Attitudes, and Expenditures in the State 55
Q234. Where did you go on your most recent fishing trip in Arizona in 2013? (Asked of those
who personally fished in Arizona in 2013.) (Part 1.)
0.70.70.70.70.70.70.70.70.70.80.80.80.80.80.80.80.80.90.90.90.91.01.01.11.11.11.21.21.21.21.31.31.31.61.72.02.22.82.8
3.73.83.94.6
6.77.0
3.73.22.9
0 20 40 60 80 100
Lake PleasantRoosevelt Lake
Big LakeSaguaro Lake
Woods Canyon LakeBartlett LakeLake HavasuCanyon Lake
Patagonia LakeWillow Springs Lake
Colorado River - Lees FerryApache LakeLake Powell
Colorado River - Ehrenberg /Colorado River - Topock Area
Parker Canyon LakeRed Mountain Lake
Show Low LakeAlamo Lake
Lake Mary (Upper)Oak Creek
Salt River (below Saguaro)Lynx Lake
Ashurst LakeLake Mead
Silverbell LakeDead Horse Lake
Lake MohaveSilver CreekKaibab Lake
Black River, East ForkMittry Lake
Veterans Oasis LakeTonto Creek (Salt River Drainage)Colorado River - Parker Strip Area
Fool Hollow LakeBlack Canyon Lake
Salt River (above Roosevelt)Goldwater Lake
Knoll LakeBear Canyon LakePena Blanca LakeTempe Town LakeRose Canyon Lake
Canyon CreekGila River - Phoenix Area
Nelson ReservoirDogtown Reservoir
Percent (n=5637)

56 Responsive Management
Q234. Where did you go on your most recent fishing trip in Arizona in 2013? (Asked of those
who personally fished in Arizona in 2013.) (Part 2.)
1.73.7
0.020.040.040.050.10.10.10.10.10.10.10.20.20.20.20.20.20.20.20.20.30.30.30.30.30.30.30.30.30.30.40.40.40.40.40.4
0.40.40.50.50.50.5
0.40.40.4
0 20 40 60 80 100
Cortez LakeRainbow Lake
Greer Area Lakes - Bunch, River, TunnelSurprise Lake
Yuma Area CanalsClear Creek Reservoir
Verde River (Sycamore Ck to Childs)Lake Mary (Lower)
Gila River - Safford AreaChaparral LakeRiggs Flat Lake
Green Valley LakeVerde River (Sullivan Lk to Perkinsville)
Chevelon LakeFortuna Pond (Moser Pond)
Verde River (Bartlett Dam - Ft McDowellLuna Lake
Crescent LakeCluff Ranch Ponds
Little Colorado River (Greer)Christopher Creek
Cataract LakeBecker Lake
Whitehorse LakeKennedy Lake
East Verde RiverFain Lake
Alvord LakePhoenix Area Canals
Watson LakeYuma West Wetlands Pond
Little Colorado River (Sheep's Crossing)Arivaca Lake
Francis Short PondLyman LakeRoper Lake
Black River, West ForkCarnero Lake
Lee Valley LakeRedondo Lake
Kinnikinick LakeWoodland ReservoirFrye Mesa Reservoir
Granite Basin LakeCouncil Park Pond (Somerton)
OtherDon't know
Percent (n=5637)

Arizona Anglers’ Opinions, Attitudes, and Expenditures in the State 57
Q234. Where did you go on your most recent fishing trip in Arizona in 2013? (Asked of those
who personally fished in Arizona in 2013.) (Part 1, alphabetically.)
3.70.70.10.30.90.50.40.040.80.40.70.040.20.40.80.20.20.71.00.30.020.51.70.81.62.8
0.30.40.30.40.40.30.13.2
0.70.10.90.8
3.71.10.22.2
0.21.2
0.70.3
4.6
0 20 40 60 80 100
Alamo LakeAlvord Lake
Apache LakeArivaca LakeAshurst LakeBartlett Lake
Bear Canyon LakeBecker Lake
Big LakeBlack Canyon Lake
Black River, East ForkBlack River, West Fork
Canyon CreekCanyon LakeCarnero LakeCataract Lake
Chaparral LakeChevelon Lake
Christopher CreekClear Creek Reservoir
Cluff Ranch PondsColorado River - Lees Ferry
Colorado River - Topock AreaColorado River - Parker Strip Area
Colorado River - Ehrenberg / Blythe to YumaCortez Lake
Council Park Pond (Somerton)Crescent Lake
Dead Horse LakeDogtown Reservoir
East Verde RiverFain Lake
Fool Hollow LakeFortuna Pond (Moser Pond)
Francis Short PondFrye Mesa Reservoir
Gila River - Phoenix AreaGila River - Safford Area
Goldwater LakeGranite Basin LakeGreen Valley Lake
Greer Area Lakes - Bunch, River, TunnelKaibab Lake
Kennedy LakeKinnikinick Lake
Knoll LakeLake Havasu
Percent (n=5637)

58 Responsive Management
Q234. Where did you go on your most recent fishing trip in Arizona in 2013? (Asked of those
who personally fished in Arizona in 2013.) (Part 2, alphabetically.)
1.73.7
0.20.4
3.80.052.8
0.30.20.80.30.40.40.80.70.51.00.91.31.20.8
3.90.70.1
6.70.40.11.30.50.20.7
2.91.31.20.70.81.10.30.1
2.07.0
0.91.11.20.4
0.10.20.3
0 20 40 60 80 100
Lake Mary (Lower)Lake Mary (Upper)
Lake MeadLake Mohave
Lake PleasantLake Powell
Lee Valley LakeLittle Colorado River (Sheep's
Little Colorado River (Greer)Lyman Lake
Luna LakeLynx Lake
Mittry LakeNelson Reservoir
Oak CreekParker Canyon Lake
Patagonia LakePena Blanca Lake
Phoenix Area CanalsRainbow Lake
Red Mountain LakeRedondo Lake
Riggs Flat LakeRoosevelt Lake
Roper LakeRose Canyon Lake
Saguaro LakeSalt River (above Roosevelt)
Salt River (below Saguaro)Show Low Lake
Silver CreekSilverbell LakeSurprise Lake
Tempe Town LakeTonto Creek (Salt River Drainage)
Verde River (Sullivan Lk toVerde River (Sycamore Ck to Childs)
Verde River (Bartlett Dam - FtVeterans Oasis Lake
Watson LakeWhitehorse Lake
Willow Springs LakeWoodland ReservoirWoods Canyon Lake
Yuma Area CanalsYuma West Wetlands Pond
OtherDon't know
Percent (n=5637)

Arizona Anglers’ Opinions, Attitudes, and Expenditures in the State 59
Q234. Where did you go on your most recent fishing trip in Arizona in 2013? (Asked of those who personally fished in Arizona in 2013.) (Part 1, alphabetically.)
Bodies of Water
Apa
che
Coc
hise
Coc
onin
o
Gila
Gra
ham
Gre
enle
e
La
Paz
Mar
icop
a
Alamo Lake 0.0 0.9 0.2 0.0 0.4 1.4 9.7 0.9 Alvord Lake 0.0 0.0 0.0 0.0 0.0 0.0 0.0 0.5 Apache Lake 0.0 0.3 0.7 7.0 2.5 2.7 0.0 2.6 Arivaca Lake 0.0 0.0 0.0 0.0 0.0 0.0 0.0 0.0 Ashurst Lake 0.0 0.3 11.7 0.0 0.4 0.0 0.0 0.8 Bartlett Lake 0.0 0.9 0.7 0.0 0.0 0.0 0.0 6.9 Bear Canyon Lake 0.5 0.0 0.0 0.6 0.0 0.0 1.4 1.2 Becker Lake 1.4 0.0 0.0 0.3 0.4 1.4 0.0 0.2 Big Lake 30.4 5.7 1.4 2.1 12.2 10.8 1.4 3.6 Black Canyon Lake 0.0 0.0 0.0 0.6 0.4 0.0 0.0 1.4 Black River, East Fork 3.9 2.1 0.0 0.6 1.7 5.4 0.0 1.1 Black River, West Fork 0.0 0.3 0.0 0.6 0.0 0.0 0.0 0.0 Canyon Creek 0.0 0.0 0.0 0.6 0.0 0.0 0.0 1.2 Canyon Lake 0.0 0.0 0.5 0.0 0.0 0.0 0.0 5.4 Carnero Lake 0.0 0.0 0.0 0.0 0.0 0.0 0.0 0.2 Cataract Lake 0.0 0.0 3.1 0.0 0.0 0.0 0.0 0.2 Chaparral Lake 0.0 0.0 0.0 0.0 0.0 0.0 0.0 0.8 Chevelon Lake 0.0 0.3 0.2 0.3 0.0 0.0 0.0 0.5 Christopher Creek 0.0 0.0 0.2 0.3 0.4 0.0 0.0 0.5 Clear Creek Reservoir 0.5 0.0 1.4 0.0 0.0 0.0 1.4 0.3 Cluff Ranch Ponds 0.0 0.0 0.0 0.3 22.6 2.7 1.4 0.0 Colorado River - Lees Ferry 1.0 0.6 10.5 0.0 0.0 0.0 5.6 2.1 Colorado River - Topock Area 0.0 0.0 1.0 0.0 1.2 0.0 0.0 0.2 Colorado River - Parker Strip Area 0.0 0.6 0.7 0.0 0.4 1.4 34.9 0.5 Colorado River –Ehrenberg/Blythe to Yuma 0.0 0.3 0.0 0.0 1.2 0.0 9.7 0.6
Cortez Lake 0.0 0.0 0.0 0.0 0.0 0.0 0.0 1.1 Council Park Pond (Somerton) 0.0 0.0 0.0 0.0 0.0 0.0 0.0 0.0 Crescent Lake 6.3 0.9 0.0 0.0 0.4 0.0 0.0 0.2 Dead Horse Lake 0.0 0.0 1.0 0.3 0.0 0.0 0.0 0.9 Dogtown Reservoir 0.0 0.0 1.0 0.0 0.0 0.0 1.4 0.6 East Verde River 0.0 0.0 0.0 3.1 0.4 0.0 0.0 0.2 Fain Lake 0.0 0.0 0.0 0.0 0.0 0.0 0.0 0.0 Fool Hollow Lake 2.4 0.6 0.0 0.0 0.4 0.0 0.0 0.5 Fortuna Pond (Moser Pond) 0.0 0.0 0.0 0.0 0.0 0.0 0.0 0.0 Francis Short Pond 0.0 0.0 2.9 0.0 0.0 0.0 0.0 0.0 Frye Mesa Reservoir 0.0 0.0 0.0 0.0 2.1 0.0 0.0 0.0 Gila River - Phoenix Area 0.0 0.0 0.0 0.0 0.4 5.4 0.0 1.1 Gila River - Safford Area 0.0 1.2 0.0 0.3 11.3 9.5 0.0 0.3
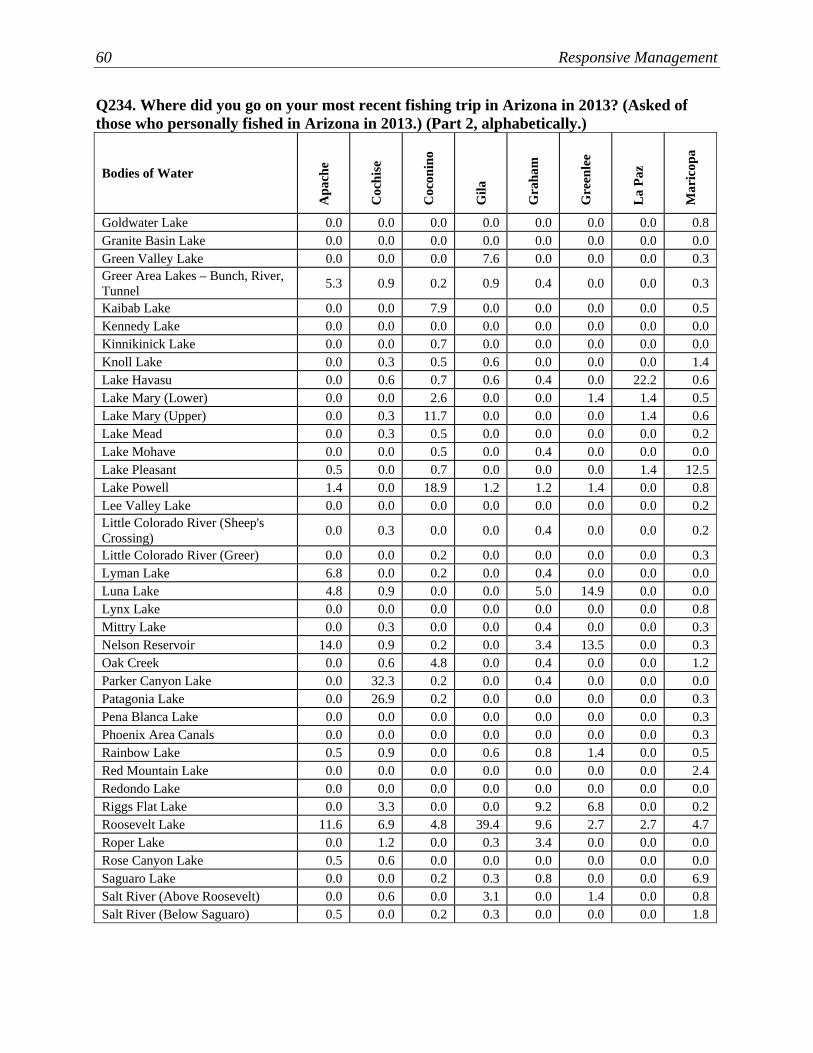
60 Responsive Management
Q234. Where did you go on your most recent fishing trip in Arizona in 2013? (Asked of those who personally fished in Arizona in 2013.) (Part 2, alphabetically.)
Bodies of Water
Apa
che
Coc
hise
Coc
onin
o
Gila
Gra
ham
Gre
enle
e
La
Paz
Mar
icop
a
Goldwater Lake 0.0 0.0 0.0 0.0 0.0 0.0 0.0 0.8 Granite Basin Lake 0.0 0.0 0.0 0.0 0.0 0.0 0.0 0.0 Green Valley Lake 0.0 0.0 0.0 7.6 0.0 0.0 0.0 0.3 Greer Area Lakes – Bunch, River, Tunnel 5.3 0.9 0.2 0.9 0.4 0.0 0.0 0.3
Kaibab Lake 0.0 0.0 7.9 0.0 0.0 0.0 0.0 0.5 Kennedy Lake 0.0 0.0 0.0 0.0 0.0 0.0 0.0 0.0 Kinnikinick Lake 0.0 0.0 0.7 0.0 0.0 0.0 0.0 0.0 Knoll Lake 0.0 0.3 0.5 0.6 0.0 0.0 0.0 1.4 Lake Havasu 0.0 0.6 0.7 0.6 0.4 0.0 22.2 0.6 Lake Mary (Lower) 0.0 0.0 2.6 0.0 0.0 1.4 1.4 0.5 Lake Mary (Upper) 0.0 0.3 11.7 0.0 0.0 0.0 1.4 0.6 Lake Mead 0.0 0.3 0.5 0.0 0.0 0.0 0.0 0.2 Lake Mohave 0.0 0.0 0.5 0.0 0.4 0.0 0.0 0.0 Lake Pleasant 0.5 0.0 0.7 0.0 0.0 0.0 1.4 12.5 Lake Powell 1.4 0.0 18.9 1.2 1.2 1.4 0.0 0.8 Lee Valley Lake 0.0 0.0 0.0 0.0 0.0 0.0 0.0 0.2 Little Colorado River (Sheep's Crossing) 0.0 0.3 0.0 0.0 0.4 0.0 0.0 0.2
Little Colorado River (Greer) 0.0 0.0 0.2 0.0 0.0 0.0 0.0 0.3 Lyman Lake 6.8 0.0 0.2 0.0 0.4 0.0 0.0 0.0 Luna Lake 4.8 0.9 0.0 0.0 5.0 14.9 0.0 0.0 Lynx Lake 0.0 0.0 0.0 0.0 0.0 0.0 0.0 0.8 Mittry Lake 0.0 0.3 0.0 0.0 0.4 0.0 0.0 0.3 Nelson Reservoir 14.0 0.9 0.2 0.0 3.4 13.5 0.0 0.3 Oak Creek 0.0 0.6 4.8 0.0 0.4 0.0 0.0 1.2 Parker Canyon Lake 0.0 32.3 0.2 0.0 0.4 0.0 0.0 0.0 Patagonia Lake 0.0 26.9 0.2 0.0 0.0 0.0 0.0 0.3 Pena Blanca Lake 0.0 0.0 0.0 0.0 0.0 0.0 0.0 0.3 Phoenix Area Canals 0.0 0.0 0.0 0.0 0.0 0.0 0.0 0.3 Rainbow Lake 0.5 0.9 0.0 0.6 0.8 1.4 0.0 0.5 Red Mountain Lake 0.0 0.0 0.0 0.0 0.0 0.0 0.0 2.4 Redondo Lake 0.0 0.0 0.0 0.0 0.0 0.0 0.0 0.0 Riggs Flat Lake 0.0 3.3 0.0 0.0 9.2 6.8 0.0 0.2 Roosevelt Lake 11.6 6.9 4.8 39.4 9.6 2.7 2.7 4.7 Roper Lake 0.0 1.2 0.0 0.3 3.4 0.0 0.0 0.0 Rose Canyon Lake 0.5 0.6 0.0 0.0 0.0 0.0 0.0 0.0 Saguaro Lake 0.0 0.0 0.2 0.3 0.8 0.0 0.0 6.9 Salt River (Above Roosevelt) 0.0 0.6 0.0 3.1 0.0 1.4 0.0 0.8 Salt River (Below Saguaro) 0.5 0.0 0.2 0.3 0.0 0.0 0.0 1.8

Arizona Anglers’ Opinions, Attitudes, and Expenditures in the State 61
Q234. Where did you go on your most recent fishing trip in Arizona in 2013? (Asked of those who personally fished in Arizona in 2013.) (Part 3, alphabetically.)
Bodies of Water
Apa
che
Coc
hise
Coc
onin
o
Gila
Gra
ham
Gre
enle
e
La
Paz
Mar
icop
a
Show Low Lake 2.9 0.9 0.0 0.3 0.0 0.0 0.0 0.8 Silver Creek 0.0 0.6 0.2 0.3 0.0 0.0 0.0 1.2 Silverbell Lake 0.0 0.3 0.0 0.3 0.0 0.0 0.0 0.0 Surprise Lake 0.0 0.0 0.0 0.0 0.0 0.0 0.0 0.9 Tempe Town Lake 0.0 0.0 0.2 0.0 0.0 0.0 0.0 1.4 Tonto Creek (Salt River Drainage) 0.0 0.3 0.0 4.6 0.0 0.0 0.0 1.2 Verde River (Sullivan Lake to Perkinsville) 0.0 0.0 0.0 0.0 0.0 0.0 0.0 0.3
Verde River (Sycamore Ck to Childs) 0.0 0.0 0.0 0.0 0.0 0.0 0.0 0.5
Verde River (Bartlett Dam to Fort McDowell Indian Reservation 0.5 0.0 0.2 0.0 0.4 0.0 1.4 0.5
Veterans Oasis Lake 0.0 0.0 0.0 0.0 0.0 0.0 0.0 1.5 Watson Lake 0.0 0.0 0.2 0.0 0.0 0.0 0.0 0.0 Whitehorse Lake 0.0 0.0 1.4 0.0 0.0 0.0 0.0 0.2 Willow Springs Lake 1.0 0.0 0.0 13.4 0.4 0.0 0.0 4.1 Woodland Reservoir 0.5 0.0 0.0 0.0 0.0 0.0 0.0 0.0 Woods Canyon Lake 0.0 0.6 0.5 4.9 0.4 2.7 0.0 6.6 Yuma West Wetlands Pond 0.0 0.3 0.0 0.0 0.0 0.0 0.0 0.0 Other 2.4 2.4 3.8 3.7 2.9 13.5 1.4 4.1 Don't know 0.5 1.5 0.0 0.6 0.4 0.0 1.4 1.8

62 Responsive Management
Q234. Where did you go on your most recent fishing trip in Arizona in 2013? (Asked of those who personally fished in Arizona in 2013.) (Part 1, alphabetically.)
Bodies of Water
Moh
ave
Nav
ajo
Pim
a
Pina
l
Sant
a C
ruz
Yav
apai
Yum
a
Out
-of-
Stat
e
Alamo Lake 1.9 0.3 0.3 1.0 0.0 4.6 0.5 3.7 Alvord Lake 0.0 0.0 0.0 0.2 0.0 0.0 0.0 0.2 Apache Lake 0.0 1.0 4.3 2.7 1.4 0.7 0.0 0.5 Arivaca Lake 0.0 0.0 1.2 0.0 2.9 0.0 0.0 0.3 Ashurst Lake 0.0 1.0 0.3 0.2 0.0 1.3 0.0 0.2 Bartlett Lake 0.0 0.0 0.2 2.2 1.4 2.0 0.0 2.2 Bear Canyon Lake 0.0 1.5 0.2 1.9 0.0 0.0 0.0 0.0 Becker Lake 0.0 1.8 0.3 0.2 0.0 0.0 0.0 1.0 Big Lake 0.8 13.8 8.7 8.8 5.6 2.2 1.5 2.5 Black Canyon Lake 0.0 2.0 0.0 1.2 0.0 0.0 0.0 0.0 Black River, East Fork 0.0 1.8 1.2 0.7 0.0 0.0 0.0 0.0 Black River, West Fork 0.0 0.5 0.5 0.2 0.0 0.0 0.0 0.2 Canyon Creek 0.0 0.0 0.0 1.5 1.4 0.2 0.0 0.3 Canyon Lake 0.0 0.0 1.5 8.8 0.0 0.2 0.2 2.0 Carnero Lake 0.0 0.3 0.2 0.0 0.0 0.0 0.0 0.0 Cataract Lake 0.0 0.0 0.0 0.2 0.0 1.1 0.0 0.0 Chaparral Lake 0.0 0.0 0.0 0.0 0.0 0.0 0.0 0.5 Chevelon Lake 0.0 2.5 0.2 0.0 0.0 0.2 0.0 0.0 Christopher Creek 0.0 0.3 0.2 0.7 0.0 0.0 0.0 0.0 Clear Creek Reservoir 0.0 4.3 0.0 0.2 0.0 0.4 0.0 0.5 Cluff Ranch Ponds 0.0 0.0 0.0 0.0 1.4 0.0 0.0 0.0 Colorado River - Lees Ferry 3.8 1.0 0.8 0.2 2.9 2.8 2.0 8.6 Colorado River - Topock Area 21.0 0.5 0.5 0.0 0.0 0.2 1.0 3.9 Colorado River - Parker Strip Area 3.0 0.0 0.2 0.2 0.0 0.7 1.0 1.7
Colorado River –Ehrenberg/Blythe to Yuma 0.8 0.0 0.3 0.5 2.9 0.4 29.5 3.9
Council Park Pond (Somerton) 0.0 0.0 0.0 0.0 0.0 0.0 0.2 0.2 Crescent Lake 0.0 1.8 0.7 0.2 0.0 0.2 0.0 0.3 Dead Horse Lake 0.3 0.3 0.0 0.2 0.0 7.0 0.2 0.5 Dogtown Reservoir 2.4 0.3 0.0 0.2 0.0 3.1 0.0 0.0 East Verde River 0.0 0.0 0.3 0.0 0.0 1.1 0.0 0.0 Fain Lake 0.0 0.0 0.0 0.0 0.0 4.4 0.0 0.0 Fool Hollow Lake 0.3 8.8 0.7 1.2 0.0 1.5 0.0 0.2 Fortuna Pond (Moser Pond) 0.0 0.0 0.0 0.0 0.0 0.0 10.8 0.2 Francis Short Pond 0.0 0.0 0.0 0.0 0.0 0.2 0.0 0.0 Frye Mesa Reservoir 0.0 0.0 0.0 0.0 0.0 0.0 0.0 0.2 Gila River - Phoenix Area 0.0 0.0 0.3 0.5 0.0 0.0 1.2 0.3 Gila River - Safford Area 0.0 0.0 0.2 0.2 0.0 0.0 0.2 0.2

Arizona Anglers’ Opinions, Attitudes, and Expenditures in the State 63
Q234. Where did you go on your most recent fishing trip in Arizona in 2013? (Asked of those who personally fished in Arizona in 2013.) (Part 2, alphabetically.)
Bodies of Water
Moh
ave
Nav
ajo
Pim
a
Pina
l
Sant
a C
ruz
Yav
apai
Yum
a
Out
-of-
Stat
e
Goldwater Lake 0.0 0.0 0.0 0.0 0.0 7.2 0.0 0.0 Granite Basin Lake 0.0 0.0 0.0 0.0 0.0 0.7 0.0 0.0 Green Valley Lake 0.0 0.0 0.0 0.2 0.0 0.0 0.0 0.3 Greer Area Lakes – Bunch, River, Tunnel 0.0 1.0 1.2 0.5 0.0 0.0 0.5 0.3
Kaibab Lake 1.9 0.0 0.0 0.5 0.0 2.6 0.5 0.0 Kennedy Lake 0.0 0.0 2.2 0.0 1.4 0.0 0.0 0.3 Kinnikinick Lake 0.0 0.0 0.0 0.2 0.0 0.2 0.0 0.2 Knoll Lake 0.0 0.3 0.0 0.7 0.0 0.4 0.0 0.0 Lake Havasu 35.6 0.7 0.7 0.7 0.0 1.3 1.0 15.3 Lake Mary (Lower) 0.0 0.0 0.2 0.2 0.0 0.0 0.2 0.5 Lake Mary (Upper) 0.3 0.5 0.7 0.7 0.0 3.1 0.0 0.3 Lake Mead 11.9 0.0 0.0 0.0 0.0 0.4 0.2 4.2 Lake Mohave 12.7 0.0 0.0 0.0 0.0 0.7 0.7 2.4 Lake Pleasant 0.3 0.0 1.0 2.7 0.0 5.7 0.2 5.6 Lake Powell 0.0 3.5 1.0 0.2 0.0 4.1 0.2 2.2 Lee Valley Lake 0.0 0.0 0.2 0.0 0.0 0.0 0.0 0.0 Little Colorado River (Sheep's Crossing) 0.0 1.0 0.2 0.2 0.0 0.0 0.2 0.2
Little Colorado River (Greer) 0.0 0.3 0.7 1.0 1.4 0.0 0.2 0.3 Lyman Lake 0.0 0.5 0.2 0.0 0.0 0.0 0.0 0.0 Luna Lake 0.0 0.0 0.7 0.0 0.0 0.2 0.0 0.5 Lynx Lake 0.0 0.0 0.0 0.7 0.0 12.9 0.2 0.2 Mittry Lake 0.0 0.0 0.0 0.0 0.0 0.0 20.5 0.2 Nelson Reservoir 0.0 2.0 1.0 0.2 0.0 0.0 0.0 0.3 Oak Creek 0.0 0.0 0.3 0.5 0.0 2.8 0.2 1.7 Parker Canyon Lake 0.0 0.0 4.9 0.2 14.1 0.0 0.2 0.2 Patagonia Lake 0.0 0.0 18.1 0.7 28.1 0.2 0.0 1.2 Pena Blanca Lake 0.0 0.0 4.0 0.5 29.6 0.0 0.0 0.2 Phoenix Area Canals 0.0 0.0 0.2 0.0 0.0 0.0 0.2 0.5 Rainbow Lake 0.0 1.8 0.8 1.0 0.0 0.4 0.2 0.2 Red Mountain Lake 0.0 0.0 0.2 1.5 0.0 0.0 0.0 1.0 Redondo Lake 0.0 0.0 0.0 0.0 0.0 0.0 2.5 0.0 Riggs Flat Lake 0.0 0.0 0.3 0.0 0.0 0.4 0.0 0.0 Roosevelt Lake 0.0 9.0 11.0 18.6 2.9 3.1 0.0 6.9 Roper Lake 0.0 0.0 0.3 0.0 0.0 0.0 0.0 0.0 Rose Canyon Lake 0.0 0.0 6.0 0.5 0.0 0.0 0.0 0.3 Saguaro Lake 0.0 0.0 0.7 4.4 0.0 0.2 0.0 3.9 Salt River (Above Roosevelt) 0.0 1.5 0.3 2.2 0.0 0.2 0.0 1.9 Salt River (Below Saguaro) 0.0 0.3 0.0 2.9 0.0 0.0 0.0 2.2

64 Responsive Management
Q234. Where did you go on your most recent fishing trip in Arizona in 2013? (Asked of those who personally fished in Arizona in 2013.) (Part 3, alphabetically.)
Bodies of Water
Moh
ave
Nav
ajo
Pim
a
Pina
l
Sant
a C
ruz
Yav
apai
Yum
a
Out
-of-
Stat
e
Show Low Lake 0.0 14.3 2.0 3.2 0.0 0.2 0.2 0.2 Silver Creek 0.3 5.0 0.5 0.7 0.0 0.2 0.0 0.2 Silverbell Lake 0.0 0.0 8.7 0.2 0.0 0.0 0.0 0.5 Surprise Lake 0.0 0.0 0.0 0.0 0.0 0.0 0.0 0.3 Tempe Town Lake 0.0 0.0 0.0 0.7 0.0 0.0 0.0 0.3 Tonto Creek (Salt River Drainage) 0.0 0.3 0.5 0.5 0.0 0.2 0.2 0.0
Verde River (Sullivan Lake to Perkinsville) 0.0 0.0 0.2 0.2 0.0 2.8 0.2 0.3
Verde River (Sycamore Ck to Childs) 0.0 0.0 0.0 0.0 0.0 3.7 0.0 0.2
Verde River (Bartlett Dam to Fort McDowell Indian Reservation 0.0 0.7 0.0 0.0 0.0 0.7 0.0 0.5
Veterans Oasis Lake 0.0 0.0 0.0 2.7 0.0 0.0 0.0 0.2 Watson Lake 0.0 0.0 0.0 0.0 0.0 2.8 0.0 0.3 Whitehorse Lake 0.5 0.0 0.0 0.2 0.0 2.0 0.0 0.0 Willow Springs Lake 0.8 5.3 0.7 3.9 0.0 0.7 0.2 0.5 Woodland Reservoir 0.0 1.3 0.0 0.0 0.0 0.0 0.0 0.0 Woods Canyon Lake 0.0 2.5 1.2 5.6 0.0 0.0 0.5 0.2 Yuma Area Canals 0.0 0.0 0.0 0.2 0.0 0.0 11.8 0.8 Yuma West Wetlands Pond 0.0 0.0 0.0 0.0 1.4 0.0 4.5 0.2 Other 0.3 4.5 4.7 2.7 0.0 4.6 3.2 2.7 Don't know 1.3 0.3 1.5 2.2 1.4 0.7 2.0 4.9

Arizona Anglers’ Opinions, Attitudes, and Expenditures in the State 65
Days Fished at Various Locations, Among All Active Anglers (Part 1.) Days Fished at
Location Trips Made to
Location Bodies of Water Mean Median Mean Median
Alamo Lake 5.33 3 2.58 1Alvord Lake 5.40 5 6.33 5Apache Lake 6.63 3 3.94 2Arivaca Lake 3.93 3 2.90 2Ashurst Lake 6.35 2 4.36 1Bartlett Lake 9.23 4 8.33 3Bear Canyon Lake 5.87 2 3.23 1Becker Lake 6.64 3 5.63 3Big Lake 4.90 3 2.95 2Black Canyon Lake 5.01 2 3.94 2Black River, East Fork 4.38 3 2.17 1Black River, West Fork 3.02 2 1.99 1Canyon Creek 3.75 2 2.88 2Canyon Lake 5.85 3 5.38 2Carnero Lake 2.10 2 1.66 1Cataract Lake 7.09 2 5.24 2Chaparral Lake 8.50 5 9.75 5Chevelon Lake 2.65 1 2.09 1Christopher Creek 2.38 1 1.86 1Clear Creek Reservoir 5.80 2 4.66 2Cluff Ranch Ponds 8.59 3 8.64 3Colorado River - Lees Ferry 6.59 3 4.61 1Colorado River - Topock Area 22.59 8 18.03 5Colorado River - Parker Strip Area 12.09 6 9.06 2Colorado River - Ehrenberg / Blythe to Yuma 15.63 8 11.51 5Cortez Lake 6.89 4 6.77 3Council Park Pond (Somerton) 8.98 5 6.66 5Crescent Lake 3.47 2 2.78 2Dead Horse Lake 8.61 3 5.63 2Dogtown Reservoir 3.19 2 2.47 1East Verde River 7.01 2 6.36 2Fain Lake 9.19 4 9.08 3Fool Hollow Lake 6.65 3 4.54 2Fortuna Pond (Moser Pond) 10.76 5 8.44 4Francis Short Pond 16.08 5 9.38 2Frye Mesa Reservoir 3.27 1 2.72 1Gila River - Phoenix Area 12.70 10 11.41 7Gila River - Safford Area 7.80 3 7.23 3Goldwater Lake 5.93 3 5.94 3Granite Basin Lake 7.10 4 7.08 6Green Valley Lake 15.97 8 10.40 4Greer Area Lakes - Bunch, River, Tunnel 3.62 2 2.68 1Kaibab Lake 7.57 3 4.41 2Kennedy Lake 7.60 5 6.23 4Kinnikinick Lake 2.76 2 2.42 1Knoll Lake 3.48 2 1.90 1Lake Havasu 17.51 10 12.62 4Lake Mary (Lower) 3.31 2 2.54 2

66 Responsive Management
Days Fished at Various Locations, Among All Active Anglers (Part 2.) Days Fished at
Location Trips Made to
Location Bodies of Water Mean Median Mean Median
Lake Mead 10.75 5 7.41 3Lake Mohave 18.05 8 14.58 4Lake Pleasant 7.41 4 6.58 3Lake Powell 8.91 4 4.77 1Lee Valley Lake 3.91 2 1.50 1Little Colorado River (Sheep’s Crossing) 3.22 1 2.37 1Little Colorado River (Greer) 3.75 2 2.51 2Lyman Lake 6.74 2 6.76 3Luna Lake 4.39 3 3.61 2Lynx Lake 7.29 2 5.90 2Mittry Lake 12.82 5 10.83 5Nelson Reservoir 6.33 2 3.15 2Oak Creek 5.00 3 3.93 2Parker Canyon Lake 6.06 3 4.49 2Patagonia Lake 7.50 4 5.22 2Pena Blanca Lake 5.17 3 4.19 2Phoenix Area Canals 3.99 4 3.52 3Rainbow Lake 8.85 3 6.95 2Red Mountain Lake 18.10 4 17.76 4Redondo Lake 6.45 3 6.39 3Riggs Flat Lake 3.86 2 3.19 2Roosevelt Lake 7.97 4 5.33 2Roper Lake 8.43 3 8.15 2Rose Canyon Lake 8.11 3 4.57 2Saguaro Lake 10.14 4 9.57 3Salt River (above Roosevelt) 14.11 4 8.98 2Salt River (below Saguaro) 8.29 4 9.08 3Show Low Lake 6.82 3 5.14 2Silver Creek 4.46 2 3.86 1Silverbell Lake 17.17 6 15.36 6Surprise Lake 13.36 3 12.87 2Tempe Town Lake 6.95 3 6.32 2Tonto Creek (Salt River Drainage) 6.45 2 5.01 2Verde River (Sullivan Lake to Perkinsville) 5.29 3 3.94 2Verde River (Sycamore Ck to Childs) 8.82 3 7.62 2Verde River (Bartlett Dam to Ft McDowell Res.) 3.39 2 2.59 1Veterans Oasis Lake 33.20 5 33.30 5Watson Lake 5.73 2 4.63 2Whitehorse Lake 3.82 2 2.26 1Willow Springs Lake 5.33 3 4.02 2Woodland Reservoir 2.46 1 2.11 1Woods Canyon Lake 5.24 3 3.45 2Yuma Area Canals 12.87 5 9.93 4Yuma West Wetlands Pond 7.62 5 5.53 3Other location 10.18 3 7.94 2
Arizona Anglers’ Opinions, Attitudes, and Expenditures in the State 67
SATISFACTIONS AND DISSATISFACTIONS WITH FISHING IN ARIZONA
A large majority of active anglers (83%) were satisfied with their overall 2013 fishing
experiences in Arizona; however, 11% were dissatisfied.
A series of questions asked about satisfaction or dissatisfaction with a variety of aspects of
fishing in Arizona, such as the amount of fish caught, the size of fish caught, or access to the
waters. The order of the questions was randomized to eliminate “order bias” (the tendency of
a previous answer to affect a subsequent answer). Although the absolute results are
important, the relative results are of more interest—where each questions falls within the
entire series.
• The greatest satisfaction is with the variety of fish available (84% are satisfied), followed
by three more aspects with at least two-thirds being satisfied with it: level of access
(78%), consumption safety (69%), and availability of waters where bait can be used
(68%).
o The greatest dissatisfaction is with the number of fish caught (28% are dissatisfied)
and the size of the fish caught (22%). However, for each aspect, satisfaction leads
dissatisfaction, even for these with relatively high dissatisfaction.
o Lower satisfaction does not necessarily mean commensurate higher dissatisfaction
because large percentages gave a neutral response or did not know. Therefore, even
the bottom in satisfaction is well above dissatisfaction (availability of fly and lure
waters only, at 37% satisfaction and 5% dissatisfaction).
o The first graph illustrating these data is in color; because color graphs may not
reproduce well in black-and-white printing, this color graph is followed by four
graphs showing the percent being very satisfied, the percent being very or somewhat
satisfied, the percent being very dissatisfied, and the percent being very or somewhat
dissatisfied.

68 Responsive Management
Three questions asked active anglers about satisfaction or dissatisfaction with aspects of their
most recent fishing trip in Arizona.
• The most basic of the three questions asked active anglers about satisfaction or
dissatisfaction with their most recent fishing trip in Arizona overall: 74% were satisfied,
while 18% were dissatisfied. Paired with the findings reported above, these findings
suggest that at least some of those who were dissatisfied with their most recent trip were,
nonetheless, satisfied overall.
• Another question asked about satisfaction or dissatisfaction with the number of fish
caught on their most recent trip: just more than half (52%) were satisfied, but more than
a third (37%) were dissatisfied.
• A final question about the most recent trip asked active anglers about their satisfaction or
dissatisfaction with the size of the fish they caught on their most recent trip: 53% were
satisfied, while 28% were dissatisfied.

Arizona Anglers’ Opinions, Attitudes, and Expenditures in the State 69
Q29. Overall, how satisfied or dissatisfied are you with your fishing experiences in Arizona in 2013? (Asked of those who personally fished in Arizona
in 2013.)
Less than 0.5%
3
8
7
36
47
0 20 40 60 80 100
Very satisfied
Somewhatsatisfied
Neither satisfiednor dissatisfied
Somewhatdissatisfied
Very dissatisfied
Don't know
Percent (n=5637)
83%
11%
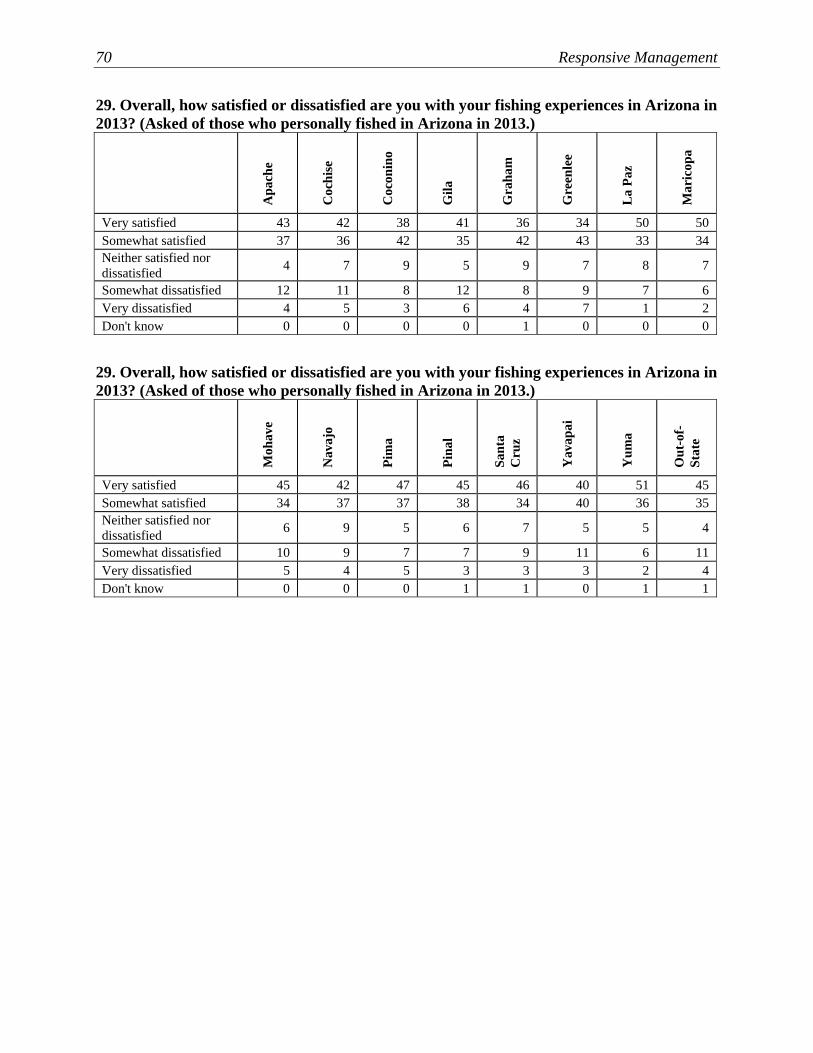
70 Responsive Management
29. Overall, how satisfied or dissatisfied are you with your fishing experiences in Arizona in 2013? (Asked of those who personally fished in Arizona in 2013.)
Apa
che
Coc
hise
Coc
onin
o
Gila
Gra
ham
Gre
enle
e
La
Paz
Mar
icop
a
Very satisfied 43 42 38 41 36 34 50 50 Somewhat satisfied 37 36 42 35 42 43 33 34 Neither satisfied nor dissatisfied 4 7 9 5 9 7 8 7
Somewhat dissatisfied 12 11 8 12 8 9 7 6 Very dissatisfied 4 5 3 6 4 7 1 2 Don't know 0 0 0 0 1 0 0 0
29. Overall, how satisfied or dissatisfied are you with your fishing experiences in Arizona in 2013? (Asked of those who personally fished in Arizona in 2013.)
Moh
ave
Nav
ajo
Pim
a
Pina
l
Sant
a C
ruz
Yav
apai
Yum
a
Out
-of-
Stat
e
Very satisfied 45 42 47 45 46 40 51 45 Somewhat satisfied 34 37 37 38 34 40 36 35 Neither satisfied nor dissatisfied 6 9 5 6 7 5 5 4
Somewhat dissatisfied 10 9 7 7 9 11 6 11 Very dissatisfied 5 4 5 3 3 3 2 4 Don't know 0 0 0 1 1 0 1 1

Arizona Anglers’ Opinions, Attitudes, and Expenditures in the State 71
Q32-Q42. Percent satisfied or dissatisfied with the various aspects of fishing in Arizona in 2013.
56
48
48
46
27
35
29
31
24
24
22
28
30
21
22
35
26
32
23
27
16
14
11
12
26
29
16
31
12
37
37
53
58
4
8
3
2
16
6
19
7
9
5
4
1
2
2
2
6
2
9
3
3
2
1
0% 20% 40% 60% 80% 100%
The variety of fish
The level of access tofishing waters
The consumption safetyof the fish they caught
The availability of waterswhere bait can be used
The size of fish theycaught
The boating ramps anddocks
The number of fish theycaught
The locations where fishare stocked
The frequency of fishstocking
The availability of catch-and-release only waters
The availability of fly andlure only waters
Percent
Very satisfiedSomewhat satisfiedNeutral or don't knowSomewhat dissatisfiedVery dissatisfied
84
78
69
68
62
61
61
54
51
40
37 *
5
10
6 *
3 *
22
8
28
9 *
12
6 *
5
Bold number in the middle of the green part of bar shows
total satisfied; bold number to right of bars shows total
dissatisfied.
* Rounding on graph causes apparent discrepancy in sum,
which is calculated on unrounded numbers.

72 Responsive Management
Q32-Q42. Percent who were very satisfied with each of the following in Arizona. (Asked of those
who personally fished in Arizona in 2013.)
24
27
29
56
48
48
46
35
31
24
22
0 20 40 60 80 100
The variety of fish
The level of access to fishing waters
The consumption safety of the fish theycaught
The availability of waters where baitcan be used
The boating ramps and docks
The locations where fish are stocked
The number of fish they caught
The size of fish they caught
The frequency of fish stocking
The availability of catch-and-releaseonly waters
The availability of fly and lure onlywaters
Percent
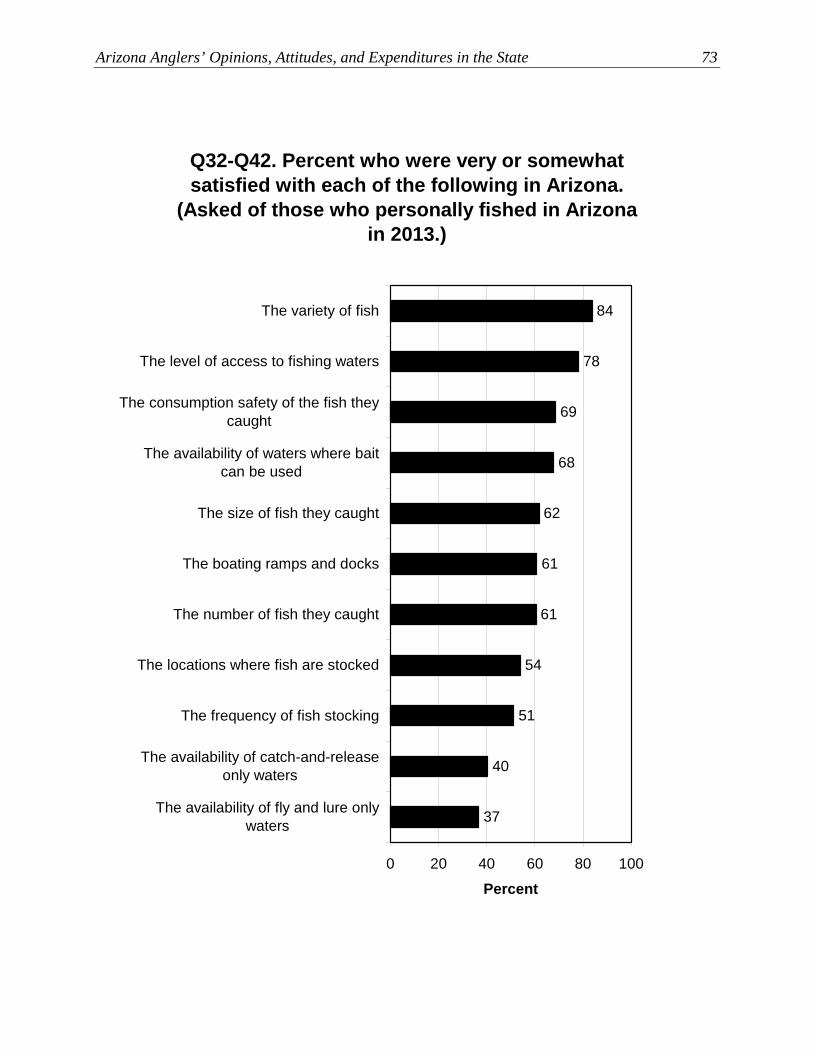
Arizona Anglers’ Opinions, Attitudes, and Expenditures in the State 73
Q32-Q42. Percent who were very or somewhat satisfied with each of the following in Arizona.
(Asked of those who personally fished in Arizona in 2013.)
51
54
61
84
78
69
68
62
61
40
37
0 20 40 60 80 100
The variety of fish
The level of access to fishing waters
The consumption safety of the fish theycaught
The availability of waters where baitcan be used
The size of fish they caught
The boating ramps and docks
The number of fish they caught
The locations where fish are stocked
The frequency of fish stocking
The availability of catch-and-releaseonly waters
The availability of fly and lure onlywaters
Percent

74 Responsive Management
Q32-Q42. Percent who were very dissatisfied with each of the following in Arizona. (Asked of those
who personally fished in Arizona in 2013.)
2
2
2
9
6
3
3
2
2
1
1
0 20 40 60 80 100
The number of fish they caught
The size of fish they caught
The frequency of fish stocking
The locations where fish are stocked
The consumption safety of the fish theycaught
The level of access to fishing waters
The availability of catch-and-releaseonly waters
The boating ramps and docks
The availability of waters where baitcan be used
The variety of fish
The availability of fly and lure onlywaters
Percent

Arizona Anglers’ Opinions, Attitudes, and Expenditures in the State 75
Q32-Q42. Percent who were very or somewhat dissatisfied with each of the following in Arizona. (Asked of those who personally fished in Arizona
in 2013.)
5
6
6
28
22
12
10
9
8
5
3
0 20 40 60 80 100
The number of fish they caught
The size of fish they caught
The frequency of fish stocking
The level of access to fishing waters
The locations where fish are stocked
The boating ramps and docks
The availability of catch-and-releaseonly waters
The consumption safety of the fish theycaught
The variety of fish
The availability of fly and lure onlywaters
The availability of waters where baitcan be used
Percent

76 Responsive Management
Q32-Q42. Percent who were very satisfied with each of the following in Arizona. (Asked of those who personally fished in Arizona in 2013.)
Aspect of fishing
Apa
che
Coc
hise
Coc
onin
o
Gila
Gra
ham
Gre
enle
e
La
Paz
Mar
icop
a
The variety of fish 48 41 46 53 38 24 50 63 The frequency of fish stocking 29 23 20 29 27 24 33 23 The locations where fish are stocked 39 26 20 29 31 24 50 33 The number of fish they caught 23 25 28 31 27 12 16 30 The size of fish they caught 26 27 29 24 23 24 33 25 The level of access to fishing waters 45 34 32 47 40 35 33 50 The availability of fly and lure only waters 32 14 10 27 13 6 33 24
The availability of waters where bait can be used 45 32 25 48 46 47 50 50
The availability of catch-and-release only waters 35 16 14 23 19 18 50 26
The consumption safety of the fish they caught 42 41 34 40 54 59 67 53
The boating ramps and docks 35 23 26 31 35 18 50 37
Q32-Q42. Percent who were very satisfied with each of the following in Arizona. (Asked of those who personally fished in Arizona in 2013.)
Aspect of fishing
Moh
ave
Nav
ajo
Pim
a
Pina
l
Sant
a C
ruz
Yav
apai
Yum
a
Out
-of-
Stat
e
The variety of fish 46 37 56 47 62 44 55 53 The frequency of fish stocking 18 24 33 27 31 21 31 27 The locations where fish are stocked 15 25 42 28 46 22 31 26 The number of fish they caught 25 22 31 24 23 25 29 31 The size of fish they caught 25 25 31 25 23 26 36 36 The level of access to fishing waters 51 54 49 37 54 49 52 56 The availability of fly and lure only waters 16 24 18 24 31 23 24 28
The availability of waters where bait can be used 49 42 48 40 62 46 55 35
The availability of catch-and-release only waters 20 31 26 18 54 14 34 23
The consumption safety of the fish they caught 49 49 47 37 38 40 48 38
The boating ramps and docks 36 33 27 31 38 28 45 44

Arizona Anglers’ Opinions, Attitudes, and Expenditures in the State 77
Q32-Q42. Percent who were very or somewhat satisfied with each of the following in Arizona. (Asked of those who personally fished in Arizona in 2013.)
Aspect of fishing
Apa
che
Coc
hise
Coc
onin
o
Gila
Gra
ham
Gre
enle
e
La
Paz
Mar
icop
a
The variety of fish 81 81 75 89 83 71 100 85 The frequency of fish stocking 58 52 47 45 58 41 67 51 The locations where fish are stocked 68 53 47 50 67 47 83 54 The number of fish they caught 61 60 63 66 69 53 84 60 The size of fish they caught 65 66 57 58 67 65 67 59 The level of access to fishing waters 77 62 60 71 77 71 67 80 The availability of fly and lure only waters 48 27 29 45 31 24 33 37
The availability of waters where bait can be used 68 66 47 73 81 76 50 68
The availability of catch-and-release only waters 55 34 33 40 37 41 50 41
The consumption safety of the fish they caught 74 64 58 71 81 71 84 72
The boating ramps and docks 61 52 47 55 67 41 83 61
Q32-Q42. Percent who were very or somewhat satisfied with each of the following in Arizona. (Asked of those who personally fished in Arizona in 2013.)
Aspect of fishing
Moh
ave
Nav
ajo
Pim
a
Pina
l
Sant
a C
ruz
Yav
apai
Yum
a
Out
-of-
Stat
e
The variety of fish 80 87 90 87 100 80 83 79 The frequency of fish stocking 44 52 62 62 31 43 53 46 The locations where fish are stocked 43 54 62 57 61 54 55 46 The number of fish they caught 54 64 63 59 62 60 66 55 The size of fish they caught 59 60 67 60 69 69 64 68 The level of access to fishing waters 84 79 78 81 85 75 76 82 The availability of fly and lure only waters 28 48 37 47 46 32 34 46
The availability of waters where bait can be used 70 69 69 76 85 74 69 60
The availability of catch-and-release only waters 38 46 43 43 69 27 40 44
The consumption safety of the fish they caught 67 75 72 65 54 60 66 56
The boating ramps and docks 71 64 62 69 69 62 59 61
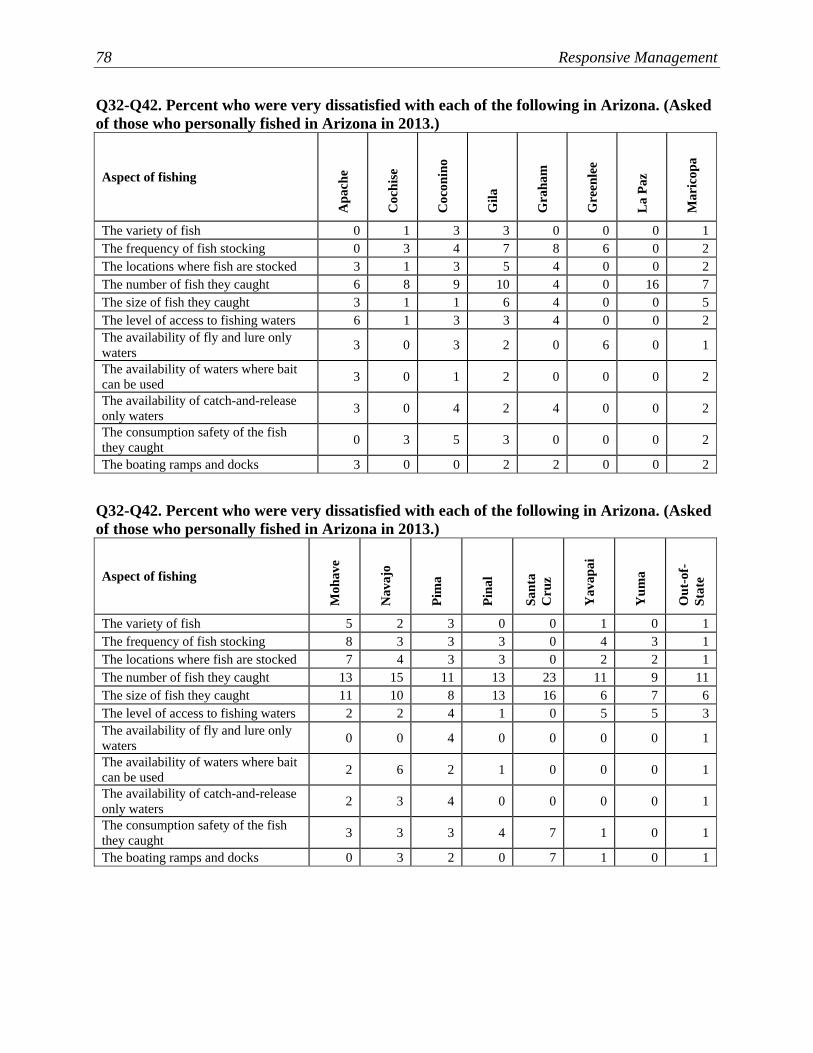
78 Responsive Management
Q32-Q42. Percent who were very dissatisfied with each of the following in Arizona. (Asked of those who personally fished in Arizona in 2013.)
Aspect of fishing
Apa
che
Coc
hise
Coc
onin
o
Gila
Gra
ham
Gre
enle
e
La
Paz
Mar
icop
a
The variety of fish 0 1 3 3 0 0 0 1 The frequency of fish stocking 0 3 4 7 8 6 0 2 The locations where fish are stocked 3 1 3 5 4 0 0 2 The number of fish they caught 6 8 9 10 4 0 16 7 The size of fish they caught 3 1 1 6 4 0 0 5 The level of access to fishing waters 6 1 3 3 4 0 0 2 The availability of fly and lure only waters 3 0 3 2 0 6 0 1
The availability of waters where bait can be used 3 0 1 2 0 0 0 2
The availability of catch-and-release only waters 3 0 4 2 4 0 0 2
The consumption safety of the fish they caught 0 3 5 3 0 0 0 2
The boating ramps and docks 3 0 0 2 2 0 0 2
Q32-Q42. Percent who were very dissatisfied with each of the following in Arizona. (Asked of those who personally fished in Arizona in 2013.)
Aspect of fishing
Moh
ave
Nav
ajo
Pim
a
Pina
l
Sant
a C
ruz
Yav
apai
Yum
a
Out
-of-
Stat
e
The variety of fish 5 2 3 0 0 1 0 1 The frequency of fish stocking 8 3 3 3 0 4 3 1 The locations where fish are stocked 7 4 3 3 0 2 2 1 The number of fish they caught 13 15 11 13 23 11 9 11 The size of fish they caught 11 10 8 13 16 6 7 6 The level of access to fishing waters 2 2 4 1 0 5 5 3 The availability of fly and lure only waters 0 0 4 0 0 0 0 1
The availability of waters where bait can be used 2 6 2 1 0 0 0 1
The availability of catch-and-release only waters 2 3 4 0 0 0 0 1
The consumption safety of the fish they caught 3 3 3 4 7 1 0 1
The boating ramps and docks 0 3 2 0 7 1 0 1
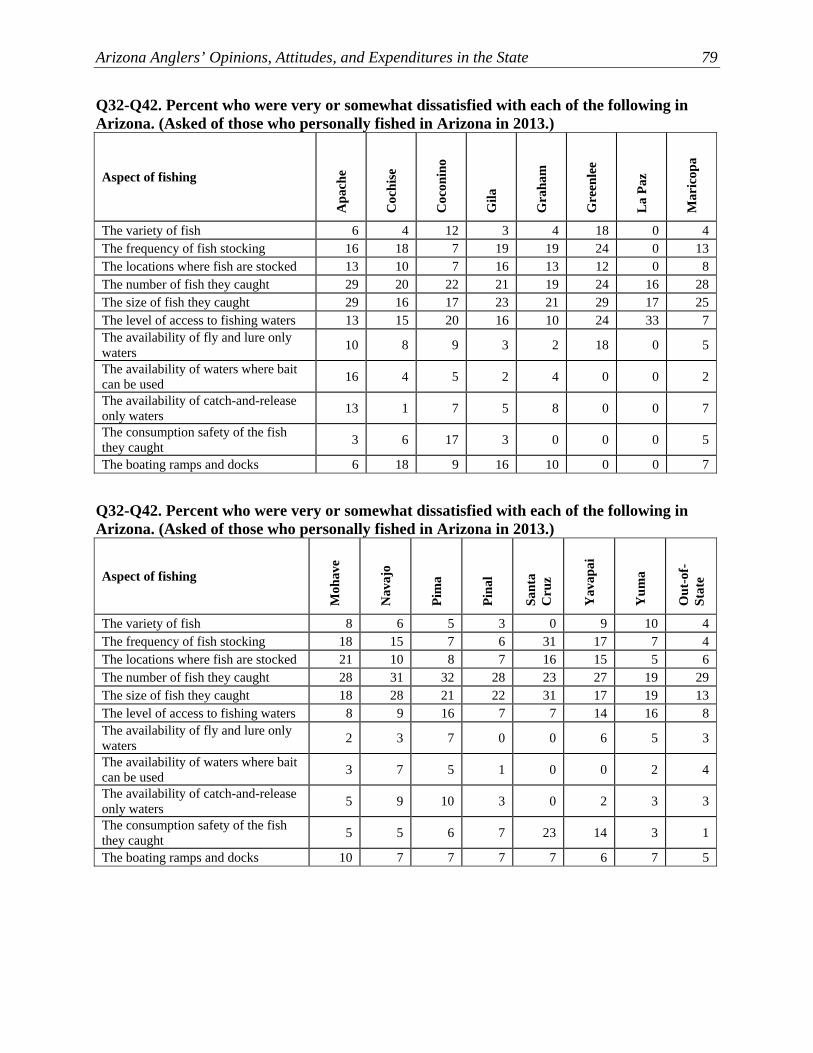
Arizona Anglers’ Opinions, Attitudes, and Expenditures in the State 79
Q32-Q42. Percent who were very or somewhat dissatisfied with each of the following in Arizona. (Asked of those who personally fished in Arizona in 2013.)
Aspect of fishing
Apa
che
Coc
hise
Coc
onin
o
Gila
Gra
ham
Gre
enle
e
La
Paz
Mar
icop
a
The variety of fish 6 4 12 3 4 18 0 4 The frequency of fish stocking 16 18 7 19 19 24 0 13 The locations where fish are stocked 13 10 7 16 13 12 0 8 The number of fish they caught 29 20 22 21 19 24 16 28 The size of fish they caught 29 16 17 23 21 29 17 25 The level of access to fishing waters 13 15 20 16 10 24 33 7 The availability of fly and lure only waters 10 8 9 3 2 18 0 5
The availability of waters where bait can be used 16 4 5 2 4 0 0 2
The availability of catch-and-release only waters 13 1 7 5 8 0 0 7
The consumption safety of the fish they caught 3 6 17 3 0 0 0 5
The boating ramps and docks 6 18 9 16 10 0 0 7
Q32-Q42. Percent who were very or somewhat dissatisfied with each of the following in Arizona. (Asked of those who personally fished in Arizona in 2013.)
Aspect of fishing
Moh
ave
Nav
ajo
Pim
a
Pina
l
Sant
a C
ruz
Yav
apai
Yum
a
Out
-of-
Stat
e
The variety of fish 8 6 5 3 0 9 10 4 The frequency of fish stocking 18 15 7 6 31 17 7 4 The locations where fish are stocked 21 10 8 7 16 15 5 6 The number of fish they caught 28 31 32 28 23 27 19 29 The size of fish they caught 18 28 21 22 31 17 19 13 The level of access to fishing waters 8 9 16 7 7 14 16 8 The availability of fly and lure only waters 2 3 7 0 0 6 5 3
The availability of waters where bait can be used 3 7 5 1 0 0 2 4
The availability of catch-and-release only waters 5 9 10 3 0 2 3 3
The consumption safety of the fish they caught 5 5 6 7 23 14 3 1
The boating ramps and docks 10 7 7 7 7 6 7 5
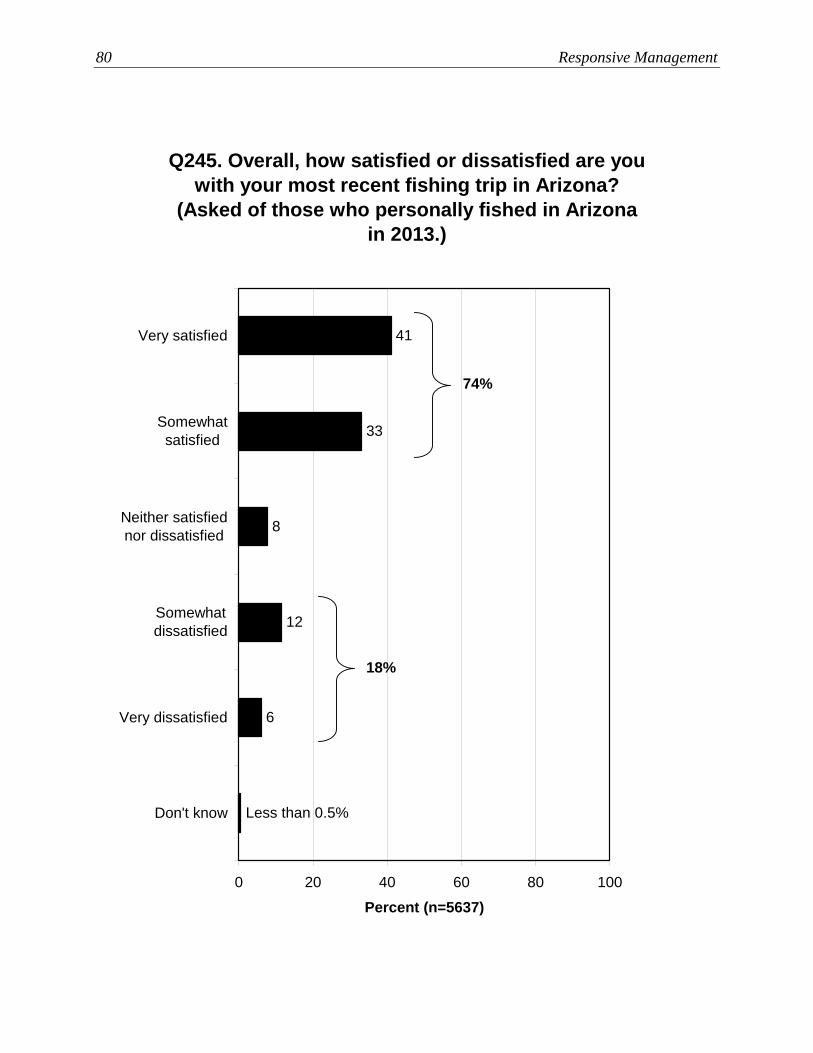
80 Responsive Management
Q245. Overall, how satisfied or dissatisfied are you with your most recent fishing trip in Arizona?
(Asked of those who personally fished in Arizona in 2013.)
Less than 0.5%
6
12
8
33
41
0 20 40 60 80 100
Very satisfied
Somewhatsatisfied
Neither satisfiednor dissatisfied
Somewhatdissatisfied
Very dissatisfied
Don't know
Percent (n=5637)
18%
74%

Arizona Anglers’ Opinions, Attitudes, and Expenditures in the State 81
Q245. Overall, how satisfied or dissatisfied are you with your most recent fishing trip in Arizona? (Asked of those who personally fished in Arizona in 2013.)
Apa
che
Coc
hise
Coc
onin
o
Gila
Gra
ham
Gre
enle
e
La
Paz
Mar
icop
a
Very satisfied 38 35 34 32 37 24 42 43 Somewhat satisfied 34 33 37 37 36 34 24 32 Neither satisfied nor dissatisfied 9 10 12 8 8 13 15 8
Somewhat dissatisfied 10 14 11 13 14 22 11 12 Very dissatisfied 8 7 5 10 5 7 8 5 Don't know 0 1 0 0 0 0 0 0
Q245. Overall, how satisfied or dissatisfied are you with your most recent fishing trip in Arizona? (Asked of those who personally fished in Arizona in 2013.)
Moh
ave
Nav
ajo
Pim
a
Pina
l
Sant
a C
ruz
Yav
apai
Yum
a
Out
-of-
Stat
e
Very satisfied 40 38 46 34 38 36 37 44 Somewhat satisfied 33 32 30 41 37 33 40 37 Neither satisfied nor dissatisfied 9 10 6 8 16 8 9 4
Somewhat dissatisfied 10 12 10 9 7 13 8 10 Very dissatisfied 8 8 8 7 3 9 6 5 Don't know 0 0 1 0 0 1 1 1

82 Responsive Management
Q246. How satisfied or dissatisfied are you with the number of fish you caught on your most recent
fishing trip in Arizona? (Asked of those who personally fished in Arizona in 2013.)
1
18
18
10
28
24
0 20 40 60 80 100
Very satisfied
Somewhatsatisfied
Neither satisfiednor dissatisfied
Somewhatdissatisfied
Very dissatisfied
Don't know
Percent (n=5637)
37% *
52%
* Rounding on graph causes apparent discrepancy; sum is calculated on unrounded
numbers.
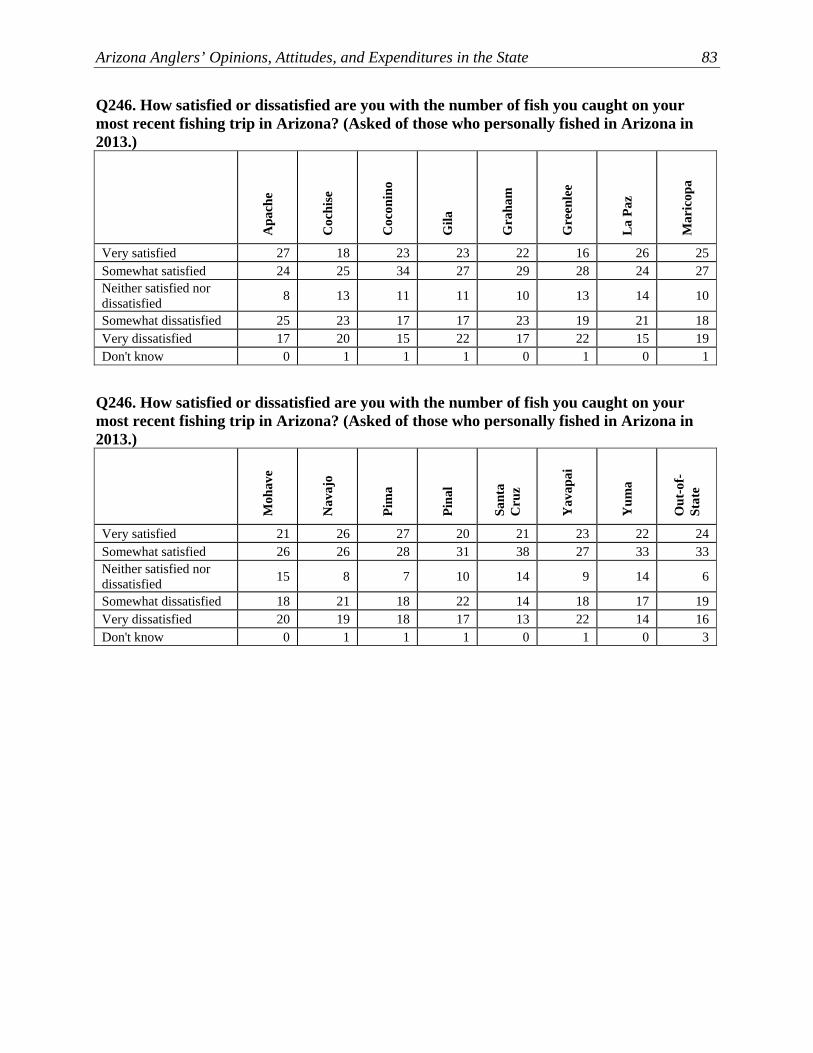
Arizona Anglers’ Opinions, Attitudes, and Expenditures in the State 83
Q246. How satisfied or dissatisfied are you with the number of fish you caught on your most recent fishing trip in Arizona? (Asked of those who personally fished in Arizona in 2013.)
Apa
che
Coc
hise
Coc
onin
o
Gila
Gra
ham
Gre
enle
e
La
Paz
Mar
icop
a
Very satisfied 27 18 23 23 22 16 26 25 Somewhat satisfied 24 25 34 27 29 28 24 27 Neither satisfied nor dissatisfied 8 13 11 11 10 13 14 10
Somewhat dissatisfied 25 23 17 17 23 19 21 18 Very dissatisfied 17 20 15 22 17 22 15 19 Don't know 0 1 1 1 0 1 0 1
Q246. How satisfied or dissatisfied are you with the number of fish you caught on your most recent fishing trip in Arizona? (Asked of those who personally fished in Arizona in 2013.)
Moh
ave
Nav
ajo
Pim
a
Pina
l
Sant
a C
ruz
Yav
apai
Yum
a
Out
-of-
Stat
e
Very satisfied 21 26 27 20 21 23 22 24 Somewhat satisfied 26 26 28 31 38 27 33 33 Neither satisfied nor dissatisfied 15 8 7 10 14 9 14 6
Somewhat dissatisfied 18 21 18 22 14 18 17 19 Very dissatisfied 20 19 18 17 13 22 14 16 Don't know 0 1 1 1 0 1 0 3

84 Responsive Management
Q247. How satisfied or dissatisfied are you with the size of fish you caught on your most recent fishing
trip in Arizona? (Asked of those who personally fished in Arizona in 2013.)
4
14
14
15
29
23
0 20 40 60 80 100
Very satisfied
Somewhatsatisfied
Neither satisfiednor dissatisfied
Somewhatdissatisfied
Very dissatisfied
Don't know
Percent (n=5637)
28%
53% *
* Rounding on graph causes apparent discrepancy; sum is
calculated on unrounded numbers.

Arizona Anglers’ Opinions, Attitudes, and Expenditures in the State 85
Q247. How satisfied or dissatisfied are you with the size of fish you caught on your most recent fishing trip in Arizona? (Asked of those who personally fished in Arizona in 2013.)
Apa
che
Coc
hise
Coc
onin
o
Gila
Gra
ham
Gre
enle
e
La
Paz
Mar
icop
a
Very satisfied 28 17 17 23 21 20 29 23 Somewhat satisfied 25 30 33 33 30 24 28 28 Neither satisfied nor dissatisfied 14 19 18 13 17 12 14 16
Somewhat dissatisfied 14 13 19 13 14 22 17 13 Very dissatisfied 16 16 11 15 16 14 10 15 Don't know 2 5 2 4 2 8 3 4
Q247. How satisfied or dissatisfied are you with the size of fish you caught on your most recent fishing trip in Arizona? (Asked of those who personally fished in Arizona in 2013.)
Moh
ave
Nav
ajo
Pim
a
Pina
l
Sant
a C
ruz
Yav
apai
Yum
a
Out
-of-
Stat
e
Very satisfied 22 25 28 20 21 19 23 30 Somewhat satisfied 29 25 30 36 32 32 31 32 Neither satisfied nor dissatisfied 16 12 11 14 21 14 16 9
Somewhat dissatisfied 13 20 14 14 11 12 15 13 Very dissatisfied 16 15 13 11 14 17 11 10 Don't know 5 4 4 5 0 6 3 6

86 Responsive Management
PERCEPTIONS OF CROWDING AT FISHING AREAS Four questions asked about crowding overall in Arizona in 2013 when active anglers were
fishing. In general, ratings of crowding were relatively low (no higher than 3.31 on a 0 to 10
scale, with 0 being not at all crowded and 10 being extremely crowded). Nonetheless, not
insubstantial percentages gave a rating of higher than the midpoint (ranging from 13% to
19%). The highest mean rating was for crowding from other anglers (3.31); the highest
percentage above the midpoint was for crowding from personal watercraft (referred to as
PWC) operators (19% above the midpoint).
Another question asked about crowding on active anglers’ most recent fishing trip in
Arizona. The mean rating was well below the midpoint, at 3.40. More than a fifth of active
anglers (22%) gave the question the lowest rating of 0, and a large majority (64%) gave a
rating below the midpoint. However, 21% gave a rating above the midpoint, suggesting that
crowding was an issue for about 1 in 5 active anglers in Arizona on their last trip.
Three additional questions asked active anglers about their most recent fishing trip: the first
asked them how many other anglers not in their fishing party that they saw each day, the
second asked how many other anglers they expected to see, and the third asked them how
many other anglers would have been acceptable.
• Regarding the number of other anglers that they saw, the answers range widely from no
other anglers to more than 50. The mean number is 17.8 other anglers, and the median
answer is 10 other anglers.
• It would appear that active anglers saw about the number of other anglers that they
expected to see: the mean is 18.7 other anglers, and the median is 10 other anglers.
• Although active anglers saw about the number of anglers they expected to see, it is worth
noting that the number they saw, in general, is close to their threshold. When asked
about the number of other anglers that would be acceptable to see, the mean is 21.6 other
anglers, and the median is 12 other anglers, not much greater than what active anglers
actually saw.
• An analysis put two of these questions together, finding that 18% saw more other anglers
than their threshold, 29% saw the same as their threshold, and 42% saw fewer other

Arizona Anglers’ Opinions, Attitudes, and Expenditures in the State 87
anglers than their threshold (the remaining 11% answered “don’t know” to either of the
two questions used in this analysis—Q248, the number seen; and Q250, their threshold).
Another question specific to active anglers’ last trip found that they were about evenly split
regarding whether other anglers not in their fishing party were using or wanted to use the
same fishing area that they (the respondents) were using. When presented with the
statement, “Other anglers not in my fishing party wanted to use or were using the same
fishing areas that I was using during my fishing trip to * ”, 43% of active anglers
agreed, while 37% disagreed—a difference of only 6 percentage points.
• A follow-up question asked anglers to estimate the distance, in yards, to the closest angler
not in their party on that trip. The responses ran the gamut, from having other anglers 1-5
yards away, to not having any other anglers around. The median distance was 50 yards.
o * The survey inserted the name of the location of each angler’s most recent fishing
trip in the question, based on his/her earlier answer in the survey about the location.

88 Responsive Management
4
21
9
17
4
4
5
1
2
10
12
11
4
3
2
4
5
8
7
12
10
8
31
6
4
3
3
5
5
7
4
6
5
7
43
8
1
1
4
3
3
9
6
8
11
10
37
6
0 20 40 60 80 100
10
9
8
7
6
5
4
3
2
1
0
Don't know
Percent (n=950)
Other anglers not in fishing party (mean of3.31)
Boaters, excluding PWC operators, whowere not fishing (mean of 2.91)
PWC operators (mean of 2.61)
Other recreationists not fishing or boating(mean of 2.41)
Q262-265. On a scale of 0 to 10, where 0 is not at all crowded and 10 is extremely crowded, how would you rate how crowded you felt by [other anglers not in your fishing party / boaters, not including PWC operators, who were not fishing / operators of
personal watercraft, such as Jet Skis / other recreationists who were not fishing or boating]? (Asked of those who personally
fished in Arizona in 2013.)
Question was asked pertaining to fishing overall in Arizona in 2013, not just
the last trip.
Above the midpoint: Other anglers: 16% Boaters, ex. PWC: 18% PWC: 19% Other recreationists: 13%

Arizona Anglers’ Opinions, Attitudes, and Expenditures in the State 89
Q262. How would you rate how crowded you felt by other anglers on a scale of 0 to 10, where 0 is not at all crowded and 10 is extremely crowded?
Rating
Apa
che
Coc
hise
Coc
onin
o
Gila
Gra
ham
Gre
enle
e
La
Paz
Mar
icop
a
10 3 2 0 4 3 0 0 2 9 0 2 3 6 7 7 0 1 8 0 2 1 7 3 0 11 7 7 3 12 8 0 3 0 0 4 6 3 10 3 4 10 0 6 4 5 26 8 13 13 14 20 6 18 4 6 10 9 17 7 20 6 10 3 6 14 11 19 7 20 17 12 2 16 10 20 7 17 0 11 10 1 6 2 11 7 3 13 11 9 0 26 24 16 15 17 20 34 18 Don't know 3 6 7 2 10 0 0 2
Q262. How would you rate how crowded you felt by other anglers on a scale of 0 to 10, where 0 is not at all crowded and 10 is extremely crowded?
Rating
Moh
ave
Nav
ajo
Pim
a
Pina
l
Sant
a C
ruz
Yav
apai
Yum
a
Out
-of-
Stat
e
10 0 0 0 4 0 1 0 0 9 2 3 3 3 0 0 1 0 8 2 4 5 3 0 1 1 1 7 0 4 2 8 0 3 1 4 6 0 1 1 1 0 9 2 2 5 0 13 22 21 0 13 12 20 4 10 16 7 8 10 9 4 10 3 10 12 17 8 0 11 11 11 2 13 13 13 16 20 12 12 10 1 15 10 11 5 20 4 14 8 0 40 16 18 16 40 23 39 29 Don't know 8 7 0 8 10 13 2 4

90 Responsive Management
Q263. How would you rate how crowded you felt by boaters, not including PWC operators, who were not fishing, on a scale of 0 to 10, where 0 is not at all crowded and 10 is extremely crowded?
Rating A
pach
e
Coc
hise
Coc
onin
o
Gila
Gra
ham
Gre
enle
e
La
Paz
Mar
icop
a
10 6 2 0 2 0 7 0 3 9 0 2 1 2 0 0 11 5 8 3 4 3 6 7 0 0 4 7 3 0 0 4 0 0 0 5 6 0 2 8 7 7 7 5 6 5 3 8 14 9 10 0 11 8 4 13 8 7 9 3 13 5 7 3 6 14 7 11 17 7 16 14 2 13 10 16 15 13 0 23 7 1 6 8 8 4 3 13 5 7 0 39 39 30 28 30 47 23 28 Don't know 6 4 7 4 10 7 0 5
Q263. How would you rate how crowded you felt by boaters, not including PWC operators, who were not fishing, on a scale of 0 to 10, where 0 is not at all crowded and 10 is extremely crowded?
Rating
Moh
ave
Nav
ajo
Pim
a
Pina
l
Sant
a C
ruz
Yav
apai
Yum
a
Out
-of-
Stat
e
10 2 0 2 1 0 3 1 0 9 4 1 0 0 0 3 0 0 8 10 1 2 3 0 5 4 2 7 10 3 0 1 0 3 2 7 6 2 3 5 5 0 4 5 2 5 6 12 8 9 10 7 6 9 4 10 12 5 8 0 5 5 2 3 10 3 14 4 10 7 4 9 2 10 17 15 13 0 9 8 7 1 6 10 9 12 30 8 11 8 0 29 29 32 36 40 29 51 49 Don't know 4 9 7 8 10 17 4 6

Arizona Anglers’ Opinions, Attitudes, and Expenditures in the State 91
Q264. How would you rate how crowded you felt by PWC operators, that is, operators of personal watercraft, such as Jet Skis, WaveRunners, and Sea Doos, on a scale of 0 to 10, where 0 is not at all crowded and 10 is extremely crowded?
Rating A
pach
e
Coc
hise
Coc
onin
o
Gila
Gra
ham
Gre
enle
e
La
Paz
Mar
icop
a
10 0 2 0 6 0 7 0 5 9 0 0 1 0 0 0 11 4 8 6 2 5 4 7 0 6 5 7 0 2 1 6 3 0 6 5 6 0 2 5 4 3 0 6 7 5 6 4 5 6 0 0 6 8 4 3 2 4 7 3 7 6 5 3 0 8 7 17 7 0 11 7 2 13 6 10 2 7 0 6 3 1 6 2 8 7 7 7 0 7 0 58 67 43 41 50 67 45 37 Don't know 6 4 9 2 13 13 0 7
Q264. How would you rate how crowded you felt by PWC operators, that is, operators of personal watercraft, such as Jet Skis, WaveRunners, and Sea Doos, on a scale of 0 to 10, where 0 is not at all crowded and 10 is extremely crowded?
Rating
Moh
ave
Nav
ajo
Pim
a
Pina
l
Sant
a C
ruz
Yav
apai
Yum
a
Out
-of-
Stat
e
10 10 0 0 1 0 3 0 0 9 6 1 0 1 0 5 5 0 8 13 6 2 4 0 4 1 2 7 6 0 2 0 0 3 4 3 6 2 1 3 4 0 0 5 2 5 6 3 4 7 0 7 5 8 4 2 6 4 3 20 3 4 1 3 4 6 6 5 0 5 4 4 2 10 13 4 9 0 8 7 4 1 6 7 5 8 20 9 7 4 0 35 45 57 50 49 36 56 62 Don't know 2 12 13 8 10 17 4 8

92 Responsive Management
Q265. How would you rate how crowded you felt by other recreationists who were not fishing or boating on a scale of 0 to 10, where 0 is not at all crowded and 10 is extremely crowded?
Rating A
pach
e
Coc
hise
Coc
onin
o
Gila
Gra
ham
Gre
enle
e
La
Paz
Mar
icop
a
10 3 2 0 2 0 7 6 2 9 3 0 0 0 7 0 6 1 8 0 2 4 4 7 0 6 5 7 0 2 1 2 0 0 0 4 6 3 6 1 4 0 7 0 4 5 3 2 8 13 10 0 17 12 4 10 10 4 7 0 0 6 7 3 3 10 3 15 10 7 11 8 2 19 6 17 13 3 13 11 12 1 13 12 12 7 17 7 17 7 0 35 45 42 30 37 53 23 32 Don't know 6 4 8 4 10 7 0 6
Q265. How would you rate how crowded you felt by other recreationists who were not fishing or boating on a scale of 0 to 10, where 0 is not at all crowded and 10 is extremely crowded?
Rating
Moh
ave
Nav
ajo
Pim
a
Pina
l
Sant
a C
ruz
Yav
apai
Yum
a
Out
-of-
Stat
e
10 2 3 0 5 0 1 0 0 9 2 1 2 4 0 0 4 0 8 6 1 5 0 0 4 4 0 7 0 0 1 0 0 5 4 4 6 0 1 2 4 0 3 2 1 5 6 7 7 7 0 5 7 9 4 4 6 4 5 10 4 1 3 3 2 7 9 5 0 15 7 6 2 13 16 9 12 0 8 8 7 1 10 9 16 13 40 7 13 9 0 50 40 40 37 40 32 44 57 Don't know 6 7 4 8 10 16 6 4

Arizona Anglers’ Opinions, Attitudes, and Expenditures in the State 93
Q260. Overall, how crowded would you describe your most recent fishing trip in Arizona on a scale of 0 to 10, where 0 is not at all crowded and 10 is
extremely crowded? (Asked of those who personally fished in Arizona in 2013.)
1
22
8
14
6
6
5
1
3
9
14
11
0 20 40 60 80 100
10
9
8
7
6
5
4
3
2
1
0
Don't know
Percent (n=5637)
Mean: 3.4021%

94 Responsive Management
Q260. Overall, how crowded would you describe your most recent fishing trip in Arizona on a scale of 0 to 10, where 0 is not at all crowded and 10 is extremely crowded? (Asked of those who personally fished in Arizona in 2013.)
Rating A
pach
e
Coc
hise
Coc
onin
o
Gila
Gra
ham
Gre
enle
e
La
Paz
Mar
icop
a
10 2 3 1 4 4 5 1 4 9 1 1 2 0 2 0 1 1 8 4 6 4 4 4 3 4 5 7 5 8 6 5 6 5 4 6 6 6 4 6 3 7 12 8 7 5 13 16 14 11 17 12 11 15 4 10 9 10 9 11 8 4 9 3 14 15 13 14 13 11 4 14 2 12 13 12 12 8 12 13 10 1 14 9 9 9 6 14 13 7 0 20 14 24 27 21 16 35 21 Don't know 0 1 0 2 1 1 1 1
Q260. Overall, how crowded would you describe your most recent fishing trip in Arizona on a scale of 0 to 10, where 0 is not at all crowded and 10 is extremely crowded? (Asked of those who personally fished in Arizona in 2013.)
Rating
Moh
ave
Nav
ajo
Pim
a
Pina
l
Sant
a C
ruz
Yav
apai
Yum
a
Out
-of-
Stat
e
10 2 2 5 3 0 2 2 2 9 2 2 2 2 3 2 1 1 8 4 3 5 8 6 2 2 4 7 2 7 7 6 4 4 4 5 6 2 6 7 5 4 5 4 4 5 6 13 16 18 11 14 11 11 4 5 10 10 9 8 10 5 10 3 14 16 14 13 21 12 12 12 2 15 13 10 10 14 11 10 13 1 10 7 8 9 10 12 10 10 0 36 22 16 16 18 25 38 27 Don't know 1 1 0 2 0 1 1 2
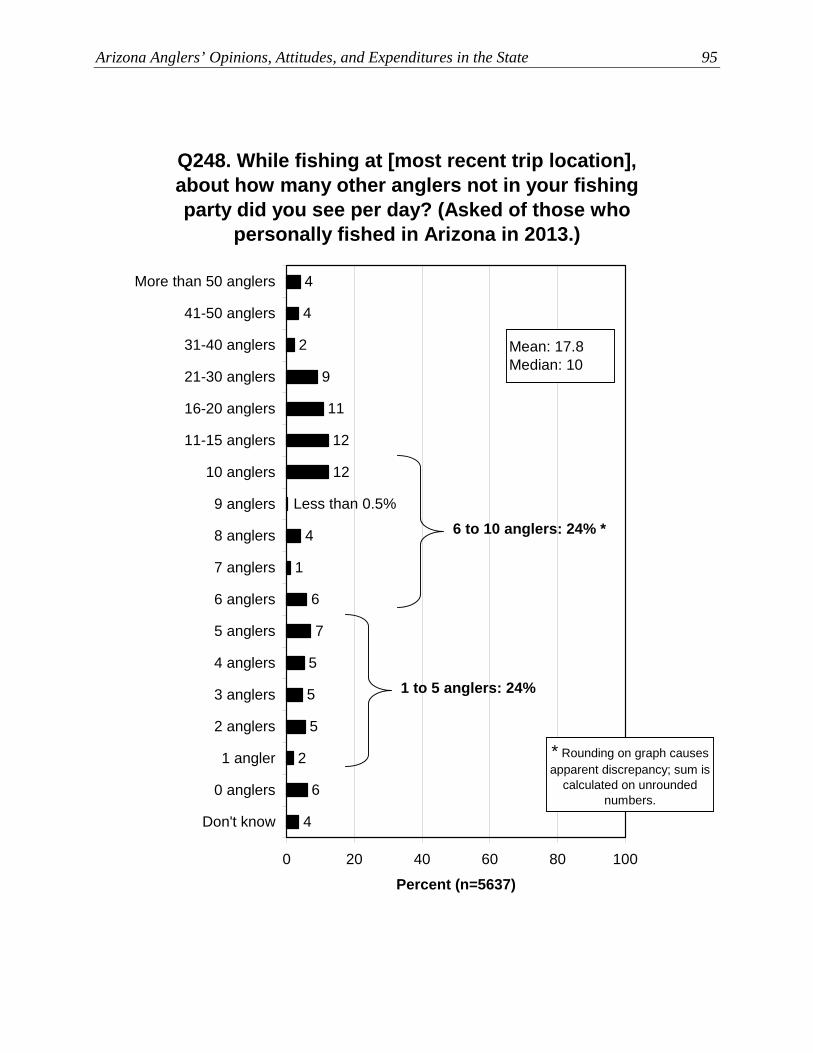
Arizona Anglers’ Opinions, Attitudes, and Expenditures in the State 95
Q248. While fishing at [most recent trip location], about how many other anglers not in your fishing party did you see per day? (Asked of those who
personally fished in Arizona in 2013.)
4
6
2
5
5
5
7
6
1
12
11
9
2
4
4
12
Less than 0.5%
4
0 20 40 60 80 100
More than 50 anglers
41-50 anglers
31-40 anglers
21-30 anglers
16-20 anglers
11-15 anglers
10 anglers
9 anglers
8 anglers
7 anglers
6 anglers
5 anglers
4 anglers
3 anglers
2 anglers
1 angler
0 anglers
Don't know
Percent (n=5637)
1 to 5 anglers: 24%
6 to 10 anglers: 24% *
* Rounding on graph causes apparent discrepancy; sum is
calculated on unrounded numbers.
Mean: 17.8Median: 10

96 Responsive Management
Q248. While fishing at [most recent trip location], about how many other anglers not in your fishing party did you see per day? (Asked of those who personally fished in Arizona in 2013.)
Number of other anglers seen
Apa
che
Coc
hise
Coc
onin
o
Gila
Gra
ham
Gre
enle
e
La
Paz
Mar
icop
a
More than 50 anglers 4 4 3 2 4 5 1 5
41-50 anglers 5 5 2 4 4 0 3 4 31-40 anglers 3 2 1 3 2 3 1 2 21-30 anglers 11 9 10 10 6 7 7 9 16-20 anglers 8 15 10 9 8 9 8 12 11-15 anglers 12 15 11 10 13 5 4 13 10 anglers 12 14 15 16 11 12 8 12 9 anglers 1 0 0 0 0 0 0 0 8 anglers 3 3 3 5 4 7 6 5 7 anglers 0 3 2 0 3 0 1 1 6 anglers 8 7 5 6 3 5 3 6 5 anglers 8 6 9 6 8 7 8 7 4 anglers 4 4 4 5 4 9 1 5 3 anglers 3 3 5 5 11 8 10 4 2 anglers 7 3 7 6 7 7 11 5 1 angler 2 1 3 2 1 5 6 2 0 anglers 5 3 7 7 7 7 19 6 Don't know 3 2 3 4 5 3 1 3

Arizona Anglers’ Opinions, Attitudes, and Expenditures in the State 97
Q248. While fishing at [most recent trip location], about how many other anglers not in your fishing party did you see per day? (Asked of those who personally fished in Arizona in 2013.)
Number of other anglers seen
Moh
ave
Nav
ajo
Pim
a
Pina
l
Sant
a C
ruz
Yav
apai
Yum
a
Out
-of-
Stat
e
More than 50 anglers 2 2 5 6 0 3 1 3
41-50 anglers 1 4 4 5 4 2 1 3 31-40 anglers 1 2 3 2 0 1 1 3 21-30 anglers 5 7 13 9 0 6 4 9 16-20 anglers 9 11 12 13 8 11 3 8 11-15 anglers 9 12 14 12 20 9 8 13 10 anglers 12 15 14 15 14 13 10 10 9 anglers 0 1 0 0 3 0 0 1 8 anglers 4 5 4 2 1 4 4 4 7 anglers 2 1 1 1 3 1 1 2 6 anglers 5 6 5 6 6 7 8 7 5 anglers 8 9 4 5 14 8 10 6 4 anglers 7 6 4 5 6 7 9 4 3 anglers 10 4 3 3 0 4 9 6 2 anglers 10 5 4 3 10 7 11 6 1 angler 4 3 1 1 0 4 5 2 0 anglers 8 7 3 4 4 9 12 4 Don't know 2 4 5 6 7 4 2 9

98 Responsive Management
Q249. While fishing at [most recent trip location], about how many other anglers not in your fishing
party did you expect to see per day? (Asked of those who personally fished in Arizona in 2013.)
9
6
1
4
3
2
8
4
Less than 0.5%
10
13
9
3
5
4
15
Less than 0.5%
2
0 20 40 60 80 100
More than 50 anglers
41-50 anglers
31-40 anglers
21-30 anglers
16-20 anglers
11-15 anglers
10 anglers
9 anglers
8 anglers
7 anglers
6 anglers
5 anglers
4 anglers
3 anglers
2 anglers
1 angler
0 anglers
Don't know
Percent (n=5637)
6 to 10 anglers: 22% *
1 to 5 anglers: 19% *
* Rounding on graph causes apparent discrepancy; sum is
calculated on unrounded numbers.
Mean: 18.7Median: 10

Arizona Anglers’ Opinions, Attitudes, and Expenditures in the State 99
Q249. While fishing at [most recent trip location], about how many other anglers not in your fishing party did you expect to see per day? (Asked of those who personally fished in Arizona in 2013.)
Number of other anglers expected to see
Apa
che
Coc
hise
Coc
onin
o
Gila
Gra
ham
Gre
enle
e
La
Paz
Mar
icop
a
More than 50 anglers 2 3 2 3 2 5 0 4
41-50 anglers 6 6 3 4 5 1 1 6 31-40 anglers 5 4 1 3 1 0 1 4 21-30 anglers 13 12 9 12 8 8 6 9 16-20 anglers 11 16 15 13 7 12 14 15 11-15 anglers 12 15 8 9 8 7 7 10 10 anglers 14 14 17 16 15 15 4 15 9 anglers 0 0 0 0 0 0 0 0 8 anglers 1 1 3 3 2 4 4 2 7 anglers 0 1 1 1 2 0 0 0 6 anglers 4 5 3 2 3 3 4 3 5 anglers 7 7 10 8 6 5 12 9 4 anglers 4 3 3 3 5 7 4 2 3 anglers 3 1 3 1 6 9 7 3 2 anglers 4 2 5 4 7 4 7 4 1 angler 1 0 2 2 2 1 7 1 0 anglers 6 5 7 8 8 5 12 6 Don't know 6 5 6 8 13 12 8 7

100 Responsive Management
Q249. While fishing at [most recent trip location], about how many other anglers not in your fishing party did you expect to see per day? (Asked of those who personally fished in Arizona in 2013.)
Number of other anglers expected to see
Moh
ave
Nav
ajo
Pim
a
Pina
l
Sant
a C
ruz
Yav
apai
Yum
a
Out
-of-
Stat
e
More than 50 anglers 2 3 6 5 1 2 1 3
41-50 anglers 2 5 3 6 6 2 1 4 31-40 anglers 1 2 3 3 1 2 0 1 21-30 anglers 6 7 12 12 4 8 3 10 16-20 anglers 11 13 16 15 11 11 5 8 11-15 anglers 10 9 14 11 14 9 9 8 10 anglers 13 19 12 12 21 17 17 10 9 anglers 0 0 0 0 0 0 0 0 8 anglers 1 2 4 2 1 2 3 2 7 anglers 1 1 0 0 3 0 0 1 6 anglers 5 4 5 5 3 6 5 6 5 anglers 9 10 4 7 10 7 12 5 4 anglers 5 3 2 3 6 5 6 3 3 anglers 7 4 2 2 0 3 7 3 2 anglers 6 5 2 2 3 4 8 2 1 angler 4 2 1 0 0 3 5 1 0 anglers 11 7 5 4 4 9 12 5 Don't know 9 6 11 10 11 8 5 29
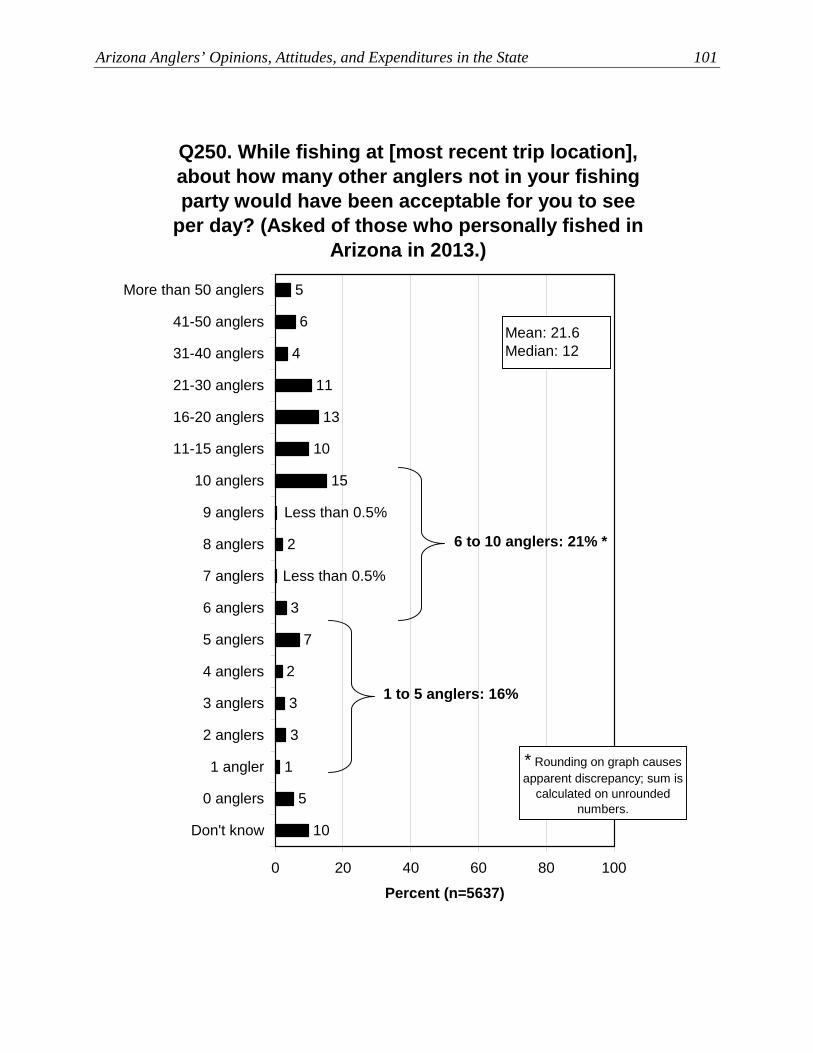
Arizona Anglers’ Opinions, Attitudes, and Expenditures in the State 101
Q250. While fishing at [most recent trip location], about how many other anglers not in your fishing party would have been acceptable for you to see
per day? (Asked of those who personally fished in Arizona in 2013.)
10
5
1
3
3
2
7
3
Less than 0.5%
10
13
11
4
6
5
15
Less than 0.5%
2
0 20 40 60 80 100
More than 50 anglers
41-50 anglers
31-40 anglers
21-30 anglers
16-20 anglers
11-15 anglers
10 anglers
9 anglers
8 anglers
7 anglers
6 anglers
5 anglers
4 anglers
3 anglers
2 anglers
1 angler
0 anglers
Don't know
Percent (n=5637)
* Rounding on graph causes apparent discrepancy; sum is
calculated on unrounded numbers.
6 to 10 anglers: 21% *
1 to 5 anglers: 16%
Mean: 21.6Median: 12

102 Responsive Management
Q250. While fishing at [most recent trip location], about how many other anglers not in your fishing party would have been acceptable for you to see per day? (Asked of those who personally fished in Arizona in 2013.) Number of other anglers that would have been acceptable to see A
pach
e
Coc
hise
Coc
onin
o
Gila
Gra
ham
Gre
enle
e
La
Paz
Mar
icop
a
More than 50 anglers 4 4 5 8 4 5 0 5
41-50 anglers 7 7 5 7 5 1 4 6 31-40 anglers 5 5 2 3 2 0 0 4 21-30 anglers 12 15 10 12 9 11 8 11 16-20 anglers 14 17 14 13 8 11 19 13 11-15 anglers 11 11 11 8 7 11 7 11 10 anglers 13 14 15 12 18 14 3 16 9 anglers 0 0 0 0 0 0 0 0 8 anglers 1 1 2 4 5 1 1 2 7 anglers 0 1 0 1 3 4 0 0 6 anglers 3 4 3 3 4 4 4 2 5 anglers 5 7 9 7 8 12 11 7 4 anglers 2 2 3 2 5 1 6 1 3 anglers 4 1 3 1 4 3 14 3 2 anglers 2 1 5 3 4 7 8 2 1 angler 0 1 2 1 1 3 1 1 0 anglers 4 5 5 5 4 7 6 6 Don't know 10 5 6 9 8 5 7 9

Arizona Anglers’ Opinions, Attitudes, and Expenditures in the State 103
Q250. While fishing at [most recent trip location], about how many other anglers not in your fishing party would have been acceptable for you to see per day? (Asked of those who personally fished in Arizona in 2013.) Number of other anglers that would have been acceptable to see M
ohav
e
Nav
ajo
Pim
a
Pina
l
Sant
a C
ruz
Yav
apai
Yum
a
Out
-of-
Stat
e
More than 50 anglers 2 4 5 5 4 4 2 5
41-50 anglers 5 6 6 8 6 5 3 8 31-40 anglers 4 2 4 4 0 2 0 4 21-30 anglers 4 10 14 12 6 9 4 9 16-20 anglers 10 16 13 17 9 12 9 8 11-15 anglers 6 9 10 10 17 10 10 8 10 anglers 18 18 13 13 22 16 18 10 9 anglers 0 0 0 0 0 0 0 0 8 anglers 2 2 3 1 1 2 2 3 7 anglers 1 0 0 0 4 0 1 1 6 anglers 5 2 3 3 4 5 6 5 5 anglers 9 8 5 5 6 8 10 7 4 anglers 3 3 2 2 1 3 6 3 3 anglers 4 2 2 2 0 3 7 3 2 anglers 6 4 2 2 3 7 6 2 1 angler 4 1 1 1 0 2 3 1 0 anglers 6 4 4 3 6 4 7 4 Don't know 10 10 12 11 11 8 6 21

104 Responsive Management
11
42
29
18
0 20 40 60 80 100
Saw more thantheir threshold(gave a higher
number in Q248than they gave in
Q250)
Saw the same astheir threshold(gave the same
number in the twoquestions)
Saw fewer thantheir threshold(gave a lower
number in Q248than in Q250)
Answered "don'tknow" to either
question
Percent (n=5637)
Q248. While fishing at [most recent trip location], about how many other anglers not in your fishing party did you see
per day? Q250. While fishing at [most recent trip location], about how
many other anglers not in your fishing party would have been acceptable for you to see per day?
(Asked of those who personally fished in Arizona in 2013.)

Arizona Anglers’ Opinions, Attitudes, and Expenditures in the State 105
3
26
11
17
23
19
0 20 40 60 80 100
Strongly agree
Moderately agree
Neither agree nordisagree
Moderatelydisagree
Strongly disagree
Don't know
Percent (n=5228)
Q251. Please tell me if you agree or disagree with the following statement: Other anglers not in my fishing party wanted to use or were using the same fishing areas that I
was using during my fishing trip to [most recent trip location]. (Asked of those who personally fished in Arizona
in 2013.)
37%
43% *
* Rounding on graph causes apparent discrepancy; sum is
calculated on unrounded numbers.

106 Responsive Management
Q251. Please tell me if you agree or disagree with the following statement: Other anglers not in my fishing party wanted to use or were using the same fishing areas that I was using during my fishing trip to [most recent trip location].
Apa
che
Coc
hise
Coc
onin
o
Gila
Gra
ham
Gre
enle
e
La
Paz
Mar
icop
a
Strongly agree 19 19 17 17 14 13 21 20 Moderately agree 26 28 24 26 33 23 28 23 Neither agree nor disagree 14 19 19 22 11 16 15 17
Moderately disagree 11 10 11 11 10 12 4 10 Strongly disagree 29 22 28 18 30 31 31 28 Don't know 1 2 2 6 2 4 1 3
Q251. Please tell me if you agree or disagree with the following statement: Other anglers not in my fishing party wanted to use or were using the same fishing areas that I was using during my fishing trip to [most recent trip location].
Moh
ave
Nav
ajo
Pim
a
Pina
l
Sant
a C
ruz
Yav
apai
Yum
a
Out
-of-
Stat
e
Strongly agree 15 19 23 25 10 15 17 22 Moderately agree 22 25 25 23 21 23 20 22 Neither agree nor disagree 24 21 11 11 21 21 22 10
Moderately disagree 11 10 13 15 11 13 11 11 Strongly disagree 23 21 25 21 30 23 26 30 Don't know 5 3 3 5 7 4 5 6

Arizona Anglers’ Opinions, Attitudes, and Expenditures in the State 107
Q252. While fishing at [most recent trip location], please estimate the distance, in yards, between you
and the closest angler not in your fishing party.
7
7
10
3
14
18
14
6
9
3
9
0 20 40 60 80 100
Nobody around
More than 100yards
51-100 yards
41-50 yards
31-40 yards
21-30 yards
16-20 yards
11-15 yards
6-10 yards
1-5 yards
Don't know
Percent (n=5637)
Mean: 234.26Median: 50
For the calculation of the mean and median, a maximum of 2,000 yards was allowed on the distance; those who said that nobody was around were coded as 2,000 yards.

108 Responsive Management
Q252. While fishing at [most recent trip location], please estimate the distance, in yards, between you and the closest angler not in your fishing party.
Distance
Apa
che
Coc
hise
Coc
onin
o
Gila
Gra
ham
Gre
enle
e
La
Paz
Mar
icop
a
Nobody around 4 5 7 9 7 11 14 5 More than 100 yards 14 14 16 13 9 8 15 14
51-100 yards 18 17 19 17 17 12 18 19 41-50 yards 14 16 13 13 17 8 12 15 31-40 yards 1 2 3 3 4 4 0 3 21-30 yards 11 9 10 8 10 18 6 10 16-20 yards 12 6 9 12 6 8 4 9 11-15 yards 5 3 3 2 5 0 4 2 6-10 yards 8 11 7 9 12 11 6 10 1-5 yards 5 11 6 5 8 12 8 7 Don't know 8 6 7 9 5 8 12 6
Q252. While fishing at [most recent trip location], please estimate the distance, in yards, between you and the closest angler not in your fishing party.
Distance
Moh
ave
Nav
ajo
Pim
a
Pina
l
Sant
a C
ruz
Yav
apai
Yum
a
Out
-of-
Stat
e
Less than a yard 13 8 5 4 3 9 15 6 More than 100 yards 19 12 12 10 13 10 15 15
51-100 yards 19 17 16 16 27 22 17 17 41-50 yards 9 17 12 12 22 15 11 11 31-40 yards 2 4 3 4 3 2 4 3 21-30 yards 6 11 10 14 11 9 11 8 16-20 yards 6 9 11 10 6 9 6 7 11-15 yards 1 3 5 5 0 5 4 3 6-10 yards 7 8 9 9 3 7 5 6 1-5 yards 7 7 11 8 7 7 4 6 Don't know 11 4 6 7 6 6 9 18

Arizona Anglers’ Opinions, Attitudes, and Expenditures in the State 109
OPINIONS ON REGULATIONS IN GENERAL AND THE REGULATIONS BOOKLET
Anglers were asked about the restrictiveness of Arizona’s fishing regulations, and the large
majority are fine with the level of restrictiveness: 74% say the regulations should be about
the same as they currently are vis-à-vis restrictiveness. Otherwise, 5% say that they should
be more restrictive while 15% say that they should be less restrictive.
The clarity of the regulations does not seem to be a problem, as 89% of anglers agree that the
regulations are clear and easy to understand. Only 4% disagree.
The questions above were about the regulations themselves; one question, however,
specifically asked about the ease of use of the regulations booklet. A large majority of
anglers (83%) agree that the regulations booklet is easy to use, while only 3% disagree.
Two open-ended questions (in which no answer set was given but to which respondents
could have given any response that came to mind) asked about the things that are most liked
about the regulations booklet and the things that are least liked (i.e., disliked).
• The most liked thing about the regulations booklet is the layout/that it is easy to read (the
top-named item at 38%). Other responses include the specific information about water
bodies/maps (11%), that it is easily accessible, including online (9%), that it is thorough
(9%), and the information about fish species (8%).
• Regarding the least liked things about the regulations booklet, no item was named by
more than 8% of anglers. The top item is that it is perceived as too long/wordy. The
graph shows the full list.

110 Responsive Management
Q270. In your opinion, should Arizona's fishing regulations be more or less restrictive?
6
2
13
74
4
1
0 20 40 60 80 100
Much morerestrictive
Somewhat morerestrictive
About the same
Somewhat lessrestrictive
Much lessrestrictive
Don't know
Percent (n=1070)
15%
5%

Arizona Anglers’ Opinions, Attitudes, and Expenditures in the State 111
Q270. In your opinion, should Arizona’s fishing regulations be more or less restrictive?
Apa
che
Coc
hise
Coc
onin
o
Gila
Gra
ham
Gre
enle
e
La
Paz
Mar
icop
a
Much more restrictive 0 0 0 5 0 0 0 0
Somewhat more restrictive 0 7 3 5 2 0 7 4
About the same 76 74 80 68 66 67 87 74 Somewhat less restrictive 18 14 14 15 17 33 0 14
Much less restrictive 7 0 3 3 11 0 7 1
Don't know 0 5 0 5 4 0 0 7
Q270. In your opinion, should Arizona’s fishing regulations be more or less restrictive?
Moh
ave
Nav
ajo
Pim
a
Pina
l
Sant
a C
ruz
Yav
apai
Yum
a
Out
-of-
Stat
e
Much more restrictive 2 1 2 1 0 2 0 2
Somewhat more restrictive 7 7 6 1 7 5 6 3
About the same 68 59 74 76 86 78 76 76 Somewhat less restrictive 15 26 11 15 0 8 10 8
Much less restrictive 4 4 1 4 7 2 6 1 Don't know 4 3 5 2 0 4 3 10
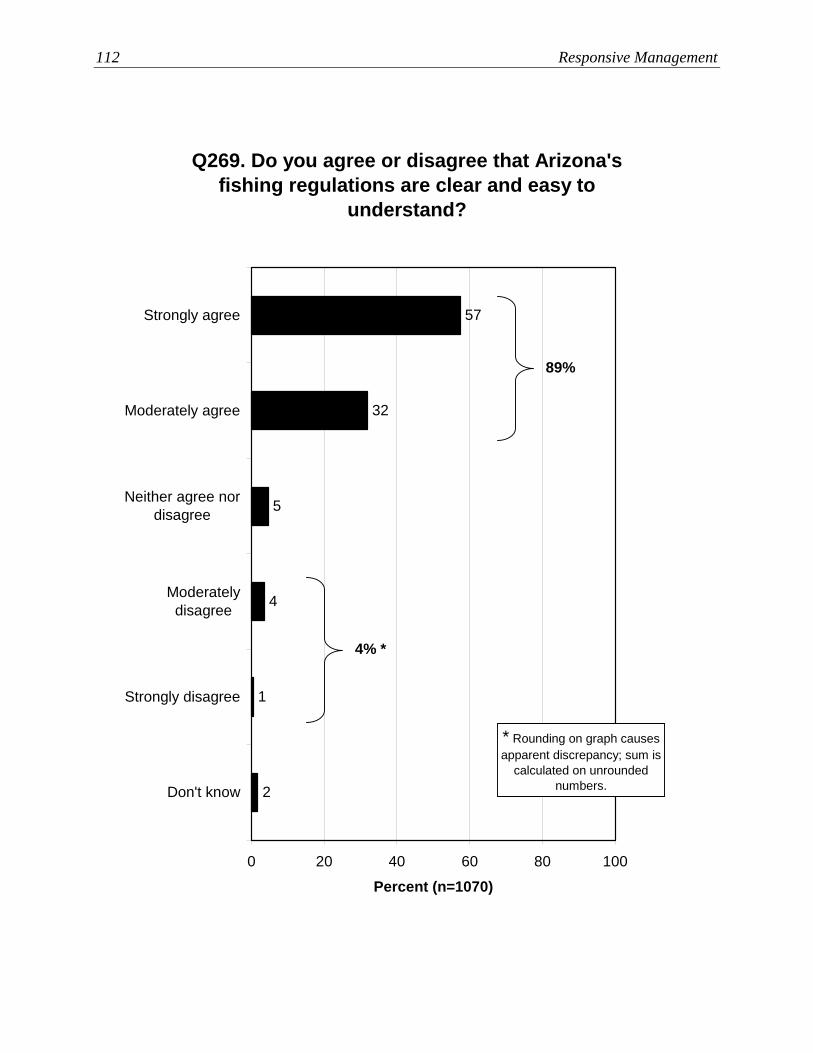
112 Responsive Management
Q269. Do you agree or disagree that Arizona's fishing regulations are clear and easy to
understand?
2
1
4
5
32
57
0 20 40 60 80 100
Strongly agree
Moderately agree
Neither agree nordisagree
Moderatelydisagree
Strongly disagree
Don't know
Percent (n=1070)
4% *
89%
* Rounding on graph causes apparent discrepancy; sum is
calculated on unrounded numbers.
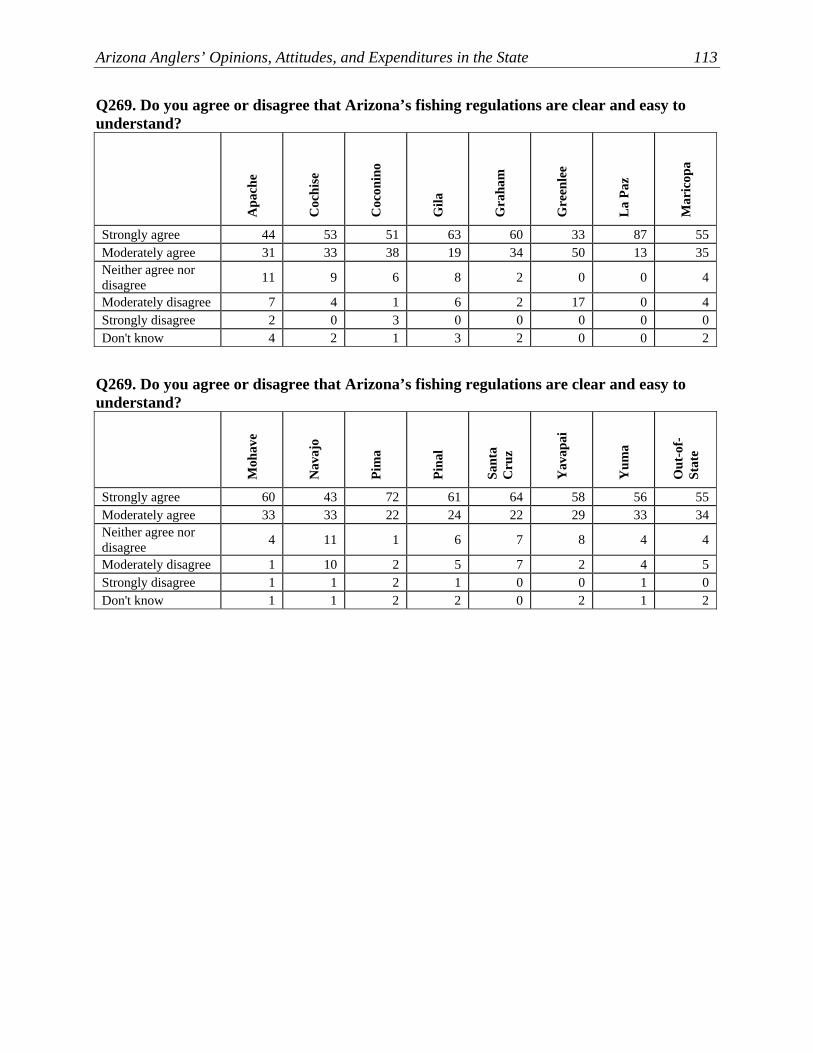
Arizona Anglers’ Opinions, Attitudes, and Expenditures in the State 113
Q269. Do you agree or disagree that Arizona’s fishing regulations are clear and easy to understand?
Apa
che
Coc
hise
Coc
onin
o
Gila
Gra
ham
Gre
enle
e
La
Paz
Mar
icop
a
Strongly agree 44 53 51 63 60 33 87 55 Moderately agree 31 33 38 19 34 50 13 35 Neither agree nor disagree 11 9 6 8 2 0 0 4
Moderately disagree 7 4 1 6 2 17 0 4 Strongly disagree 2 0 3 0 0 0 0 0 Don't know 4 2 1 3 2 0 0 2
Q269. Do you agree or disagree that Arizona’s fishing regulations are clear and easy to understand?
Moh
ave
Nav
ajo
Pim
a
Pina
l
Sant
a C
ruz
Yav
apai
Yum
a
Out
-of-
Stat
e
Strongly agree 60 43 72 61 64 58 56 55 Moderately agree 33 33 22 24 22 29 33 34 Neither agree nor disagree 4 11 1 6 7 8 4 4
Moderately disagree 1 10 2 5 7 2 4 5 Strongly disagree 1 1 2 1 0 0 1 0 Don't know 1 1 2 2 0 2 1 2

114 Responsive Management
Q271. Regardless of whether you agree or disagree that the regulations are clear, do you agree or
disagree that the Arizona Game and Fish Department's fishing regulations booklet is
easy to use?
6
Less than 0.5%
2
8
30
53
0 20 40 60 80 100
Strongly agree
Moderately agree
Neither agree nordisagree
Moderatelydisagree
Strongly disagree
Don't know
Percent (n=1070)
3% *
83%
* Rounding on graph causes apparent discrepancy; sum is
calculated on unrounded numbers.

Arizona Anglers’ Opinions, Attitudes, and Expenditures in the State 115
Q271. Regardless of whether you agree or disagree that the regulations are clear, do you agree or disagree that the Arizona Game and Fish Department’s fishing regulations booklet is easy to use?
Apa
che
Coc
hise
Coc
onin
o
Gila
Gra
ham
Gre
enle
e
La
Paz
Mar
icop
a
Strongly agree 42 42 51 48 49 50 74 54 Moderately agree 29 35 32 27 23 33 13 30 Neither agree nor disagree 18 12 4 16 4 0 7 8
Moderately disagree 4 2 6 5 6 17 0 2 Strongly disagree 2 0 0 0 0 0 0 0 Don't know 4 9 7 3 19 0 7 6
Q271. Regardless of whether you agree or disagree that the regulations are clear, do you agree or disagree that the Arizona Game and Fish Department’s fishing regulations booklet is easy to use?
Moh
ave
Nav
ajo
Pim
a
Pina
l
Sant
a C
ruz
Yav
apai
Yum
a
Out
-of-
Stat
e
Strongly agree 49 46 62 59 50 52 53 46 Moderately agree 35 26 28 27 35 30 24 33 Neither agree nor disagree 6 14 5 4 15 10 15 9
Moderately disagree 4 9 2 1 0 0 4 2 Strongly disagree 0 0 0 0 0 1 0 0 Don't know 6 6 3 9 0 7 4 10

116 Responsive Management
Q272. What do you like most about the fishing regulations booklet?
22
1
2
2
38
11
9
9
8
5
1
1
Less than 0.5%
Less than 0.5%
Less than 0.5%
1
0 20 40 60 80 100
Layout / easy to read / clear
Information specific to certain water bodies /regional information / good maps
Easy to access / readily available / it can beaccessed online
Thorough / contains all information needed
Information about fish species
Information on creel and size limits
Photographs
Has kids activities in it
Information on season dates
Index
Has state records
Information on fees and types of licenses
It is up-to-date
Information on fishing methods
Other
Don't know / no answer
Percent
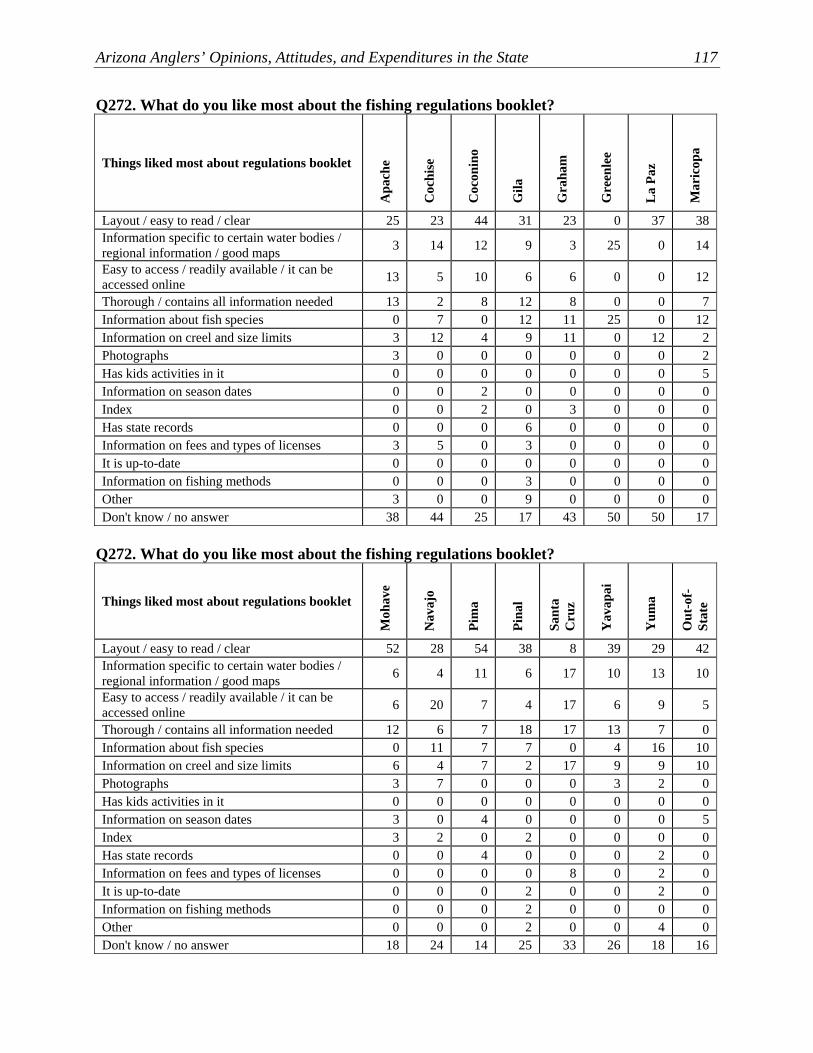
Arizona Anglers’ Opinions, Attitudes, and Expenditures in the State 117
Q272. What do you like most about the fishing regulations booklet?
Things liked most about regulations booklet
Apa
che
Coc
hise
Coc
onin
o
Gila
Gra
ham
Gre
enle
e
La
Paz
Mar
icop
a
Layout / easy to read / clear 25 23 44 31 23 0 37 38 Information specific to certain water bodies / regional information / good maps 3 14 12 9 3 25 0 14
Easy to access / readily available / it can be accessed online 13 5 10 6 6 0 0 12
Thorough / contains all information needed 13 2 8 12 8 0 0 7 Information about fish species 0 7 0 12 11 25 0 12 Information on creel and size limits 3 12 4 9 11 0 12 2 Photographs 3 0 0 0 0 0 0 2 Has kids activities in it 0 0 0 0 0 0 0 5 Information on season dates 0 0 2 0 0 0 0 0 Index 0 0 2 0 3 0 0 0 Has state records 0 0 0 6 0 0 0 0 Information on fees and types of licenses 3 5 0 3 0 0 0 0 It is up-to-date 0 0 0 0 0 0 0 0 Information on fishing methods 0 0 0 3 0 0 0 0 Other 3 0 0 9 0 0 0 0 Don't know / no answer 38 44 25 17 43 50 50 17
Q272. What do you like most about the fishing regulations booklet?
Things liked most about regulations booklet
Moh
ave
Nav
ajo
Pim
a
Pina
l
Sant
a C
ruz
Yav
apai
Yum
a
Out
-of-
Stat
e
Layout / easy to read / clear 52 28 54 38 8 39 29 42 Information specific to certain water bodies / regional information / good maps 6 4 11 6 17 10 13 10
Easy to access / readily available / it can be accessed online 6 20 7 4 17 6 9 5
Thorough / contains all information needed 12 6 7 18 17 13 7 0 Information about fish species 0 11 7 7 0 4 16 10 Information on creel and size limits 6 4 7 2 17 9 9 10 Photographs 3 7 0 0 0 3 2 0 Has kids activities in it 0 0 0 0 0 0 0 0 Information on season dates 3 0 4 0 0 0 0 5 Index 3 2 0 2 0 0 0 0 Has state records 0 0 4 0 0 0 2 0 Information on fees and types of licenses 0 0 0 0 8 0 2 0 It is up-to-date 0 0 0 2 0 0 2 0 Information on fishing methods 0 0 0 2 0 0 0 0 Other 0 0 0 2 0 0 4 0 Don't know / no answer 18 24 14 25 33 26 18 16
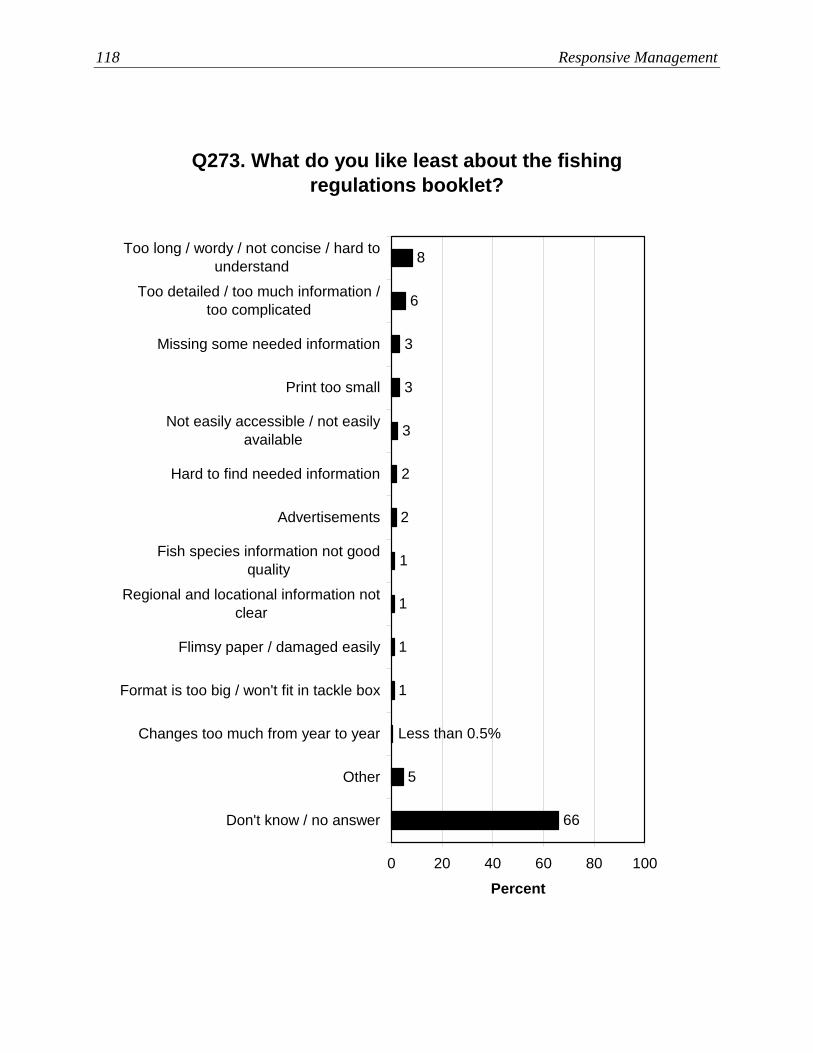
118 Responsive Management
Q273. What do you like least about the fishing regulations booklet?
1
1
2
8
6
3
3
3
2
1
1
Less than 0.5%
5
66
0 20 40 60 80 100
Too long / wordy / not concise / hard tounderstand
Too detailed / too much information /too complicated
Missing some needed information
Print too small
Not easily accessible / not easilyavailable
Hard to find needed information
Advertisements
Fish species information not goodquality
Regional and locational information notclear
Flimsy paper / damaged easily
Format is too big / won't fit in tackle box
Changes too much from year to year
Other
Don't know / no answer
Percent

Arizona Anglers’ Opinions, Attitudes, and Expenditures in the State 119
Q273. What do you like least about the fishing regulations booklet?
Things liked least about regulations booklet
Apa
che
Coc
hise
Coc
onin
o
Gila
Gra
ham
Gre
enle
e
La
Paz
Mar
icop
a
Too long / wordy / not concise / hard to understand 6 2 6 6 3 25 0 12
Too detailed / too much information / too complicated 0 0 4 3 3 0 0 10
Missing some needed information 0 9 0 6 8 0 0 2 Print too small 0 5 0 9 6 0 0 5 Not easily accessible / available 0 9 4 3 0 0 0 2 Hard to find needed information 9 0 0 0 0 0 0 0 Advertisements 0 0 4 6 0 0 0 2 Fish species info. not good quality 0 0 0 6 0 0 0 2 Regional and locational information not clear 3 0 2 0 0 25 0 0
Flimsy paper / damaged easily 0 0 0 0 0 0 0 2 Format is too big / won't fit in tackle box 0 0 0 3 3 0 0 0
Changes too much from year to year 0 0 2 0 3 0 0 0 Other 6 2 6 0 3 0 0 5 Don't know / no answer 78 72 73 60 71 50 100 62
Q273. What do you like least about the fishing regulations booklet?
Things liked least about regulations booklet
Moh
ave
Nav
ajo
Pim
a
Pina
l
Sant
a C
ruz
Yav
apai
Yum
a
Out
-of-
Stat
e
Too long / wordy / not concise / hard to understand 12 4 4 11 0 4 9 5
Too detailed / too much information / too complicated 6 7 0 0 0 1 7 10
Missing some needed information 3 0 7 4 0 3 7 10 Print too small 3 2 4 0 0 1 7 0 Not easily accessible / available 0 6 0 2 8 3 2 0 Hard to find needed information 3 7 0 4 8 6 7 5 Advertisements 0 0 4 2 0 1 0 0 Fish species info. not good quality 0 2 0 0 0 0 4 0 Regional and locational information not clear 3 4 0 0 0 0 7 5
Flimsy paper / damaged easily 0 2 0 0 0 0 2 0 Format is too big / won't fit in tackle box 0 7 4 2 0 1 0 0
Changes too much from year to year 0 0 0 0 0 1 0 0 Other 0 11 4 4 25 6 7 0 Don't know / no answer 73 52 75 76 59 72 49 63
120 Responsive Management
OPINIONS ON BAG LIMITS Trout anglers were asked about their support for or opposition to various trout bag limits.
The trout anglers were randomly assigned into six groups; each group was given one of the potential limits from 0 (allowing none to be kept) to 5, after being told that the current limit is 6 trout. • For trout bag limits of 0 through 3, opposition far exceeds support. At a limit of 4 trout,
support and opposition are about the same. At the limit of 5 trout, support far exceeds opposition. Based on the data, any limit of less than 4 trout will be met with much opposition. o Three graphs are shown for this: a bar graph showing all possible responses, a bar
graph showing total support and total opposition, and a line graph showing total support and total opposition.
In a similar fashion, catfish anglers were asked about various catfish limits, after being told
that the current limit is 25 per day. They were asked about limits of 5, 10, 15, and 20 catfish. • At the lowest limit of 5 catfish, support and opposition are the same (both at 38%). At
higher limits, support far exceeds opposition, with a majority supporting each limit over 5 (limits of 10, 15, and 20). At the highest limit of 20, only 2% of catfish anglers are in opposition. o Three graphs are shown for this: a bar graph showing all possible responses, a bar
graph showing total support and total opposition, and a line graph showing total support and total opposition.
Finally, the survey asked about crappie limits (currently there is no limit). The survey asked
about possible limits of 10, 15, 20, and 25 crappie. • Opposition just slightly exceeds support at the lowest limit asked about (10 crappie). At
all higher limits, support far exceeds opposition, with a majority in support of each limit above 10 crappie. At the highest limit of 25 crappie, only 7% oppose. o Three graphs are shown for this: a bar graph showing all possible responses, a bar
graph showing total support and total opposition, and a line graph showing total support and total opposition.
Note that county-by-county breakdowns of these questions are not shown because of low
sample sizes once the sample is broken down by county and then by scenario.

Arizona Anglers’ Opinions, Attitudes, and Expenditures in the State 121
Q79. Currently, the statewide bag limit for trout is 6 per day. Would you support or oppose a bag limit of [0, 1, 2, 3, 4, 5] per day? (Asked of those who
fished for trout in Arizona in 2013.)
2
47
22
11
9
9
3
55
8
7
16
10
1
46
21
13
11
9
1
40
17
20
11
12
1
22
18
22
11
26
1
12
14
18
19
35
0 20 40 60 80 100
Strongly support
Moderatelysupport
Neither supportnor oppose
Moderatelyoppose
Strongly oppose
Don't know
Percent (n=173 to 201)
Limit of 0Limit of 1Limit of 2Limit of 3Limit of 4Limit of 5

122 Responsive Management
Q79. Currently, the statewide bag limit for trout is 6 per day. Would you support or oppose a bag limit of [0, 1, 2, 3, 4, 5] per day? (Asked of those who
fished for trout in Arizona in 2013.)
69
18
64
26
24
67
31
57
40
37
27
55
0 20 40 60 80 100
Overall support
Overall opposition
Percent (n=173 to 201)
Limit of 0Limit of 1Limit of 2Limit of 3Limit of 4Limit of 5

Arizona Anglers’ Opinions, Attitudes, and Expenditures in the State 123
Overall support for or opposition to various trout limits.
88 90 9187
7781
18
26 24
31
37
55
6964
67
57
40
27
0
10
20
30
40
50
60
70
80
90
100
Limit of 0 Limit of 1 Limit of 2 Limit of 3 Limit of 4 Limit of 5
Limit (n=173 to 201)
Perc
ent
Total giving opinionOverall supportOverall opposition

124 Responsive Management
Q80. Currently, the statewide bag limit for catfish is 25 per day. Would you support or oppose a bag
limit of [5, 10, 15, 20] per day? (Asked of those who fished for catfish in Arizona in 2013.)
5
10
28
19
27
11
2
8
15
17
35
22
3
4
11
34
21
27
0
1
1
53
18
27
0 20 40 60 80 100
Strongly support
Moderatelysupport
Neither supportnor oppose
Moderatelyoppose
Strongly oppose
Don't know
Percent (n=99 to 113)
Limit of 5Limit of 10Limit of 15Limit of 20

Arizona Anglers’ Opinions, Attitudes, and Expenditures in the State 125
Q80. Currently, the statewide bag limit for catfish is 25 per day. Would you support or oppose a bag
limit of [5, 10, 15, 20] per day? (Asked of those who fished for catfish in Arizona in 2013.)
38
38
23
57
56
14
71
2
0 20 40 60 80 100
Overall support
Overallopposition
Percent (n=99 to 113)
Limit of 5Limit of 10Limit of 15Limit of 20

126 Responsive Management
Overall support for or opposition to various catfish limits.
7680
7073
38
57 56
38
23
14
71
20
10
20
30
40
50
60
70
80
90
100
Limit of 5 Limit of 10 Limit of 15 Limit of 20
Limit (n=99 to 113)
Perc
ent
Total giving opinionOverall supportOverall opposition

Arizona Anglers’ Opinions, Attitudes, and Expenditures in the State 127
Q81. Currently, the statewide bag limit for crappie is unlimited. Would you support or oppose a bag limit of [10, 15, 20, 25] per day? (Asked of those
who fished for crappie in Arizona in 2013.)
6
11
28
18
26
10
1
28
8
13
25
26
1
4
14
34
34
13
2
5
2
51
18
22
0 20 40 60 80 100
Strongly support
Moderatelysupport
Neither supportnor oppose
Moderatelyoppose
Strongly oppose
Don't know
Percent (n=58 to 81)
Limit of 10Limit of 15Limit of 20Limit of 25

128 Responsive Management
Q81. Currently, the statewide bag limit for crappie is unlimited. Would you support or oppose a bag limit of [10, 15, 20, 25] per day? (Asked of those
who fished for crappie in Arizona in 2013.)
36
40
51
36
18
68
7
69
0 20 40 60 80 100
Overall support
Overallopposition
Percent (n=58 to 81)
Limit of 10Limit of 15Limit of 20Limit of 25

Arizona Anglers’ Opinions, Attitudes, and Expenditures in the State 129
Overall support for or opposition to various crappie limits.
76
87 86
76
51
68
36
18
36
69
40
70
10
20
30
40
50
60
70
80
90
100
Limit of 10 Limit of 15 Limit of 20 Limit of 25
Limit (n=58 to 81)
Perc
ent
Total giving opinionOverall supportOverall opposition

130 Responsive Management
OPINIONS ON MANAGEMENT STRATEGY The survey asked active anglers if they would prefer catching a few larger fish (i.e., manage
for quality over quantity) or catching many smaller fish (i.e., manage for quantity over
quality) when they go fishing. The former is preferred by a majority: 71% say that they
would rather go fishing where they can catch a few larger fish.
Q116. If you had to choose between the following two options, which do you prefer when fishing in
Arizona? (Asked of those who personally fished in Arizona in 2013.)
29
71
0 20 40 60 80 100
Catching a fewlarger fish
Catching manysmaller fish
Percent (n=2804)

Arizona Anglers’ Opinions, Attitudes, and Expenditures in the State 131
Q116. If you had to choose between the following two options, which do you prefer when fishing in Arizona? (Asked of those who personally fished in Arizona in 2013.)
Option
Apa
che
Coc
hise
Coc
onin
o
Gila
Gra
ham
Gre
enle
e
La
Paz
Mar
icop
a
Catching a few larger fish 83 70 72 74 77 89 67 70
Catching many smaller fish 17 30 28 26 23 11 33 30
Q116. If you had to choose between the following two options, which do you prefer when fishing in Arizona? (Asked of those who personally fished in Arizona in 2013.)
Option
Moh
ave
Nav
ajo
Pim
a
Pina
l
Sant
a C
ruz
Yav
apai
Yum
a
Out
-of-
Stat
e
Catching a few larger fish 70 83 71 73 65 75 75 62
Catching many smaller fish 30 17 29 27 35 25 25 38

132 Responsive Management
THE DEPARTMENT’S FISHING REPORT Just about half of Arizona’s anglers (52%) have used the Fishing Report on the Department’s
website.
• Of those who have used the Fishing Report, a little under half (43%) find it very useful,
and another 52% find it somewhat useful. Only 5% say that it has no utility.
Q267. Have you ever used the Fishing Report on the Arizona Game and Fish Department's website?
1
46
52
0 20 40 60 80 100
Yes
No
Don't know
Percent (n=1043)

Arizona Anglers’ Opinions, Attitudes, and Expenditures in the State 133
Q267. Have you ever used the Fishing Report on the Arizona Game and Fish Department’s website?
Apa
che
Coc
hise
Coc
onin
o
Gila
Gra
ham
Gre
enle
e
La
Paz
Mar
icop
a
Yes 33 50 52 47 42 45 39 58 No 67 50 48 51 58 55 61 41 Don't know 0 0 0 2 0 0 0 1
Q267. Have you ever used the Fishing Report on the Arizona Game and Fish Department’s website?
Moh
ave
Nav
ajo
Pim
a
Pina
l
Sant
a C
ruz
Yav
apai
Yum
a
Out
-of-
Stat
e
Yes 41 46 58 68 60 54 32 26 No 58 53 39 32 40 44 67 72 Don't know 2 1 3 0 0 2 1 2
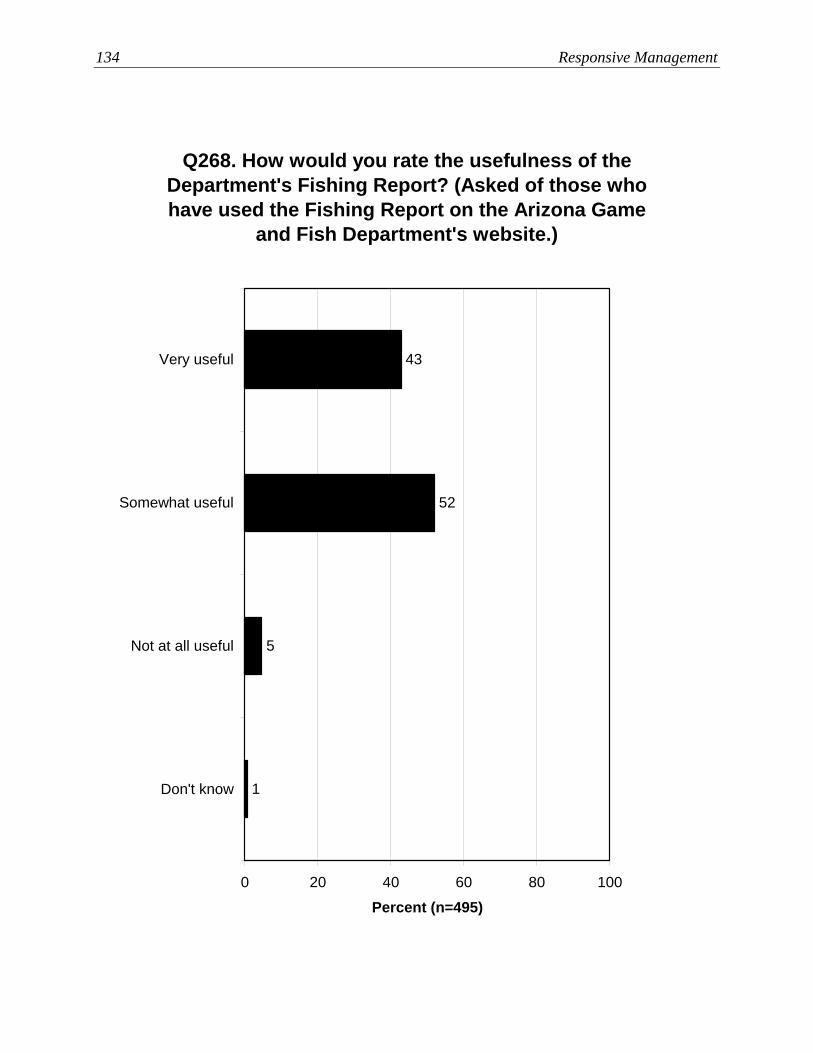
134 Responsive Management
Q268. How would you rate the usefulness of the Department's Fishing Report? (Asked of those who have used the Fishing Report on the Arizona Game
and Fish Department's website.)
1
5
52
43
0 20 40 60 80 100
Very useful
Somewhat useful
Not at all useful
Don't know
Percent (n=495)

Arizona Anglers’ Opinions, Attitudes, and Expenditures in the State 135
Q268. How would you rate the usefulness of the Department’s Fishing Report? (Asked of those who have used the Fishing Report on the Arizona Game and Fish Department’s website.)
Rating
Apa
che
Coc
hise
Coc
onin
o
Gila
Gra
ham
Gre
enle
e
La
Paz
Mar
icop
a
Very useful 23 24 35 25 28 100 0 43 Somewhat useful 62 69 53 75 67 0 80 53
Not at all useful 8 7 12 0 0 0 20 4
Don't know 8 0 0 0 5 0 0 0
Q268. How would you rate the usefulness of the Department’s Fishing Report? (Asked of those who have used the Fishing Report on the Arizona Game and Fish Department’s website.)
Rating
Moh
ave
Nav
ajo
Pim
a
Pina
l
Sant
a C
ruz
Yav
apai
Yum
a
Out
-of-
Stat
e
Very useful 50 44 41 47 33 52 38 50 Somewhat useful 46 53 53 45 44 44 54 35
Not at all useful 4 3 6 4 23 2 8 9
Don't know 0 0 0 4 0 2 0 6
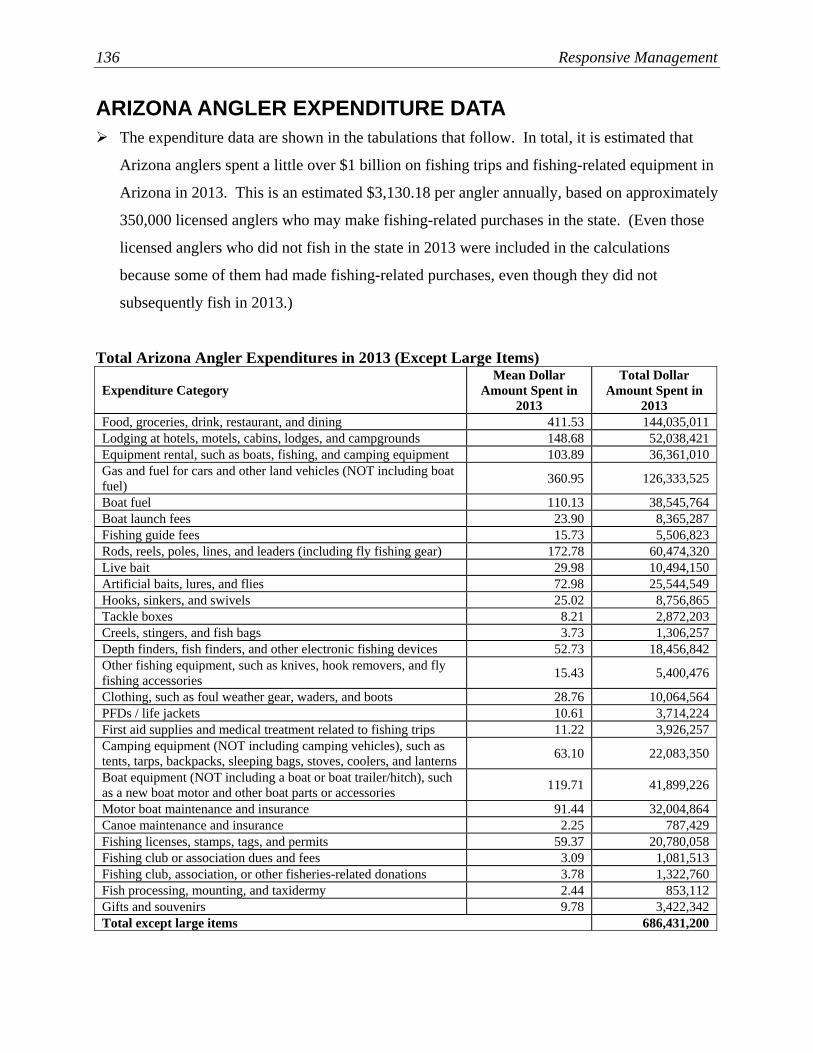
136 Responsive Management
ARIZONA ANGLER EXPENDITURE DATA The expenditure data are shown in the tabulations that follow. In total, it is estimated that
Arizona anglers spent a little over $1 billion on fishing trips and fishing-related equipment in
Arizona in 2013. This is an estimated $3,130.18 per angler annually, based on approximately
350,000 licensed anglers who may make fishing-related purchases in the state. (Even those
licensed anglers who did not fish in the state in 2013 were included in the calculations
because some of them had made fishing-related purchases, even though they did not
subsequently fish in 2013.)
Total Arizona Angler Expenditures in 2013 (Except Large Items)
Expenditure Category Mean Dollar
Amount Spent in 2013
Total Dollar Amount Spent in
2013 Food, groceries, drink, restaurant, and dining 411.53 144,035,011 Lodging at hotels, motels, cabins, lodges, and campgrounds 148.68 52,038,421 Equipment rental, such as boats, fishing, and camping equipment 103.89 36,361,010 Gas and fuel for cars and other land vehicles (NOT including boat fuel) 360.95 126,333,525
Boat fuel 110.13 38,545,764 Boat launch fees 23.90 8,365,287 Fishing guide fees 15.73 5,506,823 Rods, reels, poles, lines, and leaders (including fly fishing gear) 172.78 60,474,320 Live bait 29.98 10,494,150 Artificial baits, lures, and flies 72.98 25,544,549 Hooks, sinkers, and swivels 25.02 8,756,865 Tackle boxes 8.21 2,872,203 Creels, stingers, and fish bags 3.73 1,306,257 Depth finders, fish finders, and other electronic fishing devices 52.73 18,456,842 Other fishing equipment, such as knives, hook removers, and fly fishing accessories 15.43 5,400,476
Clothing, such as foul weather gear, waders, and boots 28.76 10,064,564 PFDs / life jackets 10.61 3,714,224 First aid supplies and medical treatment related to fishing trips 11.22 3,926,257 Camping equipment (NOT including camping vehicles), such as tents, tarps, backpacks, sleeping bags, stoves, coolers, and lanterns 63.10 22,083,350
Boat equipment (NOT including a boat or boat trailer/hitch), such as a new boat motor and other boat parts or accessories 119.71 41,899,226
Motor boat maintenance and insurance 91.44 32,004,864 Canoe maintenance and insurance 2.25 787,429 Fishing licenses, stamps, tags, and permits 59.37 20,780,058 Fishing club or association dues and fees 3.09 1,081,513 Fishing club, association, or other fisheries-related donations 3.78 1,322,760 Fish processing, mounting, and taxidermy 2.44 853,112 Gifts and souvenirs 9.78 3,422,342 Total except large items 686,431,200
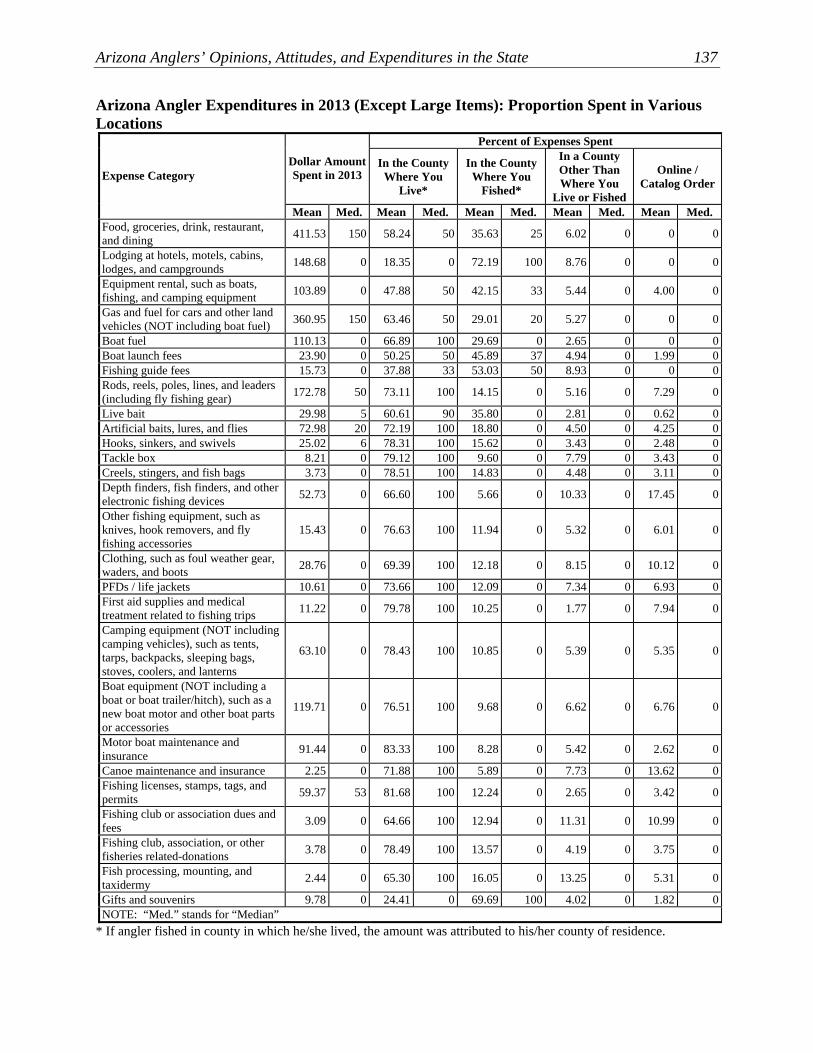
Arizona Anglers’ Opinions, Attitudes, and Expenditures in the State 137
Arizona Angler Expenditures in 2013 (Except Large Items): Proportion Spent in Various Locations
Percent of Expenses Spent
Dollar Amount Spent in 2013
In the County Where You
Live*
In the County Where You
Fished*
In a County Other Than Where You
Live or Fished
Online / Catalog Order
Expense Category
Mean Med. Mean Med. Mean Med. Mean Med. Mean Med. Food, groceries, drink, restaurant, and dining 411.53 150 58.24 50 35.63 25 6.02 0 0 0
Lodging at hotels, motels, cabins, lodges, and campgrounds 148.68 0 18.35 0 72.19 100 8.76 0 0 0
Equipment rental, such as boats, fishing, and camping equipment 103.89 0 47.88 50 42.15 33 5.44 0 4.00 0
Gas and fuel for cars and other land vehicles (NOT including boat fuel) 360.95 150 63.46 50 29.01 20 5.27 0 0 0
Boat fuel 110.13 0 66.89 100 29.69 0 2.65 0 0 0Boat launch fees 23.90 0 50.25 50 45.89 37 4.94 0 1.99 0Fishing guide fees 15.73 0 37.88 33 53.03 50 8.93 0 0 0Rods, reels, poles, lines, and leaders (including fly fishing gear) 172.78 50 73.11 100 14.15 0 5.16 0 7.29 0
Live bait 29.98 5 60.61 90 35.80 0 2.81 0 0.62 0Artificial baits, lures, and flies 72.98 20 72.19 100 18.80 0 4.50 0 4.25 0Hooks, sinkers, and swivels 25.02 6 78.31 100 15.62 0 3.43 0 2.48 0Tackle box 8.21 0 79.12 100 9.60 0 7.79 0 3.43 0Creels, stingers, and fish bags 3.73 0 78.51 100 14.83 0 4.48 0 3.11 0Depth finders, fish finders, and other electronic fishing devices 52.73 0 66.60 100 5.66 0 10.33 0 17.45 0
Other fishing equipment, such as knives, hook removers, and fly fishing accessories
15.43 0 76.63 100 11.94 0 5.32 0 6.01 0
Clothing, such as foul weather gear, waders, and boots 28.76 0 69.39 100 12.18 0 8.15 0 10.12 0
PFDs / life jackets 10.61 0 73.66 100 12.09 0 7.34 0 6.93 0First aid supplies and medical treatment related to fishing trips 11.22 0 79.78 100 10.25 0 1.77 0 7.94 0
Camping equipment (NOT including camping vehicles), such as tents, tarps, backpacks, sleeping bags, stoves, coolers, and lanterns
63.10 0 78.43 100 10.85 0 5.39 0 5.35 0
Boat equipment (NOT including a boat or boat trailer/hitch), such as a new boat motor and other boat parts or accessories
119.71 0 76.51 100 9.68 0 6.62 0 6.76 0
Motor boat maintenance and insurance 91.44 0 83.33 100 8.28 0 5.42 0 2.62 0
Canoe maintenance and insurance 2.25 0 71.88 100 5.89 0 7.73 0 13.62 0Fishing licenses, stamps, tags, and permits 59.37 53 81.68 100 12.24 0 2.65 0 3.42 0
Fishing club or association dues and fees 3.09 0 64.66 100 12.94 0 11.31 0 10.99 0
Fishing club, association, or other fisheries related-donations 3.78 0 78.49 100 13.57 0 4.19 0 3.75 0
Fish processing, mounting, and taxidermy 2.44 0 65.30 100 16.05 0 13.25 0 5.31 0
Gifts and souvenirs 9.78 0 24.41 0 69.69 100 4.02 0 1.82 0NOTE: “Med.” stands for “Median”
* If angler fished in county in which he/she lived, the amount was attributed to his/her county of residence.

138 Responsive Management
Percent of Arizona Anglers Making Expenditures on Large Items Percent of licensed anglers who purchased the following primarily for fishing in 2013.
Item Percent Who Purchased
Boat 4.3 Truck / jeep 2.9 Camper 1.9 Trailer 1.4 Other 1.2 Motor / vehicle part 0.9 Canoe / kayak 0.7 ATV 0.3 Cabin 0.2
Arizona Angler Expenditures on Large Items in 2013
Amount
Spent in 2013 on Boats
Amount Spent in 2013
on Trailers
Amount Spent in 2013 on Campers
Amount Spent in 2013
on ATVs
Amount Spent in 2013 on Trucks /
Jeeps Mean 6,665.00 7,785.18 12,460.55 5,490.27 15,410.81Median 2,500 3,500 4,000 4,500 6,000Sum 98,684,828 38,060,367 78,885,156 4,570,855 152,598,455
Arizona Angler Expenditures on Large Items in 2013
Amount Spent in 2013 on Cabins
Amount Spent in 2013 on Canoes
and Kayaks
Amount Spent in 2013 on Motors /
Vehicle Parts
Amount Spent in 2013 on Other
Items Mean 16,567.03 1,206.27 1,020.72 2,198.60Median 2,625.81 500 500 154.95Sum 11,256,497 2,895,162 3,002,219 9,115,313
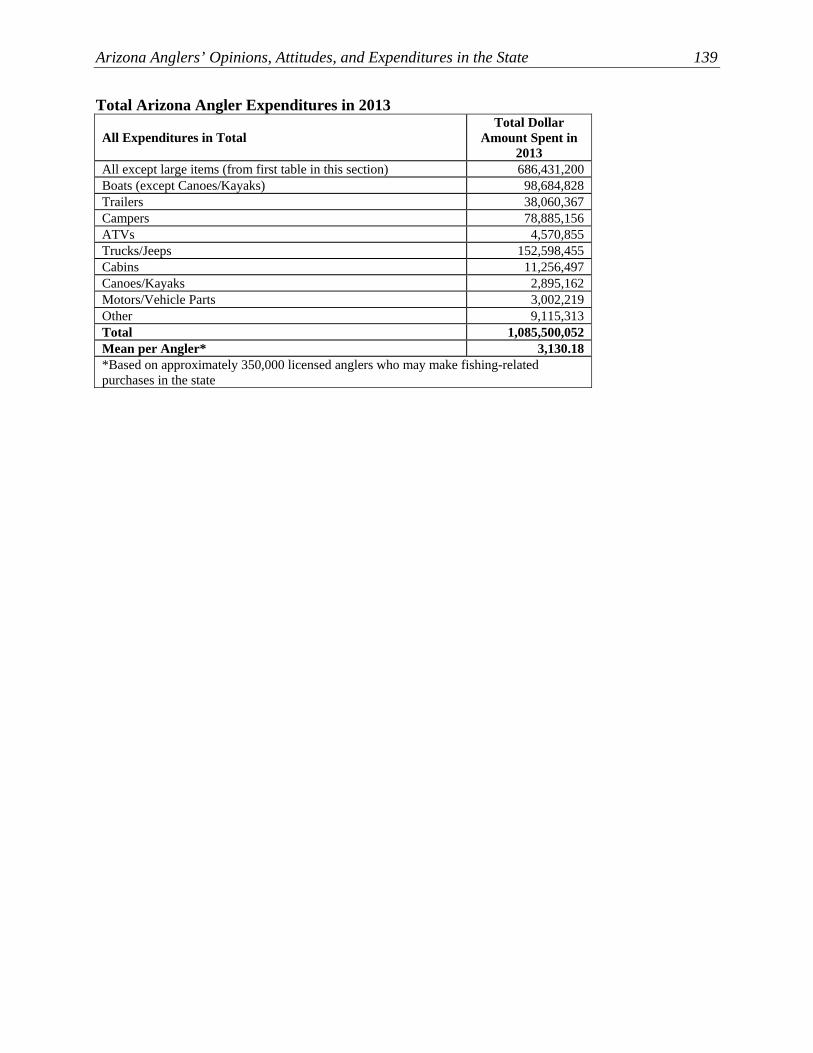
Arizona Anglers’ Opinions, Attitudes, and Expenditures in the State 139
Total Arizona Angler Expenditures in 2013
All Expenditures in Total Total Dollar
Amount Spent in 2013
All except large items (from first table in this section) 686,431,200 Boats (except Canoes/Kayaks) 98,684,828 Trailers 38,060,367 Campers 78,885,156 ATVs 4,570,855 Trucks/Jeeps 152,598,455 Cabins 11,256,497 Canoes/Kayaks 2,895,162 Motors/Vehicle Parts 3,002,219 Other 9,115,313 Total 1,085,500,052 Mean per Angler* 3,130.18 *Based on approximately 350,000 licensed anglers who may make fishing-related purchases in the state
140 Responsive Management
PARTICIPATION IN OUTDOOR RECREATION IN GENERAL An open-ended question asked anglers to indicate other outdoor recreation activities that they
enjoy. The most common are hunting (51% participate), hiking/backpacking (25%), and
camping (20%). A second tier consists of golf (8%), ATVing/off-roading (8%), boating
(6%), bicycling (6%), and shooting (5%).
• Anglers were asked to compare the importance of fishing to their other recreation
activities. For a majority of anglers (60%), fishing is either their most important
recreational activity or one of their most important activities.

Arizona Anglers’ Opinions, Attitudes, and Expenditures in the State 141
Q28. What other outdoor recreation activities do you enjoy? (Part 1.)
1.3
1.1
0.9
0.9
0.8
0.7
0.7
0.7
0.6
0.6
0.5
0.4
0.3
0.3
3.3
5.0
5.8
50.6
25.0
19.5
8.3
7.8
6.2
2.3
1.8
1.7
1.7
1.5
1.4
0 20 40 60 80 100
Hunting (including trapping and bowhunting)
Hiking / backpacking
Camping
Golf
ATVing / off-roading / dirt biking / snowmobiling
Boating
Bicycling
Shooting
Walking
Skiing / snowboarding
Horseback riding / equestrian activities
Archery (includes bowhunting)
Wildlife watching / birdwatching / photography
Sightseeing / driving for pleasure
Gardening
Collecting / gathering / prospecting
Field sports in general (did not specify)
Swimming
Motorcycling
Baseball / softball
Jogging / running
Tennis
Art / crafts / woodworking
Auto racing / working on carsClimbing / rock climbing / mountaineering /
geocachingWater skiing / wakeboarding
Flying planes / flying other aircraft / ballooning /skydiving
Water sports in general (did not specify)
Football
Percent (n=3476)
The use of one decimal place on this graph is not meant to imply that the survey results have an accuracy to that decimal place; rather, it is done
so that the activities at the low end of participation are not lost (i.e., they
would round to 0 if shown as integers).

142 Responsive Management
Q28. What other outdoor recreation activities do you enjoy? (Part 2.)
0.05
0.05
0.05
0.03
0.03
0.03
0.02
0.02
0.02
0.01
0.01
0.01
8.08
0.15
0.21
0.22
0.31
0.29
0.26
0.24
0.24
0.22
0.13
0.11
0.08
0.08
0.05
0.05
0 20 40 60 80 100
Working on house / landscaping
Basketball
Horseshoes
Soccer
Picnicking / BBQing / cooking out
Surfing
Anything / outside in general / being in nature
RVing
Firewood
Frisbee golf / disc golf
Livestock / ranch work / farm work
SCUBA diving / skin diving
Skating (not ice) / skateboarding
Volleyball
Radio-controlled models
Astronomy
Falconry
Martial artsBeachcombing / beach activities (other than
surfing)Snowshoeing
Lacrosse
Handball
Windsurfing
Hockey
Fitness / working out in general
Going to yard sales
Snow play / sledding
Don't know / no answer / none
Percent (n=3476)
The use of two decimal places on this graph is not meant to imply that the survey results have an accuracy
to that decimal place; rather, it is done so that the activities at the low end of participation are not lost (i.e., they would round to 0 if shown as
integers).

Arizona Anglers’ Opinions, Attitudes, and Expenditures in the State 143
Q28. What other outdoor recreation activities do you enjoy?
Activities
Apa
che
Coc
hise
Coc
onin
o
Gila
Gra
ham
Gre
enle
e
La
Paz
Mar
icop
a
Hunting (including trapping and bowhunting) 70.09 58.70 62.99 54.14 69.56 74.35 34.76 50.11
Hiking / backpacking 29.06 24.49 38.50 21.04 21.83 34.20 6.42 24.83 Camping 23.93 16.80 21.51 17.22 29.29 34.20 19.52 19.19 Golf 3.42 5.78 4.50 3.82 1.15 14.25 8.80 8.35 ATVing / off-roading / dirt biking / snowmobiling 15.38 3.22 6.51 8.90 14.37 17.10 10.93 7.22
Boating 6.84 4.53 9.00 4.45 9.22 5.70 21.66 4.29 Bicycling 0.85 1.90 8.49 1.94 2.85 5.70 0 7.00 Shooting 5.13 4.53 3.99 4.45 4.61 8.55 4.28 5.42 Walking 0.85 3.22 1.49 2.57 1.15 0 4.28 3.39 Skiing / snowboarding 2.56 0.66 4.50 1.25 0.54 2.85 0 2.03 Horseback riding / equestrian activities 5.13 1.90 2.50 1.25 2.31 2.85 2.14 1.81 Archery (includes bowhunting) 2.56 0.66 1.49 2.57 1.15 2.85 0 2.03 Wildlife watching / birdwatching / photography 1.71 2.56 3.99 1.25 1.69 0 2.14 1.13
Sightseeing / driving for pleasure 4.27 1.31 1.00 0.63 2.31 0 2.14 0.68 Gardening 2.56 2.56 0.49 3.82 0.54 2.85 0 1.58 Collecting / gathering / prospecting 2.56 1.31 0.49 0 1.15 0 2.14 0.90 Field sports in general (did not specify) 0 0 0.49 1.25 0 0 0 1.35 Swimming 0 0 1.00 0.63 1.69 0 0 0.68 Motorcycling 0 0.66 2.50 1.94 0 0 2.14 0.45 Baseball / softball 0 0.66 0.49 0 0 2.85 0 0.68 Jogging / running 0 0.66 1.49 0.63 0.54 5.70 0 0.68 Tennis 0 0 0.49 0 0.54 0 0 0.90 Art / crafts / woodworking 0 0.66 0 0 0.54 0 0 1.13 Auto racing / working on cars 0.85 0.66 0.49 0 0.54 0 0 0.68 Climbing / rock climbing / mountaineering / geocaching 0 0.66 2.01 0 0.54 0 0 0.45
Water skiing / wakeboarding 0 0 1.00 0.63 0.54 0 2.14 0.45 Flying planes / flying other aircraft / ballooning / skydiving 0 0.66 0.49 0 0 0 0 0.45
Water sports in general (did not specify) 0 0 0 0 0 0 0 0.45 Football 0 0 0.49 0 0 0 0 0.45 Working on house / landscaping 0 0 0 0 0 0 0 0.23 Basketball 0 0 0 0 0 0 0 0.45 Horseshoes 0 0.66 0 0 0 2.85 0 0.23 Soccer 0 0 0.49 0 0.54 0 0 0.23
Note: The use of two decimal places in this tabulation is not meant to imply that the survey results have an accuracy to that decimal place; rather, it is done so that the activities at the low end of participation are not lost (i.e., they would round to 0 if shown as integers). In cells that are a true 0, the cell does not include decimals.
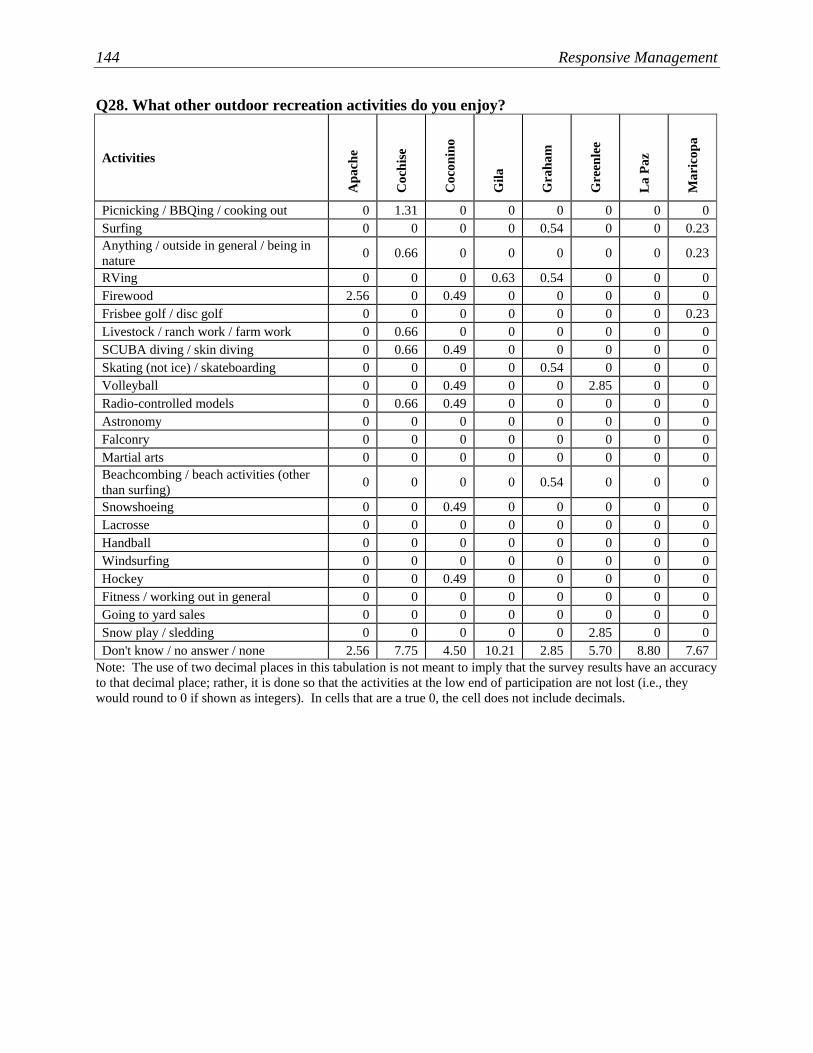
144 Responsive Management
Q28. What other outdoor recreation activities do you enjoy?
Activities
Apa
che
Coc
hise
Coc
onin
o
Gila
Gra
ham
Gre
enle
e
La
Paz
Mar
icop
a
Picnicking / BBQing / cooking out 0 1.31 0 0 0 0 0 0 Surfing 0 0 0 0 0.54 0 0 0.23 Anything / outside in general / being in nature 0 0.66 0 0 0 0 0 0.23
RVing 0 0 0 0.63 0.54 0 0 0 Firewood 2.56 0 0.49 0 0 0 0 0 Frisbee golf / disc golf 0 0 0 0 0 0 0 0.23 Livestock / ranch work / farm work 0 0.66 0 0 0 0 0 0 SCUBA diving / skin diving 0 0.66 0.49 0 0 0 0 0 Skating (not ice) / skateboarding 0 0 0 0 0.54 0 0 0 Volleyball 0 0 0.49 0 0 2.85 0 0 Radio-controlled models 0 0.66 0.49 0 0 0 0 0 Astronomy 0 0 0 0 0 0 0 0 Falconry 0 0 0 0 0 0 0 0 Martial arts 0 0 0 0 0 0 0 0 Beachcombing / beach activities (other than surfing) 0 0 0 0 0.54 0 0 0
Snowshoeing 0 0 0.49 0 0 0 0 0 Lacrosse 0 0 0 0 0 0 0 0 Handball 0 0 0 0 0 0 0 0 Windsurfing 0 0 0 0 0 0 0 0 Hockey 0 0 0.49 0 0 0 0 0 Fitness / working out in general 0 0 0 0 0 0 0 0 Going to yard sales 0 0 0 0 0 0 0 0 Snow play / sledding 0 0 0 0 0 2.85 0 0 Don't know / no answer / none 2.56 7.75 4.50 10.21 2.85 5.70 8.80 7.67
Note: The use of two decimal places in this tabulation is not meant to imply that the survey results have an accuracy to that decimal place; rather, it is done so that the activities at the low end of participation are not lost (i.e., they would round to 0 if shown as integers). In cells that are a true 0, the cell does not include decimals.

Arizona Anglers’ Opinions, Attitudes, and Expenditures in the State 145
Q28. What other outdoor recreation activities do you enjoy?
Activities
Moh
ave
Nav
ajo
Pim
a
Pina
l
Sant
a C
ruz
Yav
apai
Yum
a
Out
-of-
Stat
e
Hunting (including trapping and bowhunting) 35.64 76.12 48.89 64.33 60.39 54.82 46.59 39.48
Hiking / backpacking 17.82 19.33 24.24 20.99 16.29 26.36 14.27 29.57 Camping 20.68 23.30 23.03 18.89 16.29 20.51 9.31 15.48 Golf 6.90 5.70 5.05 9.10 0 5.85 9.31 16.87 ATVing / off-roading / dirt biking / snowmobiling 14.36 6.82 7.07 7.35 7.02 8.79 11.17 7.31
Boating 13.23 2.85 7.67 3.85 7.02 7.10 4.34 10.61 Bicycling 1.73 2.85 5.66 4.19 2.25 3.77 3.72 5.74 Shooting 7.48 3.96 5.66 4.54 2.25 4.61 6.83 2.09 Walking 4.02 2.27 3.44 3.50 2.25 2.51 2.48 4.35 Skiing / snowboarding 2.86 3.43 2.22 1.75 2.25 1.26 3.10 3.13 Horseback riding / equestrian activities 0 1.69 1.22 2.79 4.78 2.10 0 2.26 Archery (includes bowhunting) 0 0.58 2.62 1.41 0 0.84 1.86 0.87 Wildlife watching / birdwatching / photography 2.86 1.69 1.62 1.75 2.25 2.92 1.24 2.95
Sightseeing / driving for pleasure 1.73 1.16 1.01 2.44 2.25 3.36 3.10 4.52 Gardening 0.58 1.69 0.20 1.41 2.25 1.26 1.24 1.91 Collecting / gathering / prospecting 4.59 1.16 1.62 0.69 2.25 2.92 0 1.74 Field sports in general (did not specify) 0.58 0 1.22 0.34 0 0.41 1.86 0.87 Swimming 3.44 0 1.42 0.34 2.25 0.41 1.24 1.39 Motorcycling 0.58 1.16 0.81 2.10 2.25 1.26 1.86 1.39 Baseball / softball 0.58 0 1.42 1.06 0 0.41 1.24 0.87 Jogging / running 0.58 0 1.01 0.69 0 0.84 1.24 0.52 Tennis 0 0.58 0.60 0.69 0 0.41 0 0.52 Art / crafts / woodworking 0 0 0 0 0 0.84 0.62 0.34 Auto racing / working on cars 0 0.58 0.20 0.34 0 0.84 1.24 0.70 Climbing / rock climbing / mountaineering / geocaching 1.73 0.58 0.60 0 0 0 0 0.87
Water skiing / wakeboarding 1.16 0 1.01 0 0 0.41 0 0.18 Flying planes / flying other aircraft / ballooning / skydiving 0.58 0 0 0.34 0 0.41 0.62 0.34
Water sports in general (did not specify) 0 1.69 0.40 0 0 0 0 0.18 Football 0 0 0.20 0.34 0 0.84 0.62 0 Working on house / landscaping 0.58 0 1.01 0.69 0 0 0 0.18 Basketball 0 0 0.40 0 0 0.41 0 0 Horseshoes 0 0.58 0 0.34 0 0.84 1.24 0.34 Soccer 0 0 0.20 0 0 0.84 0 0.34
Note: The use of two decimal places in this tabulation is not meant to imply that the survey results have an accuracy to that decimal place; rather, it is done so that the activities at the low end of participation are not lost (i.e., they would round to 0 if shown as integers). In cells that are a true 0, the cell does not include decimals.

146 Responsive Management
Q28. What other outdoor recreation activities do you enjoy?
Activities
Moh
ave
Nav
ajo
Pim
a
Pina
l
Sant
a C
ruz
Yav
apai
Yum
a
Out
-of-
Stat
e
Picnicking / BBQing / cooking out 0 0.58 0.81 0.69 0 0.84 0.62 0.18 Surfing 1.16 0 0 0 0 0 0 0.52 Anything / outside in general / being in nature 0.58 0.58 0.20 0.34 0 0 1.24 0
RVing 1.16 0 0.60 0 0 0.41 1.24 0.18 Firewood 0 1.16 0 0 0 0 0 0.70 Frisbee golf / disc golf 0 0 0 0 0 0.41 0 0 Livestock / ranch work / farm work 0 0.58 0 0.34 0 0 0.62 0.52 SCUBA diving / skin diving 1.16 0.58 0 0 0 0 0 0 Skating (not ice) / skateboarding 0.58 0 0.20 0 0 0.41 0 0 Volleyball 0 0 0 0.34 0 0 0.62 0 Radio-controlled models 0 0 0 0 0 0 0 0.18 Astronomy 0 0 0.20 0 0 0 0 0.18 Falconry 0 0 0.20 0 0 0 0 0.18 Martial arts 0 0 0.20 0 0 0 0 0.18 Beachcombing / beach activities (other than surfing) 0 0.58 0 0 2.25 0 0 0
Snowshoeing 0 0 0 0 0 0 0.62 0 Lacrosse 0 0 0.20 0 0 0 0 0 Handball 0 0 0 0 0 0 0 0.18 Windsurfing 0 0 0 0 0 0 0 0.18 Hockey 0 0 0 0 0 0 0 0 Fitness / working out in general 0 0 0 0 0 0 0.62 0 Going to yard sales 0 0 0 0 0 0 0.62 0 Snow play / sledding 0 0 0 0 0 0 0 0 Don't know / no answer / none 13.23 4.54 9.69 4.88 11.55 7.54 13.03 9.22
Note: The use of two decimal places in this tabulation is not meant to imply that the survey results have an accuracy to that decimal place; rather, it is done so that the activities at the low end of participation are not lost (i.e., they would round to 0 if shown as integers). In cells that are a true 0, the cell does not include decimals.
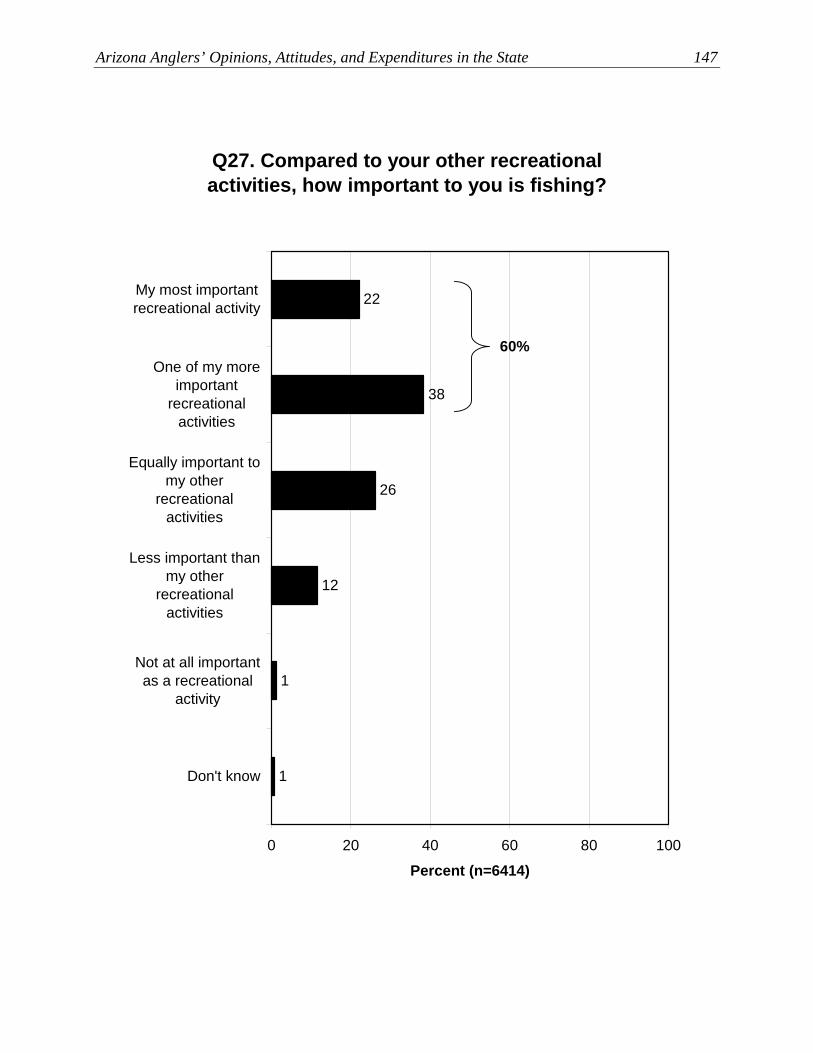
Arizona Anglers’ Opinions, Attitudes, and Expenditures in the State 147
Q27. Compared to your other recreational activities, how important to you is fishing?
1
1
12
26
38
22
0 20 40 60 80 100
My most importantrecreational activity
One of my moreimportant
recreationalactivities
Equally important tomy other
recreationalactivities
Less important thanmy other
recreationalactivities
Not at all importantas a recreational
activity
Don't know
Percent (n=6414)
60%

148 Responsive Management
Q27. Compared to your other recreational activities, how important to you is fishing?
Importance of Fishing
Apa
che
Coc
hise
Coc
onin
o
Gila
Gra
ham
Gre
enle
e
La
Paz
Mar
icop
a
My most important recreational activity 16 19 16 23 17 17 26 23
One of my more important recreational activities 40 39 39 41 35 46 38 37
Equally important to my other recreational activities 28 25 27 27 29 26 25 26
Less important than my other recreational activities 15 13 15 7 16 12 12 12
Not at all important as a recreational activity 2 3 2 1 2 0 0 1
Don't know 0 1 0 1 0 0 0 1
Q27. Compared to your other recreational activities, how important to you is fishing?
Importance of Fishing
Moh
ave
Nav
ajo
Pim
a
Pina
l
Sant
a C
ruz
Yav
apai
Yum
a
Out
-of-
Stat
e
My most important recreational activity 26 21 21 19 20 18 25 26
One of my more important recreational activities 42 38 40 40 39 40 38 38
Equally important to my other recreational activities 22 29 24 28 24 29 28 23
Less important than my other recreational activities 9 10 13 11 14 11 7 9
Not at all important as a recreational activity 0 2 1 2 1 1 1 2
Don't know 0 0 1 1 3 1 1 2

Arizona Anglers’ Opinions, Attitudes, and Expenditures in the State 149
CHARACTERISTICS OF ANGLERS The survey included four questions about characteristics and behaviors of anglers, such as
their level of expertise and the number of days that they fished.
• Active anglers most commonly perceive of themselves as intermediate in expertise: 54%
give this response, which exceeds advanced (36%) and far exceeds beginner (10%).
• The mean number of years that anglers have been fishing in Arizona is 23.8 years; the
median is 23 years.
• Days fishing in Arizona in 2013: the mean is 20.9 days; the median is 10 days.
• Number of fishing trips taken in or to Arizona: the median number is 5 trips taken in
2013.

150 Responsive Management
Q43. How would you rate your expertise as an angler? (Asked of those who personally fished in
Arizona in 2013.)
1
36
54
10
0 20 40 60 80 100
Beginner
Intermediate
Advanced
Don't know
Percent (n=5637)

Arizona Anglers’ Opinions, Attitudes, and Expenditures in the State 151
Q43. How would you rate your expertise as an angler? (Asked of those who personally fished in Arizona in 2013.)
Level of Expertise
Apa
che
Coc
hise
Coc
onin
o
Gila
Gra
ham
Gre
enle
e
La
Paz
Mar
icop
a
Beginner 7 10 7 8 8 8 14 11 Intermediate 51 56 52 53 63 45 39 55 Advanced 39 33 40 38 29 45 46 33 Don't know 3 1 1 1 1 3 1 1
Q43. How would you rate your expertise as an angler? (Asked of those who personally fished in Arizona in 2013.)
Level of Expertise
Moh
ave
Nav
ajo
Pim
a
Pina
l
Sant
a C
ruz
Yav
apai
Yum
a
Out
-of-
Stat
e
Beginner 6 7 12 8 16 7 8 6 Intermediate 50 54 54 62 48 54 54 45 Advanced 42 37 34 29 35 38 35 48 Don't know 2 2 0 1 1 1 2 1

152 Responsive Management
Q21. How many years total have you been fishing in Arizona?
7
6
5
2
3
9
10
7
10
2
6
8
9
10
8
0 20 40 60 80 100
More than 50 years
46-50 years
41-45 years
36-40 years
31-35 years
26-30 years
21-25 years
16-20 years
11-15 years
6-10 years
5 years
4 years
3 years
2 years
1 year
Percent (n=2154)
22% *
* Rounding on graph causes apparent discrepancy; sum is calculated on unrounded
numbers.
Mean: 23.8Median: 23

Arizona Anglers’ Opinions, Attitudes, and Expenditures in the State 153
Q21. How many years total have you been fishing in Arizona? (Asked of those who personally fished in Arizona in 2013.)
Years
Apa
che
Coc
hise
Coc
onin
o
Gila
Gra
ham
Gre
enle
e
La
Paz
Mar
icop
a
More than 50 years 15 5 7 11 17 13 25 9
46-50 years 15 2 4 9 4 13 0 7 41-45 years 6 2 4 4 10 6 0 1 36-40 years 19 9 12 7 4 6 0 14 31-35 years 9 7 6 7 6 0 0 9 26-30 years 13 9 11 13 12 0 8 12 21-25 years 9 5 14 6 4 13 0 12 16-20 years 0 11 14 11 10 13 17 10 11-15 years 4 12 11 13 8 13 0 7 6-10 years 9 11 6 6 10 6 0 4 5 years 0 9 1 2 2 0 0 2 4 years 0 0 4 0 2 6 0 1 3 years 0 5 4 0 2 0 8 5 2 years 2 5 1 2 6 6 25 4 1 year 0 9 1 9 2 6 17 3
Q21. How many years total have you been fishing in Arizona? (Asked of those who personally fished in Arizona in 2013.)
Years
Moh
ave
Nav
ajo
Pim
a
Pina
l
Sant
a C
ruz
Yav
apai
Yum
a
Out
-of-
Stat
e
More than 50 years 4 13 7 5 0 18 3 0
46-50 years 3 12 4 11 0 3 6 0 41-45 years 1 4 6 2 20 4 5 0 36-40 years 6 8 7 11 0 11 9 0 31-35 years 6 14 3 6 0 0 0 1 26-30 years 3 7 11 6 41 10 5 4 21-25 years 7 7 6 7 0 3 3 1 16-20 years 9 13 4 17 20 11 12 3 11-15 years 12 7 11 7 20 6 6 5 6-10 years 19 7 19 7 0 15 25 12 5 years 6 1 2 6 0 2 3 7 4 years 0 1 4 2 0 2 2 4 3 years 3 3 4 6 0 1 5 10 2 years 9 3 5 7 0 8 8 17 1 year 10 1 7 1 0 5 9 35
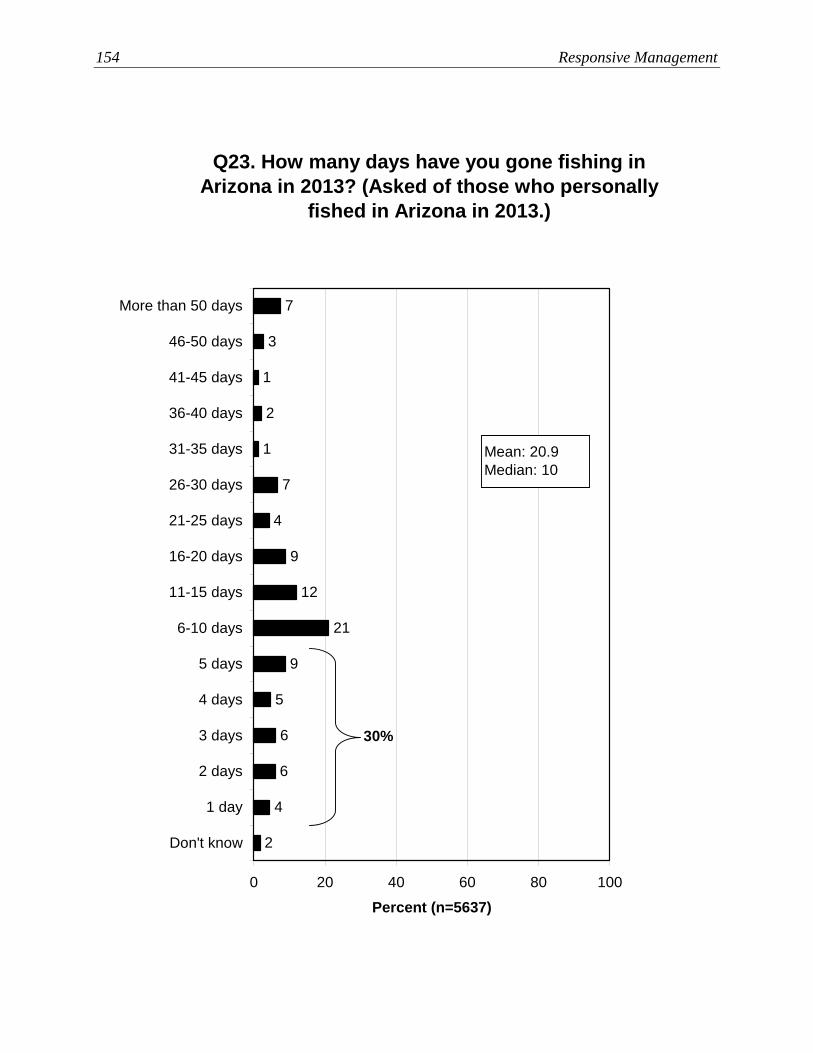
154 Responsive Management
Q23. How many days have you gone fishing in Arizona in 2013? (Asked of those who personally
fished in Arizona in 2013.)
2
4
6
6
5
9
21
7
1
2
1
3
7
4
9
12
0 20 40 60 80 100
More than 50 days
46-50 days
41-45 days
36-40 days
31-35 days
26-30 days
21-25 days
16-20 days
11-15 days
6-10 days
5 days
4 days
3 days
2 days
1 day
Don't know
Percent (n=5637)
30%
Mean: 20.9Median: 10

Arizona Anglers’ Opinions, Attitudes, and Expenditures in the State 155
Q23. How many days have you gone fishing in Arizona in 2013? (Asked of those who personally fished in Arizona in 2013.)
Days
Apa
che
Coc
hise
Coc
onin
o
Gila
Gra
ham
Gre
enle
e
La
Paz
Mar
icop
a
More than 50 days 7 10 8 15 9 5 19 7
46-50 days 0 2 3 3 3 4 6 3 41-45 days 0 0 1 2 2 1 0 1 36-40 days 2 2 2 3 3 3 4 2 31-35 days 2 1 2 1 1 1 1 1 26-30 days 8 6 5 9 10 7 17 6 21-25 days 2 1 7 5 4 3 1 4 16-20 days 10 13 9 12 8 12 7 8 11-15 days 14 13 14 11 15 8 8 11 6-10 days 24 25 21 20 21 34 17 22 5 days 9 5 9 6 7 7 4 10 4 days 4 5 3 3 3 7 4 4 3 days 6 5 5 3 4 0 4 7 2 days 3 5 5 4 6 4 4 6 1 day 5 4 3 3 3 4 3 4 Don't know 0 1 2 1 2 0 0 2
Q23. How many days have you gone fishing in Arizona in 2013? (Asked of those who personally fished in Arizona in 2013.)
Days
Moh
ave
Nav
ajo
Pim
a
Pina
l
Sant
a C
ruz
Yav
apai
Yum
a
Out
-of-
Stat
e
More than 50 days 18 9 5 5 10 8 15 2
46-50 days 4 3 2 2 0 3 5 1 41-45 days 2 1 1 1 0 1 1 1 36-40 days 4 3 1 2 0 3 4 1 31-35 days 2 3 1 0 3 2 2 0 26-30 days 10 9 6 6 7 9 10 4 21-25 days 5 5 5 6 10 5 6 2 16-20 days 8 10 10 10 13 12 10 7 11-15 days 13 13 13 15 6 12 15 8 6-10 days 16 20 23 22 27 22 12 16 5 days 5 10 7 7 9 7 4 10 4 days 2 2 8 5 7 4 3 8 3 days 4 5 6 7 1 4 5 10 2 days 4 4 5 4 6 2 3 14 1 day 1 3 5 4 1 4 1 16 Don't know 1 2 2 2 1 2 2 1

156 Responsive Management
Q24. In total, about how many fishing trips have you taken in Arizona in 2013? (Asked of those who
personally fished in Arizona in 2013.)
3
12
10
19
8
6
3
4
9
9
7
11
0 20 40 60 80 100
More than 30 trips
26-30 trips
21-25 trips
16-20 trips
11-15 trips
6-10 trips
5 trips
4 trips
3 trips
2 trips
1 trip
Don't know
Percent (n=5637)
49%
Mean: 13.9Median: 5

Arizona Anglers’ Opinions, Attitudes, and Expenditures in the State 157
Q24. In total, about how many fishing trips have you taken in Arizona in 2013? (Asked of those who personally fished in Arizona in 2013.)
Trips
Apa
che
Coc
hise
Coc
onin
o
Gila
Gra
ham
Gre
enle
e
La
Paz
Mar
icop
a
More than 30 trips 9 7 8 16 8 8 21 8
26-30 trips 6 3 2 5 7 5 10 4 21-25 trips 1 2 4 5 2 1 0 3 16-20 trips 7 6 9 10 6 8 7 6 11-15 trips 7 6 10 10 9 7 11 7 6-10 trips 25 23 21 22 20 28 18 20 5 trips 11 6 10 6 8 4 3 11 4 trips 6 8 6 4 7 8 3 7 3 trips 13 12 10 5 11 12 6 12 2 trips 8 14 8 7 10 9 4 11 1 trip 6 11 10 5 10 8 15 8 Don't know 1 1 3 3 2 0 3 3
Q24. In total, about how many fishing trips have you taken in Arizona in 2013? (Asked of those who personally fished in Arizona in 2013.)
Trips
Moh
ave
Nav
ajo
Pim
a
Pina
l
Sant
a C
ruz
Yav
apai
Yum
a
Out
-of-
Stat
e
More than 30 trips 21 11 4 6 13 10 18 3
26-30 trips 6 6 3 2 4 4 7 3 21-25 trips 4 4 3 4 6 3 5 2 16-20 trips 8 8 5 5 6 6 10 3 11-15 trips 9 9 8 8 7 10 11 3 6-10 trips 16 22 17 25 21 22 13 10 5 trips 9 11 9 9 11 10 7 5 4 trips 6 7 9 8 10 7 4 4 3 trips 7 8 14 12 6 8 7 7 2 trips 5 6 12 9 10 7 7 10 1 trip 3 6 12 11 4 10 7 50 Don't know 5 3 3 2 3 3 4 1

158 Responsive Management
DEMOGRAPHIC DATA The survey collected some demographic data, which is primarily used in analyses. These
data include:
• Gender: 83% of anglers in the survey (including non-active anglers) are male, while 17%
are female.
• Age: note that the database was of licensed anglers, and very few people under 16 years
old are licensed; therefore, the mean and median shown are of those 16 years old and
older.
• Ethnicity: although whites predominate, other ethnicities are represented within the
community of Arizona anglers.
• County of residence: of all the counties, Maricopa accounts for the most anglers, by far.
Note that the sample was purposely proportioned to have the counties be equal to their
true proportion of all licensed anglers.
• Income: the income follows a bell curve, with the peak in the $60,000 to $79,999 range.

Arizona Anglers’ Opinions, Attitudes, and Expenditures in the State 159
Q497. Respondent's gender (not asked, observed by interviewer).
17
83
0 20 40 60 80 100
Male
Female
Percent (n=6414)
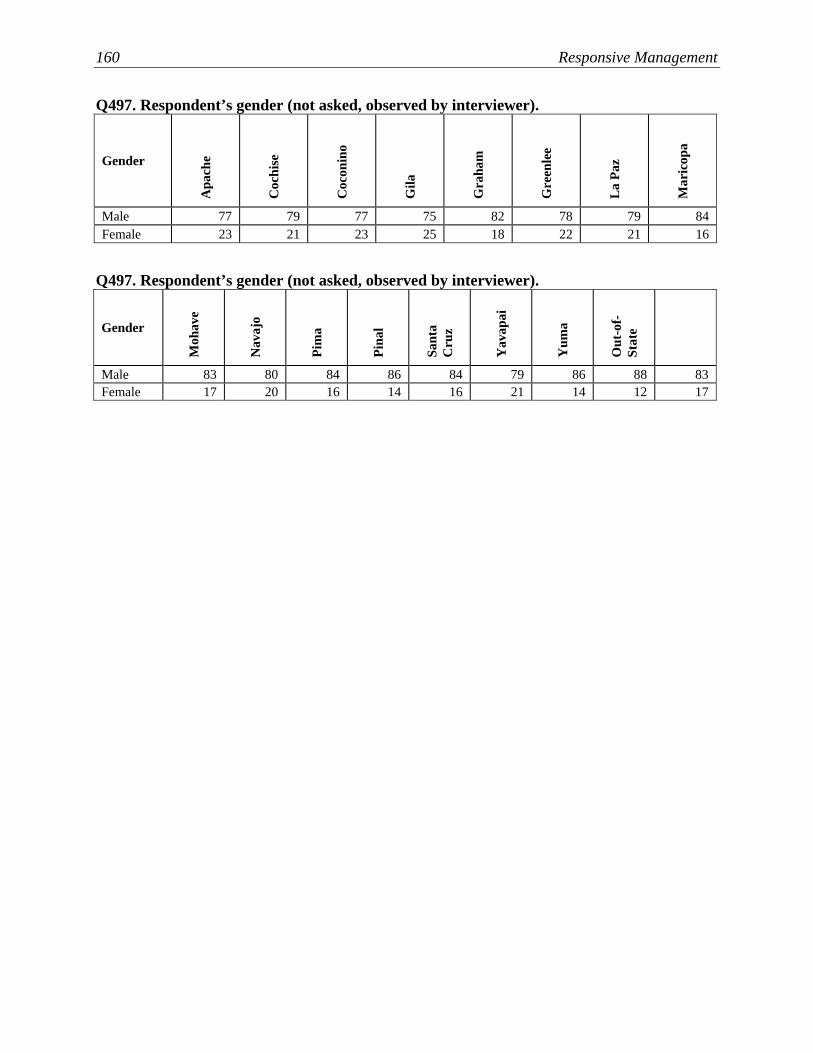
160 Responsive Management
Q497. Respondent’s gender (not asked, observed by interviewer).
Gender
Apa
che
Coc
hise
Coc
onin
o
Gila
Gra
ham
Gre
enle
e
La
Paz
Mar
icop
a
Male 77 79 77 75 82 78 79 84 Female 23 21 23 25 18 22 21 16
Q497. Respondent’s gender (not asked, observed by interviewer).
Gender
Moh
ave
Nav
ajo
Pim
a
Pina
l
Sant
a C
ruz
Yav
apai
Yum
a
Out
-of-
Stat
e
Male 83 80 84 86 84 79 86 88 83 Female 17 20 16 14 16 21 14 12 17

Arizona Anglers’ Opinions, Attitudes, and Expenditures in the State 161
Q491. Respondent's age.
5
7
13
21
29
23
1
2
0 20 40 60 80 100
65 years old orolder
55-64 years old
45-54 years old
35-44 years old
25-34 years old
18-24 years old
Under 18 yearsold
Refused / Don'tknow
Percent (n=6414)
Mean: 52.7*Median: 55*
* Mean and median are of those who bought a fishing license in Arizona; note that few people
under 16 years old buy licenses, which may make the mean and
median appear high.

162 Responsive Management
Q491. Respondent’s age.
Age bracket
Apa
che
Coc
hise
Coc
onin
o
Gila
Gra
ham
Gre
enle
e
La
Paz
Mar
icop
a
65 years old or older 16 21 12 28 14 8 38 19
55-64 years old 35 31 31 38 30 32 29 29 45-54 years old 22 20 22 18 22 23 21 23 35-44 years old 13 11 18 6 15 22 7 15 25-34 years old 3 11 11 5 8 9 3 7 18-24 years old 7 4 5 2 9 6 3 4 Under 18 years old 1 2 0 0 0 0 0 1
Refused / Don't know 2 1 2 3 2 0 1 2
Q491. Respondent’s age.
Age bracket
Moh
ave
Nav
ajo
Pim
a
Pina
l
Sant
a C
ruz
Yav
apai
Yum
a
Out
-of-
Stat
e
65 years old or older 38 21 20 23 16 28 30 47
55-64 years old 27 30 28 26 31 29 24 2645-54 years old 19 22 21 19 19 19 16 1135-44 years old 7 12 14 16 10 13 13 525-34 years old 6 9 8 8 10 5 9 318-24 years old 2 4 7 5 9 4 7 4Under 18 years old 0 1 0 1 3 1 1 0
Refused / Don't know 1 1 2 2 3 1 1 4

Arizona Anglers’ Opinions, Attitudes, and Expenditures in the State 163
Q489. What races or ethnic backgrounds do you consider yourself? Please mention all that apply.
Less than 0.5%
2
1
87
8
2
1
1
Less than 0.5%
0 20 40 60 80 100
White
Latino
American Indian /Native American
Black or African-American
Asian
Pacific Islander
Other
Refused
Don't know
Percent (n=6414)
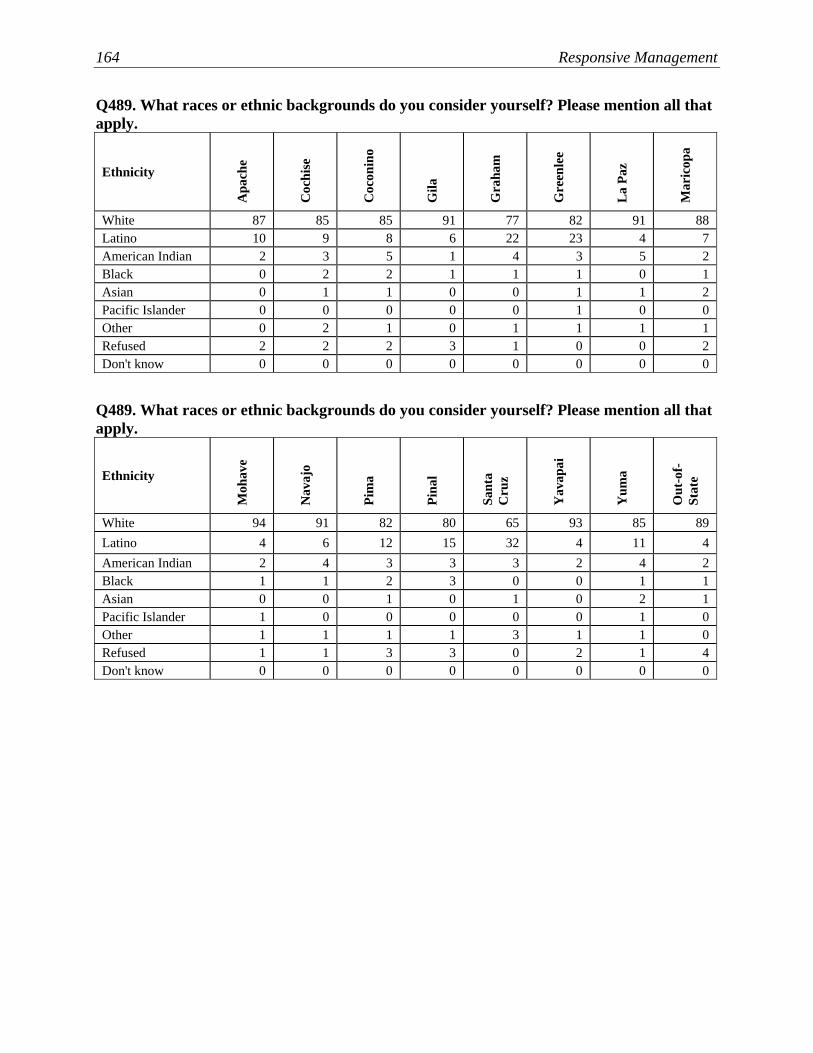
164 Responsive Management
Q489. What races or ethnic backgrounds do you consider yourself? Please mention all that apply.
Ethnicity
Apa
che
Coc
hise
Coc
onin
o
Gila
Gra
ham
Gre
enle
e
La
Paz
Mar
icop
a
White 87 85 85 91 77 82 91 88 Latino 10 9 8 6 22 23 4 7 American Indian 2 3 5 1 4 3 5 2 Black 0 2 2 1 1 1 0 1 Asian 0 1 1 0 0 1 1 2 Pacific Islander 0 0 0 0 0 1 0 0 Other 0 2 1 0 1 1 1 1 Refused 2 2 2 3 1 0 0 2 Don't know 0 0 0 0 0 0 0 0
Q489. What races or ethnic backgrounds do you consider yourself? Please mention all that apply.
Ethnicity
Moh
ave
Nav
ajo
Pim
a
Pina
l
Sant
a C
ruz
Yav
apai
Yum
a
Out
-of-
Stat
e
White 94 91 82 80 65 93 85 89 Latino 4 6 12 15 32 4 11 4 American Indian 2 4 3 3 3 2 4 2 Black 1 1 2 3 0 0 1 1 Asian 0 0 1 0 1 0 2 1 Pacific Islander 1 0 0 0 0 0 1 0 Other 1 1 1 1 3 1 1 0 Refused 1 1 3 3 0 2 1 4 Don't know 0 0 0 0 0 0 0 0

Arizona Anglers’ Opinions, Attitudes, and Expenditures in the State 165
Q485. Respondent's county of residence.
1.1
2.2
4.7
2.3
1.4
0.5
0.4
47.9
4.9
3.2
11.0
3.5
0.4
5.6
3.0
8.1
0 20 40 60 80 100
Apache
Cochise
Coconino
Gila
Graham
Greenlee
La Paz
Maricopa
Mohave
Navajo
Pima
Pinal
Santa Cruz
Yavapai
Yuma
Out-of-State
Percent (n=6414)

166 Responsive Management
Q486. Which of these categories best describes your total household income before taxes last
year?
9
11
16
15
13
7
13
5
12
0 20 40 60 80 100
Under $20,000
$20,000-$39,999
$40,000-$59,999
$60,000-$79,999
$80,000-$99,999
$100,000-$119,999
$120,000 or more
Don't know
Refused
Percent (n=6414)

Arizona Anglers’ Opinions, Attitudes, and Expenditures in the State 167
Q486. Which of these categories best describes your total household income before taxes last year?
Income
Apa
che
Coc
hise
Coc
onin
o
Gila
Gra
ham
Gre
enle
e
La
Paz
Mar
icop
a
Under $20,000 6 5 7 12 5 9 12 6 $20,000-$39,999 12 12 11 19 16 12 21 10 $40,000-$59,999 17 15 17 20 19 10 19 13 $60,000-$79,999 18 16 15 18 16 28 12 15 $80,000-$99,999 15 14 14 7 16 14 8 12 $100,000-$119,999 10 12 10 7 7 10 9 10 $120,000 or more 9 13 12 5 8 13 7 16 Don't know 7 6 5 6 6 1 3 6 Refused 8 7 8 8 7 3 10 13
Q486. Which of these categories best describes your total household income before taxes last year?
Income
Moh
ave
Nav
ajo
Pim
a
Pina
l
Sant
a C
ruz
Yav
apai
Yum
a
Out
-of-
Stat
e
Under $20,000 14 7 6 5 6 10 10 3 $20,000-$39,999 23 17 14 17 16 16 18 11 $40,000-$59,999 21 24 15 17 11 21 19 16 $60,000-$79,999 15 19 16 17 19 18 15 18 $80,000-$99,999 7 9 12 13 11 10 12 9 $100,000-$119,999 5 6 7 9 8 4 7 9 $120,000 or more 6 8 12 9 10 7 8 13 Don't know 4 6 4 4 9 5 8 4 Refused 6 6 13 10 10 10 3 17

168 Responsive Management
ABOUT RESPONSIVE MANAGEMENT Responsive Management is an internationally recognized public opinion and attitude survey research
firm specializing in natural resource and outdoor recreation issues. Our mission is to help natural
resource and outdoor recreation agencies and organizations better understand and work with their
constituents, customers, and the public.
Utilizing our in-house, full-service telephone, mail, and web-based survey center with 50
professional interviewers, we have conducted more than 1,000 telephone surveys, mail surveys,
personal interviews, and focus groups, as well as numerous marketing and communication plans,
needs assessments, and program evaluations.
Clients include the federal natural resource and land management agencies, most state fish and
wildlife agencies, state departments of natural resources, environmental protection agencies, state
park agencies, tourism boards, most of the major conservation and sportsmen’s organizations, and
numerous private businesses. Responsive Management also collects attitude and opinion data for
many of the nation’s top universities.
Specializing in research on public attitudes toward natural resource and outdoor recreation issues,
Responsive Management has completed a wide range of projects during the past 22 years, including
dozens of studies of hunters, anglers, wildlife viewers, boaters, park visitors, historic site visitors,
hikers, birdwatchers, campers, and rock climbers. Responsive Management has conducted studies
on endangered species; waterfowl and wetlands; and the reintroduction of large predators such as
wolves, grizzly bears, and the Florida panther.
Responsive Management has assisted with research on numerous natural resource ballot initiatives
and referenda and has helped agencies and organizations find alternative funding and increase their
membership and donations. Additionally, Responsive Management has conducted major
organizational and programmatic needs assessments to assist natural resource agencies and
organizations in developing more effective programs based on a solid foundation of fact.
Arizona Anglers’ Opinions, Attitudes, and Expenditures in the State 169
Responsive Management has conducted research on public attitudes toward natural resources and
outdoor recreation in almost every state in the United States, as well as in Canada, Australia, the
United Kingdom, France, Germany, and Japan. Responsive Management has also conducted focus
groups and personal interviews with residents of the African countries of Algeria, Cameroon,
Mauritius, Namibia, South Africa, Tanzania, Zambia, and Zimbabwe.
Responsive Management routinely conducts surveys in Spanish and has conducted surveys in
Chinese, Korean, Japanese and Vietnamese and has completed numerous studies with specific target
audiences, including Hispanics; African-Americans; Asians; women; children; senior citizens; urban,
suburban, and rural residents; large landowners; and farmers.
Responsive Management’s research has been upheld in U.S. District Courts; used in peer-reviewed
journals; and presented at major natural resource, fish and wildlife, and outdoor recreation
conferences across the world. Company research has been featured in most of the nation’s major
media, including CNN, The New York Times, The Wall Street Journal, and on the front pages of USA
Today and The Washington Post. Responsive Management’s research has also been highlighted in
Newsweek magazine.
Visit the Responsive Management website at:
www.responsivemanagement.com