wiiw Working Paper 29: Dimensions of Quality Upgrading in ...
41
wiiw Working Papers | 29 Uwe Dulleck, Neil Foster, Robert Stehrer and Julia Wörz Dimensions of Quality Upgrading in CEECs April 2004
-
Upload
khangminh22 -
Category
Documents
-
view
0 -
download
0
Transcript of wiiw Working Paper 29: Dimensions of Quality Upgrading in ...

wiiw Working Papers | 29
Uwe Dulleck, Neil Foster, Robert Stehrer and Julia Wörz
Dimensions of Quality Upgrading in CEECs
April 2004
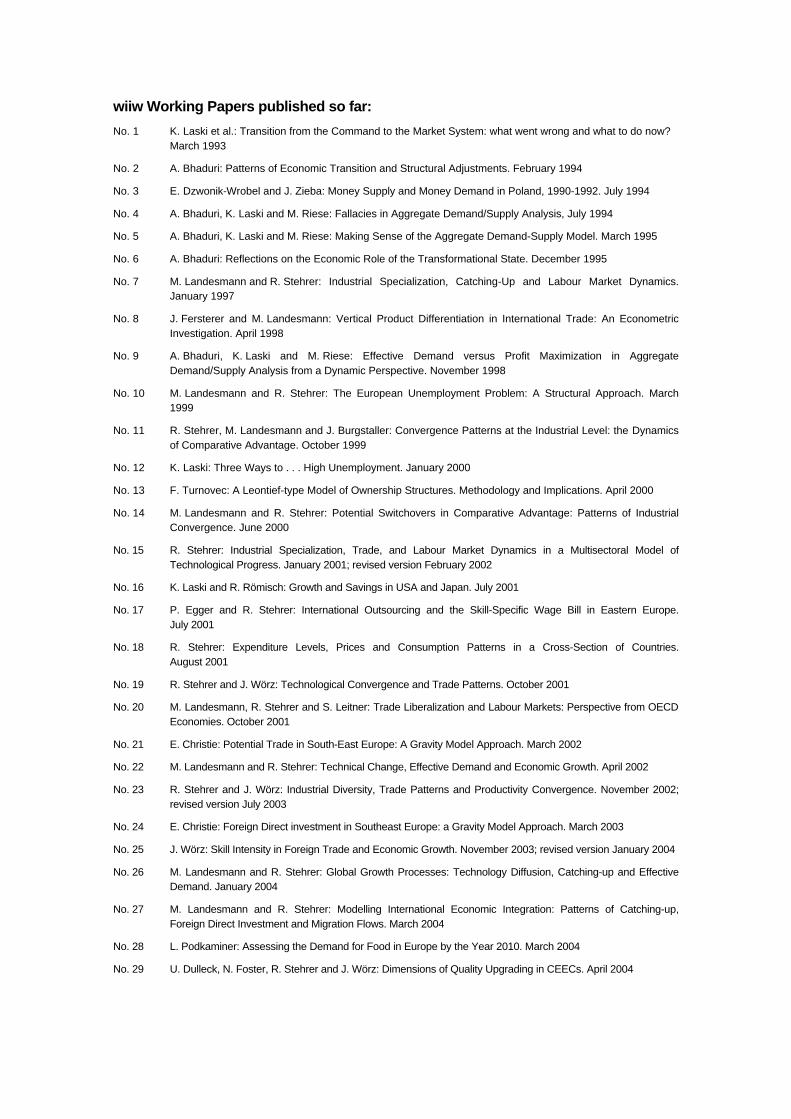
wiiw Working Papers published so far:
No. 1 K. Laski et al.: Transition from the Command to the Market System: what went wrong and what to do now? March 1993
No. 2 A. Bhaduri: Patterns of Economic Transition and Structural Adjustments. February 1994
No. 3 E. Dzwonik-Wrobel and J. Zieba: Money Supply and Money Demand in Poland, 1990-1992. July 1994
No. 4 A. Bhaduri, K. Laski and M. Riese: Fallacies in Aggregate Demand/Supply Analysis, July 1994
No. 5 A. Bhaduri, K. Laski and M. Riese: Making Sense of the Aggregate Demand-Supply Model. March 1995
No. 6 A. Bhaduri: Reflections on the Economic Role of the Transformational State. December 1995
No. 7 M. Landesmann and R. Stehrer: Industrial Specialization, Catching-Up and Labour Market Dynamics. January 1997
No. 8 J. Fersterer and M. Landesmann: Vertical Product Differentiation in International Trade: An Econometric Investigation. April 1998
No. 9 A. Bhaduri, K. Laski and M. Riese: Effective Demand versus Profit Maximization in Aggregate Demand/Supply Analysis from a Dynamic Perspective. November 1998
No. 10 M. Landesmann and R. Stehrer: The European Unemployment Problem: A Structural Approach. March 1999
No. 11 R. Stehrer, M. Landesmann and J. Burgstaller: Convergence Patterns at the Industrial Level: the Dynamics of Comparative Advantage. October 1999
No. 12 K. Laski: Three Ways to . . . High Unemployment. January 2000
No. 13 F. Turnovec: A Leontief-type Model of Ownership Structures. Methodology and Implications. April 2000
No. 14 M. Landesmann and R. Stehrer: Potential Switchovers in Comparative Advantage: Patterns of Industrial Convergence. June 2000
No. 15 R. Stehrer: Industrial Specialization, Trade, and Labour Market Dynamics in a Multisectoral Model of Technological Progress. January 2001; revised version February 2002
No. 16 K. Laski and R. Römisch: Growth and Savings in USA and Japan. July 2001
No. 17 P. Egger and R. Stehrer: International Outsourcing and the Skill-Specific Wage Bill in Eastern Europe. July 2001
No. 18 R. Stehrer: Expenditure Levels, Prices and Consumption Patterns in a Cross-Section of Countries. August 2001
No. 19 R. Stehrer and J. Wörz: Technological Convergence and Trade Patterns. October 2001
No. 20 M. Landesmann, R. Stehrer and S. Leitner: Trade Liberalization and Labour Markets: Perspective from OECD Economies. October 2001
No. 21 E. Christie: Potential Trade in South-East Europe: A Gravity Model Approach. March 2002
No. 22 M. Landesmann and R. Stehrer: Technical Change, Effective Demand and Economic Growth. April 2002
No. 23 R. Stehrer and J. Wörz: Industrial Diversity, Trade Patterns and Productivity Convergence. November 2002; revised version July 2003
No. 24 E. Christie: Foreign Direct investment in Southeast Europe: a Gravity Model Approach. March 2003
No. 25 J. Wörz: Skill Intensity in Foreign Trade and Economic Growth. November 2003; revised version January 2004
No. 26 M. Landesmann and R. Stehrer: Global Growth Processes: Technology Diffusion, Catching-up and Effective Demand. January 2004
No. 27 M. Landesmann and R. Stehrer: Modelling International Economic Integration: Patterns of Catching-up, Foreign Direct Investment and Migration Flows. March 2004
No. 28 L. Podkaminer: Assessing the Demand for Food in Europe by the Year 2010. March 2004
No. 29 U. Dulleck, N. Foster, R. Stehrer and J. Wörz: Dimensions of Quality Upgrading in CEECs. April 2004

Uwe Dulleck and Neil Foster are assistant professors in the Department of Economics, University of Vienna. Robert Stehrer is a research economist at wiiw and lecturer in economics at Johannes Kepler University, Linz, Austria. Julia Wörz is a research economist at wiiw and lecturer in economics at the University of Vienna.
Uwe Dulleck, Neil Foster,
Robert Stehrer and Julia Wörz
Dimensions of Quality
Upgrading in CEECs

Contents
Abstract...................................................................................................................................i
1 Introduction ...................................................................................................................... 1
2 Dimensions of quality upgrading ..................................................................................... 2
2.1 Dimension 1: Industry specialization patterns......................................................... 3
2.2 Dimension 2: Specialization patterns within industries ........................................... 4
2.3 Dimension 3: Quality upgrading within quality segments of industries................... 4
2.4 Formalizing dimensions of quality upgrading.......................................................... 5
3 Data and methodology .................................................................................................... 7
3.1 Data.......................................................................................................................... 8
3.2 Methodology of calculating relative unit values....................................................... 8
4 Descriptive analysis ....................................................................................................... 10
4.1 Industry specialization patterns ............................................................................. 10
4.2 Quality specialization within industries ................................................................. 11
4.3 Quality specialization within segments.................................................................. 13
4.4 Summary................................................................................................................ 15
5 Econometric analysis..................................................................................................... 16
5.1 Quality upgrading within industries........................................................................ 16
5.2 Quality upgrading within segments ....................................................................... 19
6 Conclusions ................................................................................................................... 23
References ........................................................................................................................... 25
Appendix............................................................................................................................... 27
List of Tables and Figures
Table 1 Specialization patterns...................................................................................... 11
Table 2 Specialization in quality segments within industry groups ............................... 12
Table 3a Quality upgrading within segments, current weights........................................ 14
Table 3b Quality upgrading within segments, 1995 weights........................................... 15
Table 4 Specialization within industries......................................................................... 17
Table 5 Specialization within selected low- and high-tech industries ........................... 19
Table 6 Specialization within quality segments ............................................................. 21
Table 7 Specialization within quality segments in low- and high-tech industries.......... 22
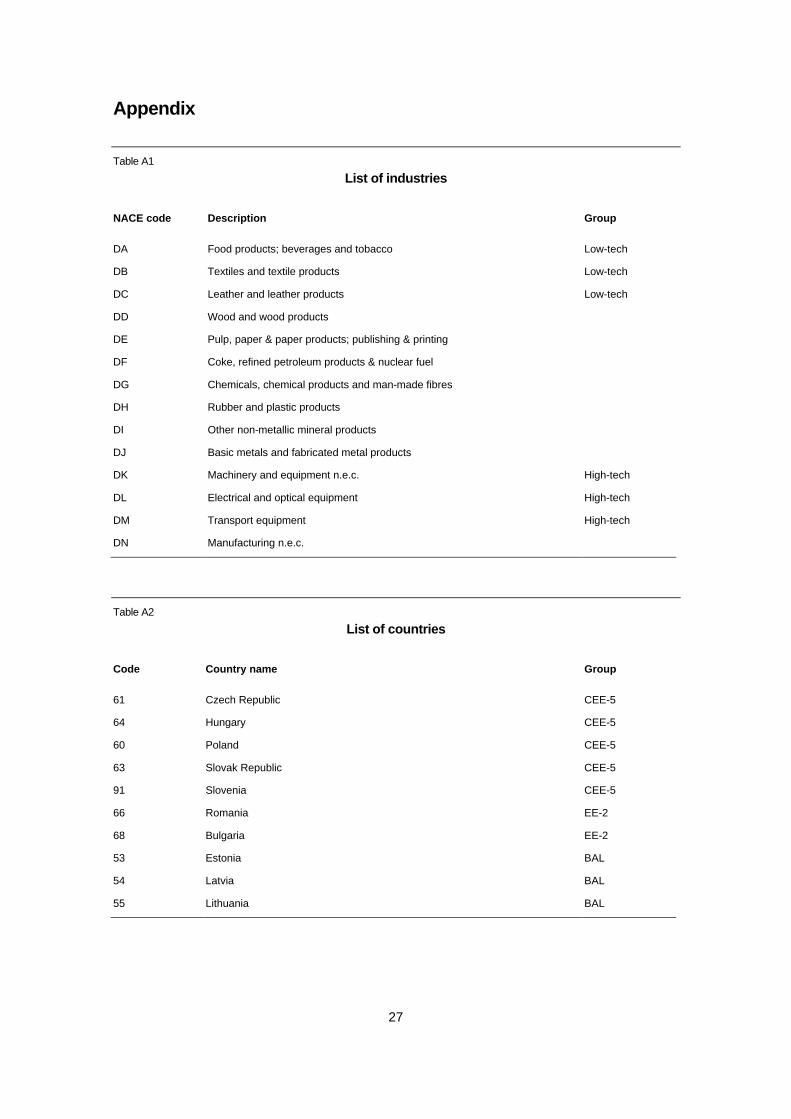
Table A1 List of industries ................................................................................................ 26
Table A2 List of countries................................................................................................. 26
Figure 1 Dimensions of quality upgrading ........................................................................ 3
i
Abstract
The impact of the Central and Eastern European economies’ trade integration with European markets on CEE trade structures has been studied extensively. These studies frequently observe a quality upgrading of CEE exports. In this paper we consider three dimensions of quality upgrading: upgrading across industries, upgrading across different quality segments within industries and, finally, product upgrading within quality segments inside industries. For the analysis we partition industries into quality segments based on EU-15 import unit values. The results for ten CEE countries (comprising the CEE-5, the Baltics and Southeastern Europe) and thirteen industries suggest fundamental differences, both across country groups and across the three different notions of quality upgrading. The CEE-5 show no evidence of entering a ‘low-quality trap’ in all three dimensions. By contrast, while there is a general catching-up process across industries and inside quality segments, the second notion of low-quality specialization may be applicable within the high-tech industries to the performance of the Baltics and Southeast Europe as a group. Keywords: trade composition, quality, CEECs, integration JEL classification: F14, F15, L60, P52

1
Uwe Dulleck, Neil Foster, Robert Stehrer and Julia Wörz∗
Dimensions of quality upgrading in CEECs
1 Introduction
At the beginning of the 1990s, the CEE countries often showed trade specialization in low-tech and low-skill industries. Recent studies have however shown that the specialization pattern of many CEECs has changed over time, in many cases rapidly, with the CEE countries shifting production towards higher-tech and higher-skill industries (see Havlik, 2001; Landesmann and Stehrer, 2002; Wörz, 2003). To date, studies have largely relied on a comparison of trade structures across industries and countries and trade flows within individual industries disregarding quality differentials inside industries (notable exceptions being Landesmann and Burgstaller, 1997, and Landesmann and Fersterer, 1998). It is conceivable that the CEE countries, although catching up in terms of shifting their exports to higher-tech industries, do not manage to catch up in terms of the quality of the goods produced. This would lead to specialization in low-quality goods within an industry, a dimension not being captured by existing studies. There are a number of reasons why a low-quality trap in this dimension may exist. Redding (1996) develops a model of endogenous growth in which workers invest in human capital or skill acquisition, while firms invest in quality-augmenting R&D. These two forms of investment exhibit pecuniary externalities and are strategic complements. The paper shows that firms can become locked in a low-skill, low-quality trap due to deficiencies in education and training. Dulleck (2002) suggests a number of reasons why countries may be trapped in the production of low-quality goods within an industry. The main argument rests on the assumption of economies of scale in the production of high-quality goods. These together with international trade policies, external economies due to quality uncertainty (e.g. labelling, imaging) or external economies due to demand effects give rise to a disadvantage for second movers, i.e. transition economies. The first-mover advantage of Western European countries results in a situation where firms from these economies serve the whole market (West and East) with high-quality goods.1 Based on an idea in Murphy et al. (1989) transition countries can become successful in high-quality industries if a critical number of sectors are entering the high-quality sectors (segments) simultaneously; i.e. a ‘Big Push’ is needed to escape the low-quality trap.
∗ We are grateful for comments by Jesús Crespo-Cuaresma (University of Vienna), Michael Landesmann (wiiw and
Johannes Kepler University, Linz) and an anonymous referee. 1 A referee suggested that a combination of economies of scale internal to the firm and imperfect financial markets would
achieve the same result.
2
Although theory suggests a number of reasons why a low-quality trap may exist, there is evidence that at least some of the transition countries do quite well in upgrading their products (i.e. increasing the overall unit value ratios of their exports; see for example Aturupane et al., 1999, and Landesmann and Stehrer, 2002). Quality is measured as the unit value of exports by industries. Increasing unit values in relation to those countries that define the quality benchmark indicate a movement towards producing higher quality. Still, this does not rule out the possibility that these countries remain specialized in the lower-quality segments of each industry. In this paper, we improve upon the existing studies by adding an additional dimension of quality, namely changes in unit values across and within quality segments of certain industries. We define quality segments of products by their unit values in EU-15 imports (i.e. import prices per kilogram) and construct three different segments for each of thirteen industries representing low-, medium- and high-quality goods within a particular industry. The segments are constructed using the unit values of the European Union’s imports as a benchmark measure of the quality of different goods. By doing so, we can observe whether the export composition of transition countries moves towards exporting goods from higher segments as well as whether within segments there has been a movement towards producing higher-quality products. In addition, we can examine whether the price/quality gaps within high-quality segments close faster than the gaps in low- or medium-quality segments. The emphasis of this study lies on segments within industries and dynamics within quality segments. In particular, we move away from the emphasis that is prevalent in the literature looking at movements across industries and examine whether a low-quality trap exists within industries and within industry segments, i.e. we investigate whether CEE countries run the risk of specializing in the production and export of goods that are of a lower quality than those imported by EU-15 countries on average. The paper is organized as follows. In Section 2 we discuss our hypotheses and introduce the dimensions of ‘quality’ used in the empirical part of the paper. Section 3 introduces the methodological issues and describes the data sources. In Section 4 we present a descriptive overview of the ongoing dynamics of trade patterns with respect to the hypotheses given in Section 2. Section 5 then describes the results from our econometric investigation of the second and third dimensions of quality upgrading. Section 6 concludes. 2 Dimensions of quality upgrading
As discussed in the introduction, the notion of ‘quality upgrading’ or ‘low-quality traps’ may be misleading due to different concepts, different levels of aggregation and measurement issues. In this section we discuss the notions of ‘quality’ we employ in our analysis. Figure 1 illustrates the three dimensions of quality upgrading we consider. Dimension 1 describes upgrading between industries, dimension 2 describes upgrading of products
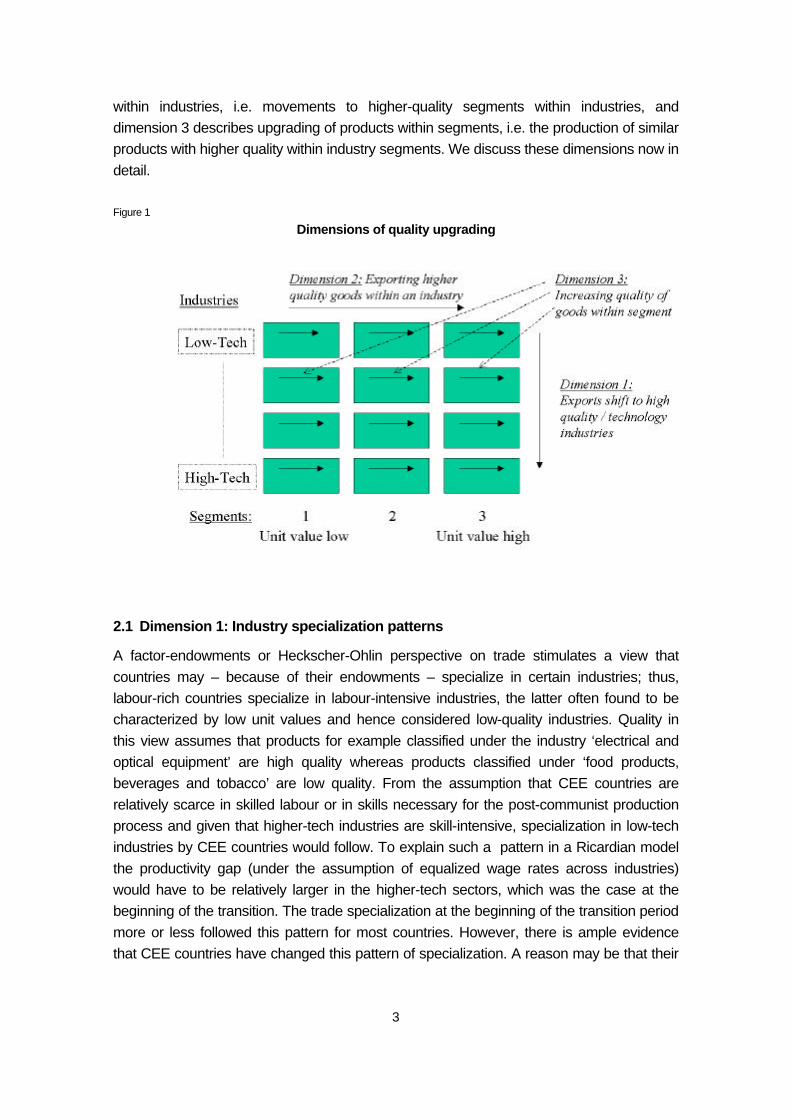
3
within industries, i.e. movements to higher-quality segments within industries, and dimension 3 describes upgrading of products within segments, i.e. the production of similar products with higher quality within industry segments. We discuss these dimensions now in detail. Figure 1
Dimensions of quality upgrading
2.1 Dimension 1: Industry specialization patterns
A factor-endowments or Heckscher-Ohlin perspective on trade stimulates a view that countries may – because of their endowments – specialize in certain industries; thus, labour-rich countries specialize in labour-intensive industries, the latter often found to be characterized by low unit values and hence considered low-quality industries. Quality in this view assumes that products for example classified under the industry ‘electrical and optical equipment’ are high quality whereas products classified under ‘food products, beverages and tobacco’ are low quality. From the assumption that CEE countries are relatively scarce in skilled labour or in skills necessary for the post-communist production process and given that higher-tech industries are skill-intensive, specialization in low-tech industries by CEE countries would follow. To explain such a pattern in a Ricardian model the productivity gap (under the assumption of equalized wage rates across industries) would have to be relatively larger in the higher-tech sectors, which was the case at the beginning of the transition. The trade specialization at the beginning of the transition period more or less followed this pattern for most countries. However, there is ample evidence that CEE countries have changed this pattern of specialization. A reason may be that their
4
skill endowments have become similar to those of Western European countries. Most of the CEE countries had high levels of technical education in the past, allowing them to quickly adapt their skills to post-communist production processes. Also, productivity gaps have been closed much faster in more technology-intensive industries (see Landesmann and Stehrer, 2002, for a discussion of recent developments). 2.2. Dimension 2: Specialization patterns within industries
The description above cannot capture specialization within industries. For a judgement of the quality of a country’s exports within a particular industry, it is important to know the specific type of the majority of products exported in this industry. For example, knowing that Romania exports ‘electronic and optical equipment’ tells us little about the quality of the goods exported; there is a large difference in ‘quality’ for example between simple radio alarms and advanced scientific equipment, both of which are included in the electronic and optical equipment industry. Similarly, within the food products, beverages and tobacco industry there are likely to be large differences in quality between champagne and processed foodstuffs such as processing and preserving of fish. A low-quality trap in exports would be reflected by specialization in the low-quality segment of industries, i.e. the production of radio alarms in electronic and optical equipment and of processed food in food products, beverages and tobacco. Instead of comparing the export composition across industries, we compare the export composition across quality segments of industries. We divide each industry into three quality segments by ranking the products within each industry according to the unit value of EU-15 imports (see Section 3 below for details). The hypothesis that a country’s industry is trapped in low-quality exports would hold then if the industry is specialized in the segment with the lowest quality. This means that even if a country may be able to specialize in the production and export of products in high-tech sectors, but within these sectors only in the lower-quality segments, the hypothesis of a low-quality trap in this dimension holds. Under the assumption that equal products get the same price in EU markets, this implies that our notion of a low-quality trap is equivalent to a relatively higher share of exports in the low-quality segment of an industry. 2.3 Dimension 3: Quality upgrading within quality segments of industries
The previous two notions of a low-quality trap consider what happens to specialization across industries and what happens to specialization within industries. One notion of low quality not yet considered is what happens to quality within segments. Regardless of which segment and which industry a country is specializing in, has there been a movement towards producing higher- or lower-quality goods within that segment? In this sense quality
5
upgrading can either be defined as a movement towards producing ‘higher-quality’ products within quality segments or simply keeping the set of products produced but increasing their average quality. To refer to examples again, Romania may continue either to produce simple radio alarms but increase the average quality of these products or start producing other products within this segment (e.g. simple stereo systems) with higher than average quality. Our final notion of a low-quality trap therefore examines whether within segments countries have shifted their production to producing higher-quality goods, where quality is measured by unit value ratios. This dimension can identify a quality trap within industry segments. 2.4 Formalizing dimensions of quality upgrading
To better understand the definitions of quality upgrading employed in this paper, consider the following highly simplified and descriptive model. Assume that a small open economy houses two industries i = H, L (for high- and low-tech, respectively). Within each industry firms can specialize in production (e.g. due to economies of scale or capacity constraints) in either a low-quality or a high-quality segment j = 1, 2. Within these quality segments, a firm can further choose the exact quality level qij of its good.2 The world market determines the price as well as the demand for goods of a given quality (e.g. by import quota restrictions or customer groups reached by marketing instruments). Specifically we assume that the revenue of a firm is an increasing and concave function in qij. Thus the choice of the industry, the quality segment and the quality determine prices and quantities, denoted as pij(qij) and xij(qij). For simplicity, we assume that marginal costs wi differ only across industries but are the same across quality segments. Production in the high-quality segment induces higher fixed costs than in the low-quality segments, i.e. Fi1 < Fi2, as this necessitates extra investment in research and development, marketing, etc. The choice of qij induces fixed costs given by an increasing and convex function fij(qij). The overall costs for each option are hence C(xij,qij) = Fj + fij(qij) + wixij. The profit function will determine a unique choice of industry and quality segment as well as the exact quality to produce given parameter values. In this situation firms face simple decision problems: firms in a particular industry first maximize their profit (setting marginal product equal to marginal revenue, f'(qij) = (x(qij)p(qij))’ ) within each quality segment j = 1, 2 choosing qij and then comparing the maximum profits they can make in both quality segments and in both industries. Whichever profit is larger determines the industry and segment to produce in as well as the exact quality to produce.
2 To give examples, unprocessed sweet corn is a low-tech (i = L), low-quality (j = 1) good, champagne is low-tech but
high-quality (j = 2). Similarly, scientific electronic equipment is high-tech (i = H), high-quality (j = 2), whereas radio alarms are high-tech, low-quality (j = 1). Each of these goods can be produced at different qualities within the quality segment.
6
Consider the case where in each period one firm enters.3 The firm has to decide which quality to produce and cannot change this decision later. We assume that prices are always above marginal costs such that firms keep producing. Given that we want to discuss quality dynamics: assume a firm enters in the high-tech industry, in the high-quality segment and chooses a qH2 above the segment average. In this case, we claim to observe quality upgrading in all three dimensions. The output of high-technology industries increases relative to that of low-tech industries. Within the high-tech industry, the high-quality segment’s output increases compared to that of the low-quality segment. And finally, given that qH2 is chosen above the segment average, the average quality produced in the segment increases too. Similarly, assume that a firm enters the high-tech, low-quality segment and produces a quality qH1 above the average quality. This would constitute quality upgrading according to the first and third dimension but a low-quality trap in the second dimension. Over time the parameters of the model may change. Steeper functions fij(qij) lower the average quality of goods produced within a segment. A change of the exogenous prices and quantities can affect the segment and industry choice. An increase in the demand for goods xij raises profits in segment j of industry i and thus increases the incentive for the entering firms to produce this product. For example, rising home market demand or trade integration increases xij. If this occurs only for Segment 1, a low-quality trap can emerge. Interpreting wi as labour costs in industry i implies that firms make larger profits in industries with lower wi. For example, if skilled labour becomes relatively cheaper, new firms enter in the skill-intensive higher-tech sectors (quality upgrading of the first dimension). Economic policies may affect the cost parameters. A better educated labour force may bring down the fixed costs for research and development (reducing FHj) or reduce the slope of fij(qij). Thus, entering firms will produce higher quality compared to existing ones. These simple considerations allow us to define the dimensions of quality upgrading mentioned above more precisely. A formal representation of our three dimensions of quality upgrading which are used below in the descriptive as well as the econometric part is then given by the following (for simplicity we omit the country index here): Dimension 1: For this dimension we look, firstly, at the export structure of a particular country Shi = vi/v where vi denotes exports (either in values or in tons) of industry i and v denotes total exports, and, secondly, the market shares in EU markets defined by MShi = vi/mi
EU where miEU denotes total EU imports in industry i. Particularly interesting are
the changes over time. A low-quality trap in this dimension is defined as: ∆(ShH/ShL ) < 0.
3 The restriction to one firm only may result from credit constraints given less developed markets in transition economies
as a referee suggested.
7
Dimension 2: Here we look at shifts of the production structure within industries. Again we use export shares as for Dimension 1, however for individual segments j inside industries i: firstly, the export structure within industries is given by Shij = vij/vi and, secondly, we calculate market shares in EU markets for a particular quality segment, i.e. MShij = vij/mij
EU. Particularly we are interested in changes over time. A low quality trap is present if: ∆(Shi2/Shi1)<0. Dimension 3: For this dimension we look at the ‘price’ of the exported goods in a particular segment j of industry i. As Aiginger (1997) points out, unit values contain information about the quality and competitiveness of industry output. For this dimension we thus calculate unit values and unit value ratios of exports within segments (see Section 3 below for a detailed description of the methodology). Quality upgrading is then interpreted as unit value ratios rising over time and, analogously, a low-quality trap emerges if these are falling over time, i.e: ∆UVRij < 0. Of course, these three dimensions are related to each other: For example, the relative performance in quality upgrading of the third dimension has implications for the first and second dimensions as it also changes the respective shares of segments within industries and the export structure.4 In the empirical part, we will come back to this by considering what happens in terms of quality upgrading across the different segments. These three dimensions of quality upgrading are the subject of the remainder of this paper. In Section 4 of the paper we provide some descriptive statistics using these concepts. In the econometric analysis (Section 5), we only refer to the second and third definition, since for the first definition (trade patterns by industry) there already exists a literature (for recent studies see Havlik, 2001; Landesmann and Stehrer, 2002; and Landesmann, 2003). 3 Data and methodology
In the empirical section below we use the specialization patterns of CEECs trade flows into the EU market to assess the above stated hypotheses and their specific individual relevance for CEECs. For this we use trade data at a very detailed level from which we calculate the relevant measures for the respective industries and segments within these industries. In this section we provide an overview of the classifications and calculations of the relevant data.
4 This has, at first sight, counterintuitive implications as a referee pointed out. Consider an industry in two countries A and
B; country A’s unit values increase by 8% in the high-quality segment and by 10% in the low-quality segment, country B’s by 0% and 1% respectively. Comparing these two countries in the second dimension, yields a weaker performance of country A because the dynamics point towards relative more exports from low-quality segments than from high-quality segments, whereas this is not the case for country B. Considering the third dimension shows that country A dominates country B in the low- and the high-quality segment.
8
3.1 Data
As is common in the empirical literature5, in order to measure the quality of production (exports) for CEE countries we employ unit values, constructing unit value ratios for the CEE countries as the unit value of imports into the EU (for a particular commodity, segment or industry) divided by the unit value of total imports (of this commodity, segment or industry) into the EU. Aiginger (1997) suggests that for many industries, unit values are a good indicator of quality. He argues that unit values, which are measured as output per unit of input (material measured in kilograms), are related to quality since the numerator includes all of the quality elements such as premiums for higher sophistication, for speciality production and for related services. The more characteristics a good accumulates the higher will be its unit value. Aiginger also points out potential problems of this measure, one being that unit values will also increase with market power. He argues that – although this may seem troubling since market power is not normally associated with improved quality – in Schumpeterian models, in models of quality ladders and in the new trade theory, market power is indeed related to innovation, early starting advantages and successful vertical integration. A further problem with unit values as a measure of quality is that it is difficult to disentangle quality improvements from price inflation. In the empirical part of the paper we deal with this problem by replacing export shares in value terms by the shares in terms of tons. The empirical evidence suggests that changes in quantities are more important than changes in prices. The database used is the Comext trade database, which provides trade data at the 8-digit CN level for EU-15 imports and exports. The period analysed is from 1995 to 2000. Beginning with 1995 has the advantage that the Central and Eastern European countries had already started trade integration with the EU and had already been through the transformational recession. Further, from 1995 onwards data for EU-15 are available, thus including important trading partners for the CEE countries (in particular Austria). The database comprises about 10,000 products in each year. One of the problems is that the number of products and the products covered change from year to year. To cope with this problem we include only products that are consistently in the database over the whole period. This reduced the number of products to about 8000 per year. 3.2 Methodology of calculating relative unit values
In calculating the relative unit values of traded products we use the Comext trade database at the most detailed 8-digit level. Denoting the value of exports to the EU-15 of commodity k by country c in year t by vkt
c and the quantity (measured in tons) by xktc,
the export unit value is defined as
5 Havlik (2001), and Landesmann and Stehrer (2002) both use unit values in their studies.
9
UVktc = vkt
c/ xkt.c (1)
The unit values of country c’s exports to the EU-15 are then compared to the unit values of total EU-15 imports (from the world, including intra-EU trade) by calculating the logs of the unit value ratios UVRkt
c = ln (UVktc / UVkt
EU) (2) where UVkt
EU denotes the unit value of total EU-15 imports for a particular commodity k in year t. Taking the logarithm of (UVkt
c / UVktEU) ensures a symmetric aggregation across
products for ratios larger and smaller than 1. In logs, the ratio is thus greater (smaller) than zero if the export unit value of country c is greater (smaller) than the unit value of total EU-15 imports. We will not present information at the very detailed (8-digit) product level but aggregate the unit value ratios to the level of industries and segments within industries. The CN 8-digit level can be classified according to the NACE rev. 1, 2-digit (DA-DN) classification, which comprises fourteen industries. We used thirteen of these in the analysis, excluding the oil industry, which is very unequally represented in the individual CEE countries. Within each of the thirteen industries we distinguish between three quality segments. These segments are calculated in the following way: first, we calculate the unit values using the averages of EU-15 imports for the years 1995 to 2000 and rank them within each industry. Then we calculate the cumulative sum of the value of EU-15 imports (ranked by the unit values) within industries. Finally, we classify the products of the lower third of the cumulative import value as Segment 1 (low-quality segment), the middle third as Segment 2 (medium-quality segment) and the upper third as Segment 3 (high-quality segment). Further, we construct a weighted sum of the unit value ratios across the products belonging to a particular industry i and quality segment j. We denote the set of products in a particular industry and quality segment by Iij. The weight used for a particular commodity k in Iij is the share of its export value in the industry’s and segment’s exports of country c. The weights are calculated as wkt
c = vktc / ∑ k ∈ Iij vkt.
c (3) The unit value ratio for a particular segment j in industry i is then UVRijt
c = ∑ k ∈ Iij UVRktc wkt.
c (4)
10
This measure can be interpreted analogously to the unit value ratios for a particular commodity as mentioned above. Similarly, we use in the descriptive part the unit value of exports defined by UVijt
c = ∑ k ∈ Iij UVktc wkt.
c (5) 4 Descriptive analysis
In order to present a descriptive overview of the performance of CEE countries we present the selected variables for individual country groups in selected low- and high-tech industries. Specifically, we present the data aggregated for a subset of typically low-tech industries: food products, beverages and tobacco (DA); textiles and textile products (DB); and leather and leather products (DC), as well as a subset of typically high-tech industries: machinery and equipment (DK); electrical and optical equipment (DL); and transport equipment (DM). Data are presented for three country groups: CEE-5 (the Czech Republic, Hungary, Poland, Slovakia and Slovenia); EE-2 (Bulgaria and Romania); and BAL (Estonia, Latvia and Lithuania). We compare these country groups for two years, 1995 and 2000. 4.1 Industry specialization patterns
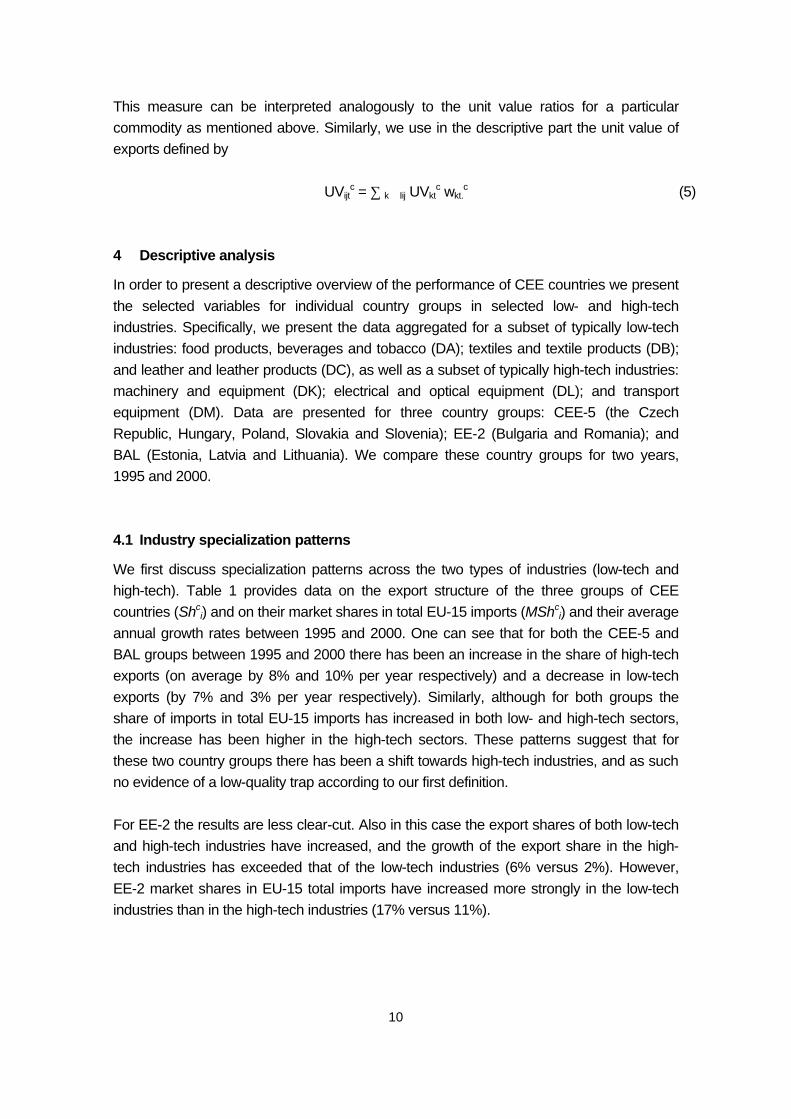
We first discuss specialization patterns across the two types of industries (low-tech and high-tech). Table 1 provides data on the export structure of the three groups of CEE countries (Shc
i) and on their market shares in total EU-15 imports (MShci) and their average
annual growth rates between 1995 and 2000. One can see that for both the CEE-5 and BAL groups between 1995 and 2000 there has been an increase in the share of high-tech exports (on average by 8% and 10% per year respectively) and a decrease in low-tech exports (by 7% and 3% per year respectively). Similarly, although for both groups the share of imports in total EU-15 imports has increased in both low- and high-tech sectors, the increase has been higher in the high-tech sectors. These patterns suggest that for these two country groups there has been a shift towards high-tech industries, and as such no evidence of a low-quality trap according to our first definition. For EE-2 the results are less clear-cut. Also in this case the export shares of both low-tech and high-tech industries have increased, and the growth of the export share in the high-tech industries has exceeded that of the low-tech industries (6% versus 2%). However, EE-2 market shares in EU-15 total imports have increased more strongly in the low-tech industries than in the high-tech industries (17% versus 11%).
11
Table 1
Specialization patterns
Export structures of CEECs
CEE-5 EE-2 BAL
1995 2000 Growth 1995 2000 Growth 1995 2000 Growth
Low-tech 24.59 15.98 -0.07 43.11 47.83 0.02 43.51 37.08 -0.03
High-tech 27.13 37.32 0.08 8.18 10.61 0.06 4.92 10.14 0.10
Shares in EU-15 imports
CEE-5 EE-2 BAL
1995 2000 Growth 1995 2000 Growth 1995 2000 Growth
Low-tech 3.27 3.45 0.01 0.81 1.49 0.17 0.28 0.50 0.09
High-tech 1.96 3.12 0.12 0.08 0.13 0.11 0.02 0.05 0.13
Total 2.73 3.66 0.07 0.39 0.53 0.07 0.13 0.23 0.08
Note: Annual growth rates are approximated by dividing the total period growth by number of years.
In general, we find no evidence of a low-quality trap across county groups according to our first definition. The ratio of high- to low-tech exports has grown in all three country groups over the observation period (i.e. ∆(ShH/ShL) > 0), thus structural change has resulted in a relatively greater importance of high-tech industries as opposed to low-tech industries in total exports to the EU of these countries. 4.2 Quality specialization within industries
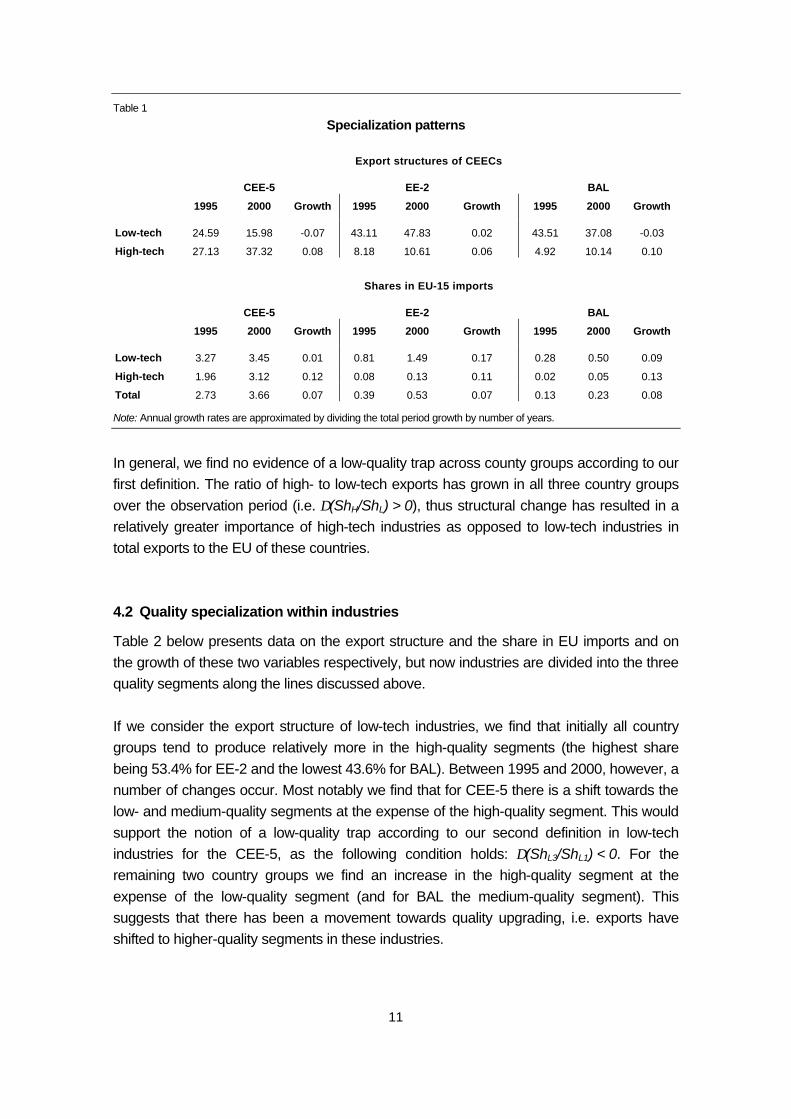
Table 2 below presents data on the export structure and the share in EU imports and on the growth of these two variables respectively, but now industries are divided into the three quality segments along the lines discussed above. If we consider the export structure of low-tech industries, we find that initially all country groups tend to produce relatively more in the high-quality segments (the highest share being 53.4% for EE-2 and the lowest 43.6% for BAL). Between 1995 and 2000, however, a number of changes occur. Most notably we find that for CEE-5 there is a shift towards the low- and medium-quality segments at the expense of the high-quality segment. This would support the notion of a low-quality trap according to our second definition in low-tech industries for the CEE-5, as the following condition holds: ∆(ShL3/ShL1) < 0. For the remaining two country groups we find an increase in the high-quality segment at the expense of the low-quality segment (and for BAL the medium-quality segment). This suggests that there has been a movement towards quality upgrading, i.e. exports have shifted to higher-quality segments in these industries.
12
Table 2
Specialization in quality segments within industry groups
Export structure
CEE-5 EE-2 BAL
1995 2000 Growth 1995 2000 Growth 1995 2000 Growth
Low-tech 100.00 100.00 100.00 100.00 100.00 100.00
1 28.63 33.28 0.03 15.32 11.61 -0.05 26.84 25.35 -0.01
2 26.85 27.40 0.00 31.33 29.91 -0.01 29.53 30.07 0.00
3 44.52 39.32 -0.02 53.35 58.48 0.02 43.63 44.59 0.00
High-tech 100.00 100.00 100.00 100.00 100.00 100.00
1 70.51 67.59 -0.01 62.39 67.32 0.02 71.23 75.09 0.01
2 18.97 20.66 0.02 26.30 23.92 -0.02 20.36 16.90 -0.03
3 10.51 11.75 0.02 11.32 8.76 -0.05 8.41 8.01 -0.01
Shares in EU-15 imports
CEE-5 EE-2 BAL
1995 2000 Growth 1995 2000 Growth 1995 2000 Growth
Low-tech 3.27 3.45 0.01 0.81 1.49 0.17 0.28 0.50 0.16
1 2.74 3.57 0.06 0.36 0.54 0.10 0.82 1.54 0.18
2 2.78 2.87 0.01 0.81 1.35 0.14 0.24 0.38 0.12
3 4.25 3.89 -0.02 1.27 2.50 0.19 0.24 0.43 0.16
High-tech 1.96 3.12 0.12 0.08 0.13 0.11 0.02 0.05 0.41
1 3.96 6.57 0.13 0.15 0.27 0.16 0.05 0.16 0.47
2 1.44 2.63 0.17 0.09 0.13 0.09 0.05 0.16 0.48
3 0.52 0.84 0.12 0.02 0.03 0.01 0.01 0.02 0.26
Notes: Annual growth rates are approximated by dividing the total period growth by number of years.
Turning now to the high-tech industries, we find a different pattern. For all country groups the share of exports in the high-quality segment was initially rather small, ranging from 8.4% in BAL to 10.5% in CEE-5. Between 1995 and 2000 we see a shift in the export structure towards the low-quality segments for EE-2 and BAL, with the shares of the low-quality segments increasing at the expense of the medium- and high-quality segments. This is also reflected when calculating the ratios of exports in Segment 3 versus Segment 1 for each industry group. There is again evidence for the existence of a low-quality trap for these two groups of countries according to our second definition (i.e. ∆(ShH3/ShH1) < 0). For the CEE-5 we find the opposite, namely an increase in the share of high-quality and medium-quality segments at the expense of the low-quality segment. For this group therefore we can say that there is evidence of quality upgrading in the high-tech industries, with exports shifting to higher-quality segments. In summary, depending on the industry and country group, evidence for a low-quality trap is sometimes found in this dimension.
13
We also look at changes in the representation of CEE countries’ exports on EU markets. Apart from a general increase in their import shares in the EU-15, the above conclusions are broadly supported when we consider the share of CEE exports to the EU in total EU imports (see lower part of Table 2). 4.3 Quality specialization within segments
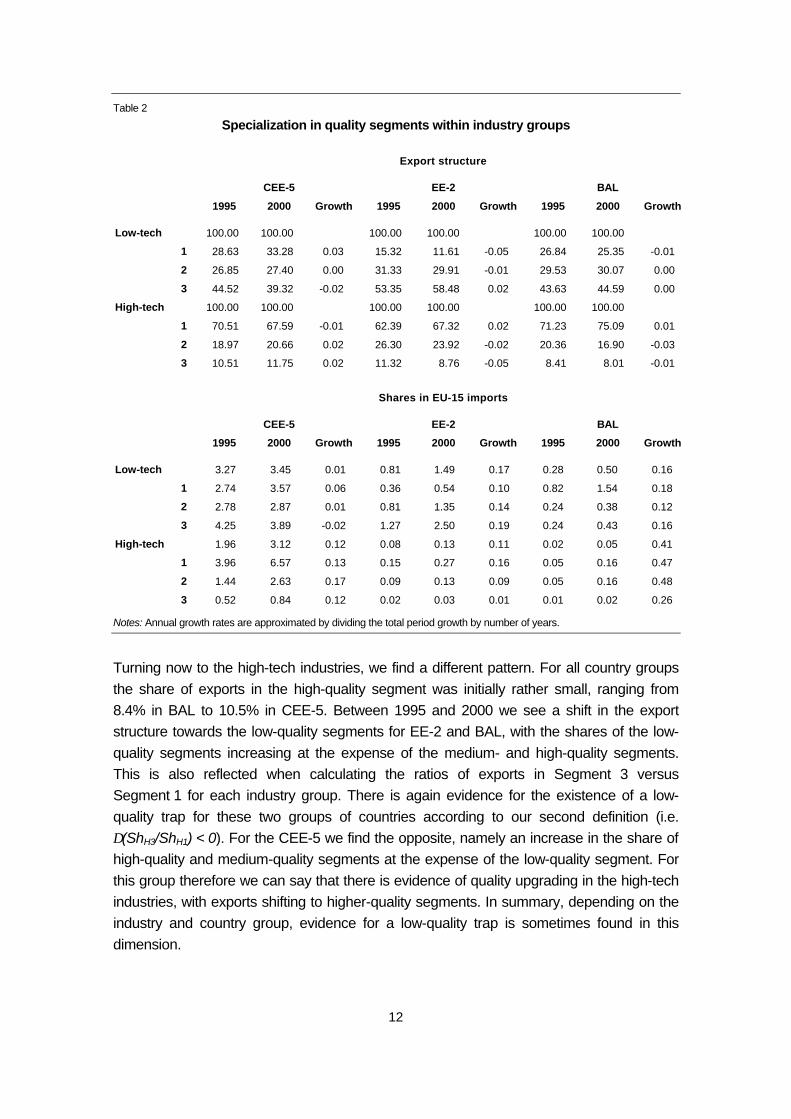
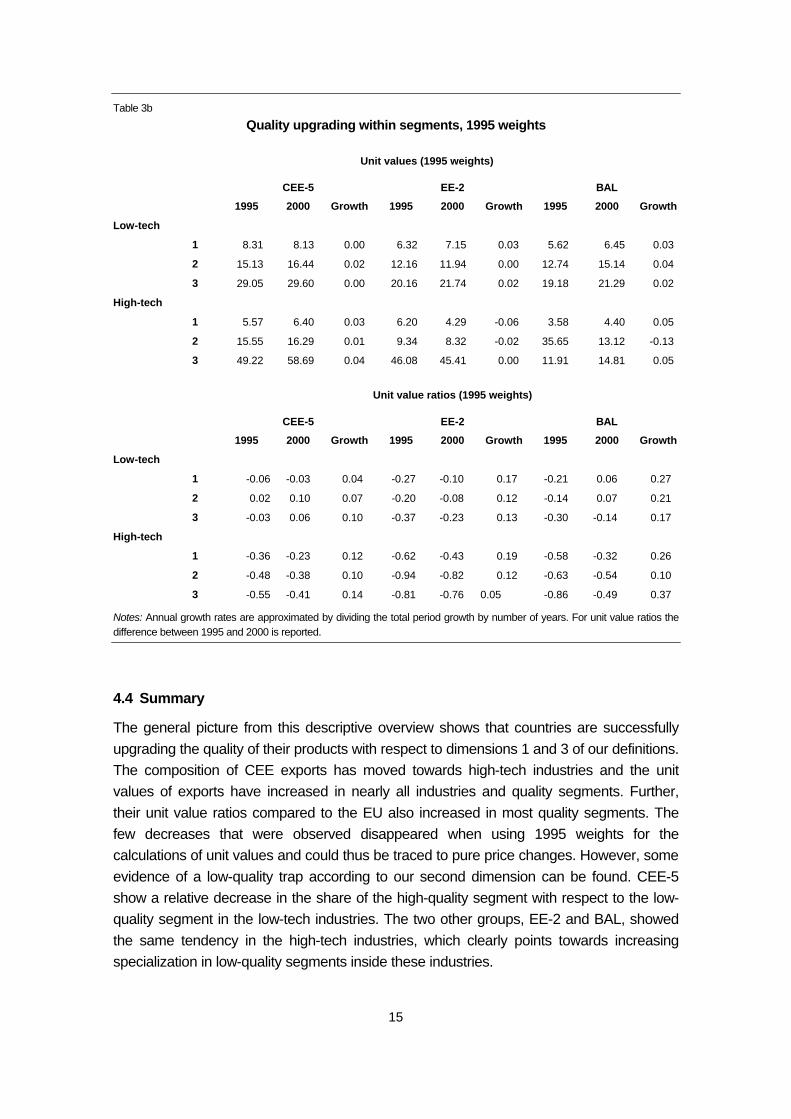
For our final dimension we look at the movements of unit values and unit value ratios inside segments. Rising unit values can be observed if either the prices of each exported good rise or the composition shifts towards the goods with higher than average quality (and thus higher prices). Looking at Tables 3a and 3b, one can see that the values are more constant when using fixed 1995 weights.6 This suggests that price increases have played a minor role while shifts towards exporting higher quality within the segments have been of greater significance. Let us briefly discuss the results from Table 3a, based on current weights: In terms of unit values we find across most country and industry groups an increase between 1995 and 2000 (the exceptions being the low- and high-quality segments of the low-tech industries for CEE-5, as well as the low- and medium-quality segments respectively of the high-tech industries for EE-2 and BAL respectively). For CEE-5 and BAL this increase has been stronger in high-tech industries, suggesting that quality improvements have been stronger in the latter industries. For EE-2 we find the opposite result with quality improvements being stronger in the low-tech industries. However, the developments vary for individual quality segments inside industry groups. In general, improvements have been strongest in the lower-quality segments inside the low-tech industries. CEE-5 and BAL have further increased their export unit values noticeably in the low- and high-quality segment of the high-tech industries, while EE-2 show the strongest improvements in the medium-quality segment of this industry group. For an interpretation of the quality upgrading process it is better to look at unit value ratios as for this measure overall price changes of a particular product are less influential. We find a similar pattern when we consider unit value ratios, with improvements in the quality of CEE exports for all country groups and both low- and high-tech industries. Once again improvements are found to be strongest in the high-tech industries, even in the case of EE-2, which has seen the strongest improvement in the unit value ratio for high-tech
6 Applying fixed 1995 weights implies using the quantities of the base year and so removes the compositional effect.
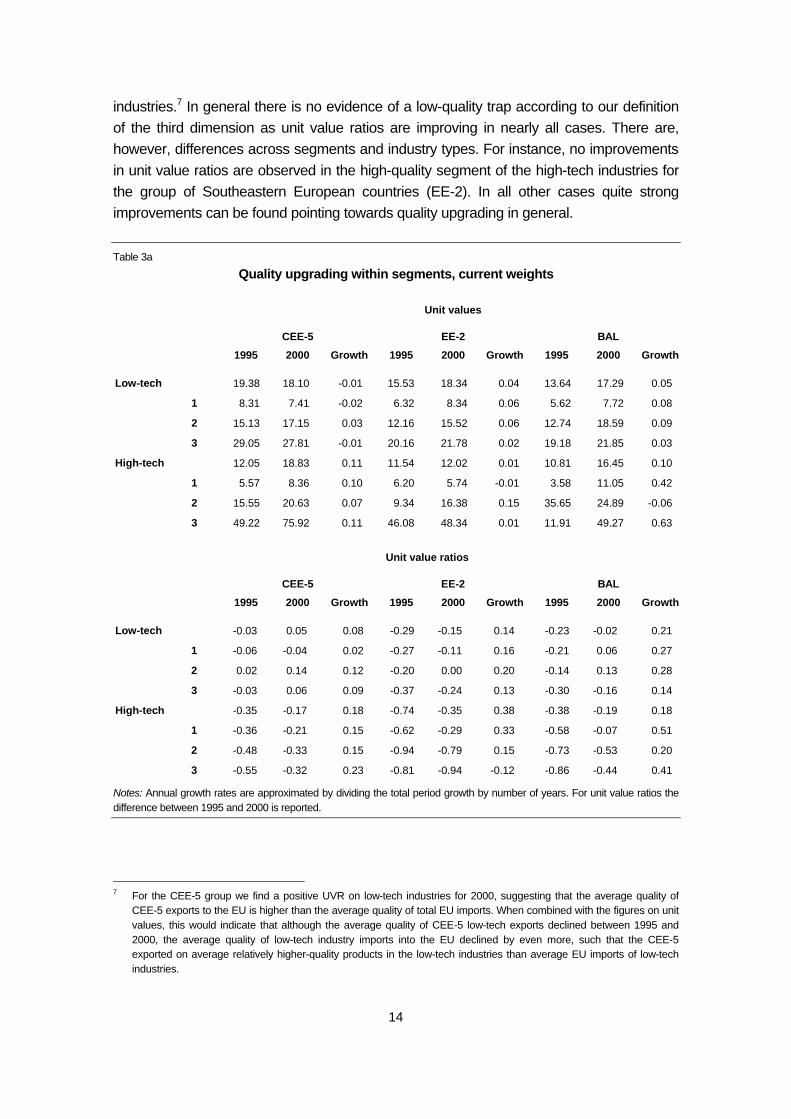
14
industries.7 In general there is no evidence of a low-quality trap according to our definition of the third dimension as unit value ratios are improving in nearly all cases. There are, however, differences across segments and industry types. For instance, no improvements in unit value ratios are observed in the high-quality segment of the high-tech industries for the group of Southeastern European countries (EE-2). In all other cases quite strong improvements can be found pointing towards quality upgrading in general. Table 3a
Quality upgrading within segments, current weights
Unit values
CEE-5 EE-2 BAL
1995 2000 Growth 1995 2000 Growth 1995 2000 Growth
Low-tech 19.38 18.10 -0.01 15.53 18.34 0.04 13.64 17.29 0.05
1 8.31 7.41 -0.02 6.32 8.34 0.06 5.62 7.72 0.08
2 15.13 17.15 0.03 12.16 15.52 0.06 12.74 18.59 0.09
3 29.05 27.81 -0.01 20.16 21.78 0.02 19.18 21.85 0.03
High-tech 12.05 18.83 0.11 11.54 12.02 0.01 10.81 16.45 0.10
1 5.57 8.36 0.10 6.20 5.74 -0.01 3.58 11.05 0.42
2 15.55 20.63 0.07 9.34 16.38 0.15 35.65 24.89 -0.06
3 49.22 75.92 0.11 46.08 48.34 0.01 11.91 49.27 0.63
Unit value ratios
CEE-5 EE-2 BAL
1995 2000 Growth 1995 2000 Growth 1995 2000 Growth
Low-tech -0.03 0.05 0.08 -0.29 -0.15 0.14 -0.23 -0.02 0.21
1 -0.06 -0.04 0.02 -0.27 -0.11 0.16 -0.21 0.06 0.27
2 0.02 0.14 0.12 -0.20 0.00 0.20 -0.14 0.13 0.28
3 -0.03 0.06 0.09 -0.37 -0.24 0.13 -0.30 -0.16 0.14
High-tech -0.35 -0.17 0.18 -0.74 -0.35 0.38 -0.38 -0.19 0.18
1 -0.36 -0.21 0.15 -0.62 -0.29 0.33 -0.58 -0.07 0.51
2 -0.48 -0.33 0.15 -0.94 -0.79 0.15 -0.73 -0.53 0.20
3 -0.55 -0.32 0.23 -0.81 -0.94 -0.12 -0.86 -0.44 0.41
Notes: Annual growth rates are approximated by dividing the total period growth by number of years. For unit value ratios the difference between 1995 and 2000 is reported.
7 For the CEE-5 group we find a positive UVR on low-tech industries for 2000, suggesting that the average quality of
CEE-5 exports to the EU is higher than the average quality of total EU imports. When combined with the figures on unit values, this would indicate that although the average quality of CEE-5 low-tech exports declined between 1995 and 2000, the average quality of low-tech industry imports into the EU declined by even more, such that the CEE-5 exported on average relatively higher-quality products in the low-tech industries than average EU imports of low-tech industries.
15
Table 3b
Quality upgrading within segments, 1995 weights
Unit values (1995 weights)
CEE-5 EE-2 BAL
1995 2000 Growth 1995 2000 Growth 1995 2000 Growth
Low-tech
1 8.31 8.13 0.00 6.32 7.15 0.03 5.62 6.45 0.03
2 15.13 16.44 0.02 12.16 11.94 0.00 12.74 15.14 0.04
3 29.05 29.60 0.00 20.16 21.74 0.02 19.18 21.29 0.02
High-tech
1 5.57 6.40 0.03 6.20 4.29 -0.06 3.58 4.40 0.05
2 15.55 16.29 0.01 9.34 8.32 -0.02 35.65 13.12 -0.13
3 49.22 58.69 0.04 46.08 45.41 0.00 11.91 14.81 0.05
Unit value ratios (1995 weights)
CEE-5 EE-2 BAL
1995 2000 Growth 1995 2000 Growth 1995 2000 Growth
Low-tech
1 -0.06 -0.03 0.04 -0.27 -0.10 0.17 -0.21 0.06 0.27
2 0.02 0.10 0.07 -0.20 -0.08 0.12 -0.14 0.07 0.21
3 -0.03 0.06 0.10 -0.37 -0.23 0.13 -0.30 -0.14 0.17
High-tech
1 -0.36 -0.23 0.12 -0.62 -0.43 0.19 -0.58 -0.32 0.26
2 -0.48 -0.38 0.10 -0.94 -0.82 0.12 -0.63 -0.54 0.10
3 -0.55 -0.41 0.14 -0.81 -0.76 0.05 -0.86 -0.49 0.37
Notes: Annual growth rates are approximated by dividing the total period growth by number of years. For unit value ratios the difference between 1995 and 2000 is reported.
4.4 Summary
The general picture from this descriptive overview shows that countries are successfully upgrading the quality of their products with respect to dimensions 1 and 3 of our definitions. The composition of CEE exports has moved towards high-tech industries and the unit values of exports have increased in nearly all industries and quality segments. Further, their unit value ratios compared to the EU also increased in most quality segments. The few decreases that were observed disappeared when using 1995 weights for the calculations of unit values and could thus be traced to pure price changes. However, some evidence of a low-quality trap according to our second dimension can be found. CEE-5 show a relative decrease in the share of the high-quality segment with respect to the low-quality segment in the low-tech industries. The two other groups, EE-2 and BAL, showed the same tendency in the high-tech industries, which clearly points towards increasing specialization in low-quality segments inside these industries.
16
5 Econometric analysis
5.1 Quality upgrading within industries
The above descriptive analysis suggests that for different country groups there may be evidence of a low-quality trap according to our second definition. In this section of the paper we concentrate on our second and third definitions of a low-quality trap, addressing econometrically whether significant evidence of a low-quality trap exists. The first question we address is whether CEE exports to the EU-15 have shifted in composition towards higher-quality segments within an industry. To test this hypothesis we specify the following estimating equation: c
ijiicij
cij
cij DIndDSegDSegUVRShSh εδγγββα ++++∆++=∆ 322121995,1 (6)
where c
ijSh∆ is the change in each quality segment’s j export share (in total exports of an
industry) between 1995 and 2000, cijSh 1995, is the initial segment share and c
ijUVR∆ is the
change in unit value ratio of segment j between 1995 and 2000. DSeg2 and DSeg3 are segment dummies for the medium- and high-quality segments respectively and DIndi are industry-specific dummy variables. The initial segment share is included as a catch-up term; a negative coefficient implying that segments with initially relatively low shares are increasing their shares and vice versa. A positive and significant coefficient on the export share of DSeg3 (the high-quality segment dummy) for example, would indicate that the share of exports of this segment has increased by significantly more than the share of Segment 1 (i.e. the low-quality segment). We also include the change in the unit value ratio in the regression in order to test whether improvements in quality within segments during the period have been important in explaining the export performance of the different segments. The model is estimated using a fixed effects model for each country group. Rather than having a time-series and a cross-country element to the data however, we have an industry and a country dimension. Since we have already grouped all ten CEECs into three relatively homogenous groups we do not expect any significant country-specific fixed effects. Therefore we define individual specific effects across industries rather than across countries. The reported results are based on a LSDV model that contains industry fixed effects using a heteroscedasticity robust estimator. The results are presented in the first three columns of Table 4.
17
Table 4
Specialization within industries
Values Tons
cijSh∆ CEE-5 EE-2 BAL CEE-5 EE-2 BAL
cijSh 1995, -0.24
(0.00)*** -0.12
(0.34)** -0.50
(0.00)*** -0.15
(0.00)*** -0.04 (0.36)
-0.57 (0.00)***
cijUVR∆ 0.09
(0.03)** 0.005 (0.88)
0.02 (0.66)
-0.03 (0.48)
-0.02 (0.31)
-0.06 (0.02)**
DSeg2 0.06 (0.00)***
0.06 (0.113)
-0.09 (0.11)
-0.03 (0.21)
0.03 (0.54)
-0.36 (0.00)***
DSeg3 0.04 (0.03)**
0.08 (0.01)***
-0.08 (0.20)
-0.06 (0.04)**
0.03 (0.54)
-0.38 (0.00)***
Const. 0.03 (0.29)
-0.08 (0.87)
0.21 (0.01)**
0.09 (0.01)**
-0.002 (0.97)
0.47 (0.00)***
R2 0.36 0.22 0.31 0.21 0.11 0.27
Obs. 195 78 117 195 78 117
Notes: p-values in brackets. All models are estimated using heteroscedastic consistent robust standard errors. ***, ** and * indicate significance at the 1, 5 and 10 per cent levels respectively.
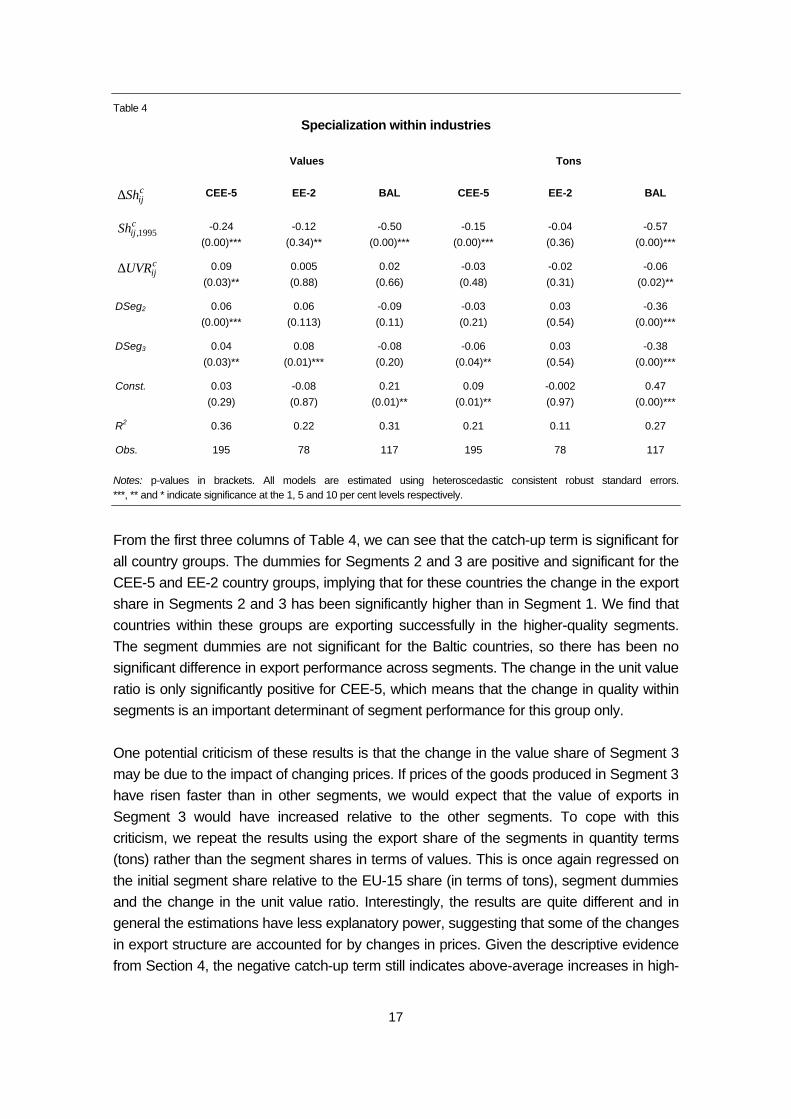
From the first three columns of Table 4, we can see that the catch-up term is significant for all country groups. The dummies for Segments 2 and 3 are positive and significant for the CEE-5 and EE-2 country groups, implying that for these countries the change in the export share in Segments 2 and 3 has been significantly higher than in Segment 1. We find that countries within these groups are exporting successfully in the higher-quality segments. The segment dummies are not significant for the Baltic countries, so there has been no significant difference in export performance across segments. The change in the unit value ratio is only significantly positive for CEE-5, which means that the change in quality within segments is an important determinant of segment performance for this group only. One potential criticism of these results is that the change in the value share of Segment 3 may be due to the impact of changing prices. If prices of the goods produced in Segment 3 have risen faster than in other segments, we would expect that the value of exports in Segment 3 would have increased relative to the other segments. To cope with this criticism, we repeat the results using the export share of the segments in quantity terms (tons) rather than the segment shares in terms of values. This is once again regressed on the initial segment share relative to the EU-15 share (in terms of tons), segment dummies and the change in the unit value ratio. Interestingly, the results are quite different and in general the estimations have less explanatory power, suggesting that some of the changes in export structure are accounted for by changes in prices. Given the descriptive evidence from Section 4, the negative catch-up term still indicates above-average increases in high-
18
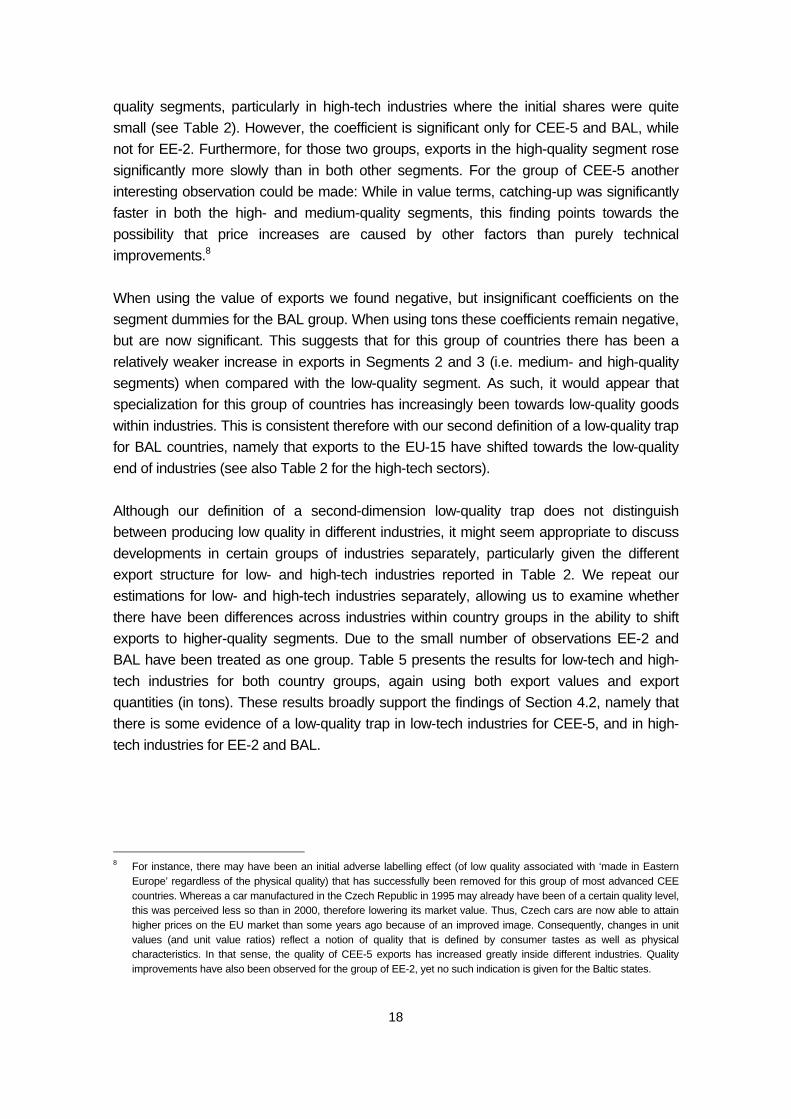
quality segments, particularly in high-tech industries where the initial shares were quite small (see Table 2). However, the coefficient is significant only for CEE-5 and BAL, while not for EE-2. Furthermore, for those two groups, exports in the high-quality segment rose significantly more slowly than in both other segments. For the group of CEE-5 another interesting observation could be made: While in value terms, catching-up was significantly faster in both the high- and medium-quality segments, this finding points towards the possibility that price increases are caused by other factors than purely technical improvements.8 When using the value of exports we found negative, but insignificant coefficients on the segment dummies for the BAL group. When using tons these coefficients remain negative, but are now significant. This suggests that for this group of countries there has been a relatively weaker increase in exports in Segments 2 and 3 (i.e. medium- and high-quality segments) when compared with the low-quality segment. As such, it would appear that specialization for this group of countries has increasingly been towards low-quality goods within industries. This is consistent therefore with our second definition of a low-quality trap for BAL countries, namely that exports to the EU-15 have shifted towards the low-quality end of industries (see also Table 2 for the high-tech sectors). Although our definition of a second-dimension low-quality trap does not distinguish between producing low quality in different industries, it might seem appropriate to discuss developments in certain groups of industries separately, particularly given the different export structure for low- and high-tech industries reported in Table 2. We repeat our estimations for low- and high-tech industries separately, allowing us to examine whether there have been differences across industries within country groups in the ability to shift exports to higher-quality segments. Due to the small number of observations EE-2 and BAL have been treated as one group. Table 5 presents the results for low-tech and high-tech industries for both country groups, again using both export values and export quantities (in tons). These results broadly support the findings of Section 4.2, namely that there is some evidence of a low-quality trap in low-tech industries for CEE-5, and in high-tech industries for EE-2 and BAL.
8 For instance, there may have been an initial adverse labelling effect (of low quality associated with ‘made in Eastern
Europe’ regardless of the physical quality) that has successfully been removed for this group of most advanced CEE countries. Whereas a car manufactured in the Czech Republic in 1995 may already have been of a certain quality level, this was perceived less so than in 2000, therefore lowering its market value. Thus, Czech cars are now able to attain higher prices on the EU market than some years ago because of an improved image. Consequently, changes in unit values (and unit value ratios) reflect a notion of quality that is defined by consumer tastes as well as physical characteristics. In that sense, the quality of CEE-5 exports has increased greatly inside different industries. Quality improvements have also been observed for the group of EE-2, yet no such indication is given for the Baltic states.
19
Table 5
Specialization within selected low- and high-tech industries
Low-tech High-tech
Values Tons Values Tons
cijSh∆ CEE-5 Other CEE-5 Other CEE-5 Other CEE-5 Other
cijSh 1995, -0.15
(0.016)** -0.39
(0.00)*** -0.20
(0.02)** -0.35
(0.01)*** -0.36
(0.01)*** -0.66
(0.00)*** -0.07 (0.56)
-0.51 (0.01)***
cijUVR∆ 0.007
(0.93) -0.06 (0.52)
0.18 (0.12)
-0.04 (0.76)
0.11 (0.09)*
0.03 (0.33)
0.02 (0.55)
-0.02 (0.42)
DSeg2 -0.0008 (0.97)
0.09 (0.03)**
-0.10 (0.07)*
-0.10 (0.20)
-0.02 (0.73)
-0.24 (0.01)**
0.04 (0.64)
-0.33 (0.03)**
DSeg3 -0.02 (0.37)
0.09 (0.08)*
-0.12 (0.04)**
-0.10 (0.25)
-0.05 (0.45)
-0.27 (0.01)**
0.03 (0.74)
-0.40 (0.02)**
Const. 0.06 (0.04)**
0.07 (0.19)
0.14 (0.03)**
0.18 (0.05)**
0.12 (0.12)
0.39 (0.00)***
-0.004 (0.97)
0.42 (0.02)**
R2 0.15 0.35 0.36 0.14 0.45 0.53 0.35 0.45
Obs. 45 45 45 45 45 45 45 45
Notes: p-values in brackets. All models are estimated using heteroscedastic consistent robust standard errors. ***, ** and * indicate significance at the 1, 5 and 10 percent levels respectively.
Thus, there are significant differences within country groups when we look at different industries. In the case of CEE-5 for example, although we find no evidence of a low-quality trap in general, the results suggest that within low-tech industries there has been movement towards exporting lower-quality goods. This further suggests that this group must have been relatively good at shifting exports towards higher-quality goods in medium- and high-tech industries. Conversely, we find evidence of a low-quality trap for the other group – with exports shifting towards lower-quality production – only in the subset of high-tech industries. Within the low-tech industries no such evidence of a low-quality trap exists; when using the value data this group may have shifted its exports towards higher-quality goods in the low-tech industries. 5.2 Quality upgrading within segments
As for the third dimension of quality upgrading, we examine whether there has been a movement within segments. This could imply a low-quality trap of the third dimension and would not become apparent by our previous analysis. In this section we examine specifically whether there has been a movement towards lower-quality production within segments. To test this hypothesis we estimate the following model:
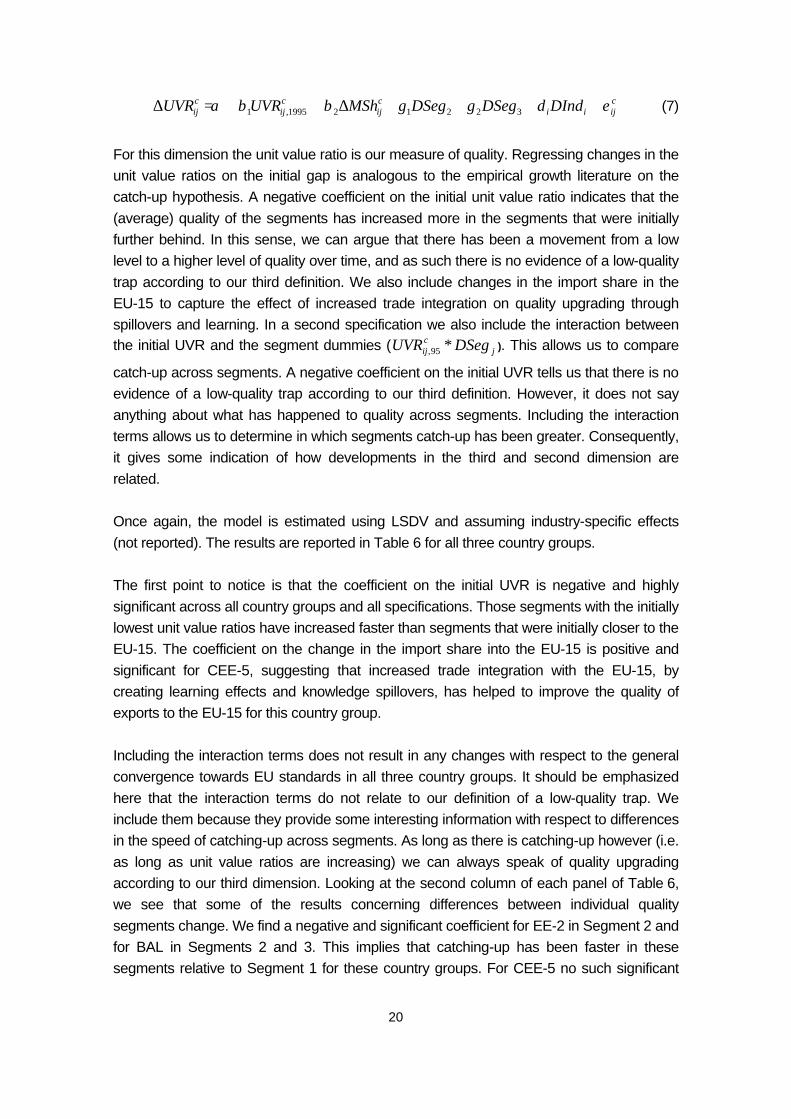
20
cijii
cij
cij
cij DIndDSegDSegMShUVRUVR εδγγββα ++++∆++=∆ 322121995,1 (7)
For this dimension the unit value ratio is our measure of quality. Regressing changes in the unit value ratios on the initial gap is analogous to the empirical growth literature on the catch-up hypothesis. A negative coefficient on the initial unit value ratio indicates that the (average) quality of the segments has increased more in the segments that were initially further behind. In this sense, we can argue that there has been a movement from a low level to a higher level of quality over time, and as such there is no evidence of a low-quality trap according to our third definition. We also include changes in the import share in the EU-15 to capture the effect of increased trade integration on quality upgrading through spillovers and learning. In a second specification we also include the interaction between the initial UVR and the segment dummies ( j
cij DSegUVR ∗95, ). This allows us to compare
catch-up across segments. A negative coefficient on the initial UVR tells us that there is no evidence of a low-quality trap according to our third definition. However, it does not say anything about what has happened to quality across segments. Including the interaction terms allows us to determine in which segments catch-up has been greater. Consequently, it gives some indication of how developments in the third and second dimension are related. Once again, the model is estimated using LSDV and assuming industry-specific effects (not reported). The results are reported in Table 6 for all three country groups. The first point to notice is that the coefficient on the initial UVR is negative and highly significant across all country groups and all specifications. Those segments with the initially lowest unit value ratios have increased faster than segments that were initially closer to the EU-15. The coefficient on the change in the import share into the EU-15 is positive and significant for CEE-5, suggesting that increased trade integration with the EU-15, by creating learning effects and knowledge spillovers, has helped to improve the quality of exports to the EU-15 for this country group. Including the interaction terms does not result in any changes with respect to the general convergence towards EU standards in all three country groups. It should be emphasized here that the interaction terms do not relate to our definition of a low-quality trap. We include them because they provide some interesting information with respect to differences in the speed of catching-up across segments. As long as there is catching-up however (i.e. as long as unit value ratios are increasing) we can always speak of quality upgrading according to our third dimension. Looking at the second column of each panel of Table 6, we see that some of the results concerning differences between individual quality segments change. We find a negative and significant coefficient for EE-2 in Segment 2 and for BAL in Segments 2 and 3. This implies that catching-up has been faster in these segments relative to Segment 1 for these country groups. For CEE-5 no such significant
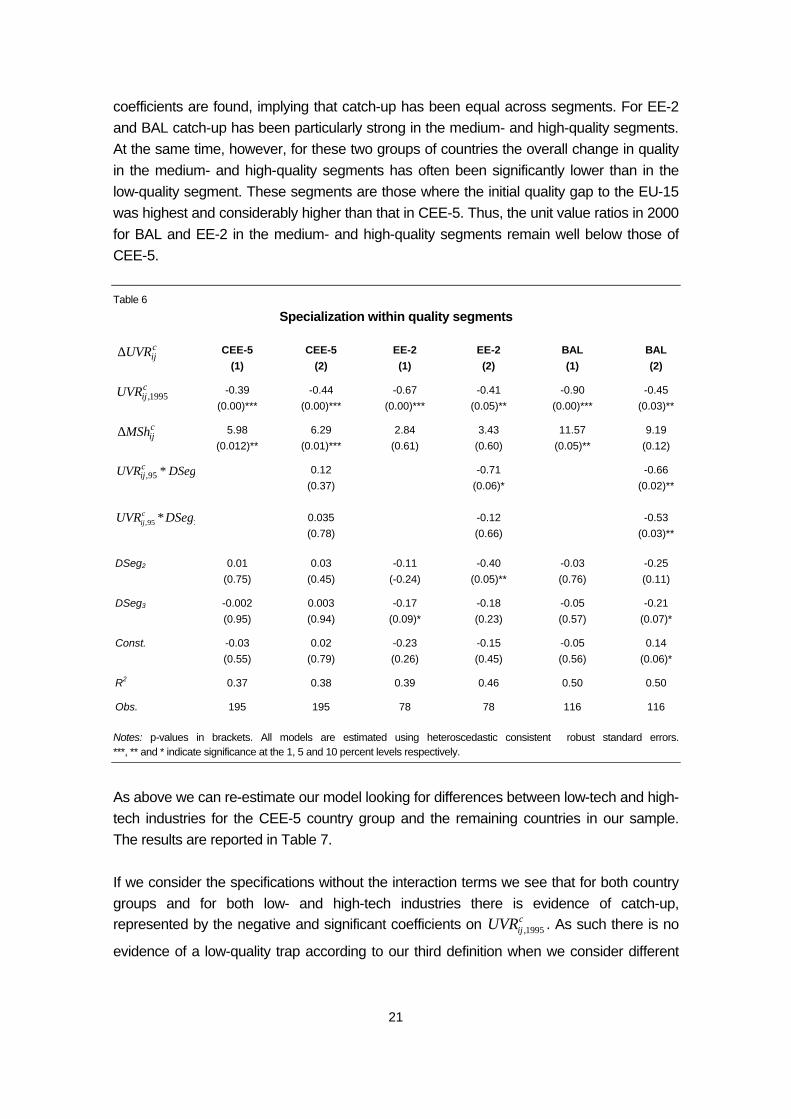
21
coefficients are found, implying that catch-up has been equal across segments. For EE-2 and BAL catch-up has been particularly strong in the medium- and high-quality segments. At the same time, however, for these two groups of countries the overall change in quality in the medium- and high-quality segments has often been significantly lower than in the low-quality segment. These segments are those where the initial quality gap to the EU-15 was highest and considerably higher than that in CEE-5. Thus, the unit value ratios in 2000 for BAL and EE-2 in the medium- and high-quality segments remain well below those of CEE-5. Table 6
Specialization within quality segments
cijUVR∆ CEE-5
(1) CEE-5
(2) EE-2 (1)
EE-2 (2)
BAL (1)
BAL (2)
cijUVR 1995, -0.39
(0.00)*** -0.44
(0.00)*** -0.67
(0.00)*** -0.41
(0.05)** -0.90
(0.00)*** -0.45
(0.03)**
cijMSh∆ 5.98
(0.012)** 6.29
(0.01)*** 2.84
(0.61) 3.43
(0.60) 11.57
(0.05)** 9.19
(0.12)
95, DSegUVRcij ∗
0.12 (0.37)
-0.71 (0.06)*
-0.66 (0.02)**
395, DSegUVRcij ∗
0.035 (0.78)
-0.12 (0.66)
-0.53 (0.03)**
DSeg2 0.01 (0.75)
0.03 (0.45)
-0.11 (-0.24)
-0.40 (0.05)**
-0.03 (0.76)
-0.25 (0.11)
DSeg3 -0.002 (0.95)
0.003 (0.94)
-0.17 (0.09)*
-0.18 (0.23)
-0.05 (0.57)
-0.21 (0.07)*
Const. -0.03 (0.55)
0.02 (0.79)
-0.23 (0.26)
-0.15 (0.45)
-0.05 (0.56)
0.14 (0.06)*
R2 0.37 0.38 0.39 0.46 0.50 0.50
Obs. 195 195 78 78 116 116
Notes: p-values in brackets. All models are estimated using heteroscedastic consistent robust standard errors. ***, ** and * indicate significance at the 1, 5 and 10 percent levels respectively.
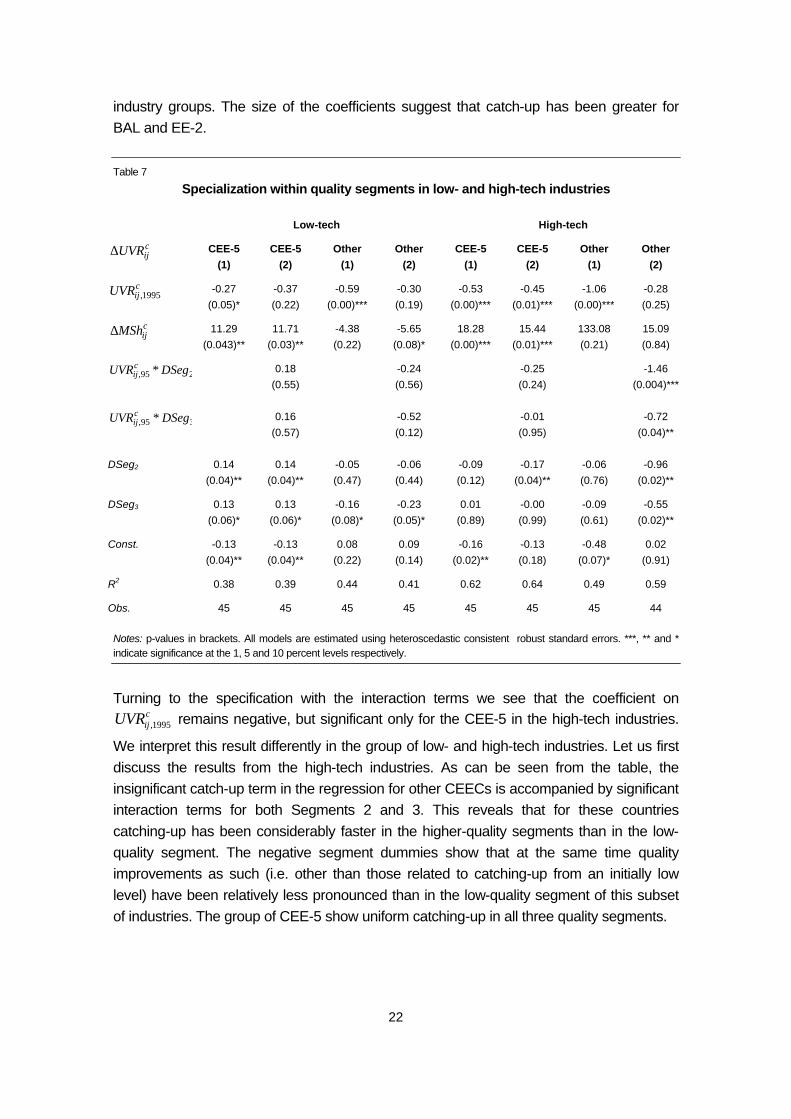
As above we can re-estimate our model looking for differences between low-tech and high-tech industries for the CEE-5 country group and the remaining countries in our sample. The results are reported in Table 7. If we consider the specifications without the interaction terms we see that for both country groups and for both low- and high-tech industries there is evidence of catch-up, represented by the negative and significant coefficients on c
ijUVR 1995, . As such there is no
evidence of a low-quality trap according to our third definition when we consider different
22
industry groups. The size of the coefficients suggest that catch-up has been greater for BAL and EE-2. Table 7
Specialization within quality segments in low- and high-tech industries
Low-tech High-tech
cijUVR∆ CEE-5
(1) CEE-5
(2) Other
(1) Other
(2) CEE-5
(1) CEE-5
(2) Other
(1) Other
(2)
cijUVR 1995, -0.27
(0.05)* -0.37 (0.22)
-0.59 (0.00)***
-0.30 (0.19)
-0.53 (0.00)***
-0.45 (0.01)***
-1.06 (0.00)***
-0.28 (0.25)
cijMSh∆ 11.29
(0.043)** 11.71
(0.03)** -4.38 (0.22)
-5.65 (0.08)*
18.28 (0.00)***
15.44 (0.01)***
133.08 (0.21)
15.09 (0.84)
295, DSegUVRcij ∗
0.18 (0.55)
-0.24 (0.56)
-0.25 (0.24)
-1.46 (0.004)***
395, DSegUVRcij ∗
0.16 (0.57)
-0.52 (0.12)
-0.01 (0.95)
-0.72 (0.04)**
DSeg2 0.14 (0.04)**
0.14 (0.04)**
-0.05 (0.47)
-0.06 (0.44)
-0.09 (0.12)
-0.17 (0.04)**
-0.06 (0.76)
-0.96 (0.02)**
DSeg3 0.13 (0.06)*
0.13 (0.06)*
-0.16 (0.08)*
-0.23 (0.05)*
0.01 (0.89)
-0.00 (0.99)
-0.09 (0.61)
-0.55 (0.02)**
Const. -0.13 (0.04)**
-0.13 (0.04)**
0.08 (0.22)
0.09 (0.14)
-0.16 (0.02)**
-0.13 (0.18)
-0.48 (0.07)*
0.02 (0.91)
R2 0.38 0.39 0.44 0.41 0.62 0.64 0.49 0.59
Obs. 45 45 45 45 45 45 45 44
Notes: p-values in brackets. All models are estimated using heteroscedastic consistent robust standard errors. ***, ** and * indicate significance at the 1, 5 and 10 percent levels respectively.
Turning to the specification with the interaction terms we see that the coefficient on
cijUVR 1995, remains negative, but significant only for the CEE-5 in the high-tech industries.
We interpret this result differently in the group of low- and high-tech industries. Let us first discuss the results from the high-tech industries. As can be seen from the table, the insignificant catch-up term in the regression for other CEECs is accompanied by significant interaction terms for both Segments 2 and 3. This reveals that for these countries catching-up has been considerably faster in the higher-quality segments than in the low-quality segment. The negative segment dummies show that at the same time quality improvements as such (i.e. other than those related to catching-up from an initially low level) have been relatively less pronounced than in the low-quality segment of this subset of industries. The group of CEE-5 show uniform catching-up in all three quality segments.
23
Turning now to the group of low-tech industries, we have the puzzling result that the overall tendency for convergence disappears in the results for the second specification (for both country groups). This might be due to a lack of a sufficiently high degree of variability after the inclusion of the interaction terms. This problem has not arisen in the high-tech industries, as one expects to find more variability in changes in unit value ratios in this subset. Overall, the results from this section suggest that there is no evidence of a low-quality trap according to our third definition for any of the countries. On the contrary, a general shift towards producing goods at the higher end of the quality segments has been observed. However, the results also point to significant differences in the extent of catch-up across countries in different segments and in different industry groupings. 6 Conclusions
This paper addressed the question of whether CEECs are locked in exporting low quality to the EU market which would correspond to their communist and early post-communist image. We presented empirical evidence on whether or not they were successfully upgrading their exports in terms of quality in the second half of the 1990s. For this we referred to the lock-in scenario as a low-quality trap and used various refinements of quality. Our first dimension of quality upgrading referred to shifts in export structure. A country is said to successfully escape a low-quality trap by shifting exports from low- to high-tech industries. The second notion identified shifts inside industries from low- to high-quality segments as upgrading. This would imply no evidence of such a trap. Finally, we added a third dimension of quality: Rather than concentrating on shifts across distinct segments, we looked at quality improvements inside quality segments within industries. We presented descriptive evidence on all three notions of quality upgrading or low-quality traps. This was followed by econometric tests for the latter two definitions. An important distinction between CEE-5 (Czech Republic, Slovakia, Hungary, Poland and Slovenia) and the five other countries (Bulgaria, Romania and the Baltic States) was observed. Whereas the former group appeared to be successful in substantial quality upgrading of their export structure according to all three definitions, results were less uniform for the second group of less advanced countries. The notion of a low-quality trap in the second dimension (defined as low-end specialization within industries) could not be ruled out for these countries in the subset of high-tech industries. These differing developments inside the subset of high-tech industries between country groups became apparent from our descriptive analysis and were confirmed by the regression analysis. It has to be mentioned that the use of unit values as a measure of quality implies a concept of quality which comprises physical and technical properties as well as consumer tastes
24
and thus incorporates image and labelling effects as quality improvements. Comparing our results based on values to those based on quantities (i.e. tons) we find another distinction between the group of Baltic and Southeastern European countries on the one hand and CEE-5 on the other hand. Whereas the former experienced corresponding shifts in values and quantities, the latter showed increases in value terms that were often not accompanied by increases in exported quantities (or even in contrast to those). These results suggest that CEE-5 faced quality improvements associated with other factors than simply improvements in technical properties, i.e. positive labelling effects, changes in their image. This kind of improvements in quality as perceived by Western European consumers have been experienced neither by the Southeastern European countries nor by the Baltic states to the same extent. Already by 1995, CEE-5 exports were of considerably higher quality than those of other Eastern European countries. Given further quality upgrading in this group of countries, as confirmed by the findings in this paper, lack of quality will not pose an obstacle to CEE-5 exports to the EU-15. This implies positive long-term prospects for CEE-5 trade flows with the EU-15. However, quality seems to be a concern in the case of Bulgaria, Romania and partly the Baltic states. These countries show some evidence of entering a low-quality trap according to our second definition within the high-tech industries. Despite showing convergence (in terms of exported quality) inside high quality segments, increases in relative unit values are significantly slower in those segments. Together with their initial huge quality gaps in these segments, this implies some restructuring towards lower quality inside industries.
25
References
Aiginger, K. (1997), ‘The Use of Unit Values to Discriminate Between Price and Quality Competition’, Cambridge Journal of Economics, 21, pp. 571-592.
Aturupane, C., S. Djankov and B. Hoekman (1999), ‘Horizontal and vertical intra-industry trade between Eastern Europe and the European Union’, Weltwirtschaftliches Archiv, Vol. 135, No. 1, pp. 62-81.
Dulleck, U. (2002), ‘Trade and transition – Is there a low-quality trap?’, University of Vienna, mimeo.
Havlik, P. (2001), ‘Competitiveness of CEECs’ Industry’, Proceedings of the International Conference on the 10-Year Review of Transitional Economies and Challenges in the Next Decade, Final Report, UNIDO, Vienna, pp. 23-36.
Landesmann, M. (2003), ‘The CEECs in an Enlarged Europe: Patterns of Structural Change and Catching-up’, in: H. Handler (ed.), Structural Reforms in the Candidate Countries and the European Union, Austrian Ministry for Economic Affairs and Labour, Economic Policy Center, Vienna.
Landesmann, M. and J. Burgstaller (1997), ‘Vertical Product Differentiation in EU Markets: the Relative Position of East European Producers’, wiiw Research Reports, No. 234, The Vienna Institute for International Economic Studies (wiiw), Vienna.
Landesmann, M. and J. Fersterer (1998), ‘Vertical Product Differentiation in International Trade: an Econometric Analysis’, wiiw Working Papers, No 8, The Vienna Institute for International Economic Studies (wiiw), Vienna, April.
Landesmann, M. A. and R. Stehrer (2002), ‘Evolving Competitiveness of CEECs in an Enlarged Europe’, Rivista di Politica Economia, Vol. 92, No. 1, pp. 23-87.
Murphy, K. M., A. Shleifer and R. W. Vishny (1989), ‘Industrialization and the Big Push’, Journal of Political Economy, Vol. 97, pp. 1003-1026.
Redding, S. (1996), ‘The Low-Skill, Low-Quality Trap: Strategic Complementarities Between Human Capital and R&D’, Economic Journal, 106 (March), pp. 458-470.
Wörz, J. (2003), ‘Trade structure and convergence: A comparison of CEECs to different world regions’, The Vienna Institute Monthly Report, No. 7, The Vienna Institute for International Economic Studies (wiiw), July, pp. 1-8.

27
Appendix
Table A1
List of industries
NACE code Description Group
DA Food products; beverages and tobacco Low-tech
DB Textiles and textile products Low-tech
DC Leather and leather products Low-tech
DD Wood and wood products
DE Pulp, paper & paper products; publishing & printing
DF Coke, refined petroleum products & nuclear fuel
DG Chemicals, chemical products and man-made fibres
DH Rubber and plastic products
DI Other non-metallic mineral products
DJ Basic metals and fabricated metal products
DK Machinery and equipment n.e.c. High-tech
DL Electrical and optical equipment High-tech
DM Transport equipment High-tech
DN Manufacturing n.e.c.
Table A2
List of countries
Code Country name Group
61 Czech Republic CEE-5
64 Hungary CEE-5
60 Poland CEE-5
63 Slovak Republic CEE-5
91 Slovenia CEE-5
66 Romania EE-2
68 Bulgaria EE-2
53 Estonia BAL
54 Latvia BAL
55 Lithuania BAL


Short list of the most recent wiiw publications (as of April 2004)
For current updates and summaries see also wiiw's website at www.wiiw.ac.at Dimensions of Quality Upgrading in CEECs by Uwe Dulleck, Neil Foster, Robert Stehrer and Julia Wörz wiiw Working Papers, No. 29, April 2004 30 pages including 9 Tables and 1 Figure, EUR 8.00 (PDF: free download from wiiw’s website)
European Union, Russia and Ukraine: Creating New Neighbourhoods by Vasily Astrov and Peter Havlik wiiw Research Reports, No. 305, April 2004 26 pages including 6 Tables and 3 Figures, EUR 22.00 (PDF: EUR 20.00) The Vienna Institute Monthly Report 4/04 edited by Leon Podkaminer • European Union and Russia: difficult neighbourhoods • European Partnership and the Balkans • Euro introduction in the new member states: which country in which year? • Selected monthly data on the economic situation in ten transition countries, 2002 to 2004 • Guide to wiiw statistical services on Central and Eastern Europe, Russia and Ukraine wiiw, April 2004 33 pages including 16 Tables (exclusively for subscribers to the wiiw Service Package) Assessing the Demand for Food in Europe by the Year 2010 by Leon Podkaminer wiiw Working Papers, No. 28, March 2004 14 pages including 5 Tables, EUR 8.00 (PDF: free download from wiiw’s website) Croatia’s Delayed Transition: Competitiveness and Economic Policy Challenges by Hermine Vidovic and Vladimir Gligorov wiiw Research Reports, No. 304, March 2004 48 pages including 27 Tables and 8 Figures, EUR 22.00 (PDF: EUR 20.00) Modelling International Economic Integration: Patterns of Catching-up, Foreign Direct Investment and Migration Flows by Michael Landesmann and Robert Stehrer wiiw Working Papers, No. 27, March 2004 28 pages including 2 Tables and 7 Figures, EUR 8.00 (PDF: free download from wiiw’s website) The Vienna Institute Monthly Report 3/04 edited by Leon Podkaminer • New EU member countries joining the euro zone: the criteria of demonstrable maturity • Moldova: Europe’s poorhouse • Assessing the demand for food in Europe by the year 2010 • Selected monthly data on the economic situation in ten transition countries, 2002 to 2003 • Guide to wiiw statistical services on Central and Eastern Europe, Russia and Ukraine wiiw, March 2004 31 pages including 21 Tables (exclusively for subscribers to the wiiw Service Package)

Transition Countries on the Eve of EU Enlargement by Leon Podkaminer et al. wiiw Research Reports, No. 303 (Special issue on the transition economies), February 2004 92 pages including 30 Tables and 6 Figures, EUR 70.00 (PDF: EUR 65.00) The Vienna Institute Monthly Report 2/04 edited by Leon Podkaminer • Inflation, exchange rates and the real catch-up • Specialization patterns in CEEC manufacturing • Agriculture in transition countries in 2003: hit by the drought • Selected monthly data on the economic situation in ten transition countries, 2002 to 2003 • Guide to wiiw statistical services on Central and Eastern Europe, Russia and Ukraine wiiw, February 2004 37 pages including 12 Tables and 4 Figures (exclusively for subscribers to the wiiw Service Package) Global Growth Processes: Technology Diffusion, Catching-up and Effective Demand by Michael Landesmann and Robert Stehrer wiiw Working Papers, No. 26, January 2004 30 pages including 2 Tables and 4 Figures, EUR 8.00 (PDF: free download from wiiw’s website) Lessons to be Learnt from the ERM and their Applicability to the Accession Economies Seeking to Join the ERM2 by Pawel Kowalewski wiiw Research Reports, No. 302, January 2004 36 pages including 6 Tables and 7 Figures, EUR 22.00 (PDF: 20.00)
The Vienna Institute Monthly Report 1/04 edited by Leon Podkaminer • Slovak flat tax: more pain than gain? • Hungary: targeting an inconsistency • The Common Economic Space agreement: origins and prospects • Selected monthly data on the economic situation in ten transition countries, 2002 to 2003 • Guide to wiiw statistical services on Central and Eastern Europe, Russia and Ukraine wiiw, January 2004 27 pages including 11 Tables (exclusively for subscribers to the wiiw Service Package)
The Vienna Institute Monthly Report 12/03 edited by Leon Podkaminer • Thirty years of The Vienna Institute for International Economic Studies • The reform agenda and the Washington Consensus • ‘Last-minute’ warnings from Brussels to the acceding countries • Slovenia’s accession to the EU: fiscal implications • Selected monthly data on the economic situation in ten transition countries, 2002 to 2003 • Guide to wiiw statistical services on Central and Eastern Europe, Russia and Ukraine wiiw, December 2003 41 pages including 16 Tables (exclusively for subscribers to the wiiw Service Package)
A Note on the Evolution of Inequality in Poland, 1992-99 (reprinted from Cambridge Journal of Economics, Vol. 27, No. 5, 2003, pp. 755-768, by permission of Cambridge Political Economy Society) Analytical Notes on the Balassa-Samuelson Effect (reprinted from Banca Nazionale del Lavoro Quarterly Review, No. 226, 2003, pp. 207-221, by permission of Banca Nazionale del Lavoro) by Leon Podkaminer wiiw Research Reports, No. 301, November 2003 29 pages including 13 Tables, EUR 8.00
Skill Intensity in Foreign Trade and Economic Growth by Julia Wörz wiiw Working Papers, No. 25, November 2003; revised version January 2004 28 pages including 6 Tables, EUR 8.00 (PDF: free download from wiiw’s website)
EU Enlargement: Growth, Competitiveness and Some Challenges Facing the Future Member States by Peter Havlik wiiw Current Analyses and Country Profiles, No. 20, November 2003 22 pages including 8 Tables and 6 Figures, EUR 30.00 (PDF: 28.00) Countries in Transition 2003: wiiw Handbook of Statistics covers twelve transition countries (Bulgaria, Croatia, Czech Republic, Hungary, Poland, Macedonia, Romania, Russia, Serbia and Montenegro, Slovakia, Slovenia, Ukraine), 1990 to August 2003 wiiw, Vienna, November 2003 556 pages including 416 Tables and Figures, EUR 90.00 (ISBN 3-85209-008-3)
Structural Change, Convergence and Specialization in the EU Accession Countries by Michael Landesmann Industrial Development by Peter Havlik and Waltraut Urban Structural Patterns of East-West European Integration by Michael Landesmann and Robert Stehrer wiiw Structural Report 2003 on Central and Eastern Europe, Volume 1, October 2003 121 pages including 28 Tables and 39 Figures, EUR 90.00
Labour Market Trends by Hermine Vidovic Structural Development of Manufacturing FDI by Gábor Hunya Technological Activity by Mark Knell Regional GDP and Regional Unemployment by Roman Römisch wiiw Structural Report 2003 on Central and Eastern Europe, Volume 2, October 2003 113 pages including 48 Tables, 13 Figures and 4 Maps, EUR 90.00
Low-quality Trap or Quality Upgrading by Uwe Dulleck, Neil Foster, Robert Stehrer and Julia Wörz Structural Characteristics of Agriculture and the Food Industry by Doris Hanzl-Weiss, Zdenek Lukas and Josef Pöschl Structural Change: a Comparison of Three Manufacturing Sectors by Doris Hanzl-Weiss wiiw Structural Report 2003 on Central and Eastern Europe, Volume 3, October 2003 113 pages including 52 Tables, 22 Figures and 1 Map, EUR 90.00

wiiw Service Package The Vienna Institute offers to firms and institutions interested in unbiased and up-to-date information on Central, East and Southeast European markets a package of exclusive services and preferential access to its publications and research findings, on the basis of a subscription at an annual fee of EUR 2,000.
This subscription fee entitles to the following package of Special Services:
– A free invitation to the Vienna Institute's Spring Seminar, a whole-day event at the end of March, devoted to compelling topics in the economic transformation of the Central and East European region (for subscribers to the wiiw Service Package only).
– Copies of, or online access to, The Vienna Institute Monthly Report, a periodical consisting of timely articles summarizing and interpreting the latest economic developments in Central and Eastern Europe and the former Soviet Union. The statistical annex to each Monthly Report contains tables of the latest monthly country data. This periodical is not for sale, it can only be obtained in the framework of the wiiw Service Package.
– Free copies of the Institute's Research Reports (including Reprints), Analytical Forecasts and Current Analyses and Country Profiles
– A free copy of the wiiw Handbook of Statistics, Countries in Transition (published in October/November each year and containing more than 400 tables and figures on the economies of Bulgaria, Croatia, the Czech Republic, Hungary, Macedonia, Poland, Romania, Russia, Serbia and Montenegro, Slovakia, Slovenia and Ukraine)
– Free online access to the wiiw Monthly Database, containing more than 1200 leading indicators monitoring the latest key economic developments in ten Central and East European countries.
– Consulting. The Vienna Institute is pleased to advise subscribers on questions concerning the East European economies or East-West economic relations if the required background research has already been undertaken by the Institute. We regret we have to charge extra for ad hoc research.
– Free access to the Institute's specialized economics library and documentation facilities.
Subscribers who wish to purchase wiiw data sets on CD-ROM or special publications not included in the wiiw Service Package are granted considerable price reductions.
For detailed information about the wiiw Service Package please visit wiiw's website at www.wiiw.ac.at

To The Vienna Institute for International Economic Studies Oppolzergasse 6 A-1010 Vienna ¡ Please forward more detailed information about the Vienna Institute's Service Package ¡ Please forward a complete list of the Vienna Institute's publications to the following address
Please enter me for
¡ 1 yearly subscription of Research Reports (including Reprints) at a price of EUR 225.00 (within Austria), EUR 250.00 (Europe) and EUR 265.00 (overseas) respectively
Please forward
¡ the following issue of Research Reports ...........................................................................................
¡ the following issue of Analytical Forecasts ........................................................................................
¡ the following issue of Current Analyses and Country Profiles ...........................................................
¡ the following issue of Working Papers ...............................................................................................
¡ the following issue of Research Papers in German language ...........................................................
¡ the following issue of China Reports .................................................................................................
¡ the following issue of Industry Studies ..............................................................................................
¡ the following issue of Structural Reports ...........................................................................................
¡ the following issue of wiiw-wifo Data on Foreign Direct Investment ..................................................
¡ the following issue of COUNTRIES IN TRANSITION: wiiw Handbook of Statistics ..........................
...................................................................................................................................................................................................
Name
...................................................................................................................................................................................................
Address
...................................................................................................................................................................................................
Telephone Fax E-mail
.......................................................... ........................................................
Date Signature
Herausgeber, Verleger, Eigentümer und Hersteller:
Verein „Wiener Institut für Internationale Wirtschaftsvergleiche“ (wiiw), Wien 1, Oppolzergasse 6
Postanschrift: A-1010 Wien, Oppolzergasse 6, Tel: [+431] 533 66 10, Telefax: [+431] 533 66 10 50
Internet Homepage: www.wiiw.ac.at
Nachdruck nur auszugsweise und mit genauer Quellenangabe gestattet.
P.b.b. Verlagspostamt 1010 Wien