Wiimote as an Input Device in Google Earth Visualization and Navigation: A User Study Comparing Two...
7
Wiimote as an input device in Google Earth visualization and navigation: a user study comparing two alternatives Beatriz Sousa Santos (1,2) , Bruno Prada (1) , Hugo Ribeiro (1) , Paulo Dias (1,2) , Samuel Silva (1) , Carlos Ferreira (3) , (1) Department of Electronics Telecommunications and Informatics, Univ. Aveiro, Portugal (2) IEETA / Institute of Electronics Engineering and Telematics of Aveiro, Portugal (3) DEGEI-Univ. Aveiro, CIO, Univ. de Lisboa, Portugal {[email protected]} Abstract This paper presents a user study performed to compare the usability of the Wiimote as an input device to visualize information and navigate in Google Earth using two different configurations. This study had the collaboration of 15 participants which performed a set of tasks using the Wiimote as an input device while the image was projected on a common projection screen, as well as a mouse on a desktop. Results show that most users clearly preferred one of the Wiimote configurations over the other, and over the mouse; moreover, they had better performances using the preferred configuration. Keywords: Google Earth, usability, user study, visualization, Wiimote. 1. Introduction Since the appearance of the Wii (a game console by Nintendo) [1], attempts to use its input device in different applications have been made and published. The papers by LaViola [2], Sheridan et al. [3], Sreedharan et al. [4]. Bernardes et al. [5], are examples. A paper by Lee [6] and a recent tutorial by Wingrave et al. [7] on the capabilities and limitations of the Wii Remote Controller (Wiimote), give a lot of information obtained by the hacking community that has been reverse engineering the device. Moreover, various sites devoted to the Wiimote exist [8] [9], and several demonstration videos can be seen at Youtube (e.g. [10]). Hence, this piece of equipment seems to have gained a relevant place in the plethora of input devices to consider when designing 3D applications. We have been studying the usability of a low cost Virtual Reality platform with different input and output devices, mostly for navigation tasks [11] [12], and got interested in exploring the potential of the Wiimote as an input device to our platform, mainly due to its technical characteristics, accessibility to the general public, and low cost. Yet, this involved defining precisely how to use the Wiimote, as it has several buttons and sensors allowing different input configurations. This paper presents a user study performed to compare the usability of the Wiimote in two different configurations as an input device to visualize information and navigate in a virtual environment (VE). Google Earth was selected since it is a well known, free and ready to use VE [13], where users can navigate to visualize information. We had the collaboration of 15 participants which performed a set of tasks using the Wiimote while the image was projected on a common projection screen, as well as using a mouse on a desktop. This paper is organized in five sections: section 2 briefly addresses Wiimote capabilities and describes the two configurations used, sections 3 and 4 present the user study, and main results, finally section 5 presents some conclusions and future work. 2. The Wiimote as an input device The Wiimote is a handheld device containing several buttons, a 3-axis accelerometer, a high-resolution high speed Infra-Red (IR) camera, wireless Bluetooth connectivity, as well as a speaker, a vibration motor and four blue LEDs, all coming at an accessible cost, in a robust and easy to configure pack. Lee [6] considered it one of the most sophisticated PC-compatible input devices available today and suitable for exploring interaction research. In his paper, this author addresses what’s involved in developing custom applications, as well as additional unexpected uses of the device. Though a remarkable device, it has limitations for universal 3D interaction tasks; in fact, Wiimote’s spatial data doesn’t directly map to real-world position, yet, it can be employed effectively under constrained use (as in [2]). Actually, according to Wingrave et al. in their tutorial about the Wiimote [7], it “is an imperfect harbinger of a new class of spatially convenient devices”. This tutorial discusses techniques for exploiting its capabilities and methods to compensate for its limitations in 3D User Interfaces (UIs). 2.1. Main characteristics As already mentioned, the Wiimote has been hacked by many people contributing to sites that collect a
-
Upload
independent -
Category
Documents
-
view
5 -
download
0
Transcript of Wiimote as an Input Device in Google Earth Visualization and Navigation: A User Study Comparing Two...
Wiimote as an input device in Google Earth visualization and navigation: a user study comparing two alternatives
Beatriz Sousa Santos (1,2), Bruno Prada(1), Hugo Ribeiro(1), Paulo Dias(1,2), Samuel Silva(1), Carlos Ferreira(3),
(1)Department of Electronics Telecommunications and Informatics, Univ. Aveiro, Portugal (2)IEETA / Institute of Electronics Engineering and Telematics of Aveiro, Portugal
(3) DEGEI-Univ. Aveiro, CIO, Univ. de Lisboa, Portugal {[email protected]}
Abstract This paper presents a user study performed to
compare the usability of the Wiimote as an input device to visualize information and navigate in Google Earth using two different configurations. This study had the collaboration of 15 participants which performed a set of tasks using the Wiimote as an input device while the image was projected on a common projection screen, as well as a mouse on a desktop. Results show that most users clearly preferred one of the Wiimote configurations over the other, and over the mouse; moreover, they had better performances using the preferred configuration.
Keywords: Google Earth, usability, user study, visualization, Wiimote.
1. Introduction
Since the appearance of the Wii (a game console by Nintendo) [1], attempts to use its input device in different applications have been made and published. The papers by LaViola [2], Sheridan et al. [3], Sreedharan et al. [4]. Bernardes et al. [5], are examples. A paper by Lee [6] and a recent tutorial by Wingrave et al. [7] on the capabilities and limitations of the Wii Remote Controller (Wiimote), give a lot of information obtained by the hacking community that has been reverse engineering the device. Moreover, various sites devoted to the Wiimote exist [8] [9], and several demonstration videos can be seen at Youtube (e.g. [10]). Hence, this piece of equipment seems to have gained a relevant place in the plethora of input devices to consider when designing 3D applications.
We have been studying the usability of a low cost Virtual Reality platform with different input and output devices, mostly for navigation tasks [11] [12], and got interested in exploring the potential of the Wiimote as an input device to our platform, mainly due to its technical characteristics, accessibility to the general public, and low cost. Yet, this involved defining precisely how to use the Wiimote, as it has several buttons and sensors allowing different input configurations. This paper presents a user study performed to compare the usability
of the Wiimote in two different configurations as an input device to visualize information and navigate in a virtual environment (VE). Google Earth was selected since it is a well known, free and ready to use VE [13], where users can navigate to visualize information.
We had the collaboration of 15 participants which performed a set of tasks using the Wiimote while the image was projected on a common projection screen, as well as using a mouse on a desktop.
This paper is organized in five sections: section 2 briefly addresses Wiimote capabilities and describes the two configurations used, sections 3 and 4 present the user study, and main results, finally section 5 presents some conclusions and future work.
2. The Wiimote as an input device
The Wiimote is a handheld device containing several buttons, a 3-axis accelerometer, a high-resolution high speed Infra-Red (IR) camera, wireless Bluetooth connectivity, as well as a speaker, a vibration motor and four blue LEDs, all coming at an accessible cost, in a robust and easy to configure pack. Lee [6] considered it one of the most sophisticated PC-compatible input devices available today and suitable for exploring interaction research. In his paper, this author addresses what’s involved in developing custom applications, as well as additional unexpected uses of the device.
Though a remarkable device, it has limitations for universal 3D interaction tasks; in fact, Wiimote’s spatial data doesn’t directly map to real-world position, yet, it can be employed effectively under constrained use (as in [2]). Actually, according to Wingrave et al. in their tutorial about the Wiimote [7], it “is an imperfect harbinger of a new class of spatially convenient devices”. This tutorial discusses techniques for exploiting its capabilities and methods to compensate for its limitations in 3D User Interfaces (UIs).
2.1. Main characteristics
As already mentioned, the Wiimote has been hacked by many people contributing to sites that collect a

significant body of knowledge concerning the main technical characteristics and constraints of this device, and help using it to develop custom applications. We include some specifications relevant to our case [6] [14-15].
Figure 1 displays a top view of the Wiimote and its frames of reference showing the buttons located on the top face. .
Figure 1 Wiimote (adapted from [1])
The Wiimote includes twelve buttons, four in a standard directional pad layout, other seven buttons are on the top face (to be used by the thumb), and one (button B) is on the bottom (adequate to be used as a trigger by the index) [6].
IR sensors (installed as shown in figure 2) allow tracking up to four IR sources with a refresh rate of 100Hz. The three axis linear accelerometer provides motion sensor capabilities. Communication is done through Bluetooth, which allows connecting the Wiimote to many computers. Batteries provide an operation time of 20 to 40 hours.
Wiimote capabilities to be used as a pointer or for motion recognition have constraints. On one hand, assumptions are made concerning the screen’s visual angle, as well as the scale of movement when the control is used as a pointer, and thus the cursor location corresponding to the intersection of the pointing direction with the screen is not computed accurately. On the other hand, while using the accelerometer data, motion recognition may not be accurate. Yet, these limitations do not seem to preclude its effective use in most circumstances [6].
In order to be able to use data from the IR sensors, it was necessary to attach to the projection screen a bar including IR LEDs (usually referred to as “sensor bar”, in spite of not having any sensor); we used a “home made” device, which was very simple to develop and inexpensive, including a simple IR LEDs circuit and a battery embedded in a plastic bar that we attached to the lower edge of the projection screen.
Several software solutions exist for connecting to Wiimote, parsing the input data, and configuring the controller. We used GlovePIE, a free Programmable Input Emulator supporting many input devices and used to map gestures, button presses, and other actions to keyboard keys, mouse input, or joystick buttons and axes [16].
2.2. Used configurations
Interaction in games and other applications using the Wiimote accelerometer data varies from basic shake triggering, to tilt-and-balance control, to simple gesture recognition. On the other hand, the control may also be used as a pointer. A variety of more or less complex combinations of these methods with different data coming from the buttons, as well as various mappings among these data and application or game functionality may be used. As a consequence, we had a range of possibilities and had to choose two that seemed a priori reasonably suitable to the type of tasks under study, as well as reasonably intuitive.
Figure 2 Using configuration A (adapted from [1])
Figure 3 Configuration B (buttons and IR sensors) (adapted from [1])
The two configurations selected take advantage of different sensors in the Wiimote. One configuration (henceforth referred to as A) uses acceleration data and data provided by some buttons, the other (B) uses buttons and infrared sensors. Figures 2 and 3 illustrate how to use the Wiimote in these configuration (namely, how to grasp it, the gestures to do, and the buttons to press) and Table 1 shows mappings between real world actions and consequent actions in the virtual world, as well as the functionality of Google Earth set off by pressing Wiimote buttons, for both configurations. They are basically similar, however, since in configuration A the acceleration data is parsed, users have to move up, down, right and left in the VE making gestures with the Wiimote (tilting it) as shown in figure 2. On the other hand, in configuration B users have to use the Wiimote
like a pointer, as shown in figure 3, maintaining it aimed at the screen as to view the sensor bar .
Table 1 Mapping of configurations A and B (gestures and buttons pressed)
Real world action Virtual world action
Front Move down Back Move up Right Move right Left Move up
Buttons pressed Functionality of Google Earth
A Same as left button of the mouse B Same as right button of the mouse 1 Full screen - Zoom out + Zoom in
Home Return to original point of view
3. User study: comparing the usability of two alternative Wiimote configurations
To compare the two different configurations of the Wiimote regarding its usability as an input device to navigate in the circumstances we have been studying [11-12] [17], we organized an experiment where we started from the following null hypothesis: users would have similar performance and satisfaction while using any of the two configurations. A within-group experimental design was used [18]; input device configuration was the input variable; and performance, satisfaction, and comfort were output variables. Also, some possible secondary variables were considered. We had the collaboration of 15 volunteer students (9 women and 6 men) from different Departments of our University that performed a set of tasks using both Wiimote configurations, and answered a questionnaire. All participants also performed the same tasks on a desktop with a mouse, so that we could assess their performance, satisfaction and comfort, while using a platform they are much familiarized with (giving a sort of “base line” data, useful as a reference). Thus, all participants used three experimental conditions, which we will call: A, B and D (desktop with mouse).
Tasks were selected as to be representative of what users usually do while visualizing information and navigating in Google Earth, and included:
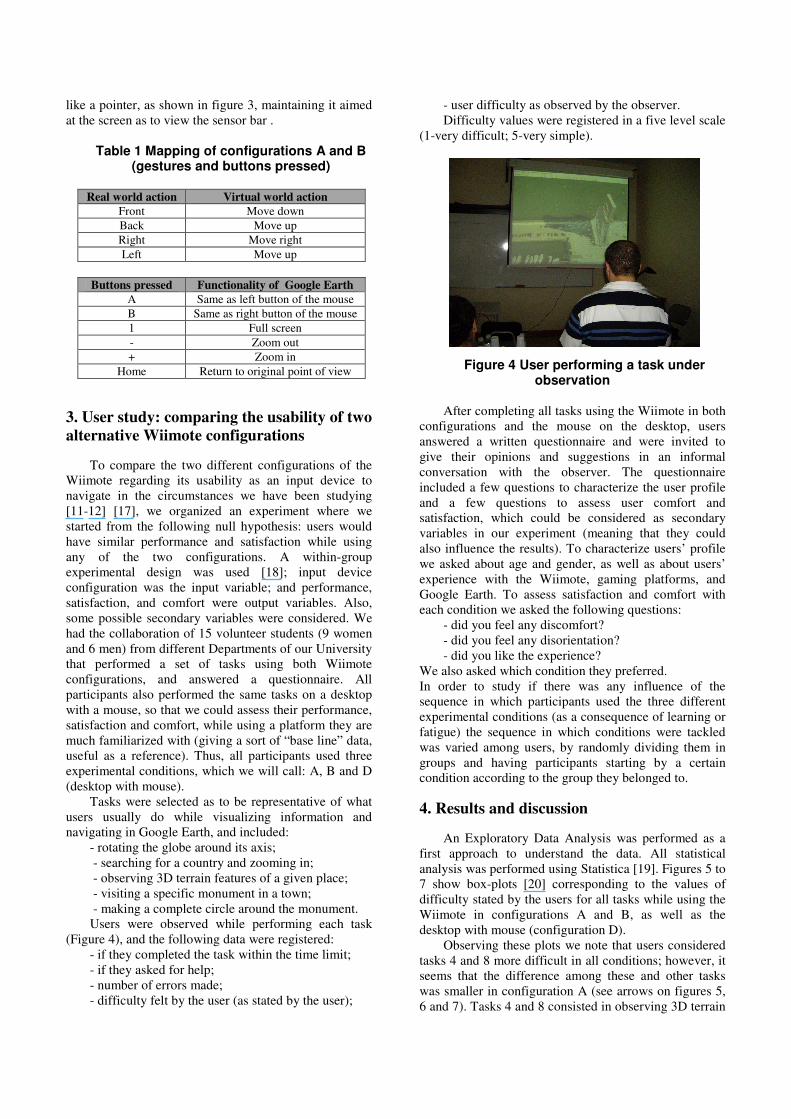
- rotating the globe around its axis; - searching for a country and zooming in; - observing 3D terrain features of a given place; - visiting a specific monument in a town; - making a complete circle around the monument. Users were observed while performing each task
(Figure 4), and the following data were registered: - if they completed the task within the time limit; - if they asked for help; - number of errors made; - difficulty felt by the user (as stated by the user);
- user difficulty as observed by the observer. Difficulty values were registered in a five level scale
(1-very difficult; 5-very simple).
Figure 4 User performing a task under observation
After completing all tasks using the Wiimote in both
configurations and the mouse on the desktop, users answered a written questionnaire and were invited to give their opinions and suggestions in an informal conversation with the observer. The questionnaire included a few questions to characterize the user profile and a few questions to assess user comfort and satisfaction, which could be considered as secondary variables in our experiment (meaning that they could also influence the results). To characterize users’ profile we asked about age and gender, as well as about users’ experience with the Wiimote, gaming platforms, and Google Earth. To assess satisfaction and comfort with each condition we asked the following questions:
- did you feel any discomfort? - did you feel any disorientation? - did you like the experience?
We also asked which condition they preferred. In order to study if there was any influence of the sequence in which participants used the three different experimental conditions (as a consequence of learning or fatigue) the sequence in which conditions were tackled was varied among users, by randomly dividing them in groups and having participants starting by a certain condition according to the group they belonged to.
4. Results and discussion
An Exploratory Data Analysis was performed as a first approach to understand the data. All statistical analysis was performed using Statistica [19]. Figures 5 to 7 show box-plots [20] corresponding to the values of difficulty stated by the users for all tasks while using the Wiimote in configurations A and B, as well as the desktop with mouse (configuration D).
Observing these plots we note that users considered tasks 4 and 8 more difficult in all conditions; however, it seems that the difference among these and other tasks was smaller in configuration A (see arrows on figures 5, 6 and 7). Tasks 4 and 8 consisted in observing 3D terrain
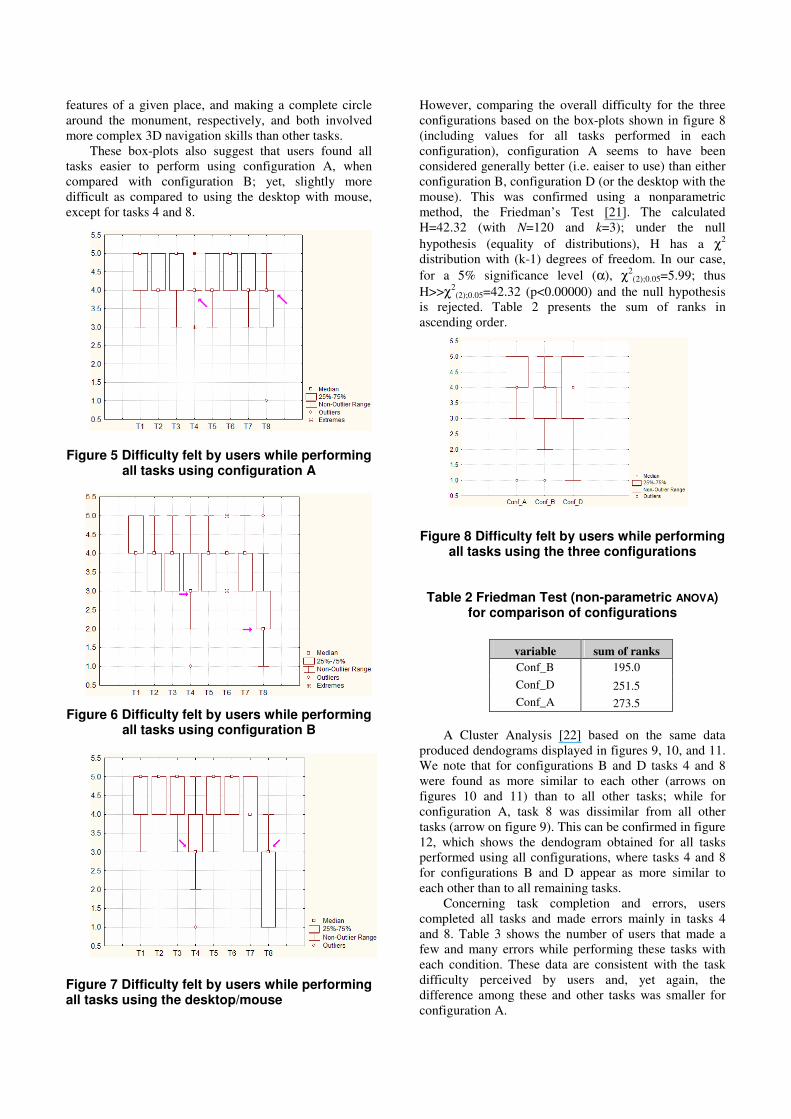
features of a given place, and making a complete circle around the monument, respectively, and both involved more complex 3D navigation skills than other tasks.
These box-plots also suggest that users found all tasks easier to perform using configuration A, when compared with configuration B; yet, slightly more difficult as compared to using the desktop with mouse, except for tasks 4 and 8.
Figure 5 Difficulty felt by users while performing all tasks using configuration A
Figure 6 Difficulty felt by users while performing
all tasks using configuration B
Figure 7 Difficulty felt by users while performing all tasks using the desktop/mouse
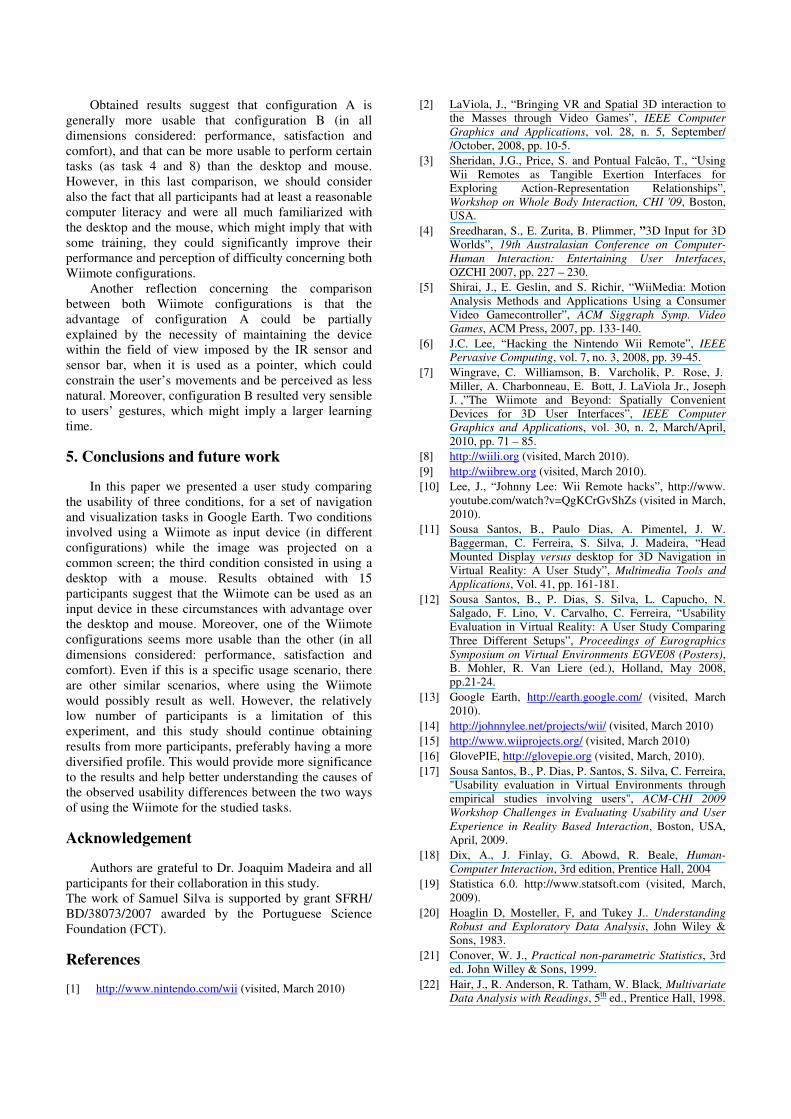
However, comparing the overall difficulty for the three configurations based on the box-plots shown in figure 8 (including values for all tasks performed in each configuration), configuration A seems to have been considered generally better (i.e. eaiser to use) than either configuration B, configuration D (or the desktop with the mouse). This was confirmed using a nonparametric method, the Friedman’s Test [21]. The calculated H=42.32 (with N=120 and k=3); under the null hypothesis (equality of distributions), H has a χ2 distribution with (k-1) degrees of freedom. In our case, for a 5% significance level (α), χ2
(2);0.05=5.99; thus H>>χ2
(2);0.05=42.32 (p<0.00000) and the null hypothesis is rejected. Table 2 presents the sum of ranks in ascending order.
Figure 8 Difficulty felt by users while performing
all tasks using the three configurations
Table 2 Friedman Test (non-parametric ANOVA)
for comparison of configurations
A Cluster Analysis [22] based on the same data
produced dendograms displayed in figures 9, 10, and 11. We note that for configurations B and D tasks 4 and 8 were found as more similar to each other (arrows on figures 10 and 11) than to all other tasks; while for configuration A, task 8 was dissimilar from all other tasks (arrow on figure 9). This can be confirmed in figure 12, which shows the dendogram obtained for all tasks performed using all configurations, where tasks 4 and 8 for configurations B and D appear as more similar to each other than to all remaining tasks.
Concerning task completion and errors, users completed all tasks and made errors mainly in tasks 4 and 8. Table 3 shows the number of users that made a few and many errors while performing these tasks with each condition. These data are consistent with the task difficulty perceived by users and, yet again, the difference among these and other tasks was smaller for configuration A.
variable sum of ranks Conf_B 195.0 Conf_D 251.5 Conf_A 273.5

Figure 9 Dendogram showing similarity among tasks based on the difficulty felt by users while
using configuration A
Figure 10 Dendogram showing similarity among tasks based on the difficulty felt by users while using configuration B
Figure 11 Dendogram showing similarity among tasks based on the difficulty felt by
users while using the desktop/mouse
Figure 12 Dendogram showing similarity among tasks based on the difficulty felt by
users for all configurations
Table 3 Number of users that made a few and some errors in each condition while performing
tasks 4 and 8
Tables 4 to 6 show comfort data obtained for all
experimental conditions, fro 14 users. Observing these tables we note that more users felt discomfort or disorientation while using configuration B; however, more users stated that they had liked the experience a lot as compared with the desktop and mouse. Perhaps the novelty of the Wiimote has balanced any discomfort users might have felt while using it.
Also concerning preferences, configuration A seems to have a large advantage over configuration B and the desktop and mouse. In fact, 11 participants preferred configuration A, two preferred configuration B, and two preferred the mouse and desktop. Moreover, this preference seems independent of the sequence in which participants had used the three configurations. This general preference by configuration A may be related, on one hand, to the seemingly lesser difficulty to complete the tasks, as well as less discomfort and disorientation as compared with configuration B, and on the other hand, to the novelty of the Wiimote and adequacy to more complex 3D tasks, as compared with the desktop with mouse.
Table 4 Comfort data: configuration A
Table 5 Comfort data: configuration B
Table 6 Comfort data: desktop/mouse
Desktop/mouse Conf_ A Conf_B
Errors/ Task
few many few many few many
4 10 0 2 0 7 2 8 4 9 4 0 8 4
Conf_A �� no slightly a lot
Did you feel discomfort? 13 2 0 Did you feel disorientation? 9 6 0
Did you like? 0 1 14
Conf_ B �� no slightly a lot
Did you feel discomfort? 8 5 2 Did you feel disorientation? 7 5 3
Did you like? 0 1 14
Desktop/mouse �� no slightly a lot
Did you feel discomfort? 13 1 0 Did you feel disorientation? 11 3 0
Did you like? 2 3 10
Obtained results suggest that configuration A is generally more usable that configuration B (in all dimensions considered: performance, satisfaction and comfort), and that can be more usable to perform certain tasks (as task 4 and 8) than the desktop and mouse. However, in this last comparison, we should consider also the fact that all participants had at least a reasonable computer literacy and were all much familiarized with the desktop and the mouse, which might imply that with some training, they could significantly improve their performance and perception of difficulty concerning both Wiimote configurations.
Another reflection concerning the comparison between both Wiimote configurations is that the advantage of configuration A could be partially explained by the necessity of maintaining the device within the field of view imposed by the IR sensor and sensor bar, when it is used as a pointer, which could constrain the user’s movements and be perceived as less natural. Moreover, configuration B resulted very sensible to users’ gestures, which might imply a larger learning time.
5. Conclusions and future work
In this paper we presented a user study comparing the usability of three conditions, for a set of navigation and visualization tasks in Google Earth. Two conditions involved using a Wiimote as input device (in different configurations) while the image was projected on a common screen; the third condition consisted in using a desktop with a mouse. Results obtained with 15 participants suggest that the Wiimote can be used as an input device in these circumstances with advantage over the desktop and mouse. Moreover, one of the Wiimote configurations seems more usable than the other (in all dimensions considered: performance, satisfaction and comfort). Even if this is a specific usage scenario, there are other similar scenarios, where using the Wiimote would possibly result as well. However, the relatively low number of participants is a limitation of this experiment, and this study should continue obtaining results from more participants, preferably having a more diversified profile. This would provide more significance to the results and help better understanding the causes of the observed usability differences between the two ways of using the Wiimote for the studied tasks.
Acknowledgement
Authors are grateful to Dr. Joaquim Madeira and all participants for their collaboration in this study. The work of Samuel Silva is supported by grant SFRH/ BD/38073/2007 awarded by the Portuguese Science Foundation (FCT).
References
[1] http://www.nintendo.com/wii (visited, March 2010)
[2] LaViola, J., “Bringing VR and Spatial 3D interaction to the Masses through Video Games”, IEEE Computer Graphics and Applications, vol. 28, n. 5, September/ /October, 2008, pp. 10-5.
[3] Sheridan, J.G., Price, S. and Pontual Falcão, T., “Using Wii Remotes as Tangible Exertion Interfaces for Exploring Action-Representation Relationships”, Workshop on Whole Body Interaction, CHI '09, Boston, USA.
[4] Sreedharan, S., E. Zurita, B. Plimmer, ”3D Input for 3D Worlds”, 19th Australasian Conference on Computer-Human Interaction: Entertaining User Interfaces, OZCHI 2007, pp. 227 – 230.
[5] Shirai, J., E. Geslin, and S. Richir, “WiiMedia: Motion Analysis Methods and Applications Using a Consumer Video Gamecontroller”, ACM Siggraph Symp. Video Games, ACM Press, 2007, pp. 133-140.
[6] J.C. Lee, “Hacking the Nintendo Wii Remote”, IEEE Pervasive Computing, vol. 7, no. 3, 2008, pp. 39-45.
[7] Wingrave, C. Williamson, B. Varcholik, P. Rose, J. Miller, A. Charbonneau, E. Bott, J. LaViola Jr., Joseph J. ,”The Wiimote and Beyond: Spatially Convenient Devices for 3D User Interfaces”, IEEE Computer Graphics and Applications, vol. 30, n. 2, March/April, 2010, pp. 71 – 85.
[8] http://wiili.org (visited, March 2010). [9] http://wiibrew.org (visited, March 2010). [10] Lee, J., “Johnny Lee: Wii Remote hacks”, http://www.
youtube.com/watch?v=QgKCrGvShZs (visited in March, 2010).
[11] Sousa Santos, B., Paulo Dias, A. Pimentel, J. W. Baggerman, C. Ferreira, S. Silva, J. Madeira, “Head Mounted Display versus desktop for 3D Navigation in Virtual Reality: A User Study”, Multimedia Tools and Applications, Vol. 41, pp. 161-181.
[12] Sousa Santos, B., P. Dias, S. Silva, L. Capucho, N. Salgado, F. Lino, V. Carvalho, C. Ferreira, “Usability Evaluation in Virtual Reality: A User Study Comparing Three Different Setups”, Proceedings of Eurographics Symposium on Virtual Environments EGVE08 (Posters), B. Mohler, R. Van Liere (ed.), Holland, May 2008, pp.21-24.
[13] Google Earth, http://earth.google.com/ (visited, March 2010).
[14] http://johnnylee.net/projects/wii/ (visited, March 2010) [15] http://www.wiiprojects.org/ (visited, March 2010) [16] GlovePIE, http://glovepie.org (visited, March, 2010). [17] Sousa Santos, B., P. Dias, P. Santos, S. Silva, C. Ferreira,
"Usability evaluation in Virtual Environments through empirical studies involving users", ACM-CHI 2009 Workshop Challenges in Evaluating Usability and User Experience in Reality Based Interaction, Boston, USA, April, 2009.
[18] Dix, A., J. Finlay, G. Abowd, R. Beale, Human-Computer Interaction, 3rd edition, Prentice Hall, 2004
[19] Statistica 6.0. http://www.statsoft.com (visited, March, 2009).
[20] Hoaglin D, Mosteller, F, and Tukey J.. Understanding Robust and Exploratory Data Analysis, John Wiley & Sons, 1983.
[21] Conover, W. J., Practical non-parametric Statistics, 3rd ed. John Willey & Sons, 1999.
[22] Hair, J., R. Anderson, R. Tatham, W. Black, Multivariate Data Analysis with Readings, 5th ed., Prentice Hall, 1998.