White Matter Microstructure in Superior Longitudinal Fasciculus Associated with Spatial Working...
13
Uncorrected Proof White Matter Microstructure in Superior Longitudinal Fasciculus Associated with Spatial Working Memory Performance in Children Martin Vestergaard 1 * , Kathrine Skak Madsen 1,2,3 * , William F. C. Baaré 1,2 , Arnold Skimminge 1 , Lisser Rye Ejersbo 4 , Thomas Z. Ramsøy 1,3,5 , Christian Gerlach 4 , Per Åkeson 1 , Olaf B. Paulson 1,2,3,6 , and Terry L. Jernigan 1,2,3,7 Abstract ■ During childhood and adolescence, ongoing white matter maturation in the fronto-parietal cortices and connecting fiber tracts is measurable with diffusion-weighted imaging. Important questions remain, however, about the links between these changes and developing cognitive functions. Spatial working memory (SWM) performance improves significantly throughout the childhood years, and several lines of evidence implicate the left fronto-parietal cortices and connecting fiber tracts in SWM processing. Here we report results from a study of 76 typically developing children, 7 to 13 years of age. We hypothesized that better SWM performance would be associated with increased fractional anisotropy (FA) in a left fronto-parietal network com- posed of the superior longitudinal fasciculus (SLF), the regional white matter underlying the dorsolateral pFC, and the posterior parietal cortex. As hypothesized, we observed a significant as- sociation between higher FA in the left fronto-parietal network and better SWM skills, and the effect was independent of age. This association was mainly accounted for by variability in left SLF FA and remained significant when FA measures from global fiber tracts or right SLF were included in the model. Further, the effect of FA in left SLF appeared to be mediated primarily by decreasing perpendicular diffusivity. Such associations could be related to individual differences among children in the archi- tecture of fronto-parietal connections and/or to differences in the pace of fiber tract development. Further studies are needed to determine the contributions of intrinsic and experiential fac- tors to the development of functionally significant individual differences in fiber tract structure. ■ INTRODUCTION Spatial working memory (SWM) capacity develops through- out childhood and adolescence (Conklin, Luciana, Hooper, & Yarger, 2007; De Luca et al., 2003). Working memory is the ability to maintain and manipulate information relevant for the task at hand (Baddeley, 1981). Executive functions like working memory are considered essential for perform- ing goal-oriented behaviors, and SWM deficits have been associated with behavioral disorders in children such as autism and attention deficit/hyperactivity disorder (ADHD) (Corbett, Constantine, Hendren, Rocke, & Ozonoff, 2009; Goldberg et al., 2005; Westerberg, Hirvikoski, Forssberg, & Klingberg, 2004). Studies of SWM have consistently im- plicated several brain regions as contributing to on-line maintenance and manipulation of spatial information. The dorsolateral pFC (DLPFC) and the posterior parietal cortex (PPC) have been linked to SWM functions (Van Asselen et al., 2006; Koch et al., 2005; Klingberg, Forssberg, & Westerberg, 2002). Lesions applied to the pFC (princi- pal sulcus) in the macaque monkey cause profound deterioration of SWM performance (Funahashi, Bruce, & Goldmanrakic, 1993; Goldman & Rosvold, 1970). In human patients, SWM deficits have been associated with frontal lesions in the right (Van Asselen et al., 2006; Owen, Morris, Sahakian, Polkey, & Robbins, 1996) and the left hemisphere (du Boisgueheneuc et al., 2006; Owen et al., 1996). TMS studies have shown that stimulation of DLPFC and PPC in either the right or the left hemisphere disrupts SWM performance (Koch et al., 2005; Oliveri et al., 2001; Muri et al., 2000). These findings have been corroborated by single cell recordings in rhesus monkeys, demonstrating that SWM performance is related to electrophysiological activity in the principal sulcus (DLPFC) and PPC (Takeda & Funahashi, 2007; Chafee & Goldman-Rakic, 1998) and that the pattern of task-related activity in the principal sul- cus matches that in the PPC during performance of an 1 Copenhagen University Hospital, Hvidovre, Denmark, 2 Center for Integrated Molecular Brain Imaging, Copenhagen, Denmark, 3 University of Copenhagen, Denmark, 4 University of Aarhus, Copenhagen, Denmark, 5 Copenhagen Business School, Denmark, 6 Copenhagen University Hospital, Rigshospitalet, Denmark, 7 Uni- versity of California, San Diego *These authors have contributed equally to this work. © Massachusetts Institute of Technology Journal of Cognitive Neuroscience X:Y, pp. 1–12
-
Upload
independent -
Category
Documents
-
view
0 -
download
0
Transcript of White Matter Microstructure in Superior Longitudinal Fasciculus Associated with Spatial Working...
UncorrectedProof
White Matter Microstructure in Superior LongitudinalFasciculus Associated with Spatial Working Memory
Performance in Children
Martin Vestergaard1*, Kathrine SkakMadsen1,2,3*, William F. C. Baaré1,2,Arnold Skimminge1, Lisser Rye Ejersbo4, Thomas Z. Ramsøy1,3,5,
Christian Gerlach4, Per Åkeson1, Olaf B. Paulson1,2,3,6,and Terry L. Jernigan1,2,3,7
Abstract
! During childhood and adolescence, ongoing white mattermaturation in the fronto-parietal cortices and connecting fibertracts is measurable with diffusion-weighted imaging. Importantquestions remain, however, about the links between thesechanges and developing cognitive functions. Spatial workingmemory (SWM) performance improves significantly throughoutthe childhood years, and several lines of evidence implicate theleft fronto-parietal cortices and connecting fiber tracts in SWMprocessing. Here we report results from a study of 76 typicallydeveloping children, 7 to 13 years of age. We hypothesized thatbetter SWM performance would be associated with increasedfractional anisotropy (FA) in a left fronto-parietal network com-posed of the superior longitudinal fasciculus (SLF), the regionalwhite matter underlying the dorsolateral pFC, and the posterior
parietal cortex. As hypothesized, we observed a significant as-sociation between higher FA in the left fronto-parietal networkand better SWM skills, and the effect was independent of age.This association was mainly accounted for by variability in leftSLF FA and remained significant when FA measures from globalfiber tracts or right SLF were included in the model. Further,the effect of FA in left SLF appeared to be mediated primarilyby decreasing perpendicular diffusivity. Such associations couldbe related to individual differences among children in the archi-tecture of fronto-parietal connections and/or to differences inthe pace of fiber tract development. Further studies are neededto determine the contributions of intrinsic and experiential fac-tors to the development of functionally significant individualdifferences in fiber tract structure. !
INTRODUCTION
Spatial working memory (SWM) capacity develops through-out childhood and adolescence (Conklin, Luciana, Hooper,& Yarger, 2007; De Luca et al., 2003). Working memory isthe ability to maintain and manipulate information relevantfor the task at hand (Baddeley, 1981). Executive functionslike working memory are considered essential for perform-ing goal-oriented behaviors, and SWM deficits have beenassociated with behavioral disorders in children such asautism and attention deficit/hyperactivity disorder (ADHD)(Corbett, Constantine, Hendren, Rocke, & Ozonoff, 2009;Goldberg et al., 2005; Westerberg, Hirvikoski, Forssberg,& Klingberg, 2004). Studies of SWM have consistently im-plicated several brain regions as contributing to on-line
maintenance and manipulation of spatial information. Thedorsolateral pFC (DLPFC) and the posterior parietal cortex(PPC) have been linked to SWM functions (Van Asselenet al., 2006; Koch et al., 2005; Klingberg, Forssberg,& Westerberg, 2002). Lesions applied to the pFC (princi-pal sulcus) in the macaque monkey cause profounddeterioration of SWM performance (Funahashi, Bruce, &Goldmanrakic, 1993; Goldman & Rosvold, 1970). In humanpatients, SWM deficits have been associated with frontallesions in the right (Van Asselen et al., 2006; Owen, Morris,Sahakian, Polkey, & Robbins, 1996) and the left hemisphere(du Boisgueheneuc et al., 2006; Owen et al., 1996). TMSstudies have shown that stimulation of DLPFC and PPCin either the right or the left hemisphere disrupts SWMperformance (Koch et al., 2005; Oliveri et al., 2001; Muriet al., 2000). These findings have been corroborated bysingle cell recordings in rhesus monkeys, demonstratingthat SWM performance is related to electrophysiologicalactivity in the principal sulcus (DLPFC) and PPC (Takeda& Funahashi, 2007; Chafee & Goldman-Rakic, 1998) andthat the pattern of task-related activity in the principal sul-cus matches that in the PPC during performance of an
1Copenhagen University Hospital, Hvidovre, Denmark, 2Centerfor Integrated Molecular Brain Imaging, Copenhagen, Denmark,3University of Copenhagen, Denmark, 4University of Aarhus,Copenhagen, Denmark, 5Copenhagen Business School, Denmark,6Copenhagen University Hospital, Rigshospitalet, Denmark, 7Uni-versity of California, San Diego*These authors have contributed equally to this work.
© Massachusetts Institute of Technology Journal of Cognitive Neuroscience X:Y, pp. 1–12
UncorrectedProof
SWM task (Chafee & Goldman-Rakic, 1998). Moreover,numerous fMRI and PET studies have revealed activationfoci in prefrontal areas and PPC during SWM performance.The activation foci in prefrontal regions have been observedin both right and left DLPFC, and whether SWM is lateral-ized remains an issue of debate (Lycke, Specht, Ersland, &Hugdahl, 2008; Srimal & Curtis, 2008; Leung, Oh, Ferri, &Yi, 2007; Owen, McMillan, Laird, & Bullmore, 2005). Overall,the findings suggest that functions of DLPFC and PPC areimportant for SWM functioning. Studies of the rhesus mon-key cortex confirm that the DLPFC and PPC have recip-rocal connections within the major axon bundle of thesuperior longitudinal fasciculus (SLF) (Petrides & Pandya,2006; Cavada & Goldman-Rakic, 1991).
Structural MRI studies have revealed gradual increasesof white matter volume and apparent thinning of cortexduring childhood and adolescence. Both gray and whitematter exhibit protracted trajectories of developmentalchange that vary across different cerebral regions. Amongthe latest developing regions are portions of parietal andpFC (Sowell et al., 2004; Sowell, Trauner, Gamst, & Jernigan,2002; Paus et al., 2001; Giedd et al., 1999; Jernigan, Trauner,Hesselink, & Tallal, 1991), and ongoing myelination ofconnecting fiber tracts between these regions is likely torelate to these cortical changes. However, conventionalstructural MRI provides only limited information aboutfiber tract structure.
Age-related change in microstructure of white matterduring childhood and adolescence is measurable usingdiffusion tensor imaging (DTI) (Lebel, Walker, Leemans,Phillips, & Beaulieu, 2008; Eluvathingal, Hasan, Kramer,Fletcher, & Ewing-Cobbs, 2007; Snook, Paulson, Roy,Phillips, & Beaulieu, 2005). DTI measures properties ofthe diffusion of water in the brain. Within white matter,the axonal membrane and the surrounding myelin hinderdiffusion perpendicular to the fiber tracts relative to dif-fusion parallel to the tracts, causing anisotropic diffusion(Beaulieu, 2002). Fractional anisotropy (FA) is a measureof the degree of elongation of the diffusion tensor (Basser,Mattiello, & LeBihan, 1994). FA, perpendicular diffusivity(!!), and parallel diffusivity (!") are estimated by fittingthe diffusion measurements of each voxel to the diffusiontensor model (Beaulieu, 2002; Basser et al., 1994). DTIstudies in young children have consistently shown age-related increases in FA associated with a disproportionatedecrease in !! relative to !", possibly related to ongoingmyelination and increases in fiber density (Lebel et al.,2008; Eluvathingal et al., 2007; Snook et al., 2005). Further-more, FA measures from different white matter fiber tractsexhibit variable developmental trajectories (Lebel et al.,2008), with FA in some approaching adult levels earlyand others not until after adolescence.
The relationship between age-related changes in themicrostructural properties of white matter and the con-current development of cognitive functions in children isstill poorly understood, although a few studies suggestassociations between FA values in white matter and per-
formance on cognitive tasks (Madsen et al., 2010; Niogi& McCandliss, 2006; Nagy, Westerberg, & Klingberg,2004). To date, one research group has examined asso-ciations between white matter FA and SWM performancein children and adolescents. Nagy et al. (2004) studied23 children between 7 and 18 years of age, with an SWMtask that required the children to remember the positionsin a 4 ! 4 spatial grid of sequences of red circles. DTIimages were analyzed using a voxel-based analysis to iden-tify regions exhibiting an association between FA and SWMperformance. The investigators found that better SWMperformance was correlated with increased FA values in aleft inferior frontal cluster and a left fronto-parietal cluster;however, after adjusting for age, only the left inferior fron-tal cluster remained significant. Furthermore, in the samegroup of children, the variability in FA in the left fronto-parietal cluster that exhibited a relationship to SWM per-formance was also positively correlated with SWM-relatedfMRI activity in the left inferior parietal lobe and left supe-rior frontal sulcus (Olesen, Nagy, Westerberg, & Klingberg,2003). Interestingly, in one fMRI study of adolescents, age-related increases in SWM-related brain activation were ob-served in left prefrontal areas as well as in bilateral posteriorparietal areas (Schweinsburg, Nagel, & Tapert, 2005).In summary, there is strong evidence to implicate DLPFC
and PPC in SWM functions, and DTI studies have shownthat during childhood and adolescence, FA increases canbe observed in the SLF, the major fiber tract connectingthese areas (Lebel et al., 2008). SWM functions show age-related improvement across childhood and adolescence(Conklin et al., 2007), and limited evidence available froma study of children and adolescents suggests that FA varia-bility in fronto-parietal white matter regions of the lefthemisphere is associated with variability among childrenin their SWM skills. Because SWM performance and FA inwhite matter tracts are both known to increase with age inchildren, such associations between these two measureswithin a group of children of different ages could arise sim-ply because of their association with chronological age.Indeed, in the study by Nagy et al. (2004), some of theassociations between FA and SWM performance were sub-stantially reduced when age was controlled. Of course, thiscould indicate that age-related increase in FA has a directrelationship with developing SWM functions, and thus con-trolling for age reduces the correlation. However, it couldalso indicate that factors not causally linked to chronologi-cal age, for example, years practicing SWM skills, mediatethe apparent relationship between FA and SWM perfor-mance. In other studies of school-aged children, clear evi-dence has emerged for relationships between white matterFA and behavioral differences (e.g., on reading, verbalworking memory, and inhibitory tasks) that remained aftercontrolling for the age of the children (Madsen et al., 2010;Niogi & McCandliss, 2006). These associations suggest thatthe structure of brain fiber tracts may be related to indi-vidual differences among children that occur even amongchildren of similar age and may either be related to stable
2 Journal of Cognitive Neuroscience Volume X, Number Y
UncorrectedProof
differences in neural architecture or to differences in theage trajectories of biological maturation of fiber tracts.In the present study, we were interested in the degree
to which FA variability in a fronto-parietal network consist-ing of SLF, DLPFC, and PPC could be linked to individualdifferences in SWM performance within a large group of76 typically developing children between the ages of 7and 13 years. Given the consistent evidence from earlierstudies of SWM in children and adolescents that a left-sided neural system is implicated in the development ofSWM skills, we hypothesized that FA in the left hemi-sphere SLF and in the white matter underlying the DLPFCand the PPC would account for significant variability inSWM performance, after accounting for any associationmediated by chronological age. Follow-up analyses wereplanned to estimate the relative contributions of the threeROI measures to the prediction of SWM performance andto further examine the anatomical specificity of the effectsby including as covariates either an estimate of globalwhite matter FA or an FA in the corresponding right hemi-sphere ROI. The parallel and perpendicular diffusivitieswere also examined to further explore the nature of sig-nificant associations with FA.
METHODSSubjects
Ninety-two typically developing children aged 7 to 13 years(mean± SD: age = 10.0 ± 1.7 years, 53 girls, 39 boys) fromthree schools (first to sixth graders) in the Copenhagenarea participated in the study. All children assented tothe procedures, and informed written consent was ob-tained from the parents/guardians of all subjects beforeparticipation after oral and written explanation of the studyaims and study procedures. The study was approved bythe local Danish Committee for Biomedical Research Ethics(H-KF-01-131/03) and conducted in accordance with theDeclaration of Helsinki. Sixteen of the participating sub-jects (9 girls, 7 boys) were subsequently excluded as de-scribed in the Image evaluation section. Thus, 76 subjectswere included in the analyses reported here (mean ± SD:age = 10.1 ± 1.6 years, 44 girls, 32 boys). According to par-ent reports, no subjects had any known history of neuro-logical or psychiatric disorders or significant brain injury.
There were no significant differences between the in-cluded and the excluded subjects on age, gender, parentaleducation, or handedness (as assessed with the EdinburghHandedness Inventory). Demographic data from the in-cluded subjects are presented in Table 1.
SWM Task
SWM was assessed using the Cambridge Neuropsychologi-cal Test Automated Battery (CANTAB; Cambridge Cogni-tion Ltd., Cambridge, UK). The CANTAB SWM task iscomputerized and was administered using a Pacebladetouch screen computer. Subjects are shown a display con-taining N colored boxes and told that a blue token ishidden inside one of the boxes. Subjects must find thehidden token by touching the boxes until the token islocated. The subject then moves the blue token to a col-umn to the right of the display and must start a new searchof the same array of boxes for a token now hidden in oneof the previously empty boxes. This continues until a bluetoken has been located in each of the boxes (positions).The number of boxes in the array is then gradually in-creased from three to eight boxes. The trials containingonly three boxes are used as control trials. The color andthe position of the boxes vary from trial to trial to dis-courage the use of stereotyped search strategies. The pri-mary behavioral outcome measure is the “between-errors”score, which is a measure of the number of times thesubject returns to a box in which a blue token has alreadybeen located during that trial.
Image Acquisition
All subjects were scanned using a 3-T Siemens MagnetomTrio MR scanner (Siemens, Erlangen, Germany) with aneight-channel head coil (Invivo, Orlando, FL). Subjectswere scanned the same day as SWM was assessed. All scanswere acquired aligned parallel to the AC–PC line. Diffusion-weighted (DW) images of the whole brain were acquiredusing a twice-refocused balanced spin echo sequence thatminimized eddy current distortion (Reese, Heid, Weisskoff,& Wedeen, 2003). Ten non-DW images (b= 0) and 61 DWimages, encoded along independent collinear diffusion gra-dient orientations (Cook et al., 2006; Jansons & Alexander,
Table 1. Demographic Data for the Included Subjects
First/Second Graders Third/Fourth Graders Fifth/Sixth Graders All Subjects
Age (mean ± SD) 8.2 ± 0.5 10.1 ± 0.4 12.2 ± 0.4 10.1 ± 1.6
Gender (female/male) 14/10 16/13 14/9 44/32
Handedness (right/left) 21/3 24/5 21/2 66/10
Parents! average years of education (mean ± SD) 14.0 ± 1.7 13.4 ± 2.0 13.7 ± 2.0 13.7 ± 1.9
Children enrolled in the study were scanned either in the months just before (when in first, third, or fifth grade) or just after (when in second, fourth,or sixth grade) the summer school holiday.
Vestergaard et al. 3
UncorrectedProof
2003), were acquired with a b value of 1200 s/mm2 (repeti-tion time [TR] = 8200 msec, echo time [TE] = 100 msec,field of view [FOV] = 220 ! 220 mm2, matrix = 96 ! 96,GRAPPA: acceleration factor = 2, number of referencelines = 48, 61 perpendicular slices with no gap, 2.3 !2.3 ! 2.3 mm3 voxels, NEX = 1, acquisition time =9.50 min). A gradient-echo-based field map sequence(TR=530msec, TE[1]= 5.19msec and TE[2]= 7.65msec,FOV = 256 ! 256 mm2, matrix = 128 ! 128, 47 perpen-dicular slices with no gap, voxel size = 2 ! 2 ! 3 mm3,NEX = 1, acquisition time = 2.18 min) was acquiredto correct geometric distortions caused by B0 magneticfield inhomogeneities. T2-weighted images of the wholehead were acquired using a 3-D turbo spin echo sequence(TR = 3000 msec, TE = 354 msec, FOV = 282! 216 mm2,matrix = 256 ! 196, 192 sagittal slices, 1.1 mm3 isotropicvoxels, NEX=1, acquisition time=8.29min) for generatingbrain masks.
Image Evaluation
All subjects! images were screened for neurological anom-alies by an experienced neuroradiologist. Before imageanalysis and blind to behavioral data, the raw images fromall subjects were visually checked to ascertain the qualityof the data. As described earlier, on the basis of this in-spection, 1 subject with incidental neurological findings,3 subjects not completing the scanning session, and 12 sub-jects with significantly reduced image quality due to move-ment or susceptibility artifacts were excluded from furtheranalysis.
Image Analysis
Images were preprocessed using pipelines implementedin Matlab, using mainly SPM5 routines. DW images wereoriented to the Montreal Neurological Institute (MNI) co-ordinate system and corrected for geometric distortionsbecause of B0 inhomogeneities and imaging gradient non-linearities. At first, the mean B0 image was coregisteredto the T2-weighted image using a rigid transformation(six-parameter mutual information), after which all DWimages were coregistered (no reslicing) to the mean B0image. Next, all coregistered images were corrected forgeometric distortion using both the acquired B0 fieldmap (Andersson, Hutton, Ashburner, Turner, & Friston,2001) and the scanner-specific maps of gradient nonlinear-ities ( Jovicich et al., 2006). All images were resliced usingtrilinear interpolation. Note that this procedure involvesonly one interpolation step. The diffusion gradient orien-tations were adjusted to account for any rotation appliedduring registration. The diffusion tensor was fitted usingthe RESTORE algorithm with a noise standard deviationof 30 (Chang, Jones, & Pierpaoli, 2005) implemented inCamino (Cook et al., 2006), and FA and diffusivity parallel(!" = !1) and perpendicular (!! = (!2 + !3) / 2) to theprincipal diffusion direction were calculated. A brain mask
on the basis of the T2-weighted image was automaticallycreated using SPM5 segmentation routines and morphol-ogical operations and applied to the FA and diffusivityimages.
Intersubject Spatial Normalization of Fiber Tracts
In the present study, we extracted FA and diffusivity mea-sures from specific ROIs for each subject to test our hy-potheses. Spatial normalization and alignment of fibertracts across children were achieved by means of thetract-based spatial statistics (TBSS) module (Smith et al.,2006), part of FSL 4.1.0 (Smith et al., 2004). At first,subjects! FA images were aligned into a common spaceusing the nonlinear registration tool FNIRT (Andersson,Jenkinson, & Smith, 2007). A study-specific target, thegroup!s most representative FA image, was then identifiedafter nonlinearly registering each subject!s FA image toevery other subject!s FA image. Next, the target FA imagewas aligned to MNI space using affine registration, andsubsequently the entire aligned data set was transformedinto 1 mm3 MNI space. After this, a cross-subject meanFA image was created and thinned to create a study-specificmean FA skeleton, representing the centers of all tractscommon to the group. The mean FA skeleton was thresh-olded at FA > 0.25 and contained 103,588 1 mm3 inter-polated isotropic voxels, corresponding to approximatelyone quarter of the voxels with FA greater than 0.25. Eachsubject!s aligned FA image was then projected onto themean skeleton by locating the highest local FA value inthe direction perpendicular to the skeleton tracts and byassigning this value to the subject!s skeleton. In addi-tion, the nonlinear warps and the skeleton projectionswere applied to the !" and !! data. Further, to generatea color-coded target FAmap, the affine transformation gen-erated when aligning the target FA image to MNI spacewas applied to the target!s primary eigenvector (v1) im-age using the vecreg command in FSL.
Regions of Interest
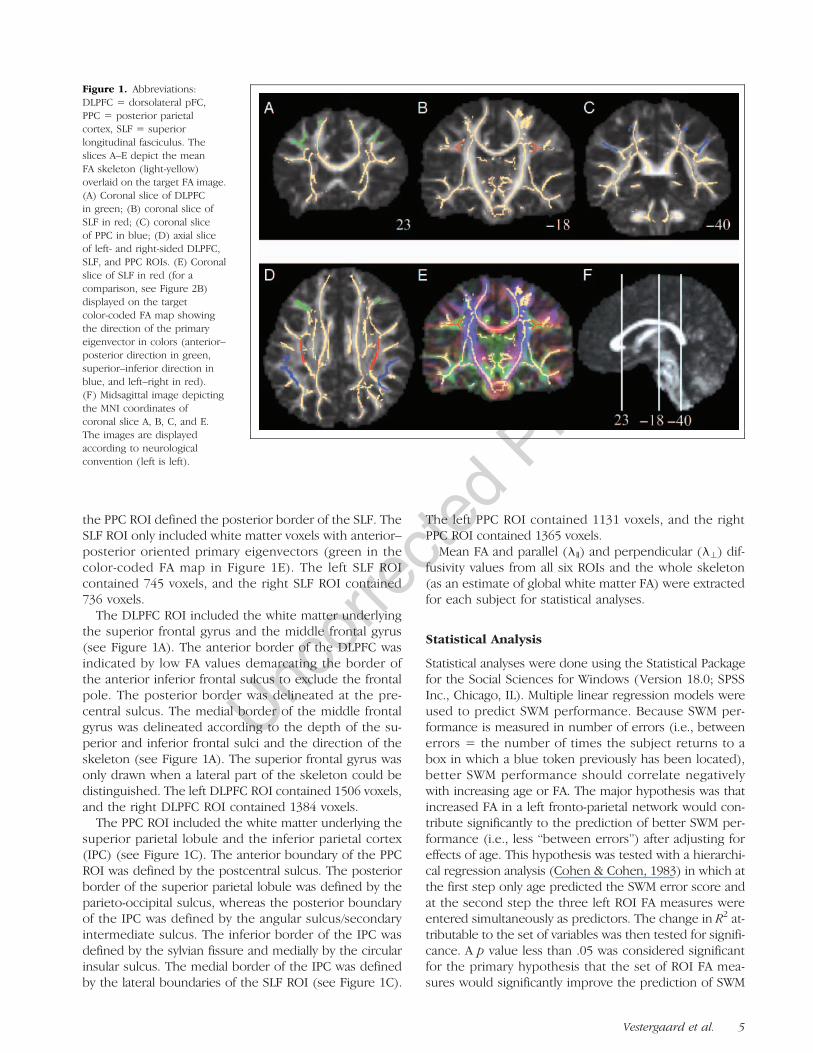
ROIs were drawn onto a representation of the study-specificmean FA skeleton overlaid on the “study-representative”FA map. SLF, DLPFC, and PPC ROIs for the hypothesis testswere drawn in the left hemisphere and, for post hoc analy-ses, also in the right hemisphere (see Figure 1D). The bor-ders of the DLPFC and PPC ROIs were located using ahuman brain atlas (Duvernoy, 1999) and were drawn usinganatomical information visible in the study-specific targetFA map. The SLF ROI was drawn using the target!s color-coded FA map and was defined in accordance with theMRI Atlas of Human White Matter (Mori, Wakana, Nagae-Poetscher, & van Zijl, 2005; for a comparison example be-tween a gray-scaled FAmap and a color-coded FAmap fromthe same coronal slice, see Figure 1B and E).The posterior border of the DPLFC ROI defined the
anterior border of the SLF, and the anterior border of
4 Journal of Cognitive Neuroscience Volume X, Number Y
UncorrectedProof
the PPC ROI defined the posterior border of the SLF. TheSLF ROI only included white matter voxels with anterior–posterior oriented primary eigenvectors (green in thecolor-coded FA map in Figure 1E). The left SLF ROIcontained 745 voxels, and the right SLF ROI contained736 voxels.The DLPFC ROI included the white matter underlying
the superior frontal gyrus and the middle frontal gyrus(see Figure 1A). The anterior border of the DLPFC wasindicated by low FA values demarcating the border ofthe anterior inferior frontal sulcus to exclude the frontalpole. The posterior border was delineated at the pre-central sulcus. The medial border of the middle frontalgyrus was delineated according to the depth of the su-perior and inferior frontal sulci and the direction of theskeleton (see Figure 1A). The superior frontal gyrus wasonly drawn when a lateral part of the skeleton could bedistinguished. The left DLPFC ROI contained 1506 voxels,and the right DLPFC ROI contained 1384 voxels.The PPC ROI included the white matter underlying the
superior parietal lobule and the inferior parietal cortex(IPC) (see Figure 1C). The anterior boundary of the PPCROI was defined by the postcentral sulcus. The posteriorborder of the superior parietal lobule was defined by theparieto-occipital sulcus, whereas the posterior boundaryof the IPC was defined by the angular sulcus/secondaryintermediate sulcus. The inferior border of the IPC wasdefined by the sylvian fissure and medially by the circularinsular sulcus. The medial border of the IPC was definedby the lateral boundaries of the SLF ROI (see Figure 1C).
The left PPC ROI contained 1131 voxels, and the rightPPC ROI contained 1365 voxels.
Mean FA and parallel (!") and perpendicular (!!) dif-fusivity values from all six ROIs and the whole skeleton(as an estimate of global white matter FA) were extractedfor each subject for statistical analyses.
Statistical Analysis
Statistical analyses were done using the Statistical Packagefor the Social Sciences for Windows (Version 18.0; SPSSInc., Chicago, IL). Multiple linear regression models wereused to predict SWM performance. Because SWM per-formance is measured in number of errors (i.e., betweenerrors = the number of times the subject returns to abox in which a blue token previously has been located),better SWM performance should correlate negativelywith increasing age or FA. The major hypothesis was thatincreased FA in a left fronto-parietal network would con-tribute significantly to the prediction of better SWM per-formance (i.e., less “between errors”) after adjusting foreffects of age. This hypothesis was tested with a hierarchi-cal regression analysis (Cohen & Cohen, 1983) in which atthe first step only age predicted the SWM error score andat the second step the three left ROI FA measures wereentered simultaneously as predictors. The change in R2 at-tributable to the set of variables was then tested for signifi-cance. A p value less than .05 was considered significantfor the primary hypothesis that the set of ROI FA mea-sures would significantly improve the prediction of SWM
Figure 1. Abbreviations:DLPFC = dorsolateral pFC,PPC = posterior parietalcortex, SLF = superiorlongitudinal fasciculus. Theslices A–E depict the meanFA skeleton (light-yellow)overlaid on the target FA image.(A) Coronal slice of DLPFCin green; (B) coronal slice ofSLF in red; (C) coronal sliceof PPC in blue; (D) axial sliceof left- and right-sided DLPFC,SLF, and PPC ROIs. (E) Coronalslice of SLF in red (for acomparison, see Figure 2B)displayed on the targetcolor-coded FA map showingthe direction of the primaryeigenvector in colors (anterior–posterior direction in green,superior–inferior direction inblue, and left–right in red).(F) Midsagittal image depictingthe MNI coordinates ofcoronal slice A, B, C, and E.The images are displayedaccording to neurologicalconvention (left is left).
Vestergaard et al. 5
UncorrectedProofperformance after adjusting for age. Follow-up regression
analyses were planned to examine the anatomical spe-cificity of the results by including as covariates either thewhole skeleton FA or the corresponding right hemisphereROI FA in a multiple linear regression model, also adjust-ing for age as in the primary analyses. Planned follow-upanalyses further examined the parallel (!") and the per-pendicular (!!) diffusivities to explore the specific effectsof the diffusivities by following the same statistical analysis
protocol as for the FA data. Collinearity (multicollinearity)between the predictors was assessed for all regressionmodels.Finally, an effect-size map is presented to provide fur-
ther (more qualitative) information about variation acrossthe white matter skeleton in the effect size relating FA toSWM performance ( Jernigan, Gamst, Fennema-Notestine,& Ostergaard, 2003). The effect-size map is based ont maps of the correlation between FA and SWM perfor-mance (i.e., between errors) after controlling for age; how-ever, the sign of the correlations is reversed so that highFA and better SWM performance (i.e., fewer errors) areshown in warm colors (red to yellow). The t map wasgenerated using the Monte Carlo permutation test, with10,000 permutations implemented in the randomize pro-gram within FSL (Nichols & Holmes, 2002).
RESULTS
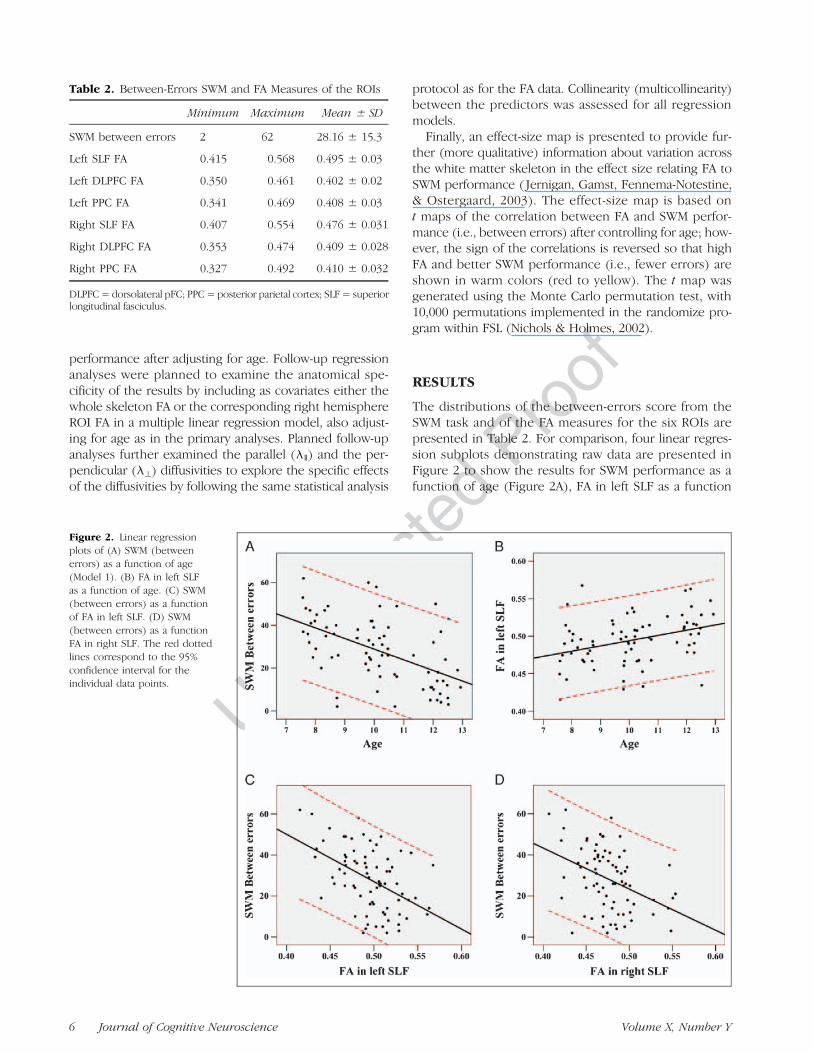
The distributions of the between-errors score from theSWM task and of the FA measures for the six ROIs arepresented in Table 2. For comparison, four linear regres-sion subplots demonstrating raw data are presented inFigure 2 to show the results for SWM performance as afunction of age (Figure 2A), FA in left SLF as a function
Table 2. Between-Errors SWM and FA Measures of the ROIs
Minimum Maximum Mean ± SD
SWM between errors 2 62 28.16 ± 15.3
Left SLF FA 0.415 0.568 0.495 ± 0.03
Left DLPFC FA 0.350 0.461 0.402 ± 0.02
Left PPC FA 0.341 0.469 0.408 ± 0.03
Right SLF FA 0.407 0.554 0.476 ± 0.031
Right DLPFC FA 0.353 0.474 0.409 ± 0.028
Right PPC FA 0.327 0.492 0.410 ± 0.032
DLPFC= dorsolateral pFC; PPC= posterior parietal cortex; SLF= superiorlongitudinal fasciculus.
Figure 2. Linear regressionplots of (A) SWM (betweenerrors) as a function of age(Model 1). (B) FA in left SLFas a function of age. (C) SWM(between errors) as a functionof FA in left SLF. (D) SWM(between errors) as a functionFA in right SLF. The red dottedlines correspond to the 95%confidence interval for theindividual data points.
6 Journal of Cognitive Neuroscience Volume X, Number Y
UncorrectedProof
of age (Figure 2B), SWM performance as a function of FA inleft SLF (Figure 2C), and SWM performance as a function ofFA in right SLF (Figure 2D), respectively.The results of the multiple linear regression analyses
are summarized in Table 3 and Table 4. Each row of thetables provides the result of a separate, planned modelpredicting SWM scores. Age was significantly and nega-tively associated with SWM performance (between errors)(Model 1, Figure 2A). As hypothesized, increased FA in theleft fronto-parietal network contributed significantly to theprediction of better SWM performance after adjusting forage (Model 2). Inspecting the three regression coefficientsfor the left ROI FA measures in Model 2 (the hierarchicalstepwise regression analysis) revealed that only left SLFmade a significant contribution whereas left DLPFC andleft PPC contributions were negligible. Given this, follow-up models focused only on the SLF ROI measures.The first follow-up analysis (Model 3) was performed to
confirm the strong contribution of left SLF FA (alone) tothe prediction of SWM performance, after controlling forage. Next, we confirmed that when including the wholeskeleton FA in the model, only left SLF FA reached signifi-
cance (Model 4), suggesting that the association betweenSWM and left SLF FA was not mediated by global increasesin FA. Then, to further examine the laterality of the effect,we included in the model the measure of FA in the cor-responding right hemisphere SLF ROI. Again, only leftSLF FA remained significant (Model 5). We note, however,that right SLF FA was a significant predictor of SWM errorswithout left SLF in themodel (not shown in the table), aftercontrolling for age (R2 = .324, " = #.224, p = .036).In additional post hoc analyses predicting SWM errors,neither right DLPFC FA nor right PPC FA made a significantcontribution after controlling for age.
Additional exploratory analyses of the eigenvalues re-vealed that left SLF !" did not show a significant rela-tionship with SWM performance after controlling for age.However, SWM performance was significantly and posi-tively associated with left SLF !! after adjusting for age(Model 6), and this effect remained significant when enter-ing whole skeleton !! (Model 7) or right SLF !! (Model 8)as covariates.
Collinearity diagnostics were performed for all of theregression models, with no model exhibiting a Tolerance
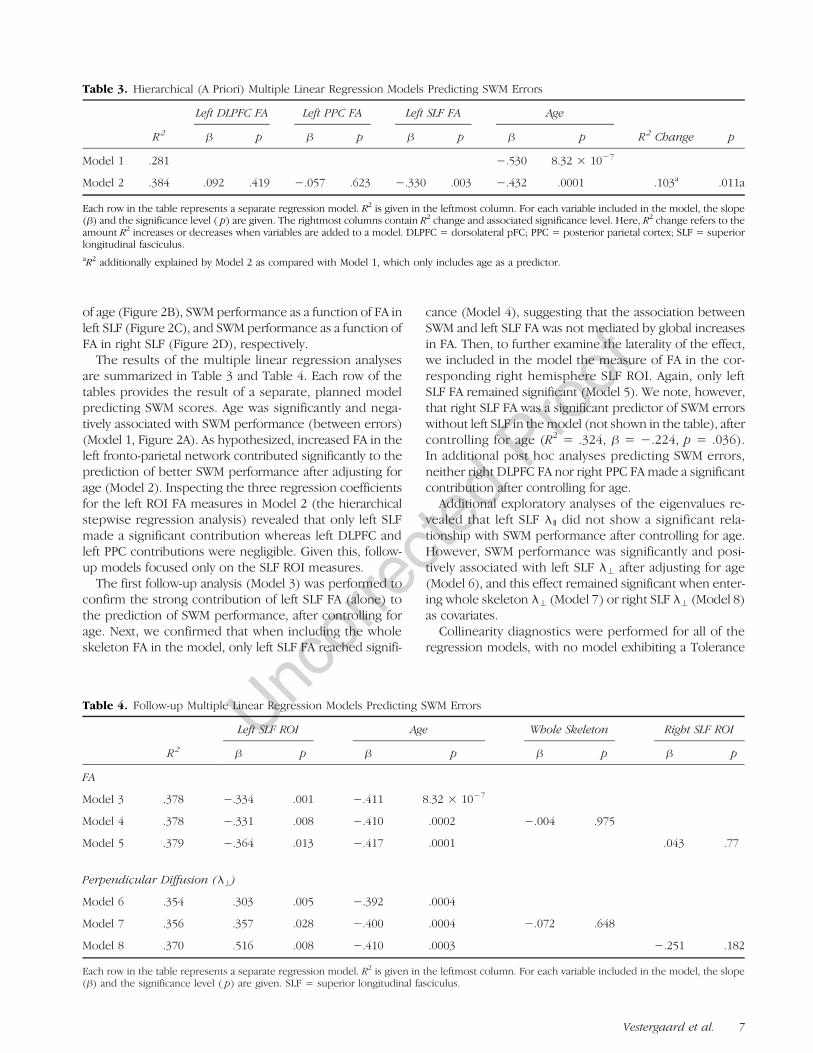
Table 3. Hierarchical (A Priori) Multiple Linear Regression Models Predicting SWM Errors
R2
Left DLPFC FA Left PPC FA Left SLF FA Age
R2 Change p" p " p " p " p
Model 1 .281 #.530 8.32 ! 10#7
Model 2 .384 .092 .419 #.057 .623 #.330 .003 #.432 .0001 .103a .011a
Each row in the table represents a separate regression model. R2 is given in the leftmost column. For each variable included in the model, the slope(") and the significance level ( p) are given. The rightmost columns contain R2 change and associated significance level. Here, R2 change refers to theamount R2 increases or decreases when variables are added to a model. DLPFC = dorsolateral pFC; PPC = posterior parietal cortex; SLF = superiorlongitudinal fasciculus.aR2 additionally explained by Model 2 as compared with Model 1, which only includes age as a predictor.
Table 4. Follow-up Multiple Linear Regression Models Predicting SWM Errors
R2
Left SLF ROI Age Whole Skeleton Right SLF ROI
" p " p " p " p
FA
Model 3 .378 #.334 .001 #.411 8.32 ! 10#7
Model 4 .378 #.331 .008 #.410 .0002 #.004 .975
Model 5 .379 #.364 .013 #.417 .0001 .043 .77
Perpendicular Diffusion (!!)
Model 6 .354 .303 .005 #.392 .0004
Model 7 .356 .357 .028 #.400 .0004 #.072 .648
Model 8 .370 .516 .008 #.410 .0003 #.251 .182
Each row in the table represents a separate regression model. R2 is given in the leftmost column. For each variable included in the model, the slope(") and the significance level ( p) are given. SLF = superior longitudinal fasciculus.
Vestergaard et al. 7
UncorrectedProof
value less than .20 or a variance inflation factor (VIF) higherthan 5 (Models 2–5: tolerance = 0.405–0.871, VIF =1.148–2.471; Models 6–8: tolerance = 0.242–0.795, VIF =1.263–4.133).
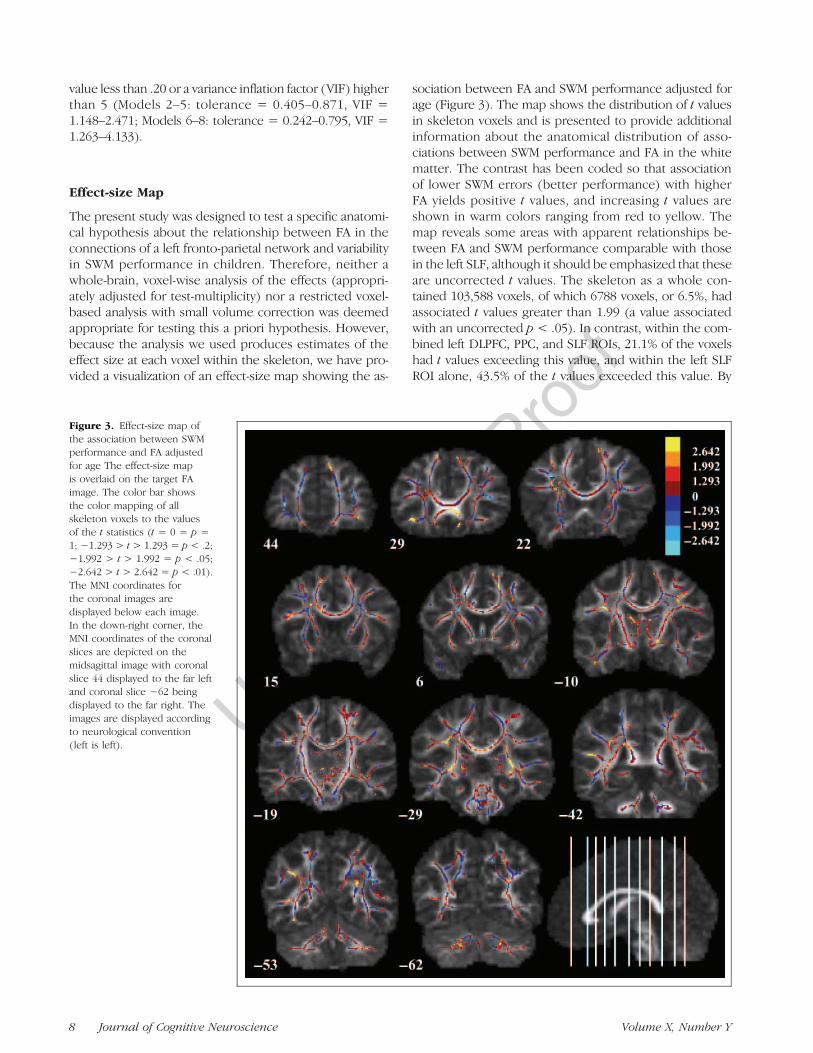
Effect-size Map
The present study was designed to test a specific anatomi-cal hypothesis about the relationship between FA in theconnections of a left fronto-parietal network and variabilityin SWM performance in children. Therefore, neither awhole-brain, voxel-wise analysis of the effects (appropri-ately adjusted for test-multiplicity) nor a restricted voxel-based analysis with small volume correction was deemedappropriate for testing this a priori hypothesis. However,because the analysis we used produces estimates of theeffect size at each voxel within the skeleton, we have pro-vided a visualization of an effect-size map showing the as-
sociation between FA and SWM performance adjusted forage (Figure 3). The map shows the distribution of t valuesin skeleton voxels and is presented to provide additionalinformation about the anatomical distribution of asso-ciations between SWM performance and FA in the whitematter. The contrast has been coded so that associationof lower SWM errors (better performance) with higherFA yields positive t values, and increasing t values areshown in warm colors ranging from red to yellow. Themap reveals some areas with apparent relationships be-tween FA and SWM performance comparable with thosein the left SLF, although it should be emphasized that theseare uncorrected t values. The skeleton as a whole con-tained 103,588 voxels, of which 6788 voxels, or 6.5%, hadassociated t values greater than 1.99 (a value associatedwith an uncorrected p < .05). In contrast, within the com-bined left DLPFC, PPC, and SLF ROIs, 21.1% of the voxelshad t values exceeding this value, and within the left SLFROI alone, 43.5% of the t values exceeded this value. By
Figure 3. Effect-size map ofthe association between SWMperformance and FA adjustedfor age The effect-size mapis overlaid on the target FAimage. The color bar showsthe color mapping of allskeleton voxels to the valuesof the t statistics (t = 0 = p =1; #1.293 > t > 1.293 = p < .2;#1.992 > t > 1.992 = p < .05;#2.642 > t > 2.642 = p < .01).The MNI coordinates forthe coronal images aredisplayed below each image.In the down-right corner, theMNI coordinates of the coronalslices are depicted on themidsagittal image with coronalslice 44 displayed to the far leftand coronal slice #62 beingdisplayed to the far right. Theimages are displayed accordingto neurological convention(left is left).
8 Journal of Cognitive Neuroscience Volume X, Number Y
UncorrectedProof
comparison, only 11% of the t values in the right SLF ROIexceeded 1.99.
DISCUSSION
This study examined associations between SWM perfor-mance and properties of white matter microstructure in aleft fronto-parietal network. As hypothesized, the resultssuggest that increased FA in left fronto-parietal connectionsexhibits a significant association with better SWM perfor-mance in children between the ages of 7 and 13 years, afteradjusting for effects statistically attributable to age. Becauseboth SWM abilities (Conklin et al., 2007) and FA in brainfiber tracts (Lebel et al., 2008) are known to increase inchildren over the age range from 7 to 13 years, a simplecorrelation between these measures could represent anonspecific association attributable to unmeasured factorsindexed by chronological age. For example, because heightalso increases in children over this age range, one mightexpect to find a simple correlation between height andSWM abilities within a group of children with varying ages,although few would infer that height has a direct relation-ship to cognitive functioning in children. One would alsoexpect that the correlation between height and cognitivefunction would be substantially reduced after controllingfor age statistically. Thus, we hypothesized that the asso-ciation between FA in the left fronto-parietal network andSWM performance would remain significant after control-ling for age; that is, that even among children of similarage, those with higher FA in a left fronto-parietal networkwould exhibit stronger SWM performance. Such a findingwould be consistent with a relationship between structuralconnectivity in this network and individual differences inSWM abilities not attributable to age-related differences.This hypothesis was confirmed.Several follow-up analyses were conducted to explore
the nature of this association. We found that only FA inthe ROI that included connecting fibers in left SLF couldbe shown to contribute significantly to the prediction ofSWM performance (again, after controlling for age). Wefurther examined the anatomical specificity of the associa-tion between SWM performance and fiber structure withinthe left SLF, that is, in the extent to which SWM exhibiteda relatively specific relationship to FA in this fiber tractrelative to other white matter regions. This is an impor-tant question because FA is known to increase duringchildhood concurrently in many fiber tracts (Lebel et al.,2008). However, the results of analyses including wholeskeleton FA as a covariate suggest that the relationshipbetween left SLF FA and SWM is not likely to be mediatedby global white matter FA differences, which might occurbecause of individual differences in the phase or intensityof brain myelination per se.We were not able to demonstrate a significant associa-
tion between SWM ability and either of the FA measuresfrom the left hemisphere superficial white matter ROIs(DLPFC or PPC) after controlling for age. These analyses
may have been limited by low power or sensitivity. It ispossible that the fibers within these segments of the tractskeleton were more mixed, that is, included more fibersfrom tracts other than the SLF, and thus FA in these ROIsmay have been a less sensitive index of structural attributesin the targeted fronto-parietal association fibers. Longitudi-nal studies or studies with larger samples and/or moresensitive methods may still reveal a relationship betweenSWM ability and structural variability in segments of the leftSLF that extend into these regions.
Our findings of an association of SWM performance withwhite matter structure in developing children extend ini-tial findings from a previous DTI study of a much smallergroup of children (Nagy et al., 2004). The previous studywas performed using voxel-wise analyses and did not exam-ine specific fiber tracts connecting fronto-parietal corticalregions. We used an ROI approach and focused specificallyon segments of the white matter likely to contain fibersof the SLF. In the present study as well as in the study byNagy et al. (2004), associations were observed betweenSWM performance and DTI parameters in left rather thanright hemisphere tracts. These results are also consistentwith prior fMRI studies that implicate the left hemispherein SWM functions in children and adolescents (Schweinsburget al. 2005; Olesen et al., 2003; Klingberg et al., 2002). How-ever, the results of our analyses do not rule out the possibil-ity that structural variability in the right SLF is relevant forSWM, nor do they imply significant lateralization of the ef-fects. In the present study, we performed analyses to deter-mine whether the association of SWM performance withleft SLF FA was likely to be mediated by FA in the rightSLF. No such mediating effect was observed, and our resultssuggest that left SLF FA exhibits an independent associationwith SWM not redundant with, or mediated by, a relation-ship with FA in the right hemisphere tract.
Being one of the major fiber bundles connecting fronto-parietal regions the SLF is likely implicated in high-ordercognitive processing and increased FA values have beenassociated with verbal abilities (Tamnes et al., 2010; Gold,Powell, Xuan, Jiang, & Hardy, 2007) and arithmetic skills(Tsang et al., 2009) in regions corresponding to the leftSLF. Further, a DTI study found verbal working memoryperformance in schizophrenia patients and healthy partici-pants to be correlated with FA in left SLF (Karlsgodt et al.,2008). Moreover, initial findings from DTI studies in psy-chiatric populations have observed reduced FA values inleft and/or right SLF, among other white matter regions,in major depressive disorder (Zou et al., 2008), schizophre-nia (Szeszko et al., 2008; Mitelman et al., 2007), and atten-tion deficit/hyperactivity disorder (Hamilton et al., 2008).
TBSS improves intersubject registration of brain fibertracts relative to prior methods for performing spatialnormalization of FA images (Smith et al., 2006), and themethod obviates the need for extensive spatial smoothing.Thus, the use of TBSS in the present study aimed toincrease the sensitivity of our ROI approach relative toROI methods used in previous DTI studies in children. We
Vestergaard et al. 9
UncorrectedProof
averaged FA over the segments of the tract skeleton thatcorresponded to the expected location of the targetedtract after applying TBSS to align the tracts across subjects.This was considered to be a more objective way of esti-mating FA within a comparable portion of the tract withineach individual than either subjective (manual) delineationof regions within the white matter or a voxel-wise approach.However, the method produces only an approximationof FA in the targeted tract, and in future studies, it may bepossible to use better validated tractography methods thatdefine the tracts on the basis of connectivity or new meth-ods using probabilistic atlases (Hagler et al., 2008) to in-crease validity and reliability.
The results of the exploratory analyses of the parallel(!") and perpendicular (!!) diffusivities in left SLF mayshed some light on possible factors mediating the ob-served variability in left SLF FA. Only the left SLF !! waspredictive of SWM scores after adjusting for age. No effectswere observed with the measures of !". This suggests thatthe increases in SLF FA associated with better SWM per-formance are primarily attributable to the decreases in!!. Several factors have been linked to variability in !!(Schwartz et al., 2005; Beaulieu, 2002). A study of diffu-sion parameters in myelin-deficient rats and age-matchedcontrols demonstrated a significant but modest decreasein diffusion anisotropy in the unmyelinated spinal cordrelative to control values. Furthermore, the decrease inanisotropy in the unmyelinated spinal cord was mainlydue to increased !! (Gulani, Webb, Duncan, & Lauterbur,2001). In a study of the effects of retinal ischemia in mice,gradual decrease in relative anisotropy was found in theoptic nerve. The decrease in anisotropy was, at first, as-sociated with early axonal degeneration of the optic nerveseen as decreased !" with no detectable changes in !!, fol-lowed by later demyelination of the optic nerve associatedwith increases in !! (Song et al., 2003). The results fromthese studies suggest that the observed decreases in leftSLF !! associated with improved SWM performance couldbe due to the degree of myelination of the fiber tract.Age-related FA increases in fiber tracts have been linkedto decreases in !! in previous studies (Lebel et al.,2008). However, other tissue parameters should be takeninto account when interpreting FA and !! such as axonaldensity, diameter and spacing, fiber packing, number ofaxons, extracellular volume fraction, and tract geometry(Schwartz et al., 2005; Beaulieu, 2002).
As mentioned earlier, these findings suggest that evenamong children of the same age, higher FA in left SLF isassociated with better SWM performance. Many questionsremain about what such age-adjusted variability in FAmight represent. It may reflect individual differences intrajectories of fiber tract development, that is, differencesin the phase of SLF development among children of similarage. Alternatively, it could represent individual differencesin the structure of fiber tracts (perhaps reflecting dif-ferences in intracortical connectivity) that emerge earlierduring brain development and remain stable in spite of
superimposed biological changes associated with develop-ment. This is plausible because individual differences inbehavioral performance have been associated with FAvariability in adults (Gold et al., 2007; Wolbers, Schoell, &Buchel, 2006) as well as in children.It is also possible that the fiber tract parameters are
influenced dynamically, perhaps in association with ac-tivity levels in the neural circuits. In a DTI study compar-ing preterm infants to full-term infants at term equivalentage, we found that preterm infants exhibited higher FAvalues in the sagittal stratum, possibly as a result of increasedsensorimotor stimulation in the extrauterine relative to theintrauterine environment (Gimenez et al., 2008). Further,a recent DTI study of adults examined changes in FA valuesbefore and after 2 months of training on three workingmemory tasks (including an SWM task). This study observeda positive correlation between amount of training and FAin a cluster adjacent to the intraparietal sulcus (Takeuchiet al., 2010). Thus, the differences measured in the presentstudy could reflect variability in the experiences and learn-ing of the children. Further environmental factors such asdiet, exercise, and sleep could perhaps also influence indi-vidual brain maturation trajectories, although the relation-ships we observed did not appear to reflect global braineffects. Finally, genetic variability and interactions betweengenotype and environmental factors may play a role in me-diating individual differences in left SLF FA and SWM skills.In conclusion, SWM performance in children is associ-
ated with variability in left SLF FA and !! that is not statis-tically attributable to age, and the relationship does notappear to reflect behavioral effects of global white matterdevelopment. Children of similar age may vary in thephase of maturation in the left SLF, and this variabilitymay mediate the observed associations with SWM abil-ity. Alternatively, the associations could be mediated byother sources of variability in the structure of the underly-ing fronto-parietal connections. Longitudinal observationsmay help to elucidate the meaning and implications ofthese associations.
AcknowledgmentsThe Danish Medical Research Council, The Lundbeck Founda-tion, and the University of Copenhagen!s Research Priority AreaBody and Mind are acknowledged for financial support.
Reprint requests should be sent to Martin Vestergaard or KathrineSkak Madsen, MR-Department, Danish Research Centre for Mag-netic Resonance, Copenhagen University Hospital, Section 340,Hvidovre, Kettegaard Allé 30, 2650 Hvidovre, Denmark, or viae-mail: [email protected]; [email protected].
REFERENCESAndersson, J. L., Hutton, C., Ashburner, J., Turner, R., &
Friston, K. (2001). Modeling geometric deformations inEPI time series. Neuroimage, 13, 903–919.
Andersson, J. L. R., Jenkinson, M., & Smith, S. (2007).Non-linear registration, aka spatial normalisation
10 Journal of Cognitive Neuroscience Volume X, Number Y
UncorrectedProof
(FMRIB Tech. Rep. No. TR07JA2). Retrieved fromwww.fmrib.ox.ac.uk/analysis/techrep.
Baddeley, A. (1981). The concept of working memory—Aview of its current state and probable future-development.Cognition, 10, 17–23.
Basser, P. J., Mattiello, J., & LeBihan, D. (1994). MR diffusiontensor spectroscopy and imaging. Biophysical Journal,66, 259–267.
Beaulieu, C. (2002). The basis of anisotropic water diffusionin the nervous system—A technical review. NMR inBiomedicine, 15, 435–455.
Cavada, C., & Goldman-Rakic, P. S. (1991). Topographicsegregation of corticostriatal projections from posteriorparietal subdivisions in the macaque monkey. Neuroscience,42, 683–696.
Chafee, M. V., & Goldman-Rakic, P. S. (1998). Matching patternsof activity in primate prefrontal area 8a and parietal area7ip neurons during a spatial working memory task.Journal of Neurophysiology, 79, 2919–2940.
Chang, L. C., Jones, D. K., & Pierpaoli, C. (2005). RESTORE:Robust estimation of tensors by outlier rejection. MagneticResonance in Medicine, 53, 1088–1095.
Cohen, J., & Cohen, P. (1983). Applied multiple regression/correlation analysis for the behavioral sciences. Hillsdale,NJ: Lawrence Erlbaum Associates.
Conklin, H. M., Luciana, M., Hooper, C. J., & Yarger, R. S.(2007). Working memory performance in typicallydeveloping children and adolescents: Behavioral evidenceof protracted frontal lobe development. DevelopmentalNeuropsychology, 31, 103–128.
Cook, P. A., Bai, Y., Nedjati-Gilani, S., Seunarine, K. K., Hall,M. G., Parker, G. J., et al. (2006). Camino: Open-sourcediffusion-MRI reconstruction and processing. 14thScientific Meeting of the International Society forMagnetic Resonance in Medicine, Seattle, WA, USA.
Corbett, B. A., Constantine, L. J., Hendren, R., Rocke, D.,& Ozonoff, S. (2009). Examining executive functioning inchildren with autism spectrum disorder, attention deficithyperactivity disorder and typical development. PsychiatryResearch, 166, 210–222.
De Luca, C. R., Wood, S. J., Anderson, V., Buchanan, J. A.,Proffitt, T. M., Mahony, K., et al. (2003). Normative datafrom the Cantab: I. Development of executive functionover the lifespan. Journal of Clinical and ExperimentalNeuropsychology, 25, 242–254.
du Boisgueheneuc, F., Levy, R., Volle, E., Seassau, M., Duffau, H.,Kinkingnehun, S., et al. (2006). Functions of the leftsuperior frontal gyrus in humans: A lesion study. Brain,129, 3315–3328.
Duvernoy, H. M. (1999). The human brain; surface, bloodsupply and three-dimensional section anatomy. Wien:Springer.
Eluvathingal, T. J., Hasan, K. M., Kramer, L., Fletcher, J. M.,& Ewing-Cobbs, L. (2007). Quantitative diffusion tensortractography of association and projection fibers innormally developing children and adolescents. CerebralCortex, 17, 2760–2768.
Funahashi, S., Bruce, C. J., & Goldmanrakic, P. S. (1993).Dorsolateral prefrontal lesions and oculomotordelayed-response performance—Evidence for mnemonicscotomas. Journal of Neuroscience, 13, 1479–1497.
Giedd, J. N., Blumenthal, J., Jeffries, N. O., Castellanos, F. X.,Liu, H., Zijdenbos, A., et al. (1999). Brain developmentduring childhood and adolescence: A longitudinal MRIstudy. Nature Neuroscience, 2, 861–863.
Gimenez, M., Miranda, M. J., Born, A. P., Nagy, Z., Rostrup, E.,& Jernigan, T. L. (2008). Accelerated cerebral white matterdevelopment in preterm infants: A voxel-based morphometry
study with diffusion tensor MR imaging. Neuroimage, 41,728–734.
Gold, B. T., Powell, D. K., Xuan, L., Jiang, Y., & Hardy, P. A.(2007). Speed of lexical decision correlates with diffusionanisotropy in left parietal and frontal white matter: Evidencefrom diffusion tensor imaging. Neuropsychologia, 45,2439–2446.
Goldberg, M. C., Mostofsky, S. H., Cutting, L. E., Mahone, E. M.,Astor, B. C., Denckla, M. B., et al. (2005). Subtle executiveimpairment in children with autism and children with ADHD.Journal of Autism and Developmental Disorders, 35,279–293.
Goldman, P. S., & Rosvold, H. E. (1970). Localization of functionwithin dorsolateral prefrontal cortex of rhesus monkey.Experimental Neurology, 27, 291–304.
Gulani, V., Webb, A. G., Duncan, I. D., & Lauterbur, P. C. (2001).Apparent diffusion tensor measurements in myelin-deficientrat spinal cords. Magnetic Resonance in Medicine, 45,191–195.
Hagler, D. J., Jr., Ahmadi, M. E., Kuperman, J., Holland, D.,McDonald, C. R., Halgren, E., et al. (2008). Automatedwhite-matter tractography using a probabilistic diffusiontensor atlas: Application to temporal lobe epilepsy.Human Brain Mapping.
Hamilton, L. S., Levitt, J. G., O!Neill, J., Alger, J. R., Luders, E.,Phillips, O. R., et al. (2008). Reduced white matter integrityin attention-deficit hyperactivity disorder. NeuroReport,19, 1705–1708.
Jansons, K. M., & Alexander, D. C. (2003). Persistent angularstructure: New insights from diffusion MRI data. Dummyversion. Information Processing in Medical Imaging, 18,672–683.
Jernigan, T. L., Gamst, A. C., Fennema-Notestine, C., &Ostergaard, A. L. (2003). More “mapping” in brain mapping:Statistical comparison of effects. Human Brain Mapping,19, 90–95.
Jernigan, T. L., Trauner, D. A., Hesselink, J. R., & Tallal, P. A.(1991). Maturation of human cerebrum observed in vivoduring adolescence. Brain, 114, 2037–2049.
Jovicich, J., Czanner, S., Greve, D., Haley, E., van der Kouwe, A.,Gollub, R., et al. (2006). Reliability in multi-site structuralMRI studies: Effects of gradient non-linearity correctionon phantom and human data. Neuroimage, 30, 436–443.
Karlsgodt, K. H., van Erp, T. G., Poldrack, R. A., Bearden, C. E.,Nuechterlein, K. H., & Cannon, T. D. (2008). Diffusiontensor imaging of the superior longitudinal fasciculus andworking memory in recent-onset schizophrenia. BiologicalPsychiatry, 63, 512–518.
Klingberg, T., Forssberg, H., & Westerberg, H. (2002).Increased brain activity in frontal and parietal cortexunderlies the development of visuospatial workingmemory capacity during childhood. Journal of CognitiveNeuroscience, 14, 1–10.
Koch, G., Oliveri, M., Torriero, S., Carlesimo, G. A., Turriziani, P.,& Caltagirone, C. (2005). rTMS evidence of different delayand decision processes in a fronto-parietal neuronal networkactivated during spatial working memory. Neuroimage, 24,34–39.
Lebel, C., Walker, L., Leemans, A., Phillips, L., & Beaulieu, C.(2008). Microstructural maturation of the human brainfrom childhood to adulthood. Neuroimage, 40, 1044–1055.
Leung, H. C., Oh, H., Ferri, J., & Yi, Y. J. (2007). Load responsefunctions in the human spatial working memory circuit duringlocation memory updating. Neuroimage, 35, 368–377.
Lycke, C., Specht, K., Ersland, L., & Hugdahl, K. (2008). AnfMRI study of phonological and spatial working memoryusing identical stimuli. Scandinavian Journal of Psychology,49, 393–401.
Vestergaard et al. 11
UncorrectedProof
Madsen, K. S., Baare, W. F., Vestergaard, M., Skimminge, A.,Ejersbo, L. R., Ramsoy, T. Z., et al. (2010). Responseinhibition is associated with white matter microstructurein children. Neuropsychologia, 48, 854–862.
Mitelman, S. A., Torosjan, Y., Newmark, R. E., Schneiderman,J. S., Chu, K. W., Brickman, A. M., et al. (2007). Internalcapsule, corpus callosum and long associative fibers ingood and poor outcome schizophrenia: A diffusion tensorimaging survey. Schizophrenia Research, 92, 211–224.
Mori, S., Wakana, S., Nagae-Poetscher, L. M., & van Zijl,P. C. M. (2005). MRI atlas of human white matter(1st ed.). Amsterdam: Elsevier.
Muri, R. M., Gaymard, B., Rivaud, S., Vermersch, A., Hess, C. W.,& Pierrot-Deseilligny, C. (2000). Hemispheric asymmetry incortical control of memory-guided saccades. A transcranialmagnetic stimulation study. Neuropsychologia, 38,1105–1111.
Nagy, Z., Westerberg, H., & Klingberg, T. (2004). Maturationof white matter is associated with the development ofcognitive functions during childhood. Journal of CognitiveNeuroscience, 16, 1227–1233.
Nichols, T. E., & Holmes, A. P. (2002). Nonparametricpermutation tests for functional neuroimaging: A primerwith examples. Human Brain Mapping, 15, 1–25.
Niogi, S. N., & McCandliss, B. D. (2006). Left lateralized whitematter microstructure accounts for individual differencesin reading ability and disability. Neuropsychologia, 44,2178–2188.
Olesen, P. J., Nagy, Z., Westerberg, H., & Klingberg, T. (2003).Combined analysis of DTI and fMRI data reveals a jointmaturation of white and grey matter in a fronto-parietalnetwork. Brain Research, Cognitive Brain Research, 18,48–57.
Oliveri, M., Turriziani, P., Carlesimo, G. A., Koch, G., Tomaiuolo, F.,Panella, M., et al. (2001). Parieto-frontal interactions invisual-object and visual-spatial working memory: Evidencefrom transcranial magnetic stimulation. Cerebral Cortex,11, 606–618.
Owen, A. M., McMillan, K. M., Laird, A. R., & Bullmore, E.(2005). N-back working memory paradigm: A meta-analysisof normative functional neuroimaging. Human BrainMapping, 25, 46–59.
Owen, A. M., Morris, R. G., Sahakian, B. J., Polkey, C. E., &Robbins, T. W. (1996). Double dissociations of memoryand executive functions in working memory tasksfollowing frontal lobe excisions, temporal lobe excisionsor amygdalo–hippocampectomy in man. Brain, 119,1597–1615.
Paus, T., Collins, D. L., Evans, A. C., Leonard, G., Pike, B., &Zijdenbos, A. (2001). Maturation of white matter in thehuman brain: A review of magnetic resonance studies.Brain Research Bulletin, 54, 255–266.
Petrides, M., & Pandya, D. N. (2006). Efferent associationpathways originating in the caudal prefrontal cortex in themacaque monkey. Journal of Comparative Neurology,498, 227–251.
Reese, T. G., Heid, O., Weisskoff, R. M., & Wedeen, V. J.(2003). Reduction of eddy-current-induced distortion indiffusion MRI using a twice-refocused spin echo. MagneticResonance in Medicine, 49, 177–182.
Schwartz, E. D., Cooper, E. T., Fan, Y., Jawad, A. F., Chin,C. L., Nissanov, J., et al. (2005). MRI diffusion coefficientsin spinal cord correlate with axon morphometry.NeuroReport, 16, 73–76.
Schweinsburg, A. D., Nagel, B. J., & Tapert, S. F. (2005).fMRI reveals alteration of spatial working memory
networks across adolescence. Journal of the InternationalNeuropsychological Society, 11, 631–644.
Smith, S. M., Jenkinson, M., Johansen-Berg, H., Rueckert, D.,Nichols, T. E., Mackay, C. E., et al. (2006). Tract-basedspatial statistics: Voxelwise analysis of multi-subjectdiffusion data. Neuroimage, 31, 1487–1505.
Smith, S. M., Jenkinson, M., Woolrich, M. W., Beckmann, C. F.,Behrens, T. E., Johansen-Berg, H., et al. (2004). Advancesin functional and structural MR image analysis andimplementation as FSL. Neuroimage, 23(Suppl. 1),S208–S219.
Snook, L., Paulson, L. A., Roy, D., Phillips, L., & Beaulieu, C.(2005). Diffusion tensor imaging of neurodevelopment inchildren and young adults. Neuroimage, 26, 1164–1173.
Song, S. K., Sun, S. W., Ju, W. K., Lin, S. J., Cross, A. H., &Neufeld, A. H. (2003). Diffusion tensor imaging detectsand differentiates axon and myelin degeneration inmouse optic nerve after retinal ischemia. Neuroimage,20, 1714–1722.
Sowell, E. R., Thompson, P. M., Leonard, C. M., Welcome,S. E., Kan, E., & Toga, A. W. (2004). Longitudinal mappingof cortical thickness and brain growth in normal children.Journal of Neuroscience, 24, 8223–8231.
Sowell, E. R., Trauner, D. A., Gamst, A., & Jernigan, T. L. (2002).Development of cortical and subcortical brain structuresin childhood and adolescence: A structural MRI study.Developmental Medicine & Child Neurology, 44, 4–16.
Srimal, R., & Curtis, C. E. (2008). Persistent neural activityduring the maintenance of spatial position in workingmemory. Neuroimage, 39, 455–468.
Szeszko, P. R., Robinson, D. G., Ashtari, M., Vogel, J., Betensky, J.,Sevy, S., et al. (2008). Clinical and neuropsychologicalcorrelates of white matter abnormalities in recent onsetschizophrenia. Neuropsychopharmacology, 33, 976–984.
Takeda, K., & Funahashi, S. (2007). Relationship betweenprefrontal task-related activity and information flow duringspatial working memory performance. Cortex, 43, 38–52.
Takeuchi, H., Sekiguchi, A., Taki, Y., Yokoyama, S., Yomogida,Y., Komuro, N., et al. (2010). Training of working memoryimpacts structural connectivity. Journal of Neuroscience,30, 3297–3303.
Tamnes, C. K., Ostby, Y., Walhovd, K. B., Westlye, L. T.,Due-Tonnessen, P., & Fjell, A. M. (2010). Intellectualabilities and white matter microstructure in development:A diffusion tensor imaging study. Human Brain Mapping.
Tsang, J. M., Dougherty, R. F., Deutsch, G. K., Wandell, B. A.,& Ben Shachar, M. (2009). Frontoparietal white matterdiffusion properties predict mental arithmetic skills inchildren. Proceedings of the National Academy ofSciences, U.S.A., 106, 22546–22551.
Van Asselen, M., Kessels, R. P. C., Neggers, S. F. W., Kappelle,L. J., Frijns, C. J. M., & Postma, A. (2006). Brain areasinvolved in spatial working memory. Neuropsychologia,44, 1185–1194.
Westerberg, H., Hirvikoski, T., Forssberg, H., & Klingberg, T.(2004). Visuo-spatial working memory span: A sensitivemeasure of cognitive deficits in children with ADHD.Child Neuropsychology, 10, 155–161.
Wolbers, T., Schoell, E. D., & Buchel, C. (2006). The predictivevalue of white matter organization in posterior parietalcortex for spatial visualization ability. Neuroimage, 32,1450–1455.
Zou, K., Huang, X. Q., Li, T., Gong, Q. Y., Li, Z., Luo, O. Y., et al.(2008). Alterations of white matter integrity in adults withmajor depressive disorder: A magnetic resonance imagingstudy. Journal of Psychiatry & Neuroscience, 33, 525–530.
12 Journal of Cognitive Neuroscience Volume X, Number Y

UncorrectedProof
AUTHOR QUERIES
AUTHOR PLEASE ANSWER ALL QUERIES
During the preparation of your manuscript, the questions listed below arose. Kindly supply the necessaryinformation.
1. Hagler et al. 2008: Please provide the volume number and page range.2. Tamnes et al. 2008: Please provide the volume number and page range.
END OF ALL QUERIES