Thermal manifestations and nanoindentation of bone cements for orthopaedic surgery

Climatic Change (2010) 100:525–557DOI 10.1007/s10584-009-9794-9
Wetland place names as indicators of manifestationsof recent climate change in SW Spain (DoñanaNatural Park)
Arturo Sousa · Pablo García-Murillo · Sükran Sahin ·Julia Morales · Leoncio García-Barrón
Received: 28 April 2008 / Accepted: 28 July 2009 / Published online: 12 January 2010© Springer Science+Business Media B.V. 2009
Abstract Recent studies have shown the value of place names as environmental indi-cators. Until now they have not been applied to the effects of climate change, becauseverifying such relationship by this approach requires a multidisciplinary analysis anda study area where the anthropic impact has been recent. This study aims to test thepossibility in a study area little altered by man until the second half of the twentiethcentury (Doñana Natural Park, SW Spain), and with a heritage very rich in wetlands.The results show that the desiccation of these wetlands is reflected in the localtoponymy, and that in turn this regression is related with the end of the Little Ice Ageand with the beginning of warming in southern Europe during the twentieth century.The coincidence of these results with data published for Arctic latitudes reveals—inour opinion—the possibility that certain place names can be used as indicators of re-cent climate changes, at least in some ecosystems.
A. Sousa (B) · P. García-Murillo · J. MoralesDepartment of Plant Biology and Ecology, University of Seville,C/ Profesor García González, 2, 41012 Seville, Spaine-mail: [email protected]
P. García-Murilloe-mail: [email protected]
J. Moralese-mail: [email protected]
S. SahinDepartment of Landscape Architecture, Ankara University, Ankara, Turkeye-mail: [email protected]
L. García-BarrónDepartment of Applied Physics II, University of Seville, Avda. Reina Mercedes s/n,41012 Seville, Spaine-mail: [email protected]

526 Climatic Change (2010) 100:525–557
1 Introduction
The possibility of using toponymy to detect or reconstruct changes in the landscapeand in natural ecosystems has been a classic discussion in the scientific literature.Some authors (Corominas 1972; Rackham 1986) are critical of studies that deviatefrom a purely linguistic interpretation and use place names as an instrument toreconstruct historical environments. Such works are criticised, above all, for the lackof data to confirm their hypothesis, and for being more a personal interpretation orexercise in guesswork. More-recent studies (Cox et al. 2002; Moore 2002) take a lesscritical posture, although claiming—with regard to zoonyms—that not all names, par-ticularly in their modern spelling, can be taken literally. Gelling (1984), for toponymyin general, and (González Bernáldez 1992), with regard to place names that refer towetlands, seem to have staked more on the information supplied by place names.
To get round the criticisms concerning lack of objectivity in the use of toponymy,several authors (Bornaechea et al. 1984; Alcázar et al. 1988; Aybes and Yalden 1995;Spens 2006; Sweeney et al. 2007) include statistical analysis reinforcing their conclu-sions (chi-square, R-Pearson, correspondence, and cluster analysis, among others).
An important development in this controversy was the analysis—by the usualmethods and contrasted scientifically—first of how the landscape changed, and, later,how these changes were reflected in the toponymy (Sousa and García Murillo 2001).Not considering place names a priori to study how the landscape changes validatesthe usefulness of analysing the toponymy by an objective and reproducible method.This demonstrates—as pointed out by Spens (2006)—the possibility of using placenames as a tool to study changes in different components of the landscape.
Various lines of research have reinforced this idea, as they have enabled theuse of toponymy to reconstruct the past distribution of species of fauna in general(Cox et al. 2002), of mammals (Aybes and Yalden 1995; Leaper et al. 1999; Webster2001) and birds (Boisseau and Yalden 1998; Moore 2002; Yalden 2002), and of flora(Bornaechea et al. 1984; García Latorre et al. 2001).
However, we do not know of any study that has demonstrated how climatechanges—or their manifestations—are perceived in place names, although Henshaw(2006) claims they can be used—jointly with other data—to identify environmentalindicators of climate.
In the specific case of SW Europe, in the Biosphere Reserve of Doñana (Spain),the effects of recent climate change on the desiccation of its wetlands are well known,and demonstrate the relationship between the end of the Little Ice Age (hereinafterLIA) in SW Spain and the disappearance of great lagoon complexes in the study area(Sousa and García Murillo 2003). This result is understandable, as climate changein the Iberian Peninsula may be related more to precipitation than to temperature(Pfister et al. 1999). More specifically, the LIA was characterised in the southernIberian Peninsula by increased rainfall (Rodrigo et al. 2000).
These earlier results suggest the working hypothesis: if, on one hand, recentclimate change—such as the LIA—has affected the evolution of the wetlands (forexample in southern Spain), and on the other, wetland changes are reflected in thehydronyms that denominate them, could the place names that refer to the wetlandsdemonstrate the effects of recent climate change such as the LIA?
The aim of this study is not so much to use the hydronyms to reconstructwetland changes resulting from the end of the LIA, but to analyse independently the

Climatic Change (2010) 100:525–557 527
evolution of climate trends, the evolution of the wetlands, and the quantitativeevolution of the hydronyms, for the same period of time.
2 Study area
In order to be able to test the working hypothesis, it is necessary to choose a studyarea where the effects of recent climate change have previously been detected, andwhich—if at all possible—is not much altered by anthropic activity (Pearsall 1961).In this way, the main alterations in its ecosystems due to recent climate trends beforehuman intervention can be reconstructed.
The study area is in the south-west of Spain. More specifically, the greater part iswithin the borders of the Abalario sector of the Doñana Natural Park (approximately37◦10′ latitude N and 6◦45′ longitude W), in Andalusia. This territory occupies a vastcoastal area (∼25,000 ha between the tourist centres of Matalascañas, Mazagón, andEl Rocío; see Fig. 1).
The study area includes about 300 small lagoons (peat bogs and shallow seasonallagoons) and small creeks located in the eastern coastal area of Huelva (betweenthe mouths of the Tinto and Guadalquivir rivers). The eastern coastal area is veryrich and diverse in its formations and wetlands, which are distributed within threenatural regions protected by law: the Las Madres and Palos lagoons Natural Area,the Doñana National Park, and the Doñana Natural Park.
In spite of the heterogeneity of these continental wetlands, from the limnological,hydrogeological, and vegetational points of view, they are all located on a commongeological substrate: the coastal Aeolian Sheet of Huelva (Rodríguez-Ramírez andYáñez-Camacho 2008). The coastal Aeolian Sheet is mostly composed of quaternarysandy sediments produced by the successive appearance of several dune fronts.
This very recent geological conformation explains why the main natural processesof change appear linked to the geomorphological dynamics, specifically the mobilisa-tion of surface sands and the erosion of the coastal strip. In the study area, the coastalstrip is affected by the erosional processes deriving from coastal drift, at least sincethe 16th century. The historical reflection of this erosional effect is the regressionof the coastal cliff of Asperillo and of the adjacent dunes (Vanney and Menanteau1979). Meanwhile, in the neighbouring Doñana National Park, Granados et al. (1988)have shown how climatically drier periods and the clearing of certain plant speciesfavoured the mobilisation of surface sands (“flying sands”) during the 18th century.
The study area, because of its geographical position, is part of the Mediterraneanclimate domain, with touches of southernality and a marked oceanic influence. Thelatter is seen in temperate winters (mean minimum temperature of the coldestmonth: 4.1◦C), mild summers (mean maximum temperature of the hottest month:33.2◦C), and abundant precipitations. According to the data of the Bodegonesweather station (situated at the edge of the study area, see Fig. 1), the annual meantemperature for the period 1951–1980 was 16.3◦C, and the annual mean precipitation678.4 mm. Bioclimatically, the area is located on the upper thermomediterraneanstage (Rivas-Martínez 1987), with 41% of the precipitation occurring in the autumnmonths and 15% in spring.

528 Climatic Change (2010) 100:525–557
Fig. 1 Map of location of the study area, showing the main geomorphological units, the richness ofwetlands, and the delimitation of the protected natural spaces
3 Data and methods
The methodology used is centred on three independent lines of work for the sametime period:
• analysis of the reduction of the wetlands,• quantitative and qualitative analysis of the place names,• analysis of the climate trends.
The time period chosen—AD 1869 to 1987—has to be long enough to providereliable data sources for these aspects, and to be able to detect changes in the trendsof the variables studied. This is possible when there are different data sources with atemporal coincidence, as in the case of flights (from which changes in the lagoons andbrooks are extracted), historical maps (from which the place names are gathered),and the series of instrumental meteorological data from the stations closest to thestudy area.

Climatic Change (2010) 100:525–557 529
3.1 Analysis of the reduction of the wetlands
To study changes in the shallow lagoons and the brooks, it was necessary to usevarious data sources, depending on the date (Table 1).
This type of multidisciplinary approach is very reliable because—as is seen inTable 1—at least one of the data sources used to reconstruct the evolution of thewetlands overlaps two of the three time periods studied. This provides a check ofthe reliability and accuracy, as the data can be contrasted with others, of differentorigin, for the previous period. Specifically, aerial photography from flights of 1956(1:33,000) and 1987 (1:20,000) and satellite images [LANSAT-TM (1986 and 1990)and (SPOT 1989)] have been used. The historical data studied come from archivesand documentary sources (more than 20) of the sixteenth to twentieth centuries,together with 49 deeds and forestry reports of the estates in the district (1932–1978) and more than 70 historical maps. Of the latter, the majority (50) are datedbetween the eighteenth and twentieth centuries. These were precisely those mostused, as the earlier maps present certain limitations (very small scale, little territorialinformation, and other technical restrictions). A complete list of these maps can beconsulted in Sousa and García Murillo (2005), and a complete review for the DoñanaProtected Space in Montes et al. (1998).
From these sources of information, and after fieldwork, the situation of thewetlands at 1987, after 1956, and at the end of the nineteenth century (∼1869), wasmapped. These results were completed with the reconstruction of the microrelieffrom topographic isolines approximately each 2 m. The original contours wereinterpolated manually at 1:10,000 scale (from more than 650 topographic levels),following the method developed in previous publications (Sousa and García Murillo2002, 2003). The results were mapped at scale 1:25,000, measuring the surface areaof the lagoons and the length of the brooks, using a planimeter (PLANIX 5000). Inthe specific case of the lagoons, the evolution of the two types of lagoon found in thestudy area (peat bogs and seasonal lagoons) was analysed separately.
3.2 Quantitative and qualitative analysis of the place names
The main instrument used was the compilation of local place names on historicalmaps of the area from 1869 to 1987 (see Appendix 1). The compilation was limited tomaps for two reasons. One was the essential need to associate each term in space andtime—to know the date and area where the studied terms appeared and disappeared.The other was that, for Spanish territory, military maps are considerably morereliable than others (such as those of the Rural Land Registers; C.E.T.U. 1990).
For the quantitative analysis, seven maps were selected (dated from AD 1869 to1987) that included most of the toponymic terms over the period studied, and whosescale was acceptably reliable and detailed (see Appendix 1). A total of 692 placenames in the study area have been gathered and analysed, of which 234 refer towetlands (the complete list of hydronyms can be consulted in Appendix 2).
The place names have been listed using the geographic criterion (Gelling 1984;C.E.T.U. 1989, 1990; Sousa and García Murillo 2001), as displayed in Table 2.
In this type of study, the absolute number in each class of place name cannot beused, as these tend to increase with time (Sousa and García Murillo 2003). Thus, the

530 Climatic Change (2010) 100:525–557
Tab
le1
Dat
esan
dso
urce
sof
info
rmat
ion
used
inth
ere
cons
truc
tion
ofth
ew
etla
nds
for
each
ofth
eth
ree
date
sst
udie
d
Tim
eF
ield
Aer
ial
Sate
llite
For
estr
yH
isto
rica
lH
isto
rica
lM
icro
topo
grap
hyP
erio
dre
conn
aiss
ance
phot
ogra
phy
imag
esfi
les
docu
men
tsca
rtog
raph
yan
alys
es
1987
Yes
Yes
Yes
Yes
––
–19
56–
Yes
Yes
Yes
–19
thce
ntur
y–
––
–Y
esY
esY
es(∼
1869
)
Climatic Change (2010) 100:525–557 531
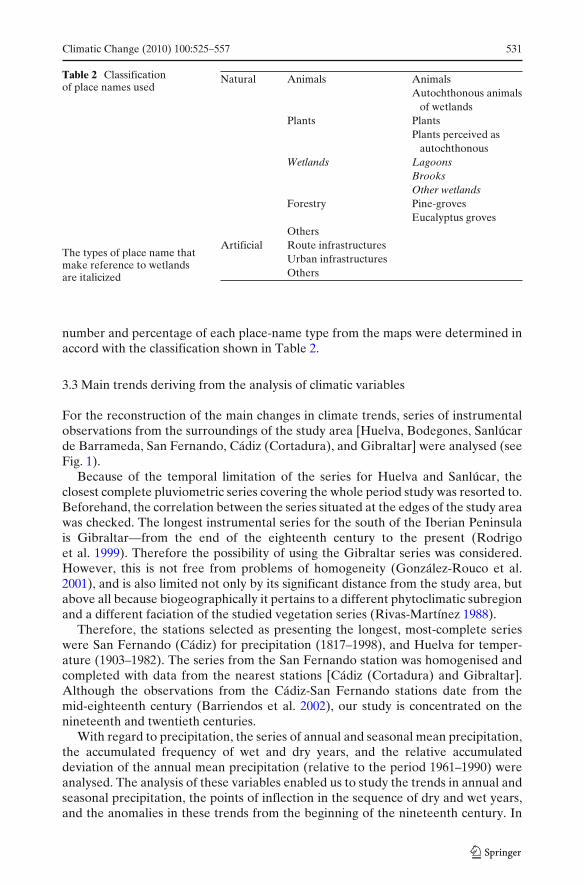
Table 2 Classificationof place names used
The types of place name thatmake reference to wetlandsare italicized
Natural Animals AnimalsAutochthonous animals
of wetlandsPlants Plants
Plants perceived asautochthonous
Wetlands LagoonsBrooksOther wetlands
Forestry Pine-grovesEucalyptus groves
OthersArtificial Route infrastructures
Urban infrastructuresOthers
number and percentage of each place-name type from the maps were determined inaccord with the classification shown in Table 2.
3.3 Main trends deriving from the analysis of climatic variables
For the reconstruction of the main changes in climate trends, series of instrumentalobservations from the surroundings of the study area [Huelva, Bodegones, Sanlúcarde Barrameda, San Fernando, Cádiz (Cortadura), and Gibraltar] were analysed (seeFig. 1).
Because of the temporal limitation of the series for Huelva and Sanlúcar, theclosest complete pluviometric series covering the whole period study was resorted to.Beforehand, the correlation between the series situated at the edges of the study areawas checked. The longest instrumental series for the south of the Iberian Peninsulais Gibraltar—from the end of the eighteenth century to the present (Rodrigoet al. 1999). Therefore the possibility of using the Gibraltar series was considered.However, this is not free from problems of homogeneity (González-Rouco et al.2001), and is also limited not only by its significant distance from the study area, butabove all because biogeographically it pertains to a different phytoclimatic subregionand a different faciation of the studied vegetation series (Rivas-Martínez 1988).
Therefore, the stations selected as presenting the longest, most-complete serieswere San Fernando (Cádiz) for precipitation (1817–1998), and Huelva for temper-ature (1903–1982). The series from the San Fernando station was homogenised andcompleted with data from the nearest stations [Cádiz (Cortadura) and Gibraltar].Although the observations from the Cádiz-San Fernando stations date from themid-eighteenth century (Barriendos et al. 2002), our study is concentrated on thenineteenth and twentieth centuries.
With regard to precipitation, the series of annual and seasonal mean precipitation,the accumulated frequency of wet and dry years, and the relative accumulateddeviation of the annual mean precipitation (relative to the period 1961–1990) wereanalysed. The analysis of these variables enabled us to study the trends in annual andseasonal precipitation, the points of inflection in the sequence of dry and wet years,and the anomalies in these trends from the beginning of the nineteenth century. In

532 Climatic Change (2010) 100:525–557
all cases, the core and dispersion statistics were calculated based on the hydrologicalyear (September–August).
For the analysis of the trends in precipitation and temperature, the criteria ofGarcía Barrón (2002) and García-Barrón and Pita (2004) for the stations of the SWIberian Peninsula were followed. In order to see the effect of possible changes inthe sequence of wet and dry years, the analysis of quintiles was used (Arlery et al.1973; Sousa et al. 2004)—the distribution is divided into five ranges depending on theperiod of reference. This is the methodological approach recommended by the WorldMeteorological Organisation and the Spanish National Institute of Meteorology toclassify the months or years as very dry, dry, normal, wet, and very wet. From thesedata, the frequency of each class was calculated, and then the accumulated frequency,to detect any possible point of inflection, following the criteria of Sousa et al. (2004).
4 Results
The results obtained are grouped in three sections, each corresponding to a differentdiscipline: first are those referring to the regression of the surface of the lagoonsand the length of the brooks of the study area during the period 1869–1987, and theirrelationship with the anthropic activity; second is the quantitative analysis of changesin place names that make reference to wetlands in the study area from 1869 to 1987;the third section complements the aforementioned results with a study of climatetrends, more relevant for aquatic ecosystems, detected at the stations closest to thestudy area.
4.1 Evolution of the shallow lagoons and brooks of Doñana Natural Park
Figure 2 shows the changes in the length of the small coastal creeks and the surfacearea of the shallow lagoons of the study area.
Overall, during this period, the brooks have regressed by 65.9% from 1869 to 1987.However, as seen in Fig. 2, the slope of the change in the length of the small brooksduring the process of desiccation is not constant. More specifically, the annual rate ofregression goes from 126.7 m/year (period 1869–1956) to 433.7 m/year (period 1956–1987).
The shallow lagoons have decreased in surface area by 77.3% from the end ofthe nineteenth century. In this case too the regression has increased very markedlyduring the second half of the twentieth century, going from 7.6 ha/year (period 1869–1956) to 42.0 ha/year (period 1956–1987). Despite the rate of regression being lessmarked during the period 1869–1956, this reduction is very significant. The largestshallow lagoons had already disappeared by the end of the nineteenth century. Ofthe seasonal ones, the drying up of the Laguna de Invierno (Winter Lagoon) isnoteworthy. At the end of the nineteenth century, this occupied 397.5 ha and hada maximum length of 5.7 km, according to the microrelief data. The two largest peatbogs of the zone were in a similar situation: the Laguna Mediana (Median Lagoon;which occupied 58.2 ha and had a maximum length of 2.0 km) and the Laguna delHilo or La Higueruela (Stream Lagoon or Stinking Clover Lagoon; with a surfacearea of 155.0 ha and a maximum length of 2.7 km), which also disappeared at the end

Climatic Change (2010) 100:525–557 533
Fig. 2 Regression of the shallow lagoons and the small Atlantic coastal brooks in the study area(1869 to 1987)
of the nineteenth century. The characteristics of these lost lagoons are establishedby the historical maps (Coello 1869; Gonzalo y Tarín 1870; Valverde 1880; CarrascoPadilla 1892; Ibáñez de Íbero 1902), by written documentary sources (Valverde 1885–1888 and 1880), and by the reconstruction of the microrelief of this zone of theDoñana Natural Park.
Although the two lagoon types (seasonal and peat bogs) of the study area haveclearly undergone a regression, the behaviour in each case is very different. The peatbogs were reduced by 2.4 ha/year from 1869 to 1956, while for the seasonal ones thereduction was more than double (5.2 ha/year). From 1956–1987, the reduction wasdue essentially to an intense drying up of the peat bogs (43.6 ha/year), as the surfacearea of the seasonal lagoons varied very little with respect to 1956. This differencecould be related with a reduction in precipitation between 1869 and 1956, as themost-significant reduction during this period is seen in the epigenically fed lagoons(the seasonal ones), which depend directly on the precipitation.
In any case, to analyse the causes of these changes, it is necessary to know theecological history of the study area during this period in order to establish a possiblecausality. For this it has been necessary to review different historical documentsdated from AD 1311 to 1992, which are listed in Appendix 3. Appendix 4 gathers themain events marking the different phases in the exploitation of the natural resourcesof the Doñana Natural Park area studied in the period from the sixteenth to thetwenty-first centuries. The results of this analysis, completed with the more-recentbibliographic sources and the photointerpretation of the flights of 1956, 1987, and2000, reveal the main soil uses, and also give an idea of the intensity of exploitationfor each of them, as shown in Fig. 3.
Until 1879, this territory was not included in the property register (seeAppendix 4), for three main reasons: firstly, the soils are oligotrophic; secondly,due to the roughness of the territory; and finally, because of the unhealthiness ofthe zone associated to the transmission of malaria by the mosquitoes that bred

534 Climatic Change (2010) 100:525–557
Fig. 3 Evolution of soil uses inthe study area (sixteenth totwenty-first centuries),including the periods oftransition between them(indicated with dashed lines).The dif ferent tones give anidea of the intensity of theexploitation of the naturalresources for each soil use, andthe intersection of the bar withthe abscissa marks the date ofstart and end of each period
in the numerous lagoons (Sousa et al. 2006a). These three characteristics of thestudy area can be tracked in various documents throughout its history, as seen inAppendix 3 (e.g. Alfonso XI 1331–1350; Heraso 1890a; De La Lama 1941 and 1951)or in different bibliographic references (Espina and Estévez 1993; García Murilloand Sousa 1997).
The foregoing explains why until the end of the nineteenth century this was anarea not only without a property register, but was also unknown and bare of popu-lation, apart from some fishermen, lighthouse keepers, and carabineers around thecoastal watchtowers of La Higuera and Del Oro (see Files D-13, D-24 and D-27 fromthe end of the sixteenth and eighteenth centuries, Appendix 3). This is why the use ofthe natural resources was limited to charcoal burning and fishing, in the zone closestto the coastal strip, and occasional hunting (as reported at the start of the seventeenthcentury in Pedro de Espinosa’s chronicle of King Felipe IV in Doñana; Appendix 3).
This situation changed drastically after the Spanish Civil War (1936–1939). Asa consequence of the international isolation associated to the end of the conflict,there was an urgent need for all types of raw materials to get yields from thesevery unproductive soils. An ambitious project of reforestation with Pinus pineaand Eucalyptus camaldulensis and Eucalyptus globulus was designed and put intopractice (Espina and Estévez 1993; Sousa and García Murillo 2001). This resulted inthe drying up of numerous lagoons, especially those—such as the peat bogs—thatconstituted an ideal breeding ground for the transmission of malaria (Kith 1936;De La Lama 1951, 1976; Sousa et al. 2006a). At the end of the 1940s, around 30new roads were opened in the study area to allow the development of these forestrymonocultures.
In Fig. 4 it can be seen that, during the period 1956 to 1987, the greater part of theterritory was occupied by the forestry monocultures associated to the production ofthe species of pine and eucalyptus mentioned.
Until the mid 1930s, the zone was a demographic desert, although in 1955 thenumber of inhabitants had increased to almost 945, the increase being largely thelabourers living in the forest settlements. In parallel, the reforested area increasedfrom 1,245 ha in 1936 to 18,381 ha in 1956 (see Fig. 4a). In 1966, it exceeded 22,000 ha,although after this date the spread of the forestry monocultures decreased (as didthe number of inhabitants, which in 1986 had fallen to 191). Thus, anthropic activitywas very intense in the study area, but only during the second half of the twentiethcentury.

Climatic Change (2010) 100:525–557 535
(B)(A)
Fig. 4 Diagram of sectors of the area occupied by the different soil uses, obtained from theinterpretation of the aerial photographs of 1956 (a) and 1987 (b)
4.2 Changes in the place names referring to wetlands in the study area
Table 3 displays the total number of place names gathered from the most-reliablehistorical maps of 1869 to 1987, together with those making reference to lagoons,brooks, and other types of wetland (following the classification of Table 2).
In Table 3 it can be seen that—in general—the total number of place names tendsto increase with time, as does the number of hydronyms. A graphical summary ofthis is given in Fig. 5.
These results demonstrate that hydronyms, regardless of their type, tend to growin absolute numbers with time (as territories become better known and the mapsbecome more detailed), in agreement with other studies on this subject (Sousa andGarcía Murillo 2001).
Therefore, in order to visualise trends in the various specific types of toponym, itis essential to calculate their proportion of the total number, as displayed in Fig. 6.
This figure clearly reflects the falling trend in the percentage of toponyms re-ferring to the wetlands and places names of other wetlands. In the case of brooks(Fig. 7a) and lagoons (Fig. 7b), there is also a reduction that coincides with the trendsshown in Fig. 2.
Figure 7 reveals that the evolution in the reduction of place names making refer-ence to brooks is different from that in those referring to lagoons. It is noteworthythat the reconstruction of the lost large lagoons, such as the Laguna de Invierno
Table 3 Number and date of the place names shown on the maps
Year of reference 1987 1981 1972 1947 1936 1897 1869
Total number of place names 184 123 89 116 91 48 41Place names of lagoons 31 28 21 23 17 22 4Place names of brooks 15 15 9 12 6 2 10Place names of other wetlands 6 4 3 3 5 4 7Total of place names to referring to wetlandsa 50 45 32 36 26 25 20
For year reference, see Appendix 1aIn some cases, the total of hydronyms does not coincide with the total of lagoons, brooks, andother wetlands, because sometimes the same place name presents the two uses. For example: StreamLagoon (Laguna del Hilo) or Well Lagoon (Laguna del Pozo)

536 Climatic Change (2010) 100:525–557
Fig. 5 Total number of toponyms analysed for each of the dates studied, as well as the absolutenumber of place names referring to wetlands for each of the dates studied
(Winter Lagoon), from the microrelief (Fig. 8a) and historical map of 1869 (Fig. 8b),shows that the drying up of a large lagoonal basin (named by a single place name)—at the end of the nineteenth century—can give rise to the appearance of numeroussmall basins (Fig. 8a), with their own place names.
In the case of the brooks, it can be seen that the drastic reduction in their lengthwas, from 1869 to 1987, coupled with the transformation first, and disappearanceafterwards, of most of the place names referring to them. Figure 9a reconstructs the
Fig. 6 Changes in the total toponyms referring to wetlands and place names of other wetlands(percentage) in the study area (1869 to 1987). The dating of the end of the Little Ice Age in Andalusia(1890) is taken from Castro-Díez et al. (2007)

Climatic Change (2010) 100:525–557 537
Fig. 7 a Changes in the place names referring to brooks (percentage) in the study area (1869 to1987). b Changes in the place names referring to lagoons (percentage) in the study area (1869 to1987)
situation of these brooks in 1869 and 1987, showing the disappearance of most ofthe hydronyms by the latter date. Figure 9b shows the situation of these brooks withthe original place names, in Spanish, according to the historical cartography of Coello(1869).
4.3 Evolution of the climate trends in Doñana Natural Park (1869–1987)
Analysis of the climate trends reveals various important changes. The annual meanprecipitation does not present statistically significant trends that demonstrate areduction. However, as can be seen in Fig. 10, analysis of the seasonal precipitationreveals a marked trend towards a reduction in spring precipitation, from the end ofthe nineteenth century to date, in agreement with studies carried out at other stationsin SW Spain (García Barrón 2002).
Specifically, the reduction in spring precipitations through the twentieth centuryis a third of the total (60 mm). Although this reduction is balanced by an increasedprecipitation in other seasons of the year, there is in fact a loss in oceanic climate
Fig. 8 a Reconstruction of the original basin of the Laguna de Invierno (Winter Lagoon) at the endof the nineteenth century from the microrelief, including in blue the small lagoonal basins remainingon the map of 1987. b Situation of the Laguna de Invierno (including hydronyms) according to adetail from the map of Coello (1869). See references of historical maps in Appendix 1

538 Climatic Change (2010) 100:525–557
Fig. 9 a Situation of the brooks studied and of the hydronyms referring to them at the end of thenineteenth century and in 1987. b Detail from the map of Francisco Coello (1869)
mildness, an increase in the conditions of summer drought, and—probably—a trendtowards more-arid conditions of mediterraneity during the twentieth century.
The data on the relative accumulated deviation of the annual mean precipitationreaffirm these ideas, as they show a positive trend at the end of the nineteenthcentury (just when the spring precipitation increases). This trend becomes a fallingone—indicating a negative anomaly in the precipitation—at the beginning of the
Fig. 10 Changes in spring precipitation at San Fernando (Cádiz). There is a marked peak at theend of the nineteenth century (after which there is a falling trend, mitigated by the wet years of thetwentieth century)

Climatic Change (2010) 100:525–557 539
Fig. 11 The annual precipitation shows a positive anomaly (increase in precipitation at the end ofthe nineteenth century), which remains constant until the start of the twentieth century, coincidingwith the third and last wet peak of the LIA in southern Spain
twentieth century (see Fig. 11). This marked change in the trend also coincides witha turning point in the sequence of wet years versus dry ones revealed by the analysisof quintiles in the precipitation series of San Fernando, Cádiz (Sousa et al. 2006b).
The mean temperatures in Andalusia (S Spain) have changed in concert withthose of the Iberian Peninsula, characterised by a twentieth century warming intwo periods: one in the first half of the twentieth century, and the second—moremarked—starting in the 1970s (Castro-Díez et al. 2007). Also very striking—because
Fig. 12 At the station of Huelva the mean minimum temperature has increased. In contrast, nostatistically significant trend is seen in the mean maximum temperature for this period

540 Climatic Change (2010) 100:525–557
of its effects on the biological ecosystems—is the trend towards a significant increasein the mean minimum temperature during the twentieth century. These aspects canbe seen in Fig. 12.
5 Discussion
The separately presented data of the three different disciplines for the same studyarea and the same time period must be interpreted jointly. The combined analysisand discussion of the different results gives a new overall perspective as a conse-quence of the interdisciplinary analysis.
5.1 The hydronyms of Doñana Natural Park (Spain) as indicators ofenvironmental changes
The results demonstrate how the historical perception of the evolution of the wet-lands in the study area can be followed up by quantitative analysis of the toponymsreferring to them (Figs. 2 and 6). Consequently, these results confirm the possibilityof using this tool as an indicator of the historical regression of the wetlands, in thesame way that previous studies have demonstrated the usefulness of this procedurein following up changes in the vegetation cover (García Latorre et al. 2001) or thefauna (Cox et al. 2002; Moore 2002), or territorial changes (Sousa and García Murillo2001; Sweeney et al. 2007).
Until the first third of the twentieth century, anthropic activity was restrictedessentially to predatory and gathering activities, above all close to the coast, anddoes not explain the changes detected in the wetlands of the study zone. Thesewetlands are located more than 10 km from the Guadalquivir marshes. In this regard,Rodríguez-Ramírez and Yáñez-Camacho (2008) state that although a subsidence ofmarsh sediments is possible, the different works in the Guadalquivir estuary have notfor the moment shown this to be the case.
Nor have the studied wetlands, situated on a very permeable sandy layer, anddistant from the Guadalquivir floodplain, been affected by floodings; however,they have been affected by geomorphological processes linked to the dynamicsof the sands. Of note have been the regression of the Asperillo coastal cliff andthe mobilisation of surface sands (Granados et al. 1988). This latter aspect will bediscussed later, during the analysis of the regression of the small coastal brooks,because—as indicated by Granados et al. (1988) and Sousa and García Murillo(2003)—it has a strong climatic component linked to the driest periods.
Thus, having ruled out other possibilities of anthropic (see Fig. 3) or natural origin,we have to examine the changes in the wetlands of the study zone in relation withthe contemporary climate trends, particularly those linked to precipitation, as seenin Section 4.3. The analysis of the trends in precipitation (Figs. 10 and 11) in relationwith the regression of shallow lagoons and brooks in the study area (Fig. 2) revealsthat the regression of the wetlands coincides with a reduction in the frequency ofclimatically wet years and an increase in that of dry ones at the end of the nineteenthcentury—the end of the LIA in Andalusia (S Spain).
This change in the wetlands, despite the latitudinal differences, which coincidesin time with changes in the Arctic, denominated post-Little Ice Age warming, could

Climatic Change (2010) 100:525–557 541
be the result of the post-nienteenth century warming. For example, changes in thecomposition of diatoms in lakes of Finland (Sorvari et al. 2002) or Canada (LeBlancet al. 2004), changes in the treeline trees in Alaska (Lloyd and Fastie 2002), or Arcticglacial regression (Zeeberg and Forman 2001), among others. These results are alsocoherent with the increase in the mean minimum temperatures detected in the studyarea (García-Barrón and Pita 2004).
Independently of the general coherence shown by the reduction of the wetlandsstudied, and of their hydronyms, there is a very striking difference in the trendsshown by the place names of lagoons and brooks for the same study area: the trend ofthe hydronyms of the brooks (Fig. 7a) shows a better fit to the process of regressionand the trends of the studied climate variables. The trend of the hydronyms thatmake reference to the lagoons, with a marked increase precisely in 1897 (at the endof the LIA, when the increase in the number of dry years versus wet ones begins)(Fig. 7b), is out of step with the reduction in the lagoonal surface area. This poses thequestion of how is it possible that in 1869 the percentage of hydronyms of lagoonswas much lower, when the surface area occupied by the lagoons was much greaterthan in later periods? The explanation is—in our opinion—related with the size ofthe lagoonal basins and their representation on the maps.
The source of the 1869 data is the map of Coello (1869; Fig. 8b), on which appearthe lost large lagoon formations (Median Lagoon, Winter Lagoon, Stream Lagoon orStinking Clover Lagoon, etc.), so that basically it shows these large lagoons and littleelse. In contrast, the reference map for 1897 (Noriega and Cobo del Guzmán 1897)does not show these large lagoons—in their place are numerous small basins, eachwith its own hydronym. Thus, the total surface area of the lagoons in the study areais reduced, but the number of lagoonal basins, and their corresponding hydronyms,is increased (see Fig. 8a).
This situation continues at later dates. The toponymic analysis therefore endorsesthe interpretation of the evolution of the lagoons developing throughout this study.However, there is a limitation imposed by the difficulty to distinguish between hy-dronyms that make reference to the basins of peat bogs and those making referenceto the basins of seasonal lagoons.
It might be thought that, if the lost large lagoons had such large surface areas,signs of the existence of these wetlands should remain in the local toponymy. Thus,the local names where the lost large lagoons (peat bogs and seasonal ones) werelocated have been analysed on the present-day topographic map at 1:10,000 scale.The result is very illuminating, as a total of 24 hydronyms appear in this area. Inthe space occupied originally by the lost Median Lagoon appear Stinking CloverLagoon, Moguer Lagoon, Cow Lagoon, and Jiménez Lagoon. In the zone of theStream Lagoon or Stinking Clover Lagoon appear Reedy Lagoon, Moor ThicketLagoon, Abalario Lagoon, Puddles, and Stream. It seems non-coincidental that theselast two place names are in a zone where no lagoonal basin is found today, but whichcorresponds with the location of one of the lost large peat bogs. Finally, in the spaceoccupied originally by the large Winter Lagoon, there are four hydronyms in1987, probably corresponding to lower, residual zones of the ancient lagoon thatdisappeared at the end of the nineteenth century (Lagoon, High Corral Lagoon,Small Turmas Lagoons, and Burnt Lagoon).
Thus, the analysis in Appendix 2 reveals how the hydronyms of the large lagoonsdisappeared after 1869, to be substituted (from 1897) by other hydronyms that

542 Climatic Change (2010) 100:525–557
refer to smaller lagoons. As pointed out in the Arctic Climate Impact Assessment(Huntington and Fox 2005, p. 66), place names reflect perceptions of the environ-ment, and can serve as a repository for accumulated knowledge.
With the brooks, the effect is different. In 1869, they undergo an intense regres-sion. Why? Undoubtedly, as seen in Fig. 11, this coincides with the end of a wetperiod especially marked by the increase in spring precipitation (Fig. 10), whichnot only helped start the desiccation of the vegetation, but also promoted erosionalprocesses. Given that in this zone the substrate is a Quaternary Aeolian layer, thealternation of wet and dry periods helped mobilise the most-superficial sands by theaction of wind (and to a lesser extent, by that of water). This process, known assecondary dunization (Granados 1987), has been extensively studied in the neigh-bouring Doñana National Park. For the study area, there is historical documentationthat, precisely for the end of the 19th century (Granados 1987), notes the effects ofthese “filling sands” or “flying sands” silting up the lowest zones of the wetlands. As aresult, not only is there an acceleration in the drying up of the studied wetlands by thereduction of the variables linked to precipitation, but also by the increase in climatevariability. With regard to the relationship with the intensification of the erosionalprocesses, climatic conditions inducing the LIA glacial advances were also respon-sible for an increase in flooding frequency and sedimentation in MediterraneanEurope (Grove 2001).
In the particular case of the brooks, secondary dunization helps the naturalprocesses filling their talweg. This in turn enables the substitution of the more-hygrophytic vegetation associated to the alluvial phreatic level by a xerophytevegetation that acts as a sediment trap, capturing the wind-borne “flying sands” ina continuous loop of positive feedback leading to the regression and disappearanceof the brooks. Subsequently, the clearing of the native vegetation by man, and itssubstitution by fast-growing species during the second half of the twentieth century,exponentially accelerated desiccation by facilitating the liberation of the “flyingsands” and the reduction of the phreatic level. This process can be followed indetail in the unpublished forestry reports of 1932 to 1978 (see Appendix 3), byinterpretation of the aerial photographs of the period (Fig. 4), and by the sequence ofdisappearance of the lagoons in relation with their isopiezometry (Sousa et al. 2006b)or the hydrogeological models for the study area (Trick and Custodio 2003; Manzanoet al. 2005).
The foregoing is clearly reflected in the place names lost after 1869—most makingreference to brooks (such as Charcoal Burners’ Brook, Floury Brook, MarzagónBrook, Morla Brook, or Rompe-culos Brook). The names of others were alteredwhen the brooks regressed, as seen in Fig. 9a.
In fact, examination of Fig. 7a and b reveals that—at least in this case—the alter-ations in the hydronyms reflect the natural changes (climatic turning point at the endof the nineteenth century) better than the anthropic ones (desiccation of the wetlandsduring the second half of the twentieth century as a consequence of reforestation).The interpretation of these trends is complex, and requires a more-detailed analysisof each of the hydronyms involved. However, it may be affected by the fact that theplace names that make reference to natural elements remain on the maps in greaternumber and for longer than those of artificial ones (Sousa and García Murillo 2001).

Climatic Change (2010) 100:525–557 543
5.2 Hydronyms and post-LIA warming
As has been seen, the analysis of the seasonal precipitation reveals a markedtrend towards the reduction of spring precipitation from the end of the nineteenthcentury to date, in agreement with other studies in the Iberian and Andalusianambit reviewed by Aguilar (2007), with the greatest reduction in March. In thewhole of Andalusia (the region in southern Spain that includes the study area)there is a general falling trend in the spring and annual precipitation series, verysignificant for spring, and fitting the significance limits for annual data (Castro-Díezet al. 2007). This effect, with the added impact of the increase in the variabilityof the precipitation at the end of the nineteenth century on the wetlands (by theintensification of erosional processes), is shown in Fig. 11.
The results presented in Fig. 6 show a clear reduction in both the length of thebrooks and the surface area of the lagoons in Doñana Natural Park. This generalisedregression of the wetlands in the study area coincides with the third and last humidpeak of the LIA, dated at the end of the nineteenth century for southern Spain(Rodrigo et al. 1999) and in the period 1830–1870 for the Spanish Mediterraneancoastal area (Barriendos and Martín-Vide 1998). Consequently, this desiccation isdue, firstly, to the end of the LIA and, later, during the second half of the twentiethcentury, to an intensive reforestation process in the area (Sousa and García Murillo2001) with fast-growing species (especially Eucalyptus globulus and Eucalyptuscamaldulensis). The importance of the increase in the thermal variables and thereduction in the precipitation of March during the twentieth century (Aguilar 2007)is more difficult to quantify, although should not be underestimated.
Thus, in the study area the changes in the hydronymy during the period 1869–1987are the consequence of a climatic turning point that affects the wetlands of DoñanaNatural Park and the hygrophytic vegetation associated to them. This turning pointcoincides with what, in more northern latitudes of the northern hemisphere, hasbecome known as post-LIA warming. We believe the hydronyms may be a tool ofinterest as indicator of the effects of recent climate change, at least in particularcontinental aquatic ecosystems, as has been demonstrated by Spens (2006) for thepresence of fish taxa in lakes of northern Sweden, or Sweeney et al. (2007) inreconstructing former floodplain connectivity in the Morava River (Czech Republic).
The fact that it is precisely the place names making reference to the wetlandsthat give good results when analysing the effects of the LIA in southern Spain isworthy of a brief reflection, as it seems to be no coincidence. In fact, the changes inthe continental aquatic ecosystems and in the rivers have, historically, been of greatimportance for human survival and development. This explains why their periods ofgreat fluctuations are noted in detail in historical documents and archives, especiallyin latitudes, such as Mediterranean ones, where there is often a water shortage. Goodexamples of this in southern Europe are historical flood events (Brázdil et al. 1999;Barriendos and Martín-Vide 1998; Barriendos and Rodrigo 2006) or the rogationsfor rain and fair weather (Martín-Vide and Barriendos 1995). It is not surprising thatthe fluctuations in wet ecosystems reflected in these trends are quickly incorporatedinto local place names. Although they cannot be used as proxy data, they can beused to mark climate changes or turning points, in the same way as has happened

544 Climatic Change (2010) 100:525–557
recently with other indicators, such as the evolution of particular insects (Bucklandand Wagner 2001; Dusoulier 2001), or the autos de fé, when witches were burnt inEurope during the coldest phases of the LIA (Behringer 1999).
6 Conclusions
Data from studies of vegetation (García Murillo and Sousa 1997), lagoons (Sousaand García Murillo 2001; Sousa et al. 2006b), and hydrogeological levels (Sousa andGarcía Murillo 2003; Trick and Custodio 2003; Manzano et al. 2005) demonstratethat the recent desiccation of the wetlands of Doñana Natural Park is due to theimplantation of monocultures of fast-growing species. However, although the impactof this is more conspicuous because it is more recent and intense, the consequencesof recent climate trends on these same aquatic ecosystems should not be sidesteppedor disparaged.
The end of the LIA has led to a gradual reduction in the phreatic levels, affectingthe more-stenohydric plant communities and associated wetlands of the study area.The coincidence at the end of the nineteenth century of the historical climatic data(Granados et al. 1988; Rodrigo et al. 1994, 1999; Barriendos and Martín-Vide 1998)with the reconstruction of the occupied area in the zone and of the lost large lagoons,suggests that this is a biological turning point of climatic origin, and independent ofthe later anthropic activity in the study area.
The use of the term LIA continues to be controversial (IPCC 2001; Jones andBriffa 2001; Jones and Mann 2004; Hunt 2006), because—among other reasons—as pointed out by Ogilvie and Jónsson (2001) it refers to three different concepts.Despite the possible inappropriateness or inaccuracy of this term for southernlatitudes, in this study, we understand it not as referring to a small global glaciationin the strict sense, but to a period of time that was not uniformly cold in either spaceor time sensu (Ogilvie and Jónsson 2001).
In the case of Andalusia, the end of the LIA brought not only a warming butalso a reduction in the number of wet years (Sousa et al. 2004, 2006b). Thus, thereappear two climatic processes with continuity in time that—in the case of the easterncoast of Huelva (S Spain)—lead synergically to a reduction of water availabilityat soil level and of feeding the phreatic levels. This would be the outcome of anincrease in the number of dry and very dry years (end of LIA), and an increase inthe heat variables as a consequence of warming during the twentieth century. Theseresults are in accord with the predictions from the Preliminary General Assessmentof the Impacts in Spain of Climate Change (Fernández-González et al. 2005), whichconsider likely the aridification of the Mediterranean ecosystems of southern Spain.
The results of this study verify the idea expressed by Henshaw (2006), and thus—at least in certain cases—place names, together with other data, can be used asenvironmental indicators of climate change.
The potential interest of these results, obtained on wetlands of southern Europe,is greater still bearing in mind they are in accord with the Arctic Climate ImpactAssessment (Huntington and Fox 2005; Nuttall et al. 2005). They confirm thesensitivity of local names to environmental change, and more specifically to theconsequences of the most-recent climatic turning points, and thus open the way forfuture studies of this type.

Climatic Change (2010) 100:525–557 545
Acknowledgements This study has been financed by the Spanish Ministry of Education andScience (Project CGL2006-07194/BOS).
Appendix 1: Historical maps used for the quantitative analysisof the place names
1869. Huelva. F. Coello.1897. Provincia de Huelva, nivelación. Instituto Geográfico Estadístico. F. Noriega
and J. Cobo del Guzmán. 1897–1900.1936. Mapa Geológico de España 1:50,000 y memoria explicativa. Sheet 1.017
(“El Asperillo”). J. Gavala y Laborde. Ed. I.G.M.E.1947. Mapa Topográf ico Nacional 1:50,000. Sheet 1.000 (Moguer) and Sheet 1.017
(“El Picacho”). 1st ed.1972. Mapa Topográf ico Nacional 1:50,000. Sheet 1017 (“El Abalario”). 2nd ed.
1974. Instituto Geográfico y Catastral.1981. Cartografía Militar de España. 1:50,000. Series L, Sheet 10–14 (1017)
(“El Abalario”). 1981, 2nded. 1984. Sheet 10–41(1000) (“Moguer”). 1982,2nd ed. 1988.
1987. Mapa Topográfico de Andalucía, 1:10,000. Ed. C.E.T.U., Junta de Andalucía.Sheets: 4–4, 3–3, 4–3, 3–1, 2–3, 2–1, 4–4, 2–4 and 2–2.
Appendix 2
Table 4 Hydronyms list, Doñana Natural Park (Abalario)
LagoonsLaguna (Lagoon) 1936 1897Laguna Ansares 1981 1972 1947 1936 1897 1869
(Goose Lagoon)Laguna Carrizosa 1987 1981 1972 1947 1936 1897
(Reedy Lagoon)Laguna Corral Alto 1987 1981 1972
(High Corral Lagoon)Laguna Chica 1987
(Little Lagoon)Laguna Granadilla 1987
(Granadilla Lagoon)Laguna Jiménez 1987 1981 1972 1947 1936 1897
(Jiménez Lagoon)Laguna Jiménez II 1972 1947
(Jiménez II Lagoon)Laguna Juanito 1987 1897
(Juanito Lagoon)Laguna Mata del Moro 1987 1981 1972 1947
(Moor Thicket Lagoon)Laguna Ojuelo 1897
(Eyeglass Lagoon)Laguna Quemada 1987 1981 1972
(Burnt Lagoon)Laguna Redonda 1981 1947 1897
(Round Lagoon)

546 Climatic Change (2010) 100:525–557
Table 4 (continued)
Laguna Vento 1981 1972 1947 1936(Vento Lagoon)
Laguna Verdeja 1987(Verdeja Lagoon)
Laguna Valluncosa 1897(Bulrush Lagoon)
Laguna de Invierno 1869(Winter Lagoon)
Laguna de Moguer 1987(Moguer Lagoon)
Laguna de Moguer I 1981(Moguer Lagoon I)
Laguna de Moguer II 1981 1972 1947(Moguer Lagoon II)
Laguna de Pino Alto 1987(Tall Pine Lagoon)
Laguna de Talmosal 1947(Talmosal Lagoon)
Laguna del Abalario 1987(Abalario Lagoon)
Laguna del Acebuche 1987(Wild Olive Lagoon)
Laguna del Cesto 1987 1981 1972 1947 1936 1897(Basket Lagoon) 7
Laguna del Conejo 1987 1981 1972 1947(Rabbit Lagoon)
Laguna del Hilo 1869(Stream Lagoon)
Laguna del Hoyo 1897(Hole in the Ground Lagoon)
Laguna del Huerto 1987 1981 1972 1947 1936 1897(Orchard Lagoon)
LagoonsLagunas del Padre Gallego 1936
(Father Gallego’s Lagoons)Laguna del Pozo 1981
(Well Lagoon)Laguna del Pozo Candiles 1947 1936 1897
(OiI-lamp Well Lagoon)Laguna del Sigarrillo 1947
(Cigarette Lagoon)Laguna de la Alcuña 1981 1972
(Nickname Lagoon)Laguna de la Cencerra 1987 1936 1897
(Cowbell Lagoon)Laguna de la Higueruela 1869
(Stinking Clover Lagoon)Laguna de la Res 1981 1972 1936 1897
(Stinking Clover Lagoon)Laguna de la Vaca 1987 1936 1897
(Cow Lagoon)
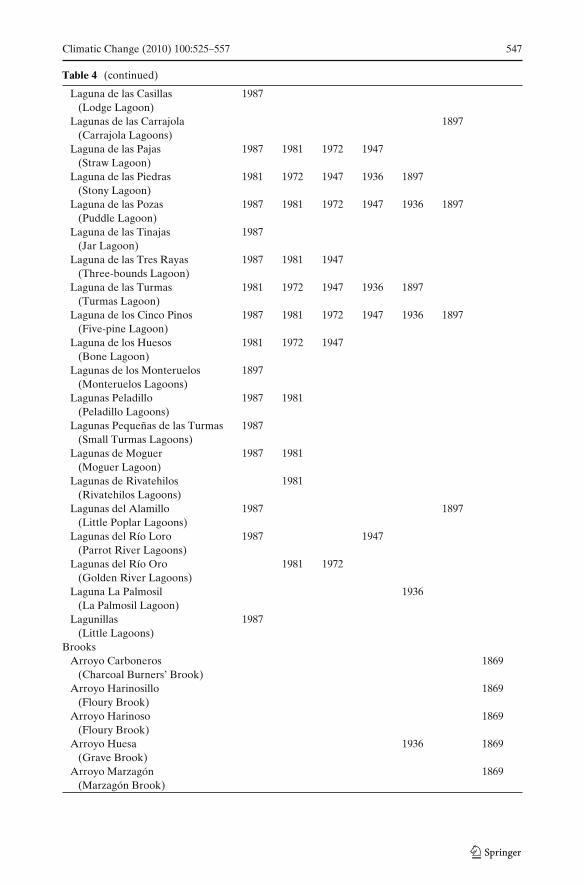
Climatic Change (2010) 100:525–557 547
Table 4 (continued)
Laguna de las Casillas 1987(Lodge Lagoon)
Lagunas de las Carrajola 1897(Carrajola Lagoons)
Laguna de las Pajas 1987 1981 1972 1947(Straw Lagoon)
Laguna de las Piedras 1981 1972 1947 1936 1897(Stony Lagoon)
Laguna de las Pozas 1987 1981 1972 1947 1936 1897(Puddle Lagoon)
Laguna de las Tinajas 1987(Jar Lagoon)
Laguna de las Tres Rayas 1987 1981 1947(Three-bounds Lagoon)
Laguna de las Turmas 1981 1972 1947 1936 1897(Turmas Lagoon)
Laguna de los Cinco Pinos 1987 1981 1972 1947 1936 1897(Five-pine Lagoon)
Laguna de los Huesos 1981 1972 1947(Bone Lagoon)
Lagunas de los Monteruelos 1897(Monteruelos Lagoons)
Lagunas Peladillo 1987 1981(Peladillo Lagoons)
Lagunas Pequeñas de las Turmas 1987(Small Turmas Lagoons)
Lagunas de Moguer 1987 1981(Moguer Lagoon)
Lagunas de Rivatehilos 1981(Rivatehilos Lagoons)
Lagunas del Alamillo 1987 1897(Little Poplar Lagoons)
Lagunas del Río Loro 1987 1947(Parrot River Lagoons)
Lagunas del Río Oro 1981 1972(Golden River Lagoons)
Laguna La Palmosil 1936(La Palmosil Lagoon)
Lagunillas 1987(Little Lagoons)
BrooksArroyo Carboneros 1869
(Charcoal Burners’ Brook)Arroyo Harinosillo 1869
(Floury Brook)Arroyo Harinoso 1869
(Floury Brook)Arroyo Huesa 1936 1869
(Grave Brook)Arroyo Marzagón 1869
(Marzagón Brook)

548 Climatic Change (2010) 100:525–557
Table 4 (continued)
Arroyo Morla 1869(Morla Brook)
Arroyo Rompe-culos 1869(Rompe-culos Brook)
Arroyo de Arenosillo 1987Arroyo de Bernabé 1987 1981 1972 1947 1936 1897 1869
(Bernabé Brook)Arroyo de Rocinela 1981
(Rocinela Brook)Arroyo de Santa María 1987
(St. Mary’s Brook)Arroyo del Aguila 1987
(Eagle Brook)Arroyo del Alamillo 1987
(Little Poplar Brook)Arroyo del Fresnillo 1981 1972 1947
(Little Ash Brook)Arroyo del Loro 1987 1981 1947
(Parrot Brook)Arroyo del Mazagón 1981 1972 1947 1936
(Mazagón Brook)Arroyo del Naranjalejo 1981 1972 1947
(Orangery Brook)Arroyo del Oro 1972 1869
(Golden Brook)Arroyo del Pepino 1987
(Cucumber Brook)Arroyo del Pino 1981
(Pine Brook)Arroyo del Pino Gordo 1972
(Big Pine Brook)Arroyo del Tojar del Lagarto 1947
(Lizard Gorse-patch Brook)Arroyo de la Casa Cabrera 1981 1972 1947
(Goatherd’s House Brook)Arroyo de la Celudia 1981 1947
(Celudia’s Brook)Arroyo de la Comba 1987 1981 1947
(Skipping-rope Brook)Arroyo de la Portuguesa 1981 1947
(The Portuguese Woman’s Brook)Arroyo de la Rocina 1987 1981 1947 1936 1897
(Rocina’s Brook)Arroyo de la Zorra 1981 1972 1947
(Vixen Brook)Arroyo de las Lagunillas 1987
(Little Lagoon Brook)Brooks
Arroyo de Las Madres del Avitor (Mothers of Avitor Brook) 1987 1981 1972 1936Arroyo de los Algados (Algados Brook) 1987Arroyo de los Hilos (Stream Brook) 1869Arroyo Julianejo (Julianejo Brook) 1936Arroyo Julanejo (Julanejo Brook) 1987

Climatic Change (2010) 100:525–557 549
Table 4 (continued)
Arroyo Rociana (Rociana Brook) 1987Río Loro (Parrot River) 1987 1981
Other wetlandsArroyo de las Lagunil1as (Little Lagoon Brook) 1987Canaliega 1869Canalillo del Saladillo (Saladillo Channel) 1869Caño de Guaperal (Guaperal Spout) 1869Caño de la Casa del Conde (The Count’s House Spout) 1869Charco Acebrón (Acebrón Pool) 1936 1869Charco de la Taorma (Taorma’s Pool) 1869Charquillos (Puddles) 1987Chorrito Bajo (Low Stream) 1987 1981 1972 1947Fuente (Spring) 1936Fuente del Pepino (Cucumber Spring) 1981 1972Hilo (Stream) 1987Laguna de las Pozas (Puddle Lagoon) 1987 1981 1972 1947 1936 1897Laguna del Hilo (Stream Lagoon) 1869Laguna del Pozo (Well Lagoon) 1981Laguna del Pozo Candiles (Oil-lamp Well Lagoon) 1947 1936 1897Madre del Avitor (Mother of Avitor) 1897Manantial (Spring) 1897Ojuelo (Eyeglass) 1936Pinos de Las Lagunillas (Little Lagoon Pines) 1987
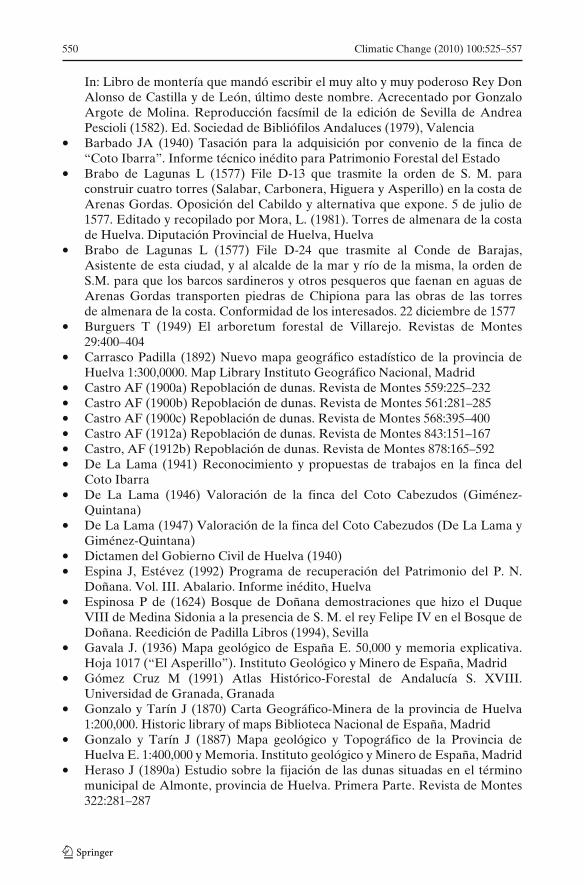
Appendix 3: List of historical documents recording the ecological historyof the study area
• Alfonso XI (1311–1350) Libro de montería que mandó escribir el muy alto y muypoderoso Rey Don Alonso de Castilla y de León, último deste nombre. Acre-centado por Gonzalo Argote de Molina. Reproducción facsímil de la ediciónde Sevilla de Andrea Pescioli (1582). Edita Sociedad de Bibliófilos Andaluces(1979), Valencia
• Álvarez de Cardoso A. (1785) Respuesta del párroco de Almonte D. AlonsoÁlvarez de Cardoso a las Relaciones enviadas por Tomás López. Editadas yrecopiladas: Ruiz González, J. E. (1999). Huelva, según las relaciones enviadaspor los párrocos al geógrafo real Tomás López en el siglo XVIII. DiputaciónProvincial de Huelva, Huelva
• Anon. (1756) File D-27 Relación de las Plazas, Torres, Puestos Fortificados,Edificios Militares y Poblaciones de la Costa de Andalucía desde la Raya Occi-dental del Reyno de Granada hasta la de Portugal en Ayamonte según el Estadoen que se hallan el año 1756. Editado y recopilado por Mora, L. (1981). Torresde almenara de la costa de Huelva. Diputación Provincial de Huelva, Huelva
• Anon. Camino de unión Dunas del Odiel- Dunas de Almonte Coto MazagónInforme técnico inédito
• Argote de Molina G (1582) Discurso sobre el libro de la montería que mandóescribir el muy alto y muy poderoso Rey Don Alonso de Castilla, y de León.
550 Climatic Change (2010) 100:525–557
In: Libro de montería que mandó escribir el muy alto y muy poderoso Rey DonAlonso de Castilla y de León, último deste nombre. Acrecentado por GonzaloArgote de Molina. Reproducción facsímil de la edición de Sevilla de AndreaPescioli (1582). Ed. Sociedad de Bibliófilos Andaluces (1979), Valencia
• Barbado JA (1940) Tasación para la adquisición por convenio de la finca de“Coto Ibarra”. Informe técnico inédito para Patrimonio Forestal del Estado
• Brabo de Lagunas L (1577) File D-13 que trasmite la orden de S. M. paraconstruir cuatro torres (Salabar, Carbonera, Higuera y Asperillo) en la costa deArenas Gordas. Oposición del Cabildo y alternativa que expone. 5 de julio de1577. Editado y recopilado por Mora, L. (1981). Torres de almenara de la costade Huelva. Diputación Provincial de Huelva, Huelva
• Brabo de Lagunas L (1577) File D-24 que trasmite al Conde de Barajas,Asistente de esta ciudad, y al alcalde de la mar y río de la misma, la orden deS.M. para que los barcos sardineros y otros pesqueros que faenan en aguas deArenas Gordas transporten piedras de Chipiona para las obras de las torresde almenara de la costa. Conformidad de los interesados. 22 diciembre de 1577
• Burguers T (1949) El arboretum forestal de Villarejo. Revistas de Montes29:400–404
• Carrasco Padilla (1892) Nuevo mapa geográfico estadístico de la provincia deHuelva 1:300,0000. Map Library Instituto Geográfico Nacional, Madrid
• Castro AF (1900a) Repoblación de dunas. Revista de Montes 559:225–232• Castro AF (1900b) Repoblación de dunas. Revista de Montes 561:281–285• Castro AF (1900c) Repoblación de dunas. Revista de Montes 568:395–400• Castro AF (1912a) Repoblación de dunas. Revista de Montes 843:151–167• Castro, AF (1912b) Repoblación de dunas. Revista de Montes 878:165–592• De La Lama (1941) Reconocimiento y propuestas de trabajos en la finca del
Coto Ibarra• De La Lama (1946) Valoración de la finca del Coto Cabezudos (Giménez-
Quintana)• De La Lama (1947) Valoración de la finca del Coto Cabezudos (De La Lama y
Giménez-Quintana)• Dictamen del Gobierno Civil de Huelva (1940)• Espina J, Estévez (1992) Programa de recuperación del Patrimonio del P. N.
Doñana. Vol. III. Abalario. Informe inédito, Huelva• Espinosa P de (1624) Bosque de Doñana demostraciones que hizo el Duque
VIII de Medina Sidonia a la presencia de S. M. el rey Felipe IV en el Bosque deDoñana. Reedición de Padilla Libros (1994), Sevilla
• Gavala J. (1936) Mapa geológico de España E. 50,000 y memoria explicativa.Hoja 1017 (“El Asperillo”). Instituto Geológico y Minero de España, Madrid
• Gómez Cruz M (1991) Atlas Histórico-Forestal de Andalucía S. XVIII.Universidad de Granada, Granada
• Gonzalo y Tarín J (1870) Carta Geográfico-Minera de la provincia de Huelva1:200,000. Historic library of maps Biblioteca Nacional de España, Madrid
• Gonzalo y Tarín J (1887) Mapa geológico y Topográfico de la Provincia deHuelva E. 1:400,000 y Memoria. Instituto geológico y Minero de España, Madrid
• Heraso J (1890a) Estudio sobre la fijación de las dunas situadas en el términomunicipal de Almonte, provincia de Huelva. Primera Parte. Revista de Montes322:281–287

Climatic Change (2010) 100:525–557 551
• Heraso J (1890b) Estudio sobre la fijación de las dunas situadas en el términomunicipal de Almonte, provincia de Huelva. Primera Parte. Revista de Montes322:311–318
• Heraso J (1890c) Estudio sobre la fijación de las dunas situadas en el términomunicipal de Almonte, provincia de Huelva. Segunda Parte. Revista de Montes322:343–348
• Heraso J (1890d) Estudio sobre la fijación de las dunas situadas en el términomunicipal de Almonte, provincia de Huelva. Cultivo de las arenas por medio depinares. Revista de Montes 332:388–397
• Heraso J (1890e). Estudio sobre la fijación de las dunas situadas en el términomunicipal de Almonte, provincia de Huelva. Revista de Montes 322:448–457
• Heraso J (1890f) Estudio sobre la fijación de las dunas situadas en el términomunicipal de Almonte, provincia de Huelva. Revista de Montes 322:472–479
• Heraso J (1890g) Estudio sobre la fijación de las dunas situadas en el términomunicipal de Almonte, provincia de Huelva. Revista de Montes 322:496–502
• Ibáñez de Íbero (1902) Mapa de España 1:500,000. Lit. Instituto Geográfico yEstadístico. Library Instituto Geológico y Minero, Madrid
• I.CO.N.A. (1982) Superficie de Dunas de Almonte después de la permuta conWordl Hotel S.A.
• I.RY.D.A. (1978) Cesión a I.R.Y.D.A. del Coto La Rocina II• Kith M (1952) Diez años de colaboración de la 5a División Hidrológica-Forestal
con Patrimonio Forestal del Estado. Revista de Montes 45:166–152• Madoz P (1848) Diccionario Geográfico-estadístico-histórico de España y sus
posesiones de Ultramar. Biblioteca Santa Ana (reprinted 1990). Almendralejo• Ministerio de Agricultura, Pesca y Alimentación (1965) Informe sobre la
situación del Coto Ibarra desde 1935• Mora Figueroa L (1981) Torres de almenara de la costa de Huelva. Diputación
Provincial de Huelva, Huelva.• Patrimonio Forestal del Estado (1940) Características del Coto Ibarra antes de
comprarlo• Patrimonio Forestal del Estado (1940) Escrituras de Compra/Venta a Coto
Atlántico del Coto Ibarra• Patrimonio Forestal del Estado (1940) Memoria y reconocimiento de montes y
propuestas de trabajos del Coto Ibarra• Patrimonio Forestal del Estado (1940) Relación de arrendatarios del Coto Ibarra• Patrimonio Forestal del Estado (1940) Tasación para la adquisición de la finca
del Coto Ibarra• Patrimonio Forestal del Estado (1941) Escritura del Coto Bayo• Patrimonio Forestal del Estado (1941) Expediente para la adquisición por
convenio del Coto Bayo• Patrimonio Forestal del Estado (1941) Oferta de venta de Forestal de Villarejo
del Coto Bayo• Patrimonio Forestal del Estado (1942) Escritura de Compra/Venta del coto
Bodegones• Patrimonio Forestal del Estado (1942) Escritura de Compra/Venta del Coto
La Matilla• Patrimonio Forestal del Estado (1942) Plano del predio rústico del Coto
La Matilla E. 1:20,000

552 Climatic Change (2010) 100:525–557
• Patrimonio Forestal del Estado (1942) Valoración en informe previo sobre cotoLa Matilla
• Patrimonio Forestal del Estado (1942) Valoración de la finca del coto Bodegonespor De La Lama
• Patrimonio Forestal del Estado (1946) Informe y valoración del Coto La RocinaII (De La Lama 1946)
• Patrimonio Forestal del Estado (1947) Escritura de Compra/Venta del CotoLa Rocina II
• Patrimonio Forestal del Estado (1948) Escritura de carta de pago del CotoLa Rocina II
• Patrimonio Forestal del Estado (1948) Escritura de Compra/Venta del CotoCabezudos
• Patrimonio Forestal del Estado (1950) Comunicación de la expropiación porrazones de interés forestal del Coto El Sacristán
• Patrimonio Forestal del Estado (1951) Carta cediendo la Compra del CotoLa Rocina I (1951)
• Patrimonio Forestal del Estado (1951) Escritura de Compra/Venta del CotoEl Sacristán
• Patrimonio Forestal del Estado (1951) Informe de valoración del CotoEl Sacristán (De La Lama 1951)
• Patrimonio Forestal del Estado (1951) Informe de valoración del CotoLa Rocina I (De La Lama 1951)
• Patrimonio Forestal del Estado (1951) Ofrecimiento de la finca a la EmpresaCalvo Sotelo del Coto La Rocina I
• Patrimonio Forestal del Estado (1951) Situación de las escrituras antes de laCompra del Coto El Sacristán
• Patrimonio Forestal del Estado (1952) Descripción de la finca del Coto ElSacristán
• Patrimonio Forestal del Estado (1952) Escritura de Compra-Venta a la empresaCalvo Sotelo del Coto La Rocina I
• Patrimonio Forestal del Estado (1952) Informe de La Lama sobre laCompra/Venta del Coto La Rocina I
• Patrimonio Forestal del Estado. Resumen de la situación de la propiedad delCoto Ibarra
• Patrimonio Forestal del Estado. Planos del catastro Dehesa Los Bodegones enel término de Almonte E. 1:25,000
• Quintana y Ceballos J (1748–1752) Plano Geográfico y Mapa General delos Pueblos, Montes, sus arboledas, extensiones, justicias, guardas que loscustodian, vecindarios, matriculados y embarcaciones que comprende laProvincia de Ayamonte, una de las que componen el Departamento de laCapitanía General de Cádiz, según la revista de la Inspección ejecutada porel Ministro Principal de Marina de la misma provincia Don José Quintana yCeballos. In: Gómez Cruz, M. (1991) Atlas Histórico-Forestal de Andalucía S.XVIII. Universidad de Granada, Granada
• Ramón de Garrochena, F (1785) Respuesta del párroco de Lucena del PuertoD. Franciso Ramón de Garrochena a las Relaciones enviadas por Tomás López.Editadas y recopiladas: Ruiz González, J. E. (1999). Huelva, según las relacionesenviadas por los párrocos al geógrafo real Tomás López en el siglo XVIII.Diputación Provincial de Huelva, Huelva

Climatic Change (2010) 100:525–557 553
• San Miguel M. (1913) Las costas de la provincia de Huelva y sus variaciones enel período histórico. Boletín de la Real Sociedad Española de Historia Natural13:434–468
• Unknown (∼ 1788) Respuesta del párroco de Moguer a las Relaciones enviadaspor Tomás López. Editadas y recopiladas: Ruiz González, J. E. (1999). Huelva,según las relaciones enviadas por los párrocos al geógrafo real Tomás López enel siglo XVIII. Diputación Provincial de Huelva, Huelva
• V División Hidrológico-Forestal (1932). Aprobación del proyecto de fijación yrepoblación Dunas de Almonte (Kith Tassara), y respuesta de la jefatura
• V División Hidrológico-Forestal (1934). Aprobación del proyecto de fijación yrepoblación de Dunas de Almonte
• V División Hidrológico- Forestal (1934) Relación de propiedades y terrenos aadquirir para el proyecto de fijación y repoblación. Respuesta de los propietariosde la finca Dunas de Almonte (1934). Respuesta de los propietarios. Edicto I,B.O.E.(1936)
• V División Hidrológico-Forestal (1935) Comunicación del Ingeniero sobrehectáreas y fincas adquiridas de la finca Dunas de Almonte
• V División Hidrológico-Forestal (1935) Escritura de Compra/Venta zona dedunas de Coto Ibarra y Coto Bayo
• V División Hidrológico-Forestal (1940) Contestación del Coto Atlántico• V División Hidrológico-Forestal (1940) Decreto de Utilidad pública a efectos
de expropiación [. . . ] para proyecto de ampliación• V División Hidrológico-Forestal (1940) Expedientes para la adquisición por
convenio de la finca Coto de Mazagón y Coto Ibarra• V División Hidrológico-Forestal (1941) Propuesta y presupuesto para el estudio
de la ampliación del Plan Forestal y de repoblación de las dunas de Almonte• V División Hidrológico-Forestal. Escritura a nombre de V-División Hidrológico-
Forestal de la finca Dunas de Almonte• V División Hidrológico-Forestal. Informe de la Jefatura de la finca Dunas de
Almonte.• Valverde E (1880) Provincia de Huelva.1:750,000. Map Library of Servicio
Geográfico del Ejército, Madrid• Valverde E (1885–1888) Guía del Antiguo Reino de Andalucía. Colección Los
Libros del Caballero Andante 12. Editorial Don Quijote, 1992. Sevilla
Appendix 4: Main events and dates marking the various phasesin the exploitation of the natural resources
1311–1350 First data on the territory under study, from the hunting book ofAlfonso XI, and its later elaboration by Argote de Molina in 1582.
1577 Data from a review of the archives relating to the construction of thecoastal watchtowers of the Costa de Castilla. Marginal uses, communaluse of the land, and demographic scarcity.
1624 Visit of King Felipe IV to the Coto de Doñana, chronicled by D. Pedrode Espinosa.

554 Climatic Change (2010) 100:525–557
1879 Land survey and property register: the land passes from communal useto private property. Experimental crops aimed at obtaining forestryyields and demographic scarcity.
1936 Start of state intervention for the expropriation of private estates. Startof the Spanish Civil War.
1939 End of the Spanish Civil War.1941 Declaration of national interest of the “Comarca Forestal del Sureste de
Huelva” (“Forestry district of south-east Huelva”). Development of theforestry monocultures of fast-growing species. Demographic occupationthrough forest settlements.
1969 Declaration of the urban centre of Matalascañas “of tourist interest”.1972 Management of the “Forestry district of south-east Huelva” passes from
the State Forestry Heritage to the National Institute for the Conserva-tion of Nature.
1978 Start of irrigation in Sector II of the Almonte Marshes Plan, and Statuteof reclassification of Doñana National Park. Reduction in the activityof reforestation with fast-growing species, and parallel reduction ofdemographic occupation. Responsibility for management passes fromstate level (Institute for the Conservation of Nature) to regional level(Institute for Agrarian Reform and Development).
1989 Management passes from agricultural production (irrigation) andforestry to the conservation of natural resources. Declaration of theNatural Park of the Surroundings of Doñana (Statute 2/1989) by theAndalusian Environmental Agency. Traditional uses of resources, limi-tations of forestry exploitation and irrigation, new demographic scarcity,and disappearance of the occupation of the forest settlements. Sea-sonal demographic increase in the coastal resorts of Matalascañas andMazagón.
References
Aguilar M (2007) Recent changes and tendencies in precipitation in Andalusia. In: Sousa A, García-Barrón L, Jurado V (eds) Climate change in Andalusia: trends and environmental consequences.Consejería de Medio Ambiente de la Junta de Andalucía, Seville, pp 99–116
Alcázar A, Martínez A, Rey Benayas JM, Ruiz JP (1988) Toponimia y léxico relacionados con lasdescargas de aguas subterráneas en la cuenca del Duero. Estud Geogr 192:329–339
Arlery R, Grisollet H, Guilmet B (1973) Climatologie. Méthodes et practiques. Gauthier-Villars,Paris
Aybes C, Yalden DW (1995) Place-name evidence for the former distribution and status of Wolvesand Beavers in Britain. Mammal Rev 25:201–227
Barriendos M, Martín-Vide J (1998) Secular climatic oscillations as indicated by catastrophic floodsin the Spanish Mediterranean coastal area (14th–19th centuries). Clim Change 38:473–491
Barriendos M, Rodrigo FS (2006) Study of historical flood events on Spanish rivers using documen-tary data. Hydrological Sciences-Journal-des Sciences Hydrologiques 51:765–783
Barriendos M, Martín-Vide J, Peña JC, Rodríguez R (2002) Daily meteorological observations inCádiz-San Fernando. Analysis of the documentary sources and the instrumental data content(1786–1996). Clim Change 53:151–170
Behringer W (1999) Climatic Change and witch-hunting: the impact of the little ice age on mentali-ties. Clim Change 43:335–351

Climatic Change (2010) 100:525–557 555
Boisseau S, Yalden DW (1998) The former status of the Crane Grus grus in Britain. Ibis 140:482–500Bornaechea A, Ortega C, Otero I (1984) Toponimia Botánica de la Provincia de Madrid. Estud
Geogr 177:483–496Brázdil R, Glaser R, Pfister C, Dobrovolný P, Antoine JM, Barriendos M, Camuffo D, Deutsch M,
Enzi S, Guidoboni E, Kotyza O, Rodrigo FS (1999) Flood events of selected European rivers inthe sixteenth century. Clim Change 43:239–285
Buckland PC, Wagner PE (2001) Is there an insect signal for the “Little Ice Age”? Clim Change48:137–149
Castro-Díez Y, Esteban-Parra MJ, Staudt M, Gámiz-Fortis S (2007) Temperature and precipitationchanges in Andalusia in the Iberian Peninsula and Northern Hemisphere context. In: SousaA, García-Barrón L, Jurado V (eds) Climate change in Andalusia: trends and environmen-tal consequences. Consejería de Medio Ambiente de la Junta de Andalucía, Seville, pp 57–77
C.E.T.U. (1989) Inventario Toponímico del Mapa Topográfico de Andalucía 1:300,000. Consejeríade Obras Públicas y Transportes, Seville
C.E.T.U. (1990) Inventario de Toponimia Andaluza. Introducción. Metodológica. Consejería deObras Públicas y Transportes, Seville
Corominas J (1972) Tópica Hespérica. Gredos, MadridCox J, Maehr D, Larkin J (2002) The biogeography of faunal place-names in the United States.
Conserv Biol 16:1143–1150De La Lama G (1951) Diez años de trabajos forestales. Revista de Montes 39:195–201De La Lama G (1976) Atlas del Eucalipto. Instituto Nacional de Investigaciones e I.C.O.N.A., SevilleDusoulier F (2001) Les insectes peuvent-ils servir de bio-indicateurs climatiques? L’exemple des
orthoptères en Bretagne. Publ Assoc Intern Climatol 14:245–252Espina J, Estévez A (1993) El espacio de repoblación forestal de Cabezudos-Abalario. In: Granados
M, Ojeda JF (eds) Intervenciones Públicas en el Litoral Atlántico andaluz. Efectos territori-ales, Agencia de Medio Ambiente (Consejería de Cultura y Medio Ambiente), Seville, pp 95–107
Fernández-González F, Loidi J, Moreno JC (2005) Impacts on plant biodiversity. In: Moreno JM (ed)A preliminary general assessment of the Impacts in Spain due to the effects of Climate Change.Ministry of the Environment, Spain, pp 183–248
García Barrón L (2002) Un modèle pour l’analyse de la sécheresse dans les climats méditerranéens.Publ Assoc Intern Climatol 14:67–73
García-Barrón L, Pita MF (2004) Stochastic analysis of time series of temperature in the south-westof the Iberian Peninsula. Atmósfera 17:225–244
García Murillo P, Sousa A (1997) Vegetation changes in Abalario (Parque Natural Entorno deDoñana). Lagascalia 19:737–744
García Latorre J, García-Latorre J, Sánchez-Picón A (2001) Dealing with aridity: socio-economicstructures and environmental changes in an arid Mediterranean region. Land Use Policy 18:53–64
Gelling M (1984) Place names in the landscape. J. M. Dent and Sons Ltd, LondonGonzález Bernáldez F (1992) Los Paisajes del Agua. Terminología popular de los Humedales.
Reyero, MadridGonzález-Rouco JF, Jiménez JL, Quesada V, Valero F (2001) Quality control and homogeneity of
precipitation data in Southwest of Europe. J Clim 14:964–978Granados M (1987) Transformaciones históricas de los ecosistemas del P.N. de Doñana. PhD thesis,
Department of Ecology, University of Seville, SevilleGranados M, Martín A, García Novo F (1988) Long-term vegetation changes on the stabilized dunes
of Doñana National Park (SW Spain). Vegetatio 75:73–80Grove AT (2001) The “Little Ice Age” and its geomorphological consequences in Mediterranean
Europe. Clim Change 48:121–136Henshaw A (2006) Pausing along the journey: learning landscapes, environmental change, and
toponymy amongst the Sikusilarmiut. Arctic Anthro 43:52–66Hunt BG (2006) The Medieval Warm Period, the Little Ice Age and simulated climatic variability.
Clim Dynam 27:677–694Huntington HP, Fox S (2005) Changing arctic: indigenous perspectives. ACIA, Cambridge Univer-
sity Press, Cambridge, pp 61–98IPCC (2001) Climate Change 2001: the physical scientific basis. Contribution of working group I
to the fourth assessment report of the intergovernmental panel on climate change. CambridgeUniversity Press, New York

556 Climatic Change (2010) 100:525–557
Jones PD, Briffa KR (2001) The “Little Ice Age”: local and global perspectives. Clim Change 48:5–8Jones PD, Mann ME (2004) Climate over past millennia. Rev Geophys 42:1–42Kith M (1936) Propuesta de ampliación del proyecto de fijación y repoblación de las Dunas de
Almonte. V División Hidrológico-Forestal del Guadalquivir. Unedited technical Report, HuelvaLeaper R, Massel G, Gorman M, Aspinall R (1999) The feasibility of reintroducing Wild Boar (Sus
scrofa) to Scotland. Mammal Rev 29:239–259LeBlanc M, Gajewski K, Hamilton PB (2004) A diatom-based Holocene palaeoenvironmental
record from a mid-arctic lake on Boothia Peninsula, Nunavut, Canada. Holocene 14:417–425Lloyd AH, Fastie CL (2002) Spatial and temporal variability in the growth and climate response of
treeline trees in Alaska. Clim Change 52:481–509Manzano M, Custodio E, Mediavilla C, Montes C (2005) Effects of localised intensive aquifer
exploitation on the Doñana wetlands (SW Spain). In: Sahuquillo A, Capilla J, Martínez-Cortina L, Sánchez-Vila X (eds) Groundwater intensive use. Balkema, Leiden, pp 209–219
Martín-Vide J, Barriendos M (1995) The use of rogation ceremony records in climatic reconstruction:a case study from Catalonia (Spain). Clim Change 30:201–221
Montes C, Borja F, Bravo MA, Moreira JM (1998) Reconocimiento biofísico de Espacios Nat-urales Protegidos. Doñana: una aproximación ecosistémica. Consejería de Medio Ambiente,Seville
Moore P (2002) Ravens (Corvus corax corax L.) in the British landscape: a thousand years ofecological biogeography in place names. J Biogeogr 29:1039–1054
Nuttall M, Berkes F, Forbes B, Kofinas G, Vlassova T, Wenzel G (2005) Hunting, herding, fishing,and gathering: indigenous peoples and renewable resource use in the Arctic. ACIA, CambridgeUniversity Press, Cambridge, pp 649–690
Ogilvie AEJ, Jónsson T (2001) “Little Ice Age” research: a perspective from Iceland. Clim Change48:9–52
Pearsall WH (1961) Place names as clues in the pursuit of ecological history. Namn Och Bygd 49:72–89
Pfister C, Brázdil R, Glaser R, Barriendos M, Camuffo D, Deutsch M, Dobrovolný P, Enzi S,Guidoboni E, Kotyza O, Militzer S, Rácz L, Rodrigo FS (1999) Documentary evidence onclimate in sixteenth-century Europe. Clim Change 43:55–110
Rackham O (1986) The history of the countryside. Dent, LondonRivas-Martínez S (1987) Memoria del mapa de series de vegetación de España 1:400,000. Insti-
tuto Nacional para la Conservación de la Naturaleza. Ministerio de Agricultura, Pesca y Ali-mentación), Madrid
Rivas-Martínez S (1988) Bioclimatología, biogeografía y series de vegetación de Andalucía Occiden-tal. Lagascalia 15:91–119
Rodrigo FS, Esteban-Parra MJ, Castro-Diez Y (1994) An attempt to reconstruct the rainfall regimeof Andalusia (Southern Spain) from 1601 A.D. to 1650 A.D. Using Historical Documents. ClimChange 27:397–418
Rodrigo FS, Esteban-Parra MJ, Pozo-Vázquez D, Castro-Díez Y (1999) A 500 year precipitationrecord in Southern Spain. Int J Climatol 19:1233–1253
Rodrigo FS, Esteban-Parra MJ, Pozo-Vázquez D, Castro-Díez Y (2000) Rainfall variability in South-ern Spain on decadal to centennial times scales. Int J Climatol 20:721–732
Rodríguez-Ramírez A, Yáñez-Camacho CM (2008) Formation of chernier plain of the Doñanamarshland (SW Spain): observations and geomorphic model. Mar Geol 254:187–196
Sorvari S, Korhola A, Thompson R (2002) Lake diatom response to recent Arctic warming in FinnishLapland. Glob Chang Biol 8:171–181
Sousa A, García Murillo P (2001) Can place names be used as indicators of landscape changes?Application to the Doñana Natural Park (Spain). Landscape Ecol 16:391–406
Sousa A, García Murillo P (2002) Méthodologie pour l’étude des effets du Petit Âge Glaciaire dansle Parc Naturel de Doñana (Huelva, Espagne). Essai de reconstitution des formations palustreset du drainage superficiel. Publ Assoc Intern Climatol 14:359–367
Sousa A, García Murillo P (2003) Changes in the wetlands of Andalucía (Doñana Natural Park, SWSpain) at the end of the Little Ice Age. Clim Change 58:193–217
Sousa A, García Murillo P (2005) Historia ecológica y evolución de las lagunas peridunares delParque Nacional de Doñana. Ministerio de Medio Ambiente, Madrid
Sousa A, García Murillo P, González Pérez MI, García Barrón L (2004) La desaparición delas lagunas del entorno de Doñana (Huelva, España), y su relación con cambios climáticos

Climatic Change (2010) 100:525–557 557
recientes. In: García Cordón JC, Diego C, Fernández de Arróyabe P, Garmendia C, RasillaD (eds) El Clima entre el Mar y la Montaña. Asociación Española de Climatología, Santander,pp 715–724
Sousa A, García Murillo P, Morales J, García Barrón L (2006a) Los humedales del SW deEspaña (litoral oriental onubense) como vínculo entre la malaria y los cambios climáticos másrecientes. In: Cuadrat JM, Saz MA, Vicente S, Lanjeri S, de Luis M, González-Hidalgo JC (eds)Clima, Sociedad y medio ambient. Asociación Española de Climatología, Zaragoza, pp 709–719
Sousa A, García-Barrón L, Morales J, García-Murillo P (2006b) Post-Little Ice Age warming anddessication of the continental wetlands of the Aeolian sheet in the Huelva region (SW Spain).Limnetica 25:57–70
Spens J (2006) Can historical names and fishers’ knowledge help to reconstruct lakes? In: HagganN, Neis B, Baird IG (eds) Fishers’ knowledge in fisheries science and management. BlackwellScience, Oxford, pp 279–289
Sweeney S, Jurek M, Bednar M (2007) Using place names to interpret former floodplain connectivityin the Morava River, Czech Republic. Landsc Ecol 22:1007–1018
Trick T, Custodio E (2003) Hydrodynamic characteristics of the western Doñana Region (area ofEl Abalario), Huelva, Spain. Hydrogeol J 12:321–335
Vanney JR, Menanteau L (1979) Types de reliefs littoraux et dunaires en basse Andalusie (de la ríade Huelva a l’embouchure du Guadalquivir). Melanges de la Casa Velázquez 15:1–52
Webster J (2001) A review of the historical evidence of the habitat of the Pine Marten in Cumbria.Mammal Rev 31:17–31
Yalden D (2002) Place name and archaeological evidence on the recent history of birds in Britain.Acta Zool Cracov 45:415–429
Zeeberg JJ, Forman SL (2001) Changes in glacier extent on north Novaya Zemlya in the twentiethcentury. Holocene 11:161–175
Copyright © 2022 FDOKUMEN