
Web Surveys in the Social Sciences: An Overview
28
Population-E, 65 (2), 2010, 285-312 Didier FRIPPIAT* and Nicolas MARQUIS** Web Surveys in the Social Sciences: An Overview Sample surveys are a valuable source of information about populations. The choice of data collection method depends upon the topic covered and the population observed, and the quality of data yielded may be affected by wide-ranging criteria, including sample representativeness, response rate, question comprehension and sincerity of responses. Survey methodology must therefore integrate constraints – which vary according to the data collection mode – while adapting constantly to make the most of available technology. Thirty years ago, postal surveys and face-to-face surveys conducted by an interviewer were joined by telephone surveys, whose advantages and disadvantages have been described in detail by Benoît Riandey and Jean-Marie Firdion in Population (1993, vol. 5). Since then, the growing problem of ex-directory numbers and the popularity of mobile phones have prompted the need for further adaptations. The increase in Internet access has led to the recent emergence of new survey methods, bringing in their wake new opportunities but also new dangers. Based on a review of the literature, Didier FRIPPIAT and Nicolas MARQUIS assess the strengths and weaknesses of this latest data collection mode. Studies making use of Web survey methodology have proliferated over the last decade and their findings having been widely published. Nobody would deny the very real impact of the Internet on social sciences, especially in the area of quantitative research that is the focus of this article. We have witnessed a similar abundance of books and articles on Web surveys, in which certain authors are cited again and again. However, as Witte (2009, p. 284) comments, “how-to” texts and monographs, concerned mainly with identifying the consequences of Web surveys, have so far made up the bulk of this literature. Interest in this approach is clearly growing, as testified by the flow of journal articles and special issues devoted to the question. The steadily expanding * Université catholique de Louvain. ** Facultés universitaires Saint-Louis. Correspondence: Nicolas Marquis, Centre d’études sociologiques, Facultés universitaires Saint- Louis, boulevard du Jardin botanique 43, 1000 Brussels, Belgium, tel.: +32 2 211 78 49, e-mail: [email protected]
-
Upload
usaintlouis -
Category
Documents
-
view
2 -
download
0
Transcript of Web Surveys in the Social Sciences: An Overview

Population-E, 65 (2), 2010, 285-312
Didier FRIPPIAT* and Nicolas MARQUIS**
Web Surveys in the Social Sciences: An Overview
Sample surveys are a valuable source of information about populations. The choice of data collection method depends upon the topic covered and the population observed, and the quality of data yielded may be affected by wide-ranging criteria, including sample representativeness, response rate, question comprehension and sincerity of responses. Survey methodology must therefore integrate constraints – which vary according to the data collection mode – while adapting constantly to make the most of available technology. Thirty years ago, postal surveys and face-to-face surveys conducted by an interviewer were joined by telephone surveys, whose advantages and disadvantages have been described in detail by Benoît Riandey and Jean-Marie Firdion in Population (1993, vol. 5). Since then, the growing problem of ex-directory numbers and the popularity of mobile phones have prompted the need for further adaptations. The increase in Internet access has led to the recent emergence of new survey methods, bringing in their wake new opportunities but also new dangers. Based on a review of the literature, Didier FRIPPIAT and Nicolas MARQUIS assess the strengths and weaknesses of this latest data collection mode.
Studies making use of Web survey methodology have proliferated over the last decade and their fi ndings having been widely published. Nobody would deny the very real impact of the Internet on social sciences, especially in the area of quantitative research that is the focus of this article. We have witnessed a similar abundance of books and articles on Web surveys, in which certain authors are cited again and again. However, as Witte (2009, p. 284) comments, “how-to” texts and monographs, concerned mainly with identifying the consequences of Web surveys, have so far made up the bulk of this literature. Interest in this approach is clearly growing, as testifi ed by the fl ow of journal articles and special issues devoted to the question. The steadily expanding
* Université catholique de Louvain.
** Facultés universitaires Saint-Louis.
Correspondence: Nicolas Marquis, Centre d’études sociologiques, Facultés universitaires Saint-Louis, boulevard du Jardin botanique 43, 1000 Brussels, Belgium, tel.: +32 2 211 78 49, e-mail: [email protected]

D. FRIPPIAT, N. MARQUIS
286
WebSM(1) Website, run by the European Web Survey Methodology project, adds eighty references to its bibliographic database each month. A great many conferences have also been based around the subject of Web surveys, notably those organized by the American Association for Public Opinion Research and by General Online Research in Germany.
In his introduction to an issue of Sociological Methods and Research devoted to this method, Witte (2009, p. 287) wrote that “Web-based survey research has reached a level of maturity such that it can be considered an essential part of the sociological tool kit”. For their part, when Couper and Miller (2008, p. 831) introduced readers to an issue of Public Opinion Quarterly on the same topic, they noted that Web survey methods have attracted far greater attention than other survey modes. However, with the exception of Couper’s seminal contribution (2000), taking stock of several years of Internet research, a comprehensive overview of the issues raised by this method has yet to be published.
While the present article resembles a literature review, it would be impossible to cover every aspect of the question, given the sheer abundance of publications on the subject. By the end of 2009, for instance, the WebSM Website listed nearly 4,000 articles, book chapters and conference working documents dealing either directly or indirectly with Web survey methodology. While making no claims to bibliographical exhaustiveness, we will nonetheless seek to present all the issues raised in the scientifi c publications we examined. We therefore proceeded as though we were conducting a qualitative study, by saturation sampling.
We began by selecting the books and articles for analysis on the basis of their publication date, focusing on the most recent ones in order to take advantage of their own literature reviews. We were particularly keen to analyse articles that adopted a broad-spectrum approach to the issue of Web surveys, as opposed to ones that presented a particular Web survey without refl ecting on the choice of methodology. We concentrated our investigations on the WebSM, ScienceDirect (Elsevier), CurrentContents (Reuters) and SAGE databases. Our fi nal selection totalled nearly ninety articles and books (not all explicitly cited). Although we drew without distinction upon social science studies and research carried out in other areas (nursing care, marketing, etc.), our primary objective was to improve current understanding of the impact of Web surveys on quantitative research in social sciences, even if many of the fi ndings can be generalized to other fi elds.
In an article published ten years ago, but still widely cited by contemporary authors, Couper (2000) referred to the Internet as a “threshold of a new era for survey research”, adding that we actually knew very little about how the World Wide Web would change the face of scientifi c investigation. Our article
(1) www.websm.org

WEB SURVEYS IN THE SOCIAL SCIENCES
287
aims to provide an overview of current methodological research and its insights into the effects of Web surveys.
In order to analyse these effects (for the time being, we make no distinction between the Web survey as data collection mode and the Web survey as sampling mode), most authors compare Web surveys with other, more familiar and better understood survey modes. For while the methods may change, the criteria by which we measure the quality of their results generally remain stable, with questions such as “Can the Internet provide a representative sample?”, “Which section of the population, if any, is excluded?”; “Is there a high non-response rate?”, and “Does this medium trigger social desirability bias?”, etc. Depending on the answers to these questions, researchers can then adjust the survey’s structure, its sampling mode (random or unrestricted self-selection), the incentives it offers or, then again, the number of reminders that are given.
Several points of consensusI.
1. Widely recognized advantages
Virtually every article acknowledges that Web surveys have several undeniable advantages, the most obvious of these being the democratization of research (Kaplowitz et al., 2004). As Couper and Miller (2008) point out, large budgets are no longer needed to conduct serious and worthwhile surveys. In their analysis of two recent surveys (European Social Survey (ESS) and an iVOX survey), Loosveldt and Sonck (2008) calculated that a single face-to-face questionnaire costs €140, as opposed to just €3 or so for sending out questionnaires to members of an online panel (group of individuals recruited to take part in Web surveys) created by a polling company. Even though these relative costs can certainly not be generalized, they do confi rm the widely held view in the literature that Web surveying is the least costly means of conducting a quantitative survey. One of its salutary consequences is that researchers are now less reliant upon funding from commissioning bodies to conduct their studies (Couper and Miller, 2008). But this democratization has doubtless also had an impact on the way in which Web-based research is perceived both by the people who commission it and by the respondents themselves. The spiralling number of surveys featuring dubious or opaque methodology (which may emanate from the fi eld of social sciences, but also from commercial businesses, newspapers, magazines, etc.) increases the risk of this mode of data collection being systematically devalued – an issue we will return to later. The present article will seek precisely to differentiate between good and poor practice.
Another frequently mentioned advantage is the speed with which data can be gathered (Schaefer and Dillman, 1998). Loosveldt and Sonck reported that it took four months to administer 980 face-to-face questionnaires for the ESS (response rate 62.25%), but less than a month to collect 3,235 questionnaires (out of the 5,685 originally sent out) for the iVOX survey. More impressively

D. FRIPPIAT, N. MARQUIS
288
still, 1,576 respondents completed the questionnaire on the very day they received it. This speed is also linked to improved access to the medium for respondents and researchers alike, the latter receiving the data in electronic format, which is easier to process.
One fi nal benefi t of Web surveys, again rarely contested, is that the Internet makes it possible to reach individuals who would otherwise be diffi cult to locate or to contact. The Internet is teeming with forums, newsgroups, newsletters, and so on, subscribed to by individuals who share the same characteristics or special interest. Researchers can gain access to these virtual communities – and thence to individuals eligible for their studies – via any search engine, simply by choosing the right keywords. They can also survey groups who, for one reason or another, would fi nd it diffi cult to respond to surveys conducted via other channels, as demonstrated by Ison’s research (2009) on people with verbal communication impairment.
2. More effective monitoring of data collection
As well as enabling researchers to conduct personalized surveys more cheaply, more quickly and in fi elds that were hitherto largely inaccessible, the Internet makes it far easier to monitor the quality of data as and when they arrive. When a survey is fi lled in online, researchers can track aspects that were not previously measurable. For a start, they can now see how long it takes individuals to answer the questions. According to Malhotra (2008), this information is crucial for gauging the quality of the responses. When, for instance, the author looked at a 2006 survey of people’s opinions on the American government’s response to Hurricane Katrina, she concluded that hastily fi lled questionnaires contained no useful information. The Internet provides a means not only of monitoring respondents’ progress, but also of infl uencing it. For example, questions can be displayed on several successive screens, forcing individuals to complete one set of questions before moving onto the next set (forced answers).
More broadly speaking, Web surveys offer an opportunity to conduct an entirely novel brand of research on non-response. With paper-based questionnaires, it is impossible to distinguish between initial non-response, where the individual fails even to consult the questionnaire, and partial non-response, where he or she starts but never fi nishes, as respondents rarely return partially completed questionnaires. The Internet, on the other hand, can record data as and when the responses are sent, meaning that researchers can pinpoint the exact moment at which respondents give up. This information is crucial for several reasons. First, it can be used to analyse how response rates are affected by the complexity of particular questions or the questionnaire as a whole. For instance, in a Web survey of 11,200 Italian students, Ganassali (2008) designed several different questionnaires featuring different styles and layouts. One of his main conclusions was that by

WEB SURVEYS IN THE SOCIAL SCIENCES
289
decreasing the perceived length (the total number of questions – 20 or 40 – was indicated on the fi rst page) the dropout rate could be brought down from 34% to 21%, and by simplifying the vocabulary, it could be reduced from 29% to 23%. Shropshire et al. (2009) shed a particularly revealing light on the problem of early termination due to lack of interest. When they looked at a 2001 survey about the protection of endangered species, they found that the respondents most likely to complete the questionnaires were those who were interested in the subject. This induced a major bias, which increased across the questions, representing up to 10% of difference in mean results according to the authors’ calculations. In this instance, missing data due to non-response could no longer be regarded as missing completely at random (Little and Rubin, 2002), as they were dependent upon the very variable that was being investigated (interest in the protection of endangered species). Similar fi ndings have been reported for surveys focusing on people’s interests and political convictions.
Other technological innovations are used by researchers to monitor the quality of their results. Galesic et al. (2008) recently adopted a technique that allowed them to observe respondents’ eye movements as they fi lled in a questionnaire over the Internet. This provided a means of empirically detecting the so-called “primacy effect” (Tourangeau et al., 2000), whereby respondents tend to select the fi rst options they see on screen, with those at the top of the list receiving far more attention than those at the bottom, especially if respondents have to “scroll down” the items, perhaps by clicking on a small arrow. Such techniques enable researchers to measure and understand the extent of bias due to this primacy effect.
3. Ambiguous fi ndings
Other issues are far less clear-cut. Most authors would accept that the specifi c effects of this particular data collection mode remain uncertain. Questions about its validity and reliability relate mainly to two areas, linked to the two distinct roles that the Internet can play in the research process, namely recruiting a sample and administering a questionnaire. For the former, we will look at the potential specifi cities of the population contacted over the Internet and whether it is possible to generalize the results obtained. For the latter, we will investigate the potential consequences of using the Web interface and the feasibility of comparing data acquired by that means with data obtained using other survey modes. As many articles have emphasized (see, for example, Faas and Schoen, 2006; Loosveldt and Sonck, 2008), it is not always easy to say which effects are due to which causes. Any meta-analysis designed to identify the effects of conducting a Web survey would involve conducting two surveys that were identical in every respect save one. However, changing the survey mode has an impact not only on the context and the interface, but also on the population being questioned (Rookey et al., 2008).

D. FRIPPIAT, N. MARQUIS
290
Who responds to Web surveys? II. Using the Internet as a sampling tool
1. Towards a typology of Web-based sampling procedures
Here we look at questions raised by the practice of using the Internet as a survey tool in quantitative research, where it serves not only to administer surveys but also – and above all – to sample and contact potential respondents.
Couper (2000) identifi ed eight types of samples that could be used for Web surveys, based on the probability/non-probability distinction. While not disputing the validity of his table, confi rmed by its many citations in the literature, we propose an alternative, iterative classifi cation, with a view to understanding the context in which Web surveys are used (Figure 1).
The least problematic cases are represented on the left-hand side of the diagram and those requiring intervention from the researcher (where possible), on the right-hand side. The fi rst questions confronting researchers are: “What types of generalization do we intend to make?”, “What type of population are we dealing with?” and “What data do we have at our disposal?”. The assumption
Figure 1. Using the Internet as a sampling tool
The Internet as a sampling tool
Population that can be identified and contacted via the Internet (II.2)
Probability sampling
Population that cannot be identifiedand/or contacted via the Internet (II.3)
Randomlydistributed non- distributed non-
response
Non-randomly
response
Sample representative
of the population
Individuals reached who do not respond inother modes
Self-selection and coverageproblems
can be identified and contacted
by other means (II.4)
Population that cannot be identified and/or
contacted by other means
Population that
No possibilityof adjusting the sample
Characteristics already
identified by other means
Characteristics not yet identified by other means
Weighting and post-
stratification
Control survey in a different mode
and/or calculation of
propensity score
WEB SURVEYS IN THE SOCIAL SCIENCES
291
here is that the researchers will wish to make inferences from their sample to a wider population.
2. Making inferences about a small population that can be identifi ed and contacted
When inferences are to be made about a small population that is totally known to the researchers and whose members can all be contacted, one option is to apply probability sampling methods. In this case, all the individuals will have a non-zero probability of being included in the sample. This procedure can be used, for example, for sets of corporate e-mail addresses, lists of university alumni or themed sites (providing all the addresses are available). It is the least problematic approach, which doubtless explains why it is rarely mentioned in the literature.
However, even when the members of the reference population can all be contacted via the Internet, data may still be biased by non-response since Web surveys have relatively low response rates (see below). It may thus be useful to have data that indicate whether non-response is randomly distributed or whether it is linked either to one of the variables being investigated in the survey or to other socio-demographic variables. Checks can be made, for instance, to ensure that no age groups are particularly under-represented. If non-response is indeed random, then the Web survey meets the criteria applied to all the other modes.
However, researchers have frequently observed that specifi c sections of the population exclude themselves from Web surveys, refusing to respond even when they have the means to do so. For this reason, several authors have investigated whether sample quality can be improved by administering the same survey in parallel using several different modes (Dillman et al., 2009; Rookey et al., 2008). Contrasting results have been obtained. Rookey et al. found that the use of a complementary postal mode in a Gallup Panel survey elicited responses from people with signifi cantly different socio-demographic characteristics from those of individuals who chose to respond over the Internet, particularly with regard to age, education and income. Furthermore, postal respondents gave noticeably different responses to the core questions of the survey that were of interest to Gallup. For Dillman et al., on the other hand, while a second survey wave by telephone targeting non-respondents to a Web survey had a considerable impact on response rates (the fi rst wave in Web mode yielded a 12.7% response rate, while the second wave in telephone mode yielded a rate of 44.9% among fi rst-wave non-respondents), it had a negligible impact on the distribution of socio-demographic variables, as non-respondents for both modes displayed a specifi c profi le in terms of variables such as education, for example. Apart from any doubts about its effi cacy, this “mixed-mode” practice relies on a questionable presupposition that we will examine later, namely that there is equivalence and total comparability between Web surveys and other survey modes.
D. FRIPPIAT, N. MARQUIS
292
3. Making inferences about the general population
If the aim is to make inferences about a population that is not totally known, identifi ed and accessible via the Internet, as is the case with the general population, then probability sampling methods no longer apply. As already stated, in order to conduct a survey, the researcher must fi rst determine not only which individuals can be contacted with a view to collecting the necessary data, but also the probability of each individual being selected. Here, however, that probability remains an unknown quantity. Without a suitable fi le (such as Belgium’s National Population Register(2)) from which to draw a probability-based sample, the researcher either has to rely on an “unrestricted” contact procedure (possibly followed by an attempt to recreate a quota sample), or else has to use an existing panel of respondents (i.e. people who have already decided to join this panel). This means that individuals do not all have the same chance of being selected. Indeed, some of them may even have no chance whatsoever, for one of two reasons. The fi rst reason relates to population coverage. As with the telephone (or even written language), Internet access is not universal. Nor is it uniformly distributed across all sections of the population. We therefore have to identify those who “are able” to take part in Web surveys. Next, alongside the issue of respondent accessibility, there is also the question of self-selection. In the absence of probability-based selection, it is the individuals themselves who decide whether or not to join the sample. We therefore need to know who “wants” to take part in Web surveys.
The population’s access to the Internet
Back in 2000, Couper warned that researchers were entertaining unrealistic hopes about future Internet penetration rates, predicting that these rates would not continue to rise indefi nitely. We will logically begin our discussion by looking at the digital divide.
This concept refers to disparities in IT diffusion between groups of individuals characterized by a particular variable (e.g. gender, age, income or place of residence). It has been studied and analysed at regular intervals for the last ten years. It is measured on the so-called Digital Divide Index (DIDIX) fi rst described in an article by Hüsing and Selhofer (2004). This compares four disadvantaged groups with national averages for Internet access and use. Being aware of the extent of the digital divide at the time of the survey is essential, since it defi nes the potentially contactable population.
If, for instance, we want to design a questionnaire for a survey in Europe, the most recent reliable data available (Eurostat, 2009) tell us that 65% of households have home Internet access. On the basis of these data, even before we send out the questionnaire, we know that 35% of European households cannot be reached by this means and are therefore irremediably excluded from
(2) National register of physical persons based on data from Belgian censuses.

WEB SURVEYS IN THE SOCIAL SCIENCES
293
the sample. This loss becomes a problem if it is unevenly distributed. And although none of the existing survey modes can achieve the ideal of 100% accessibility, Couper et al. (2007b) claim that the Internet poses greater coverage problems than, say, random digital dialling (RDD).
There are two possible reasons for this. First, as Best and Krueger (2004) point out, every mode of communication – whether the telephone, the mail service or the Internet – offers preferential access to specifi c groups of individuals. According to Schonlau et al. (2009), the Internet is less well distributed across the population than the telephone and it is therefore diffi cult to determine whether the 65% fi gure applies equally to all subpopulations, or whether certain sections of target populations are particularly excluded due to the choice of survey mode. Yet authors agree that computer ownership, combined with home Internet access, constitutes the most decisive criterion for the probability of responding to a Web survey (Couper et al., 2007b). However, the Eurostat (2009) statistics set out in Table 1 clearly show that the possession and regular use of an Internet connection depend on a large number of factors. For instance, there are clear differences between the situation in France and in two neighbouring countries, Belgium and Luxembourg.
Table 1. Regular Internet use by individuals aged 16-74 years in Europe in 2009 (%)
Europe (27) Belgium France Luxembourg
Total 48 56 50 71
Gender Male 52 61 52 80
Female 44 51 48 62
Age group 16-24 73 77 69 83
25-54 53 63 57 77
55-74 23 30 28 49
Education(a) High 75 80 76 92
Medium 50 58 68 76
No or low 28 35 33 54
Occupational status
Student 81 81 78 86
Employee, self-employed 57 67 57 79
Unemployed 40 42 46 46
Retired, inactive, etc. 20 29 26 46
(a): These are the categories used by the Eurostat survey: “No or low formal education” means that the individual has completed lower secondary education at most; “Medium formal education” means that the individual has completed upper secondary education, and “High formal education” means that the individual has completed tertiary education.Regular Internet use: Individuals who used the Internet on average every day or almost every day over the previous three months.Source: Eurostat (2009).

D. FRIPPIAT, N. MARQUIS
294
This has a defi nite impact on the likelihood of being included in a sample and agreeing to respond to a survey. For example, Hoogendoorn and Daalmans (2009) found that when potential members of a Dutch Internet panel (CentERpanel) were contacted by phone and invited to take part in a Web survey, 16% of PC-owners eventually agreed to take part, as opposed to just 5% for those who had neither computer nor Internet access, even though the organizers offered to install the necessary equipment in their homes. Non-response was also linked to differences in socioeconomic status. The most affl uent group had a response rate of 16%, versus just 6% for the lowest income group. Accordingly, non-response was in no sense randomly distributed.
The second reason is that Web surveys require more active engagement by the respondent than telephone ones. Respondents must not only have access to the Internet, but must also switch their computers on and start to surf. So if researchers wanted to gain an accurate idea of the selection probability of each member of the target population, they would have to analyse the impact of the different channels they use to announce their surveys (e-mails, social networking sites, banner ads in online or offl ine newspapers, pop-up windows on Websites, etc.). The probability of entering into contact with certain groups would then be altered, as Internet behaviour varies from one person to the next. A 2007 Eurostat survey, for instance, found that 81% of individuals who had used the Internet in the previous three months did so, among other things, to obtain information about goods and services, compared with just 36% who used it to read online newspapers or news magazines. Similarly, while 84% of users logged on to send or receive electronic messages, only 37% engaged in other communication activities. Consequently, banner ads on the sites of daily newspapers or messages left on forums or social networking sites will reach some surfers but not others. Given the virtually infi nite range of possible channels, gauging the probability of reaching each individual is an impossible task.
In sum, households with Internet access have several socio-demographic characteristics (Rookey et al., 2008) that are liable to affect the variables being investigated in Web surveys (Dever et al., 2008). Faas and Schoen’s investigation (2006) of online surveys in the run-up to the 2002 German federal election is particularly illuminating in this respect. By comparing the results of a face-to-face interview, a Web survey of respondents recruited through other channels using probability sampling and, lastly, a volunteer Internet panel, they were able to observe differences in both socio-demographic variables and political behaviour. In this instance, controlling for the former proved ineffective. Not only did the averages vary, but also the associations between the variables. Thus, the population reached through the Internet via unrestricted surveys is defi ned not only by its accessibility but also by a number of other specifi c features: this is the problem of self-selection.

WEB SURVEYS IN THE SOCIAL SCIENCES
295
Respondent self-selection and the probability of being included in a sample
By allowing individuals to decide for themselves whether or not to take part in a survey, researchers no longer have any means of calculating each person’s probability of being included in the sample (for a demonstration, see Bethlehem, 2008). Paradoxically, therefore, no sooner have Web surveys prised open the black box of “non-response”, than a new one is created. In their review of the literature, Lensvelt-Mulders et al. (2009) found that people taking part in panels were more likely to be young men with a relatively high level of education. This effect is separate from bias linked to population coverage. When the authors compared two Web surveys on the impact of environmental pollution (one using probability sampling, the other with a panel of self-selected volunteers), they observed a considerable difference between the responses given by the two samples, even when all the necessary control variables were considered. They concluded that self-selection inevitably creates biases that are diffi cult to overcome. Other authors have reached the same conclusion (Loosveldt and Sonck, 2008).
As illustrated by the survey of political opinions by Faas and Schoen (2006) and the survey of animal protection by Shropshire et al. (2009), self-selection is also quite logically infl uenced by the prospective respondent’s interest in the topic. The more strongly a person feels about the subject being investigated, the more likely he or she is to start – and complete – the questionnaire. Lensvelt-Mulders et al. (2009) concluded that “volunteer Internet-panel respondents are not a random part of the general population” (p. 4). According to Lee and Vaillant (2009, p. 320), “estimates from volunteer Web surveys may suffer from a combination of non-coverage, non-probability sampling, and non-response biases”. Analyses of errors linked to coverage and self-selection show in all cases that non-response (and hence response, likewise) are certainly not randomly distributed, so it is important to address this problem. The degree to which a self-selected sample can be adjusted depends on how much prior information the researcher possesses concerning the reference population about which inferences are to be made.
The most problematic situation arises when the researcher has no information about the reference population. Here, drawing inferences from results yielded by a volunteer sample amounts to making two questionable presuppositions: fi rst, that Internet users are representative of non-users, and second, that those who responded over the Internet are representative of those who did not (but could have done so). Functioning without a reference population should thus signify that any hopes of achieving representativeness are defi nitively abandoned.

D. FRIPPIAT, N. MARQUIS
296
4. Adjusting the sample
If, on the other hand, information on the reference population is available to researchers, they can choose between several useful procedures, depending on the nature of that information.
Classic weighting
Researchers who know the overall characteristics (general statistics) of the population about which inferences are to be drawn can apply a classic weighting and post-stratifi cation method to adjust the sample. However, while commonly used, this procedure has shown itself to be inadequate, given the coverage and self-selection biases described above (Bethlehem and Stoop, 2007). Faas and Schoen (2006) have also drawn attention to this problem, which is particularly salient when the variables used for weighting are insuffi ciently correlated with the variables of interest. Weighting is particularly ineffective in correcting self-selection bias. In the survey by Loosveldt and Sonck (2008) cited earlier, the authors found that weighting by age, gender and educational level had only a minor impact on survey results, and that it did not make the volunteer panel comparable with a randomly selected one, since the associations between the variables (e.g. between education and interest in politics) continued to differ between the two.
In addition to these shortcomings, weighting is not always easy to apply since researchers rarely have information on the survey population, which in many cases has not even been identifi ed.
Propensity score adjustment
Propensity score adjustment was originally devised in the experimental fi eld to compensate for the inadequacies of post-stratifi cation. It can be used in situations where the researcher can compare the volunteer Internet panel with a small, but probability-based sample drawn from the population about which inferences are to be made. This obviates the need for general statistics on the reference population, although the latter still needs to be identifi ed. Lee (2006), Lee and Vaillant (2009), and Schonlau et al. (2009) provide a good introduction to the propensity score adjustment technique. This approach acknowledges the fact that most Web surveys do not have a reference sampling frame. The issue here is therefore to know whether the convenience sample can be adjusted so as to acquire the same qualities as a sample drawn from a known and identifi ed population.
Although this method has been used for many years in statistical inference (Glaude and Moutardier, 1991), it was only recently introduced into the fi eld of Web surveys, by the polling company Harris Interactive (Schonlau et al., 2004). The fi rst step consists in identifying a set of variables that will allow the researchers to defi ne how the Web survey respondents differ from the reference population. These sociodemographic and lifestyle-related variables

WEB SURVEYS IN THE SOCIAL SCIENCES
297
are known as “webographic” variables (Schonlau et al., 2009). The propensity score therefore represents the probability for each individual of having and using Internet access, and it is calculated on the basis of webographic variables. This involves creating a second sample, which can be small and may only contain information on webographic variables, but which does have to be randomly formed. The impact of these webographic variables (independent variables) on the probability of having Internet access and/or of taking part in an unrestricted survey can then be calculated using logistic regression, and a propensity score assigned to each individual. Weighting is based on the inverse of this score, i.e. the lower the likelihood of an individual having an Internet connection and/or including him/herself in a panel, the higher his or her weight (Hoogendoorn and Daalmans, 2009).
This method, while innovative compared with classic post-stratifi cation, nonetheless poses several problems. First and foremost, it presupposes that researchers are capable of forming a representative sample based on the reference population that they have identifi ed. Furthermore, even though this sample is generally far smaller than the one recruited over the Internet, it is assumed to be free of all bias. As Bethlehem (2008) has pointed out, this forces researchers to exchange the biases of their Internet sample for fi ndings which are supposedly unbiased but which are also certainly less accurate due to far larger random variations, “so a reference survey reduces the bias at the cost of a loss in precision” (p. 21).
Next, as Loosveldt and Sonck (2008) indicate in their review of the literature, researchers have reported widely divergent results on the usefulness of the procedure. Even if the variables determining the probability of taking part in a survey can be identifi ed, which is far from easy, they often prove to be relatively poor predictors of participation (Bethlehem and Stoop, 2007). For example, in a study whose negative conclusions we have already discussed, Lensveldt-Mulders et al. (2009) attempted to calculate propensity scores on the basis of age, gender, education and a “motivation” variable refl ecting individuals’ degree of concern about the environment. This variable was intended to predict the probability of individuals volunteering to join a panel of respondents for a survey on that particular topic, but the authors were forced to conclude that calculating the propensity score failed to narrow the difference between the randomly composed Internet sample and the volunteer sample. More specifi cally, while they were able to correct coverage errors by matching individuals with identical propensity scores, “the matching procedure could not remove the intrinsic differences between the random WI (web-interview) and volunteer Internet panel” (p. 4), even though both had been constructed via the Internet. The model would therefore appear to be insuffi ciently predictive, in that individuals who volunteer to take part in a Web survey retain a specifi c profi le that remains unexplainable.
Lastly, the notion of forming a reference sample for weighting purposes leads us to another issue that we have yet to touch on – the comparability of
D. FRIPPIAT, N. MARQUIS
298
results obtained over the Internet and those obtained via another mode of enquiry using probability-based sampling (RDD, in the case of computer-assisted telephone interviewing; National Population Register for postal surveys, etc.). This is the “mode effect” issue, in other words, the question of how the survey mode can infl uence results.
Quality of responses collected over the Internet: III. impact of the survey mode
The possibility of conducting a survey with a mixed-mode design has been raised by several researchers, as a means of controlling for and even reducing various biases arising from the use of the Internet for sampling purposes. Adding data obtained over the telephone or through the post to reduce coverage errors and limit self-selection bias seems like a good idea but, here too, relies on a dubious axiom: if the same sample were interviewed using two different data collection modes but extremely similar questionnaires, exactly the same responses would be obtained. Studies of comparability between Internet surveys and other survey modes have yielded highly contrasting results, however, as indicated by Deutskens et al. (2006) in their review of the literature.
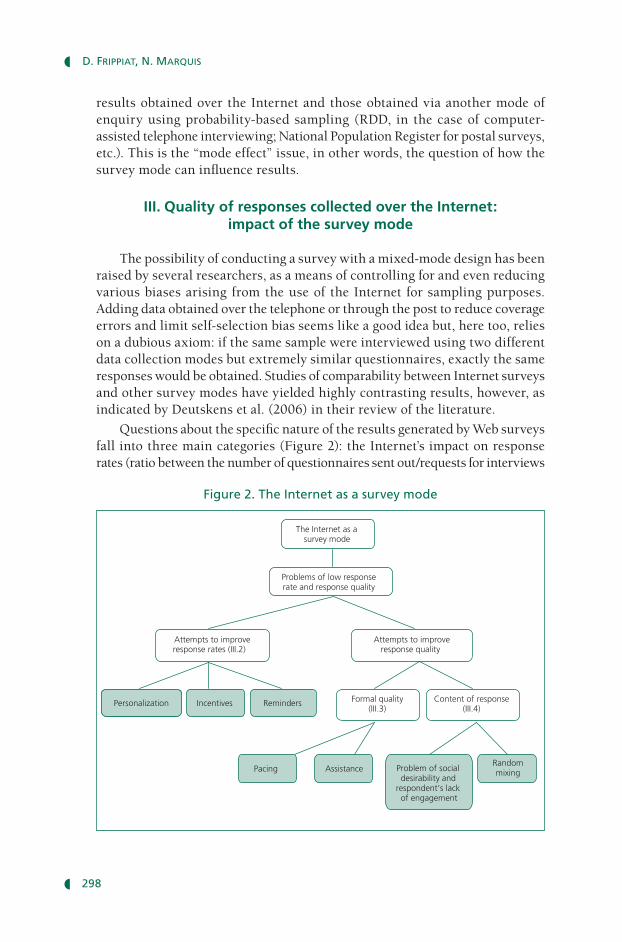
Questions about the specifi c nature of the results generated by Web surveys fall into three main categories (Figure 2): the Internet’s impact on response rates (ratio between the number of questionnaires sent out/requests for interviews
Figure 2. The Internet as a survey mode
The Internet as a survey mode
Problems of low response rate and response quality
Attempts to improve response rates (III.2)
Attempts to improve response quality
Personalization Incentives Reminders Formal quality (III.3)
Content of response (III.4)
Pacing Assistance Problem of social desirability and
respondent’s lack of engagement
Randommixing

WEB SURVEYS IN THE SOCIAL SCIENCES
299
and the number of responses received), the formal quality of responses (non-response, “don’t knows”, etc.) and the content of responses (mean scores). Moreover, Web surveys differ in several ways from other survey modes in terms of interface (“design”).
1. Innovations in terms of interface
Many authors have highlighted the advantages of Web surveys over other data collection modes. The former furnish researchers with tools that allow them to modify the interface and thereby infl uence the interaction between respondent and questionnaire as never before. On this point, see Couper’s recent book (2008) on how to give Web surveys an effective appearance, and Wright’s slightly earlier article (2005) on the software that can be used to achieve this. As Christian et al. (2009) point out in their investigation of the visual design of response scales, methodologists have traditionally focused on the impact of the question’s formulation (syntax and semantics), whereas the visual aspect has only recently started to attract attention, witness the book by Dillman et al. (2009) reviewing research on the visual appeal of Web surveys. However, although the computer medium offers new (or at least improved) opportunities for refi ning the questionnaire, each of these constitutes a fresh source of bias. Most authors agree that even tiny modifi cations can have an impact on the responses generated. Once again, however, it is very diffi cult to fi nd out which modifi cations have consequences and which are more neutral.
As with other types of self-administered questionnaires (SAQs), visual communication is of prime importance here, due to the absence of an interviewer (Dillman et al., 2009). Respondents look for informational clues about how to answer the questions being asked. In a study examining the impact of question design on respondents (positive or negative response presented fi rst, linear or non-linear layout, boxes to be fi lled in or ticked, spacing or no spacing between items, numbered or unnumbered responses, graphic layout or not, etc.), Christian et al. (2009, p. 419) emphasized that each of these aspects of the questionnaire’s layout constitutes a source of information for respondents. As such, “some visual manipulations of the response scale produce large and signifi cant differences (…)”, one example being the linear (in a column) or non-linear presentation of the response scale. These results have been confi rmed by Toepoel et al. (2008), among others, who show that the way in which items on a response scale are numbered (e.g. from 1 to 5 or from –2 to +2) has a signifi cant impact on response distribution, with negative-to-positive scales producing higher absolute means.
2. Response rates
In many ways, the issue of Web survey response rates overlaps with that of coverage and self-selection, as non-response is generally addressed from the angle of selection bias. That said, many authors also highlight the fact that

D. FRIPPIAT, N. MARQUIS
300
Web surveys affect response rates not through self-selection of volunteer participants, but through the survey design and the way it interacts with the respondent. Likewise, some have experimented with solutions linked to the logistical and technical characteristics of Web surveys.
While Web surveys are often extolled for their capacity to reach huge numbers of respondents, our previous point about sampling indicates the importance of not placing undue emphasis on sample size. A large number of respondents does not automatically mean that the sample will be of irreproachable quality. As Loosveldt et al. (2004) point out, this overemphasis on respondent numbers can mask more worrying features, for “a high percentage of non-response […] does not necessarily equal a large non-response error. In that sense, current survey practice attaches too much importance to the response percentage obtained, readily interpreting a low-response rate as a sign of poor data quality […].” (p. 67).
Response rates nevertheless tend to be regarded as a problem in Web surveys (Kaplowitz et al., 2004). In a major meta-analysis, Lozar Manfreda et al. (2008) showed that Web surveys always have response rates that are lower – by around 11% – than for other modes. Nor is this trend about to be reversed. In their review of the literature, Mu ́ñoz-Leiva et al. (2009) found that in the early years of Web surveys (1986-1992), response rates were close to 50%, partly due to the novelty effect. Since then, response rates have declined steadily. It may well be that the spiralling numbers of Web surveys and their attendant methodologies have dented the credibility of purportedly scientifi c research. It is becoming increasingly diffi cult for ordinary people to distinguish between commonplace opinion polls and in-depth studies obeying strict criteria. Furthermore, as happened with the telephone, the huge growth in Web surveys may prompt surfers to adopt the refl ex of closing all undesirable windows (including invitations to take part in surveys) and deleting any e-mails from unknown senders that have slipped through the ever more powerful fi lters. The massive use of this survey mode may therefore make potential respondents even more likely to reject unsolicited invitations. An aggravating circumstance, and one which does research a great disservice, is the fact that market researchers have been exploiting this rich seam for far longer than social scientists, and the fear of bogus lotteries, spamming and viruses now almost certainly deters people from responding (Göritz, 2006).
The benefi t of being able to contact large numbers of respondents is therefore undermined by low response rates. Even though SAQs are known to elicit fewer responses than telephone surveys, Web surveys fare even worse than postal surveys. In their comprehensive review of the literature, looking at around a hundred studies, Shih and Fan (2007) found that in mixed-mode surveys (Internet and postal), response rates were approximately 14% higher for questionnaires sent out by post than for ones sent over the Internet. In a study involving 10,000 respondents aged 50-75, who were randomly assigned to either

WEB SURVEYS IN THE SOCIAL SCIENCES
301
a Web-based questionnaire or a conventional postal one, Bech and Kristensen (2009) recorded overall response rates of 17% and 42%, respectively. The age of the target population is clearly a decisive factor in this particular instance.
The literature describes three methods intended both to ensure an adequate response rate and to enhance response quality. These are incentives, namely material or immaterial rewards for taking part in a survey, reminders sent to individuals who have not responded to the initial contact, and personalization of the interface.
Göritz (2006) sought to ascertain whether the lessons learned about incentives used in other modes could be applied to Web surveys, too. Given the numerous logistical challenges, not least relating to the new types of incentives made possible by the Internet (lotteries, competitions, Paypal payments, etc.), as well as questions about trust, connection costs borne by respondents and the “professionalization” of respondents enrolling on panels for the sake of material reward, this problem deserves further attention. Göritz’s meta-analyses (2006) confi rmed that material incentives, whether they are offered before or after the survey, increase response rates and reduce the probability of dropping out before completing the questionnaire. The mean effect is not particularly large, however, as respondents who are offered an incentive are only 19% more likely in general (odds ratio = 1.19) to respond to a survey than those who are not offered anything. Researchers would do well to use this fi gure as a yardstick for deciding whether or not to allocate part of their limited research budget to the payment of incentives. These results have since been confi rmed by the more recent literature review conducted by Sá nchez-Ferná ndez et al. (2008), who also point out that incentives do not appear to attract a particular category of respondents.
A number of authors have also looked at the use of reminders. Sending reminders over the Internet (in the case of surveys based on e-mail addresses) costs far less than sending them via traditional media, meaning that researchers can make far freer use of them. This raises the question of reminder frequency and effectiveness. When Mu ́ñoz-Leiva et al. (2009) conducted their experimental survey, they were forced to conclude that increasing the frequency of contact has only a marginal and non-signifi cant effect on the response rate. This is partly due to the fact that respondents protect themselves against these reminders by classifying them as spam.
Personalizing the interface is a particularly interesting option for Web surveys. For example, a questionnaire can be modifi ed in real time, as it is being completed, in response to the answers received. More generally, interaction between respondent and questionnaire can be enhanced (Best and Krueger, 2004). Many authors have discussed different aspects of personalization and their impact on response rates (Joinson and Reips, 2007; Schaefer and Dillman, 1998). Methods include addressing respondents by their fi rst or last name, reminding them of the responses they have already given, prefi lling the boxes,
D. FRIPPIAT, N. MARQUIS
302
and creating passwords and usernames. Once again, however, Joinson and Reips suggest that the results reported by these various authors are “highly equivocal” (p. 1373). In a study of student satisfaction with their university, which they describe as the fi rst to make successful use of personalization to improve response rates, the authors e-mailed questionnaires to several groups of students (10,000 in all). Those which began with an informal greeting (e.g. “Dear Paul”) had a greater impact on response rates (odds ratio = 1.40) than those which began with a more formal and impersonal greeting (“Dear Student”). However, the authors rightly note that this effect is not independent of the source or the sender. Accordingly, informal personalization only infl uences response rates when respondents identify the survey as emanating from powerful people or organizations (in this case, the university vice-chancellor). The signature is therefore just as important as the letter heading.
3. Formal response quality: partial non-response
We can defi ne the formal quality of responses as their potential for use by the researcher. Poor response quality therefore corresponds to high rates of non-response, “don’t knows”, and so on, and refers not to the content of the responses but instead to the form in which they are delivered to the researcher. It is therefore tempting to assume, like Smyth et al. (2009), that as the Internet makes it possible to give more detailed instructions to respondents, the responses they provide will be of a better quality.
Yet again, however, there are confl icting observations. When they compared the quality of face-to-face and Web surveys of a population with high Internet coverage, Heerwegh and Loosveldt (2008) found that the mean rate of “don’t knows” in the Web survey was 2.6 times higher than in the face-to-face one. Kreuter et al. (2008), on the other hand, using results from Internet, computer-assisted telephone interviews (CATI) and voice recognition interviews (VRIs), deduced that Internet respondents were less likely to not respond, especially for questions liable to evoke social desirability effects (see below). Similarly, in their study of the 2006 Gallup Panel (50,000 households), Rookey et al. (2008) commented that overall, the mean number of non-responses for each individual was 2.5, with 3.2 for individuals questioned by letter and just 1.9 for those questioned over the Internet. These fi ndings correspond to those of Bech and Kristensen (2009) for older people aged 50-75 years.
Web surveys provide an opportunity to enhance formal response quality and to reveal the questionnaire content progressively (pacing). Unlike printed questionnaires, where all the questions are provided at the same time, Web survey pacing prevents respondents from glancing through the questionnaire in order to pick out the questions they want to answer, or from going back to alter a response they have already given. Pacing also reduces the effort involved in completing the questionnaire: respondents no longer have to navigate through its structure, as this is automatically done for them, according to the

WEB SURVEYS IN THE SOCIAL SCIENCES
303
responses they have already given. This characteristic may reduce non-response due to navigation errors.
Questionnaires administered over the Internet can be given a far denser layout, with explanations on demand (“question mark” button), images, or markers designed to attract attention (pop-ups, fl ashing symbols, etc.). However, while all three features may arouse the respondents’ interest and capture their attention, they may also affect their responses (Shropshire et al., 2009). Another means to improve formal quality is to analyse responses in real time, if necessary returning incoherent or incomplete messages to the sender. In a study comparing groups that had replied to identical questions presented in two different forms (classic “percent chance” format and a visual format where respondents were required to assign balls to appropriate bins), Delavande and Rohwedder (2008) showed that returning incoherent responses (e.g. ones which did not add up to 100%) to respondents with an error message noticeably improved response quality. Pacing can also be used to “force” respondents to give a response in order to gain access to the next screen and the next set of questions.
4. Substantive response quality
The survey mode may also affect the distribution of responses relating to the variables of interest in a way which cannot be explained by the specifi city of the population reached by that particular medium. As usual, analyses produce a diverse range of results.
Generally speaking, authors have found that respondents to Web surveys give less extreme responses. In the study referred to earlier, Heerwegh and Loosveldt (2008) observed that Web respondents supplied more responses drawn from the middle of the rating scales than face-to-face respondents. Similarly, Dillman et al. (2009) reported that when respondents in the 2006 Gallup poll were interviewed face-to-face (CATI), they gave far more responses at the extremes of the scales than when they were questioned over the Internet. Conversely, the two visual forms of the questionnaire (Web and paper) appeared to attract more central responses, but this is not a consistent fi nding. In a survey of more than 50,000 students in the United States who answered questions about their college experience either via a printed questionnaire or over the Internet, Carini et al. (2003) found a relatively weak effect of mode, with Web-based questionnaires generating more positive means than paper ones.
With regard to the impact of the Internet survey mode on substantive response quality, two issues have been examined in depth, namely social desirability and “satisfi cing”, a term which can best be defi ned as “low respondent engagement”.
Social desirability
Social desirability refers to the tendency of respondents to provide researchers with responses that will give a favourable image of themselves, or responses
D. FRIPPIAT, N. MARQUIS
304
they think correspond to the social norm. In this sense, social desirability is linked to what Joinson et al. (2008) refer to as “self-disclosure”, which consists in revealing personal details that had previously remained hidden, even if they are rather unsavoury. This has attracted considerable attention from researchers, insofar as the anonymity afforded by Web surveys can potentially overcome respondents’ inhibitions and prompt them to reveal opinions or forms of behaviour that contravene social norms. Web surveys belong to the same category as SAQs, and we can therefore assume that, as with all questionnaires of this kind, the absence of a researcher reduces the risk of social desirability bias but increases the risk of misunderstanding the questions as they cannot be reframed. Hence the higher proportion of non-response in Web surveys, according to Kreuter et al. (2008).
Other authors paint a slightly less extreme picture, pointing out that Web survey respondents generally believe that they are dealing with an expert system (Giddens, 1987) whose mechanisms they know little about (e.g. memorizing IP addresses, sending cookies, etc.). With printed surveys, individuals feel themselves to be in control of the information they are divulging, whereas they are less certain about just how much may be gleaned from them in a Web survey without their knowledge, given the increasingly complex technical procedures involved. This often places researchers in something of a dilemma, as they have to satisfy expectations about anonymity and data confi dentiality (whether or not these are actual legal requirements), without making the procedure too cumbersome. For example, if researchers want to enable respondents to complete the questionnaire over several sessions, a username and password have to be created and this can be rather time-consuming (Zarca, 2004).
Authors nonetheless seem to agree that responding over the Internet makes individuals less sensitive to the intrusive nature of the questions than if they were replying in a different mode. This means that they can report more non-conformist or socially undesirable behaviours while not totally abandoning the notion of social desirability (De Leeuw, 2005; Joinson et al., 2008; Kreuter et al., 2008). When they modifi ed response scales, presenting high or low ranges, Toepoel et al. (2009) found that that there was no particular difference between results yielded by a Web survey and those obtained using other modes on questions prone to socially desirable responses such as “How many hours do you spend watching TV each day?”, where respondents use the response scale as a means to gauge the social norm with which they seek to conform. When a low response scale was used, 78% of individuals drawn from CentERpanel (2,000 respondents in the Netherlands) reported watching television for fewer than 2½ hours per day. When a high scale was used, however, only 46.4% gave that response. By comparison, when no scale at all was used (open question), 47.9% of individuals reporting watching television for fewer than 2½ hours per day.
WEB SURVEYS IN THE SOCIAL SCIENCES
305
Low respondent engagement (satisfi cing)
The second feature investigated in the literature is satisfi cing. Closely bound up with social desirability, it gives a broader defi nition to the tendency of respondents to choose the fi rst option they fi nd acceptable and to look no further. This type of “top-of-the-head” response only engages superfi cial cognitive processing (De Leeuw, 2005), and satisfi cing can thus be regarded as an attenuated form of non-response.
As we saw at the outset, Web surveys have opened up a new fi eld of investigation, in that we can now measure the time it takes individuals to respond, and we can track their eye movements. Spending very little time on the questions (Malhotra, 2008) or only paying attention to the fi rst response options (primacy effect observed by Galesic et al., 2009) are both indicators of low respondent engagement.
According to Krosnick et al. (2002), the level of engagement with the survey is mainly determined by the perceived diffi culty of the questions, the respondent’s ability to recall the requested information and to answer the questions being asked, and lastly, their degree of motivation. These three aspects are all linked to the investment required from respondents and have been examined together by several authors, who generally report that the greater the effort demanded, the greater the propensity to satisfi ce or drop out. Van Acker and Theuns (2009) investigated the feasibility of introducing self-anchoring scales, that is, scales whose end points are defi ned by the respondent, in order to achieve responses that were more accurate and less infl uenced by social desirability. The results obtained were in total contradiction with the predicted outcome, as the increased effort demanded of respondents simply produced a higher dropout rate, with no noticeable improvement in response quality.
With online questionnaires, the impact of this phenomenon can be reduced by the random mixing of listed responses. This is a technique whereby, for each respondent, the questionnaire presents non-ordinal responses in random order, so that the number of responses to be perused before reaching the fi rst valid one varies between respondents. While this is a useful tool for neutralizing the “fi rst seen, fi rst chosen” effect, it also introduces an additional variation between respondents. This could prove problematic, for unlike structured questionnaires, individuals with the same profi le receive slightly different questionnaires, with response options arranged in a different order.
Conclusion
Our article shows that while the Internet offers genuine opportunities for democratizing research, managing questionnaires and keeping track of the response process, it also presents many challenges, depending on the role that it plays in the scientifi c research process.
D. FRIPPIAT, N. MARQUIS
306
We would like to use this conclusion to express our general feelings towards the information we have collated. Our fi rst observation is that there is no clear consensus, despite (or because of) the sheer volume of the literature. While the Internet’s impact on sampling processes is amenable to a summary such as the one we have attempted to provide here, the same cannot be said for the inevitable “mode” effects linked not to the reference population but to the medium, as more research needs to be done on the subject. It is, however, vital that we measure the impact of this particular data collection method, if we are to include the Internet in so-called “mixed-mode” surveys, as it could potentially affect the comparability and therefore the additivity of the results.
Just because we have improved our understanding of the Internet’s effects on sampling procedures does not mean that all the problems have been solved. Quite the contrary, as the greatest obstacle would appear to be the bias arising from respondent self-selection. Making the best of a diffi cult situation, Witte (2009) sees this as a new opportunity in itself: given that Web surveys can so seldom rely on probability sampling, some authors are seeking to develop procedures aiming for representativeness without randomness. Even so, no matter how complex the methods designed to adjust the sample, the fact remains that few of them, for the time being at least, offer a convincing solution for matching non-random samples with the reference population.
Web surveys yet again raise the question of researchers’ control over the data production process. At this juncture, we therefore need to distinguish in an ideal-typical manner between Web surveys where the Internet allows researchers to retain and even increase their control, and those where the Internet weakens and even abolishes this control. Typically, Web surveys can quite legitimately be used in social science research, providing that all the respondents can be identified and contacted over the Internet, that the questionnaire’s appearance to respondents undergoes only random modifi cations, and that the researcher achieves a high response rate. It goes without saying that this is rarely the case in real life. Each deviation from this ideal situation must be clearly signalled and controlled, as far as possible.
Zarca’s work (2004; 2009) on the ethos of French mathematicians is exemplary in this regard. Viewing Web surveys as a quick and effi cient means of gathering information about individuals who cannot otherwise be contacted (e.g. due to limited funding), Zarca (2004) provides a lengthy description of the conditions under which his own survey was conducted. Although he had hoped to obtain a fi le listing all the members of the profession concerned by his survey, Zarca was only able to get hold of a database, from which many e-mail addresses were missing. He also contacted the directors of teaching and research units with a view to obtaining the e-mail addresses of their colleagues. Again, this operation was only partially successful, as some of those he contacted were worried about breaching confidentiality. Nevertheless, through a combination of approaches, the author eventually managed to achieve a
WEB SURVEYS IN THE SOCIAL SCIENCES
307
systematic listing of his target population. “We estimate that approximately 95% of the population were identifi ed using this procedure” (p. 137). Altogether, of the 2,300 people who visited the Website at least once, 921 fi lled in the questionnaire (i.e. 16% of the people he had initially contacted). Zarca emphasizes that numerous data quality controls were carried out. For example, as the questions on the socio-demographic variables were placed at the beginning of the questionnaire, the author was able to compare the characteristics of those who went on to complete the questionnaire and those who did not (something that can only be done with Web surveys, as opposed to other SAQs). Furthermore, Zarca checked that the respondents’ socio-demographic characteristics did not differ from those of the rest of the population on his list. Although this did not allow the author to check whether the sample differed from the population on the variables of interest, “it gave us grounds for assuming that the respondents formed a representative sample” (Zarca, 2009, p. 358).
Generally speaking, even if researchers cannot solve the problems posed by the use of this survey mode, they must nevertheless be aware of them and make these shortcomings as clear as Zarca did. A good Web survey is a survey whose workings are exposed. At the end of the day, the opportunities offered by the Internet for developing social science research must be taken for what they are, namely technical possibilities which increase the researcher’s control over some aspects and reduce it over others. Hopes that Web surveys will provide a means of conducting quick and inexpensive research based on representative samples are simply not realistic.
This certainly does not mean that we should abandon either the technique itself or the research that is currently being carried out on it, for we have also demonstrated that it opens up genuine new perspectives. The ease with which Web surveys generate results should not, however, prompt us to make indiscriminate use of them. Rather, Web-based research calls for even greater attention, greater control and greater honesty on the part of researchers.
Acknowledgments: We are most grateful to Jacques Marquet, and to Population’s three anonymous reviewers, for their insightful comments on the previous versions of this article.

D. FRIPPIAT, N. MARQUIS
308
REFERENCES
BECH M., KRISTENSEN M., 2009, “Differential response rates in postal and web-based surveys among older respondents”, Survey Research Methods, 3(1), pp. 1-6.
BERRET P., 2008, “Diffusion et utilisation des TIC en France et en Europe”, Paris, Ministère de la Culture et de la communication, Département des études, de la prospective et des statistiques,http://www2.culture.gouv.fr/deps/fr/Deps-CC-2008-2-TIC-site.pdf
BEST S., KRUEGER B., 2004, Internet Data Collection, Quantitative Applications in the Social Sciences, London, Sage publications, 104 p.
BETHLEHEM J., 2008, How Accurate are Self-Selection Web Surveys?, Discussion paper, http://www.npso.net/pubs/Bethlehem-2008-c.pdf
BETHLEHEM J., STOOP I., 2007, “Online panels. A paradigm theft?”, in Trotman et al. (eds), The Challenges of a Changing World, Southampton, Association for Survey Computing, pp. 113-131.
CARINI R., HAYEK J., KUH G., KENNEDY J., OUIMET J., 2003, “College student responses to web and paper surveys: Does mode matter?”, Research in Higher Education, 44(1), pp. 1-19.
CHRISTIAN M., PARSONS N., DILLMAN D., 2009 “Designing scalar questions for web surveys”, Sociological Methods Research, 37(3), pp. 393-425.
COUPER M., 2000, “Web surveys: A review of issues and approaches”, Public Opinion Quarterly, 64(4), pp. 464-494.
COUPER M., 2008, Designing Effective Web Surveys, Cambridge, Cambridge University Press, 416 p.
COUPER M., MILLE P., 2008, “Web survey methods. Introduction”, Public Opinion Quarterly, 72(5), pp. 831-835.
COUPER M., CONRAD F., TOURANGEAU R., 2007a, “Visual context effects in web surveys”, Public Opinion Quarterly, 71(4), pp. 623-634.
COUPER M., KAPTEYN A., SCHONLAU M., WINTER J., 2007b, “Noncoverage and nonresponse in an Internet survey”, Social Science Research, 36(1), pp. 131-148.
DE LEEUW E., 2005, “To mix or not to mix data collection methods in surveys”, Journal of Offi cial Statistics, 21(2), pp. 233-255.
DELAVANDE A., ROHWEDDER S., 2008, “Eliciting subjective probabilities in Internet surveys”, Public Opinion Quarterly, 72(5), pp. 866-891.
DEUTSKENS E., DE RUYTER K., WETZELS M., 2006, “An assessment of equivalence between online and mail surveys in service research”, Journal of Service Research, 8(4), pp. 346-355.
DEVER J., RAFFERTY A., VAILLANT R., 2008, “Internet surveys: Can statistical adjustments eliminate coverage bias?”, Survey Research Methods, 2(2), pp. 47-60.
DILLMAN D., SMYTH J., CHRISTIAN L., 2009, Internet, Mail and Mixed-Mode Surveys: The Tailored Design Method, 3rd edition, New York, John Wiley and Sons, 512 p.
DILLMAN D., PHELPS G., TORTORA R., SWIFT K. ET AL., 2009, “Response rate and measurement differences in mixed-mode surveys using mail, telephone, interactive voice response (IVR) and the Internet”, Social Science Research, 38(1), pp. 1-18.
EUROSTAT, 2007, Community Surveys on ICT Usage in Households and by Individuals, 2004, 2005, 2006, 2007, Eurostat.
EUROSTAT, 2009, Individuals frequently using the Internet, http://epp.eurostat.ec.europa.eu/tgm/refreshTableAction.do?tab=tableandplugin=1andpcode=tin00092andlanguage=en, accessed 19 July 2010.
FAAS T., SCHOEN H., 2006, “Putting a questionnaire on the web is not enough: A comparison of online and offl ine surveys conducted in the context of the German federal election 2002”, Journal of Offi cial Statistics, 22(2), pp. 177-190.

WEB SURVEYS IN THE SOCIAL SCIENCES
309
GALESIC M., TOURANGEAU R., COUPER M., CONRAD F., 2008, “Eye-tracking data. New insights on response order effects and other cognitive shortcuts in survey responding”, Public Opinion Quarterly, 72(5), pp. 892-913.
GANASSALI S., 2008, “The infl uence of the design of web survey questionnaires on the quality of responses”, Survey Research Methods, 2(1), pp. 21-32.
GIDDENS A., 1987, La constitution de la société, Paris, PUF, 474 p.
GLAUDE M., MOUTARDIER M., 1991, “Une évaluation du coût direct de l’enfant de 1979 à 1989”, Économie et statistique, 248, pp. 33-49.
GÖRITZ A., 2006, “Incentives in web studies: Methodological issues and a review”, International Journal of Internet Science, 1(1), pp. 58-70.
HEERWEGH D., 2005, “Effects of personal salutations in e-mail invitations to participate in a web survey”, Public Opinion Quarterly, 69(4), pp. 588-598.
HEERWEGH D., LOOSVELDT G., 2008, “Face-to-face versus web surveying in a high-internet-coverage population: Differences in response quality”, Public Opinion Quarterly, 72(5), pp. 836-846.
HEMBROFF L., RUSZ D., RAFFERTY A., MCGEE H., EHRLICH N., 2005, “The cost-effectiveness of alternative advance mailings in a telephone survey”, Public Opinion Quarterly, 69(2), pp. 232-245.
HOOGENDOORN A., DAALMANS J., 2009, “Nonresponse in the recruitment of an Internet panel based on probability sampling”, Survey Research Methods, 3(2), pp. 59-72.
HÜSING T., SELHOFER H., 2004, “DIDIX: A digital divide index for measuring inequality in IT diffusion”, IT and Society, 1(7), pp. 21-38.
ISON N., 2009, “Having their say: Email interviews for research data collection with people who have verbal communication impairment”, International Journal of Social Research Methodology, 12(2), pp. 161-172.
JOINSON A., REIPS U.-D., 2007, “Personalized salutation, power of sender and response rates to web-based surveys”, Computers in Human Behavior, 23(3), pp. 1372-1383.
JOINSON A., PAINE C., BUCHANAN T., REIPS U.-D.N, 2008, “Measuring self-disclosure online: Blurring and non-response to sensitive items in web-based surveys”, Computers in Human Behavior, 24, pp. 2158-2171.
KAPLOWITZ M., HADLOCK T., LEVINE R., 2004, “A comparison of web and mail survey response rates”, Public Opinion Quarterly, 68(1), pp. 94-101.
KREUTER F., PRESSER S., TOURANGEAU R., 2008, “Social desirability bias in CATI, IVR and web surveys. The effects of mode and question sensitivity”, Public Opinion Quarterly, 72(5), pp. 847-865.
KROSNICK J. A., HOLBROOK A. L., BERENT M. K., CARSON R. T. ET AL., 2002, “The impact of “no opinion” response options on data quality: Non-attitude reduction or an invitation to satisfi ce?”, Public Opinion Quarterly, 66(3), pp. 371-403.
LEE S., 2006, “Propensity score adjustment as a weighting scheme for volunteer panel web surveys”, Journal of Offi cial Statistics, 22(2), pp. 329-349.
LEE S., VAILLANT R., 2009, “Estimation for volunteer panel web surveys using propensity score adjustment and calibration adjustment”, Sociological Methods Research, 37(3), pp. 319-343.
LENSVELT-MULDERS G., LUGTIG P., HUBREGTSE M., 2009, “Separating selection bias and non-coverage in Internet panels using propensity matching” Survey Practice, http://surveypractice.fi les.wordpress.com/2009/09/lensvelt-mulders1.pdf, accessed on 3/10/09.
LITTLE R., RUBIN D., 2002, Statistical Analysis with Missing Data, New York, John Wiley and Sons, 408 p.
LOOSVELDT G., CARTON A., BILLIET J., 2004, “Assessment of survey data quality: A pragmatic approach”, International Journal of Market Research, 46(1), pp. 65-82.
LOOSVELDT G., SONCK N., 2008, “An evaluation of the weighting procedures for an online access panel survey”, Survey Research Methods, 2(2), pp. 93-105.

D. FRIPPIAT, N. MARQUIS
310
LOZAR MANFREDA K., BOSNJAK M., BERZELAK J., HAAS I., VEHOVAR V., 2008, “Web surveys versus other survey modes: A meta-analysis comparing response rates”, International Journal of Market Research, 50(1), pp. 79-104.
MALHOTRA N., 2008, “Completion time and response order effects in web surveys”, Public Opinion Quarterly, 72(5), pp. 914-934.
MU ́ÑOZ-LEIVA F., SÁ NCHEZ-FERNÁ NDEZ J., MONTORO-RIOS F., IBÁ Ñ EZ-ZAPATA J., 2009, “Improving the response rate and quality in web-based surveys through the personalization and frequency of reminder mailings”, Quality and Quantity, http://www.springerlink.com/content/3r5h867076046q7x, accessed on 05/10/09.
ROOKEY B., HANWAY S., DILLMAN D., 2008, “Does a probability-based household panel benefi t from assignment to postal response as an alternative to internet-only?” Public Opinion Quarterly, 72(5), pp. 962-984.
SÁ NCHEZ-FERNÁ NDEZ J., MU ́ÑOZ-LEIVA F., MONTORO-RIOS F., IBÁ Ñ EZ-ZAPATA J., 2008, “An analysis of the effect of pre-incentives and post-incentives based on draws on response to web surveys”, Quality and Quantity, http://www.springerlink.com/content/a62v71m7263v1442, accessed on 05/10/09.
SCHAEFER D., DILLMAN D., 1998, “Development of a standard e-mail methodology: Results of an experiment”, Public Opinion Quarterly, 62(3), pp. 378-397.
SCHONLAU M., VAN SOEST A., KAPTEYN A., COUPER M., 2009, “Selection bias in web surveys and the use of propensity scores”, Sociological Methods Research, 37(3), pp. 291-318.
SCHONLAU M., ZAPERT K., SIMON L., SANSTAD K. ET AL., 2004, “A comparison between responses from a propensity-weighted web survey and an identical RDD survey”, Social Science Computer Review, 22(1), pp. 128-138.
SHIH T., FAN X., 2007, “Response rates and mode preferences in web-mail mixed-mode surveys: A meta-analysis”, International Journal of Internet Science, 2(1), pp. 59-82.
SHROPSHIRE K., HAWDON J., WITTE J., 2009, “Web survey design: Balancing measurement, response, and topical interest”, Sociological Methods and Research, 37(3), pp. 344-370.
SMYTH J., DILLMAN D., CHRISTIAN L., MCBRIDE M., 2009, “Open-ended questions in web surveys: Can increasing the size of answer boxes and providing extra verbal instructions improve response quality?”, Public Opinion Quarterly, 73(2), pp. 325-337.
TOEPOEL V., DAS M., VAN SOEST A., 2008, “Effects of design in web surveys: Comparing trained and fresh respondents”, Public Opinion Quarterly, 72(5), pp. 985-1007.
TOEPOEL V., CORRIE V., DAS M., VAN SOEST A., 2009, “Design of web questionnaires: An information-processing perspective for the effect of response categories”, Sociological Methods Research, 37(3), pp. 371-392.
TOURANGEAU R., RIPS L., RASINSKI K., 2000, The Psychology of Survey Response, Cambridge, Cambridge University Press, 415 p.
VAN ACKER F., THEUNS P., 2009, “On possibilities and limitations of using self-anchoring scales in web surveys”, Quality and Quantity, http://www.springerlink.com/content/b754u16542660m20/ accessed on 03/10/09.
WITTE J., 2009, “Introduction to the special issue on web surveys”, Sociological Methods and Research, 37(3), pp. 283-290.
WRIGHT K. B., 2005, “Researching Internet-based populations: Advantages and disadvantages of online survey research, online questionnaire authoring software packages, and web survey services”, Journal of Computer-Mediated Communication, 10(3).
ZARCA B., 2004, “Un sociologue avec des “scientifi ques durs” sur la toile. Conditions de la recherche au CNRS pour la plus mal aimée des sciences et aperçu de ses relations avec certaines des plus légitimes”, Genèses, 55, pp. 126-162.
ZARCA B., 2009, “L’ethos professionnel des mathématiciens”, Revue française de sociologie, 50(2), pp. 351-384.

WEB SURVEYS IN THE SOCIAL SCIENCES
311
Didier FRIPPIAT, Nicolas MARQUIS • WEB SURVEYS IN THE SOCIAL SCIENCES: AN OVERVIEW
There has been a huge increase in the number of social science surveys conducted over the Internet in the last decade, especially in the area of quantitative research. Interest in this method has generated abundant literature, almost all of it in English-speaking world. The present article provides an exhaustive list of the questions raised in the literature by this survey method. They fall into two categories: issues relating to sampling procedures (who exactly responds to Web surveys?) and concerns about effects of the survey mode (what is the quality of responses elicited by Web surveys?). While there is consensus in one or two areas, researchers’ analyses are otherwise widely divergent. Many agree that random sampling is extremely diffi cult to achieve over the Internet, but the procedures used to compensate for sampling bias (weighting, post-stratifi cation, propensity score adjustment) are strongly contested. Similarly, regarding the use of new technologies for innovative questionnaire design, studies demonstrating real and reproducible effects are still few and far between. The present article, which also cites examples of good practice, concludes by setting out the vital precautions to taken when designing a Web survey for social science research.
Didier FRIPPIAT, Nicolas MARQUIS • LES ENQUÊTES PAR INTERNET EN SCIENCES SOCIALES : UN ÉTAT DES LIEUX
Les enquêtes en sciences sociales réalisées par Internet ont proliféré durant la dernière décennie, particulièrement dans le domaine de la recherche quantitative. L’intérêt que cette méthode suscite a produit une littérature presque totalement issue du monde anglo-saxon. Il semblait donc indispensable que les débats autour de l’enquête par Internet puissent devenir accessibles au lecteur francophone. À partir d’une revue de la littérature existante, l’article offre un relevé exhaustif des questions soulevées par cette méthode, qui sont de deux types : les problèmes liés aux procédures d’échantillonnage (qui répond aux enquêtes par Internet ?), et ceux concernant l’effet « mode » généré par ce canal d’enquête (quelle est la qualité des réponses produites ?). Au-delà de quelques éléments de consensus, les analyses des chercheurs sont loin d’être concordantes. Si beaucoup s’accordent pour signaler que l’échantillonnage aléatoire est très diffi cile à réaliser sur Internet, l’effi cacité des procédures de rectifi cation d’échantillon (pondération, poststratifi cation, pondération par l’inverse de la propension à être inclus dans l’échantillon) est fortement discutée. De même, lorsqu’il s’agit de tirer parti des nouvelles possibilités techniques en termes de conception du questionnaire, les recherches démontrant des effets réels reproductibles sont encore peu nombreuses. L’article, qui propose également un relevé de bonnes pratiques, conclut sur les indispensables précautions à prendre lorsqu’est créée une enquête par Internet dans une perspective de recherche en sciences sociales.
Didier FRIPPIAT, Nicolas MARQUIS • LAS ENCUESTAS POR INTERNET EN CIENCIAS SOCIALES: UN BALANCE GENERAL
Las encuestas sociales realizadas por Internet han proliferado durante el último decenio, particularmente en el dominio de la investigación cuantitativa. El interés suscitado por este método ha producido una literatura que proviene integralmente del mundo anglosajón. Parecía pues indispensable que los debates en torno a la encuesta por Internet fueran accesibles al lector francófono. A partir de un examen de la literatura existente, el artículo ofrece un inventario exhaustivo de las cuestiones que este método plantea, y que son de dos tipos: los problemas ligados a los procedimientos de muestreo (¿quién responde a las encuestas por Internet?), y los que se refi eren al efecto “modo” generado por este tipo de encuesta (¿cuál es la calidad de las respuestas producidas?). Aparte de algunos puntos de acuerdo, los análisis de los investigadores no son muy convergentes. Si muchos de ellos piensan que el muestreo aleatorio es muy difícil de obtener por Internet, la efi cacia de los procedimientos de corrección de la muestra (ponderación, post-estratifi cación, ponderación por el inverso de la propensión a formar parte de la muestra) es muy discutida. Del mismo modo, cuando se trata de sacar partido de las nuevas posibilidades técnicas en términos de concepción del cuestionario, las investigaciones mostrando efectos reales reproductibles son todavía poco numerosas. El artículo, que propone también una serie de prácticas recomendables, concluye sobre las precauciones indispensables que hay que tomar cuando se crea una encuesta por Internet con una perspectiva de investigación en ciencias sociales.
Translated by Elizabeth Wiles-Portier.