Water Resources of the Baltimore Area Maryland - USGS ...
112
Water Resources of the Baltimore Area Maryland By E. G. OTTON,. R. O. R. MARTIN, and W. H. DURUM WATER RESOURCES OF INDUSTRIAL AREAS GEOLOGICAL SURVEY WATER-SUPPLY PAPER 1499-F UNITED STATES GOVERNMENT PRINTING OFFICE, WASHINGTON : 1964
-
Upload
khangminh22 -
Category
Documents
-
view
0 -
download
0
Transcript of Water Resources of the Baltimore Area Maryland - USGS ...

Water Resources of the Baltimore Area MarylandBy E. G. OTTON,. R. O. R. MARTIN, and W. H. DURUM
WATER RESOURCES OF INDUSTRIAL AREAS
GEOLOGICAL SURVEY WATER-SUPPLY PAPER 1499-F
UNITED STATES GOVERNMENT PRINTING OFFICE, WASHINGTON : 1964

UNITED STATES DEPARTMENT OF THE INTERIOR
STEWART L. UDALL, Secretary
GEOLOGICAL SURVEY
Thomas B. Nolan, Director
For sale by the Superintendent of Documents, U.S. Government Printing Office . Washington, D.C. 20402

CONTENTS
Page
Abstract_____________________________.. . FlIntroduction.. _____________________________________ 1
The hydrologic cycle______________________ __ ______ 5Low-flow analyses.- _______________ ______ _ 6
Water resources of the Piedmont subarea______________-_-____--_-_-__ 9Crystalline rocks_____________________________________________ 10
Problems of well and aquifer hydraulics. _____________----___- 13Water-level fluctuations-_--____-_____-____-----_---_------- 13Chemical quality of ground water.________________________ 17Temperature of ground water______________________________- 17Use of ground water_____________________________________ 19
Susquehanna River __________________________________________ 20Discharge._____________________________________________ 20Chemical quality of water._________________________________ 20Water storage_____________________________________________ 21Water use. _ ___ _ 21
Deer Creek_________________________ _________ 21Discharge._______________________________________________ 21Low-flow frequency______________________________________ 22Chemical quality of water ______ ____________________________ 23Floods. _______________________-_--_____ 23Water use______--____________________________-___-_______ 30
Bush River _____________________________________ 30Discharge._______________________________________________ 30Chemical quality of water______________________________ 30
Gunpowder River_____________________________________________ 31Discharge.... __________ __ ___ _ _ 31Low-flow frequency______ __________________________________ 33Chemical quality of water________________________________ 33Temperature____________________________________________ 36Water storage____________________________ 36Floods.._______________________________. 38Water use________________________________________________ 41
Patapsco River_____________________________________________ 43Discharge._______________________________________________ 43Chemical quality of water_.________________________________ 46Temperature____________________________________________ 47Water storage___________________________________________ 47Floods-._________________________________ 50Water use___________.____________________________________ 50
Patuxent River_____________________________________________ 51Discharge._______________________________________________ 51Chemical quality of water__________________________________ 54Temperature_ ___________________________________________ 55Water storage___________________________________________ 55Floods. ___________._____________________ 56Water use______________________________________ r _________ 57
m

IV CONTENTS
Page Water resources of the Coastal Plain subarea.__-_-___--__-------_---- F57
Patuxent formation.___________________________________________ 60Occurrence of ground water___--_____-_-___--__--_-_-------- 61Water-level fluctuations_____________________-----___.------ 62Chemical quality of ground water. __________________________ 62Use of ground water_____________________-____-_--____----- 67
Arundel clay__________________________________________________ 70Patapsco and Raritan formations._-____-____---_-------_-_------ 70
Occurrence of ground water__________-__-____-_--_________-- 72Water-level fluctuations-.-.-------------------------------- 73Chemical quality of ground water_-_______-_-_---_--________ 73Use of ground water.______________________________________ 73
Magothy formation.___________________________________________ 73Monmouth formation...._________-____-_-_-___-___-_-_____.-_- 74Pleistocene and Recent deposits___-________--_-_-_----_--_-___-- 75Sawmill Creek.____________-___-_____-__-_--_-_------__---_-_- 76
Discharge ____._____________-_._-_____---_-_._--._________ 76Chemical quality of water-__-____-_____-_--_-_-_--_________ 77
Bacon Ridge Branch.__________________________________________ 77North River near Annapolis._____-_________-_-__--_-_-_-__-____ 79
Discharge ________________________________________________ 79Chemical quality of water.__--_________-______--_-__-______ 80
Baltimore Harbor as a source of water.__________________________ 80Chloride distribution in water_._____________________________ 82Water temperature________________-_______________________ 85pH, alkalinity, and acidity of water________________________ 85Other chemical characteristics of water_______________________ 86Flushing of the estuary. .__-_-___-___--.___._______________ 87Saline-water use___-_____--___-______----_-____---_______-_ 87
Salt-water encroachment___________________________________________ 87Public water-supply systems_________________----_____-_____________ 90Water supply from sewage effluent_________________________________ 93Potential supply of fresh water... _________ ____________ ______________ 94
Piedmont subarea.____________________________________________ 94Coastal Plain subarea--_.____-_-_-_________-___________________ 98
Definition of terms used__-_---____-__-___-_____-____--_____________ 99References. _______________________________________________________ 101
_-__-_____________________________________________________ 103
ILLUSTRATIONS
[Plates are in pocket]
PLATE 1. Map of the Baltimore area showing where water resources data have been collected.
2. Generalized geologic map of the Baltimore area.3. Altitude of the top of the Patuxent formation.

CONTENTS V
Page FIGURE 1. Index map showing location map of the Baltimore area. ______ F2
2. Streamflow records in the Baltimore area_______.______---_ 73. Duration curves of daily flow in five basins in the Baltimore
area, 1896-1952___________________________ 84 Columnar section showing complex age relationship of meta-
morphic and igneous rocks _____________-___------__---- 115. Water-level fluctuation in two wells and moving average
precipitation in the Piedmont subarea_________________ 156. Relation between annual net change in water levels and annual
precipitation at Baltimore____________________.__---__- 167. Profile of water temperatures in four wells in the Piedmont
subarea.____________________________________________ 19S. Monthly flow of Deer Creek at Rocks, 1927-55...______ 229. Duration curve of daily flow, Deer Creek at Rocks.________ 22
10. Low-flow frequency curves, Deer Creek at Rocks___________ 2311. Chemical and physical characteristics of water from selected
streams ______________-______________-_____---------_ 2712. Flood-stage frequency curve, Deer Creek at Rocks.________ 2713. Duration curves of daily flow of streams in the Gunpowder
River basin__-______-____-_____---_____-----__------- 3214. Low-flow frequency curves, Little Gunpowder Falls at
Laurel Brook__.___._______________________ 3215. Number of consecutive days of deficient discharge, Little
Gunpowder Falls at Laurel Brook_____________-_--__---_ 3416. Maximum and minimum temperatures of tap water at Ba'ti-
more in 1953________.___________________ 3717. Annual flow of Gunpowder Falls at Loch Raven Dam, 1884-
1956______________________________________ 3918. Curves of storage required to sustain a given minimum 7-c1ay
flow with a specified recurrence interval, Little Gunpowder Falls at Laurel Brook______________________ 40
19. Duration curves of daily flow for streams in the Patapr«?oRiver basin__________________________________________ 44
20. Duration curves of daily flow, Patapsco River at Hollofield__ _ _ 4521. Low-flowfrequency curves, Piney Run near Sykesville______ 4622. Curves of storage required to sustain a given minimum 7-day
flow with a specified recurrence interval, Piney Run near Sykesville--___________________________ 48
23. Duration curves of daily flow for streams in the PatuxentRiver basin______________________________________ 53
24 Low-flow frequency curves, Little Patuxent River at Guilford_ 5325. Low-flow frequency curves, Dorsey Run near Jessup_. ___-.__ 5426. Curves of storage required to sustain a given minimum 7-<?ay
flow with a specified recurrence interval, Little Patuxent River at Guilford___________________________________ 56
27. Map showing location of industrial districts______________ 6828. Geology at the well field of the Anne Arundel County Sanitary
Commission at Glen Burnie__________________________ 7129. Geology along the lower Severn River near Annapolis_______ 7130. Duration curves of daily flow for three streams in the Coaetal
Plain. ____________________..___________... 7731. Low-flow frequency curves for North River near Annapolis. 79

VI CONTENTS
PageFIGURE 32. Curves of storage required to sustain a given minimum 7-day
flow with a specified recurrence interval for North River near Annapolis.._____________________________________ F80
33. Monthly chloride concentration in main channel of F^.tapscoRiver, Baltimore Harbor_______________-______________ 82
34. Range and median chloride concentration in main channel,Baltimore Harbor, 1947-49______-__ -_________ 83
35. Idealized sections showing movement of water in shallow aquifers: (A) Movement of fresh water prior to heavy pumping in industrial areas; (B) Movement of sal* water from Patapsco estuary induced by heavy pumping. _____ 88
36. Present and proposed sources of water supply and d'stribu-tion, city of Baltimore.. ____________--_-__---_-_-_____ 93
37. Present use and the fresh water supply in the Baltimore area(exclusive of the Susquehanna River)___________________ 95
TABLES
Page
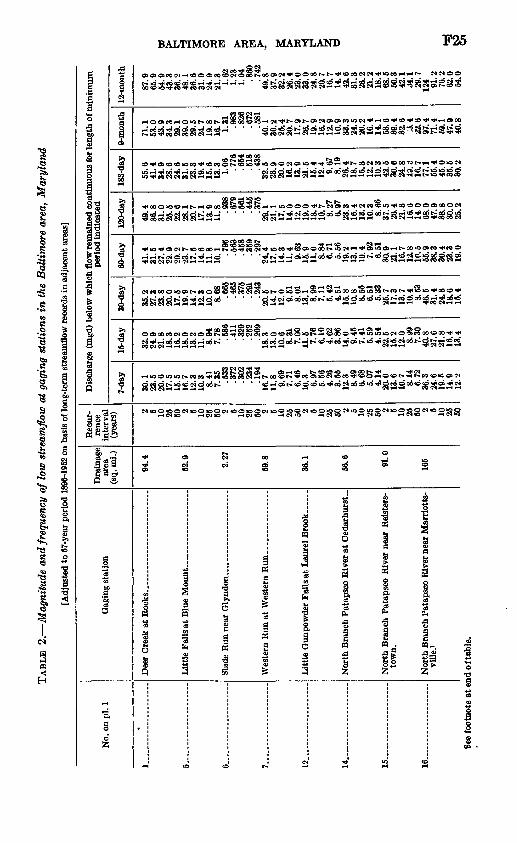
TABLE 1. Duration of daily flow of streams in the Baltimore area. _____ F242. Magnitude and frequency of low streamflow at gaging station
in the Baltimore area__________________________________ 253. Chemical analyses of water from selected Piedmont streams. _ 284. Gaging-station data for the Gunpowder River basin. ________ 315. Selected chemical and physical characteristics of ray water
from Gunpowder Falls, 1954__________________________ 356. Minimum, maximum, and average concentrations of chemical
substances in water from principal uncontaminated aquifers. 667. Use of ground water by the Anne Arundel County Sanitary
Commission in 1951 and 1955____________________ 678. Use of ground water by military establishments in 1£51 and
1955-_____________________-________________ 689. Use of ground water in the industrial area in 1945 and 1955. _ 69
10. Chemical analyses of water from selected streams of theCoastal Plain.._____________________________________ 78
11. Distribution of known biochemical oxygen demand (BOD)loading to Baltimore Harbor, 1950.___-,__--__---____-___ 81
12. Observed chloride concentration, temperature, and pH inBaltimore Harbor during summers of 1947-49____________ 84
13. Chloride concentration of periodic samples of wate** fromfour index wells_______________________________________ 89
14. Summary of available flow in Piedmont streams unaffectedby major storage reservoirs..___________________________ 97

WATER RESOURCES OF INDUSTRIAL AREAS
WATER RESOURCES OF THE BALTIMORE AREA, MARYLAND
By E. G. OTTON, R. O. E. MARTIN, and W. H. DURUI-:
ABSTRACT
The available fresh-water supplies from all sources in the Baltinore area except the Susquehanna River total about 800 mgd (million gaUons per day). In 1956, the fresh water used for all purposes was about 280 mgd, ?2 percent of the available supply. Baltimore City used 198 mgd, or about Tl percent of the total water used in the area. The Susquehanna River is not included in these totals although it is a potential source of supply. Industries use, prin cipally for cooling, 1,500 mgd of saline water from the lower Patapsoo estuary.
Ground-water sources supply only about 5.5 mgd, or 2 percent, of th^ 248 mgd combined use of ground and surface water in the Piedmont subarea. Ir contrast, about 32 mgd of ground water and only 0.5 mgd of surface water is presently withdrawn in the Coastal Plain subarea. About 75 percent of the water used in the Coastal Plain subarea supplies industrial and commercial needs.
INTRODUCTION
The Baltimore area as here defined includes all Baltimore City, Baltimore and Harford Counties, eastern Howard Courty, and northern Anne Arundel County. Streams of special importance are Gunpowder Falls, Patapsco River, Magothy Eiver, Severe Eiver, the lower reaches of the Patuxent River, and the Susquehanna Eiver at the east edge of the area.
The Baltimore area lies* in two geologic and physiographic pro vinces, the Piedmont and the Coastal Plain, separated by a north eastward-trending line called the Fall Line or, more properly, the Fall Zone (fig. 1). The Fall Zone is roughly followed by the Baltimore and Ohio Railroad from Laurel in Prince Georges County to Aber deen in Harford County. The Piedmont subarea lies north of the Fall Zone, and the Coastal Plain subarea lies to the south.
In general, the water resources of the Baltimore area are m'vre than adequate to support its expanding population and economy. Most of
Fl

F2 WATER RESOURCES OF INDUSTRIAL AREAS
77° PENNSYLVANIA
FIGURE 1. Index map showing location of the Baltimore area, Maryland.
the flow, however, already has been pre-empted. The flow of the major streams is adequately maintained, even during severe drought, by release from storage. Some stream water is excessively turbid and may be too warm at times for some uses. The chief ground-water problem is the development of an adequate quantity of water that is

BALTIMORE AREA, MARYLAND F3
of acceptable quality or that can be made so economically. In some places in the Baltimore area, where ground water is of poor chemical quality, the use of surface water is favored.
In the Piedmont subarea, ground-water supplies are sufficient only to supply the needs for domestic or some commercial use; the yields of individual wells range from less than 1 to more than 100 gpm (gallons per minute) but average only 12 gpm or 0.017 mgd (million gallons per day). Wells yielding 50 to 100 gpm are uncorrmon and those yielding more than 100 gpm are scarce. Ground water in the Piedmont subarea commonly occurs under water-table conditions in the uppermost 250 feet of the rocks, and most wells and springs yield water derived from local recharge. The chief aquifers are the crys talline rocks, including schist, gneiss, gabbro, granite, and marble in which much of the ground water is stored in the more permeable zone of decomposed rock that lies near the land surface. Tie chem ical character of ground water in the Piedmont subarea is not uni form. The lowest concentrations of dissolved solids, whi'vh range from about 20 to 300 ppm (parts per million), are associated with water from schist and quartzite, and the highest are associated with water from serpentine and marble. The latter yield the hardest water also. Iron in water is a widespread problem.
Comparatively large supplies of ground water are available in the Coastal Plain subarea. Here the yields of individual wells for industrial and public supplies range from a few gallons per- minute to as much as 1,000 gpm, or 1.44 mgd (million gallons per day), and average more than 200 gpm, or 0.288 mgd. The major aqrifers are the sand and gravel of Cretaceous and Pleistocene ages. THse units are separated from each other by relatively impervious confining layers of clay. Most of the ground water in the Coastal Plain occurs under artesian or semi-artesian conditions.
Poor water quality hinders development of additional fresl ground- water supplies in some parts of the Coastal Plain. The important aquifers yield water that generally contains as much as 1 I *>m iron, is low in dissolved solids, is slightly acidic, and, therefore, is corrosive to pumping equipment.
The major aquifers have been contaminated with saline wpter from the Patapsco Eiver and its tributaries as a result of heavy ground- water pumping in the Baltimore industrial area during the last 30 to 40 years. Locally the chloride content has exceeded 1,600 ppm.
Baltimore and its suburbs, Annapolis, Bel Air, and Laurel are the principal areas served by public water-supply systems. T1 ^ Balti more supply is the largest, and in 1954 served a populatior of more than 1,260,000 with water that is treated to meet rigid quality specifi cations.

F4 WATER RESOURCES OF INDUSTRIAL AREAS
A feature of the Baltimore sewerage system is that treated sewage effluent from its Back River plant is sold for industrial cooling water at Sparrows Point.
The increase in utilization of fresh surface water in th^ Baltimore area has been gradual, but by 1959 most surface-water sources were pre-empted. The storage of streamflow in three large reservoirs has greatly increase the efficiency of the water-supply system. Expansion to sources outside the area has been required because present demand is rapidly approaching the safe yield (with storage) of these sup plies. This need is being met by development of diversion facilities from the Susquehanna Kiver, which will insure an adequate supply for Baltimore at least until the year 2000.
Less populated outlying industrial and residential arear may find it feasible to develop some of the smaller but presently undeveloped streams, as nearly all streams in the area flow continually. Yields for streams in the Coastal Plain subarea exceed those for the Piedmont subarea. Large quantities of saline water, suitable for cooling, are available in the lower Patapsco estuary.
Surface water in the Piedmont subarea is generally low in dis solved solids, soft, slightly alkaline on the pH scale, and moderately low in dissolved iron and manganese. In the Coastal Plain the water in small streams is generally low in mineral content, sof* r and acid; sulfate is a prominent constituent.
This report contains and evaluates basic information on the avail ability and use of water resources of the Baltimore are",. This in formation will aid water planners, industrialists, planning officials of local governmental units, engineers, and hydrologists in the develop ment of the area's water resources.
In addition to this report, detailed data on streamflow and ground- water levels in the area are published in the annual series of U.S. Geological Survey water-supply papers: Part IB of "Surface Water Supply of the United States" and Part 2 of "Water Levels and Artesian Pressure in Observation Wells in the United Spates."
The principal water-resources studies in Maryland are cosponsored by the U.S. Geological Survey and the Maryland Department of Geology, Mines, and Water Resources. This cooperative program of studies has provided much of the basic information used to prepare this report. Several recent publications by the Maryland Department of Geology, Mines, and Water Resources, which were prepared in co operation with the U.S. Geological Survey, contain information on the occurrence of ground water, the flow of streams, and the chemical character of both surface and ground water in the area. These publi cations are: Bulletin 3, "The Water Resources of Arne Arundel County, 1949"; Bulletin 4, "Geology and Ground-water Resources of

BALTIMORE AREA, MARYLAND F5
the Baltimore area, 1952"; Bulletin 14, "The Water Resources of How ard and Montgomery Counties, 1954"; and Bulletin 17, "Tl <* Water Eesources of Baltimore and Harford Counties, 1956."
The authors of this report have been aided greatly by the coopera tion of the Director, Maryland Department of Geology, Mines, and Water Eesources, by the officials of the Baltimore City Bureau of Water Supply, and by the Anne Arundel County Sanitary Commis sion. Information on the chemical character of the water has been provided also by the Maryland Department of Health and by the Maryland Water Pollution Control Commission. Precipitation data were obtained from published records of the U.S. Weather Bureau.
THE HYDROLOGIC CYCLE
The hydrologic cycle describes the movement of water from the Sea, to the atmosphere, to the land masses, and back again to the sea. An understanding of the operation of the cycle aids in appraising and developing the water resources. This report describes the irovement of water after the water falls upon the surface of the earth and before it reaches the sea.
The source of all fresh water is precipitation, which averages about 42 inches per year in the Baltimore area. Part of the precipitation enters the ground and the rest runs off in streams or evaporates. The water entering the ground percolates downward to the ground-water reservoir (zone of saturation) or is collected in the soil and returned to the atmosphere by evaporation or transpiration. The upper sur face of the zone of saturation is called the water table, and the ground- water reservoir is called an aquifer if it is capable of yielding water to wells or springs at a usable rate. Where a stream channel cuts into a ground-water reservoir, ground water seeps into the stream channel and becomes the base or dry weather flow of the stream.
As the water percolates downward, some is used to wet tl x ? soil in the layer of unsaturated earth above the water table (zone of aera tion) , and the remainder recharges the ground-water reservoir. Soil moisture is depleted by evaporation or transpired by vegetation. Water returned to the atmosphere by evaporation and transpiration usually is considered together as evapotranspiration.
Recent studies of the Little Gunpowder Falls basin, whose drainage area is 36 square miles (Dingman and Ferguson, 1956, p. 48), show that during a 22-year period about 25 inches (about 60 percert) of the precipitation was returned to the atmosphere through evapotranspira tion. The remaining 17 inches (40 percent) ran off in the streams 6 inches (14 percent) directly as overland flow and about 11 inches (11 inches) after temporary storage in the ground.

F6 WATER RESOURCES OF INDUSTRIAL AREAS
Over a period of time, ground-water discharge equals ground-water recharge in the Baltimore area. Some ground water is discharged through transpiration by deep-rooted vegetation or by evaporation from areas where the water table reaches or approaches the land sur face, but the amount of water discharged in this process apparently is relatively small. Thus, the 11 inches of annual ground-water dis charge in the Little Gunpowder Falls basin is approximately the meas ure of ground-water recharge in the Piedmont subarea.
LOW-FLOW ANALYSES
Gaging-station records are the principal basic data for the study of surface-water resources. The records collected in the Baltimore area are shown on the bar graph of figure 2 and their locations are shown on plate 1. Some of the 28 streamflow records in the area are short term. To improve the reliability of the low-flow analysis the stream- flow records in the area were correlated with long-term streamflow records outside the report area and adjusted to a 57-year base period, April 1896 to March 1953. Records for this period are available for Monocacy River near Frederick, Md., and Potomac River at Point of Rocks, Md. Records for Brandywine Creek at Chadds Ford, Pa., for the 42-year period 1912-53 also were used in developing the basic correlations. In making the low-flow analyses, the climat; c year start ing April 1 was used in order that the low-flow period of the summer and fall could be treated as a unit.
Water-supply engineers sometimes base their designs en the lowest flow known. This single event, however, is a poor basis for design without consideration of the frequency of its occurrence. Frequency of low-flow events is expressed in two ways in this report, by flow duration curves and by low-flow frequency curves.
The flow-duration curve (fig. 3) is a cumulative frequency curve that shows the percentage of time in which specified discharges were equaled or exceeded during a given period. If streamflo^ during the period on which the curve is based represents the long-term daily flow of the stream, the curve may be used as a probability curve to estimate the percentage of time a specified daily discharge will b«. equaled or exceeded in the future. A single flow-duration curve abo shows the flow characteristics of a stream throughout the entire range in dis charge. The slope of the curve indicates the magnitude of stprage in the drainage basins. Thus, on unregulated streams, w^ll-sustained or flat duration curves indicate large natural storage. T% e lower end of the duration curve reflects the effects of subbasin geology on stream- flow. The daily flow-duration curves in figure 3 were compiled from

BALTIMORE AREA, MARYLAND F7
SJ.
WATER YEARSENDING SEPTEMBER 30
(Dates indicate limits of records)
. L
GAGING STATIONS
Non record ing
Recording
12
3
4
5
6
7
8
9
10
11
12
13
14
15
16
17
18
19
20
21
22
23
24
25
26
27
28
Oct. 1,1926
D Dec. 14,1904-Mar. 31.1909J
July 7,1950-Sept. 30,1955
June 3,1944-Apr. 5,1951 July 1,1955
June 24,1944
Sept. 17,1947
Sept. 1,1944
DOec. 15,1904-Mar. 31,1909
Jan. 1915
Sept. 29,1949
Dec. 7,1926
DDec. 13,1904-Mar. 31,19091
Sept. 22,1945
June 30,1927 Dec. 31,1953
Oct. 28,1929
Aug. 18,1948
Sept. 22,1931
ODD 1897,1898,1902,1903, 1906-8
May 22,1944
May 11,1944-Sept. 30,1952
Dec. 15,1931
Nov. 5,1942-Sept.30,1952 I
Oct. 1.1944
D Aug. 3,1896-Aug. 10,1898
May 3,1932
Nov. 27,1939
July 1,1948
Deer Creek at Rocks
Deer Creek near Churchvilte
Bynum Run near Bel Air
Bynum Run at Bel Air
Little Falls at Blue Mount
Slade Run near Glyndon
Western Run at Western Run
Gunpowder Falls at Glencoe
Gunpowder Falls at Lock Raven Danl
Gunpowder Falls at Lock Raven Dan (former site) 1
Gunpowder Falls near Carney
Little Gunpowder Falls at Laurel Brook
Little Gunpowder Falls near Bel Air
North Branch Patapsco River at Cec*arhurst
North Branch Patapsco River near Reisterstown
North Branch Patapsco River near Marriottsville
South Branch Patapsco River at Henryton
Piney Run near Sykesville
Patapsce River at Woodstock
Patapsco River at Holtofield
Sawmill Creek at Glen Burnie
North River near Annapolis
Bacon Ridge Branch at Chesterfield
Patuxent River near Laurel
Patuxent River at Laurel
Little Patuxent River at Guilford
Little Patuxent River at Savage
Dorsey Run near Jessup (at Annapolis Junction)
1 Monthly discharge records furnished by Baltimore Department of Public Works
FIGURE 2. Streamflow records in the Baltimore area, Maryland.
records for several small streams in each basin. These curves indicate that the daily flow per square mile, equaled or exceeded 95 percent of the time, is highest for the Coastal Plain. In the four basins in the Piedmont province, yield per square mile decreases progressively towards the south. (See table on p. F8.)

F8 WATER RESOURCES OF INDUSTRIAL AREAS
0.090.080.07
2 5 10 20 30 40 50 60 70 80 90 95 98 99 PERCENT OF TIME DAILY DISCHARGE EQUALED OR EXCEEDED THAT SHOWN
FIGUBE 3. Duration curves of daily flow in five basins in the Baltimore area, Maryland, 1896-1952.
Median duration of daily flow from major basins
[Adjusted to 57-year period 1896-1952 on basis of long-term streamflow records in adjacent areas]
Basin
Representative gaged discharge (mgd per sq mi) from major I asins equaled or exceeded the percent of time indicated
Susquehanna River.
Gunpowder River - Patapsco River. _ Patuxent River . _ Coastal Plain
1
4.624.56 4.99 5.87
4.02
2
3.393.27 3.43 4.06
3.00
5
2.222.10 2.13 2.36
2.01
10
1.601.50 1.44 1.52
1 do
20
1.121.06 .964 .962
1.12
30
0 904.850 .743 .694
QOQ
50
0.656.615 .516 .434
70
0.485.460 .358 .289
.541
80
0.411.390 .286.227
463
90
0.335.312 .210 .160
38R
95
1.286.263 .163 .122
.346
98
0.243.218 .123 .0904
307
99
0.220.195 .104 .0754
.284

BALTIMORE AREA, MARYLAND F9
The preparation and use of flow-duration curves is described by Searcy (1959). It is evident that a duration curve fails to disclose whether the lowest period of record occurred as successive days in one rare drought year or as isolated days over a succession of yea rs. This serious shortcoming, or lack of information on the chronological se quence of flow, is overcome by low-flow frequency curves.
Low-flow frequency curves treat consecutive days as a period and show the average intervals between the recurrence ef annual low flows of selected-length periods. (See fig. 10 for an example of a low-flow frequency curve.) The use of an average flow for a given period pre supposes enough storage to regulate the flow during the period.
The need for storage becomes apparent when the natural flow of a stream cannot meet demands. The amount of storage that would have been required to meet a given demand during a particular period may be determined by a mass-curve analysis (Rippl, 188F). It is important to know the frequency that a given amount of storage will be needed, because the cost of providing the needed storage then can be weighed against the benefits.
The analyses of storage requirements in this report are indicated by storage-required frequency-mass curves and diagrams which differ from the one described by Eippl in that they represent the flow for various recurrence intervals rather than particular drouglt period. These diagrams generally do not deal with any particular drought, such as Eippl's do, but instead indicate the frequency at which a de ficiency might recur, as well as the maximum allowable draft rates that are possible under variable conditions of storage and variable probabilities of recurrence. (See fig. 18 for an example of a storage- required frequency curve.) Losses due to evaporation or seepage are neglected. The amount of storage required should be increased by the amount of the losses.
WATER RESOURCES OF THE PIEDMONT SUBAREA
The sources of water in the Piedmont subarea are streams, T^ells, and springs. Man-made reservoirs regulate surface flow and supply Balti more City. Although constituting about two-thirds of the ar~sa of this report, the Piedmont subarea contains only about half the population and much less than half of the industries. The subarea is largely rural and suburban.
In 1950 the population of Harford, Baltimore, and Howard Coun ties, and Baltimore City was 1,294,000, of which T00,000 to 800,000 live in the Piedmont subarea. About TO percent of the land in Balti more and Harford Counties is used for agriculture. The most im portant crops are corn, wheat, and vegetables. Dairy products and

F10 WATER RESOURCES OF INDUSTRIAL AREAS
poultry are also produced in substantial quantities. Industry in the subarea is light and diversified, consisting of distilleries, metal fabri cating plants, food processing, dye works, and several limestone, gabbro, marble, and flagstone quarries.
The principal uses of water in the area are for the public-supply of Baltimore City and its suburbs, for rural domestic supply, for hydro electric power at Conowingo Dam, for air conditioning of industrial plants, and to a small extent for irrigation. The use of rmall streams for irrigation in the low-water season has increased, especially during critical droughts. Most of this water is consumed; therefore, this use depletes the supply appreciably, although the quantity of water is small in comparison to the amount withdrawn by industry.
CRYSTALLINE BOCKS
Ground water in the Piedmont subarea occurs chiefly under water- table conditions in pores and other openings in the weathered mantle, and in fractures in the hard, dense rock beneath the weathered zone.
The oldest rock in the Piedmont subarea, the Baltimore gneiss of Precambrian age, crops out along a belt 2 to 3 miles wide in central and southwest Baltimore City, near Granite in western Baltimore county, in the Towson-Ruxton area north of Baltimore, and in an ex tensive area near Phoenix and Monkton in north-central Baltimore County. (See pi. 2.) Gabbro and pyroxenite underlie much of the area between downtown Baltimore and the towns of Ilchester and Elllcott City along the Patapsco River. The Cockeysville marble of early Paleozoic(?) age crops out in an east-west belt in the Green - spring and Worthington valleys and more extensively in the Cockeys- ville-Texas area, where it is quarried at many places. Approximately one-third of the Piedmont subarea is underlain by the Wissahickon formation of early Paleozoic(?) age throughout an extensive area west of Chestnut Ridge, extending to the towns of Reisterstown, Arcadia, Parkton, and Gorsuch Mills.
The structure of the crystalline rocks of the Baltimore area is com plex. The Baltimore gneiss is the central core in at least three dome like structural features, one near Granite, another north of Pikesville, and the third in the Glencoe-Phoenix area. The surrounding younger metamorphic rocks dip steeply away from the central core of the domes. Throughout much of the area the highly metamorphosed schist, gneiss, and marble have dips ranging from 45° to 90° from the horizontal. Joint systems in the crystalline rocks also dip steeply and at least three of the systems trend at sharp angles to one another. The complex age relation of the igneous and metamorphic rocks in the Baltimore area are shown in figure 4.

BALTIMORE AREA, MARYLAND Fll
LITHOLOGY
Schist.quartzite and gneiss
Mica gneiss and schist on southeast;) flbite gneiss and schist on northeastl
Coarse white dolomite marble
vOuartzite, gneiss, N. and schist
Bio*fte gneiss, including horn- t fende gneiss and I anded injection pneiss
EXPLANATION
(IGNEOUS ROCKS-NUMBERED IN ASCENDING ORDER FROM OLDEST TC YOUNGEST) 6. Diabase (Triassic)5. Woodstock granite and associated pegmatites 4. Gunpowder granite3. Gabbro and serpentine (peridotite and pyroxenite) 2. Port Deposit gneiss (granodiorite) and Relay
quartz diorite of Knopf and Jonas (1929) 1. Hartley augen gneiss
FIGURE 4. Columnar section showing complex age relationship of metamorphic and igr^xras rocks. FromKnopf and Jonas (1929).
The total thickness of the metamorphic rocks in the area is not known, but it must be from more than 5,000 to 10,000 feet, if allowance is made for the repetition of beds due to repeated folding and crum pling. According to Knopf and Jonas (1929, p. 104), the total known thickness of the Wissahickon, Cockeysville, and Setters formations is 3,100 feet.
The crystalline rocks may be divided into a lower and an upper zone with respect to their physical character and permeability. The lower zone is the hard fresh rock commonly seen in quarries, and the upper zone is the weathered or rotted rock, which grades upward into the true soil zone. Most of the ground water available to wells in the Piedmont is stored in the weathered more permeable upper zone, al though considerable ground water is stored in small crevices or frac tures in the underlying hard rock.
690-492 O 63 2

F12 WATER RESOURCES OF INDUSTRIAL AREAS
The average thickness of the weathered zone in the crystalline rocks is from 25 to 50 feet, but in some places the thickness may exceed 150 feet. The average depth of 809 wells in rock is 117 feet, but depths range from a few to nearly 1,800 feet. Dingman and Fergu^on (1956, table 7, p. 34) have shown that in Baltimore and Harforc1 Counties the average yield of water from wells in rock increases slightly with increasing depth to about 250 feet. Below this depth the- rocks be come harder and denser, and crevices and parting planes tend to dis appear. Although the average yield of wells more than 250 feet deep is a little more than that of shallower wells, the yield per foot of hole is much less than that of the shallower wells. Nearly 70 percent of all wells in rock are completed at depths ranging from 50 to 150 feet. The average yield of these wells is 0.1 gpm per ft of well.
The yield of crystalline rock wells is governed in part by the topo graphic position of the well. Dingman and Ferguson (1956, p. 36) have shown that the best wells are in draws and valleys, and the poor est wells are on hilltops. The average yield of 109 valley wells is about 22 gpm, whereas the average yield of 300 hilltop wells is about 8 gpm, only slightly more than one-third that of the valley wells.
Marble is the best water-bearing rock in the Piedmont subarea. The yield of 55 wells ranges from less than 1 to 80 gpm and averages 19 gpm. The specific capacities average 1.0 gpm per ft of drawdown and range from less than 0.1 to as much as 13.3 gpm. (See p. F99 for definitions of terms used.) The coefficient of permeability deter mined from one aquifer test at Hydes is 325 gpd (gallonr per day) per sq ft, and coefficients of transmissibility for two tests at Hydes and Harrisonville, were 3,000 and 35,000 gpd per ft. The coefficient of storage has not been measured.
The next most productive rock aquifers are granite, grr.nodiorite, and quartzite. The yields of 129 wells in these rocks range from 1 to 135 gpm and average 13 gpm. Specific capacities of 34 v^lls range from less than 0.1 to 6.0 and average 0.5 gpm per ft of drawdown. Coefficients of transmissibility of the weathered granite range from 2,600 to 5,100 gpd per ft. A coefficient of storage of 0.05 wa^ obtained in a test near Simpsonville; it probably indicates semiartesian condi tions. A coefficient of transmissibility of 3,400 gpd per ft was ob tained in a test of the quartzite near Butler.
The yields of 584 wells ending in the schist and gneiss range from less than 1 to 200 gpm and average 11 gpm. The depths of the wells range from 18 to 735 feet and average about 120 feet. Specific capaci ties of 101 schist wells average 0.7 gpm per ft of drawdown, and 49 gneiss wells average 0.4 gpm per ft drawdown.
Coefficients of permeability of the schist range from 50 to 130 gpd per sq ft. Coefficients of transmissibility from two aquifer t?.sts of the

BALTIMORE AREA, MARYLAND F13
schist were 3,000 to 10,000 gpd per ft. Coefficients of trar«missibility of the gneiss range from 1,000 to 13,000 gpd. per foot based on three aquifer tests. Field coefficients of permeability of the gneiss near Shawan range from 115 to 265 gpd per sq ft. These figures are repre sentative chiefly of the shallow weathered part of the rock.
Gabbro and pyroxenite are the least productive of the crystalline rocks. The yields of 151 wells ending in these rocks rang*1, from 1 to 80 gpm and average 10 gpm. Specific capacities range from 0.1 to 2.8 and average 0.7 gpm per ft of drawdown. Coefficients of transmissi- bility and storage of the gabbro and pyroxenite have not been deter mined. The water-bearing properties of the crystalline rocks in the Piedmont are summarized in the table on page F14.
PROBLEMS OF WELL AND AQUIFER HYDRAULICS
The safe yield of the aquifers and reliable guides to veil spacing were not computed, because the water-bearing zones of the crystalline rocks are irregular in shape and erratic in distribution. 1 qujfer tests in the crystalline rocks have shown that the yield of a well may decline substantially before the effective cone of depression has spread more than a few hundred feet. If wells are heavily pumped during long periods of no recharge, yields may decrease sharp] , although the water level in wells a few thousand feet away may remain unaf fected. Overdrafts might be expected in some places were large quan tities of water are pumped. Overdrafts however, are unknown at the present time.
WATER-LEVEL, FLUCTUATIONS
The water level in wells seldom remains constant but fluctuates continually in response to changes in the relative rates of recharge and discharge. In the Piedmont subarea, the principal changes in water levels are caused by replenishment from precipitation, discharge by springs and seeps, evapotranspiration, and pumping.
Periodic measurements of water levels in the area have been made since 1944. The fluctuations in water level in two wells are shown in figure 5. These wells are 48 and 114 feet deep and end in schist and gabbro, respectively. The water level in the 48-foot well near Slacks Corner, in Howard County, fluctuated 15 feet during the 9-year period 1947-55. The fluctuation in any single year was substantially less than that during the period of record. Fluctuation of the 114-foot well was 7^ feet during the 12-year period 1944^55.
Precipitation is more variable than other factors affecting water level flucuation; therefore, water levels decline during dry years and rise during wet years (fig. 6). The net change in the ground-water level in the area as a whole was only 0.09 foot during the 12 years of record. An additional slight downward trend in ground-water

F14 WATER RESOURCES OF INDUSTRIAL AREAS
llll
II
oaH
o"i>r
CO®'
3 SSs 5£ J3 ?^^-PPQ a
2 I
S §
Nil! al'»8§c*:lfiii|il|&1|S|3
10,4.
1 ii
5 16 s
JfiIf!^l-sfl^S
111Icao-
*i!«s5 ifi«")<1E-'

24
0_j o:4
5L
U 5:50
55
BA
LTIM
OR
E,
MA
RY
LAN
D^
RO
LAN
D
PA
RK
D
ISTR
ICT
Wel
l 4N
2W
-9 (
Bal
timor
e C
ount
ry C
lub)
D
epth
114
fee
t |
Form
atio
n P
reca
mbrian g
abbr
d"
^V
^w
/
-^
/N.iv
/
N\f~
^/
- 1 /V
^X
h^ ^i-
7 1
NS
LAC
KS
C
OR
NE
R,
HO
WA
RD
C
OU
NTY
, M
AR
YLA
ND
WellH
ow
-Bdl
(S.D
. S
lack
)
Form
atio
n W
issa
hick
on
~ v^
A, V
/- i
i 3
mon
th m
ovin
g av
erag
e pr
ecip
itatio
n
:i1944
1945
1946
1947
1948
1949
1950
1951
1952
1953
1954
1955
FIG
URE
5.
Wat
er le
vel f
luct
uatio
n in
two
wel
ls a
nd m
ovin
g av
erag
e pr
ecip
itatio
n in
the
Pie
dmon
t sub
area
.

20 30 40 50 60 ANNUAL PRECIPITATION AT BALTIMORE, IN INCHEr
FIGURE 6. Relation between annual net change in water levels and annual precipitation at Baltimore, Md.
levels may be expected if precipitation in coming years is normal or below normal, because the average precipitation for the 12 years was 45.2 inches, or 2.6 inches above the 84-year average. If precipitation is only 30 inches per year, the net annual decline in the water table will be about 3.1 feet (fig. 6). If precipitation is 55 inches per year (13 inches above normal), the net annual rise in the water tabte will be about 3.0 feet.

BALTIMORE AREA, MARYLAND F17
CHEMICAL QUAJUTY OF GROUND WATER
The chemical character of ground water is largely det-wmined by the characteristics of the rock that the water comes in contact with and the length of contact. The permeable weathered rock mf.ntle affects the chemical character of the water more than the unweat hered rock, because most of the circulation is through the weathered picks.
The chemical composition of the crystalline rocks in th*. Piedmont subarea is not uniform. The quartz veins are composed principally of silica, the marble is chiefly calcium carbonate, and the granite, gneiss, and schist include both silica and other minerals of simple and complex composition. Hence the chemical character of the ground water, too, is not uniform. The dissolved-solids content in 51 samples from wells in the crystalline rocks in Baltimore and Harfo~d Counties ranged from 21 to 305 ppm and averaged 105 ppm (Dingm^u and Fer- guson, 1956, p. 62). The lowest concentrations were in samples from schist and quartzite, and the highest were in samples frorr serpentine and marble.
Hardness, as indicated by 60 analyses, ranged from 6 to 246 ppm as CaCO3 and averaged 59 ppm. Hard water is commonly associated with deposits of serpentine and marble. The average hardness of 7 samples from the marble was 133 ppm; 3 samples from the serpentine averaged 201 ppm.
The iron content of 60 samples ranged from 0.0 to 3.5 f^m, and 30 percent of the samples contained 0.3 ppm or more of iron.
The nitrate content of 58 samples ranged from 0.02 to 76 ppm and averaged 5.1 ppm (Dingman and Ferguson, 1956, p. 55-56). Probably the high nitrate content of some samples was caused by leakage of water from the surface downward alongside the well casing's.
Water from the crystalline rocks is generally several times more mineralized than that from the sedimentary rocks of the Coastal Plain because many crystalline rocks contain more cacium carbonate. Silica is also prominent in water from the crystalline rocks, generally in con centrations of about 40 ppm. Analyses of 12 samples of water from the crystalline rocks are given in the upper table on page F18.
TEMPERATURE OF GROUND WATER
Ground water is in large demand for industrial cooling and air con ditioning, because its temperature seldom fluctuates more than a few degrees during the year. In general, temperatures of ground-water at shallow depths average about the same as the mean annual air temper ature. At depths below a few hundred feet, temperature^- commonly rise at a rate dependent on the temperature gradient of tH earth at a given place. This gradient is about 1° F. for each 50 to 100 feet of depth.

F18 WATER RESOURCES OF INDUSTRIAL AREAS
Chemical analysis of water from wells in Precambrian crystalline rocks
[Analytical results in parts per million except as indicated]
Location
West Elkridge .
Catonsville ___Southwest
North Baltimore. Do. - .-. -
Northwest
East Baltimore _
Well depth (feet)
165 290 166 133 248 i60 157
291 185 175
85 80
Location
Edgewood _____
Woodstock ..........Towson.. ...........Catonsville _____Southwest
North Baltimore. . . . Do.. ............
Northwest Balti more--. ...........
East Baltimore _ ..
Date of collection
Apr. 26,1944 Aug. 9,1944 Mar. 19, 1954 July 8, 1955 Mar. 17, 1954 July 18,1955 Mar. 18, 1955
Mar. 18, 1954 Mar. 18, 1954 Feb. 10,1954
Aug. 3,1954 Aug. 6, 1954
Sul- fate
(S0 4)
20 6 1.0 3.8
33 37 12
30 12
155
Ohio- ride (Cl)
5 4 2.5 3.0 7.0
14 17
15 5.5 8.0
Fluo- ride (F)
0
0.1
.2
.2
.1
.1
Tem pera ture (°F)
47
56
56
57 56
Ni trate
(NOs)
0.10.1 .3.1
48.2
.1
.4 1.1
Silica (SiOj)
43
24
42
45 42 49
Total iron (Fe)
1.0A n.68
.04
.00
.35
1.3 1.5 1.0
.13
.17
Residue of dis solved
solids on evapora tion at 180° C
1140
U42
219
>250 «157«398
Cal cium (Ca)
20
22
36
40 19 63
Mag nesium (Mg)
7.2
8.2
15
7.8 8.0
32
Sodium (Na)
5.9 K"»
12
18 5.9 8.1
Hardness as CaCOs
Calcium, magne sium
105 123
81 50 89 88
152
13382
290
82 60
Noncar- bonate
0 0
22 39 3
30
155
27 0
Per cent sod ium
9
13
9
16 17 10
Po tas
sium (K)
1.9
3.5
3.9
3.34.2 .5
Bicar bonate (HCO)s
112 144 114 86 81 60
182
159 105 165
67 156
Specie con duct ance
(micro- mhosat 26° 0)
2fo 2fo 180 1*6 2T5 320 341
344 194 5252r-i331
PH
8.5 8.2 7.3 6.7 7.0 6.6 7.5
7.2 7.0 7.4
6.6 8.1
Car bon- ate
(COa)
7.9 12 0 0 0 0 0
0 0 0
0 0
Color
25 5 5 2 7
28
16
1 Lithium (Li), 0.3 ppm; manganese (Mn), 0.05 ppm.* Lithium (Li), 0.5 ppm; manganese (Mn), 0.02 ppm.3 Lithium (Li), 0.7 ppm; manganese (Mn), 0.10 ppm.4 Lithium (Li), 0.5 ppm; manganese (Mn), 0.10 ppm. Aluminum (Al), 0.2 ppm; copper (Cu), 0.3 ppm; zinc (Zn), 0.000 ppm; lithium (Li), 0.2 ppm; phosphate
(POO 0.0 ppm; manganese 0.10 ppm.
Temperature measurement of ground water in the Piedmont ranged from 49.5° to 57° F and averaged 54° F. (See following table.) The profile of water temperatures in four wells in the Maryland Piedmont are shown in figure 7. All the wells contained a thin laye^ of warm
Temperature of ground water in the Piedmont subarea
Area
Howard and Montgomery Counties (after Dingman and Meyer, 1954) __ ________________________
Baltimore and Harford Counties (after Dingman and Fergu- son, 1856). ............ .................................!...
Number of meas
ure ments
20
19
Depth of wells (feet)
40-203
60-440
Temperature (°F)
Range
51.5-55.5
49.5-57
Average
54
54

BALTIMORE AREA, MARYLAND F19
54.0
TEMPERATURE, IN DEGREES FAHRENHEIT Colder Warmer -
55.0 56.0 54.0 55.0 56.0 57.0 53.0 54.0 55.0 54.0 55.0 56.0
Water level Water level
240 J Location: Granite, Md. Date logged: Nov. 9,1956
Formation: granodiorite
Jacksonville, Md. Nov. 9, 1956,
schist
Perryville, Md. Oct. 16, 1956, metadacite
IIchester, Md.S>ot. 14,1956,
gabbro
FIGURE 7. Profile of water temperatures in four wells in the Maryland Piedmont subarea.
water near the water table. Three profiles show a geothermal gradient of approximately 1° F per 200 feet below a depth of 100 feet. This is only half the commonly observed gradient and proba^y is due to the relatively low thermal conductivity of the crystalline rocks.
USE OF GROUND WATER
The uses of ground water in the Piedmont subarea may be divided into three main categories; industrial and commercial, rural and sub urban domestic, and irrigation. About 0.7 mgd is used by industry and commerce. About two-thirds of this quantity (0.45 mgd) is used by two large industries, and the remaining one-third by nine others.
By far the largest use of ground water is for domestic supply. On the basis of the population in 1955, an estimated 90,000 people in the Piedmont subarea depend on wells and springs for water. They with draw about 4.5 mgd. Irrigation use amounts to about 0.3 mgd during the irrigation season, which lasts 50 to 100 days in the sumner. There fore, the total withdrawal of ground water in the Piedmont subarea is about 5.3 mgd.

F20 WATER RESOURCES OF INDUSTRIAL AREAS
SUSQUEHANNA BIVEB
The Susquehanna River, the largest river in the area, has a drainage area of 27,570 square miles, of which about 1 percent (2£2 square miles) is in Maryland. It rises in New York and winds tortuously through Pennsylvania and into Maryland, where it has a wide slightly winding channel and several small tributaries. Gradients of the main river and the tributaries are moderately high; the main river drops about 1,100 feet in. its 444-mile length.
DISCHARGE
Records of flow at Marietta (drainage area, 25,990 square miles) are published by the U.S. Geological Survey. The minimum c'aily flow of record at this gaging station is 892 mgd, or 1,380 cfs (cubb feet per second). Discharges less than 8,000 cfs are regulated by the York Haven powerplant. Safe Harbor, Holtwood, and Conowingo power- plants are downstream from the gaging station.
CHEMICAL QUALITY OF "WATER
Water from the Susquehanna River in nontidal reaches appears to be chemically suitable for most uses; however, water from lo^ flows is sometimes hard. (See following table.)
Chemical ana&yses, in parts per million, of water from the Susequehc-nna River[Public supply for Havre de Grace, raw water; analyses by Maryland State Department of Health, except
as noted]
Date of collection
Silica. . _ .-_--..... Aluminum (Al)_. _____________
Calcium (Ca) _______________Magnesium (Mg) _____________Sodium (Na) and potassium (K) ..........Bicarbonate (HCOV) ___________Sulfate (SOO .............................Chloride (Cl) ____________ . .....Fluoride(F) __ ........ _ .... __ ......Nitrate (NOs)-.. _ ... __ ... _ ... .....Dissolved solids.. ........................Hardness as CaCOs ____________Noncarbonate hardness as CaCOs-- ......pH...... . . .-.-.-. .-. ....-
At Conowingo Dam
Jan. 17, 1952
0.6
5.8
.211456
6.7
Feb. 4, 1954
8.1 1.3.6
16 3.3
37
116 53
7.1
Nov. 21, 1957 »
0.0 42 13 18 69
116 13
2.8
158 102
7.5
At Havre de Grace
Jan. 29, 1953
20 2.2 .4
5.6 .3
27 6.8 .2.5
132 15
6.8
Apr. 25, 195i
0.2
8.7
6.1 10>
7.3
Feb. 20, 1957
0.4
7.8
.3 100
6.8
i At Shores Landing, one-quarter mile below dam; specific conductance, 391 micromhos; color, 0 units analysis by U.S. Geol. Survey.
At Havre de Grace, where the Susquehanna River is used as a source of public water supply, the chloride content ranged from 4.4 to 133 ppm from November 1946 to February 1957. The maximum ob served chloride, 133 ppm, occurred on August 13, 1955, at the end of a prolonged drought.

BALTIMORE AREA, MARYLAND F21
WATER STORAGE
Conowingo Reservoir is used to generate hydroelectric power. It will also serve as a source of water for Baltimore City after 1965 through a pipeline which will divert 220 mgd, enough to supply Balti more until the year 2000. The proposed diversion is only about one- fourth the minimum daily flow of 892 mgd (1,380 cfs). Details per tinent to Conowingo Reservoir are (Thomas and Harbeck, 1956):
Location:Latitude__________________________________________ 39°40'Longitude._________________________________ 76°10'
Date of completion______-_____________-__-____-_____________-_-__ 1928Drainage area_____________________________________________sq mi__ 27, 098
/--__________.-.____.-_____-__-_____________-__-_do-_ 13.4Surface areaj _______________________________________acres__ 8,563Volume of storage:
l__ 45, 290
Total.______-______--.___._________-___-_-__-_do-_ 10% 360Storage ratio 2_________-_--___-_____-___-_-__--_-___-------_yr__ 0. 05Elevation of spillway crest _________________ _ft above mean sea IcveL _ 108. 5Average pond level___________________________________________do__ 104 5
i Usable rapacity at normal operating conditions is 23,050 million gal. »See "Definitions of terms used," pages F99-F101.
WATER USE
The chief withdrawal use of water from the Susqueharna River in Maryland at the time of this investigation (1957) was approximately 0.4 mgd for the public water supply of the town of Havre de Grace. The water is taken from a tidal reach of the stream at tl ^ town and is treated. The treatment plant was constructed in 1955 and has a rated capacity of 2 mgd.
DEER CREEK
Deer Creek, a tributary of the Susquehanna River, drains an area of 170.7 square miles, of which about 25 square miles is in Pennsyl vania and the remainder in Maryland. The topography of the basin is undulating to rolling, and the altitude of the highest point is about 1,050 feet, north of Stewartstown, Pa.
DISCHARGE
Streamflow records have been collected at Rocks (drrinage area, 94.4 square miles) since October 1926. During the period 1927-55, the average flow was 80.1 mgd (124 cfs) or 0.846 mgd per square mile. The lowest.daily flow was 8.4 mgd (13 cfs) on August 2,1931, and the lowest average flow for a calendar month was 19.5 mgd (30.2 cfs) in October 1931 (Fig. 8). Flow at the gaging station was at least

F22 WATER RESOURCES OF INDUSTRIAL AREAS
4UO
O
LjJ OUUQ.
CO
O
o
0 200
S zSCHARGE, 1
o o
o
n
EXPLANATION
Above average range
D OO 00
Below average range FT?,
Numbers above and below : '/xcolumns indicate year of /;/;occurrence ///
CM '^
IO00
,_,ID If)CM ID
CM
Maximum
Average
Minimum
124
_00
ni-^00
If)
^I00
^IIf)
ii i n
%'%
CM
S/J'//'// /
^
'^
00
If)
^
%///// y
^'&
CM If)
''''/
7 ^//' '
%
&
00
;g'//.'//10 //.
ID
V.ITT00
t
^%
^
%%
0
00
%%'A
Oct. Nov. Dec. Jan. Feb. Mar. Apr. May June July Aug. Sept.
FIGURE 8. Monthly flow of Deer Creek at Rocks, Md., 1927-55. ,
0.29 mgd per square mile, or 27.0 mgd, for 50 percent of the time (Fig. 9 and table 1).
w 4.0
3 3.0
0 2.0
iuj 1.0 z< O-8
[jO» 0.6 0<" 0.5
<g] 0.4 ID. oo 0.3Q
> 0.2_i
o
n i
"X.>^
Sy
>v
^
EXE
V
X
imple:
\
A flow o may be or excee
^
F abou expec ded9
^^
tO.2 ted tc 5 per
^~ x
9 m§ be
cent
^
Id pe squa of tr
N
***s
r sq ed e tirr
Dte: Drainage area is 94.4 sq mi. Flow is adjusted to fie 57-ye period (1896-1952)
"Nfc.^^ "s.
mi
le
^ ^^
^>^
-^^^>
^ -^
ar
12 5 10 20 30 40 50 60 70 80 90 9E, 98 99 PERCENT OF TIME DISCHARGE EQUALED OR EXCEEDED THAT S'<OWN
FIGURE 9. Duration curve of daily flow, Deer Creek at Rocks, Md.
LOW-FLOW FREQUENCY
The average flow for 30 consecutive days at Eocks may be less than 0.25 mgd per sq mi at average 10-year intervals, or there is 1 chance in 10 that the flow will be less than 0.25 mgd per sq mi in a particular

BALTIMORE AREA, MARYLAND F23
year. A flow of 0.25 mgd per sq mi amounts to 23.8 mgd at Rocks. Frequency of low flow of Deer Creek is given in figure 10 r.nd table 2.
i.o0.8
0.5
d s 0.4
§0.3 O
0.2
0.1
Note: Drainage area is 94.4 sq mi. J^ Flow is adjusted to the 57-year period (1896-1952)
Example: The annual minimum 30-day flow will be equal to or less than 0.25 mgd per sq mi at aver
age intervals of 10 years, or there is one chance in ten that the minimum 30-day flow in any year will be less than 0.25 mgd per sq mi.
12-month
9-month
183-day : 120-day : 60-day : 30-day : 15-day 7-day
2 456 8 10
RECURRENCE INTERVAL, IN YEARS
20 30 40 50
FIGURE 10. Low-flow frequency curves, Deer Creek at Rocks, Md.
CHEMICAL QUALITY OF WATER
The water of Deer Creek at Rocks is of excellent chemical quality, as it is low in dissolved solids, hardness, and other principal constitu ents. No individual constituent is dominant. (See fig. 11 and table 3.) As with much of the other water in the area having Hw concen trations of dissolved solids, silica, calcium, and bicarbonate are slightly in excess of other constituents and dissolved iron is low.
Requardt and others (1953) reported that daily samples taken at the Chapel Hill water-plant intake (downstream from the Deer Creek gaging station) during the period June 1951 to April 1952 averaged as follows: Turbidity, 108 ppm; alkalinity as CaCO3, 15 p^m; hard ness as CaCO3,21 ppm; and pH, 7.0
If the alkalinity reported as CaCO3 is recalculated to bicarbonate (by multiplying by 1.22), data for the latter three items agree well with the results reported in table 3. Turbidity is not reported in table 3.
FLOODS
The maximum flood of record on Deer Creek occurred August 23, 1933. The maximum flow on this day was about 13,600 cf s The crest gage height from flood marks was 17.7 feet (268.1 feet r.bove mean sea level). A major flood also occurred on November 17, 1926, when the crest gage height was 15.45 feet (265.8 feet above mean sea level) and the flow was 9,080 cfs. A flood of at least 265.3 feet above mean sea level will occur at the gaging station at average intervals of 10

F24 WATER RESOURCES OF INDUSTRIAL AREAS
I -f*«"i» 5&i £?
l!
oq
e 3£ 3"^ o
ootd
i
00 10
o ^ -H-
S S
s si^ 88Q U3
tO 10 T»l
M « 00
*'. «-'18 O i-l
« «
wfl
. oo'
SS8
odcjej
o
etetet
eeee'ej
w lice
1006 «5
Sl«so*O^s
o
TA
BL
E 2
. M
agni
tude
and
freq
uenc
y of
low
str
eam
flow
at
gagi
ng s
tati
ons
in t
he B
alti
mor
e ar
ea,
Mary
land
[Adj
uste
d to
57-
year
per
iod
1896
-195
2 on
bas
is o
f lon
g-te
rm st
ream
flow
reco
rds
in a
djac
ent a
reas
]
No.
on
pi. 1
1....... -
* .
..
5
6..
. ..
. ... ..
. ... ..
.
7..
...
... .
.. ..
. ....
12...... _
....
....
...
14.... .... .
15...... _
_
16....
Gag
ing
stat
ion
Dee
r C
reek
at
Roc
ks _
__
__
__
__
__
___
Wes
tern
Run
at
Wes
tern
Run
.. ______
_
Nor
th B
ranc
h Pa
taps
co R
iver
at
Ced
arhu
rst..
Nor
th B
ranc
h Pa
taps
co R
iver
nea
r R
eist
ers-
to
wn.
Nor
th B
ranc
h Pa
taps
co R
iver
nea
r M
arri
otts
- vi
lle.i
Dra
inag
e ar
ea
(sq.
mi.)
94.4
52.9
2.27
59.8
36.1
56.6
91.0
165
Rec
ur
renc
e in
terv
al
(yea
rs) 2 5 10
25
50
2 5 10
25
50 2 5 10
25
50 2 5 10
25
50 2 5 10
25
50 2 5 10
25
50 2 5 10
25
50 2 5 10
25
50
Dis
char
ge (
mgd
) be
low
whi
ch fl
ow re
mai
ned
cont
inuo
us fo
r len
gth
of m
inim
um
peri
od in
dica
ted
7-da
y
30.1
23
.5
20.6
17
.5
15.5
16
.7
12.3
10
.3
8.41
7.
35
.533
.3
72
.302
.2
34
.194
16
.7
11.8
9.
69
7.71
6.
46
10.3
6.
97
5.56
4.
26
3.55
12
.3
8.49
6.
68
5.07
4.
14
20.0
13
.6
10.7
8.
14
6.72
36
.3
24.6
19
.5
14.9
12
.2
15-d
ay
32.0
24
.9
21.8
18
.3
16.2
18
.0
13.2
11
.0
8.94
7.
78
.586
.4
11
.329
.2
52
.209
18
.3
13.0
10
.6
8.31
7.
00
11.5
7.
76
6.10
4.
62
3.86
14
.0
9.45
7.
41
5.59
4.
54
22.5
15
.2
12.0
8.
09
7.30
40
.8
27.6
21
.8
16.4
13
.4
30-d
ay
35.2
27
.3
23.8
20
.0
17.5
19
.9
14.7
12
.3
10.0
8.
68
.665
.4
65
.375
.2
91
.243
20
.5
14.7
12
.0
9.51
8.
01
13.1
8.
99
7.11
5.
42
4.51
15
.8
10.8
8.
55
6.51
5.
33
25.7
17
.3
13.7
10
.4
3.53
46
.5
31.4
24
.8
18.6
15
.4
60-d
ay
41.4
31
.5
27.4
22
.9
20.2
23
.7
17.5
14
.6
11.8
10
.1
.795
.5
63
.458
.3
59
.297
24
.4
17.5
14
.3
11.4
9.
63
15.9
11
.0
8.84
6.
71
5.56
19
.2
13.1
10
.4
7.92
6.
51
30.9
21
.1
16.7
12
.8
10.5
55
.9
38.3
30
.4
23.3
19
.0
120-
day
49.4
36
.8
31.0
25
.5
22.6
28
.1
20.7
17
.1
13.9
11
.8
.938
.6
79
.561
.4
45
.375
29
.1
21.1
17
.5
14.0
12
.0
19.0
13
.4
10.7
8.
27
6.97
23
.3
16.4
13
.2
10.3
8.
66
37.5
26
.4
21.3
16
.8
14.0
68
.0
47.9
38
.8
30.0
25
.2
183-
day
55.6
41
.4
34.9
28
.6
24.6
31
.5
23.3
19
.4
15.6
13
.3
1.06
.7
76
.654
.5
18
.438
32
.5
23.9
20
.0
16.2
13
.9
21.5
15
.4
12.4
9.
67
8.19
26
.4
18.7
15
.3
12.2
10
.3
42.5
30
.6
24.8
Id
.i5
16.7
77
.1
55.4
45
.0
35.5
30
.2
9-m
onth
71.1
53
.0
43.9
34
.3
29.1
39
.0
29.5
24
.7
19.8
16
.7
1.31
.9
83
.826
.6
72
.581
40
.1
30.2
25
:4
20.7
17
.9
26.7
19
.9
16.2
12
.9
10.9
33
.3
24.5
20
.2
16.4
14
.1
53.6
39
.4
32.6
:3
.4
22.6
97
.4
71.4
69
.1
47.9
40
.8
12-m
onth
87.9
65
.9
54.9
43
.3
36.2
48
.1
36.6
31
.0
24.9
21
.3
1.62
1.
23
1.04
.8
60
.742
49
.8
37.9
32
.2
26.4
23
.0
33.0
24
.8
20.7
16
.7
14.4
42
.6
31.3
26
.2
21.2
18
.4
68.5
50
.3
42.1
J4
.1
29.7
12
4 91.2
76
.2
62.0
54
.0Be
e fo
otno
te a
t end
of t
able
.

TAB
LE 2
. M
agni
tude
and
freq
uenc
y of
low
str
eam
flow
at
gagi
ng s
tati
ons
in t
he B
alti
mor
e ar
ea,
Ma
ryla
nd
Con
tinu
ed
[Adj
uste
d to
57-
year
per
iod
1896
-195
2 on
basis
of l
ong-
term
stre
amflo
w re
cord
s In
adja
cent
are
as]
No.
on
pi. 1
17...
_ ..
. __
__
....
18....... .
....
....
....
20.. _
__
__
__
__
_
21....... _
. _ ..
....
22..
....
...........
23....................
26... _
.. _
____ ..
.
27........ _
_ . ......
28.... .
............
Gag
ing
stat
ion
Sout
h B
ranc
h Pa
taps
co E
lver
at
Hen
ry to
n..
.
Pata
psco
Riv
er a
t H
ollo
fleld
1 ______ .
Dra
inag
e ar
ea
(sq.
ml.)
644
11.4
285 5.
1
8.5
6.92
38.0
98.4
11.6
Rec
ur
renc
e In
terv
al
(yea
rs) 2 5 10
25
50
2 5 10
25
50 2 5 10
25
50 2 5 10
25
50 2 5 10
25
50 2 5 10
25
50 2 5 10
25
50 2 5 10
25
50 2 5 10
25
50
Dis
char
ge (
mgd
) be
low
whi
ch f
low
rem
aine
d co
ntin
uous
for l
engt
h of
min
imum
pe
riod
indi
cate
d
7-da
y
9.79
5.
72
4.14
2.
88
2.25
2.
20
1.40
1.
05
.756
.6
08
61.8
42
.2
33.6
25
.4
20.9
3.
10
2.73
2.
53
2.31
2.
15
2.78
2.
03
.68
.34
.13
.57
.13
.91
.65
.50
5.70
3.
59
2.75
2.
00
1.62
14
.7
i).31
7.
11
5.19
4.
15
1.65
1.
03
.789
.5
70
.456
15-d
ay
11.4
6.
70
4.83
3.
30
2.57
2.
51
1.60
1.
20
.847
.6
71
70.4
47
.3
37.3
28
.1
22.9
3.
23
2.84
2.
62
2.40
2.
22
3.07
2.
22
1.84
1.
47
1.23
2.
75
2.25
2.
00
1.75
1.
57
6.38
4.
03
3.08
2.
24
1.78
16
.7
10.4
7.
95
5.75
4.
62
1.84
1.
15
.879
.6
35
.503
30-d
ay
13.5
8.
11
5.88
4.
01
3.10
2.
92
1.87
1.
43
1.01
.8
01
79.5
54
.2
42.8
32
.5
26.7
3.
39
2.98
2.
75
2.51
2.
33
3.37
2.
49
2.05
1.
64
1.38
2.
97
2.39
2.
13
1.86
1.
70
7.68
4.
79
3.63
2.
62
2.09
19
.9
12.4
9.
44
6.79
5.
40
2.24
1.
38
1.04
.7
51
.596
60-d
ay
17.5
10
.8
7.86
5.
36
4.01
3.
67
2.42
1.
84
1.31
1.
01
96.9
66
.1
52.7
40
.2
32.8
3.
63
3.22
2.
97
2.70
2.
51
4.04
2.
97
2.46
1.
94
1.64
3.
41
2.66
2.
35
2.04
1.
87
9.88
6.
27
4.75
3.
39
2.69
25
.6
16.2
12
.3
8.79
6.
98
2.82
1.
77
1.36
.9
69
.763
120-
day
22.6
14
.2
10.5
7.
28
5.59
4.
51
3.04
2.
36
1.71
1.
35
117 83
.2
67.0
51
.9
43.6
3.
88
3.41
3.
19
2.91
2.
71
4.70
3.
50
2.93
2.
34
1.98
3.
93
3.02
2.
65
2.31
2.
09
12.5
8.
09
6.16
4.
37
3.36
32
.4
20.9
15
.9
11.3
8.
79
3.65
2.
31
1.74
1.
23
.957
183-
day
26.4
16
.9
13.0
9.
21
7.21
5.
22
3.59
2.
83
2.11
1.
69
133 94
.9
77.2
60
.7
51.6
4.
10
3.59
3.
33
3.09
2.
89
5.24
3.
98
3.36
2.
70
2.29
4.
39
3.37
2.
93
2.51
2.
29
14.8
9.
69
7.37
5.
36
4.18
38
.3
25.1
19
.3
13.7
10
.9
4.34
2.
77
2.12
1.
54
1.22
9-m
onth
35.0
'2
3.6
18.7
13
.6
10.9
6.
71
4.78
3.
88
2.98
2.
44
168
123
102 82
.7
70.7
4.
52
3.94
3.
67
3.37
3.
21
6.37
4.
90
4.17
3.
41
2.95
5.
30
4.12
3.
50
2.97
2.
64
20.2
13
.4
10.3
7.
49
5.93
51
.6
34.4
26
.6
19.4
15
.3
6.08
3.
87
2.97
2.
15
1.71
12-m
onth
46.4
31
.8
24.9
18
.7
15.3
8.
66
6.14
4.
99
3.88
3.
27
213
158
132
107 93
.2
5.10
4.
36
4.00
3.
68
3.50
7.
69
5.95
5.
11
4.24
3.
67
6.4
5.03
4.
30
3.55
3.
12
26.5
18
.1
14.3
10
.5
8.40
68
.6
46.9
37
.0
27.3
21
.8
8.47
5.
43
4.16
3.
04
2.44
S
Prio
r to
regu
latio
n.

100
50
100
50
100
BALTIMORE AREA, MARYLAND F27
Pmey Run near Sykesville 9.11 mgd
Deer Creek at Rocks 102 mgd
TTt,BB»\ 0.1_^J1Deep Run near Patapsco
27.4 mgd
ILittle Gunpowder Fails
at Laurel Brook34 mgd
.1,J...H _0.06_ 0.1 0.1
North Branch Patapsco Rivernear Reisterstown
87.2 mgd
Severn Run near Glen B'irnie 31.1 mgd
_L^JI 0.1 1 0.2 JUJlSolid aCO O u- O
.= ~ "o -3s | §
s | a JB 2 "i8
%^ % 8IllsE s ! i
5 |
FIGURE 11. Chemical and physical characteristics of water from selected streams.
years; there is 1 chance in 10 that a flood will exceed 265.3 feet in particular year. (See fig. 12.)
269
268
267
266
265
264
263
262
261
260
?S9
XX
xX
^
/
/
/
XX
XX
xX/
3ased c n records
x"
19?7-!
x
>5
'
1.5 3 4 5 6 7 8 9 10 15 20 RECURRENCE INTERVAL, IN YEARS
30 40 50 60
FIGURE 12. Flood-stage frequency curve, Deer Creek at Rocks, Md. 690-492 O 63 3

F28 WATER RESOURCES OF INDUSTRIAL AREAS
s t,
eoH
jM
"3 g'Jf
"8
t-oo»CD
Sisi
oco»H»H
88
33
NOCD
Hrt
0 '
00
co id
010 oioi
as
co-*
IMCD
cooi
ooo oi-H
1000 #<6
£g
oo 1000 CD
88c5 "
iHt-4o-
i|
«V
s|P§
IIs near <
£
1o
OOh-'*
t-^t^t-:
S5;g:-HM-H
OOt^CD
Js^e
SK|
C*IO>Q
raoiuj
NNN
O ' '
MC»O
COCDCD
«O
00 COO -H-H
^§!S
CD-* CD
rHCJCJ
CDOOJ
cjidra
Uj 10
COIMCD
Sci2
838o ' '
CD h-t>-
oo oo oo
888o'
coco o' '
gw i
33^
ill
M
I
"30)
i11i3
*<»t^cC
ss?j
(O^N
g^
SS?
oooo oo to
N.Ho' '
OOvi-v
o -wo
S o (M
ocooi-Jr-i
« t~
eo'c4
IH>CO
«c4
a t- tc't-i
&8
oo cc oo!-
i8e' '
1->»H
c."r»
»^
^1«)V-
^
1itg
1
£
11
*H
C4
t^
S3
COrH
g
s
O
00
0
* >o
N
CO
2
a
N
CO
o e>»
«00
S
O
00
80
01
So
n
& &

BALTIMORE AREA, MARYLAND F29
-S
a 1-1
CM O tli-1
°s
3%
ss
0000 i-ii-i
0 '
100
cico
tococo
S CO CO
2Sco ooCON
co oo
10 O>
0" '
ss88o
i-l (M
0 '
'"''"I.
to
I
"3
II|1
coo
1000
8S
ss
(M
i-l i-l
0 '
OO
(M
eojj
S3
coo
^scoo
IOOO
go-o
ss8S
(M(M C5 '
oo a
i
iii
(Mat^<0
00 Cj
SS5
s"
10
oco
r5200 O
S33
i-l 00 i-i
Sc^
(M>0
co oo coceS
c> '
:s88
OrH O '
aa
i
2
1"3
1
|
IOOO
1000
10 t»
c^c^
ss
IOIO
HO
S30
I-l
eot- eoi-i
Oio
o'co
at~ NN
(MO
0'
Ood
88es '
c> '
a
33"00
^
1
|
O
|1aames Fall
**
1000
5*
§S
S^3
sff
SI
tNtNceiio
i-i i-i
oo rflO
00 «D
$z
^<00
coci
0010
ssSo c> '
oioo
S3
O(M
5!
j!
.
lill3333o >o o'co'
1111 .g.g.s.g
o to r-. oo
i Bange in flow ,8 to 1 » Bange in flow, 1.7 to » Aluminum (Al), 0.<X 4 Bange in flow, 3.1 to

F30 WATER RESOURCES OF INDUSTRIAL AREAS
The maximum flow per square mile recorded in Maryland was caused by a thundershower on a small unnamed tributary of Broad Creek at Pylesville, Harford County, on July 15, 1951. This small tributary of the Susquehanna River has a drainage area of less than 4 square miles. The maximum flow was at least 1,100 cff per sq mi. Four persons from one family were swept to their deaths while at tempting to ford the flooded highway 165.
WATER TJSE
Water is withdrawn at the Chapel Hill intake plant of the U.S. Army Aberdeen Proving Ground. Some water from Deer Creek may be used for supplemental irrigation during dry weather. The extent of this use is not known, but it is not considered large.
BUSH RIVER
Bush River is an estuary near the head of Chesapeake Bay which is fed by small streams draining about 140 square miles in Harford County.
DISCHARGE
Streamflow records are available for one tributary, Bynum Run at Bel Air, Md. The drainage area above this station is 8.8 square miles. The maximum daily flow at this station during the period of record, June 1944 through April 1951 and since July 1955, was 281 mgd (434 cfs), and the minimum daily flow was 0.39 mgd (0.6 cfs). The 6-year (1945-50) average flow was 6.66 mgd (10.3 cfs). A gaging station was operated at a point 0.5 mile upstream (drainage area. 7.7 square miles) from October 1950 to September 1955 and the records pub lished as Bynum Run near Bel Air, Md.
Winters Run, another tributary of Bush River, drains an area of about 55 square miles above Van Bibber near State Highway 7. This stream has not been gaged. It has served as a source of water for the town of Bel Air since 1954 and as a source of part of th°> water for the Army Chemical Center at Edgewood, Md. Atkissor Reservoir, iy2 miles southwest of Emmorton, stores water for th 01. Chemical Center.
CHEMICAL QUALITY OF WATER
Five partial analyses of water from the Bush River basin by the Maryland Water Pollution Control Commission indicate that the water was soft, moderately low in dissolved solids, and alkaline on the pH scale. (See following table.)

BALTIMORE AREA, MARYLAND F31
Partial chemical analyses of water from tributary streams in the Bush River basin [Analyses by Maryland Water Pollution Control Commission; results in parts per mllliOT except for pH]
Sample
1.. _ ....... _ .2................3................4................5... ____ . .....
Location
Falling Branch at Hawkins Road.. James Run at Harford Furnace. -.
Bynum Run at McPhail Road .
Dissolved solids
66 90 90
106 102
Dissolved oxygen
(Oz)
15 9.2 9.8 9.3
Alkalin ity as CaCOs
12 32 24 42 34
Hardness as CiCOs
18 44 46 56 50
PH
6.97.8 8.1 7.9 8.0
GUNPOWDER RIVERGunpowder Falls (head of Gunpowder Kiver) probably is the most
important source of fresh water in the area; it provides thr^-e-fourths of the water supply for Baltimore City. Gunpowder Falls, includ ing Little Gunpowder Falls (drainage area, 58.3 square miles), drains an area of 408 square miles, of which 11 square miles is ir Pennsyl vania. The topography ranges from rolling to rugged. TS highest point in the basin is about 900 feet above mean sea level.
DISCHARGEStreamflow records in the Gunpowder Kiver basin have been col
lected at seven gaging stations, of which five were in operation when this report was prepared. (See pi. 1.)
The flow at four stations, Little Gunpowder Falls at Laurel Brook, Little Gunpowder Falls near Bel Air, Little Falls at Blue Mount, and Western Kun at Western Run, is not affected by regulation and diver sions. Data concerning these gage stations are given in table 4.
TABLE 4. Gaging-station data for Gunpowder River basin, Maryland
No. on pi. 1
12 __ ..........
13..... __ . ...
8... _ .........11..... _ .. _ .5 _ ............7-. 6 . _ . ___ .
No. on pi. 1
12... ..........13.............8 ...........11 _ ..........5 __ .........7... ...........6... ...... .....
Gaging station
Little Gunpowder F Brook.
Little Gunpowder I Air.
Gunpowder Falls at Gunpowder Falls ne Little Falls at Blue ] Western Run at We. Slade Run near Glyi
alls at
alls ne
Glencc ar Can Mount stern I iclon
Laurel
ar Bel
« . iey..
un.._.
Average flow
Years
28 3 3 6
11 11 8
Cfs
47.4 80.0
259 U44
71.5 75.6 2.63
Mgd
30.6 51.7
167 '93.1 46.2 48.9 1.70
Mgd (per sq
mft
0.85 1.20 1.04 (') .87 .82 .75
Drainage area
(sqmi)
36.1
43
160 314 52.9 59.82.27
Elevation of gage (feet above mean
sea level)
261.43
200
250 135 305 260 420
Minimum1 daily flow
Cfs
5.8 13 71 11.4 12 9.7 .4
Mgd
3.7 8.4
45.9 1.90 7.8 6.3 .26
Date
Aug Sept July Sept Aug. Aug. Seve
1954
1931 ........25, 1908......
19-21,1908 ... 7,3,1954 ... 3,1953......3,1955......
ral days in and 1965.
Period of record
Dec. 1926 1-> Sept. 1955.
Dec. 1904 t? Mar. 1909.
Dec. 1904 t? Mar. 1909. Sept. 1949 to Sept. 1955. June 1944 to Sept. 1955 Sept. 1944 to Sept. 1955. Sept. 1947 to Sept. 1955.
Minimum monthly flow
Cfs
7.83 32.3 10.4
. U.95 19.6 19.0
.64
Mgd
5.1 211.9 67.2 U.26 12.7 12.0
.41
Month and year
Oct. 1931 Sept. 1908 Sept. 1906 Sept. 1954 Sept. 1954 Sept. 1954 Sept. 1954
i Flow highly regulated, affected by storage and diversion.

F32 WATER RESOURCES OF INDUSTRIAL AREAS
The flow-duration curves of unregulated streams in the Gunpowder Kiver basin are similar (fig. 13 and table 1). Little Falls has a slightly higher minimum flow than the other streams, and Slade Kun has the lowest.
5.0 co 4.0
0 3.0
0 2.0
o yI s '*2 ijj
O co 0.5Q£
8*0.3Q>. 0.2_i
3 0.1
XV~*v
N^,
(
~~
>x""N^N
^x^x
PAGING1 - Little Little - Wes1
Qlo/H
v
x^,.^
^«*^^^
F* VDI
STATION
i Gunpowder F ; Falls at Blue tern Run at We e Run near Gly
*svl7h x ^*v>^^^^
ANATIO
alls at Lau Mount stern Run ndon
k ^«\^V^
M
Exa
s
nple lydo qual q mi
Flow n ma or ex 95 p
of Slac y be e ceed O.i ercent c
e Run xpecte 21 m,-? >f the
Flow is adjusted to the 57 period (1896- 1952)
<."* -^^^x^^
Vj..."^ «i
^^^^
DRAINAGE A IN SQUARE r
rel Rock 35 5
. . f^»^ ^
itCM,^
yilLES
6 12.99.8 1 2.27
^'j-.. ^ v*-'v.'
^*>^
\y\\\\\\' . \
"***.'^-^^
d to
time.-year
"^
L 2 5 10 20 30 40 50 60 70 80 90 95 98 9
PERCENT OF TIME DISCHARGE EQUALED OR EXCEEDED THAT THOWN
FIQTTBE 13. Duration curves of daily flow of streams in the Gunpowder River bas'n, Maryland.
1.0
0.8
i i rr"Note: Drainage area is 36.1 sq mi. Flow is adjusted"
to the 57-year period (1896-1952)
Example: The annual minimum 30-day flow will be equal to or less than 0.20 mgd per sq mi at aver age intervals of 10 years, or there is one chance in ten that the minimum 30-day flow in any year will be less than 0.20 mgd per sq mi.
12-month
9-month
183-day
120-day
60-day
30-day15-day 7-day
4 5 6 8 10 20 RECURRENCE INTERVAL, IN YEARS
30 40 50
FIGURE 14. Low-flow frequency curves, Little Gunpowder Falls at Laurel Brook, Md.
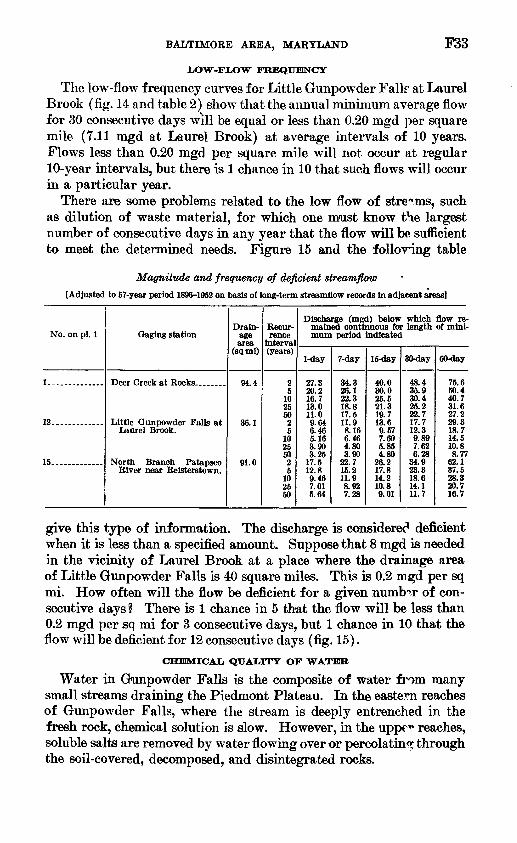
BALTIMORE AREA, MARYLAND F33
LiOW-FLiOW FREQUENCY
The low-flow frequency curves for Little Gunpowder Falk at Laurel Brook (fig. 14 and table 2) show that the annual minimum average flow for 30 consecutive days will be equal or less than 0.20 mgd per square mile (7.11 mgd at Laurel Brook) at average intervals of 10 years. Flows less than 0.20 mgd per square mile will not occur at regular 10-year intervals, but there is 1 chance in 10 that such flows will occur in a particular year.
There are some problems related to the low flow of streams, such as dilution of waste material, for which one must know the largest number of consecutive days in any year that the flow will be sufficient to meet the determined needs. Figure 15 and the following table
Magnitude and frequency of deficient streamflow
[Adjusted to 57-year period 1896-1952 on basis of long-term streamflow records in adjacent areas]
No. on pi. 1
1. ....... __ ..
12..- .-.....
15--..... ......
Gaging station
Little Gunpowder Palls at Laurel Brook.
North Branch Patapsco River near Reisterstown.
Drain age area
(sqmi)
94.4
36.1
91.0
Recur rence
interval (years)
2 5
10 25 50 2 5
10 25 50 2 5
10 25 50
Discharge (mgd) below which flow re mained continuous for length of mini mum period indicated
1-day
27.3 20.2 16.7 13.0 11.0 9.64 6.46 5.16 3.90 3.25
17.5 12.8 9.46 7.01 5.64
7-day
34.3 26.1 22.3 18.8 17.5 11.9 8.16 6.46 4.80 3.90
22.7 15.2 11.9 8.92 7.28
15-day
40.0 30.0 25.5 21.3 19.7 13.6 9.57 7.69 5.85 4.80
26.2 17.8 14.2 10.8 9.01
30-day
48.4 35.9 30.4 25.2 22.7 17.7 12.3 9.89 7-62 6.28
34.9 23.3 18.6 14.1 11.7
60-day
75.6 50.4 40.7 31.6 27.2 29.3 18.7 14.5 10.8 8.77
62.1 37.5 28.3 20.7 16.7
give this type of information. The discharge is considerec' deficient when it is less than a specified amount. Suppose that 8 mgd is needed in the vicinity of Laurel Brook at a place where the drainage area of Little Gunpowder Falls is 40 square miles. This is 0.2 mgd per sq mi. How often will the flow be deficient for a given number of con secutive days? There is 1 chance in 5 that the flow will be less than 0.2 mgd per sq mi for 3 consecutive days, but 1 chance in 10 that the flow will be deficient for 12 consecutive days (fig. 15).
CHEMICAL QUALITY OF WATER
Water in Gunpowder Falls is the composite of water from many small streams draining the Piedmont Plateau. In the eastern reaches of Gunpowder Falls, where the stream is deeply entrenched in the fresh rock, chemical solution is slow. However, in the uppe^ reaches, soluble salts are removed by water flowing over or percolating through the soil-covered, decomposed, and disintegrated rocks.
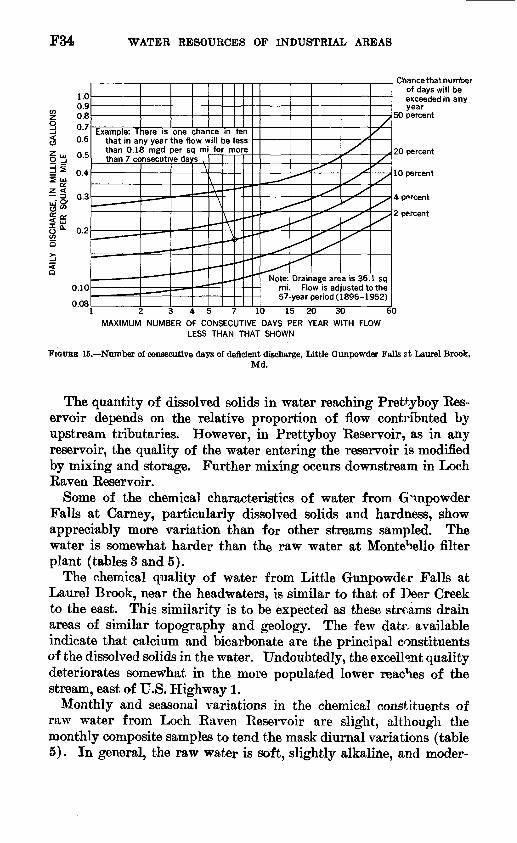
F34 WATER RESOURCES OF INDUSTRIAL AREAS
1.0 0.9 0.8 0.7
0.6
0.5
d * 0.4
0.3
0.2
Example: There is one chance in ten that in any year the flow will be less than 0.18 mgd per sq mi for more than 7 consecutive days
Note: Drainage area is 36.1 sq mi. Flow is adjusted to the 57-year period (1896-1952)
Chance that number of days will be exceeded in any year
50 percent
20 percent
10 percent
4 percent
2 percent
0.10
0.08 ____ ____________________________ ___ 1 2 3 4 5 7 10 15 20 30 60
MAXIMUM NUMBER OF CONSECUTIVE DAYS PER YEAR WITH FLOW LESS THAN THAT SHOWN
FIGURE 15. Number of consecutive days of deficient discharge, Little Gunpowder Falls st Laurel Brook,Md.
The quantity of dissolved solids in water reaching Prettyboy Res ervoir depends on the relative proportion of flow contributed by upstream tributaries. However, in Prettyboy Reservoir, as in any reservoir, the quality of the water entering the reservoir is modified by mixing and storage. Further mixing occurs downstream in Loch Raven Reservoir.
Some of the chemical characteristics of water from Gunpowder Falls at Carney, particularly dissolved solids and hardness, show appreciably more variation than for other streams sampled. The water is somewhat harder than the raw water at Montehello filter plant (tables 3 and 5).
The chemical quality of water from Little Gunpowder Falls at Laurel Brook, near the headwaters, is similar to that of Deer Creek to the east. This similarity is to be expected as these streams drain areas of similar topography and geology. The few datr- available indicate that calcium and bicarbonate are the principal constituents of the dissolved solids in the water. Undoubtedly, the excellent quality deteriorates somewhat in the more populated lower reaches of the stream, east of U.S. Highway 1.
Monthly and seasonal variations in the chemical constituents of raw water from Loch Raven Reservoir are slight, although the monthly composite samples to tend the mask diurnal variations (table 5). In general, the raw water is soft, slightly alkaline, and moder-

BALTIMORE AREA, MARYLAND F35
ately low in iron and manganese; these constituents averaged 0.20 and 0.08 ppm in 1954.
TABLE 5. Selected chemical and physical characteristics of raw water fromGunpowder Falls, 1964 l
[Results in parts per million except as indicated]
JanuaryFebruary ______March.... __ ....April................
July . .............August ..............
November ...........
Temper ature (°F)
403943505864707069655344
"65
Iron (Fe)
0.20.18.16.23.20.17.10.1734
.29
.19
.20
.20
Man ganese (Mn)
0.00.00.00.00
no.00.05
0144
.22
.03
.08
Hard ness as CaCOs
40
4141413939393938383633
39
Carbon dioxide (C0»)
3.49 Q
2.43.65.35.04.34.05.46.44.5a /*
4.2
Dissolved oxygen (percent
saturated)
938891897365666353537078
74
r«
7.37.47.47.57.37.27.37.37.27.17.17.2
7.3
Color
555766666666
6
i Analysis of water from Montebello filter plant by city of Baltimore Department of Prblic Works. * Water temperature at filters ranged from 37° to 72° F.
Chemical character of raw and treated water from Gunpowder Falls at Loch Raven Reservoir for the 10-year period 1945-54 is shown in the following table. The average annual hardness of raw water ranged from 37 to 40 ppm, pH ranged from 7.0 to 7.3, and total iron ranged from 0.20 to 0.72 ppm. The total iron and manga nese content of the raw water is reduced to negligible amounts by treatment, and hardness was increased about 10-15 ppm. Turbidity was reduced to 0.1 or 0.2 ppm, a negligible amount.
Selected chemical and physical characteristics of raw and treated water, Gunpowder Falls, 1945-54
[Results in parts per million except as indicated. Symbols: R. Raw water at Montebello filter plant; T. Treated water at Montebello filter plant. Analyses by city of Baltimore, Department of Public Works]
1945--- 1946-.-...... 1947-.- 1948.... .. 1949... .. 1950-... 1951--.. _ 1952-... .....1953.... _ ..1954... ..
Total iron (Fe)
R
0.45 .72 .27 .37 .32 .26 .51.45 .21 .20
T
002 .02 .02 .01 .01 .01 .01.01 .01 .01
Total man ganese (Mn)
R
0.14 .17 .12 .15 .14 .11 .12.06 .07 .08
T
0.00 .00 .00 .00 .00 .00 00
.00
.00
.00
Flu- oride(F)
T
------
0.6 .93 .96
Hardness as CaCOs
R
38 38 40 39 37 40 38 37 37 39
T
50 49 50 49 48 52 52 51 51 51
Car bon diox ide
(C02)
R
5.4 5.7 3.9 5.0 3.8 3.9 5.1 5.7 4.7 4.2
Dissolved oxygen (percent
saturated)
R
74 72 72 67 74 74 68 66 71 74
T
77 77 80 76 81 81 77 76 81 78
PH
R
7.1 7.1 7.2 7.2 7.1 7.2 7.0 7.0 7.1 7.3
T
7.9 7.9 7.9 79 7.9 8.0 7.8 7.9 7.9 7.9
Turbidity
R
6 10 4 4 4 5
10 8 6 5
T
0.07 .1 .2 .1 .1 .1 .1 .1 .1 .1

F36 WATER RESOURCES OF INDUSTRIAL AREAS
TEMPERATURE
The only stream-temperature data available for the Gunpowder Eiver basin are the monthly averages at the Montebello filter plant (table 5). The highest average temperature, 70° F, occurred in July and August, and the lowest, 39° F, occurred in February.
Water temperatures in the distribution system are somewhat higher (fig. 16). A maximum temperature of 82° F was reported for September 1953.
WATER STORAGE
Loch Eaven Dam, operated by the Baltimore Bureau of Water Supply, controls the flow from nearly seven-eighths of the Gun powder Falls drainage basin (exclusive of Little Gunpowder Falls). The combined storage capacity of Loch Raven and Prettyboy Res ervoirs amounts to 56 percent of the average flow (Wl itman, Re- quardt, and Associates, 1956, p. 21). Details of Prettyboy and Loch Raven Reservoirs are as follows:
Prettyboy Reservoir Location:
Latitude.. ______ ________________________ ______________-______ 39°47'Longitude. ___ __ ______________ ____ ____ . ________ 76°42'
Date of completion _______________________________________________ 1933Drainage area. ___________________________________________ _sq mi_ _ 80
-________-_____-___-__-__-___--_-___---_sq mi__ 2.34^ 1 . no__.______.____ _ ______ _ -_-----_ ______ _acres__ 1,498
Volume of storage:Usable________________________ _ _____.___miUion gal__ 19, 640
Total.. ____ ... _______ _______________ _ _do__ 19, 870Storage ratio.. _ ____________________________________________ _ _yr_ _ 0. 8Elevation of spillway crest _________________ _ft above mean sea level. _ 520Elevation of dead storage pool_______________----------____---_do_- 420
. f Surface area< [
Loch Raven Reservoir Location:
Latitude... __ _ ___ ___________ _ __ _ ___________ 39°26'Longitude.-------------.--------------------------------.-- 76°32'
Date of completion. ________ _ ____ _ _ _ _____ __ _ _ __ 1914, 1922Drainage area. ____________________________________________sq mi_ _ 303 _, f_____________________________________________sq mi_. 3. 74Surface area4 ^ n
[_______-______________________________________ acres. _ 2, 391Volume of storage:
Dead- ____________________________________ million gal_ _ 70Usable_ __ _______ _ ___ ____ _______________ _ do__ 23,630
Total.________________________________._.___._.do__ 23,700Storage ratio__-______________________________________________yr__ ft 2Elevation of spillway crest_____...__.._____.ft above mean sea level._ 240Elevation of dead storage pool..___-.._.__.-.....___.._.__...do._ 173. 5

BALTIMORE AREA, MARYLAND F37
90
80
70
60LJce
£50 o
40
30
20 ce o_<
t o o
> o o
FIGURE 16. Maximum and minimum temperatures of tap water at Baltimore, Md., ii 1053, based on measurements at 44 stations in the distribution system, Baltimore City Bureau of ^rater Supply.
The water passing the dam is measured several miles downstream near Carney, Md. (station 11, pL 1). The flow at this station for 6

F38 WATER RESOURCES OF INDUSTRIAL AREAS
years (1960-55) averaged 93.1 mgd (144 cfs), whereas the natural flow unaffected by diversion would have been 275 mgd, or 4£5 cfs. The minimum flow during the 6-year period was 1.8 mgd (1.2 cf?).
Streamflow records (table 4) are available for the gaging station on Gunpowder Falls at Glencoe (station 8, pi. 1) for the per'od Decem ber 1904 to March 1909, before the construction of Prettyboy Keser- voir. This site is upstream from Loch Haven Dam and has a drainage area of 160 square miles. Other gaged streams flowing into Loch Haven Eeservoir are Little Falls and Western Kun, which drain 53.1 and 85.4 square miles, respectively, at their mouths. These two streams drain 46 percent of the area upstream from Loch E.aven Dam.
The Baltimore Bureau of Water Supply has, since 1883, published in annual reports the computed flow into Loch Haven Keservoir. Only monthly discharge was published before 1937. This recori was com puted from flow over rated spillways, flow diverted through recording venturi tubes, and storage changes in reservoirs. No adjustment was made for evaporation from the Loch Haven Keservoir, built in 1881, and the Prettyboy Keservoir, built in 1933.
The annual mean discharge for each year, which is plotted by bar graphs in figure 17, indicates that streamflow for the 57-year base period, 1896 to 1952, averaged less than it did during the preceding 12 years, 1884 to 1895. This should not be interpreted ic mean that streamflow for the base period was unusually low because U.S. Weather Bureau precipitation records for Baltimore show at least four periods between 1825 and 1884 in which the average precipitation for 3 consecutive years was less than that recorded during the 3 low years, 1929-31.
Storage requirements at Laurel Brook are given in figure 18. Thus storage of 3 million gallons per square mile will sustain a minimum 7-day flow greater than 0.265 mgd per sq mi for 14 years out of 15 on the average (smaller flows recur at intervals of 15 years on the aver age) . The curves shown in figure 18 do not make an allowance for evaporation losses; therefore, additional storage must H provided to compensate for these losses.
FLOODS
Floods occurred in the Gunpowder River basin a few times between 1932 and 1957. One of these occurred during an exceptioral storm on August 23, 1933, when 7.62 inches of rain fell. Floodmarks of Little Falls at Blue Mount for August 1933 were the highest recorded at that station. Other great storms occurred in August 1955 when two hurri canes passed across Baltimore. The maximum precipitation during the period August 10-19, 1955, was along a narrow zone extending southwestward from Baltimore to Washington. During Baltimore's

100
1885
1890
1895
1900
1905
1910
19
15
1920
19
25
1930
W
ATE
R
YE
AR
E
ND
ING
S
EP
TEM
BE
R
30
1935
1940
1945
1950
1955
FIG
UEE
17.
Ann
ual f
low
of Q
unpo
wde
r Fa
lls a
t Lo
ch R
aven
Dam
, 18
84-1
956,
adj
uste
d fo
r di
vers
ion
and
stor
age.
I CO

F40 WATER RESOURCES OF INDUSTRIAL AREAS
Q uj dS
1.0
0.8
0.6
0.5
0.4
Note: Drainage area is 36.1 so mi. Flow is adjusted to 57-year period (1896-1952)
t £ 0.3tr >-Q <
Q"1 GQ LUI' 0.2
0.10
Natural minimum 7 day flow available
Example: Without storage there is one chance in fifteen that the mini mum 7-day flow in any year will be less than 0.135 mgd per sq mi, but if 3 million gallons of storage per square mile is provided, an allowable draft of 0.265 mgd per sq mi can be maintained with onl' one chance in fifteen of it being interrupted in any year
50
0.50-
456 8 10
RECURRENCE INTERVAL. IN YEARS
20
FIGUBE 18. Curves of stage required to sustain a given minimum 7-day flow with a specified recurrence interval, Little Gunpowder Falls at Laurel Brook, Md.
wettest month of record, August 1955, a total of 17.69 inches of pre cipitation was recorded by the U.S. Weather Bureau at its gage at the Baltimore Custom House. The fact that the maximum f -xxl in the Gunpowder River basin did not occur in August 1955 (see table on p. F41) indicates, however, that the precipitation must havi been con centrated in a relatively narrow band and might not have been as widespread as other less publicized storms. Recent storms above Gun powder Falls near Carney have not caused major floods, a* the peaks have been greatly reduced by upstream reservoirs.

BALTIMORE AREA, MARYLAND
Summary of floods in the Gunpowder River basin
F41
No. on pl.l
12.......
13.......
8... .....
11.......
5 ..
7.. __ .
6........
Gaging station
Little Gunpow der Falls at Laurel Brook.
Little Gunpow der Falls near Bel Air.
Gunpowder Falls at Glencoe.
Gunpowder Falls near Carney.
Little Falls at Blue Mount.
Western Run at Western Kun.
Slade Bun near Glyndon.
Drain age area
(sqmi)
36.1
43
160
314
52.9
59.8
2.27
Period
Dec. 1926 to Sept. 1955.
Dec. 1904 to Mar. 1909.
Dec. 1904 to Mar. 1909.
Sept. 1949 to Sept. 1955.
June 1944 to Sept. 1955.
Sept. 1944 to Sept. 1955.
Sept. 1947 to Sept. 1956.
Duration of record
Com plete water years
28
4
4
6
11
11
8
Months
10
4
4
1
4
1
1
Maximum recorded discharge
Date
8-23-33
2-26-08
2-26-08
7-9-52
9-10-50
3-18-46
9-1-52
Cfs
9,200
21,600
»5,530
7,000
5,730
5,500
448
Mgd
5,950
» 1,030
» 3, 570
4,520
3,700
3,550
290
Gage height (feet)
10.3
9.50
1 11. 93
10.62
4.53
1 August 1933 flood gage height estimated at about 14 ft. 8 Average for the day.
"WATER USB
The city of Baltimore, the chief user of water from the Gunpowder Kiver basin, supplied approximately 1,330,000 persons in 1956 and used about 200 mgd from the Gunpowder and Patapsco reservoirs. (See tables on p. F42-F43.) The demand of raw water increased from 129 mgd in 1940 to 200 mgd in 1956; the per capita demand rose from 133 to 150 gpd during the same period. Consulting engineers (Geyer and Wblff, 1955) predict that by 1975 the raw water demand will be 333 mgd and the per capita demand 187 gpd. During 1956 approximately 85 percent of the city's water was obtained from the Gunpowder River basin. The total draft from that source (raw water used) during the year was 62,092 million gallons, equivalent to an average drp ft rate of 261 cf s, which was about 70 percent of the runoff above the Loch Eaven Dam. The raw water used monthly during 1956 ranged from 48 to 142 percent of the computed streamflow.

F42 WATER RESOURCES OF INDUSTRIAL AREAS
Average delivery of filtered water to city of Baltimore, Md., 19S&-56
[Adapted in part from Requardt and others, 1953]
Year
1939. ___ .__..-_._.._..___-.-..-_. _______ .__1940. ___ -_-. ____ --.- _ ----__----... _ _---1941. ________ _____ ---.-_ ___ _-_._ _ --------1942. ___________________________________________1943. ___________________________________________1944. __ ..----.-- _ ._. _ .-----_--_----.-.._---1945. __ -_--------.__-_-_._---.-_----- _ .--_-.-1946--. _ -._---..._- ____ -_.--_-.._. _ . _ ...1947. _---.----------.--..__-_--.----_-...__---_-1948- __ ._.-_--_---_.---_...-----._--- _ ._.--_-1949. ___ --_-----..---. _ -_... _ . _ . _ --__.1950- -_._..._---.--_...- _ ..---_-.._._-_-_--__.1951. _--...---.-----.._---.._-_-_---_-_.--... ...1952. ___________________________________________1953. . ___ -_--__-_-_----..__-_-.-__---_--..----1954. -_.__-_.. _ ---_-_-_._-_-.._-_---_ _ ------1955. -_--.-_-_.- _ . _ -...._---.-_-------.--_--1956- ___________________________________________
Filtered water delivered to city
120. 17126. 03133. 42145. 08160. 82171. 29171. 63172. 75184. 90191. 57187. 10183. 68190. 26188. 53192. 98194. 56
» 195. 81196. 20
Percent of usable storage
0.27.29.30.33.37.39.40.40.42.44.43.42.44.43.45.45.23.23
1 Usable storage increased from 43,266 million gallons to 85,388 million gallons with addition of Liberty Reservoir to the system after 1954.
Raw-water demand in relation to probable population supplied
[Adapted from Requardt and others, 1953]
Year
1940 _______________'__________ ________1941.. __________________________________1942.. __________________________________1943.. -._._- _ .---..-_. ___ ___________1944_-_. ._-. _ . ___ --._..._. ____ _.1945 ...--.-..-- __ .._._... _ ....._.1946 -._--_...-........._....._-_._._.1947 -.__._-_._-.-._--_._._-_._-_-_-_.1948 -__-_-.__ _-_._._-.- _ . _ -_-_...1949- _ _______________________________1950 _________ _ . _ --_-_---------..-1951 --. ___ .----___-.._.---..-----_.1952 _.._....-....-_.._--___-- _ _.-._1953 _________________________________1954 -..___ _ ----._-_.._._ _ _----._.1955 --_---__._--.._..__._.._._--._...1956 ------ ___ _._ ___ ..._._.-._....1975 2___ _.----..--..._._.._...__._._....2000 2 ________________________________
Total raw water
demand
129137149165176176177190195190187198197199199198200333461
Estimated population
supplied (millions)
0.971. 011. 131. 191.161. 141. 141. 141. 16
» 1. 16» 1. 16
1. 191. 211.231.261. 301. 331.782. 27
Raw water demand per capita (gpd)
133136132138152154155166169164161167163162158152150187203
1 Adjusted to conform to 1950 census figures.3 Prediction for these years by consulting engineers Geyer and Wolf, 1953, (table 3-1).

BALTIMORE AREA, MARYLAND F43
Water use in millions of gallons, by the Baltimore Bureau of Water Supply from theGunpowder Falls, 1956
Year and month
March. ___________________April......................................
July................ ............ _ ....August ____ . _ . ___________September..... .. _________October. __________________November. _________________December ___ ....... __________
Total................................Daily average:
Million gallons _________Cubic feet per second ______
Raw water used
3,1065,7005,9935,6686,0865,5355,4085,6865,1684,6774 1774,838
62,042
169261
Storage change hi reservoir
+2,430+4,164+3,264+1(553
-32-675
1 AA-t
-1, 110-1,541
+397+2,147
+241
+11,279
Bypassed at dam
2,0272,0572,7911,3851,3784,695
68
1,253
15,654
4366
Computed streamfbw
5,r>«11,87111,31410,0127,4396,2^
10,5*44,6443,«W5,0746,3^46,3<*2
88,975
2«t376
Percent of streamflow
used
56485357828951
122142926676
70
7070
PATAPSCO RIVER
The Patapsco Eiver is the second largest stream in the Baltimore area. Its total drainage area above the point where it crosses U.S. Eoute 301 at Lansdowne is 359 square miles. The topography of the Patapsco River basin is largely rolling to undulating, but it is some what rugged in a few places, as in the vicinity of Ellicott City and Elkridge. The maximum elevation is about 1,100 feet in the vicinity of Snydersburg in eastern Carroll County. More than 90 percent of the Patapsco River basin overlies the crystalline rocks of the Pied mont province. Near its mouth, below Elkridge, the rive" becomes tidal, its valley widens, and its channel cuts through softer sedimen tary rocks of Cretaceous and younger age.
DISCHARGE
Streamflow records are available from 7 gaging static ns in the Patapsco River basin (see table on p. F44 and pi. 1), 2 of which have been discontinued. The static North Branch Patapsco Fiver near Reisterstown was discontinued in December 1953, because it was af fected by backwater from the recently built Liberty Dam; flow during the period of record was not affected by diversions or storage and thus is not representative of present flows. Of the 5 active stations, 3 are not affected by regulation or diversion and two are highly regulated.
The flows of North Branch Patapsco River at Cedarhu~st, South Branch Patapsco River at Henryton, and Piney Run near Sykesville are unaffected by regulation and diversion. Flow-duration curves for these streams are given in figure 19. The flow from 285 square miles of the Patapsco River basin (nearly 80 percent) is measured at the Hollofield station. Duration curves of daily flow in figure 20 show
690-492 i

F44 WATER RESOURCES OF INDUSTRIAL AREAS
Gaging-station data for the Patapsco River basin
No. on pl.l
14-
15-
16.......
17.......
18.......
19.
20-
Gaging station
North Branch Patapsco River at Cedarhurst.
North Branch Patapsco River near Seisters- town.
North Branch Patapsco River near Marriotts- ville.
South Branch Patapsco River at Henry ton.
Piney Run near Sykes- ville.
Patapsco River at Wood- stock.
Patapsco River at Hollo- field.
Drain age area (sqmi)
56.6
91.0
165
64.4
11.4
260
285
Eleva tion of gage feet
above mean
sea level
425
344.35
269. 78
289.15
450
235
190
Period of record
Sept. 1945 to Sept. 1955.
June 1927 to Dec. 1953.
Oct. 1929 to Sept. 1955.
Aug. 1948 to Sept. 1955.
Sept. 1931 to Sept. 1955.
Aug. 1896 to Mar. 1909.
May 1944 to Sept. 1955.
Avera-je flow
Years
10
26
26
7
24
7
11
Cfs
71.5
103
1180
78.6
12.8
450
1340
Mgd
46.2
66.6
'116
50.9
8.27
291
1220
Mgd per sq
mi
0.82
.73
.70
.79
.73
1.12
.71
No. on pi. 1
14. .. .15.... ...........16 17... . .18 ...............19 . 20 ..
Minimum daily flow
Cfs
12 112.2
8.0 1.2
50 118
Mgd
7.76 7.12.13
5.17 .78
32.3 112
Date
Aug. 2; Sept. 14, 1954 __ .. .. . ... .Aug. 9, 1931; Aug. 28, 29, 1932 _ . _ ..
Oct. 14, 1954.. ....................Sept. 1932... ....................July and Aug. 1900; June to Sept. 1904. Sept. 14, 1954
Minimum monthly flow
Cfs
17.2 17.6 2.25
12.2 1.82
106 224.2
Mgd
11.1 11.22.16.7.9 1.18
6-* 5 215.6
Date
Sept. 1954 Oct. 1941 Sept. 1954 Sept. 1954 Sept. 1932 Sept. 1898 Sept. 1954
1 Includes adjustments for diversions since February 1953.2 Minimum flow regulated by Liberty Reservoir since July 22,1954.
5°-
4.0
3.0
2.0
1.00.8 0.7 0.6 0.5 0.4
0.3
0.2
0.1).08 i r»7
\S*S
VXX
NSr \
EXGAGING STATION
- -
i- North Branc - South Branc - Piney Run n
h Pa tap h Pa tap ear Syk
*<5^
>*
PLA
sco R sco R =sville
vHv
S1AT
^^J-
IOIS
X*^
1 __
ver at Cedarhi ver at Henrytc
E
*^<""«5.
X
xamp near
e: Flow of Pir Sykesville rr
5y Run ay be
expected to equal or ex ceed 0.16 mgd per sq mi
-95 fFlow57-y195
XIDRAINAGE IN SQUAR
jrst 56w 64
1 1
Dercent of th is adjusted
ear period (3) \
^^\*^J
I AREA E MILES
.6
.4
n \^
time, to the 1896-
\ . - - iV_ - "~-
^ ^x
\
AJ.J..T |
1 10 20 30 40 50 60 70 80 90 95 98 99
PERCENT OF TIME DISCHARGE EQUALED OR EXCEEDED THAT SHOWN
FIGURE 19. Duration curves of daily flow for streams in the Patapsco River basin, Maryland.

BALTIMORE AREA, MARYLAND F45
2000
1000
700
500
400
8 300
200
oCO
o? 100
\
*>
| 6°
50
40
30
20
10
Note:
\
Drainage area i: 285 sq mi
X
Unregulated flow (adjusted period, 1896-195?)
Flow for 57-year period adjusted to present regulation pattern
\
12 5-10 20 40 60 80 90 95 98 99 PERCENT OF TIME DISCHARGE EQUALED OR EXCEEDED THAT S'-'OWN
FIGURE 20. Duration corves of daily flow, Patapsco River at Hollofleld, Md.
the natural flow (upper curve), adjusted to the 57-year period 1896- 1952 and the flow under the pattern of regulation during the period 1953-55, also adjusted to the 57-year base period. The aroa between the two curves represents the average amount of water, evaporated and diverted from Liberty Reservoir.
Low-flow frequency analyses for six stations in the Patapsco Eiver basin are shown in table 2, and sample curves for one station have been plotted in figure 21.

F46 WATER RESOURCES OF INDUSTRIAL AREAS
0.9 0.8 0.7 0.6
0.5
0.4
0.3
0.25E LU
CCz <
0.10
0.08
0.05
Note: Drainage area is 11.4 sq - mi. Flow is adjusted to the - 57-year period (1896-1952)
12-month
9-month
183-day 5rs
120-day |
60-day
30-day
15-day 7-day
Example: The annual minimum 30-day flow will be equal to or less than 0.13 mgd per sq mi at aver age intervals of 10 years, or there is one chance in ten that the minimum 30-day flow in any year will be less than 0.13 mgd per sq mi.
4 5 6 8 10 20
RECURRENCE INTERVAL, IN YEARS
30 40 50
FIGURE 21. Low-flow frequency curves, Piney Run near Sykesville, Md.
CHEMICAL QUALITY OP WATER
The water of North Branch Patapsco Eiver near Eeisterstown is of excellent chemical quality, reflecting the low rate at which the rocks are dissolved in the upper reaches of the basin. Based on chemical data for the Eeisterstown area, the water impounded in Liberty Eeservoir below Morgan Eun will be satisfactory for all uses. Selected analyses of water from the Patapsco Eiver basin obtained ov^r a period of about 3 years at five gaging stations in the basin are giver in table 3.
Although direct comparison should not be made on tiH basis of only two samples, the chemical quality of North Branch Patapsco Eiver near Marriottsville appears similar to that of the North Branch Patapsco Eiver near Eeisterstown, but the dissolved solids and hard ness are somewhat higher than at the upstream station near Eeis terstown. The quality of water at Marriottsville is influenced by flow of Morgan Eun. The two analyses in table 3 show less than 100 ppm dissolved solids and less than 60 ppm hardness. Color (55 units) of the water at Marriottsville was more prominent at the time of collec tion in March 1955 than at any other stations, although streamflow was extremely low (0.23 mgd).
The water of South Branch Patapsco Eiver at Henryton is of ex cellent chemical quality, as it is low in dissolved-solids content. As
BALTIMORE AREA, MARYLAND F47
with most streams in the area, the water has sufficient hardness to re duce the corrosive effect on metal surfaces. Calcium and bicarbonate are slightly dominant, and nitrate is somewhat more concentrated than for samples from the North Branch. The occurrence of ritrate may be attributed to upstream pollution, as the stream drains an area in cluding many small towns and extending nearly to Frederick County. Nitrate in excess of natural concentrations of a few tenth* of a part per million may enter the stream from several sources, sucl as munici pal, domestic, or industrial sewage, or from the leaching of fertilizers in croplands.
The water of Piney Run near Sykesville was of excellent quality at the times of sampling. Calcium and bicarbonate are orly slightly dominant, and hardness values are about one-half those of dissolved solids.
The Patapsco River at Hollofield is a mixture of the water of the North Branch and South Branch. At flows of 23 and 117 mgd, the water was of excellent quality and was nearly identical ir dissolved- solids and hardness content. The principal difference in individual constituents was that sulf ate and bicarbonate occurred in about equal proportions at the higher flow, whereas bicarbonate was dominant at the lower flow.
TEMPERATURE
Little data are available concerning the temperature range of sur face water in the Patapsco River basin. Seven temperature measure ments were made in Piney Run in 1956 near the Springfield State Hospital by the Water Pollution Control Commission anc1 Maryland Department of Health (1957, p. 53). Water temperature ranged from 66° to 73° F during the period from June 20 to October 3.
WATER STORAGE
Liberty Reservoir, on the North Branch Patapsco River along the Carroll-Baltimore County line, is the largest reservoir in the Balti more municipal system. The total storage capacity (43,330 million gallons) is about 115 percent of the average annual flow at the dam during 1950-54.
Using an 823-day, or 21,4-year, drought period (July 1, 1930, to September 30, 1932), consulting engineers (Requardt, Shaw, and Wolman, 1953) estimated the safe yield above the dam tc be 50 mgd (0.305 mgd per square mile). .A total safe yield of 95 mgd from the Patapsco River system was obtained by adding reservoir capacity sufficient to yield 45 mgd. Details concerning the reservoir above Liberty Dam are as follows:Location:
Latitude__.________________________.___._____ 39°23'Longitude.-__---____.________________.___...__-_____ 76°53'

F48 WATER RESOURCES OF INDUSTRIAL AREAS
Surface areas
Date of completion _______________________________________________ 1954Drainage area_____________________________________________sq mi__ 164
--_______._____.___________._____.________d.____ 4.86__________________________________________acres__ 3, 110
Volunae of storage:Dead_______________________________million gal__ 1,260Usable__---__________________________________do____ 42,070
Total._____________________________________do__ 43,330Storage ratio--_-_____________________________________________yr__Elevation of spillway crest _________________ _ft above mean sea level. _Elevation of dead storage pool_-_-_--_------------____-_____--_do_-
1.0420320
The storage required to maintain various rates of flow of Piney Run near Sykesville are given in figure 22 and the following table.
1.0
0.8
0.6 -
0.5
0.4
0.3
0.2
0.10
0.08
0.06
"Note: Drainage area is 11.4 sq mi. Flow is adjusted to 57-year period (1896-1952)
Natural minimum 7-day flow available
Example: Without storage there is one chance in fifteen that the rrvni- mum 7-day flow in any year will be less than 0.08 mgd per sq mi, but if 20 million gallons of storage per square mile is provided, an allowable draft of 0.32 mgd per sq mi can be maintained with only one chance in fifteen of it being interrupted in any year
I I i
50
30
20
15
10
53
2
1
0.5
456 8 10
RECURRENCE INTERVAL IN YEARS
20
FIGURE 22. Curves of storage required to sustain a given minimum 7-day flow with a specified recurrence interval, Piney Run near Sykesville, Md.

BALTIMORE AREA, MARYLAND F49
It should be borne in mind that this analysis of storage-reiuired fre quency makes no allowance for evaporation and seepage losses, and any design should make allowances for them.
Draft-storage data for selected streams
[Adjusted to 67-year period, 1896-1952, on basis of long-term streamflow records in ad'^'wnt areas]
No. on pl.l
7.........
12 ____
18 ..
22.
26
Gaging stations
Western Run at Western Run.
Natural 7-day minimumflow i million gallons..
Little Gunpowder Falls atLaurel Brook. _______
Natural 7-day minimumflow L- million gallons
Piney Run near Sykesville.
Natural 7-day minimum flow i _ million gallons _
North River near Annapolis..
Natural 7-day minimumflow i ... million gallons
Little Patuxent River at Ouil-ford . . .
Natural 7-day minimumflow' _ million gallons-
Drainage area
(sq mi)
59.8
36.1
11.4
8.5
38.0
Storage (million gallons)
29.969.8
120179299598897
1,2001,7902,990
18.036.172.2
108180361542722
1,0801,800
5.7011.422.834.257.0
114171228342570
4.258.50
17.025.542.585.0
128170255425
19.038.076.0
114190380570760
1,1401,900
Allowable draft (mgd) uncorrected for reservoir seepage and1 evaporation for recurrence intervals indicated
2 years
20.322.124.326.329.033.536.538.642.248.5
16.7
11.713.015.016.618.821.823.625.027.531.4
10.39 asA. OV
3.203.664.054.615.375.876.327.028.30
2.20 3.313.573.884.254.635.325.756.096.647.52
2.78
7.908.82
10.211.412.715.417.118.520.925.1
5.70
5 years
15.016.418.219.922.325.728.430.433.639.6
11.8
9.029.96
11.412.413.916.417.819.121.325.2
6.971 OSi. VO
2.212.582.913.373.944.424.805.446.54
1.409 48« YO
2.723.033.283.604,144.504.815.346.24
2.03
5.176.047.188.099.27
11.212.613.815.919.8
3.59
10 years
12.714.115.817.218.722.124.526.429.735.5
9.69
7.228.239.46
10.411.713.415.016.118.221.7
5.561 831.792.092.362.763.283.714.064.705.83
1.05 2.132.302.622.833.123.603.964.254.745.58
1.68
4.035.055.856.577.459.31
10.511.613.617.0
2.75
25 years
10.211.412.914.216.119.020.922.726.031.5
7.71
5.676.537.768.489.67
11.212.513.615.619.1
4.261.161.381.651.872.172.633.013.363.944.97
.756 1.731.892.162.352.633.053.373.634.114.90
1.34
3.153.804.675.215.977.308.479.50
11.414.4
2.00
The natural 7-day flow is approximately equal to the dependable flow available without storage.

F50 WATER RESOURCES OF INDUSTRIAL AREAS
FLOODS
Maximum recorded flood flows at seven gaging stations in the Patapsco Eiver basin are given in the following table. TH flood of August 1933 was the greatest of record at 2 of the 3 gaging stations
Summary of floods in the Patapsco River basin
No. on PI. 1
14..
15..
16-.-...
17..
18..
19.......
20..
Gaging station
North Branch Patapsco River at Cedarhurst.
North Branch Patapsco River near Reisters- town.
North Branch Patapsco River near Marriotts- ville.
South Branch Patapsco River at Henryton.
Piney Run near Sykes- ville.
Patapsco River at Woodstock.
Patapsco River at Hol- lofleld.
Drain age area (sq mi)
56.6
91.0
165
64.4
11.4
260
285
Period
Sept. 1954 to Sept. 1955.
June 1927 to Dec. 1953.
Oct. 1929 to Sept. 1953.1
Aug. 1948 to Sept. 1955".
Sept. 1931 to Sept. 1955.
Aug. 1896 to Mar. 1909.'
May 1944 to Sept. 1955.
Dura tion of record (com plete water years)
10
26
23
7
24
7
11
Maximum recorded discharge
Date
8-13-55
8-24-33
8-24-33
5-26-52
7-24-46
2-26-08
6-2-46
Cfs
4,130
11,000
19,500
4,930
2,100
11,000
13,500
Mgd
2,669
7,109
12,600
3,186
1,357
7,109
8,725
Oage height feet)
10.38
14.6
20.8
11.04
6.95
14.9
311.62
1 Liberty Reservoir started filling in 1954; records after then not comparable. * Incomplete.» Flood of August 1933 reached a gage height of 19.5 ft according to report by Maryland State Roads
Commission.
then in operation. On August 24, 1933, the peak flow of the North Brandy Patapsco River near Marriottsville was 19,500 cfs (or more than 12,600 mgd) with a crest gage height of 20.8 feet. During this storm, the highest flow of record (11,000 cfs on August 24) was reached on the North Branch Patapsco River near Reisterstown. Precipitation in August 1933 at Baltimore was 13.83 inches. Pre cipitation records since 1871 at the Baltimore weather station (Cus tom House) show 5 other months having more than 10 inches of rainfall; these were September 1876, July 1889, July 1£05, August 1911, and August 1955. Flooding probably occurred in tl ^ Patapsco River basin at some time during all these months. There was no major flood at the Marriottsville gage in August 1955, owing to the effect of Liberty Reservoir, which began operation in 1954.
"WATER USB
The Baltimore Bureau of Water Supply is the chief unr of water in the Patapsco River basin. During 1956, 11,088 million gallons (about 15 percent of the public supply of the city) was obtained from Liberty Reservoir. A 25-month record (July 1955-Jul^ 1957) of diversions from the reservoir, of changes in storage, of water by passed, and of computed flow of the North Branch Patrpsco River are given in the following table. During the 25 months 25 percent

BALTIMORE AREA, MARYLAND F51
of the flow was used. Monthly use ranged from 0 to 360 percent of the flow. The average use for 762 days was 39 mgd (60.3 cfs).
Water use by the Baltimore Bureau of Water Supply from the North Branch PatapscoRiver
[Results are for 25-month or 762-day period July 1966 through July 1967]
Year and month
1955 July -. . .-._- . August ________ - _- .
October ___________________November _________________
1956 January ______ .. ____ . ............
March _____________________April......................................
July.......................................
November __________________
19S7
February .............. ...................March ____________________April......................................
July.......................................
Total................................Daily average:
Million gallons ..................
Raw water used
(million gallons)
1,662996687440
911,615
2,8340
9814
911994
1,0701,0691,4901,5891.010
1,044869957
2,1222,5992,8783,082
30,130
3960.3
Storage Change in reservoir (million gallons)
-622+9,702+1,906+3,603+2,219
+234
-99+2,073
+59-42+75
-217+75-92+67+16
-108-4-O9
+67+58-92-83
-241-1,069-2,228
+15,353
Bypassed at dam (million gallons)
6,6908,3197,2145,2723,6519,5793,0781,6381,5972,5194,027
4,0865,5715,3555,177
865
74,420
98151
Computed streamflow
(million gallons)
1,0*010, 6f*
2,5T<4,0432,3101,849
2,7f*8.6P38,4767, If «5,3564,345
10,6484,0562,6743,1034,0005,129
5,1976,4986,2207,2163, Kit1,809
854
119, 9TT
1572^3
Percent of stream- flow used
1609.3
26113.9
87
10301.1.2.2
219.3
2640484020
2013152981
159360
25
Several industrial plants along the river use water for processing and cooling. Among these are a linoleum plant near Cedarhurst, a textile plant at Daniels, and a box-board plant at Ilchester.
PATUXENT RIVERAlthough a substantial part of the flow of Patuxent Kiv^r is used
by the Washington Suburban Sanitary Commission, sufficient water remains to make the stream important in the water economy of the Baltimore area. The total drainage area of the Patuxent Kiver above its confluence*with the Little Patuxent Kiver in Anne Arundel County is 181 square miles. It becomes tidal near Governor Bridge about 14 miles south of Laurel, and an estuary extends southward several more miles to the Chesapeake Bay.
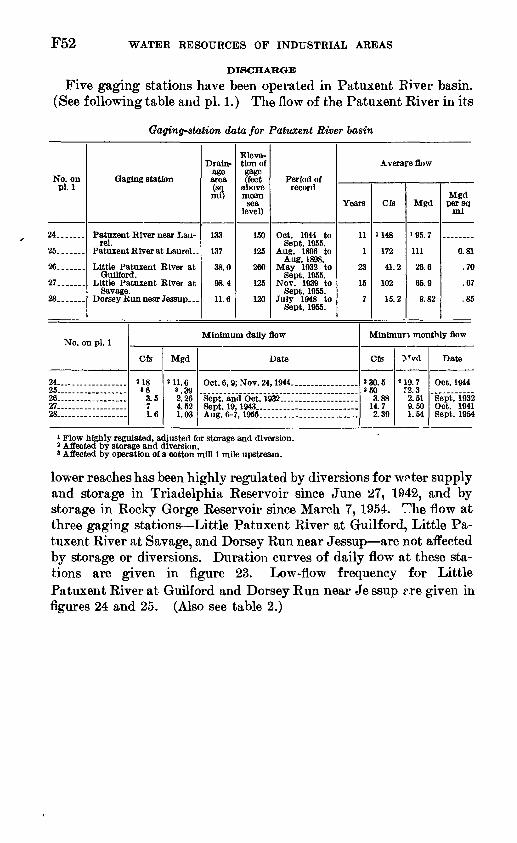
F52 WATER RESOURCES OF INDUSTRIAL AREAS
DISCHARGE
Five gaging stations have been operated in Patuxent River basin. (See following table and pi. 1.) The flow of the Patuxent River in its
Gaging-station data for Patuxent River basin
No. on pl.l
24.......
25.......
26.......
27.......
28.......
Gaging station
Patuxent River near Lau rel.
Patuxent River at Laurel-
Little Patuxent River at Guilford.
Little Patuxent River at Savage.
Dorsey Run near Jessup _
No. on pi. 1
24.............. _ .25..... .............26..................27.............. _ .28..................
Cfs
318»6
3.57 1.6
Drain age area (sq mi)
133
137
38.0
98.4
11.6
Eleva tion of gage (feet
above mean
sea level)
150
125
260
125
120
Period of record
Oct. 1944 to Sept. 1955.
Aug. 1896 to Aug. 1898.
May 1932 to Sept. 1955.
Nov. 1939 to Sept. 1955.
July 1948 to Sept. 1955.
Averare flow
Years
11
1
23
15
7
Minimum daily flow
Mgd
«11.6 ».39 2.26 4.52 1.03
Date
Oct. 6, 9; Nov. 24
Sept. an Sept. 19 Aug. 6-'
d Oct. 1{ 1943
,1944...... __ . .....
32....................
, 1955.... .............. __ ..
Cfs
1148
172
41.2
102
15.2
Mgd
195.7
111
26.6
65.9
9.82
Mgd per sq
mi
0.81
.70
.67
.85
Minimum monthly flow
Cfs
330.5 950
3.88 14.7 2.39
J^d
319.7 ?2.3 2.51 9.50 1.54
Date
Oct. 1944
Sept. 1932 Oct. 1941 Sept. 1954
1 Flow highly regulated, adjusted for storage and diversion.2 Affected by storage and diversion.9 Affected by operation of a cotton mill 1 mile upstream.
lower reaches has been highly regulated by diversions for wpter supply and storage in Triadelphia Reservoir since June 27, 1942, and by storage in Rocky Gorge Reservoir since March 7, 1954. The flow at three gaging stations Little Patuxent River at Guilford, Little Pa tuxent River at Savage, and Dorsey Run near Jessup are not affected by storage or diversions. Duration curves of daily flow at these sta tions are given in figure 23. Low-flow frequency for Little Patuxent River at Guilford and Dorsey Run near Je ssup r.re given in figures 24 and 25. (Also see table 2.)

BALTIMORE AREA, MARYLAND F53
DAILY DISCHARGE, IN MILLION GALLONS
PER SQUARE MILE
B §0 0 0 00000"- 10 W -P* WO
vi ID" k> co *» en 01 'xico b b b o b c
"SN
\ \SN\^Ox
Exampneapecw. i
pen
^v
X
*
-
le: Flow of Dor r Jessup ma :ed to equal or 2 mgd per sc ;ent of the tim
GAG^
EXPLANATION
JG STATION
Little Patuxent River at GuiH Little Patuxent River at Sava Dorsey Run near Jessup ^^^^i*
sey Ri / be e excec mi <
e. Flo
^v,
X-id
wis adjusted to the 57-year period (1896- 1952)
.^^^^ ^.*V
^^Si^^^
DRAINAGE AREA, INSQUARE MILES
ordge
^_^fcs
38.098.4 11.6
^'. -
-^^T
PERCENT OF TIME DISCHARGE EQUALED OR EXCEEDED THAT SHOWN
FIGURE 23. Duration curves of daily flow for streams in the Patuxent Biver basin, Md.
0.7 0.6
0.5
0.4
0.3
0.2
0.100.090.080.070.06
0.05
0.04
n i i i i i I i i i Note: Drainage area is 38.0 sq mi. Flow is adjusted
to the 57-year-period (1896-1952)
12-month
15-day 7-day
Example: The annual minimum 30-day flow will be equal to or less than 0.095 mgd per sq mi at aver age intervals of 10 years, or there is one chance in ten that the minimum 30-day flow in any year will be less than 0.095,mgd per sq mi
J____i i i i i i i_____i i i4 5 6 8 10 20
RECURRENCE INTERVAL, IN YEARS30 40 50
FIGURE 24. Low flow frequency curves, Little Patuxent River at Quilford, M<i.

F54 WATER RESOURCES OF INDUSTRIAL AREAS
0.8 |
0.6
0.5
% 0.4
3
< 0.3
|3d 2 0.2
0.08
0.06
0.04 -
0.03
_Note: Drainage area is 11.6 sq mi. Flow is adjusted, to the 57-year period (1896-1952)
-Example: The annual minumum 30-day flow will be_ equal to or less than 0.09 mgd per sq mi at aver age intervals of 10 years, or there is one chance m_ ten that the minimum 30-day flow in any year will be less than 0.09 mgd per sq mi.
12-month
UJO
9-month < x o t/i a
183-day ^ 3
120-day |
60-day _i <
30-day ^
15-day "* 7-day
4 5 6 8 10 20 RECURRENCE INTERVAL, IN YEARS
30 40 50
FIGURE 25. Low-flow frequency curves, Dorsey Run near Jessup, Mc<.
CHEMICAL, QUALJTY OP WATER
Some data are available concerning the chemical characteristics of raw water from the Patuxent River. (See following tr.ble.) The water is of excellent quality.
Chemical analyses, in parts per million, of water from the Patuxent River [Analyses by Washington Suburban Sanitary Commission]
Constituent
Silica(SiOj).. -..-... - ... .-._.-.-.._-. . - Iron (Fe). ...... ___ ... _ ...... __ ... _ . _ _..._. _ __ ..__. Manganese (Mn) ____________ . __________________Calcium (Ca)_. ______ . _____________ . __________
Sodium (Na)-.. ........................... _ ............. _ ...........Potassium (K). ___ ....... _ . ___ . ______ . ______ . .......Carbonate (COs). ____ .. ______ . ______ . ....................Bicarbonate (HCOs) ________________________ ______Sulfate(SO4) _ . .. .. ..................... _ .....................Chloride (Cl)... ..... .._.______.______ ___.________.____._______..__Fluoride(F) ............................... __ ..... __ ...............Nitrate (NO»)--._ ____ .. _ ..... Dissolved solids _ ___ __ ___ ____ ____ ........Hardness as CaCOs _________________ ______ ...........
Color . . . __ .......... __ ........PH.. .....................................................................Turbidity __ .............. _ _. .
A
9.7.02.00
4.01.12.61.20
154.03.2.0
1.937142
6.8.9
B
5.1.15.17
4.82.0
156.24.1.1
4820
6.9
C
5.3.02.0
112.8
197.47.51.0
6738
8.5
A. Raw water from the Patuxent treatment plant near Laurel, Md., April 1951.B. Composite sample of raw water obtained in 1957 from Triadelphia and Rocky Gorge reservoirs.C. Composite sample of treated water obtained in 1957 from both reservoirs.

BALTIMORE AREA, MARYLAND F55
TEMPERATURE
No data are available concerning the range of water temperature in the Patuxent Kiver, which is probably similar to that of o*her large Piedmont streams in Maryland.
WATER STORAGE
Triadelphia Reservoir above Brighton Dam and Kocky Gorge Kes- ervoir near Laurel are sources of water for the Washington Suburban Sanitary Commission. Overflow from the reservoirs plur the flow from the Middle and Little Patuxent Kivers is an important source of water for the Baltimore area. A description of these reservoirs follows:
Rocky Gorge Reservoir Location:
Latitude__._______.__________________________- 39°07'Longitude...._______________________________ 76°52'
Date of completion____________-___-_____---__--_____---_____-__-- 1954Drainage area,______________________________________--____sq mi_. 132 . /____-_-.___-____--_____-____-_ _.-_.-_.-__...do. 1.21Surface areas -,-«,l_--_____-__-_____-______-_____-____----_----__ _acros_ _ 773Volume of storage:
Dead-_--__________--___-___________-____-million gal__ 80Usable._____________________ ___________________do____ 5,920
Total...____.__________.__-___-___do__ 6,000 Storage ratio________________________________________--____---3-r__ 0. 2Elevation of spillway crest _________________ _ft above mean sea level- _ 270Elevation of dead storage pool.__________-_-__--_----_--_---_do___- 214
Triadelphia Reservoir Location:
Latitude._.._______---_._____._-______.__---------__-----_-- 39°12'Longitude.-_.__________._____.____.-_-________----__.-____-- 77°00'
Date of completion_______________________________________________ 1943Drainage area.____________________________________________sq mi.. 78. 4a - /-___---__-__.___-___-.________________________do____ 1.34Surface areas oc _,
l_-______--_______-________________--_-__--___-_ acres.. 857Volume of storage:
Dead-____________________________________million gal_- 0Usable_________________________________-________do____ 6, 582
Total._______________________________________do____ 6, 582Storage ratio-________________-__________-_____-_-___--____-__yr__ 0. 2Elevation of spillway crest__________________ft above mean sea level._ 350Elevation of bottom of usable pool- _ _--____-_-----_-------__-do---- 302
Storage requirements for Little Patuxent Kiver at Guilford are given in figure 26.

F56 WATER RESOURCES OF INDUSTRIAL AREAS
0.7
0.6
0.5
0.4
0.3
#0.2OL
0.1
0.08
0.06
0.05
Note: Drainage area is 38.C sq mi Flow is adjusted to 57-year period (1896-1952)
Natural minimum 7-day flow ava lable
Example: Without storage there is one chance in fifteen that the min 1 - mum 7-day flow in any year will be less than 0.062 mgd per sq m : , but if 15 million gallons of storage per square mile is provided, an allowable draft of 0.248 mgd per sq mi can be maintained with only one chance in fifteen of it being interrupted in any year
50
30
O LLl20 «
15 §
10 z
5 !
3 !
2 ,<1 i<
0.5
456 8 RECURRENCE INTERVAL IN
10 YEARS
20
FIGURE 26. Curves of storage required to sustain a given minimum 7-day flow with a sr-flcified recurrence interval, Little Patuxent River at Qullford, Md.
FLOODS
The greatest flood during the period of record (1933-55) on the Lit tle Patuxent River at Guilford was 5,300 cfs (3,245 mgd) on Septem ber 1, 1952. (See following table.) The flood produced a peak flow of 6,280 cfs (4,059 mgd) on the Little Patuxent River at Savage. Dur ing September 1952, 6.37 inches of rain fell at the weather station at Fort George G. Meade, of which 5.20 inches fell in 24 ho^irs on Sep tember 1. Large floods occurred in August 1933 and in August 1955.

BALTIMORE AREA, MARYLAND
Summary offloads in the Patuxent River basin
F57
No. on plate 1
24.....
26.....
27.....
28.....
Gaging station
Patuxent River near Laurel.
Little Patuxent River at Guilford.
Little Patuxent River at Savage.
Dorsey Run near Jessup.
Drain age area (sq. mi.)
133
38.0
98.4
11.6
Period
Oct. 1944 to Sept. 1955
May 1932 to Sept. 1955.
Nov. 1939 to Sept. 1955.
July 1948 to Sept. 1955.
Dura tion
of rec ord
(com plete water years)
11
23
15
7
Maximum discharge (flood-flow)
Date
9- 1-52
9-1-52
9- 1-52
8-13-55
Cfe
5,200
5,300
6,280
1,400
Mgd
3,361
3,425
4,059
905
Oage (feet)
10.47
13.26
1 13. 15
12.77
i Local residents reported a stage of 17.5 ft in August 1933.
WATER USB
The Washington Suburban Sanitary Commission is the principal user of water from the Patuxent Eiver. During 1955, this agency di verted an average of 29 mgd from Eocky Gorge Beservoir above Laurel. This amounted to about 30 percent of the 11-year (1945-55) average flow of the stream. During the same year, the commission diverted approximately 1.7 mgd at their Mink Hollow pumping sta tion near Ashton in Montgomery County. The commisskyi diverted about 37 mgd from Rocky Gorge Beservoir during 1956, an increase of 28 percent over 1955. However, during 1956 the diversion at Mink Hollow was only about 0.007 mgd.
Most of the water diverted was supplied to residents of Montgom ery and Prince Georges Counties in the suburbs surrounding the Dis trict of Columbia. The commission supplied Laurel with r,n average of 0.464 mgd in 1956 and Howard County with about 0.016 mgd. The U.S. Army at Fort Meade uses a small quantity of water f rm the Lit tle Patuxent Biver. In 1955 this installation used an average of 2.2 mgd. In 1956 the average use was 2.1 mgd or about 3 percent of the mean flow. No nonwithdrawal uses, excepting recreation, are known in the Patuxent Biver basin.
WATER RESOURCES OF THE COASTAL PLAIN g UBAREA
The Coastal Plain subarea of this report occupies the arer, southeast of the Baltimore and Ohio Bailroad and west of Chesapeake Bay; it is bordered on the south by the South Biver, the Washington- Annapolis Expressway, and the Patuxent Biver. The ro",ks of the Coastal Plain subarea consist chiefly of sand, gravel, clay, and sandy clay of early Cretaceous to Becent age, which form a wedge-shaped sedimentary mass. This wedge lies on the bevelled crystalline rocks exposed at the land surface west of the fall zone. The distribution of

F58 WATER RESOURCES OF INDUSTRIAL AREAS
the major sedimentary formations is shown on plate 2. These sedi ments thicken eastward and are about 500 feet thick at Glen Burnie, about 750 feet thick at Sparrows Point, and more than 1,001 feet thick at Annapolis. The subarea is rolling, hilly, and well drained, except at some places along the major streams, such as the swampy areas along the Patuxent River. There are extensive flat terraces at several places along the bay shore. The maximum elevation in the subarea, is slightly more than 200 feet near Jessup and Savage Station in eastern Anne Arundel County.
One-half to two-thirds of the industries of the Baltimore area are in this subarea. The Bethlehem Steel Co. Sparrows Point plant at the mouth of the Patapsco River is the State's largest industrial plant. Agriculture is an important activity in central Anne Arm del County and in the Back River and Patapsco River Neck sections of Baltimore County. However, in recent years the usable farm land is rapidly be coming urbanized.
Municipalities, commerce, and industry are the chief use^s of water. The major source of water in the Coastal Plain is ground water. Sur face water is, however, a source of part of the supply for Annapolis. Substantial quantities of water are also used at installations such as the Army Chemical Center, the Naval Academy, and the Faval Engi neering Experiment Station.
Enormous quantities of water are stored in the sand anc1 gravel de posits and in associated clay and sandy clay of the Baltimore area. The logs of many drilled wells penetrating the Coastal Plain strata show that about 45 percent of the material consists of sand and gravel (Bennett and Meyer, 1952, p. 35; and Otton, 1955, p. 23). Assuming a porosity of 30 percent, a block of typical sediments 1 mile square and 500 feet deep would contain 14 billion gallons of water. Practically speaking, however, only a small amount of this stored wat?.r would be available to wells, because of the limitations imposed by the perme ability of the materials through which the water must move to reach the wells and by the specific yield, which is less than porosity, and because hydraulic gradients sufficiently great to move larg-^ quantities of water can be created only near wells of high yield. Even the best wells in the Coastal Plain of Maryland furnish only about iy2 mgd. The table on page F59 shows the water-bearing properties of the formations of the Coastal Plain.
Ground water in the Coastal Plain subarea occurs under both water- table and artesian conditions. Under water-table conditions, the ground water is unconfined, and the upper surface of tr. saturated zone is called, the water table. Under artesian conditions, the water is confined under pressure between relatively impermeable strata, com monly clay or sandy clay. The hydrostatic pressure in the confined

BALTIMORE AREA, MARYLAND F59
ea
18888888
^ 55
3 S
i ill 111*18*2
if.o 3 >,.13 os t * & *
9 C uM«2
IIItic d
QO
0 S OS gS 0ft«S»: S a
rs. »-c.*81-
o u
Q .
II
Lff'H'S 03S? * *(-« ^ ^
sigl ILII ItJll« S|aa| 3*-|sw »S S «
43 o9 jr S»?
lu ac ra
690-492 O 63 5

F60 WATER RESOURCES OF INDUSTRIAL AREAS
part of an aquifer is caused by higher water levels in the irtake area. An artesian aquifer is always full of water, except locally where heavy pumping may draw the cone of depression or cone of influence, below the top of the aquifer.
Water moves downdip and laterally from the area of intake, under lain chiefly by beds of sand and gravel of Cretaceous age, to areas of discharge beneath the Chesapeake Bay and along the low-lying estu aries adjacent to the bay. Thus, most of the water in the artesian aqui fers is in slow but continual motion from the areas of recharge (higher head) to areas of discharge (lower head). The rate of move ment of ground water through the aquifers, however, is extremely slow. According to Bennett and Meyer (1952, p. 108), ground water northeast of Baltimore is moving toward centers of pumping at a rate of about 110 feet per year, and these are accelerated rates caused by pumping. Nearer the centers of pumping, it is moving as ir uch as 700 feet per year.
The temperature of water from wells tapping the deposits of the Coastal Plain at depths below 50 to 75 feet tends to remain relatively constant throughout the year. This characteristic is desirable where the water is to be used for industrial cooling processes and for air con ditioning. The observed range in temperature is from 52 to 64° F and the average is about 58° F.
In general, ground-water temperatures rise with increasing depths below 50 feet. This rate of increase, known as the geothemal gradi ent, is about 1° F for each 60- to 100-foot increment of deioth in the Coastal Plain.
PATUXBNT FORMATION
The Patuxent formation, the oldest sedimentary deposits of the Coastal Plain in the Baltimore area, consists of sand, gravel, sandy clay, and clay laid down by streams on the eroded crystalline rock sur face during Early Cretaceous time. The sediments were deposited by streams draining the Appalachian and Piedmont highlands to the north and west. The Patuxent formation, one of the major water bearing units in Maryland, crops out along a belt 3 to 5 miles wide, which is roughly the route of the Baltimore and Ohio Kailroad. The sloping crystalline rock surface on which it rests dips generally south eastward at an average rate of 85 feet per mile. Locally, the slope of this surface is as much as 150 feet per mile, as in the HigHlandtown and Canton districts of Baltimore. The upper surface of the Patux ent dips southeast but at a rate of only 45 to 50 feet per mile. (See
BALTIMORE AREA, MARYLAND F61
plate 3.) The Patuxent formation is therefore wedge-shaped and is thinnest near its area of outcrop. In the vicinity of Baltimore its thickness, as shown by well borings, ranges from a few to as much as 300 feet. A few miles southeast of the area of this report, near Glen Dale in Prince Georges County, more than 400 feet of the formation was logged in a drilled well. Individual sand layers in the formation may attain a thickness in excess of 50 feet, although they are commonly somewhat thinner.
The Patuxent formation consists of a series of irregular beds of sand, sandy clay, and clay containing thin beds of sandstone cemented by iron oxide (hematite and limonite). Much of the sane1 is arkosic and contains disseminated white clay, chiefly kaolin. The beds of sand and clay are of various colors, chiefly yellow to white, tan, buff and light pink. Some of the clay is reddish ochre to blue or drab gray. Black lignitic material is commonly disseminated hi the beds of clay and sand.
The most important hydrologic property of the forms tion is its ratio of permeable sand and gravel to clay, sandy clay, and other rela tively impervious sediments. Bennett and Meyer (1952, p. 35) list many wells in the Baltimore area in which the logs show that an aver age of 49 percent of the material is sand and gravel. The proportion of sand and gravel to clay and related sediments decreases southwest of the Baltimore area toward the District of Columbia anc1 the Poto- mac Eiver (Otton, 1955, p. 23). The logs of several wells in the Potomac River valley indicate that only 29 percent of the material is sand and gravel. The transmissibility of the aquifers in the Patuxent formation and the yields of wells tapping the formation p,re signifi cantly lower in the Potomac River valley than in the Baltimore area.
OCCURRENCE OF GROUND WATER
Wells tapping the Patuxent formation in the Baltimore area, ex clusive of those for domestic purposes, yield from about £0 to 1,000 gpm. Several of the best wells are in the Fairfield and Sparrows Point districts of Baltimore, where the water-bearing sands are noderately thick and permeable and more elaborate wells are constructed. Gen erally, large-diameter wells tapping the formation in the outcrop area yield much less than those in more favorable areas. The average yield of six wells in the Laurel-Bowie area is only 68 gpm. With the exception of the Baltimore industrial area, the best wells reported in the Patuxent formation are at North Linthicum in Ann?. Arundel County (300 gpm) and at Edgewood in Harford County (400 gpm). However, it is likely that some of the water from the wells at Edge-

F62 WATER RESOURCES OF INDUSTRIAL AREAS
wood is derived from the overlying Pleistocene sand and gravel (Ben- nett and Meyer, 1952, p. 43).
The specific capacities of 54 wells ending in the Patuxent formation range from 0.3 to 19.6 and average 6.9 gpm per ft of drawdown. The maximum, 19.6 gpm per ft of drawdown, was reported for a 12-inch- diameter well at Fort Holabird in Baltimore. This well yielded 450 gpm but is no longer used. Coefficients of permeability and trans- missibility range widely in the Patuxent formation, probably because the sediments are not uniform. (See "Definitions of terms used," p. F99.) The coefficients of permeability range from 22 gpd per sq ft near Laurel to 1,430 gpd per sq ft at Sparrows Point. Coefficients of transmissibility determined from aquifer tests range from 600 gpd per sq ft at Laurel to more than 180,000 gpd per ft at Sparrows Point. Coefficients of storage range from 0.00001 to 0.0008, both limits occur ring in the Sparrows Point district.
WATER-LEVEL FLUCTUATIONS
The average water levels in seven wells tapping the Patuxent formation rose 14.30 feet in 13 years (1944-56), because many indus tries decreased their pumpage from the aquifer. (See following table.) Water levels were lower than those in 1944 in only 2 years, 1947 and 1948.
Cumulative change, in feet, in year-end water levels since 1944 in the Patuxent andPatapsco formations
Year
1944_ ___ ___.._.-_.___.._. ___ .__.._ __ ._..1945. ___ _.._._..._.__.___ _____ ..... ______1946... _ -.._............ _____ _._ ___ _ _1947. ____ ..__.__ __ .... __ ... _____________1948.. __ .......__._ _ . ___ .... ______ _1949... ........ ____________ . ____ ______1950. ______________________________ ___________1951_ _________________________________________1952. ____-.___._ ....... _ ._._.__________ ____1953_. _...-..._.....__________ _ _______ _ ___1954. _________________________________________1955. .-__-_.______._ _ _.......____________.__1956. _________________________________________
Patuxent formation
(7 index wells)
0. 00+ 10. 07+ 1.90 1. 12-0.68+ 4.31+ 9.39
+ 11. 10+ 8.58
+ 11.32+ 12. 85+ 10.57+ 14. 30
Patapsco formation
(3 index wells)
0.00+ 6.27+ 3.47-3.53-0.39+ 8.44+ 0.20+ 1. 14-2.20-0.94-5. 12-4.09-1.91
CHEMICAL QUALITY OF GROUND WATER
Bennett and Meyer (1952) give a comprehensive discussion of qual ity of ground water in the Baltimore industrial area. Pumping of

BALTIMORE AREA, MARYLAND F63
large amounts of ground water adjacent to estuaries has caused changes in the chemical character of water in some parts of the aqui fers. Their report includes 129 analyses of water from 112 wells, nearly all of which tap the unconsolidated deposits. Bennett and Meyer restricted the quality-of-water inventory largely to wells tap ping the Patapsco or Patuxent formations, which are the principal sources of ground water pumped for industrial use.
The collection of quality-of-water data subsequent to the 1952 study has been directed largely toward an inventory of uncortaminated sources of ground water in crystalline rock and sedimentary deposits outside of the immediate harbor area. The results of the chemical analyses of 20 water samples from aquifers in the Coastal Plain sub- area are given in the table on page F64.

Che
mic
al a
naly
ses
of g
roun
d w
ater
from
the
Coa
stal
Pla
in
[Ana
lytic
al r
esul
ts i
n pa
rts
per
mill
ion
exce
pt a
s in
dica
ted]
Loc
atio
n of
wel
lW
ell
dept
h (f
eet)
Dat
e of
co
llect
ion
Tem
pe
ra
ture
(°
F)Si
lica
(SiO
z)T
otal
ir
on
(Fe)
Cal
ci
um
(Ca)
Mag
ne
si
um
(Mg)
Sodi
um
(N
a)
Po
tass
i
um
(K)
Bic
ar
bona
te
(HC
Ch)
Car
bo
na
te
(CC
h)
Sul-
fa
te
(SO
O
Chl
o
ride
(C
l)
Fluo
- ri
de
(F)
Ni
tr
ate
(NO
s)
Res
i
due
of d
is
solv
ed
soli
ds
on
evap
or
a
tion
at
180°
C
Har
dnes
s as
CaC
Ch
Cal
ci
um,
mag
ne
si
um
Non
- ca
r-
bo-
nate
Car
bo
n di
ox
ide
(CC
h)
Spec
ific
co
n
duct
an
ce
(mic
ro-
mho
s at
25°C
)
pHC
olor
Patu
xent
form
atio
n (u
ncon
tam
inat
ed b
y sa
lt w
ater
)
Sout
heas
t Bal
timor
e 1.
Do.
i __
..........
Do..
.
...
Sout
hwes
t B
altim
ore.
Eas
t B
altim
ore
' ...
...
Do
....
....
....
...
Do
....
....
....
...
Mid
dle
Riv
er.
....
...
378
378
365
115
145
153
108
315
1-22
-44
2-14
-52
2-9-
456-
5-4
51-
25-4
65-
7-4
57-
8-5
57-
8-5
5
3-19
-54
57 55
7.3
8.5
7.3
8.5
7.1
8.6
6.4
0.01 .00
.01
.71 49 04
1.4
1.4 .9 1.4
1.0
4.1
3.7
1 9
0.8 .7 .5 g
1.0
1.7
1.4
1.2.
0
0. 5
3.7
5.3
16 132
0
Q
1.6
.3
5 6 6 24 6 10 10
0 0 0 0 0 0 0 0 0
1.6
2.0
3.5
5.0
7.4
20
1.4
9
9
3.0
2.5
4.5
7.2
20 14 6.5
3F
0.0 .0 .0 .0 .0 .1
1.0
9
1 .3 1.1
1.1
16 15 11.1
19»2
3 20 30 oo
<42
3 O
Q
7 6 4 7 10 46 20 19 17 14
2 26 13 7 g
24 25 13
29 27.2
28.5
45.8
49 4
127
131 85
.454
.339
.6
5.4
5.4
5.4
5.3
5.3
6.0
5.9
5.4
5.9
6.2
4 5 2 10 20
Patu
xent
form
atio
n (c
onta
min
ated
by
salt
wat
er)
Cen
tral
Bal
timor
e ....
Sout
h B
altim
ore .
....
.60 14
97-
8-5
57-
19-5
52.
44.
946
396
8 118
60 0
17
8
165
765
1690
14 2039
062
028
446
829
6050
906.
36.
32 5

Pata
paco
form
atio
n (u
ncon
tam
inat
ed b
y sa
lt w
ater
)
Do... ..
.
127
137
99
0
200
Af\
f\
4nn
8- 3
-43
6-15
-45
3-18
-54
7- 7
-55
7- 7
-55
10-2
2-45
6-30
-55
557.
75.
9
7.7
7.5
18.0
4.0
5.6
2.0
511
6.5
2.2
3.3
2.6
1.7
0.9
2.3
2.0
2.0
1 Q
LJ4 14 3 4
50.
91 4 4
20 6 40
10 10 8.0
8.0
0 0 0 0 0 0
2 .612 2.
63.
811 11
3.0
5.5
4.0
4.0
23 1.6
1.6
0.0 .0 .2 .6
0.0
8.8
1.2 .5 .4 .1 .2
36 «29 33 «36
16 9 18 8 14 15 12
14 0 6 6
20 8.0
71 42 45.2
35.7
102 46
.445
.7
6.1
5.7
5.6
5.8
5.8
5.9
6.2
8 2 5 1
Pata
paco
form
atio
n (c
onta
min
ated
by
salt
wat
er)
BS
-l-W
U............
7- 7
-55
735
Jt 10
04.
224
55.
517
517
590
13.
6220
i Res
ampl
es.
See
Mar
ylan
d D
ept.
of O
eol.,
Min
es, a
nd W
ater
Res
ourc
es B
ull.
4, p
. 113
.J M
anga
nese
(M
n), 0
.00
ppm
; cop
per
(Cu)
, 0.0
3 pp
m; a
lum
inum
(A
l), 0
.0 p
pm;
zinc
(Z
n), 0
.10
ppm
; pho
spha
te (
P(>4
), 0.
0 pp
m.
s Alu
min
um (
Al),
0.8
ppm
; lith
ium
(L
i), 0
.1 p
pm; m
anga
nese
(M
n), 0
.1 p
pm.
« Alu
min
um (
Al),
0.1
ppm
; bar
ium
(B
a), 0
.0 p
pm; l
ithiu
m (
Li)
, 0.2
ppm
.* M
anga
nese
(M
n), 0
.02
ppm
; lith
ium
(L
i), 0
.1 p
pm.
« Pho
spha
te (
PO4)
, 0.0
ppm
.' D
isso
lved
iron
(Fe
).

F66 WATER RESOURCES OF INDUSTRIAL AREAS
Salt-water contamination is common in parts of the Pa tuxent for mation in the Baltimore area. Twenty analyses given by Pennett and Meyer (1952) were selected as representing uncontaminated sources of water in the Patuxent formation. Averages of mineral constituents reported for these waters are given in table 6. Most of these analyses
TABLE 6. Minimum, maximum, and average concentrations of chemical substances in water from principal uncontaminated aquifers
[Results are given In parts per million except as indicated]
Silica (SiO_)_-_-_-._ _______Iron (Fe) ___________Manganese (Mn) _______Calcium (Ca)_ _____ ....
Sodium (Na) _________Potassium (K)._ ___ ..Bicarbonate (HCO3). ________Carbonate (COa) _______ __Sulfate (SO*).... . __ .....Chloride (Cl)... __ ______
Nitrate (NOs)«__. __ . _______Dissolved solids:
Calculated. ______________Residue on evaporation
at 180° C.. __ . __ ..
Nbncarbonate hardness as
Alkalinity as CaCOj. ________Specific conductance
microohms at 25° C.. pH ...........Color _____________
Crystalline rocks
Mini mum
24 .00 .02
19 7.2 5.9 0.5
60
1.0 2.5 .0.0
140 50
146 6.62
Maxi mum
49 8.0 .10
63 32 18 4.5
182
155 17
.21.1
398 290
6258.5
28
Aver age i
41 1.3
0833 13 9.6 2.9
119
31 8.1 .1.3
111
282
13
Patapsco formation
Mini mum
5.9 .04
1.7 .9
4.0
.6 1.6
.0
8
35.7 5.6 1
Maxi mum
7.7 18
3.3 2.3
20
12 23 .6
5.8
18
102 6.2 8
Average
This report
4.2
10
5.4 6.9
1.4
13
56.9
After Ben- nett 2
3.8
7.1
4.7 3.5 .2
4.2
35 15
__
Patutent formation
Mini mum
6.4 .00
.9
.5 1.6.3
5
.8 2.2 .0.1
19 4
27.2 5.3 2
Maxi mum
8.6 .94
1.4 1.7 2.8.8
24
7.4 20
.116
42 46
131 6.2
20
Average
This re
port*
7.7 .38
1.9 1.0
9
3.5 7.0
"if"
61.7
After Ben- nett s
8.4 5.0
1.9 1.2
} 3.9 7.1
5.8 1.7 .0
1.1
29 11
' Average based on results for 20 samples.s Does not include one analysis having 48 ppm nitrate (NOs).» Bennett and Meyer (1952).
are of water from wells in areas away from the highly industrialized sections of Baltimore. Other than the average for the iron content, which varies widely even locally, the average data reported for the two periods are strikingly similar.
Uncontaminated water from the Patuxent formation characteris tically is low in mineral content, very soft, and acidic on tl°. pH scale. Excessive iron content in some water from cased wells suggests that the water is corrosive to metal; otherwise, it is of excellent quality for general use.
Otton (1955), in describing the ground-water resources of the Coastal Plain of southern Maryland, reports as much as 227 ppm of dissolved solids for 33 samples of water from the Patuxent forma tion. The water varies widely in chemical composition. A few sam-

BALTIMORE AREA, MARYLAND F67
pies from the outcrop belt of the formation in northern Prince Georges and Anne Arundel Counties have a pH less than 7, a low content of dissolved solids, and a relatively high content of iron and manganese. The water is probably typical of the Patuxent formation, where this formation is not overlain by younger formations containing calcareous shell fragments. Water in the Cretaceous and Eocene aquifers changes markedly in character as it moves through strata con taining base-exchange minerals, such as glauconite or hydrated aluminosilicates.
USE OF GROUND WATER
Only in the Coastal Plain subarea are public supplies obtained from ground-water sources. The Anne Arundel County Sanitary Commis sion, created and authorized by the Maryland legislature in 1922, is the chief user of ground water for public supplies. During 1955, this commission maintained and operated six well fields in northern and central Anne Arundel County in which 15 wells tapping chiefly sand and gravel deposits of the Patuxent and other aquifers of Cretaceous age were used. During 1955, the well fields of the commission de livered an average of about 1.6 mgd. This pumpage represented an increase of about 57 percent since 1951. (See table 7.)
TABLE 7. Use of ground water by the Anne Arundel County Sanitary Commissionin 1951 and 1955
Well field
Linthicum Heights.. _____
Glen Burnle __________Harundale _ . ________
Pines-on-Severn ________
All fields.... ............
Number of wells
3
62121
15
Aquifers
formations.
do
do......................
Pum
1951 (gpd)
80,000
321,000468,00074,00079,00014,000
1,036,000
page
1955 (gpd)
3^ 000
691.00070-* 000in, ooo63,00021,000
1,632,000
Percent change
i-42
+115+50+49-25+78
+57
1 A/ter 1952, some consumers were supplied with water from the Olen Burnie well field
The U.S. military establishments are major users of grennd water in the Baltimore area. Although the use of ground water by these establishments has increased, the increase has not been a^ great, in proportion, as that of the sanitary commission. The w^lls of the military establishments tap the Patuxent, Patapsco, Rsritan, and Magothy formations. It is likely that some ground water used by the Army Chemical Center at Edgewood is obtained also from deposits of Pleistocene age. Pumpage figures for these users are given in table 8.

F68 WATER RESOURCES OF INDUSTRIAL AREAS
FIGUBE 27. Map showing location of industrial districts in the Baltimore area, Maryland. After Bennettand Meyer (1952).
TABLE 8. Use of ground water by military establishments in 1951 and 1955
Military establishment
U.S. Army Chemical Center. .
Naval Engineering Experi ment Station.
Number of wells
8 2 3
Aquifers
Patuxent _________Magothy and Raritan. ....Patapscoand Raritan. ....
Pumpage (grm)
1861
650,000 1,000,000
460,000
1966
820,000 1,090,000
620,000
Percent change
+26 +9 16
Bennett and Meyer (1952, p. 78-82) described in detail the use of ground water in the Baltimore area by industry prior to 1946. A detailed pumpage inventory of the Baltimore area was made in 1955 to bring their comprehensive summary up to date. (S^e table 9.) Districts for which data on pumpage are given are shown in figure 27, except St. Denis district, which is a few miles west of th°. map area, and North Baltimore district, which is the part of Baltimore north of Fayette Street.

BALTIMORE AREA, MARYLAND F69
TABLE 9. Use of ground water in the Baltimore industrial area in l&StS and 1955
District and user
Sparrows Point: Bethlehem Steel Co ____________VA Hospital _________________
Dundalk:
The Glidden Co _____________
Canton: Baugh Chemical Co ___________American Radiator and Standard Sani
tary Corp.
Back River: Eastern Stainless Steel Co ________
Highlandtown: Crown Cork and Seal Co _________Esskay Packing Co.... ______ . ......
Penna. Water and Power Co .............Monarch Rubber Co... ..................
North Balitimore:
Harbor: Chesapeake Paper Board Co .............Proctor and Gamble Manufacturing Co.. James Distillery Inc ___________
Mutual Chemical Co... .................
Fairfleld: Food and Machinery Co _________Bethlehem Steel Co ________ . ......Continental Oil Co. ....... ..... . ..F. S. Royster Guano Co. ................Maryland Drydock Co ...................American Oil Co .........................
St Denis: Calvert Distillery Co.... ................Monumental Dist. Co __________
Curtis Bay: U.S. Industrial Chem. Co.. .............Davidson Chemical Corp. ...............
Mathieson Chemical Co. ................All Baltimore industrial area. ..........
Aquifer
1 Patuxent and Patapsco / formations.
Patuxent formation- _ ..
Patuxent formation and Pleistocene deposits.
| Pleistocene deposits __ ~
1 Patuxent and Patapsco formations.
All aauifers.. ....... ......
1945 (mgd)
10.30
5.05
.50
2.00
2.80
.70
2.15
5.20
1.30
3.70
33.70
1955 (irgd)
12.13
4.68
.09
1.08
1.11
.30
.25
2.51
1.05
.53
23.63
Percent change
+18
-9
-82
-46
-60
-57
-88
-52
-19
-86
-30
Nearly all the major users of ground water in the Baltimore indus trial area tap the Patuxent and Patapsco formations. Although the reasons for the decline in ground-water use in the Baltimore area during the decade 1945-55 are complex and not known entirely, the major reason appears to be the high cost of maintaining anc1 operating wells which tap ground water contaminated with acid waste or with salty water from the bay. The high cost of replacement of these wells, the relatively short useful life of the pumps, well screens and'casings, and the ready availability of water from the Baltimore City public supply all have been factors that decreased the use of ground water. It is significant that the area of greatest decline in use hf <? been the Harbor, Fairfield, and Curtis Bay districts, which also hr,s been the area of greatest salt-water contamination (pi. 1).
The water users beyond the reach of the mains of the public supply systems in the Baltimore area are almost entirely dependent upon wells

F70 WATER RESOURCES OF INDUSTRIAL AREAS
and springs as a source of water. The average use per person in a rural household equipped with hot and cold running water and con taining a kitchen, laundry, and bath is 50 gpd (U.S. Public Health Service, 1950, p. 5). The population of the Coastal Plain subarea without access to public water supplies is about 60,000 about 40,000 in northern Anne Arundel County and 20,000 in the Coastal Plain segment of Baltimore County. The total use of ground water by this population is about 3 mgd.
ARUNDEL CLAY
The Arundel clay, of Late Cretaceous age, was named from ex posures in northern Anne Arundel County, where it crops out along an irregular belt from Baltimore southwest ward to tl ^ Patuxent River. The unit also extends nearly 20 miles northeast of Baltimore. It consists of a few to more than 200 feet of red, brov^n, gray, to bluish tough clay. The formation commonly contains disseminated lignitic material, nodules and concretions of ironstone, and irregular bands of iron-cemented sandstone or sandy gravel. Locally, the formation may contain sand lenses of moderate permeability, al though the lenses are uncommon and small. The formation is not regarded as an aquifer. It functions as a confining lay^r, or aqui- clude, separating the water-bearing sands of the Patuxert formation from those in the Patapsco. Figure 28 shows the geologj at the well field of the Anne Arundel Sanitary Commission at G-len Burnie. Here the Arundel clay separates the two major ground-water reservoirs, the Patuxent and the Patapsco formations.
PATAPSCO AND RARITAN FORMATIONS
The Patapsco and Raritan formations, also of Late Cretaceous age, overlie the Arundel clay throughout the Baltimore area. The two formations are similar in their lithologic and hydrologic properties, and for this reason are considered as a unit in this report. They crop out along a broad belt extending southwestward from the Gunpowder River in Baltimore County to the Patuxent River in Arne Arundel County. At some places the outcrop belt of both of the formations is more than 12 miles wide, and in many places the formations are cov ered with a veneer of sand, gravel, and clay of Pleistocer?. or Recent age. The formations consist of irregularly distributed b^ds of sand, gravel, sandy clay, and clay of continental origin derived mainly from the Piedmont highland to the west and northwest. The clay layers are commonly reddish brown, tan, or gray, and the sand layers are yellow, tan, or grayish white. Iron-stone bands and nodules are com mon in both the clay and the sand. The sand beds are commonly cross- bedded, arkosic, and, in places, clayey.

BALTIMORE AREA, MARYLAND F71
Patapsco formation Arundel clay
Patuxent formation Crystalline rocks
FIGTJBE 28.-Oeology at the well field of the Anne Arundel County Sanitary Commission at Glen Burnie,Md.
The combined thickness of the formations ranges from a few feet along the northwest edge of the outcrop to nearly 600 feet near Annapolis (fig. 29). In the vicinity of Glen Burnie, a few wells have penetrated more than 250 feet of the Patapsco formation. In general, the thickness of the units increases to the southeast.
The hydrologic character of the formations is indicated by the proportion of sand to clay. Of more than 10,000 feet of strata logged, about 30 percent consists of permeable sand and gravel or, about the same percentage as in the Patuxent formation exclusive of the Balti more industrial area.

F72 WATER RESOURCES OF INDUSTRIAL AREAS
Aquia, Mon mouth, and Matawan formations
Magothy formation
Raritan and Patapsco Arundel anc1 Patuxent formations formations and
crystalline rocks
FIGURE 29. Geology along the lower Severn River near Annapolis, Md
OCCURRENCE OF GROUND WATER
Yields of about 80 large-diameter wells in the Patapsco s.nd Karitan formations range from less than 50 to about 1,000 gpm and average about 210 gpm. In the Sparrows Point area, the average yield of several industrial wells tapping the Patapsco formation is 500 to 800 gpm (Bennett and Meyer, 1952, p. 65). Generally throughout the re mainder of the area, yields of more than 500 gpm are exceptional. The specific capacities of 55 wells range from 0.1 to 22.5 gpm per ft of drawdown. The well having the highest specific capacity is at Spar rows Point and yielded Y20 gpm in 1943.
Coefficients of permeability, as determined by aquifer tests, range from 320 to 1,400 and average about 850 gpd per sq ft. The maximum value was determined in the vicinity of Glen Burnie. Coefficients of transmissibility range from 24,300 to 38,300 and average about 31,600 gpd per ft. Coefficients of storage range from 0.00005 to 0.003. Both

BALTIMORE AREA, MARYLAND F73
the upper and lower limits were computed from tests in the Sparrows Point area.
WATER-LEVEL, FLUCTUATIONS
The history of water levels in the Patapsco formation is more com plex because pumpage is variable. Water levels in the Patapsco for mation rose substantially in 1945 and were still above 19M levels at the end of 1946. However, they declined slightly in 1947. This de cline changed to a rising trend in 1948, which continued through 1949. A downward trend began in 1952 and continued through 1954. Dur ing 1955 and 1956, water levels rose 3.2 feet, and the net decline in this aquifer was only 1.9 feet during the 13 years 1947-fO. Water levels in the three key observation wells tapping this aquifer appear to be affected chiefly by pumping from wells in the Curtis Bay-Fair- field and Sparrows Point areas.
The year-end water-level record of one well tapping the Patapsco formation at Crownsville in Anne Arundel County showec1 a net de cline of 5.5 feet during the 7-year period 1949-56. This c^cline ap parently is the result of the increased use of ground water from the Patapsco formation at the Crownsville State Hospital.
CHEMICAL QUALITY OF GROUND WATER
Water from the Patapsco formation is soft, low in mineral content, high in iron locally, and similar in mineral quality to thai from the Patuxent formation (table 6).
Otton (1955) shows that high iron content is typical of acid snlfate water in the Cretaceous strata in northern and central Anm Arundel and Prince Georges Counties. The available analyses show that in the southern part of the Coastal Plain, extending northwarc1 from the vicinity of Annapolis to near the mouth of the Patapsco Eiver, wells tapping sands of Cretaceous age commonly yield water having an iron content of more than 10 ppm (pi. 1). Elsewhere in northern Anne Arundel County, iron commonly exceeds 1 ppm in the ground water.
USE OP GROUND WATER
Large quantities of water are taken from the Patapsco formation for industrial and public supply use. (See tables 7, 8, and 9.) In addition to industries listed in table 16 the National Plastics Products Co. at Odenton in Anne Arundel County uses water from the Patapsco formation. During 1951, this plant used an average of 1.0 ngd from wells tapping this formation at a depth of approximately 170 feet. By April 1956 the average pumpage of this concern had increased to 1.2 mgd.
MAOOTHY FORMATIONThe Magothy formation of Late Cretaceous age is exposed along
an irregular southwestward-trending belt extending from Sillery Bay

F74 WATER RESOURCES OF INDUSTRIAL AREAS
near the mouth of the Magothy Eiver to the vicinity of Priest Bridge on the Patuxent Eiver. The formation thins to the southwest, and in Princes Georges County only a few outcrops have beer noted. It extends northeastward across the bay and has been recognized in deep wells as far north as Long Island. It consists of lignitic or carbonaceous grayish-white to yellowish sand interspersed with layers of clay. The sand is commonly coarse and cross-bedded ancf may grade horizontally into clayey sand, sandy clay, or clay. Pyrito and glau- conite are common in the sandy layers. The logs of 12 wells pene trating the formation in Anne Arundel County show that about 85 percent of it consists of sand and gravel. The Magothy formation ranges in thickness from a few feet near its northernmost limit of exposure to as much as 130 feet at Annapolis. Commonly at or near its outcrop it is 30 to 70 feet thick.
The yields of 17 large-capacity wells tapping the Magcfrhy forma tion range from 20 to 1,000 gpm and average about 200 gpm. The two best wells are at the Annapolis Water Works a few miles west of Annapolis. One of these wells is 248 feet deep and contains 50 feet of screen opposite clean permeable sand. When the well was com pleted in 1947, its specific capacity was 10 gpm per ft of drawdown, the largest measured in any well tapping this aquifer, ^he specific capacities of 13 of the most productive wells in the formation range from 0.3 to about 10 and average about 3 gpm per ft of drawdown.
Coefficients of permeability, as computed from aquifer tests, range from 370 to 2,960 gpd per sq ft. The maximum value was determined from a test on a 232-foot well at the Crownsville State Hospital. The minimum value was determined from a recovery test on a 307-foot well at the U.S. Naval Academy. Coefficients of tran^missibility range from 23,100 to 74,200 gpd per ft. The maximuir value was determined from a test of the well at the Crownsville State Hospital. Coefficients of storage range from 0.00003 at Crownsville to 0.005 at Sandy Point. The U.S. Naval Academy is the major us^r of water from this formation. (See table 8.)
MONMOUTH FORMATION
The Monmouth formation, of Late Cretaceous age, crops out along an irregular belt a few miles wide extending southwesiward from Gibson Island to the Patuxent Eiver where.it is crossed by U.S. Eoute 301. The formation, of marine origin, consists of grayish-black to black micaceous, glauconitic sandy clay. Although formerly thought not to be an aquifer, some wells have been drilled which tap sandy lenses in the formation. Generally the lenses are not larg0-. In some places the formation contains no water-bearing zones. In Anne Arun del County, the Monmouth formation ranges in thickness from 50 to

BALTIMORE AREA, MARYLAND F75
80 feet and dips gently southeastward at a rate of about 20 feet per mile.
The maximum yield reported from the few wells in the Monmouth formation is 20 gpm. One such well drilled in 1943 at the now aban doned Sandy Point ferry terminal, had a specific capacity of 0.1 gpm per ft of drawdown and yielded 20 gpm. The well was abandoned because the water was of poor quality.
Although no tests of the Monmouth formation as an aquifer were made within the area of this report, test data are available for a drilled well at Rock Hall in Kent County across the Chesapeake Bay. Analysis of this test indicates a coefficient of permeability of 150 gpd per sq ft. The coefficient of transmissibility determined from the same test was 4,500 gpd per ft and the coefficient of storage v^as 0.0005. In general, the Monmouth formation is a much poorer aquifer than the underlying Magothy or Patapsco formations.
PLEISTOCENE AND RECENT DEPOSITS
The Pleistocene and Recent deposits in the Baltimore area have been divided into two units called upland and lowland deposits, by Bennett and Meyer (1952, p. 68). The lowland deposits, are those lying below an altitude of about 50 feet above sea level. Tlose above this altitude are classed as upland deposits. The upland deposits consist' chiefly of coarse sand, gravel, and silty sand anc1 underlie only a small part of the area of this report. They are, therefore, relatively unimportant with regard to the availability of ground- water supplies and are not discussed further.
The lowland deposits, consisting of clay, sand, gravel, ar i cobbles underlie an extensive area along the estuaries of Baltimore and Anne Arundel Counties. They are largely estuarine or marine in origin and range in thickness from 0 to 150 feet. The basal part of the deposits commonly consists of coarse gravel and sand overlain in places by clay, which may effectively seal the gravel from cor tact with the brackish water of the estuaries. Bennett and Meyer (1952, p. 69) report that the Pleistocene gravel is more than 60 feet thnk at the Aberdeen Proving Ground.
The yields of 47 wells tapping the Pleistocene and Recent deposits range from 15 to 1,000 gpm and average about 146 gpm. The best well tapping the deposits (1,000 gpm) is in the valley of the Patapsco River near Relay. It is a collector-type well, 33 feet deep, which fur nishes water for a distillery. The specific capacities of 13 wells tapping the deposits range from 1.4 to 66 and average 16 gpm per ft of draw down. The maximum specific capacity was determined in 1943 on a 58-foot well, 10 inches in diameter, at Havre de Grace in southeastern
690-492 O 63 6

F76 WATER RESOURCES OF INDUSTRIAL AREAS
Harford County. The permeability of the deposits at this locality is exceptionally high.
Coefficients of permeability range from 900 to 6,300 gpd per sq ft, Coefficients of transmissibility range from 14,500 to 200,000 gpd per ft. The maximum value of 200,000 was determined at the 58-foot well at Havre de Grace. The coefficients of storage of the sand and gravel in the Pleistocene deposits in the Baltimore area are not known. Stor age coefficients probably range from 0.0001 to 0.005 in areas where artesian conditions prevail.
Although the Pleistocene deposits are among the most permeable in the Maryland Coastal Plain, the chief concern in using them is the possibility of salt-water encroachment should they be pumped heavily. Such encroachment has occurred in the Baltimore harbc~ area and could readily take place in other areas, where the geologic conditions are similar, if the head in the aquifer is drawn below sea level by heavy pumping. This subject is discussed in detail by Bennett and Meyer (1952, p. 124-172). Some industrial water is obtained from these deposits. (See table 9.)
SAWMILL CREEK
Sawmill Creek, in northern Anne Arundel County, drains a small Coastal Plain area (5.1 square miles) underlain chiefly by sand and clay of the Patapsco formation. The topography is slightly rolling and, in a few places, nearly level. The maximum elevation is about 180 feet.
DISCHARGE
The most unusual streamflow record in Maryland probaHy is that of Sawmill Creek. The gage-height hydrograph for the 8-year record May 1944 to September 1952 has broad peaks and slow recessions, indi cating a ground-water source for a large part of the discharge. The range in stage is remarkably small in comparison with other streams; the maximum range during the period of record was 3.05 feet. The average flow for the 8 years 1945-52 was 5.34 mgd (8.26 cfs). The minimum daily flow was 2.33 mgd (3.6 cfs) on September 7-8, 1950, and the lowest monthly flow was 3.29 mgd (5.09 cfs) in October 1947. The maximum daily flow was 101 mgd (157 cfs) on September 1,1952.
The flow per square mile for Sawmill Creek is greater than that of any stream in the report area (fig. 30). However, because of the small drainage area, the flow of Sawmill Creek is much less than that of some of the larger streams.
Sawmill Creek is not regulated above the gaging station. Some water, however, is stored in a small pond, Wagners Pond, a short dis tance below the station.

BALTIMORE AREA, MARYLAND F77
y DISCHARGE, IN MILLION GALLON
PER SQUARE MILE
O O OOOO "- W CO 4
Ko cj bicn-Njbo o b b c
x\^ Xr^N
^^f
GAGING
2**.^.
EXPLANATK
STATION
^^^**"*"^i. L *~"
^^2*
..^
b
"* -
DRAINAGE AREA, SQUARE MILES
Sawmill Creek at Glen Burnie Bacon Ridge Branch at Chesterfield North River near Annapolis
i i
5.1 6.92 8.5
xamp neaexpceec
i- QSFlow
.»,. _N
S
e: Flow ' Annaf acted to 1 0.29 n percent isadjus period
" .
^£^7
of Norl jolis n equa
igd pr of th
,ted to (1896
_
h River nay be or ex-
r sq mi ? time, the 57- -1952)
"""" .
--...._ -^"--v^ ~- -_
x>>^^
_. _ __
"^12 5 10 20 30 40 50 60 70 80 90 9" 98 99
Q PERCENT OF TIME DISCHARGE EQUALED OR EXCEEDED THAT SHOWN
FIGURE 30. Duration curves of daily flow for three streams in the Coastal P'ain.
In 1957 several deep wells were drilled on Dorsey Road within the Sawmill Creek basin. These wells furnish water for GHn Burnie from the Patapsco formation near its outcrop area. Sawmill Creek has not been gaged since 1953, and present discharge mar show the effect of recent heavy pumping from the nearby well field. Water is not known to be diverted from Sawmill Creek for use.
CHEMICAL, QUAUTY OF WATER
During the water year 1954 55, two chemical analyses r^ere made of water from Sawmill Creek (table 10). These show the r-ater to be slightly acidic and to be low in dissolved solids and hardness. The iron content of both samples was low. Nitrate, sometimes ar indicator of pollution, was moderately high (15 ppm) in the sample collected on December 8, 1954.
BACON RIDGE BRANCH
Bacon Ridge Branch drains an area underlain by sedimentary de posits, chiefly beds of marine sandy clay and sand of Cretaceous and Eocene age. The topography is undulating to hilly in places. Some of the smaller drains and tributaries are ravinelike. Elevations in the basin range from sea level to approximately 180 feet above sea level.
Bacon Ridge Branch at Chesterfield (station 23, pi. 1) v^as gaged from November 1942 to September 1952. Records for the 6.92 square- mile drainage area above the station show a 9-year (1944 52) average flow of 6.72 mgd (10.4 cfs). The minimum daily flow was 1.94 mgd (3.0 cfs) during August 1943, and the lowest average monthly flow was 2.10 mgd (3.25 cfs) in August 1943. All records for ttis station include about 0.19 mgd of sewage effluent added to the stream at the Crownsville State Hospital. The low-flow frequency data (table 2)

F78 WATER-RESOURCES OF INDUSTRIAL AREAS
e '8
5:
a
i B1? I§ soo j^ in.
111!
!«I
111
38
e5 '
.
-*ooCBCJ
CJCJ
S r>- i-<e> '
00e> '
oco 06=0
HOO
>dco
ce.0 osoi
o
00
CO 10
sss
C-JO SON
IN CO
0 '
oo eoio
oo o rfco'
o
8J5
II
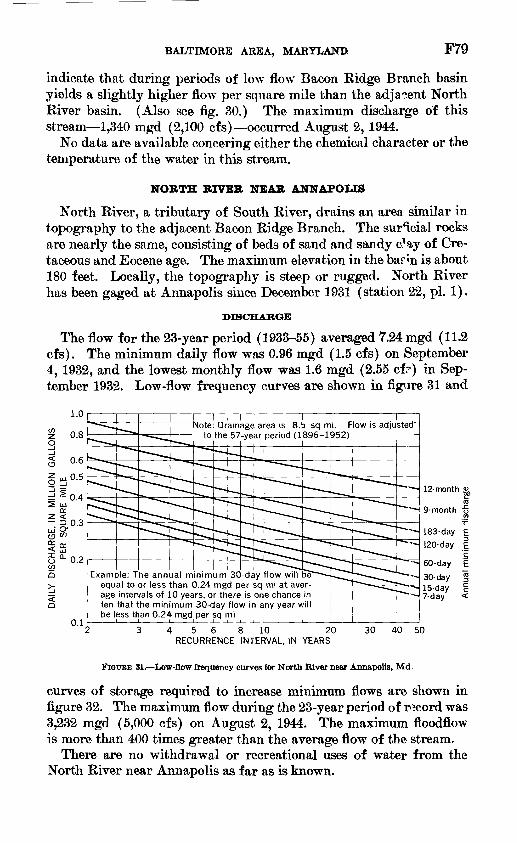
BALTIMORE AREA, MARYLAND F79
indicate that during periods of low flow Bacon Ridge Branch basin yields a slightly higher flow per square mile than the adjacent North River basin. (Also see fig. 30.) The maximum discharge of this stream 1,340 mgd (2,100 cfs) occurred August 2, 1944.
No data are available concering either the chemical character or the temperature of the water in this stream.
NORTH RIVER NEAR ANNAPOLIS
North River, a tributary of South River, drains an area similar in topography to the adjacent Bacon Ridge Branch. The sur'icial rocks are nearly the same, consisting of beds of sand and sandy e'ay of Cre taceous and Eocene age. The maximum elevation in the bar in is about 180 feet. Locally, the topography is steep or rugged. North River has been gaged at Annapolis since December 1931 (station 22, pi. 1).
DISCHARGE
The flow for the 23-year period (1933-55) averaged 7.24 mgd (11.2 cfs). The minimum daily flow was 0.96 mgd (1.5 cfs) on September 4, 1932, and the lowest monthly flow was 1.6 mgd (2.55 cf?) in Sep tember 1932. Low-flow frequency curves are shown in figure 31 and
i.o
0.8
0.6
0.5
|ffi 5^ 0.2
0.1
i i i i n i r i [ n Note: Drainage area is 8.5 sq mi. Flow is adjusted"
to the 57-year period (1896-1952)
Example: The annual minimum 30-day flow will be equal to or less than 0.24 mgd per sq mi at aver-- age intervals of 10 years, or there is one chance in ten that the minimum 30-day flow in any year will be less than 0.24 mgd per sq mi
12-month
9-month S
183-day E
120-day |'c
60-day E
30-day 115-day §7-day <
4 5 6 8 10 20 RECURRENCE INTERVAL, IN YEARS
30 40 50
FIGUBE 31. Low-flow frequency curves for North River near Annapolis, Md
curves of storage required to increase minimum flows are shown in figure 32. The maximum flow during the 23-year period of record was 3,232 mgd (5,000 cfs) on August 2, 1944. The maximum floodflow is more than 400 times greater than the average flow of the stream.
There are no withdrawal or recreational uses of water from the North River near Annapolis as far as is known.
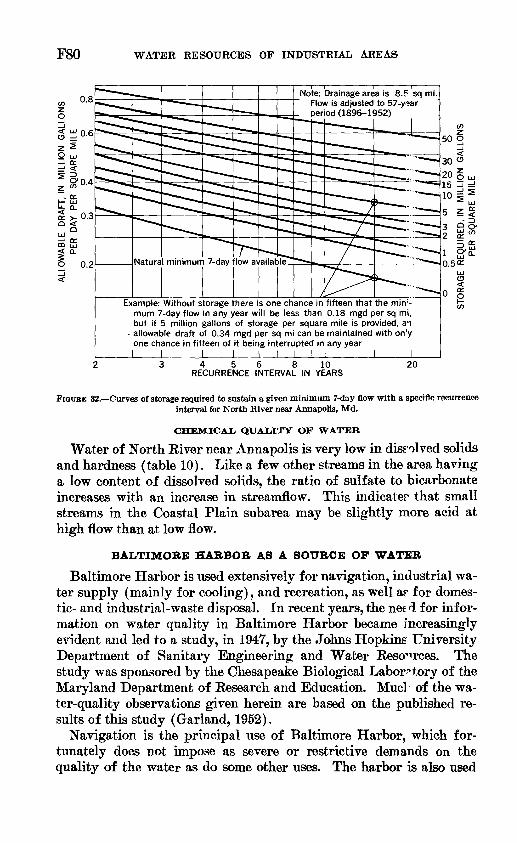
F80 WATER RESOURCES OF INDUSTRIAL AREAS
0.8
0.3
I"
q 0.2
Note: Drainage area is 8.F sq mi. Flow is adjusted to 57-y?ar period (1896-1952)
Example: Without storage there is one chance in fifteen that the min ; - mum 7-day flow in any year will be less than 0.18 mgd per sq mi, but if 5 million gallons of storage per square mile is provided, an
- allowable draft of 0.34 mgd per sq mi can be maintained with onfy one chance in fifteen of it being interrupted in any year
I I_____I I I I I \ I______I I
trt
50 g
30 &
is rj 10 §5 z
3 2 2 CE
1 ^* 0.5^
LUC3
n a
456 8 10 RECURRENCE INTERVAL IN YEARS
20
FIGURE 32. Curves of storage required to sustain a given minimum 7-day flow with a specific recurrence interval for North River near Annapolis, Md.
CHEMICAL QUALITY OF WATER
Water of North Kiver near Annapolis is very low in diss olved solids and hardness (table 10). Like a few other streams in the area having a low content of dissolved solids, the ratio of sulfate to bicarbonate increases with an increase in streamflow. This indicator that small streams in the Coastal Plain subarea may be slightly more acid at high flow than at low flow.
BALTIMORE HARBOR AS A SOURCE OF WATER
Baltimore Harbor is used extensively for navigation, industrial wa ter supply (mainly for cooling), and recreation, as well ar for domes tic- and industrial-waste disposal. In recent years, the need for infor mation on water quality in Baltimore Harbor became increasingly evident and led to a study, in 1947, by the Johns Hopkins University Department of Sanitary Engineering and Water Resources. The study was sponsored by the Chesapeake Biological Laboratory of the Maryland Department of Research and Education. Mucl of the wa ter-quality observations given herein are based on the published re sults of this study (Garland, 1952).
Navigation is the principal use of Baltimore Harbor, which for tunately does not impose as severe or restrictive demands on the quality of the water as do some other uses. The harbor is also used

BALTIMORE AREA, MARYLAND F81
as a disposal basin for millions of gallons of domestic and industrial wastes daily, a practice that has influenced industrial development of the area.
Garland (1952) classifies waste loadings into three bro^d groups: pollution contributed by tributary streams, domestic sewage, and industrial waste. The aggregate effect of waste loadings, both natural and artificial, contributed by tributary streams was evaluated from estimates of BOD (biochemical-oxygen demand) and main-stream discharge. BOD of tributary streams totaled about 8,000 pounds per day during the warm seasons covered by the study. (See table 11.)TABLE 11. Distribution of known biochemical oxygen demand (BOD) loading to
Baltimore Harbor, 1950 [Based on data from Garland (1952)]
Source
Antecedent natural and artificial pollution from tributary streams. . Raw and treated domestic sewage.... ________________
Total _ ........ __ ..... ___ .... _ .............. _ ......
5-day 20°C BOD
(pounds per day)
8,200 16,70031,000
55,900
Population equivalent 1
50,000 100,000180,000
330,000
Percent of total
15 3055
100
1 Population equivalent is useful to establish a common denominator for certain types of vaste discharges. Studies have shown that in the United States the average daily per capita sewage discharge of 5-day 20°C BOD is about 0.17 pound. From this figure it is possible to convert quantities of BOD to e-juivalent popu lation and vice versa.
At the time of Garland's study, Back Eiver sewage-treatment plant served a population estimated to be 976,000. Effluent flow from this plant was about 130 mgd. Waste loadings from raw ar-i treated domestic sewage equaled a BOD of nearly 17,000 pound? per day (table 11). Improvements effected as part of the long-range sewerage program are expected to reduce the BOD by about 9,000 pounds per day or about one-half the loading observed during the 1050 study. Increased sewage flow however, is expected to partly offset the im provement, so that the BOD will be about 14,000 pounds by 1970.
The BOD of Baltimore Harbor in general is low, normally less than 4.0 ppm. (See following table.) Appreciable oxygen deficiencies resulting from pollution occur principally in the innermost sections of the Harbor and during summer.Summary of selected chemical characteristics of water, Baltimore Harbor, 1947-49
[Based on data from Garland (1952) for chloride-sampling points in Patapsco Rive* (pi. 1)]
Constituent or characteristicRange
5-day, 20° C BOD '______.___ppm_. Dissolved oxygen (DO)
percent saturation.- Iron (Fe)_ _.__._.______ __.___ppm__
Maximum
2. 1 - 10. 5
29 -190 . 53-140
Median
1. 1- 3. 5
3 -99 . 29-11. 18
Minimum
1. 0 - 2. 5
0 -87 . 00- 1. 40
1 Summer BOD only.

F82 WATER RESOURCES OF INDUSTRIAL AREAS
The BOD loading from industries surveyed totals mori than that from all other waste categories combined. Petroleum products, coke, gas and allied byproducts, and baker's yeast were principal sources of BOD.
Producers of pigment, iron and steel products, and fertilizers con tribute daily large quantities of solids and several hundred tons of acids to the harbor estuary. Industrial-waste discharges to the harbor are predominantly acidic, either as acids or products of the hydrolysis and oxidation resulting from pigment and metal-pickling operations as for example, waste iron sulfate (FeSO4 -7H2O). Alkrline indus trial wastes are few. Thus reaction with natural stream alkalinity affords the only significant neutralization of acidic waste.
CHLORIDE: DISTRIBUTION IN WATERGarland (1952) states, "An almost limitless variety of salinity dis
tribution can develop within the Baltimore Harbor as a result of the complex interplay of forces due to tides, winds, and rrTer runoff." Examination and evaluation of salinity data must consider that com-
10,000
8000
6000
O 400013
2 2000
v> 0ct£lO,000z
g 8000 Ct
I 6000 U
4000
2000
T 1 I i i i r
Point 3
i i i i i I 1 i i i i i i i i, i I
L I I I I I I I I I
1948 1949
FIGUEE 33. Monthly chloride concentrations in main channel of Patapsco River, Baltimore Harbor, at sampling points 3 and 10 (pi. 1), June 1948 to November 1949.
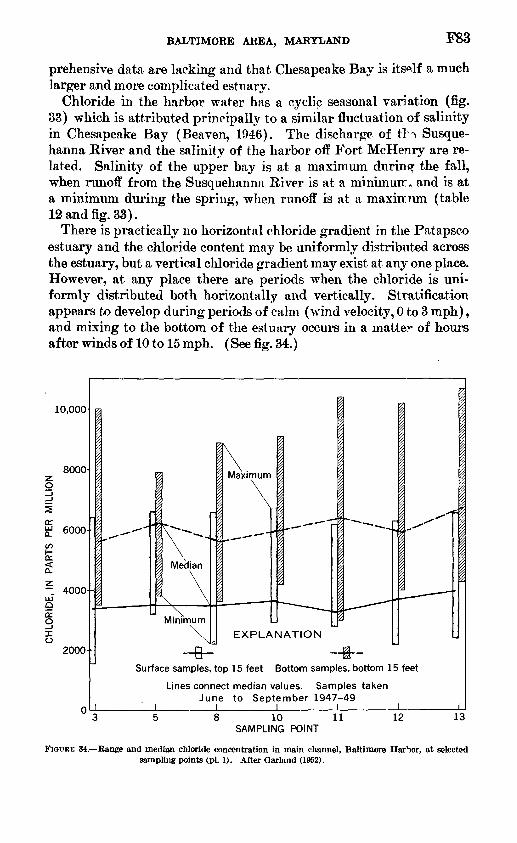
BALTIMORE AREA, MARYLAND F83
prehensive data are lacking and that Chesapeake Bay is itself a much larger and more complicated estuary.
Chloride in the harbor water has a cyclic seasonal variation (fig. 33) which is attributed principally to a similar fluctuation of salinity in Chesapeake Bay (Beaven, 1946). The discharge of tH Susque- hanna Kiver and the salinity of the harbor off Fort McHenry are re lated. Salinity of the upper bay is at a maximum during the fall, when runoff from the Susquehanna River is at a minimuir. and is at a minimum during the spring, when runoff is at a maxiirnm (table 12 and fig. 33).
There is practically no horizontal chloride gradient in the Patapsco estuary and the chloride content may be uniformly distributed across the estuary, but a vertical chloride gradient may exist at any one place. However, at any place there are periods when the chloride is uni formly distributed both horizontally and vertically. Stratification appears to develop during periods of calm (wind velocity, 0 to 3 mph), and mixing to the bottom of the estuary occurs in a matter of hours after winds of 10 to 15 mph. (See fig. 34.)
10,000
8000-
6000-
- 4000 to
E o
o2000-
\-B-
Surface samples, top 15 feet Bottom samples, bottom 15 feet
Lines connect median values. Samples taken June to September 1947-49
8 10 SAMPLING POINT
11 12 13
FIGURE 34. Range and median chloride concentration in main channel, Baltimore Harbor, at selected sampling points (pi. 1). After Garland (1952).

F84 WATER RESOURCES OF INDUSTRIAL AREAS
TABLE 12. Observed chloride concentration, temperature, and pH in Baltimore Harbor during summers of 1947-49
[Station: T, surface; B, bottom; number corresponds to location of station shown on l\. 1. Observations made June to September after Garland (1952)]
Station Maximum Median Minimum
Observed chloride concentration, parts per million
1-T_ ___________________________________B_ ___________________________________
2-T __ _________________________________B___. ...... ._.._ __ . _ .... _ _.
3-T______ ______B__ __________________________________
4-T_ ___________________________________B_ ___________________________________
6-T_ --_------_-_________-_-_____-___.__B_ _---_--______-____________-._______
6-T_ ______________________________ -----B_ ___________________________________
7-T_ ___________________________________B_ ________________ ..____._______-____
8-T_ ___________________________________B. ___________________________________
9-T_ -__---___-_-_._____________________B_ ___________________________________
10-T_ __________________________________B_-___-__-__-_.___ __ _ ___________
11-T- __________________________________B_ __________________________________
12-T. __________________________________B_ __________________________________
13-T_ __________________________________B. _-_-_____-___--_____.___..______-_
6,6006,8006,5006,7006,400
10, 0006,5006,6006,6007,9005,9007,4006,30011,8006,6008,9008,5006,6006,7009, 1006,200
10, 4006,300
10, 2006,600
10, 700
3, SCO4, OCO2, SCO3, 6CO3,4(05, 6CO3, 3CO3, SCO3, 5CO6, 2CO3, 4CO4, SCO3, 4CO5, 6CO3, 5CO5, 6CO3,2003,4003, 6CO6,0003, SCO6, 4CO3, 7CO5,9004,0006,700
2,3003,300
9001,8001,5003,5002,5003, 1003,2003,8002,9003,0003,0003, 7002,2003,6002,4003,1002,9004,2002,8003, 0002,2004,0002, 4004,300
Observed temperature, °F
1-T_. __________________________________B_ -_-_-___-__-______________--__-____
2-TB- ___________________________________
3-T_._-_- ___ ____ _ ... -._-__--- _ __B_ _ __________________________________
4r-T_ ________________________ ___________B______ __ _ ____ _______________ _ __
5-T_ __--__--__-_--__._-_____. __________B- _ _--_-__-____-___-_________---_--_-
6-T_ __________ _________________________B.. ...................... ............
7-T. ...................................B_ ___________________________________
8-T_ -. _ _. _--_ _B_ _-__________--_____________._-_--_-
9-T_ ___________________________________B-__-_-____--_________-_____-_ -_-_._-
10-T_ __________________________________B_____ _______ _ ___ _______
11-T_ _---_____-__-_______-_-____------_B_ __-_.___--________-_-______----___
12-T____ ______ __________ ___ ___ _B_ __________________________________
13-T. __________________________________B____.____ __________________________
8482868286828682849284828281848284848482818182818281
7777797579777777777577757777777579797775757577757575
6868666870646868686868687063686368726866666166636663

BALTIMORE AREA, MARYLAND F85
TABLE 12. Observed chloride concentration, temperature, and pH in Baltimore Harbor during summers of 1947-49 Continued
[Station: T, surface; B, bottom; number corresponds to location of station shown on pi 1. Observations made June to September after Garland (1952)]
Station Maximum Median Minimum
Observed pH
1-T...... ______________________________ 7.4B._____________________________ 7. 2
2-T____________________________________ 7. 5B____________________________________ 7.7
3-T__._________________________________ 7. 6B..__________________________________ 7. 7
4-T..._________________________________ 7. 1B____________________________________ 7.8
6-T____________________________________ 7.5B____________________________________ 7.0
6-T_.__________________________________ 6.3B____________________________________ 7.2
7-T____________________________________ 6. 6B____..__...._..__.___.__..__ . . ... 7.0
8-T____________________________________ 7. 6B_ ________ ___________________________ 7.7
9-T__________________________ _ _ _____ 7.2B__________________________ _ _ _____ 7.6
10-T. __________________________________ 8.0B___________________________________ 7.7
11-T_____________________________ _____ 8.0B_______________________ _ _ _ _____ 7.8
12-T._________ _ _ __ _ _ _ 8. 1B______ ___ 7.9
13-T___________________________________ 8. 5B_____________________ ______ ___ 8.3
6.9 6.8 6.8 6.8 6.8 6.85.75.8 7.0 6.7 3. 8 5.0 3.9 5. 4 6.7 6.7 5.8 6.8 7. 3 7.0 7.8 7.4 7.7 7.3 7.7 7.4
6. 7 6.7 6.6 6.6 6.4 3. 1 2.5 6.6 6.3 3.4 3. 1 3.5 2.8 5. 3 3.6 3.9 4.8 6.6 6.4 7. 1 6.5 7. 1 6.6 7.0 6. 6
WATER TEMPERATURE
Water temperature in Baltimore Harbor closely parallels local air temperature. Garland (1952) reports that the inner harbor water is commonly 2° to 4° F warmer than that in the outer harbor, probably because of less mixing with the cooler bay water and industrial use of the inner harbor water. During spring and summer, the temperature of water in the bottom of the main channel does not rise as quickly as that of water near the surface. In the main channel, differences of as much as 12° F, between surface and bottom temperatures were measured. Ordinarily, however, the differences were less th-Mi 5° F.
The median summer (June to September) surface and bottom tem perature of water for the period 1947-49 ranged from abo^t 75 to 79° F for all stations. (See table 12.) However, maximum of 86° F were observed in the inner harbor. The harbor freezes over at out once every 10 years.
pH, ALJKALJNITY, AND ACIDITY OF WATER
Water in the harbor normally is alkaline on the pH scale, averag ing about 50 ppm alkalinity as CaCO3 (Garland, 1952). The harbor

F86 WATER RESOURCES OF INDUSTRIAL AREAS
survey showed that variation in pH of the water occurs principally in the highly industrialized Curtis Bay-Fairfield area, on Colgate Creek, and at Sparrows Point.
At the mouth of Colgate Creek, pH values less than 4.0 were ob served nearly one-third of the time. Comprehensive sampling of Colgate Creek during the summer of 1948 showed that pH values for the entire stream were about 3.0. Values of pH in this range indicate high acidity, which would be toxic to most fish (California Water Pol lution Control Board, 1952, p. 167).
About half of the water samples collected in Curtis Bay had a pH less than 5.0, and approximately half of these were less than 4.0, which is in the range of free mineral acid. Dilution by the alkaline water of the main channel was sufficient to neutralize acid loadings. In gen eral, the pH of the main estuary water remained near the neutral point and ranged from about 6.3 to 8.5. (See table 12 and the following table.)
Trend in pH of surface water, Baltimore Harbor l
12-month period August to July
1940-41 1943-44 1945-46 1949-50.
Percent of time pH was equa1 to or less than stated value
7.0
95 96 97 98
6.0
54 82 88 89
5.0
4 50 58 62
4.0
0 13 19 21
1 Curtis Bay at Pennington Avenue Bridge; from daily records of E. I. du Pont de N«mours and Co.
OTHER CHEMICAL. CHARACTERISTICS OF WATE"*
Garland (1952) states that harbor water normally contains about 2 ppm of iron except in the vicinity of Curtis Bay, Colgate Creek, and Bear Creek, where the iron concentration is normally about 10 ppm but sometimes exceeds 100 ppm owing to concentrations of iron-bear ing (ferrous sulfate) waste. The chemistry of iron as a pollutant in harbor water is as follows: Ferrous sulfate in waste discharges to the harbor is hydrolyzed to hydrous ferric oxides and sulfuric acid; also, the ferrous ions are oxidized by dissolved oxygen in the water to the trivalent state, principally as the sparingly soluble ferric hydroxide. When the ferric hydroxide floe reaches the organic sediments accumu lating on the river bottom, it is placed in a reducing environment hi which the ferric ion is reduced to the more soluble ferrous form. Later, the ferrous iron in solution is exposed to air in the upper layers of water, once again oxidized by dissolved oxygen to the insoluble tri valent form, and the cycle is repeated.

BALTIMORE AREA, MARYLAND F87
Garland concludes that pollution has been intensified during the past two decades. Although deterioration of water quality is more evident in periphery water than in the main channel, the downward trend in quality is general. Increasing industrial production in the area will largely determine trends in quality, as harbor pollution by domestic sewage is being reduced by increasing treatment capacity.
IXUSHING OF THE ESTUARY
The flushing of Baltimore Harbor is extremely complex. Three principal flushing forces are the Patapsco River, tides, t nd wind. Flushing time at Baltimore Harbor during summer is slightly more than 100 days, not including important local wind effects. Less time is required in summer than in winter because of seasonal distribution of winds.
SALINE-WATER USE
In December 1955, a study of 19 of the larger industrial plants in Baltimore Harbor was made to determine how much saline water was being pumped from the Patapsco River. The following data sum marizes the results obtained:
Average pumpage Locality of saline waterNorthwest Branch:
North side______________________________________ 3. 7East side_______________..______________________ 126. 2South side______________________________________ 20. 0
Lower Patapsco River:North side________-__-______________________________________ 5. 9East side_._____________________ _ __ _____________________ 838.5Westside________-----______________________-__ <. 1
Curtis Bay:West side_____________________________________ 36. 5East side.______________________________________________ 7. 9
Middle Branch:North side-__-_-__--_.____________________.______ 76. 8West side-____--___.__________________________________ 241. 5
Total.__-_-__-_--_--____-__._________________________-__- 1,357. 7
The foregoing total possibly is too low by at least 10 percent owing to incomplete coverage, although it includes some estimates. Thus the average pumpage in 1955 was probably about 1,500 mgd. This is about 1% times as much water as was used for the 1956 total daily municipal water supply for the city of Baltimore (200 mgd) and shows the importance of the estuary as a source of industrial water.
The water has many uses, principally for cooling in condensers, air compressors, and as standby fire protection. About 47 p ^rcent of the pumpage is used by public-utility industries.
SALT-WATER ENCROACHMENT
The general relation between fresh and salt water in shallow aqui fers near the estuaries in the Baltimore area is shown in f gure 35.

F88 WATER RESOURCES OF INDUSTRIAL AREAS
WellWe'l
Well
FIGURE 35. Idealized sections showing movement of water in shallow aquifers. (A) Movement of fresh water prior to heavy pumping in industrial areas. (B) Movement of salt-water fro"n Patapsco estuary induced by heavy pumping. After Bennett (1952).
Owing to confining clay beds, the position of the contact between salt water and fresh water probably is somewhat different than shown.
The major artesian aquifers in the Baltimore area dip southeast ward toward the Atlantic Ocean. The position of the tfowndip salt water front in the Patapsco and Patuxent formations has not been determined. In 1945, the salt-water front in the Patuxent formation may have been 10 to 20 miles southeast of the outcrop area. At that time the updip encroachment of salt water in the Patuxent formation probably did not constitute an immediate danger. Kedu",ed pumping from this formation in the Baltimore area in recent years should re tard salt-water encroachment.
Samples from a deep well in the Patuxent formation g\t the Bethle hem Steel Co. Sparrows Point plant indicate no significant increase in chloride in nearly 8 years of observations (1947-55). The chloride determinations of samples from this and other index wells in the Bal timore area are given in table 13.
The approximate areal extent of the salt-water encroachment in the Patuxent formation in 1945 was shown by Bennett and Meyer (1952, pis. 15 and 16). Contamination (assumed to be indicated by chloride concentrations greater than 15 ppm) occurred in practically all the Harbor district, a large part of the Canton district, the southern part of the Highlandtown district, and a part of the Fairfield district to

BALTIMORE AREA, MARYLAND F89
TABLE 13. Chloride concentration in periodic samples of water from four index wellsWell at Sparrows Point
[Owner, Bethlehem Steel Co.; depth, 456 ft; aquifer, Patuxent formation]
ChlorideDate 1947 (ppm) Feb. 12................... 9
Sept. 21___.__...... 16Dec. 30__________ 14
1960
Feb. 2.................... 11Feb. 27.. ..........._ 14Apr. 5___________ 6Dec. 7..._._.......... 12Dec. 28______..... _ 8
1951
Feb. 6_._....___.. 12 Apr. 4.................... 12
ChlorideDate 1961 Con. (ppm) May 21.......__........ 12Aug. 16....__._...... 16Sept. 20.. .......__.. 12
1959
Jan. 3.................... 14Feb. 14...____._.... 11June 2__________ 12Aug. 27.....__......... 9Oct. 6. ....._........ 12Nov. 24__.....____. 12
1953
Jan. 27_........___. 7Mar. 30.................. 11June 12................... 11July 29 .-. ..-...... 12
ChlorideDate 196S Von. (ppm) Sept. I................... 12Oct. 9.................... 10Dec. 23 ..... ........ 8
196.1
Feb. 4.. . 10Mar. 19.................. 9.5June 2______....... 10Sept. 8__.._._._. 13Dec. 28. .__ .. 14
Feb. 14. .. - 13July 18.. ... 12Oct. 19.. 13Nov. 25.. ... 13
Well at Sparrows Point[Owner, Bethlehem Steel Co.; depth, 300 ft; aquifer, Patapsco formation]
1944 Sept. 7_...__........... 80Oct. 6...................... 76
1946
June. 115
Mar. 11.._...._...... . 125May 18___...___.... 112Oct. 28. 136
1960
Feb. 2._--....-...-....... 131May 25_.___......._ 148Oct. 31. ... 158
1961
Feb. 6 ............. 162May 21..................... 178Nov. 5..................... 162
19Bg Nov. 24.................... 50Dec. 30 ............. 106
1963
Jan. 26.. ................ 42Mar. 30.. ........ 128June 12_.______ __ 98 July 29 ............ 104Dec. 23............__.... 108
1964
Feb. 4.. . 108 June 2.. 110 Sept. 8__________ 96 Dec. 28.___________ 99
Apr. 27................ ..... 120July 18. ....... ... 118Oct. 19.. . .- 122Nov. 25.. ............ 127
Well in Curtis Bay area Owner, E. I. du Pont de Nemours and Co.; depth, 245 ft, aquifer, Patuxent formation]
1945 July27_.__................. 4Nov. 2.._....._.__.. 4
1949 Sept. 21...__............ 6
195S Oct. 6.. ................. 46
1963June 18.__________ 56 Sept. I... ............ 52
1964Apr. 7 ... ... 60 Sept. 8..................... 55Dec. 28__ ...._.__ 50
1966 Feb. 26.. . . 48Apr. 26-_ ... 50Sept. 28. ... 46 Nov. 25.. ....... ..... 39
Well in east Baltimore[Owner, American Radiator and Standard Sanitary Corp.; depth, 176 ft; aquifer, Patuxent formation!
May 15.1943
1949Mar. 14................._ 44Apr. 12-__ ...... __ 44Aug. 30.______.____ 70Nov. 28...-....-.. ..... 45
1950Feb. 2 ................ 51Feb. 27-.. ............... 54Apr. 5 . . ........ 52Apr. 28.-..... . ...... 58May 24 . .. . . 52June 26___. __. __ 50July 26 - _.. 48
I960 Con. Sept. 29.. ....... ....... . 58Oct. 3.. 38 Dec. 7 . 50
1951 Feb. 6... _ ....... _ _ _ .. 52Apr. 4.... ............... 50May 21 .. ....... .... 50Sept. 20. _ ... 60 Nov. 5... _ 50
Jan. 3. ____ . _______ 42Feb. 14. . . 43Apr. 1 ... .. ___ .. 48Mayl __ ... 32
195Z Con.
June 4 ... 52July 17 ... .... 74Aug. 27... .... 48Oct. 6. 54Nov. 24.......... ... 54Dec. 30...._ ... ._.- 50
1953
Mar. 30... . 50June 12 ..._........... 62July29 ................. 54Sept. I....... . 64Nov. 9... . 54Dec. 23. 46
the south. (See fig. 27.) Some areas, particularly the Curtis Bay district, were not included in general areas of contamination because the problem is localized and probably is caused by leakage through

F90 WATER RESOURCES OF INDUSTRIAL AREAS
well casings from the Patapsco formation or Pleistocene deposits. In the contaminated areas, a chloride content of more than 5,300 ppm has been reported (Bennett and Meyer, 1952, p. 131); this is about the chloride content of water from the Chesapeake Bay. Some wells in the Sparrows Point area have yielded water containing as much as 1,000 ppm of chloride.
In the Curtis Bay district, analysis of water from an E. I. du Pont de Nemours and Co. well in the Patuxent formation shows that the chloride content increased appreciably between 1949 and 1952, but remained fairly constant from 1952-56. (See table 13 and pi. 1.) In the absence of additional supporting data, it cannot be concluded that salt water in the Patuxent formation has spread in the Curtis Bay district since 1952. Low chloride content in water from a 115- foot well at the Westport stadium indicates that salt water has not spread that far northwestward.
Resampling of wells in the Patuxent formation in the lower Harbor and Canton districts shows that salt-water encroachment is continu ing, in places, the chloride content of water is in excess of 1,600 ppm. Scattered data for eastern Highlandtown and lower F mdalk dis tricts indicate no current problem there of salt-water encroachment in the Patuxent formation.
The Patapsco formation was contaminated by salt water chiefly be tween 1920 to 1940, when many large ground-water supplies were developed near the Patapsco River estuary (Bennett and Meyer, 1952).
Plate 1 shows also the extent of chloride contamination in the water bearing material overlying the Arundel clay, chiefly the Patapsco formation. The contaminated area includes large parts of the Canton, Dundalk, Fairfield, and Curtis Bay districts and practically all the Sparrows Point district. The chloride content of wate^ in the Pa tapsco formation at Sparrows Point has changed littl^ since 1944 (table 13). The chloride content in 1952 and 1953 was not static but varied by a factor of three or more during a comparatively short period. Insufficient data have been collected for the Patapsco forma tion since 1945 to indicate precise changes in the area of chloride con tamination from the Patapsco estuary. Analyses of several samples collected in the summer of 1955 from deep wells tapping the Patapsco formation in the Bear Creek area south of Inverness indicate little or no encroachment in that area.
PUBLIC WATER-SUPPLY SYSTEMS
The public water-supply system of the city of Baltimore is the major system in the area. Several small cities are served by public systems also. (See following table.)

BALTIMORE AREA, MARYLAND F91
Summary of information on public water supplies in the Baltimore area, Maryland
Community
Baltimore. .
Annapolis..
Bel Air..
Laurel... _ .
Com munity
Baltimore..
Annapolis..
Bel Air....
Laurel.. .
Supplier
Metropolitan Dis trict, Baltimore County.
Dreams Landing, Eastport, Forest Hills.
Bel Air Com munity.
Washington Suburban Sanitary Commission.
Population
Number supplied
1,261,000
28,300
(>)
Treatment plant
Name
Montebello ... Ashburton ....
Bynum Run- Winters Run..
Patuxent ...... Robt. B.
Morse.
Rated capacity (mgd)
240 120
360
5.0
.288 1.0
1.288 31.7 10.0
Year
1954
1950
Source
Gunpowder River and North Branch Pa- tapsco River.
Broad Creek and four wells, 242- 270 ft. deep.
Bynum Run and Winters Run.
Patuxent River and Northwest Branch Ana- costia River.
Reservoir
Name
Loch E Pretty Libertj
aven... Boy...
Triadelphia.- Rocky Gorge.
Stor age
(mil lion gal lons)
23,470 19,751 43,000
86,221
80
6,118 6,000
Fin ished- water
storage (million gallons)
773.5
2.25
» 45. 295
Treat Tient
Sedimentation, prechlorina- tion, coagulation with alum, rapid sand filtration, adjust ment of pH ^ith lime.
Lime, aeratiot, coagulation with alum, sedimentation, chlorination, and adjustment ofpH.
Prechlorinatior, coagulation, sedimentation filtration, postehlorinat'on, and fluori- dation.
Prechlorinatior, coagulation with alum, sedimentation, rapid sand filtration, post- chlorination, fiuoridation, and adjustment of pH.
Aver age
daily con
sump tion
(mgd)
U99.3
remarks
Maximum daily con sumption, 237.2 mil lion fallons, July 14, 1954.
Four \rells have com bined capacity of 3,500 gpm.
i Average daily consumption for 1954.> Sanitary Commission supplied about 4,480 persons in Laurel in 1950 and a total of 3&VOOO persons in
the entire system. » Total finished water storage tor Washington Suburban Sanitary Commission.
Before expansion in 1954, the raw-water supply for the city of Baltimore and its suburbs consisted of Loch Raven and Pretty Boy Reservoirs on the Gunpowder Falls, with a storage capacity of 43,266 million gallons. The system also included a large filtration plant treating 240 mgd. The Gunpowder Falls development for which ground was broken on December 3, 1875, consisted of Loch Raven Reservoir on the Gunpowder Falls at Raven's Rock anc1 a tunnel for delivering water to two distributing reservoirs, namely Lake Montebello (484 million gallons) and Lake Clifton (256 million gal lons). Water from Gunpowder Falls was introduced into the city of Baltimore through the new works on September 28,1881. Most of
690-492 O 63 7

F92 WATER RESOURCES OF INDUSTRIAL AREAS
the features of the original development are still in existence and are held in reserve.
The new Loch Raven Bam was started in 1912, but, owing to complications in acquiring certain property subject to inundation, the crest elevation was held to 188 feet. Tilting boards were added later to increase the effective elevation to 192 feet. The dam was completed in 1914. In 1915 a rapid-sand type filtration plant was completed, which has a capacity of 128 mgd, and in 1928 a second filtration plant was completed at Montebello, which has a capacity of 112 mgd.
Prettyboy Dam was started in 1929 and was completed in 1933. It provided about 19,400 million gallons of additional storage on the Gunpowder Falls. Provision was made to release water downstream into the Loch Raven Reservoir through hydraulically controlled valves. The new Gunpowder Falls-Montebello Tunnel was placed in service on December 23, 1940. Since that time, water 1 ^s been de livered to the filtration plants at Montebello by gravity.
The average daily consumption of water from the Baltimore city supply was 137 mgd by 1941, whereas the dependable yield of the Gunpowder was about 148 mgd.
In 1942, consulting engineers (Requardt and Wolnnan, 1942) proposed that preliminary work toward the building of a second permanent additional supply begin immediately to meet deficiencies anticipated in the 1940's. They reported the most favorable perma nent supply could be developed on the Patapsco River by the erection of "a dam (Liberty) at Falls Run Dam Site No. 4 and a tunnel to the Montebello Filters."
The required 10- and 7-foot tunnels from the Pataprco River at Liberty dam site to the Montebello filtration plants were completed in May 1951. During 1954, the construction of Liberty Dam on the North Branch of the Patapsco River was completed, and impoundment of water to supplement the Gunpowder Falls began. At an elevation of 420 feet, the reservoir impounds 43,000 million gallons of water which will provide an additional safe yield of 95 mgd. Owing to the fact that the crest of the dam is 160 feet above that of the Loch Raven impounding reservoir, it is possible to serve some of the higher zones in the city of Baltimore by gravity. In addition, it nearly doubles the Montebello Filters.
In addition to the dam, reservoir, and tunnels recommended by the engineering consultants in 1942, a modern filtration plant that can treat as much as 120 mgd has been built near the intersection of Liberty Heights Avenue and Druid Park Drive. The clear-water reservoir for this plant is Lake Ashburton, a storage reservoir used in the supply of the middle service area since 1908. As the elevation

BALTIMORE AREA, MARYLAND F93
of this lake is 353 feet, the need is eliminated for raising fr">m the low service area all the water used in the service areas above an elevation of 100 feet. In the years since 1945, growth in the suburbs exceeded estimates of the advisory engineers and, by 1952, it was apparent that the early construction of Ashburton filtration plant would be advis able. Construction began in 1953 and was completed in the spring of 1956.
By 1953 the population of Baltimore was growing sc fast that a third water source to supplement supplies from the Gunpowder Falls and Patapsco Kivers was needed. The City of Baltimore is required by statute to furnish water to the Baltimore County Metro politan District and in addition, by mutual agreement, to f mall parts of northern Howard and Anne Arundel Counties. Reasoning that it would be more economical for growing adjacent areas to obtain their water from the city of Baltimore, the city planners projected the water needs to a 709 square-mile service area, of which the city of Baltimore occupies 79 square miles (fig. 36).
FIGURE 36. Present and proposed sources of water supply and distribution, city of Baltbrore. (Adapted from Requardt, Shaw, and Wolman, 1953.)
WATER SUPPLY FROM SEWAGE EFFLTJEN1:"1
The Baltimore sewerage system is one of the most mocSrn in the United States and usually is known as a separate system. That is, it transports domestic, industrial, and manufacturing wastes.
The Back River Sewage Treatments Works, where more tl an 95 per-

F94 WATER RESOURCES OF INDUSTRIAL AREAS
cent of the sewage from the city is treated, is on the we^t shore of Back River south of Eastern Avenue. The sewage from a part of Baltimore County adjacent to the city is treated at this plant, also. The average sewage flow to the plant is approximately 130 mgd. Its maximum capacity is 291 mgd. The Patapsco Sewage Works is just north of Wagners Point on the west side of the Patapsco River. It receives sewage from the part of the city south of the Patax>sco River, from a part of Anne Arundel County immediately adjacent to the city, and from the Catonsville area in Baltimore County to the west. Only about 5 percent of the city's sewage is treated at this plant.
The sewage at the Back River plant is treated for removal of solids and is filtered. It is also chlorinated during the summer. During 1960 about 52 mgd was discharged into the Back River, and about 101 mgd was sold to the Bethlehem Steel Co. for use as process cooling water and for other purposes.
POTENTIAL SUPPLY OF FRESH WATER
The potential available fresh-water supply for the Baltimore area is about 1,250 mgd. Of course, water is a reusable resource. Some of the 1,250 mgd is removed by wells near a stream or by direct pumping from the stream and may be used and returned as sewage effluent and be included in the flow past a downstream gaging station. For ex ample, industries along the Patapsco River below Liberty Dam use and reuse the river water. Only the fresh water that is discharged directly into the bay or its estuaries or that lost by evapotrinspiration is completely lost as a resource.
Figure 37 shows graphically the comparison of present use (1955- 56) and potential fresh-water resources (exclusive of the Susque- hanna River) in the Baltimore area. A proposed diverr'on for 220 mgd from the Susquehanna River is now under construction. In addition to the fresh water use, 1,500 mgd of saline water is used by industries in the area. The saline-water resource is nearl^ unlimited in quantity, but its use might be seriously curtailed if th-*. bay water were to deteriorate markedly in chemical or physical quality.
PIEDMONT SUBAREA
The availability of ground-water supplies in the Piediront subarea is inherently limited by the character of the reservoir rocks. The storage capacity of the rocks is governed largely by weathering and to a lesser degree by jointing and fracturing. Below depths of about 200 to 300 feet, the crystalline rocks become less water Haring, and the chances of obtaining even small supplies of ground v^ater are re duced greatly.
Although a few wells yielding more than 100 gpm have been drilled

BALTIMORE AREA, MARYLAND F95
560
520
480
440
400
360
£320fleaz3 280
ZO 240
200
160
120
80
40
EXPLANATION
Potential water resources
1955-56
COASTAL PLAIN SUBAREA
30
PIEDMONT-SUBAREA-
532
242
150
5.5
PIGTJBE 37. Present use and the fresh-water supply in the Baltimore area, Maryland (exclusive of theSusquebanna River).
F96 WATER RESOURCES OF INDUSTRIAL AREAS
in the Piedmont subarea, such wells are exceptional; the average yield of 820 wells penetrating crystalline rock is only 12 gpm. To obtain a water supply of 1 mgd would require a well field of 60 such wells, assuming that these wells could deliver a sustained yield of 12 gpm, or about 17,000 gpd per well. During prolonged drought, wh^.n ground- water recharge is at a minimum, the yield of many of the crystalline- rock wells declines substantially, except where nearby streams or other water bodies provide recharge to the underlying rock aquifers.
A wide range in the behavior of individual wells may b^ expected, dependent largely on the local geologic and hydrologic conditions.
Only an indirect estimate can be made concerning tli-^ potential ground-water supplies in the Piedmont subarea. Dingman and Fer- guson (1956, p. 52) estimated the average ground-water runoff, or the effective ground-water recharge, in Baltimore and Harford Coun ties to be about 500,000 gpd per sq mi. (See "Defmiticn of terms used," p. F100.) Thus, for the approximately 900 square miles included in the Piedmont subarea of this report, the ultimate ground-water development is theoretically about 450 mgd. Of course to obtain this quantity of ground water would be impractical, because of the large number of wells required. The ultimate development of ground- water supplies thus is restricted largely by economic factors and may be expected to be far less than the theoretical maximum, probably about one-third, or 150 mgd.
Construction of storage reservoirs on a stream increa^s the de pendable flow of th*e stream; however, it is usually not practical to build reservoirs large enough to make the entire flow dependable. Loch Raven Dam, Liberty Dam, and Rocky Gorge Dam create suffi cient storage capacity so that the dependable flow is equal to the flow that would be available 63, 43, and 64 percent of the time if no storage were provided. Hence it may be assumed that it would be practicable to build sufficient storage capacity on other streams to make the de pendable flow (with storage) equal to the natural flow available 60 or more percent of the time as shown by the flow duration curve.
A total flow of 244 mgd may be obtained 60 percent of th<^ time from seven minor Piedmont streams. (See table 14.) This flov is the ap proximate limit of the dependable flow that can be developed from those streams in the Piedmont subarea that are not affected by regu lations. The assumption also must be made that ground water will remain in its present state of development so as not to change surface- water base flow.
Winters Run and Broad Creek in Harford County are rot included in table 14. Winters Run has been largely pre-empted as a source of water for the town of Bel Air and for the U.S. Army Chemical Cen-

BALTIMORE AREA, MARYLAND F97
TABLE 14. Summary of available flow in Piedmont streams unaffected by majorstorage reservoirs
Piedmont stream
Deer Creek.....Bynum Run * ...Little Gunpowdi Piney Run ......South Branch Ps Little Patuxent Dorsey Run .....
Total.....
jr Falls ,_____ ..............
itapsco River ______________River _____________ .. .
Drainage area sq mi
170.7 23.8 58.3 18.2 85.7
161.4 11.6
529.7
Flow (mgd) equaled or exceeded the indicated percent »«» of time l
50
112 15 37
9 40 72
5
290
60
97 13 31
8 33 58 4
244
90
57 8
18 4
14 27
2
130
1 Based on flow records from nearest gaging station adjusted to the 57-year base period 1896-1952.2 Flow based on average rate of discharge of Deer Creek and Little Gunpowder Falls.
ter. Broad Creek, which drains an area of 41.4 square miles, is the source of water for a reservoir near its mouth. This reservoir is used chiefly for recreation.
The city planners concluded after studies in 1921, 1934, and 1942, that when closer and cheaper water sources were fully utilised, Balti more would turn to the Susquehanna Kiver for further wator develop ment. Water from the Susquehanna River is of excellent quality and is plentiful. Unlike the other two sources that feed by gravity, how ever, the water must be pumped to Baltimore.
The pumps at the Susquehanna would receive water stored by Cono wingo Dam which has an 89-ft head utilized by the Conowingo Power Co. Flows in the river exceed 6,400 cfs for 90 percent of th°i time and are greater than 2,000 cfs for 99.9 percent. Even at the year 2000, water diversions will interfere with power production at Conowingo only intermittently and to a very slight extent.
The additional supply of fresh surface water that can b«, obtained for the Piedmont subarea, without use of the water fror^ the Sus quehanna Kiver, is 290 mgd. The supply that is available from streams is as follows:
Drainage basin (mgd)Gunpowder Falls_-__--_____-_____________________________ 148Patapsco River_________________________________________ 95Patuxent River_________________________________________ 45Minor streams unaffected by storage reservoirs.______________ 244
Total. 532i Baltimore, 1956.8 Washington Suburban Sanitary Commission, 1957.
Use (mgd) »200
242
Proposed diversions from the Susquehanna Kiver amount to as much as 220 mgd. Furthermore, widespread heavy withdrawals from wells might significantly reduce the streamflow.

F98 WATER RESOURCES OF INDUSTRIAL AREAS
Chemical analyses of the water from these streams are scarce, but the water has proven satisfactory for most uses. Treatment is re quired for the removal of suspended sediment, especially during spring runoff.
COASTAL PLAIN SUBAREA
The ultimate potential development of the ground-water resources in the approximately 400 square miles constituting the Coastal Plain subarea is difficult to evaluate accurately for many complex reasons. However, when examined from a broad perspective, the ultimate limit of the development of ground-water supplies in the Baltimore area is determined by precipitation and ground-water replenishment. The average annual rainfall of 43 inches is equivalent to abcut 2.1 mgd per sq mi. Recent studies by Meyer and Bennett (1955) ar d by others have shown that at Salisbury, Md., an area somewhat similar to the Baltimore area in geology and topography, the average annual ground-water discharge, or the effective ground-water recharge, over a 14-year period was about 0.6 mgd per sq mi. If 0.6 mgd of ground- water recharge is applied to the 400-square mile area in the Coastal Plain subarea, the ultimate ground-water potential for perennial with drawal is about 240 mgd. This is nearly eight times the amount of ground water withdrawn for all uses in 1955. (See following table.)
Summary of ground-water use in the Coastal Plain subarea ir, 1955
Type of use MgdIndustrial and commercial._________________________________________ 24. 5Public supply________________________________________ 2. 6Military installations.____________________________________________ 2. 4Rural and domestic____-_-_--_-_____-_-______-_____--__------_--- 3. 0
Total._____________________________________________ 32. 5
The amount of water recoverable from wells on a sustained basis probably is somewhat less than 240 mgd, probably about f 0 mgd, be cause the governing factors in withdrawing water from aquifers is their permeability and the hydraulic gradients that can be created in them. These factors determine the rate at which water can move toward the pumped wells and, thus they limit the yield of the wells. Furthermore, recent information on drilling indicates that some of the water-bearing sand becomes thinner and less permeable near the outcrops. Therefore, the opportunity for recharge is less and the rates of transmission of water through them are reduced.
Although the quantity of ground water available in the area is enormous, several economic factors limit its development. Water quality and pumping costs are two such factors. For example, much of the ground water from the Patapsco, Raritan, and Magothy for-

BALTIMORE AREA, MARYLAND F99
mations in northern Anne Amndel County and in places ir Baltimore County is slightly acidic and very high in iron content (more than 30 ppm in places). This water is corrosive to pumps, well screens, and casings. Although the water can be improved by treatment, this in creases its unit cost. Thus it might not be economical to use ground water of this quality, especially as water of better quality may be available from surface sources. On the other hand, ground water may be preferred if a uniform temperature is needed.
High pumping costs, brought about by the decline in puirping levels hi heavily pumped well fields in the deeper parts of the aquifers, tend to cause a reduction in the use of ground water. Development of the surface-water resources in the Coastal Plain subarea is hampered by the small size of the drainage basins above tidewater. Only four streams in the subarea have drainage areas larger than 5 sq uare miles. The total supplies of fresh surface water in the Costal Plain is esti mated to be 30 mgd (see following table), assuming that storage will be provided.
Summary of available flow of Coastal Plain streams
Coastal Plain stream
Sawmill Branch of Furnace Creek. _____ ___
Bacon Ridge Branch near Chesterfield. ________Severn River above U.S. Highway 301 '. ________
Total flow ___________
Drainage area
(sqmi)
5.1 8.5 6.9
25
45.5
Flow (mgd) equaled or exceeded the indicated percentage of time '
50
4.3 4.9 5.8
18.7
33.7
60
4.0 5.1 4.3
11.8
31.2
90
3.2 3.0 2.7
11.4
20.3
»Based on flow records from nearest gaging station adjusted to the 57-year base period 1 <>96-1952. ' Flow based on average flow duration per square mile for the three gaged Coastal Flair streams.
DEFINITION OF TERMS USED
Aquifer is a hydrologic unit composed of water-bearing e^rth mate rials in which water may collect in usable quantities; synonymous with ground-water reservoir.
Biochemical oxygen demand (BOD) is a measure of the amount of oxygen required to destroy organic wastes by bacterial action; thus it is a measure of the degree of pollution of stream water.
Climatic year, as used in this report for low-flow studies of surface water, is the 12-month period beginning April 1 and ending the following March 31. Designated as the year beginning April 1.
Coefficient of permeability (field) is a measure of the capacity of rocks to transmit water under head or pressure differentials; defined as the rate of flow of water, in gallons per day, through a cross sec tion of the aquifer of 1 square foot under a unit hydraulic gradient (1 foot per foot) at the prevailing water temperature.

F100 WATER RESOURCES OF INDUSTRIAL AREAS
Coefficient of storage refers to the volume of water released or taken into storage in an aquifer per unit surface area per unit change in the component of head normal to that surface; it is a dimensionless value, as it expresses only magnitude and does not hav*?. a unit of measure.
Coefficient of transmissibility is the field coefficient of permeability multiplied by the saturated thickness of the aquifer.
Contamination is a general term referring to the introduction into water of microorganisms, chemicals, and other wastes, including sewage, which render water unfit for most uses without corrective treatment. The intrusion of saline water into fresh water also would be called contamination.
Cubic foot per second (cfs) is a rate of discharge equivalent to a stream whose channel is 1 square foot in cross section and whose average velocity is 1 foot per second.
Discharge is the rate of flow of water in a stream, usually expressed in cubic feet per second or million gallons per day (mgd). A stream flowing at the rate of 1 cfs discharges 646,317 gallons in 24 hours. The volume of flow is often expressed in cfs-days. One cfs-day is the volume of water represented by a flow of 1 cfs for 24 hours. A discharge of 1 mgd equals 1.5472 cfs.
Discharge per square mile as used in hydrologic studies, refers to an average number of units of water flowing per unit time from each square mile of area drained and is based on the assumption that runoff is distributed uniformly in time and area; expressed in cubic feet per second per square mile or in million gallons per day per square miles.
Dissolved oxygen refers to the weight of oxygen actually dissolved in a sample of water, expressed in parts per million.
Drainage area is the size of the drainage basin drained by a stream above a given location, expressed in square miles.
Effective ground-water recharge is used in this report as the maxi mum quantity of water that could be recovered from the aquifers without a permanent depletion of ground-water storage.
Equivalents per million (epnt) refers to a unit chemical combining weight of a constituent in a million unit weights of water; it is calculated by dividing the concentration in parts per million by the chemical combining weight of the constituent.
Parts per million (ppm) is a unit weight of a constituent in a million unit weights of water. One part per million equals or°, ten-thou sandth of 1 percent (0.0001 percent).
pH is a measure of the acidity or alkalinity of water. / pH of 7.0 is neutral, an acid solution has a pH less than 7.0, and a basic or alkaline solution has a pH more than 7.0.

BALTIMORE AREA, MARYLAND F101
Safe yield, as used for ground-water studies, is the rate at vhich water can be withdrawn from an aquifer without depleting the supply to such an extent that withdrawal at this rate is no longer economical ly feasible. The practicable rate of withdrawing wat?.r from an underground reservoir perennially for human use (Meinzer, 1923, p. 55). As used in this report, safe yield is defined as a technically derived practicable rate of perennial withdrawal for human use of the surface water as stored in a reservoir.
Specific capacity is the yield of a well per unit drawdown, usually expressed as gallons per minute per foot of drawdown ; although the drawdown of a well varies with time of pumping, th-^ definition does not include time as a .factor. However, it implies a period of time sufficient to permit effective stabilization of the drawdown.
Storage ratio is the ratio, expressed in years, of usable capacity of a reservoir to the mean annual runoff; equivalent to the time, in years, required to impound a volume of water equal to the usab1 ^ capacity of the reservoir, assuming an average rate of runoff.
Volume of storage refers to the reservoir content expressed in million gallons, or in million gallons per square mile of drainage basin.
Water year is the 12-month period beginning October 1 and ending the following September 30. Designated as the year ending Sep tember 30.
REFERENCES
Beaven, G. F., 1946, Effect of Susquehanna River streamflow on Chesapeake Baysalinities and history of past oyster mortality on upper Bay bars: MarylandBoard Nat. Resources, 1946 annual rept.
Bennett, R. R., and Meyer, R. R., 1952, Geology and ground-water resources ofthe Baltimore area: Maryland Dept. Geology, Mines, and Waf^1* ResourcesBull. 4.
California Water Pollution Control Board, 1952, Water quality criteria: StateWater Pollution Control Board Pub. 3.
Dingman, R. J., and Ferguson, H. F., 1956, The ground-water resources of thePiedmont part, in- The water resources of Baltimore and Hartcrd Counties:Maryland Dept. Geology, Mines, and Water Resources Bull. 17.
Dingman, R. J., and Meyer, Gerald, 1954, The ground-water resources in Thewater resources of Howard and Montgomery Counties: Maryland Dept.Geology, Mines, and Water Resources Bull. 14.
Garland, Chesley F., 1952, A study of water quality in Baltimore Harbor: Mary land State Board Nat. Resources Pub. 96,132 p., 31 figs, 20 tables
Geyer, John C., and Wolff, J. B., 1955, Report to the city of Baltimore on thewater distribution and appurtenant problems: 233 p. [Rept. of consultingengineers]
Knopf, E. B., and Jonas, A. I., 1929, Geology of the crystalline rocl s, BaltimoreCounty: Maryland Geol. Survey.
Martin, R. O. R., 1956, The surface-water resources, in The water resources ofBaltimore and Harford Counties: Maryland Dept. Geology, Mines, and WaterResources Bull. 17.

F102 WATER RESOURCES OF INDUSTRIAL AREAS
Meinzer, O. E., 1923, Outline of ground-water hydrology, with definitions: U.S. Geol. Survey Water-Supply Paper 494.
Meyer, R. R., and Bennett, R. R., 1955, Ground-water resources of tl ^ Salisbury area, in The water resources of Somerset, Wicomico and Worcester Counties: Maryland Dept. Geology, Mines, and Water Resources Bull. 16.
Otton, E. G., 1955, Ground-water resources of the southern Maryland coastal plain: Maryland Dept. Geology, Mines, and Water Resources B "11. 15.
Requardt, G. J., Shaw, H. B., and Wolman, Abel, 1953, Report to the city of Bal timore on future sources of water supply and appurtenant problems: Board of Advisory Engineers on Future Water Supply, 61 p., 19 figs., 21 tables.
Requardt, G. J., and Wolman, Abel, 1942, Report to the Public Improvement Com mission of the city of Baltimore on future sources of water supply: Board of Advisory Engineers on Future Water Supply, 46 p., 12 figs., 11 tables.
Rippl, W., 1883, The capacity of storage reservoirs for water supply: Inst. Civil Eng. Proc., v, 7J, p. 270-278.
Searcy, J. K., 1959, Flow-duration curves, Manual of Hydrology, pt. 2. Low-flow techniques: Water-Supply Paper 1542-A, 33 p., 13 figs., 3 table-'
Thomas, N. O., and Harbeck, G. E., Jr., 1956, Reservoirs in the United States: U.S. Geol. Survey Water-Supply Paper 1360-A, p. 46.
U.S. Department of Health, Education, and Welfare, Public Health Service, 1950, Individual water supply systems: Washington, U.S. Govt. Printing Office.
U.S. Weather Bureau, 1956, Climatic guide for Baltimore, Md.Water Pollution Control Commission and Maryland Department of Health, 1957,
Water pollution survey of the Patapsco River.Whitman, Ezra, Requardt, G. J., and Associates, 1956, Water supplies in New
Castle County, Del.: Baltimore, Md., 34 p. [Consulting engineries' report to the Levy Court of New Castle County, Del,]

INDEX
[Italic page numbers indicate major references]Page
Aberdeen Proving Ground, Md__.____ F30 Abstract.-. __._____.____ 1 Aeration, zone of.. _... 5 Alkalinity.. _.__..__..__.__._ 23,85 Annapolis, Md . _ ...__ 68,78,79 Anne Arundel County Sanitary Commission. 67 Aquifers . .... . ..__. 5,58,99
hydraulics . . . ..____ 13 tests... . ....__ __..._ 13,72,75
Army Chemical Center at Edgewood, Md - 30,67 Artesian aquifers.. . ____ 88 Artesian conditions__._____.____ 68 Arundel clay _________________ 70 Atkisson Reservoir _ 30
Back River Sewage Treatment Works..... 93,94,98Bacon Ridge Branch... _ 77
at Chesterfield, Md...__ _.__.... 77Baltimore Bureau of Water Supply_____ 38Baltimore Custom House.... _.. 40Baltimore gneiss._ ____ 10Baltimore Harbor, as a source of water. ___ 80Bel Air, Md._._________._.__ 30Bennett, R. R., and Meyer, R. R., cited.. 62Bibliography. . _ .. _____ 101Bicarbonate.. _______-_______ 47Biochemical oxygen demand._ _.. 99Brighton Dam.________________ 65Broad Creek....... _ __ ____ 97Bush River__ _______________ 50,31Bynum Run at Bel Air, Md_________ 30
Calcium...... _______________ 47Carney, Md .........__.............. 28Chapel Hill water-plant intake._.....___ 23Chemical analyses...._... 18,20,28,31,54,64,66,78Chemical quality of water. __.. 17,
20,23,30,33,46,54,62,73,77,80Chesterfield, Md_______________ 77Chloride.... _._________.. 20,82,88,89Climatic year _.._____._______ 99 Coastal Plain States..._ ._..___.... 24Coastal Plain subarea____________ 3,57,98 Cockeysvilte formation.___________ 11 Cockeysville marble..____________ 10 Colgate Creek.._....._____...._... 86Conowingo Dam_______________ 10,97 Conowingo Reservoir_____________ 21 Contamination......._______.____ 100Crownsville State Hospital__________ 73,74 Crystalline rocks_______________ 10
PageCubic foot per second. .. . F100 Curtis Bay.. . . - 86 Curtis Bay district 90
Deep Run near Patapsco, Md 78 Deer Creek_ . SI
at Rocks, Md... . 28 Discharge per square mile 100 Dissolved oxygen.. 100 Dissolved solids.. - 17,46,80Dissolved solids content- 17 Diversion--. - 4,21,57,97Dorsey Run near Jessup, Md.. 63 Drainage area__ 5,31,33,38,43,76,97
Edgewood, Md.. 30,67 Effective ground-water recharge 100 Equivalents per million .. 100 Evaporation 5 Evapotranspiration.. 5
Fall Zone_ l Floods._-_-_-___-__-__ 23,38,50,56,79 Flushing of Baltimore Harbor 87 Fort George G. Meade.. 56 Fort McHenry. 83
Gabbro. ..... ... 13Gaging station records. 6 Garland, Chesley, cited... - - 81,82,86 Geothermal gradient 60 Glen Burnie, Md. 77,78Gneiss 12Granite.- . - 12Granodiorite.-. 12Ground water 10
chemical quality.- 17occurrence of _ 61,72recharge 96use of 67
Guilford, Md ... ----- - 63Gunpowder Falls 92
at Glencoe, Md 38near Carney, Md 28
Gunpowder River. 24, SI
Hardness of water.. ... 17,21.35,46,47,77,80 Havre de Grace, Md__ 20,75 Henryton, Md__ .. 29Hollofield, Md.. .................... 29,47Howard County, Md .. 57 Hydroelectric power 10,21
F103
F104 INDEX
PageHydrograph . - F76Hydrologic cycle 5Hydrologic properties, crystalline rocks 14
Patapsco formation.. 71Patuxent formation..... 61Raritan formation .... 71units of the Coastal Plain........ 59
Igneous rocks 14 Industry... - 9,58
See alto discussion under Use of water. Introduction.... 1Iron._________......._........ 17,35,66,73Irrigation...... . . . 19
-_. - 53Johns Hopkins University. . 80Joints_-__ -_. . ....... . . 10Jones Falls near Rockland, Md_ 29
Laurel, Md... . -.. 57Laurel Brook . 28 Liberty Dam.... .. ..... . 92,96Liberty Reservoir. 46,47 Little Falls 32
at Blue Mount, Md - 38Little Gunpowder Falls at Laurel Brook, Md. 28 Little Gunpowder Falls basin...... ._.- 5Little Patuxent River at Guilford, Md....___ 53
at Savage, Md.___._.. ._____._ 56 Location of area______.....__...... 1,57Loch Raven Dam___ __....__..... 92,96Loch Raven Reservoir.----.--.--.... . ._ 34,36,91Low flow, analyses.-...-..-.. ____..__ 6
frequency. -- ----._-- 22,33,45,77,79 Lowland deposits...-___-________ 75
Magothyformation___...... .....__. 67,75,98Manganese___-._ ....._..-....-. 35Marble..-- .-.-.--.___ ..--.-. ... .. 12 Marietta, Md .- ....... -.. 20Marriottsville, Md__.._.- . .... 29,46,50Maryland Department of Research and Edu
cation, Chesapeake Biological Lab oratory.-_ __...___... 80
Metamorpbic rocks......__......._..._ 10,14MinkHoUow, Md_.. . .____ _ 57Monmouth Formation.. .- 74Moutebello filter plant_ 36,92Montgomery County, Md.__.... .... _... 57Morgan Run, Md_.______.__.___ . 46
Navigation ..___.- .. .....____- 80Nitrate.._..._.-.._.___......_. _. 17,47,77North Branch Patapsco River near Marriotts
ville, Md..... ................ 29,46,50near Reistertown, Md.__.._..__ 28,46,50
North Linthicum, Md_ ..- _._ _. 61 North River near Annapolis, Md__..--_-_.___ 78,79
Otton, E. G. f rtted...... -................ 66,73Overdrafts_....... _ . ..... ...... 13
Parts permillion..--_ -_.___ ______ -_ looPatapsco, Md_.__..._____._____ 78
Page Patapsco formation .... F62,65,67,69, 70,9SPatapsco River__._...___ ..... . 24,45,75
at Hollofleld. ._....__._._._. 29,47Patapsco Sewage Works_.._._........._.. 94Patuxent formation.. ..... ..-- 60, 64,88,90Patuxent River._- ...- --. -....-- 24, 61Permeability, coefficients of.... -- 12,
62,72,74,75,76,99Perry Point, Md.._.__._- ___ ._ __... 28 pH.-.... . .. . 23,35,77,80,85,100Piedmontsubarea. ... -.. .._...... 3,9,94Piney Run near Sykesville, Md _.__..... 29,47Pleistocene deposits..-.--.------ -.--------- 75Pollution 47,81,86Population......---. . _--. -,.... 3,9,70Precipitation - - . 5,13,16,38 Prettyboy Dam__ -- - .. 92 Prettyboy Reservoir --------- ...... 34,36,91Prince Georges County, Md. - 57,74 Public water-supply systems- -----..------- 90Pumpage .-- . - -.- .... 67,73Pyroxenite. ------------------------------- 13
Quartzite 12
Raritan formation...-.-------------------- 67,70,98Recent deposits___..___.___..... 75Reisterstown, Md..-.... -- 28,46,50Relay, Md. .... . 75Requardt, G, J., and Wolman, Abel, quoted. 92 Rippl.W., cited .-----. ---- ... . 9Rockland, Md...... ... ... -. 29Rocks, Md-.-. -.- . ..----- 28Rocky Gorge Dam...------- . - 96Rocky Gorge Reservoir..___...._ -. .. 55,57,96
Safe yield__ 101Saline-water use. 87Salinity 83Salt-water encroachment. __.. ... 3,64,66, 87 Saturation, zone of_.. .... , 5Savage, Md __ ... .... 56Sawmill Creek... . . 76
at Glen Burnie, Md_. ... _ 78 Schist..- - -- 12Setters formation__ .._ ._ 11 Severn Run near Glen Burnie, ltd_. ...... 78Sewage disposal____ ___.__......., 81Sewage effluent, water supply from___..-. 93 Sewerage system.. . ...- -. 4 Slade Run __ .. 32South Branch Patapsco River at Henryton,
Md._ 29Sparrows Point, Md.... . 58,62,72,88Specific capacities..... _. 13,59,62,75,101Specific yield .... ... 58Storage. . 9,2', 36,47,55,91,96,101
coefficients of- 62,72,74,75,76,100ratio_ ...... ... . .. ... , 101
Streamfiow.......___._*_._.____ -. 25,33Streamflow data... - 7,20,21,30,31,38,43,51,76,79,96 Susquehanna River._ ..._ ... 4,20,24,83
at Perry Point, Md.... 28 Sykesville, Md.._ .......... .... 29,47

INDEX F105
Page Temperature of water.... F17,35,36,47,55,60,84,85Terms, definition of_____. ....._- 99Thickness, geologic formations.._.. _. _- 58
Magothy formation___..._._........ 74metamorphicrocks.._ .._ _ . _._ ._ 11 Monmouth formation.__~___... __ 74 Patapsco formation_.....-.-. ....__ 71Patuxent formation__ . . 61Raritan formation. . - - --.- . 71
Topography..-------------..-----.- 43,76,77,79Transmissibility, coefficients of.. 12,72,74,75,76,100 Transpiration.__--- - --- -- _ 5 Tridelphia Reservoir.. -------------- 52,55Turbidity.. ----------------- 23,35
U.S. Naval Academy at Annapolis, Md___ 74
Use of water -_ . See otoo Water, use.
Page F73
Washington Suburban Sanitary Commission. 51,55,57
Water, chemical quality of..._....___... 73 Water-level fluctuations... . 13,62,73 Water supply, potential..__.__. -__ 94
problems ...- -. --_ .. . 2 Water table.. . ... ....-.- 5
conditions.._ ... _.__..___ 58 Water, use..... 10,17,19,21,30,41, SO, 57,67,73,87,92Water year----. --------------- 101Wells, depth...-. - - 14
yields... 3,12.fi-> 61,72,74,75,94 Winters Bun.-. -.- ... 30 Wissabickon formation . 10,11
o