Calvert County Maryland
154
Calvert County Maryland Comprehensive Annual Financial Report For the fiscal year ended June 30, 2012
-
Upload
khangminh22 -
Category
Documents
-
view
1 -
download
0
Transcript of Calvert County Maryland

Calvert County Maryland
Comprehensive Annual
Financial Report
For the fiscal year ended June 30, 2012


Calvert County Maryland
Comprehensive AnnualFinancial Report
For the fiscal year ended June 30, 2012
Prepared by:Department of Finance & Budget
Calvert County, Maryland


COUNTY COMMISSIONERS OF CALVERT COUNTY, MARYLAND
JUNE 30, 2012
TABLE OF CONTENTS
INTRODUCTORY SECTION PAGE
Letter of Transmittal i-vCertificate of Achievement for Excellence in Financial Reporting viCertain Elected and Appointed Officials viiOrganizational Chart-Calvert County viii
FINANCIAL SECTION
Independent Auditor's Report 1-3
Management's Discussion and Analysis (required supplementary information) 4-15
Basic Financial StatementsStatement of Net Position 16 Statement of Activities 17-18Balance Sheet 19 Statement of Revenues, Expenditures and Changes in Fund Balance - 20 Governmental FundsReconciliation of the Statement of Revenues, Expenditures and Changes in 21 Fund Balance of the Governmental Funds to the Statement of ActivitiesStatement of Net Position - Proprietary Funds 22 Statement of Revenue, Expenses and Changes in Fund Net Position - 23 Proprietary FundsStatement of Cash Flows - Proprietary Funds 24 Statement of Fiduciary Net Position 25 Statement of Changes in Fiduciary Net Position 26
Notes to Financial Statements 27-64
Required Supplementary InformationSummary Schedule of Revenue and Expenditures, and Other Financing 65 Sources and Uses - Budget and Actual (Budgetary Basis) - General FundSchedule of Pension Fund Funding Progress & Employer Contributions Calvert County Maryland Post-Employment Benefit Plan 66 Calvert County Employees Retirement Plan 67 Calvert County Sheriff's Department Plan 68 Length of Service Awards Program (Volunteer Fire Departments & Rescue Squads) 69

COUNTY COMMISSIONERS OF CALVERT COUNTY, MARYLAND
JUNE 30, 2012
TABLE OF CONTENTS (Continued)
Other Supplementary InformationSchedule of Revenue and Other Financing Sources - Budget and Actual 70-72 (Budgetary Basis) - General FundSchedule of Expenditures and Other Financing Uses - Budget and Actual 73-80 (Budgetary Basis) - General Fund
Nonmajor Funds and Other SchedulesCombining Balance Sheet - Nonmajor Governmental Funds 81-82Combining Statement of Revenue, Expenditures and Changes in Fund Balance 83-84 Nonmajor Governmental Funds
Combining Statement of Net Position - Nonmajor Proprietary Funds 85 Combining Statement of Revenue, Expenses and Changes in Fund Net Position - 86 Nonmajor Proprietary FundsCombining Statement of Cash Flows - Nonmajor Proprietary Funds 87
Component Unit Statement of Net Position - Economic Development Authority 88 Component Unit Statement of Revenue, Expenses and Changes in Fund Net Position - 89 Economic Development AuthorityComponent Unit Statement of Cash Flows - Economic Development Authority 90 Combining Schedule of Revenues, Expenses and Changes in Net Position - 91 Water and Sewer Fund
Statement of Changes in Assets and Liabilities - Agency Fund 92
Schedule of Notes Receivable - Volunteer Fire Departments and Rescue Squads 93 General Fund
Schedule of Real and Personal Taxes Receivable - General Fund 94
Combining Statement of Revenues, Expenditures and Changes in Fund Equity 95 Calvert County Family Network
Compliance ReportReport on internal control over financial reporting and on compliance and other 96-97 matters based on an audit of financial statements performed in accordance with Government Auditing Standards

COUNTY COMMISSIONERS OF CALVERT COUNTY, MARYLAND
JUNE 30, 2012
TABLE OF CONTENTS (Continued)
STATISTICAL SECTION
Financial Trend Data
Schedule 1 Net Position by Category 98 Schedule 2 Changes in Net Position 99-100Schedule 3 General Tax Revenues 101 Schedule 4 Fund Balance of Governmental funds 102 Schedule 5 Changes in Fund Balance of Governmental funds 103
Revenue Capacity
Schedule 6 Assessed and Estimated Actual Value of Taxable Property 104 Schedule 7 Direct and Overlapping Real Property Tax Rates 105 Schedule 8 Principal Property Taxpayers 106 Schedule 9 Property Tax Levies and Collections Schedule 107
Debt Capacity
Schedule 10 Ratios of Outstanding Debt by type 108 Schedule 11 Ratios of Net General Bonded Debt 109 Schedule 12 Pledged-Revenue Coverage 110
Demographic and Economic Information
Schedule 13 Demographic and Economic Statistics 111 Schedule 14 Principal Employers 112
Operating Information
Schedule 15 Full Time Equivalent Calvert County Employees by Function 113 Schedule 16 Operating Indicators by Function 114 Schedule 17 Capital Asset Statistics by Function 115

“THIS PAGE LEFT INTENTIONALLY BLANK”

Introductory Section

“THIS PAGE LEFT INTENTIONALLY BLANK”
HonorabCounty A
The ComYear endrequires tthat this rundergo1984 (as Budget (OOrganizareliabilitymanagemmaterial results of
Managemcontrol stloss, thefto allow generallydesignedmaterial assuranceprocedur
Murphy &Calvert Cprovide r
le Members Administrato
mprehensiveded June 30, that Calvert report be audan annual siamended inOMB) Circuations. Respy of all of th
ment. To therespects andf operations
ment of the gtructure desift or misuse, for the prepa
y accepted ind to provide rmisstatemene, constraineres. The cost
& Murphy, CCounty Govereasonable a
CALVE
Boa
SteGe
SEvan K.
of the Boardor and Citize
Annual Fina2012, is herCounty annudited by certngle audit in 1996) and t
ular A-133, Aponsibility fohe informatioe best of our d are reportedof Calvert C
government igned to ensuand to ensur
aration of finn the United reasonable ant. The conced by the cos of a control
CPA, LLC, ernment’s finssurance tha
ERT COUN
ard of CounPat Nutte
even R. Weemerald W. ClaSusan ShawSlaughenho
d of County ens of Calver
ancial Reporreby submittually issue atified public n conformitythe provisionAudits of Staor both the aon presented knowledged in a manne
County Gove
is responsiblure that the are that adequnancial stateState of Am
assurance thacept of reasosts and benefl should not
Independentnancial stateat the financi
NTY GOVE
nty Commisser, Presidenms, Vice Pre
ark, Commisw, Commissio
oupt Jr., Co
Commissionrt County
rt of Calvert ed. Calvert C
a report of itsaccountants
y with the prns of the U.Sates, Local Gaccuracy of th
in these repand belief, ter that presenernment and
le for establiassets of theuate and accments in con
merica (GAAat the financionable assurafits of establexceed the b
t Certified Pements. Theial statement
ERNMENT
sioners ntesidentssioner oner
ommissioner
ners of Calv
County, MaCounty Codes financial ps. The Counrovisions of tS. Office of MGovernmentsthe data and ports rests withe enclosed nts fairly theits compone
ishing and me governmencurate accounnformity wit
AP). The inteial statementance implieslishing increbenefit to be
Public Accoue goal of the ts of Calvert
r
Decem
vert County,
aryland for the of Public L
position and nty is also rethe Single AManagemens, and Non Pthe completith the Coundata are acc
e financial pent units.
maintaining ant are protectnting data arth accountinernal controlts will be fre
s a high degremental cont derived from
untants have independentt County Go
mber 20, 2012
he Fiscal Local Law activity, andquired to
Audit Act of nt and Profiteness and
nty’scurate in all position and
an internal ted from re compiled
ng principles l structure isee from ree of trol m it.
audited t audit is to vernment
2
d
s

-i-
HonorabCounty A
The ComYear endrequires tthat this rundergo1984 (as Budget (OOrganizareliabilitymanagemmaterial results of
Managemcontrol stloss, thefto allow generallydesignedmaterial assuranceprocedur
Murphy &Calvert Cprovide r
le Members Administrato
mprehensiveded June 30, that Calvert report be audan annual siamended inOMB) Circuations. Respy of all of th
ment. To therespects andf operations
ment of the gtructure desift or misuse, for the prepa
y accepted ind to provide rmisstatemene, constraineres. The cost
& Murphy, CCounty Govereasonable a
CALVE
Boa
SteGe
SEvan K.
of the Boardor and Citize
Annual Fina2012, is herCounty annudited by certngle audit in 1996) and t
ular A-133, Aponsibility fohe informatioe best of our d are reportedof Calvert C
government igned to ensuand to ensur
aration of finn the United reasonable ant. The conced by the cos of a control
CPA, LLC, ernment’s finssurance tha
ERT COUN
ard of CounPat Nutte
even R. Weemerald W. ClaSusan ShawSlaughenho
d of County ens of Calver
ancial Reporreby submittually issue atified public n conformitythe provisionAudits of Staor both the aon presented knowledged in a manne
County Gove
is responsiblure that the are that adequnancial stateState of Am
assurance thacept of reasosts and benefl should not
Independentnancial stateat the financi
NTY GOVE
nty Commisser, Presidenms, Vice Pre
ark, Commisw, Commissio
oupt Jr., Co
Commissionrt County
rt of Calvert ed. Calvert C
a report of itsaccountants
y with the prns of the U.Sates, Local Gaccuracy of th
in these repand belief, ter that presenernment and
le for establiassets of theuate and accments in con
merica (GAAat the financionable assurafits of establexceed the b
t Certified Pements. Theial statement
ERNMENT
sioners ntesidentssioner oner
ommissioner
ners of Calv
County, MaCounty Codes financial ps. The Counrovisions of tS. Office of MGovernmentsthe data and ports rests withe enclosed nts fairly theits compone
ishing and me governmencurate accounnformity wit
AP). The inteial statementance implieslishing increbenefit to be
Public Accoue goal of the ts of Calvert
r
Decem
vert County,
aryland for the of Public L
position and nty is also rethe Single AManagemens, and Non Pthe completith the Coundata are acc
e financial pent units.
maintaining ant are protectnting data arth accountinernal controlts will be fre
s a high degremental cont derived from
untants have independentt County Go
mber 20, 2012
he Fiscal Local Law activity, andquired to
Audit Act of nt and Profiteness and
nty’scurate in all position and
an internal ted from re compiled
ng principles l structure isee from ree of trol m it.
audited t audit is to vernment
2
d
s

-ii-
for the fiscal year ended June 30, 2012 are free of material misstatement. The independent audit involved examining, on a test basis, evidence supporting the amounts and disclosures in the financial statements; assessing the accounting principles used and significant estimates made by management; and evaluating the overall financial statement presentation. The independent auditor concluded based upon the audit, that there was a reasonable basis for rendering an unqualified (“clean”) opinion that the financial statements are fairly presented in conformity with GAAP. The auditor’s report is presented as the first component of the financial section of this report. Also prepared by the auditors is a “report on internal control over financial reporting and on compliance and other matters based on an audit of financial statements performed in accordance with government auditing standards”. This report is presented on pages 96 & 97.
GAAP require that management provide a narrative introduction, overview, and analysis to accompany the basic financial statements in the form of Management’s Discussion and Analysis (MD&A). This letter of transmittal is designed to complement MD&A and should be read in conjunction with it. The Calvert County Government’s MD&A can be found immediately following the report of the independent auditors on page 4.
PROFILE OF THE GOVERNMENT
Calvert County, Maryland was formed as one of the original counties in Maryland in 1654 and has a Commissioner form of government. A board of five Commissioners governs the County and serves the executive and legislative functions. The Commissioners operate under a Code of Public Local Laws of Calvert County, revised in 1985, and are subject to legislation adopted by the State Legislature. "Beginning with the general election to be held in Calvert County in November 1978, five county commissioners shall be elected by countywide vote. One shall be a resident of the first election district, one a resident of the second district, and one a resident of the third election district of the county. Of the remaining candidates, the two receiving the highest number of votes shall be selected. Commissioners who are elected and qualify shall take office the third Tuesday of December following election. Each commissioner shall hold office for 4 years or until a successor is elected and qualified (Code 1981, § 4-102; 1985,ch 715, § 2.)"
There are several other elected officials in Calvert County that include: Register of Wills, Sheriff, States Attorney, Treasurer, Mayor of the Town of Chesapeake Beach, Mayor of the Town of North Beach, Clerk of the Circuit Court, and five members of the Board of Education.
The Commissioners appoint a County Administrator who is responsible for the day-to-day administration of the County government. The Commissioners establish policy, enact ordinances, review and approve annual budgets, conduct public hearings and make decisions on land use matters. The Commissioners also appoint all department heads, members of boards and commissions and represent the county in dealings with other municipalities, the state and federal government. The office of the Commissioners is located at 175 Main Street, Prince Frederick, Maryland, 20678. The main phone number is 410-535-1600 and the website is www.co.cal.md.us.
Calvert County occupies 213 square miles, has 143 miles of shoreline, and serves a population of about 90,000. It is the smallest county in Southern Maryland. Despite recent

-iii-
growth, Calvert County retains its rural character and agrarian roots, offering good schools, a clean environment and good quality of life. Calvert is a peninsula, bounded by the Chesapeake Bay on the east and the Patuxent River on the west. Steep cliffs and woods predominate on the bay side, while along the Patuxent, rolling fields slip gently down to the river. The County’s many creeks provide refuge for wildlife, as well as scenic areas for boating and fishing.
Prince Frederick, the County seat, is located 35 miles southeast of Washington, D.C. and 55 miles south of Baltimore. There are two incorporated towns in Calvert County: North Beach and Chesapeake Beach, located on the bay at the northeast corner of the county. In addition, the Comprehensive Plan identifies seven "town centers." These include (from north to south) Dunkirk, Owings, Huntingtown, Prince Frederick, St. Leonard, Lusby, and Solomons.
The County provides a full range of municipal services, including: public safety, construction and maintenance of highways and streets, sanitation, health and social services, culture/recreation, education, public improvements, planning and zoning, and general administrative services. The County is also financially accountable for legally separate entities which are reported separately within the County’s financial statements. The entities that meet these criteria are the Calvert County Board of Education and the Economic Development Authority of Calvert County. Additional information on the component units can be found in Note 1.
Calvert County’s annual operating and capital budget represents a comprehensive financial plan for the County effective each year on the first day of July. Each County department, agency, or board receiving county funds submits a budget request to the Commissioners at a public hearing, via the Department of Finance and Budget. Additional public hearings are conducted to obtain taxpayer comments. On or before July 1 of each year, the budget is legally enacted through passage of a resolution. No expenditure of county funds may be made in excess of appropriation at the fund level. A Summary Schedule of Revenues, Expenditures, and Other Financing Sources and Uses - Budget and Actual (budgetary basis) can be found on page 65 of this report. The capital projects fund budget is prepared on a project length basis and, accordingly, annual budgetary comparisons are not presented in the basic financial statements and supplemental information.
FACTORS AFFECTING FINANCIAL CONDITION
Local economy: Conservative fiscal management has allowed the County to maintain a sound financial position. Property taxes and income taxes provide the majority (89 percent, budgetary basis, in fiscal year 2012) of the revenue for the General Fund of the Calvert County Government. Property taxes have finally succumbed to the underlying reality of weakening property values. Income tax revenue declined on a year over year basis in fiscal year 2009 and again in fiscal year 2010. In, fiscal year 2012, a new record level of income tax was realized. FY 2013 is expected to continue at this increased level.
Property tax, the largest revenue source, represented 62 percent of the total General Fund revenue for fiscal year 2012. Along with the rest of the Country, Calvert County’s property values have decreased from peak levels. This decrease in value is expected to lower the real property tax revenue in fiscal years 2013 and 2014. The number of residential building permits issued in fiscal year 2012 was 233, an increase of 11 percent or 23 permits from the

-iv-
prior fiscal year. Property taxes have been buoyed by public utility providers and in some cases increased.
Income tax revenue, at 27 percent of the total General Fund revenue for fiscal year 2012, is directly affected by personal income levels, employment levels, and population growth. The median household income for Calvert County in 2009 was $90,621, one of the highest levels in the nation for a county of our size. Income tax revenues were strong in FY 2012 and based on projections by the State of Maryland, moderate increases are expected to continue.
Long-term financial planning: Calvert County annually adopts a Capital Budget and prepares a five year Capital Improvement Plan. There is also a four year financial forecast prepared of general fund revenues and expenses. These are the County’s primary financial management planning tools.
The fiscal year 2013 budget reflected education, roads, and public facilities as the continued top priorities of the County’s administration. Within the Capital Improvements Program Budget for Fiscal Year 2013, 53 percent was dedicated to new school construction, additions, renovations, and the maintenance of existing facilities. Most of this allocation is for the replacement of Calvert High school.
The County continues its policy of maintaining a reserve of 8 percent of current budgeted General Fund expenditures to protect its high credit ratings. The County maintains additional reserve funds as a means to handle potential revenue shortfalls, to fund one-time non-recurring expenditures, or in the event of emergency or unplanned expenditures. In addition, the County has assigned a portion of fund balances for future other post- employment benefits and accrued leave. The County has experienced regular credit rating upgrades in recent years. The latest ratings, received during fiscal year 2012, were Aa1 from Moody’s Investors Service, Inc., AAA from Standard & Poor’s, and AAA from Fitch Ratings.
In 1990, the County adopted a debt affordability model to ensure that the debt levels are kept at an affordable, manageable, moderate level. A debt policy was adopted in FY 2009 to comply with the State of Maryland’s new requirement. The guidelines created in 1990 and ratified in this policy, establish maximum acceptable debt ratios. These ratios and their maximum acceptable levels are: 1) debt to assessed value, 4.5 percent, 2) debt service as a percent of general fund revenue, 9.5 percent, and 3) debt per capita $1,500. Using fiscal year 2012 data, the County’s current ratios are as follows: debt to assessed value is .90 percent, debt service to general fund revenue is 7.3 percent, and debt per capita is $1,437.
AWARDS AND ACKNOWLEDGEMENTS
The Government Finance Officers Association of the United States and Canada (GFOA) awarded a Certificate of Achievement for Excellence in Financial Reporting to Calvert County Government for its comprehensive annual financial report for the fiscal year ended June 30, 2011. In order to be awarded a Certificate of Achievement, a government must publish an easily readable and efficiently organized comprehensive annual financial report. This report must satisfy both generally accepted accounting principles and applicable legal requirements.

-v-
prior fiscal year. Property taxes have been buoyed by public utility providers and in some cases increased.
Income tax revenue, at 27 percent of the total General Fund revenue for fiscal year 2012, is directly affected by personal income levels, employment levels, and population growth. The median household income for Calvert County in 2009 was $90,621, one of the highest levels in the nation for a county of our size. Income tax revenues were strong in FY 2012 and based on projections by the State of Maryland, moderate increases are expected to continue.
Long-term financial planning: Calvert County annually adopts a Capital Budget and prepares a five year Capital Improvement Plan. There is also a four year financial forecast prepared of general fund revenues and expenses. These are the County’s primary financial management planning tools.
The fiscal year 2013 budget reflected education, roads, and public facilities as the continued top priorities of the County’s administration. Within the Capital Improvements Program Budget for Fiscal Year 2013, 53 percent was dedicated to new school construction, additions, renovations, and the maintenance of existing facilities. Most of this allocation is for the replacement of Calvert High school.
The County continues its policy of maintaining a reserve of 8 percent of current budgeted General Fund expenditures to protect its high credit ratings. The County maintains additional reserve funds as a means to handle potential revenue shortfalls, to fund one-time non-recurring expenditures, or in the event of emergency or unplanned expenditures. In addition, the County has assigned a portion of fund balances for future other post- employment benefits and accrued leave. The County has experienced regular credit rating upgrades in recent years. The latest ratings, received during fiscal year 2012, were Aa1 from Moody’s Investors Service, Inc., AAA from Standard & Poor’s, and AAA from Fitch Ratings.
In 1990, the County adopted a debt affordability model to ensure that the debt levels are kept at an affordable, manageable, moderate level. A debt policy was adopted in FY 2009 to comply with the State of Maryland’s new requirement. The guidelines created in 1990 and ratified in this policy, establish maximum acceptable debt ratios. These ratios and their maximum acceptable levels are: 1) debt to assessed value, 4.5 percent, 2) debt service as a percent of general fund revenue, 9.5 percent, and 3) debt per capita $1,500. Using fiscal year 2012 data, the County’s current ratios are as follows: debt to assessed value is .90 percent, debt service to general fund revenue is 7.3 percent, and debt per capita is $1,437.
AWARDS AND ACKNOWLEDGEMENTS
The Government Finance Officers Association of the United States and Canada (GFOA) awarded a Certificate of Achievement for Excellence in Financial Reporting to Calvert County Government for its comprehensive annual financial report for the fiscal year ended June 30, 2011. In order to be awarded a Certificate of Achievement, a government must publish an easily readable and efficiently organized comprehensive annual financial report. This report must satisfy both generally accepted accounting principles and applicable legal requirements.
A Certificurrent cAchievemeligibility
The Counannual buBudget Apolicy dobelieve osubmitted
The prepdedicatedthe departhis repor
I would aleadershia respons
icate of Achiomprehensivment Programy for another
nty also receudget dated
Award, the Cocument, opeour current bd it to the GF
paration of thd service of trtment has mrt and accura
also like to thip and supposible manner
ievement is vve annual finm’s requiremr certificate.
eived the GFJuly 1, 2011
County must erations guidudget continFOA to dete
he comprehethe entire sta
my sincere apately recordi
hank the Coort in planninr.
valid for a pnancial reporments and w
FOA Award 1 to June 30, publish a bu
de, financialnues to confoermine its eli
nsive annuaaff of the Finppreciation fing the day t
unty Commng and condu
period of onert continues
we are submit
for Distingu2012. In or
udget documplan, and co
orm to progrigibility for a
al financial renance and Bufor the contrito day transa
issioners anducting the fin
Resp
TimDire
e year only. Wto meet the
tting it to the
uished Budgerder to qualif
ment that meeommunicatioram requiremanother awa
eport was mudget Depaributions madactions that m
d the Countynancial oper
pectfully sub
m Hayden, CPector, Financ
We believe tCertificate o
e GFOA to d
et Presentatify for this Dets program ons mediumments and haard.
made possiblertment. Eachde in the premake up the
y Administrarations of the
bmitted,
PA, CMA ce and Budg
that our ofdetermine its
ion for its Distinguished
criteria as a m. We ave
e by the h member o
eparation of report.
ator for theire County in
get
s
d
f
r

-vi-

-vii-
COUNTY COMMISSIONERS OF CALVERT COUNTY ___________________________
CERTAIN ELECTED OFFICIALS Pat Nutter
President, Board of County Commissioners
Steven R. Weems Vice President, Board of County Commissioners
Susan Shaw Commissioner
Gerald W. Clark Commissioner
Evan K. Slaughenhoupt Jr. Commissioner
Novalea Tracy-Soper Treasurer
___________________________
CERTAIN APPOINTED OFFICIALS
Terry L. Shannon County Administrator
Timothy Hayden Director of Finance and Budget
Charles R. Johnston Director of Planning and Zoning
Linda Vassallo Director of Economic Development
Terry P. Carlson, P.E. Director of Public Works
Jacqueline K. Vaughan Director of Public Safety
___________________________

-viii-
Citi
zens
Boa
rdof
Cou
nty
Com
mis
sion
ers
Cou
nty
Adm
inis
trat
orC
ount
yA
ttorn
ey
Pers
onne
lPl
anni
ngA
ndZo
ning
Gen
eral
Serv
ices
Publ
icSa
fety
Fina
nce
and
Bud
get
Publ
icW
orks
Econ
omic
Dev
elop
men
tTe
chno
logy
Serv
ices
Com
mun
ityR
esou
rces
Publ
icTr
ansp
orta
tion
Fam
ilyN
etw
ork
Agi
ng
CA
ASA
Nat
ural
Res
ourc
es
Mos
quito
Con
trol
Park
san
dR
ecre
atio
n
Mar
ine
Mus
eum
Bui
ldin
gsA
ndG
roun
ds
Rai
lway
Mus
eum
Prog
ram
s,D
ata,
and
Spec
ialP
roje
cts
Zoni
ngan
dPe
rmits
Plan
ning
and
Plan
Rev
iew
Boa
rdof
App
eals
Emer
genc
yM
anag
emen
t
Con
trol
Cen
ter
Volu
ntee
rFire
Com
pani
es
Fals
eA
larm
Red
uctio
n
Fire
/Res
cue/
EMS
Solid
Was
te
Ente
rpris
eFu
nd-
Wat
erA
ndSe
wer
Engi
neer
ing
CA
LVER
TC
OU
NTY
GO
VER
NM
ENT
175
Mai
nS
treet
,Prin
ceFr
eder
ick,
MD
2067
8Lo
cal:
410-
535-
1600
;Met
ro:3
01-8
55-1
243
calv
ertc
ount
y@co
.cal
.md.
us
Elec
tions
Boa
rd
Mai
nten
ance
Trea
sure
r’s O
ffice
Cap
italP
roje
cts
Bus
ines
sD
evel
opm
ent
Bus
ines
sR
eten
tion
and
Out
reac
h
Mar
ketin
g,To
uris
m,
&Pu
blic
Info
rmat
ion
Posi
tion
Cla
ssifi
catio
n,&
Empl
oyee
Rel
atio
ns
Rec
ruitm
ent,
Sele
ctio
n&
Staf
fing
Acc
ount
ing
Bud
get
Purc
hasi
ng
Ris
kM
anag
emen
t
App
licat
ions
GIS
Net
wor
k

Financial Section
Citi
zens
Boa
rdof
Cou
nty
Com
mis
sion
ers
Cou
nty
Adm
inis
trat
orC
ount
yA
ttorn
ey
Pers
onne
lPl
anni
ngA
ndZo
ning
Gen
eral
Serv
ices
Publ
icSa
fety
Fina
nce
and
Bud
get
Publ
icW
orks
Econ
omic
Dev
elop
men
tTe
chno
logy
Serv
ices
Com
mun
ityR
esou
rces
Publ
icTr
ansp
orta
tion
Fam
ilyN
etw
ork
Agi
ng
CA
ASA
Nat
ural
Res
ourc
es
Mos
quito
Con
trol
Park
san
dR
ecre
atio
n
Mar
ine
Mus
eum
Bui
ldin
gsA
ndG
roun
ds
Rai
lway
Mus
eum
Prog
ram
s,D
ata,
and
Spec
ialP
roje
cts
Zoni
ngan
dPe
rmits
Plan
ning
and
Plan
Rev
iew
Boa
rdof
App
eals
Emer
genc
yM
anag
emen
t
Con
trol
Cen
ter
Volu
ntee
rFire
Com
pani
es
Fals
eA
larm
Red
uctio
n
Fire
/Res
cue/
EMS
Solid
Was
te
Ente
rpris
eFu
nd-
Wat
erA
ndSe
wer
Engi
neer
ing
CA
LVER
TC
OU
NTY
GO
VER
NM
ENT
175
Mai
nS
treet
,Prin
ceFr
eder
ick,
MD
2067
8Lo
cal:
410-
535-
1600
;Met
ro:3
01-8
55-1
243
calv
ertc
ount
y@co
.cal
.md.
us
Elec
tions
Boa
rd
Mai
nten
ance
Trea
sure
r’s O
ffice
Cap
italP
roje
cts
Bus
ines
sD
evel
opm
ent
Bus
ines
sR
eten
tion
and
Out
reac
h
Mar
ketin
g,To
uris
m,
&Pu
blic
Info
rmat
ion
Posi
tion
Cla
ssifi
catio
n,&
Empl
oyee
Rel
atio
ns
Rec
ruitm
ent,
Sele
ctio
n&
Staf
fing
Acc
ount
ing
Bud
get
Purc
hasi
ng
Ris
kM
anag
emen
t
App
licat
ions
GIS
Net
wor
k

“THIS PAGE LEFT INTENTIONALLY BLANK”

-1-
INDEPENDENT AUDITOR’S REPORT
County Commissioners of Calvert County, MarylandPrince Frederick, Maryland
We have audited the accompanying financial statements of the governmental activities, the business-type activities, the aggregate discretely presented component units, each major fund, and the aggregate remaining fund information of the County Commissioners of Calvert County, Maryland, as of and for the year ended June 30, 2012, which collectively comprise the County’s basic financial statements as listed in the table of contents. These financial statements are the responsibility of the County Commissioners of Calvert County, Maryland’s management. Our responsibility is to express opinions on these financial statements based on our audit. We did not audit the financial statements of the Calvert County Board of Education, which represent 38 percent, 50 percent and 48 percent, respectively of the assets, net position and revenues of the total reporting entity. Those financial statements were audited by other auditors whose report thereon has been furnished to us, and our opinion, insofar as it relates to the amounts included for the Calvert County Board of Education, is based on the report of the other auditors.
We conducted our audit in accordance with auditing standards generally accepted in the United States of America and the standards applicable to financial audits contained in Government Auditing Standards, issued by the Comptroller General of the United States. Those standards require that we plan and perform the audit to obtain reasonable assurance about whether the financial statements are free of material misstatement. An audit includes examining, on a test basis, evidence supporting the amounts and disclosures in the financial statements. An audit also includes assessing the accounting principles used and the significant estimates made by management, as well as evaluating the overall financial statement presentation. We believe that our audit and the report of other auditors provide a reasonable basis for our opinions.

-2-
In our opinion, based on our audit and the report of other auditors, the financial statements referred to above present fairly, in all material respects, the respective financial position of the governmental activities, the business-type activities, the aggregate discretely presented component units, each major fund, and the aggregateremaining fund information of the County Commissioners of Calvert County, Maryland, as of June 30, 2012, and the respective changes in financial position, and cash flows, where applicable, thereof for the year then ended in conformity with accounting principles generally accepted in the United States of America.
In accordance with Government Auditing Standards, we have also issued our report dated December 19, 2012, on our consideration of the County Commissioners of Calvert County, Maryland’s internal control over financial reporting and on our tests of its compliance with certain provisions of laws, regulations, contracts, and grant agreements and other matters. The purpose of that report is to describe the scope of our testing of internal control over financial reporting and compliance and the results of that testing, and not to provide an opinion on internal control over financial reporting or on compliance. That report is an integral part of an audit performed in accordance with Government Auditing Standards and should be considered in assessing the results of our audit.
Accounting principles generally accepted in the United States of America require that the management’s discussion and analysis, budgetary comparison information, and historical pension and other post employment benefit schedules on pages 4 through 15 and 65 through 69 be presented to supplement the basic financial statements. Such information, although not a part of the basic financial statements, is required by the Governmental Accounting Standards Board, who considers it to be an essential part of financial reporting for placing the basic financial statements in an appropriate operational, economic, or historical context. We and the other auditors have applied certain limited procedures to the required supplementary information in accordance with auditing standards generally accepted in the United States of America, which consisted of inquiries of management about the methods of preparing the information and comparing the information for consistency with management’s responses to our inquiries, the basic financial statements, and other knowledge we obtained during our audit of the basic financial statements. We do not express an opinion or provide any assurance on the information because the limited procedures do not provide us with sufficient evidence to express an opinion or provide any assurance.
Our audit was conducted for the purpose of forming opinions on the financial statements that collectively comprise the County Commissioners of Calvert County, Maryland’s financial statements as a whole. The introductory section, combining and individual nonmajor fund financial statements, and statistical section are presented for purposes of additional analysis and are not a required part of the financial statements.The combining and individual nonmajor fund financial statements and schedules listed in the table of contents under other supplemental information are the responsibility of management and were derived from and relate directly to the underlying accounting and

-3-
other records used to prepare the financial statements. The information has been subjected to the auditing procedures applied by us and the other auditors in the audit of the financial statements and certain additional procedures, including comparing and reconciling such information directly to the underlying accounting and other records used to prepare the financial statements or to the financial statements themselves, and other additional procedures in accordance with auditing standards generally accepted in the United States of America. In our opinion, based on our audit and the report of other auditors, the information is fairly stated in all material respects in relation to the financial statements as a whole. The introductory and statistical sections have not been subjected to the auditing procedures applied by us and the other auditors in the audit of the basic financial statements and, accordingly, we do not express an opinion or provide any assurance on them.
Clinton, Maryland December 19, 2012

-4-
COUNTY COMMISSIONERS OF CALVERT COUNTY, MARYLAND
MANAGEMENT’S DISCUSSION AND ANALYSIS
This section of the Annual Financial Report of Calvert County, Maryland presents a narrative overview and analysis of the financial activities of Calvert County Government for the fiscal year ended June 30, 2012. We encourage readers to use the information presented here in conjunction with the accompanying basic financial statements and the accompanying notes to those financial statements.
Financial Highlights
Government-wide:
• The assets of Calvert County Government exceeded its liabilities at the close of the most recent fiscal year by $207.9 million (net position). 18 percent of this amount is attributable to the business-type activities that include the Water and Sewer Fund, the Solid Waste and Recycling Fund, the Calvert Marine Museum and the Chesapeake Hills Golf Course. Of total net position, $38.6 million (unrestricted net position) may be used to meet ongoing obligations to citizens and creditors ($36.5 million of this amount is related to governmental activities and $2.1 million is attributable to the business-type activities), $20.2 million is restricted for specific purposes (restricted net position), and $149.1 million is invested in capital assets, net of related debt. Included as restricted cash is $32.5 million of which $30.4 million represents bond proceeds.
• The government’s total net position has decreased by $103,501; a $188,991 increase was related to the governmental activities and a decrease of $292,492 was related to the business-type activities.
Fund Level:
• In accordance with Governmental Accounting Standards Board Statement No. 54, effective for the year ended June 30, 2011, new fund balance categories were established for financial reporting purposes of all governmental funds. These new categories, nonspendable, restricted, committed, assigned, and unassigned, were established to enhance fund balance presentation and improve the usefulness of fund balance information.
• As of June 30, 2012, the County’s governmental funds reported combined fund balances of $120.0 million, a decrease of $8.4 million from the prior year. Approximately 84.3 percent of this total amount, $101.2 million is available to meet the County’s current and future needs (committed, assigned and unassigned). Of this total, $73.8 million (prior year, $81.6 million) has been dedicated for certain purposes, including, $36.1 million for approved capital projects, $3.5 million for employee leave obligations payouts, $8.1 million for purposes within special revenue funds and $4.7 million for other post employment benefits (GASB 45).
• The proprietary funds operating revenue increased by $300,316 or 1.8 percent.

-5-
• At the close of the current fiscal year, the available fund balance for the General Fund was $57.0 million (committed, assigned and unassigned), or 23.9 percent of total fiscal year 2012 General Fund budgetary expenditures and other financing uses. Nonspendable and restricted fund balance of the General Fund was $9.5 million, or 14.4 percent of fund balance.
• Calvert County Government issued new general obligation bonds of $9.4 million during fiscal year 2012. The purpose of this debt was to finance several major capital projects including Calvert High School, the Substance Abuse Center, College of Southern Maryland and water and sewer projects.
Overview of the Financial Statements
This discussion and analysis is intended to serve as an introduction to Calvert County Government’s basic financial statements. Calvert County Government’s basic financial statements are comprised of three components: 1) government-wide financial statements, 2) fund financial statements, and 3) notes to the financial statements. This report also contains other required and non-required supplementary information.
Government-wide financial statements: The government-wide financial statements are designed to provide readers with a broad overview of Calvert County Government’s finances, in a manner comparable to a private-sector business. The government-wide financial statements can be found on pages 16 to 18 of this report. These statements are described next:
The statement of net position presents information on all of Calvert County Government’s assets and liabilities, with the difference between the two reported as netposition. Over time, increases or decreases in net position may serve as a useful indicator of whether the financial position and condition of Calvert County Government is improving or deteriorating.
The statement of activities presents information showing how the government’s net position changed during the most recent fiscal year. All changes in net position are reported as soon as the underlying event giving rise to the change occurs, regardless of the timing of related cash flows. Thus, revenues and expenses are reported in this statement for some items that will only result in cash flows in future fiscal periods (e.g., uncollected taxes and earned but unused vacation leave).
Both of the government-wide financial statements distinguish functions of Calvert County Government that are principally supported by taxes and intergovernmental revenues (governmental activities) from other functions that are intended to recover all or a significant portion of their costs through user fees and charges (business-type activities). The governmental activities of Calvert County Government include: general government, public safety, public works, health and hospitals, social services, education, recreation and culture, conservation of natural resources, urban development and housing, economic development, and debt service. The business-type activities of Calvert County Government include: water and sewer, solid waste & recycling, Calvert Marine Museum operations and the Chesapeake Hills Golf Course.

-6-
The government-wide financial statements include not only Calvert County Government itself (known as the primary government), but also legally separate component units. Calvert County Government has the following component units: Calvert County Board of Education and Economic Development Authority. Financial information for these component units is reported separately from the financial information presented for the primary government itself.
Fund financial statements: A fund is a grouping of related accounts that is used to maintain control over resources that have been segregated for specific activities or objectives. Calvert County Government, like other state and local governments, uses fund accounting to ensure and demonstrate compliance with finance-related legal requirements. All of the funds of Calvert County Government can be divided into three categories: governmental funds, proprietary funds, and fiduciary funds.
Governmental funds: Governmental funds are used to account for essentially the same functions reported as governmental activities in the government-wide financial statements. However, unlike the government-wide financial statements, governmental fund financial statements focus on near-term inflows and outflows of spendable resources, as well as on balances of spendable resources available at the end of the fiscal year. Such information may be useful in evaluating a government’s near-term financing requirements.
Because the focus of governmental funds is narrower than that of the government-wide financial statements, it is useful to compare the information presented for governmental funds with similar information presented for governmental activities in the government-wide financial statements. By doing so, readers may better understand the long-term impact of the government’s near-term financing decisions. Both the governmental fund balance sheet and the governmental fund statement of revenues, expenditures, and changes in fund balances provide a reconciliation to facilitate this comparison between governmental funds and governmental activities.
Calvert County Government maintains 13 individual governmental funds: the General, Planning and Zoning, Board of Library Trustees, Parks and Recreation, Bar Library, Economic Development Authority Revolving Loan, Revolving Loan, Calvert County Family Network, Excise Tax, Economic Development Incentive, Grants, Land Preservation, and Capital Projects funds. Information is presented separately in the governmental fund balance sheet and in the governmental fund statement of revenues, expenditures, and changes in fund balances for the general and capital projects funds with a summary of the other funds, referred to as nonmajor governmental funds.
Calvert County Government adopts an annual appropriated budget for its General Fund. To demonstrate compliance with this budget, a budgetary comparison statement has been provided for the General Fund, the County’s primary fund. The summary schedule on a budgetary basis for the General Fund can be found in the Required Supplementary Information section on page 68 of this report.
Proprietary funds: Proprietary funds, also known as enterprise funds, are used to report the same functions presented as business-type activities in the government-wide financial statements. Calvert County Government uses enterprise funds to account for its water and sewer, solid waste and recycling, Calvert Marine Museum and Chesapeake Hills Golf Course activities. Note that the Calvert Marine Museum and Chesapeake Hills Golf Course are combined in the column “Nonmajor Proprietary Funds” in the basic proprietary fund financial statements found on pages 22 to 24 of this report.

-7-
Fiduciary funds: Fiduciary funds are used to account for resources held for the benefit of parties outside the government. Fiduciary funds are not reflected in the government-wide financial statement because the resources of those funds are not available to support Calvert County Government’s own programs. The accounting used for fiduciary funds is much like that used for proprietary funds. The basic fiduciary fund financial statements can be found on pages 25 and 26 of this report.
Notes to the financial statements: The notes provide additional information that is essential to a full understanding of the data provided in the government-wide and fund financial statements. The notes to the financial statements are part of the basic financial statements and can be found on pages 27 to 64 of this report.
Other information: In addition to the basic financial statements and accompanying notes, this report also presents certain required supplementary information, other supplementary information, and a statistical section concerning Calvert County Government. Other supplementary information can be found beginning on page 70 of this report.
Government-wide Financial Analysis
This is the eleventh reporting period that the Governmental Accounting Standards Board (GASB) Statement No. 34 has been applied in the preparation of the financial statements of Calvert County Government.
As noted earlier, net position may serve over time as a useful indicator of a government’s overall financial condition and position. In fiscal year 2012 assets exceeded liabilities by $207.9 million (prior year, $208.0 million).
As shown in the chart on the following page titled “Calvert County Government’s Changes in Net Position” Calvert County Government’s net position is divided into three categories:
• invested in capital assets, net of related debt; o 71.7 percent of total net position (69.5 percent, prior year)
• restricted net position; o 9.4 percent of total net position (9.4 percent, prior year)
• unrestricted net position o 18.9 percent of total net position (21.2 percent, prior year)
Investment in capital assets net of depreciation includes the County’s purchases of land and easements, buildings, machinery, equipment, infrastructure and improvements, less any un-matured debt used to acquire those assets. The County uses these capital assets to provide services to citizens. Restricted net position are resources that are subject to external restrictions on how they may be used. Unrestricted net position may be used to meet the government’s ongoing obligations to citizens and creditors.

-8-
The following table indicates the changes in net position for governmental and business-type activities:
Governmental activities: Net position of the Governmental activities increased by $188,991 (prior year, an increase of $12.6 million). Fiscal Year 2012’s increase was limited, in part; by the use of some of the estimated surplus to forward fund some of the County’s planned Fiscal Year 2013 expenses.
Business-type activities: Business-type activities decreased Calvert County Government’s net position by $292,492 (prior year, a decrease of $481,549). This decrease is the result of the Chesapeake Hills Golf Course and Calvert Marine Museum’s net position decreasing partially offset by the positive results of the Water and Sewer Fund and Solid Waste fund.
The Board of County Commissioners began a seven year water and sewer rate plan in January 2006 to phase-in rate adjustments so that revenues will eventually cover the costs of operations. Until such time that the rates have been fully adjusted, the County plans to use reserves to fund the deficit for the Water and Sewer Fund. At the end of fiscal year 2012, the long term part of these advances total $5.9 million. This deficit is anticipated to be in excess of $8.2 million at the end of the phase-in period. The Board of County Commissioners will determine the payback method of this amount when the phase-in is complete.
The Solid Waste and Recycling Fund had an increase in net position of $100,358, explained by positive operating results. Lowered revenues due to the economically sensitive waste stream were offset by strong cost controls. The Calvert Marine Museum had a decrease of $317,291 in net position. The Chesapeake Hills Golf Course decreased by $221,663 to net position. Fiscal year 2012 was the third year that the County’s Parks and Recreation division managed the golf course. Although posting an accrual accounting basis loss of $407,458, on a cash basis (with the most significant adjustment being depreciation) the golf course came out slightly ahead.
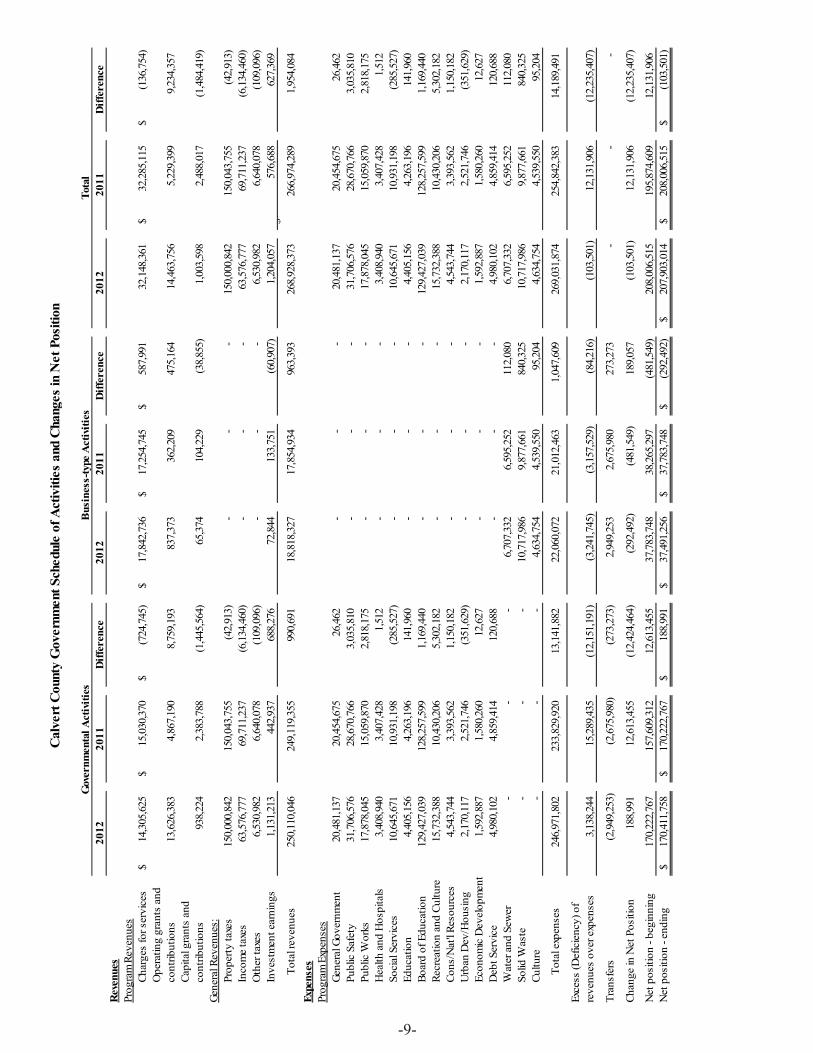
The chart on the following page reflects the revenues and program expenses for the governmental and the business-type activities and the changes in net position for the year ended June_30:
2012 2011 Difference 2012 2011 Difference 2012 2011 Difference
Current and other assets 180,626,550$ 190,351,003$ (9,724,453)$ 9,928,624$ 7,024,466$ 2,904,158$ 190,555,174$ 197,375,469$ (6,820,295)$ Capital assets 184,902,951 180,174,725 4,728,226 49,200,956 48,543,997 656,959 234,103,907 228,718,722 5,385,185
Total Assets 365,529,501$ 370,525,728$ (4,996,227) 59,129,580 55,568,463 3,561,117 424,659,081 426,094,191 (1,435,110)
Long-term liabilities 138,861,937$ 139,303,679$ (441,742)$ 18,057,479$ 15,209,948$ 2,847,531$ 156,919,416$ 154,513,627$ 2,405,789$ Other liabilities 56,255,806 60,999,282 (4,743,476) 3,580,845 2,574,767 1,006,078 59,836,651 63,574,049 (3,737,398)
Total Liabilities 195,117,743$ 200,302,961$ (5,185,218) 21,638,324 17,784,715 3,853,609 216,756,067 218,087,676 (1,331,609)
Net Position:Invested in capital assets, net of related debt 116,545,107$ 109,943,246$ 6,601,861$ 32,568,768$ 34,549,717$ (1,980,949)$ 149,113,875$ 144,492,963$ 4,620,912$ Restricted 17,390,548 17,137,497 253,051 2,787,892 2,336,457 451,435 20,178,440 19,473,954 704,486 Unrestricted 36,476,103 43,142,024 (6,665,921) 2,134,596 897,574 1,237,022 38,610,699 44,039,598 (5,428,899)
Total Net Position 170,411,758$ 170,222,767$ 188,991$ 37,491,256$ 37,783,748$ (292,492)$ 207,903,014$ 208,006,515$ (103,501)$
Governmental Activities Business-type Activities Total
Calvert County's Government's Change in Net Position
-9-
2012
2011
Diff
eren
ce20
1220
11D
iffer
ence
2012
2011
Diff
eren
ceR
even
ues
Prog
ram
Rev
enue
sCh
arge
s fo
r ser
vice
s14
,305
,625
$
15,0
30,3
70$
(724
,745
)$
17,8
42,7
36$
17
,254
,745
$
58
7,99
1$
32,1
48,3
61
32,2
85,1
15$
(136
,754
)$
Ope
ratin
g gr
ants
and
co
ntrib
utio
ns13
,626
,383
4,86
7,19
0
8,75
9,19
3
837,
373
362,
209
47
5,16
4
14,4
63,7
56
5,22
9,39
9
9,
234,
357
Ca
pita
l gra
nts
and
cont
ribut
ions
938,
224
2,38
3,78
8
(1,4
45,5
64)
65,3
74
10
4,22
9
(38,
855)
1,
003,
598
2,48
8,01
7
(1
,484
,419
)
Ge
nera
l Rev
enue
s:Pr
oper
ty ta
xes
150,
000,
842
150,
043,
755
(42,
913)
-
-
-
15
0,00
0,84
2
15
0,04
3,75
5
(4
2,91
3)
In
com
e ta
xes
63,5
76,7
77
69
,711
,237
(6
,134
,460
)
-
-
-
63,5
76,7
77
69,7
11,2
37
(6,1
34,4
60)
Oth
er ta
xes
6,53
0,98
2
6,64
0,07
8
(109
,096
)
-
-
-
6,
530,
982
6,64
0,07
8
(1
09,0
96)
In
vest
men
t ear
ning
s1,
131,
213
44
2,93
7
68
8,27
6
72
,844
133,
751
(6
0,90
7)
1,20
4,05
7
57
6,68
8
627,
369
-$
Tota
l rev
enue
s25
0,11
0,04
6
24
9,11
9,35
5
99
0,69
1
18
,818
,327
17,8
54,9
34
963,
393
26
8,92
8,37
3
26
6,97
4,28
9
1,
954,
084
Ex
pens
esPr
ogra
m E
xpen
ses
Gene
ral G
over
nmen
t20
,481
,137
20,4
54,6
75
26,4
62
-
-
-
20,4
81,1
37
20,4
54,6
75
26,4
62
Pu
blic
Saf
ety
31,7
06,5
76
28
,670
,766
3,
035,
810
-
-
-
31,7
06,5
76
28,6
70,7
66
3,03
5,81
0
Publ
ic W
orks
17,8
78,0
45
15
,059
,870
2,
818,
175
-
-
-
17,8
78,0
45
15,0
59,8
70
2,81
8,17
5
Hea
lth a
nd H
ospi
tals
3,40
8,94
0
3,40
7,42
8
1,51
2
-
-
-
3,
408,
940
3,40
7,42
8
1,
512
So
cial
Ser
vice
s10
,645
,671
10,9
31,1
98
(285
,527
)
-
-
-
10
,645
,671
10
,931
,198
(2
85,5
27)
Ed
ucat
ion
4,40
5,15
6
4,26
3,19
6
141,
960
-
-
-
4,
405,
156
4,26
3,19
6
14
1,96
0
Bo
ard
of E
duca
tion
129,
427,
039
128,
257,
599
1,16
9,44
0
-
-
-
12
9,42
7,03
9
12
8,25
7,59
9
1,
169,
440
Re
crea
tion
and
Cultu
re15
,732
,388
10,4
30,2
06
5,30
2,18
2
-
-
-
15
,732
,388
10
,430
,206
5,
302,
182
Co
ns/N
at'l R
esou
rces
4,54
3,74
4
3,39
3,56
2
1,15
0,18
2
-
-
-
4,
543,
744
3,39
3,56
2
1,
150,
182
U
rban
Dev
/Hou
sing
2,17
0,11
7
2,52
1,74
6
(351
,629
)
-
-
-
2,
170,
117
2,52
1,74
6
(3
51,6
29)
Ec
onom
ic D
evel
opm
ent
1,59
2,88
7
1,58
0,26
0
12,6
27
-
-
-
1,59
2,88
7
1,
580,
260
12,6
27
D
ebt S
ervi
ce4,
980,
102
4,
859,
414
12
0,68
8
-
-
-
4,98
0,10
2
4,
859,
414
120,
688
Wat
er a
nd S
ewer
-
-
-
6,
707,
332
6,
595,
252
112,
080
6,
707,
332
6,59
5,25
2
11
2,08
0
So
lid W
aste
-
-
-
10
,717
,986
9,87
7,66
1
84
0,32
5
10,7
17,9
86
9,87
7,66
1
84
0,32
5
Cu
lture
-
-
-
4,
634,
754
4,
539,
550
95,2
04
4,
634,
754
4,53
9,55
0
95
,204
To
tal e
xpen
ses
246,
971,
802
233,
829,
920
13,1
41,8
82
22
,060
,072
21,0
12,4
63
1,04
7,60
9
26
9,03
1,87
4
25
4,84
2,38
3
14
,189
,491
3,13
8,24
4
15,2
89,4
35
(12,
151,
191)
(3,2
41,7
45)
(3,1
57,5
29)
(84,
216)
(1
03,5
01)
12,1
31,9
06
(12,
235,
407)
Tran
sfer
s(2
,949
,253
)
(2
,675
,980
)
(273
,273
)
2,94
9,25
3
2,67
5,98
0
27
3,27
3
-
-
-
Chan
ge in
Net
Pos
ition
188,
991
12,6
13,4
55
(12,
424,
464)
(292
,492
)
(481
,549
)
189,
057
(1
03,5
01)
12,1
31,9
06
(12,
235,
407)
Net
pos
ition
- be
ginn
ing
170,
222,
767
157,
609,
312
12,6
13,4
55
37
,783
,748
38,2
65,2
97
(481
,549
)
208,
006,
515
195,
874,
609
12,1
31,9
06
N
et p
ositi
on -
endi
ng17
0,41
1,75
8$
17
0,22
2,76
7$
18
8,99
1$
37
,491
,256
$
37,7
83,7
48$
(292
,492
)$
207,
903,
014
$
208,
006,
515
$
(103
,501
)$
Cal
vert
Cou
nty
Gov
ernm
ent S
ched
ule
of A
ctiv
ities
and
Cha
nges
in N
et P
ositi
on
Gov
ernm
enta
l Act
iviti
esB
usin
ess-
type
Act
iviti
esTo
tal
Exce
ss (D
efic
ienc
y) o
f re
venu
es o
ver e
xpen
ses

-10-
The two contributcontributThis tranBenefits million iincome ta
The majocompleteresult ofwere inc“capitalizas expencapital as
The nextprogram 52 percenpurposes
most signiftions and intions is mosnsfer was int
Trust fund,is due mostlax. That cha
ority of the ded capital assf multi-year curred in theze” the assetnses and thosset for the S
two charts urevenues annt of the tota:
ficant differencome taxesstly the resutended to ass, co-owned ly to the Stange was ab
differences nsets. The $5capital proje capital prt. Remembe
ose expensesStatement of
use data fromnd expenses bal program e
ences in the s. The $8
ult of a transsist the Couby the Cou
tate’s changeout $4 millio
noted in the e5.3 million Rects that we
roject fund, er that the ms are reclassf Net Position
m the Statemby function. xpenses the
revenue sec.8 million dsfer from th
unty with theunty and BOe in estimaton.
expense sectRecreation anere completethe “functio
modified GAsified (by lon.
ment of Activ The Board chart becom
ction are reldifference i
he County’s e funding ofOE. The Inte of the Co
tion are relatnd Culture ded in FY 20onal aspect”
AAP statemeowering the
vities that md of Educatiomes meaning
lated to operin the operaBoard of E
f the Other Pncome tax ounty’s shar
ted to classifdifference, fo011. Althou” of the expents show th
expense) a
atches goveron is not inclgless for com
rating grantating grants
Education (BPost-Employdecrease ofre of unallo
fying by funor example, ugh the exppense is us
hese capital aand recordin
rnmental luded becaus
mparison
s and s and BOE).yment f $6.1ocated
nction is the enses ed to assets
ng the
se at

-11-
This chaactivities
art uses the s program rev
Statement ovenue and ex
of Activitiesxpenses:
data to dissplay a commparison of tthe businesss-type

-12-
This chabusiness–
Financia
As notedcomplian
Governmprovide iinformatiparticulargovernm
As reporcombined(prior yedecrease.million o
Approxim$108.4 mfor spend$81.6 mremaindeindicate
art uses the –type activit
al Analysis o
d earlier, Cance with fina
mental fundsinformation ion is usefur, committed
ment’s net res
rted on the d fund balan
ear, increase. General O
of capital pro
mately 84 pmillion) consding at the g
million) of ther of fund bthat it is no
revenues froties revenues
of the Gover
alvert Countyance-related
ds: The focon near-term
ul in assessd, assigned asources avail
balance shnce is $120.0 of $17.4 m
Obligation booject expense
ercent (priotitutes commgovernment’his amount balance, $18ot available
om the States by source:
rnment’s Fu
y Governmelegal require
cus of Calvem inflows, oing Calvert
and unassignlable for spe
heet of the 0 million (pr
million). Thonds with a es were incu
r year, 84 pmitted, assign’s discretion
has been 8.8 million for new spe
ement of A
unds
ent uses funements.
ert County Goutflows, and
County Goned fund balanding at the
governmentrior year, $1he capital pr
par value ourred, both o
percent) of tned and una
n. It should committedor 15.7 percending becau
ctivities to
nd accountin
Governmentd balances oovernment’sances may s end of the f
tal funds, th28.4 million
rojects fund of $6.4 millif which wou
this amountassigned fund
be noted thor assignedcent, is nonuse it has a
display a co
ng to ensure
t’s governmof spendables financing serve as a usfiscal year.
he total govn), a decreas
saw the larion were refuld impact th
, $101.2 mid balance, w
hat $73.8 mid for certainnspendable aalready been
omparison o
and demon
ental funds resources. requirementeful measure
vernmental fse of $8.4 mrgest part ofunded and $hat fund bala
illion (prior which is avaiillion (prior n purposes.and restrict
n dedicated:
of the
strate
is to Such
ts. In e of a
fundsmillion
f this $21.7ance.
year,ilable year, The
ted to 1) to

-13-
liquidate contracts and purchase orders of the prior period, 2) for inventories, or 3) dedicated for a variety of constrained purposes. Additional details of fund balance are presented in Note 8 within the notes section of these financial statements.
The General Fund is the chief operating fund of Calvert County Government. At the end of the current fiscal year, the assigned and unassigned fund balance of the General Fund was $35.5 million (prior year, $36.0 million), while total fund balance was $66.5 million (prior year, $66.5 million). As a measure of the General Fund’s liquidity, it may be useful to compare both assigned and unassigned fund balance and total fund balance to total fund expenditures. Assigned and unassigned fund balance represents 15.0 percent of the total General Fund budgetary expenditures and other financing uses (prior year, 16.2 percent), while total fund balance represents 28.0 percent (prior year, 29.9 percent) of that same amount.
The fund balance of Calvert County Government’s General Fund decreased by $27,381 (prior year increase of $8.6 million). As noted previously, staff had estimated fiscal year 2012 would have surplus funds and used some of that funding to pay for anticipated fiscal year 2013 expenses. Many revenue and expense line item variances resulted in the County’s budgetary loss of $500,935.
The Capital Projects Fund has a total fund balance of $36.1 million (prior year, $44.7 million) of which the balance is committed or assigned for future capital project expenditures. Unspent bond proceeds of $23.3 million make up 64.6 percent of the total assigned fund balance (prior year, $31.2 million, 69.8 percent).
Proprietary funds: Calvert County Government’s proprietary fund statements provide the same type of information found in the government-wide financial statements, but in more detail. Overall the net position of the proprietary funds decreased $0.3 million (prior year, decrease of $.5 million). At the end of the year, unrestricted net position of the Water and Sewer Fund amounted to negative $1.7 million (prior year, negative $3.6 million). The Solid Waste and Recycling Fund reported $3.7 million in unrestricted net position (prior year, $3.7 million). The Calvert Marine Museum ended the year with $3.5 million of total net position (prior year, $3.8 million) and the Chesapeake Hills Golf Course ended the year with $3.7 million of total net position (prior year, $3.9 million).
General Fund Budgetary Highlights
The final budget for the General Fund was increased by $8.6 million over the original budget (prior year, $3.2 million increase). The majority of the budget adjustment was related to income tax revenue and an OPEB transfer. Overall expenditures were less than the final budget by $2.6 million. There are many variances within the 1,500 budgeted line items of the general fund. Three notable positive variances are utilities, with a $230,000 savings, contingent expenses, with a $189,000 savings and contracted service savings throughout the general fund of $443,000. Revenues were $3.1 million less than the final budgetary estimates. $2.0 million of this difference can be explained by a planned use of fund balance that would not impact actual revenues. There was also a $1.0 million transfer from the excise tax fund that was not made because of the better than expected results (planned $2 million use of fund balance vs. $27,381 actual). Excise tax may be used to pay for debt service and earlier in the year, the debt service expense estimate was decreased by about $750,000 through a budget adjustment.

-14-
Capital Asset and Debt Administration
Capital assets: Calvert County Government’s investment in capital assets for its governmental and business-type activities as of June 30, 2012, amounts to $234.1 million (prior year, $228.7 million), net of accumulated depreciation. This investment in capital assets includes: land, land development rights, construction in progress, buildings, improvements, machinery and equipment, and infrastructure.
Major capital asset events during the current fiscal year included the following: • Completed the HVAC renovations to the Detention Center with a cost of $388 thousand.• Completed construction of Bus Canopy with a total capitalized cost of $240 thousand. • Completed work on part of the Prince Frederick Loop Road with a cost of $5.3 million. • Completed the skate board park at Dunkirk District Park for a capitalized cost of $253
thousand.
Additional information on Calvert County’s capital assets can be found in Note 6 of this report.
Long-term debt: At the end of the current fiscal year, Calvert County Government had total general obligation debt and notes payable outstanding of $146.8 million (prior year, $148.9 million). The full faith and credit and unlimited taxing power of the County are irrevocably pledged to levy and collect taxes in order to provide for the payment of principal and interest due on the debt. Of this amount, $17.2 million (prior year, $14.3 million) are considered self-supporting bonds, funded through various surcharges and assessments related to the operation of the water and sewerage, solid waste and recycling systems, and the golf course of the County. Within the governmental activities are the $7.9 million (prior year, $10.6 million) in installment purchase agreements for the land preservation program. The principal amount is supported by US Treasury Strip securities.
2012 2011 Difference 2012 2011 Difference 2012 2011 Difference
Land 30,775,992$ 30,775,992$ -$ 4,561,708$ 4,561,708$ -$ 35,337,700$ 35,337,700$ -$ Land development rights 11,245,305 11,245,305 - - - - 11,245,305 11,245,305 - Construction in progress 13,140,534 4,893,697 8,246,837 3,115,374 3,318,950 (203,576) 16,255,908 8,212,647 8,043,261 Buildings 34,210,400 35,988,643 (1,778,243) 25,128,782 26,612,639 (1,483,857) 59,339,182 62,601,282 (3,262,100) Improvements 19,056,434 19,946,083 (889,649) 9,059,156 9,224,493 (165,337) 28,115,590 29,170,576 (1,054,986) Machinery and equipment 14,233,150 13,818,969 414,181 7,323,792 4,826,389 2,497,403 21,556,942 18,645,358 2,911,584 Infrastructure 62,241,136 63,506,036 (1,264,900) - - - 62,241,136 63,506,036 (1,264,900)
Total Capital Assets 184,902,951$ 180,174,725$ 4,728,226$ 49,188,812$ 48,544,179$ 644,633$ 234,091,763$ 228,718,904$ 5,372,859$
Calvert County's Government's Capital Assets
Governmental Activities Business-type Activities Total
(Net of Depreciation)
2012 2011 Difference 2012 2011 Difference 2012 2011 Difference
General obligation debt 129,402,238$ 134,450,812$ (5,048,574) 10,823,463$ 7,335,104$ 3,488,359 140,225,701 141,785,916 (1,560,215) Notes payable 158,794 198,085 (39,291) 6,412,663 6,934,384 (521,721) 6,571,457 7,132,469 (561,012) Land preservation program 7,933,355 10,611,555 (2,678,200) - - - 7,933,355 10,611,555 (2,678,200)
Total Bonded Debt 137,494,387$ 145,260,452$ (7,766,065)$ 17,236,126$ 14,269,488$ 2,966,638$ 154,730,513$ 159,529,940$ (4,799,427)$
Calvert County's Government's Outstanding Debt
Governmental Activities Business-type Activities Total

-15-
Calvert County Government’s total general obligation bonded debt decreased by $1.6 million, (prior year, an increase of $11.9 million), or a negative 1.0 percent during the current fiscal year (prior year, an increase of 9.2 percent).
In May 2012, the County’s credit ratings were reaffirmed by the three major rating agencies. The current ratings follow:
Standard & Poor’s “AAA” Fitch Ratings “AAA” Moody’s Investors Service, Inc. “Aa1”
In 1990, the County adopted a debt affordability model to ensure that the debt levels are kept at an affordable, manageable, moderate level. A debt policy was adopted in FY 2010 to comply with the State of Maryland’s new requirement. The guidelines created in 1990 and ratified in the policy, establish maximum acceptable debt ratios. These ratios and their maximum acceptable levels are: 1) debt to assessed value, 4.5 percent, 2) debt service as a percent of general fund revenue, 9.5 percent, and 3) debt per capita $1,500. Using fiscal year 2012 data, the County’s current ratios are as follows: debt to assessed value is .90 percent, debt service to general fund revenue is 7.3 percent, and debt per capita is $1,437.
Additional information on Calvert County Government’s long-term debt can be found in Note 7 of this report.
Economic Factors and Fiscal Year 2012’s Budgets and Rates
• The estimated total personal income of County residents for calendar year 2011 is $295.2 million ($281.3 million in 2010), an increase of 4.7 percent. There was a 3.4 percent increase from calendar year 2009 to 2010.
• The unemployment rate for the County and the State of Maryland remained relatively flat from 2011 to 2012 at 5.9 percent and 5.3 percent, respectively.
• Real property tax assessments for the third of the County that was reassessed for fiscal year 2012 were down on average 16.1 percent.
All of these factors were considered in preparing the Calvert County Government’s budget for the 2013 fiscal year. Calvert County Government has adopted a balanced budget for fiscal year 2013.
Requests for InformationThis financial report is designed to provide a general overview of Calvert County Government’s finances for all those with an interest in the government’s finances. Questions concerning any of the information provided in this report or requests for additional financial information should be addressed to the Department of Finance and Budget, Calvert County Government, 175 Main Street, Prince Frederick, MD 20678.

“THIS PAGE LEFT INTENTIONALLY BLANK”

COUNTY COMMISSIONERS OF CALVERT COUNTYCALVERT COUNTY, MARYLAND
BASIC FINANCIAL STATEMENTS
JUNE 30, 2012

“THIS PAGE LEFT INTENTIONALLY BLANK”

-16-
COUNTY COMMISSIONERS OF CALVERT COUNTY, MARYLAND
STATEMENT OF NET POSITIONJUNE 30, 2012
Primary Government Component UnitsBusiness- Economic
Governmental Type Board of DevelopmentActivities Activities Total Education Authority
ASSETSCash, cash equivalents and investments 119,999,485$ 542,033$ 120,541,518$ 18,734,584$ 1,757,853$ Receivables
Taxes 7,134,661 - 7,134,661 - - Special assessments 1,073,314 - 1,073,314 - - Accounts 20,803,348 2,553,062 23,356,410 - - Notes 4,882,227 308,348 5,190,575 - 45,127 Accrued interest 51,230 7,838 59,068 - 2,416 Other - - - 60,342 -
Due from primary government - - - 17,034,079 149,868 Internal balances 2,940,912 (2,940,912) - - - Due from other governments - - - 2,351,446 - Deferred expenses - 107,903 107,903 - - Prepaid costs - 542 542 39,638 - Inventory 301,124 121,147 422,271 94,225 - Net pension asset 147,684 - 147,684 - - Restricted assets
Cash 23,292,565 9,240,807 32,533,372 - - Capital assets not being depreciated 55,161,831 7,677,082 62,838,913 6,427,152 22,191 Depreciable capital assets - net 129,741,120 41,511,730 171,252,850 212,461,063 - Total assets 365,529,501 59,129,580 424,659,081 257,202,529 1,977,455
LIABILITIESAccounts payable 3,648,464 1,796,146 5,444,610 4,239,387 - Notes payable 107,400 - 107,400 - - Accrued liabilities 10,209,821 354,490 10,564,311 16,419,788 - Due to other governments 5,808,591 - 5,808,591 1,256,075 - Due to component units 17,156,439 - 17,156,439 - - Compensated absences, current portion 1,436,034 105,000 1,541,034 - - Long-term debt, current portion 11,620,753 1,315,974 12,936,727 21,293 - Estimated postclosure costs, current portion 30,000 - 30,000 - Unearned revenue 6,238,304 9,235 6,247,539 4,127,789 - Noncurrent liabilities:
Net pension obligation 5,221,835 - 5,221,835 19,099,109 - Compensated absences, net of current portion 7,346,468 642,810 7,989,278 - - Long-term debt, net of current portion 125,575,517 15,304,070 140,879,587 3,451,893 - Bond premium/deferred loss of refunding 298,117 616,082 914,199 - - Estimated postclosure costs, net of current portion 420,000 1,494,517 1,914,517 - -
Total liabilities 195,117,743 21,638,324 216,756,067 48,615,334 -
NET POSITIONInvested in capital assets, net of related debt 116,545,107 32,568,768 149,113,875 218,888,215 22,191 Restricted for
Capital projects 6,072,868 - 6,072,868 - - Grants 129,925 - 129,925 210,821 - Land Preservation 9,150,961 - 9,150,961 - - Parks and Recreation 1,300,369 - 1,300,369 - - Restricted capital connections - 1,575,904 1,575,904 - - Planning and Zoning 46,119 - 46,119 - - Bar library 32,262 - 32,262 - - Revolving loan 12,100 - 12,100 - - Economic Development Authority revolving loan 322,836 - 322,836 - - Economic Development incentive 308,224 - 308,224 - - Board of Library Trustees 14,884 - 14,884 - - Gifts and bequests - 1,211,988 1,211,988 - -
Unrestricted 36,476,103 2,134,596 38,610,699 (10,511,841) 1,955,264
Total net position 170,411,758$ 37,491,256$ 207,903,014$ 208,587,195$ 1,977,455$
The accompanying notes to the financial statements are an integral part of this statement.

-17-
Program Revenues
Operating CapitalCharges for Grants and Grants and
Functions/Programs Expenses Services Contributions Contributions
Primary Government:Governmental activities:
General government 20,481,137$ 2,247,276$ 1,971,886$ 49,631$Public safety 31,706,576 5,194,555 3,199,933 216,701Public works 17,878,045 740,638 632,072 480,216Health and hospital 3,408,940 152,082 136,196 -Social services 10,645,671 56,037 1,705,796 -Education 4,405,156 - 155,680 -Board of Education 129,427,039 - 4,573,994 -Recreation and culture 15,732,388 4,022,094 931,651 189,256Conservation and natural resources 4,543,744 205,877 160,343 2,420Urban development and housing 2,170,117 1,121,755 101,503 -Economic development 1,592,887 557,870 57,329 -Interest on long-term debt 4,980,102 7,441 - -
Total governmental activities 246,971,802 14,305,625 13,626,383 938,224
Business-Type activities:Water and sewer 6,707,332 6,689,621 88,267 -Solid waste 10,717,986 10,241,500 425,177 -Recreation and culture 4,634,754 911,615 323,929 65,374
Total business-type activities 22,060,072 17,842,736 837,373 65,374
Total primary government 269,031,874$ 32,148,361$ 14,463,756$ 1,003,598$
Component Units:School district 253,356,702 3,877,612 52,095,076 12,124,521Economic development 3,371 4,579 - -
Total component units 253,360,073$ 3,882,191$ 52,095,076$ 12,124,521$
General Revenues:Property taxesIncome taxesRecordation taxesAdmission and amusement taxesFranchise taxesOther miscellaneous taxesInterest and dividendsLoss on asset disposalUnrestricted investment earningsUnrestricted local appropriations, state and federal aidUnrestricted state reimbursement of electricity deregulation
Transfers Total general revenues and transfers Change in net position
Net position - beginning
Net position - ending
The accompanying notes to the financial statements are an integral part of this statement.
COUNTY COMMISSIONERS OF CALVERT COUNTY, MARYLAND
STATEMENT OF ACTIVITIESFOR THE YEAR ENDED JUNE 30, 2012

-18-
Net (Expense) Revenue and Changes in Net PositionPrimary Government Component Units
EconomicGovernmental Business-type Board of Development
Activities Activities Total Education Authority
(16,212,344)$ -$ (16,212,344)$ -$ -$(23,095,387) - (23,095,387) - -(16,025,119) - (16,025,119) - -
(3,120,662) - (3,120,662) - -(8,883,838) - (8,883,838) - -(4,249,476) - (4,249,476) - -
(124,853,045) - (124,853,045) - -(10,589,387) - (10,589,387) - -
(4,175,104) - (4,175,104) - -(946,859) - (946,859) - -(977,688) - (977,688) - -
(4,972,661) - (4,972,661) - -
(218,101,570) - (218,101,570) - -
- 70,556 70,556 - -- (51,309) (51,309) - -- (3,333,836) (3,333,836) - -
- (3,314,589) (3,314,589) - -
(218,101,570)$ (3,314,589)$ (221,416,159)$ -$ -$
- - - (185,259,493) -- - - - 1,208
-$ -$ -$ (185,259,493)$ 1,208$
150,000,842 - 150,000,842 - -63,576,777 - 63,576,777 - -
5,180,576 - 5,180,576 - -30,938 - 30,938 - -
1,192,010 - 1,192,010 - -127,458 - 127,458 - -
1,131,213 72,844 1,204,057 7,095 9,564- - - - -- - - - -- - - 184,347,833 -- - - - -
(2,949,253) 2,949,253 - - -218,290,561 3,022,097 221,312,658 184,354,928 9,564
188,991 (292,492) (103,501) (904,565) 10,772
170,222,767 37,783,748 208,006,515 209,491,760 1,966,683
170,411,758$ 37,491,256$ 207,903,014$ 208,587,195$ 1,977,455$
The accompanying notes to the financial statements are an integral part of this statement.
COUNTY COMMISSIONERS OF CALVERT COUNTY, MARYLAND
STATEMENT OF ACTIVITIESFOR THE YEAR ENDED JUNE 30, 2012

-19-
COUNTY COMMISSIONERS OF CALVERT COUNTY, MARYLAND
BALANCE SHEETGOVERNMENTAL FUNDS
JUNE 30, 2012 Nonmajor Total
Capital Governmental GovernmentalGeneral Fund Projects Funds Funds
Cash, cash equivalents and investments 109,472,097$ -$ 10,527,388$ 119,999,485$ Receivables:
Taxes 6,257,083 - 877,578 7,134,661 Special assessments 1,073,314 - - 1,073,314 Accounts 19,257,649 - 1,545,699 20,803,348 Notes 4,882,227 - - 4,882,227 Accrued interest 51,031 199 - 51,230
Due from other funds 9,571,173 15,672,431 8,764,675 34,008,279 Due from other governments - - - - Inventory 284,936 - 16,188 301,124 Restricted assets
Cash and investments - 23,292,565 - 23,292,565
Total assets 150,849,510$ 38,965,195$ 21,731,528$ 211,546,233$
Liabilities:Accounts payable 1,220,495 1,053,544 1,374,425 3,648,464 Notes payable - - 107,400 107,400 Accrued liabilities 8,363,377 311,696 - 8,675,073 Due to other funds 29,709,157 - 1,358,210 31,067,367 Due to component units 15,599,868 1,514,005 42,566 17,156,439 Due to other governments 5,808,591 - - 5,808,591 Deferred revenue 23,632,336 - 1,458,379 25,090,715 Total liabilities 84,333,824 2,879,245 4,340,980 91,554,049
Fund Balances: Nonspendable 9,545,194 - 7,170,057 16,715,251 Restricted - - 2,114,579 2,114,579 Committed 21,430,248 1,514,005 8,091,028 31,035,281 Assigned 8,218,619 34,571,945 14,884 42,805,448 Unassigned 27,321,625 - - 27,321,625
Total fund balances 66,515,686 36,085,950 17,390,548 119,992,184
Total liabilities and fund balances 150,849,510$ 38,965,195$ 21,731,528$ 211,546,233$
Fund balance (as reported above) 119,992,184 Amounts reported for governmental activities in the statement of net position are different because: Capital assets used in governmental activities are not financial resources and, therefore, are not reported in the funds. 184,902,951 Other long-term assets are not available to pay for current-period expenditures and, therefore, are deferred in the funds. 19,000,095 Long term liabilities are not due and payable in the current period, and, therefore, are not reported in the funds. (146,726,889) Net pension obligations are not due and payable in the current period,
and, therefore, are not reported in the funds. (5,221,835) Accrued interest on long-term liabilities, including bonds payable are not reported in the funds. (1,534,748)
Net position of governmental activities 170,411,758$
The accompanying notes to the financial statements are an integral part of this statement.
ASSETS
LIABILITIES AND FUND BALANCE

-20-
COUNTY COMMISSIONERS OF CALVERT COUNTY, MARYLAND
STATEMENT OF REVENUES, EXPENDITURES AND CHANGES IN FUND BALANCEGOVERNMENTAL FUNDS
FOR THE YEAR ENDED JUNE 30, 2012
Nonmajor TotalGovernmental Governmental
General Fund Capital Projects Funds FundsREVENUES
Taxes 218,215,279$ -$ 2,608,709$ 220,823,988$Licenses and permits 304,571 - - 304,571Intergovernmental 4,440,567 907,556 4,789,689 10,137,812Charges for services 3,303,365 - - 3,303,365Fines and forfeitures 330,763 - 147,043 477,806Miscellaneous 10,356,654 30,667 5,108,916 15,496,237
Total revenues 236,951,199 938,223 12,654,357 250,543,779
EXPENDITURESGeneral government 16,164,778 - - 16,164,778Public safety 27,372,685 - - 27,372,685Public works 9,758,758 - - 9,758,758Health and hospitals 2,767,520 - - 2,767,520Social services 1,647,702 - 6,704,026 8,351,728Education - other 3,401,964 - 88,558 3,490,522Board of Education 109,059,947 - - 109,059,947Recreation and culture 4,345,114 - 6,857,560 11,202,674Conservation of natural resources 405,569 - 3,192,135 3,597,704Urban development and housing 1,836,545 - 166,637 2,003,182Economic development 1,273,769 - - 1,273,769Pensions and insurance 29,522,254 - - 29,522,254Capital projects - 21,690,541 - 21,690,541Debt service
Principal retirement 10,971,736 - - 10,971,736Interest 5,108,954 - - 5,108,954
Total expenditures 223,637,295 21,690,541 17,008,916 262,336,752
Excess (deficiency) of revenues over expenditures 13,313,904 (20,752,318) (4,354,559) (11,792,973)
OTHER FINANCING SOURCES (USES)Bond issuance - 5,773,720 - 5,773,720Premium on bonds issued - 568,872 - 568,872Refunding bonds issued - 21,785,000 - 21,785,000Premium on refunding bonds issued - 2,422,139 - 2,422,139Amount deposited in refunding escrow - (24,207,139) - (24,207,139)Transfers in - other - 5,784,422 6,181,965 11,966,387Transfers out - other (13,341,285) - (1,574,355) (14,915,640)
Total other financing sources (uses) (13,341,285) 12,127,014 4,607,610 3,393,339
Net change in fund balance (27,381) (8,625,304) 253,051 (8,399,634)
Fund balance at beginning of year 66,543,067 44,711,254 17,137,497 128,391,818
Fund balance at end of year 66,515,686$ 36,085,950$ 17,390,548$ 119,992,184$
The accompanying notes to the financial statements are an integral part of this statement.

-21-
Amounts reported for governmental activities in the statement of activities are different because:
Net change in fund balances - total governmental funds (8,399,634)$
Governmental funds report capital outlays as expenditures. However, in the statement of activities the cost of those assets is allocated over their estimated useful lives and reported as depreciation expense. This is the amount by which capital outlays exceeded depreciation in the current period.
Capital outlays 28,006,066 Depreciation (11,636,949)
16,369,117
The net effect of various transactions involving capital assets including, capitalized (11,640,891) assets reclassed from construction in progress, sales, trade-ins, and donations.
Revenues in the statement of activities that do not provide current financial (419,971) resources are not reported as revenues in the funds.
The issuance of long-term debt (i.e. bonds, leases, installment purchase agreements) proceeds provide current financial resources to government funds, while the repayment of the principal of the long-term debt consumes the current financial resources of government funds.
Compensated absences 258,808 Change in landfill postclosure liabilities 30,000 Net pension obligation (766,434) Issuance - General Obligation Bonds (5,773,720) Premium on issuance of debt (568,872) Principal payments 10,971,736
Changes in long-term debt 4,151,518
Some expenses reported in the statement of activities do not require the use of current financial resources and therefore are not reported as expenditures in governmental funds.
Change in accrued interest 128,852
Change in net position of governmental activities 188,991$
The accompanying notes to the financial statements are an integral part of this statement.
COUNTY COMMISSIONERS OF CALVERT COUNTY, MARYLAND
FOR THE YEAR ENDED JUNE 30, 2012GOVERNMENTAL FUNDS TO THE STATEMENT OF ACTIVITIES
AND CHANGES IN FUND BALANCE OF THERECONCILIATION OF THE STATEMENT OF REVENUES, EXPENDITURES

-22-
COUNTY COMMISSIONERS OF CALVERT COUNTY, MARYLAND
STATEMENT OF NET POSITIONPROPRIETARY FUNDS
JUNE 30, 2012
Water Solid Waste Total Nonmajorand Sewer and Recycling Proprietary
Fund Fund Funds TotalASSETSCurrent assets:Cash and cash equivalents 254,209$ 1,000$ 187,932$ 443,141$ Investments - - 98,892 98,892
Total cash, cash equivalents and investments 254,209 1,000 286,824 542,033
Accounts receivable 1,687,565 865,497 - 2,553,062 Notes receivable 308,348 - - 308,348 Accrued interest receivable 344 7,491 3 7,838 Due from other funds - 5,272,051 - 5,272,051 Deferred expenses 89,690 6,069 12,144 107,903 Prepaid expenses - - 542 542 Inventory 69,622 - 51,525 121,147
Total current assets 2,409,778 6,152,108 351,038 8,912,924
Non-current assets:Restricted assets
Cash and investments 7,068,174 960,645 1,211,988 9,240,807
Capital assets not being depreciated 3,264,487 2,014,794 2,397,801 7,677,082 Depreciable capital assets - net 35,414,775 2,080,469 4,016,486 41,511,730 Total non-current assets 45,747,436 5,055,908 7,626,275 58,429,619
Total assets 48,157,214 11,208,016 7,977,313 67,342,543
LIABILITIESCurrent liabilities:Vouchers and accounts payable 507,825 1,267,992 20,329 1,796,146 Accrued expenses 215,599 76,377 62,514 354,490 Due to other funds 8,169,424 - 43,539 8,212,963 Unearned revenue - - 9,235 9,235 Compensated absences, current portion 50,000 50,000 5,000 105,000 Long-term debt, current portion 1,172,168 109,743 34,063 1,315,974 Total current liabilities 10,115,016 1,504,112 174,680 11,793,808
Noncurrent liabilities:Compensated absences, net of current portion 210,913 410,836 21,061 642,810 Estimated post closure costs - 1,494,517 - 1,494,517 Bond premium/deferred loss on refunding 400,183 76,377 139,522 616,082 Long-term debt, net of current portion 13,602,280 1,219,573 482,217 15,304,070
Total liabilities 24,328,392 4,705,415 817,480 29,851,287
NET POSITIONInvested in capital assets, net of related debt 23,904,814 2,765,947 5,898,007 32,568,768 Restricted capital connection 1,575,904 - - 1,575,904 Restricted gifts and bequests - - 1,211,988 1,211,988 Unrestricted (1,651,896) 3,736,654 49,838 2,134,596
Total net position 23,828,822$ 6,502,601$ 7,159,833$ 37,491,256$
The accompanying notes to the financial statements are an integral part of this statement.

-23-
COUNTY COMMISSIONERS OF CALVERT COUNTY, MARYLAND
STATEMENT OF REVENUE, EXPENSES, AND CHANGES IN FUND NET POSITIONPROPRIETARY FUNDS
YEAR ENDED JUNE 30, 2012
Water Solid Waste Total Nonmajorand Sewer and Recycling Proprietary
Fund Fund Funds TotalOperating revenues:
Charges for services 5,882,334$ 10,174,347$ 795,096$ 16,851,777$
Operating expenses:Salaries & benefits 2,200,483 2,313,906 2,909,583 7,423,972 Contracted services 432,896 6,943,694 172,204 7,548,794 Supplies 256,676 54,925 162,159 473,760 Heat, light and power 592,034 37,159 194,944 824,137 Depreciation 2,057,354 606,142 526,261 3,189,757 Miscellaneous 53,728 61,863 354,304 469,895 Telephone 13,017 8,590 11,399 33,006 Compensated absences 41,834 48,578 11,823 102,235 Maintenance and repairs 632,911 467,155 173,497 1,273,563 Capital outlay 6,674 122,496 48,114 177,284 Grant & restricted expenses - - 70,466 70,466
Total operating expenses 6,287,607 10,664,508 4,634,754 21,586,869
Operating income (loss) (405,273) (490,161) (3,839,658) (4,735,092)
Non-operating revenue (expenses):
Grants - - 65,185 65,185 Contributions and fund-raising - - 258,744 258,744 Deferred amount on refunding (31,422) (445) - (31,867) Miscellaneous income 96,387 41,017 116,519 253,923 FEMA grant reimbursement 88,267 425,177 - 513,444 Tower revenue 117,036 26,136 - 143,172 Investment income 27,822 36,491 8,531 72,844 Developer contribution 225,931 - - 225,931 Interest expense (388,303) (53,033) - (441,336)
Total non-operating revenue (expenses) 135,718 475,343 448,979 1,060,040
Income (loss) before contributions and transfers (269,555) (14,818) (3,390,679) (3,675,052)
Operating transfers in (out) 47,726 115,176 2,786,351 2,949,253 Capital transfers in (out) - - - - Capital connection charges 367,933 - - 367,933 Capital contributions - - 65,374 65,374
Change in net position 146,104 100,358 (538,954) (292,492)
Total net position - beginning 23,682,718 6,402,243 7,698,787 37,783,748
Total net position - ending 23,828,822$ 6,502,601$ 7,159,833$ 37,491,256$
The accompanying notes to the financial statements are an integral part of this statement.

-24-
COUNTY COMMISSIONERS OF CALVERT COUNTY, MARYLAND
STATEMENT OF CASH FLOWS PROPRIETARY FUNDS
FOR THE YEAR ENDED JUNE 30, 2012
SolidWater Waste and Nonmajor
and Sewer Recycling ProprietaryFund Fund Funds Total
CASH FLOWS FROM OPERATING ACTIVITIESReceipts from customers 5,857,987$ 10,073,850$ 789,291$ 16,721,128$ Tower revenue 117,036 26,136 - 143,172 Payments to suppliers (1,859,554) (7,082,291) (1,182,691) (10,124,536) Payments to employees (2,180,870) (2,329,994) (2,894,889) (7,405,753) Payments to other funds - (587,167) - (587,167) Receipts from other funds (400,817) - 492,534 91,717
Net cash provided by (used in) operating activities 1,533,782 100,534 (2,795,755) (1,161,439)
CASH FLOWS FROM NON-CAPITAL FINANCING ACTIVITIESOperating transfers (to)/ from other funds 47,726 115,176 2,786,351 2,949,253 Contribution and fundraising receipts, miscellaneous 184,653 466,194 377,388 1,028,235
Net cash provided by (used in) non-capital financing activities 232,379 581,370 3,163,739 3,977,488
CASH FLOWS FROM CAPITAL AND RELATED FINANCING ACTVITIESAdditions to capital assets and construction-in-progress (2,509,317) (573,000) (753,275) (3,835,592) Proceeds from issuance of long term debt 3,236,127 - 655,802 3,891,929 Grant funds received - - 63,060 63,060 Capital connection fees received 367,933 - - 367,933 Capital contributions - - 65,374 65,374 Developer contribution 225,931 - - 225,931 Principal paid on long-term obligations (1,018,350) (108,292) - (1,126,642) Interest paid on long-term obligations (214,840) (53,034) (6,566) (274,440)
Net cash provided by (used in) capital and related financing activities 87,484 (734,326) 24,395 (622,447)
CASH FLOWS FROM INVESTING ACTIVITIESInterest received on deposits 10,283 43,548 10,849 64,680 Purchase of investments (1,979,245) 8,874 (445,797) (2,416,168)
Net cash provided by (used in) investing activities (1,968,962) 52,422 (434,948) (2,351,488)
Increase (decrease) in cash and cash equivalents (115,317) - (42,569) (157,886) Cash and cash equivalents, beginning of year 369,526 1,000 230,501 601,027
Cash and cash equivalents, end of year 254,209$ 1,000$ 187,932$ 443,141$
PROVIDED BY (USED IN) OPERATING ACTIVITIESOperating income (loss) (405,273)$ (490,161)$ (3,839,658)$ (4,735,092)$ Adjustments to reconcile operating income (loss) to
Net cash provided by (used in) operating activitiesDepreciation 2,057,354 606,142 526,261 3,189,757 Gain(Loss) on sale of asset 1,020 - - 1,020 Landfill closure costs and other - 65,000 - 65,000 Tower revenue 117,036 26,136 - 143,172
Changes in assets and liabilitiesInventory (3,139) - 1,217 (1,922) Accounts receivable (25,367) (100,497) - (125,864) Prepaid expenses - - 2,117 2,117 Deferred expenditures - - (5,805) (5,805) Due from other funds - (587,167) 492,534 (94,633) Accounts payable 198,934 602,757 (20,701) 780,990 Accrued expenses (5,966) (21,676) 48,280 20,638 Due to other funds (400,817) - - (400,817)
Net cash provided by (used in) operating activities 1,533,782$ 100,534$ (2,795,755)$ (1,161,439)$
Reconciliation of cash and cash equivalents to the balance sheet:Cash and investments, unrestricted 254,209$ 1,000$ 286,824$ 542,033$ Cash and investments, restricted 7,068,174 960,645 1,211,988 9,240,807
7,322,383 961,645 1,498,812 9,782,840 Less - noncash equivalent investments 7,068,174 960,645 1,310,880 9,339,699
Cash and cash equivalents 254,209$ 1,000$ 187,932$ 443,141$
The accompanying notes to the financial statements are an integral part of this statement.

-25-
PENSION &OTHER POST
EMPLOYMENTBENEFITS AGENCY
TRUST FUNDS FUNDASSETS
Cash and short-term investments 5,867,813$ 94,396$
Investments at fair valueFixed income fund 32,552,886 - Common stock 13,153,089 - Equity fund 71,417,020 - Other assets 3,280,855 - Total investments 120,403,850 -
Accounts receivable - 6,186 Interest receivable 69,260 -
Total assets 126,340,923$ 100,582$
LIABILITIESAccounts Payable -$ 100,582$
NET POSITION
126,340,923$
The accompanying notes to the financial statements are an integral part of this statement.
COUNTY COMMISSIONERS OF CALVERT COUNTY, MARYLAND
STATEMENT OF FIDUCIARY NET POSITIONJUNE 30, 2012
Net position held in trust for pension benefits and other purposes

-26-
COUNTY COMMISSIONERS OF CALVERT COUNTY, MARYLAND
STATEMENT OF CHANGES IN FIDUCIARY NET POSITIONFOR THE YEAR ENDED JUNE 30, 2012
PENSION &OTHER POST
EMPLOYMENTBENEFITS
TRUST FUNDSADDITIONS
Contributions:Plan sponsor 16,724,829$ Employee 1,099,347
Total contributions 17,824,176
Investment income/(loss): Net appreciation/(depreciation) in fair value of investments (3,015,211) Interest and dividends 4,903,340
Total investment income/(loss) 1,888,129
Total additions 19,712,305
DEDUCTIONSBenefits 4,055,039 Administrative expenses 807,440
Total deductions 4,862,479
Change in net position 14,849,826
Net position - beginning 111,491,097
Net position - ending 126,340,923$
The accompanying notes to the financial statements are an integral part of this statement.

“THIS PAGE LEFT INTENTIONALLY BLANK”
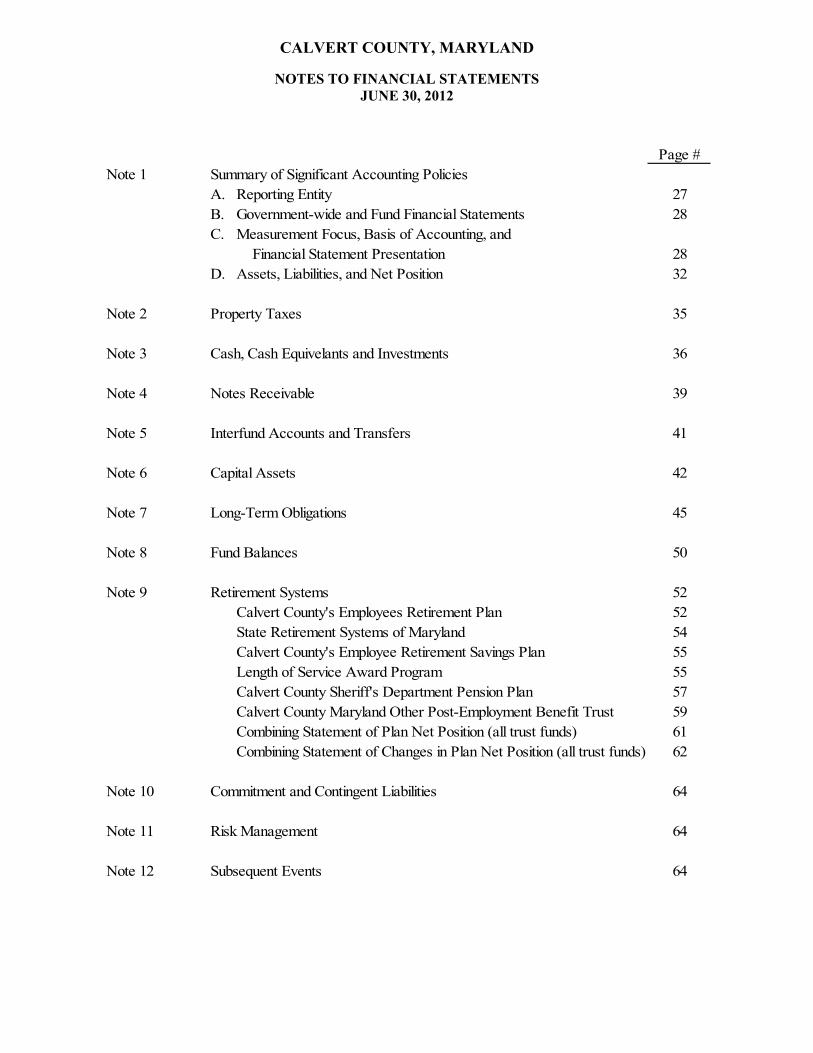
CALVERT COUNTY, MARYLAND
NOTES TO FINANCIAL STATEMENTS JUNE 30, 2012
Page #Note 1 Summary of Significant Accounting Policies
A. Reporting Entity 27B. Government-wide and Fund Financial Statements 28C. Measurement Focus, Basis of Accounting, and
Financial Statement Presentation 28D. Assets, Liabilities, and Net Position 32
Note 2 Property Taxes 35
Note 3 Cash, Cash Equivelants and Investments 36
Note 4 Notes Receivable 39
Note 5 Interfund Accounts and Transfers 41
Note 6 Capital Assets 42
Note 7 Long-Term Obligations 45
Note 8 Fund Balances 50
Note 9 Retirement Systems 52Calvert County's Employees Retirement Plan 52State Retirement Systems of Maryland 54Calvert County's Employee Retirement Savings Plan 55Length of Service Award Program 55Calvert County Sheriff's Department Pension Plan 57Calvert County Maryland Other Post-Employment Benefit Trust 59Combining Statement of Plan Net Position (all trust funds) 61Combining Statement of Changes in Plan Net Position (all trust funds) 62
Note 10 Commitment and Contingent Liabilities 64
Note 11 Risk Management 64
Note 12 Subsequent Events 64

-27-
CALVERT COUNTY, MARYLAND
NOTES TO FINANCIAL STATEMENTS JUNE 30, 2012
Note 1 - Summary of Significant Accounting Policies
Calvert County (the County), was established as one of the original counties of the Maryland colony in 1654. The County is governed by a board of five Commissioners. One Commissioner is elected from each of the three districts and two are elected at large. All serve four-year terms. This board assumes responsibilities conferred upon them by the Maryland General Assembly and provides the following services: public safety, public improvements, health and social services, sanitation, recreation and culture, education, economic development and general administrative services. The basic financial statements of the County have been prepared in conformity with accounting principles generally accepted in the United States of America as applied to government units as prescribed by the Governmental Accounting Standards Board (GASB).
A. Reporting Entity
The accompanying financial statements include various agencies, department organizations and offices which are legally part of Calvert County (the Primary Government) and the County’s component units. As defined by accounting principles, a component unit is a legally separate organization that is financially accountable to the Primary Government or where its relationship with the County is of such significance that exclusion would cause the County’s financial statements to be misleading or incomplete. The two discretely presented component units described below reported in separate columns in the government-wide financial statements to emphasize separation from the Primary Government.
Discretely Presented Component Units
Board of Education of Calvert County Public Schools - The Board of Education of Calvert County Public Schools (the Board) is responsible for elementary and secondary education within the County. The Board is fiscally dependent upon the County because the Commissioners are responsible for approving the Board's annual appropriations in the budget. In addition, the Commissioners are responsible for levying taxes and collecting and distributing the funds to the Board and the County issues bonds to finance school system construction projects. Complete financial statements of the Board may be obtained at the entity's administrative offices located at 1305 Dares Beach Road, Prince Frederick, Maryland, 20678.
Economic Development Authority of Calvert County - The Economic Development Authority of Calvert County (the Authority) was established in 1969, for the purpose of acquiring, constructing, developing, improving, operating, and managing an industrial park within the County and to enlarge economic development opportunities for the preservation and betterment of the economy of Calvert County. The members of the Board of the Authority are appointed by the Commissioners. The Authority provides services which exclusively benefit the County and County employees perform all of the Authority’s services. The Economic Development Authority of Calvert County does not issue separate financial statements, so their statements are included in this document on pages 88-90.
The Calvert County Housing Authority, the Volunteer Fire and Rescue Squads, the Calvert County Fair, Inc., and the Calvert County Soil Conservation District have been excluded

-28-
CALVERT COUNTY, MARYLAND
NOTES TO FINANCIAL STATEMENTS JUNE 30, 2012
from the basic financial statements on the basis that these entities are not controlled by or financially dependent upon the County.
B. Government-Wide and Fund Financial Statements
The government-wide financial statements (i.e., the statement of net position and the statement of activities) display information about the County as a whole. These statements include the financial activities of the Primary Government, except for fiduciary funds. The statements distinguish between those activities of the County that are governmental, normally supported by taxes and intergovernmental revenues, and those that are considered business-type activities, which rely to a significant extent on fees and charges for support. Likewise, the Primary Government is reported separately from the component units.
The statement of activities demonstrates the degree to which the direct expenses of a given function or segment is offset by program revenues. Direct expenses are those that are clearly identifiable with a specific function or segment. Program revenues include 1) charges to customers or applicants who purchase, use, or directly benefit from goods, services, or privileges provided by a given function or segment and 2) grants and contributions that are restricted to meeting the operational or capital requirements of a particular function or segment. Taxes and other items not properly included among program revenues are reported instead as general revenues.
Separate financial statements are provided for governmental funds, proprietary funds and fiduciary funds, even though the latter are excluded from the government-wide financial statements. Major individual governmental funds and major individual proprietary funds are reported as separate columns in the fund financial statements.
C. Measurement Focus, Basis of Accounting and Financial Statement Presentation
The basic financial statements are divided into three categories: government-wide financial statements, fund financial statements, and budgetary statements. The measurement focus, bases of accounting and presentation of these categories is discussed below.
Measurement Focus and Basis of Accounting
The Government-wide financial statements measure and report all assets (both financial and capital), liabilities, revenues, expenses, gains and losses using the economic resources measurement focus and the accrual basis of accounting, as do the Proprietary funds and Pension and Other Post Employment Benefit Trust funds statements. Revenues are recorded when earned and expenses are recorded when a liability is incurred, regardless of the timing of related cash flows. Property taxes are recognized as revenue as soon as all eligibility requirements imposed by the provider have been met.
All governmental funds are accounted for using a current financial resources measurement focus and are reported using the modified accrual basis of accounting. Revenues are recognized in the accounting period in which the revenues are measurable and available. “Measurable” means the amount of the transaction can be determined and “available” means

-29-
CALVERT COUNTY, MARYLAND
NOTES TO FINANCIAL STATEMENTS JUNE 30, 2012
collectible within the current period, or soon enough thereafter, to be used to pay liabilities of the current period. For the County’s purposes, the period of availability is considered to be 60 days after year end. Revenues considered susceptible to accrual are grants, delinquent property taxes, income taxes and interest on investments.
In governmental funds expenditures are generally recorded when incurred; however, expenditures for debt service, compensated absences, and claims and judgments are recorded when payments are due. General County capital asset acquisitions are reported as expenditures in governmental funds. Proceeds of the County’s general long-term debt are reported as other financing sources.
The Agency Funds have no measurement focus since these funds only report assets and liabilities. Agency Funds use the accrual basis of accounting.
Financial Statement Presentation
Fund financial statements report detailed information about the County. Governmental and Proprietary fund financial statement presentation focuses on major funds rather than reporting funds by type. Each major fund is presented in a separate column. Nonmajor funds are aggregated and presented in a single column. Fiduciary funds are reported by fund type.
Governmental Fund Types
General Fund - The General Fund is the general operating fund of the Primary Government. All financial resources are accounted for in this fund except those required to be accounted for in another fund. The General Fund is a major fund.
Capital Projects Fund - The Capital Projects Fund is used to account for financial resources to be used for the acquisition or construction of major capital facilities of the County.The Capital Projects Fund is a major fund.
Special Revenue Funds - Special revenue funds are used to account for the proceeds of specific revenue sources (other than major capital projects or expendable trusts) that are legally restricted to expenditures for specified purposes. The special revenue funds include the Parks and Recreation Fund, Planning and Zoning Special Revenue Fund, Bar Library Fund, Revolving Loan Fund, Economic Development Authority Revolving Loan Fund, Calvert County Family Network, Grants Fund, Economic Development Incentive Fund, Excise Tax Fund, the Land Preservation Fund, and the Board of Library Trustees for Calvert County (the Library). None of these special revenue funds are major funds.
Proprietary Fund Type
Enterprise Funds - Enterprise funds are used to report activities for which a fee is charged to external users for goods or services. Enterprise funds herein include the operations of the Water and Sewer Fund, the Solid Waste and Recycling Fund, the Chesapeake Hills Golf Course, and the Calvert Marine Museum. The Water and Sewer Fund and the Solid Waste and Recycling

-30-
CALVERT COUNTY, MARYLAND
NOTES TO FINANCIAL STATEMENTS JUNE 30, 2012
Fund are major funds. The Chesapeake Hills Golf Course and the Calvert Marine Museum are nonmajor funds, which are combined in one column for reporting.
Fiduciary Fund Types
Trust Funds - The County maintains pension trust funds to account for the Calvert County Employees Retirement Plan, the Volunteer Fire Departments and Rescue Squads Pension Plan, the Calvert County Sheriff’s Department Pension Plan, and the Calvert County Maryland Post-Employment Benefits Plan.
Agency Funds - The Tax Redemption Fund is an agency fund used to account for tax payments made by delinquent property owners to redeem tax certificates held by third parties. These funds are held by the County in a trustee capacity.
Net Position
The government-wide and business-type fund financial statements utilize net position presentation. Net positon is presented in three components – invested in capital assets (net of related debt), restricted and unrestricted.
1. Invested in Capital Assets (net of related debt) – This component of net position consists of capital assets, net of accumulated depreciation and reduced by outstanding bonds, notes or other borrowings attributable to the acquisition, construction, or improvement of these assets.
2. Restricted – This component consists of assets that have constraints placed on them either externally by third-parties (creditors, grantors, contributors, or laws or regulations of other governments) or by law through constitutional provisions or enabling legislation.
3. Unrestricted – This component consists of assets that do not meet the definition of “invested in capital assets, net of related debt” and restricted.
Significant Accounting Policies
The following is a summary of the more significant accounting policies applied to elements in the County’s basic financial statements:
Private Sector Guidance - Private-sector standards of accounting and financial reporting issued prior to December 1, 1989, generally are followed in both the government-wide and proprietary fund financial statements to the extent that those standards do not conflict with or contradict guidance of the Governmental Accounting Standards Board. Governments also have the option of following subsequent private-sector guidance for business-type activities and enterprise funds, subject to this same limitation. The County has elected not to follow subsequent private-sector guidance.
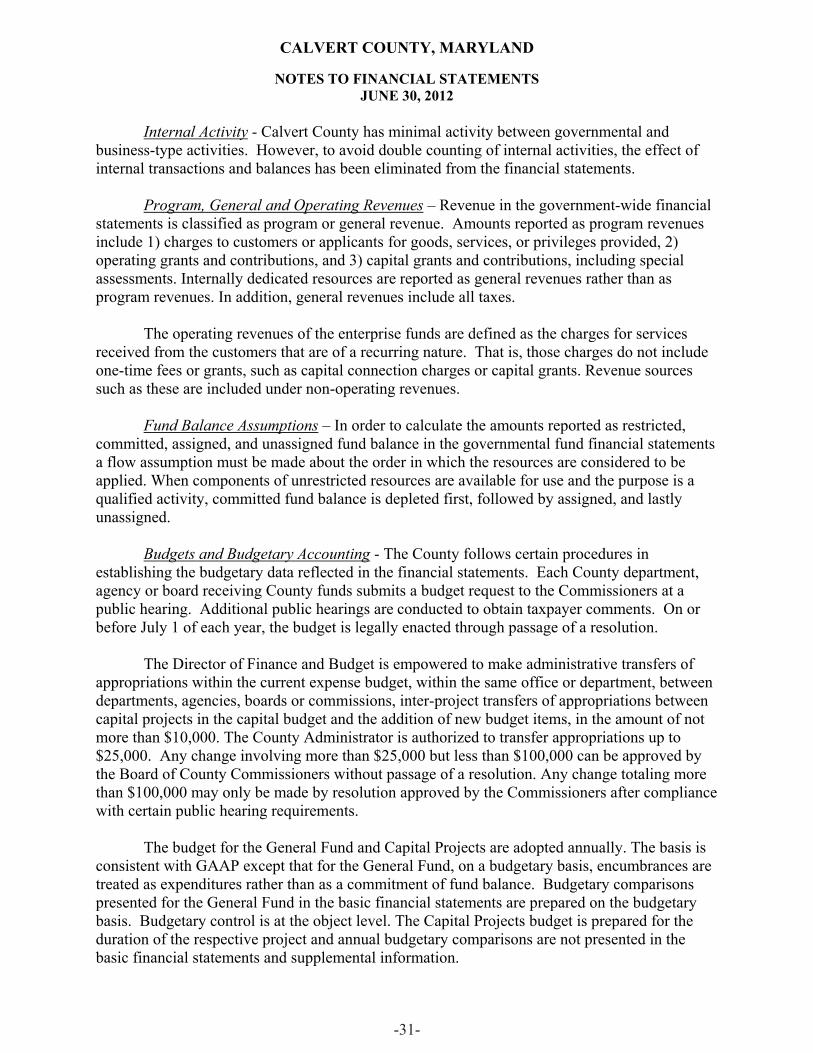
-31-
CALVERT COUNTY, MARYLAND
NOTES TO FINANCIAL STATEMENTS JUNE 30, 2012
Internal Activity - Calvert County has minimal activity between governmental and business-type activities. However, to avoid double counting of internal activities, the effect of internal transactions and balances has been eliminated from the financial statements.
Program, General and Operating Revenues – Revenue in the government-wide financial statements is classified as program or general revenue. Amounts reported as program revenues include 1) charges to customers or applicants for goods, services, or privileges provided, 2) operating grants and contributions, and 3) capital grants and contributions, including special assessments. Internally dedicated resources are reported as general revenues rather than as program revenues. In addition, general revenues include all taxes.
The operating revenues of the enterprise funds are defined as the charges for services received from the customers that are of a recurring nature. That is, those charges do not include one-time fees or grants, such as capital connection charges or capital grants. Revenue sources such as these are included under non-operating revenues.
Fund Balance Assumptions – In order to calculate the amounts reported as restricted, committed, assigned, and unassigned fund balance in the governmental fund financial statements a flow assumption must be made about the order in which the resources are considered to be applied. When components of unrestricted resources are available for use and the purpose is a qualified activity, committed fund balance is depleted first, followed by assigned, and lastly unassigned.
Budgets and Budgetary Accounting - The County follows certain procedures in establishing the budgetary data reflected in the financial statements. Each County department, agency or board receiving County funds submits a budget request to the Commissioners at a public hearing. Additional public hearings are conducted to obtain taxpayer comments. On or before July 1 of each year, the budget is legally enacted through passage of a resolution.
The Director of Finance and Budget is empowered to make administrative transfers of appropriations within the current expense budget, within the same office or department, between departments, agencies, boards or commissions, inter-project transfers of appropriations between capital projects in the capital budget and the addition of new budget items, in the amount of not more than $10,000. The County Administrator is authorized to transfer appropriations up to $25,000. Any change involving more than $25,000 but less than $100,000 can be approved by the Board of County Commissioners without passage of a resolution. Any change totaling more than $100,000 may only be made by resolution approved by the Commissioners after compliance with certain public hearing requirements.
The budget for the General Fund and Capital Projects are adopted annually. The basis is consistent with GAAP except that for the General Fund, on a budgetary basis, encumbrances are treated as expenditures rather than as a commitment of fund balance. Budgetary comparisons presented for the General Fund in the basic financial statements are prepared on the budgetary basis. Budgetary control is at the object level. The Capital Projects budget is prepared for the duration of the respective project and annual budgetary comparisons are not presented in the basic financial statements and supplemental information.

-32-
CALVERT COUNTY, MARYLAND
NOTES TO FINANCIAL STATEMENTS JUNE 30, 2012
D. Assets, Liabilities and Net Position
Cash, Cash Equivalents and Investments - For purposes of the statements of cash flows, cash equivalents are considered to be investments that are a) short-term, highly liquid investments which are readily convertible to known amounts of cash; and b) so near maturity that the investment presents insignificant risk of changes in value because of changes in interest rates.
Investments in certificates of deposit, U.S. government obligations, repurchase agreements and other investments are carried at fair value, which is determined on June 30 of each fiscal year.
Investments in the pension trust funds (Volunteer Fire and Rescue Squad Pension Fund and Calvert County Sheriff’s Department Pension Plan, the Calvert County Employees Retirement Plan and the Calvert County Maryland Other Post-Employment Benefits Trust) are carried at fair value determined on June 30 of each year, based on appraisals or quotations by an independent investment counselor.
Use of Estimates - The preparation of financial statements in conformity with accounting principles generally accepted in the United States of America requires management to make estimates and assumptions that affect the reported amounts of assets and liabilities, disclosure of contingent assets and liabilities at the date of the financial statements, and the reported amounts of revenue and expenses during the reporting period. Actual results could differ from those estimates.
Long-Term Receivables - Long-term receivables relating to governmental fund types are reported in the respective balance sheets in spite of the spending measurement focus. These receivables however, are offset by nonspendable fund balance account to indicate they should not be considered available spendable resources since they do not represent net current assets.
Inventory - Inventory is valued at the lower of cost (first-in, first-out method) or market. The inventories are recorded as expenditures when consumed rather than when purchased. Governmental fund type inventories are offset by a nonspendable fund balance account, which indicates that inventory does not constitute "available spendable resources," even though it is a component of net current assets.
Capital Assets - All capital assets are valued at historical cost or estimated historical cost if actual historical cost is not available. Contributed capital assets are valued at estimated fair market value on the date contributed. The County currently defines capital assets as assets with an initial cost of $5,000 or more and an estimated useful life of more than one year. In prior years the capital asset threshold was $3,000. Those prior year assets are still recorded as capital assets. Assets are depreciated using the straight-line method over the estimated useful life of the asset. The table on the next page is a general guideline for determining the estimated useful life of assets:

-33-
CALVERT COUNTY, MARYLAND
NOTES TO FINANCIAL STATEMENTS JUNE 30, 2012
Buildings 25-30 years Machinery and equipment 3-10 years Improvements 15-20 years Vehicles 3-7 years Water and Sewer Systems 20-30 years Computers 3 years
The purpose of depreciation is to spread the cost of capital assets equitably among all users over the life of these assets. The amount charged to depreciation expense each year represents that year’s pro rata share of the cost of capital assets.
With the implementation of GASB Statement 34, the County has recorded its public domain (infrastructure) capital assets, which include roads, bridges, curbs and gutters, streets and sidewalks, drainage systems and lighting systems.
Accumulated Annual, Personal and Sick Leave Benefits - County employees are granted annual leave at varying rates based upon years of service. The carrying amount of accumulated annual leave may not exceed a maximum of 100 days on a calendar year basis. In addition, 15 days of sick leave and 5 days of personal leave are granted annually. Upon termination or retirement, all annual and personal leave accrued to the credit of an employee is paid. The amount of accrued sick leave payable is based upon the employee’s full-time status. The sick leave can be paid to the employee or credited to their retirement benefit upon meeting retirement eligibility in the applicable defined benefit pension plan. For 35-hour per week employees, one-fourth of the accrued sick leave up to 700 hours plus one-half of the accrued sick leave over 700 hours will be paid to the employees The 40-hour per week employees receive one-fourth of the accrued sick leave up to 800 hours plus one-half of the accrued sick leave over 800 hours.
Deferred Compensation Plan - The County has established a deferred compensation plan in accordance with Internal Revenue Code Section 457, and administered by Nationwide Retirement Solutions. All County employees may participate in the plan and defer a portion of their salary, subject to limitations imposed by the Internal Revenue Service. In September 1997, the County amended the plan in accordance with the provisions of IRC Section 457(g). The assets of the plan were placed in an independent trust for the exclusive benefit of participants and their beneficiaries. The requirements of that IRC Section prescribes that the County no longer owns the amounts deferred by employees, including the related income on those amounts. Accordingly, the assets and the liability for the compensation deferred by plan participants, including earnings on plan assets, were removed from the County's financial statements. The plan assets will not be subject to the claims of the public entity's creditors.
Other Post Employment Benefit Obligations – OPEB - In fiscal year 2008 the County adopted, GASB Statement No. 45 - Accounting and Financial Reporting by Employers for Post-employment Benefits Other Than Pensions, which required that employers account for and report the annual cost of OPEB and the outstanding obligations and commitments related to OPEB in essentially the same manner as pensions. Annual OPEB cost is based on actuarially determined amounts that, if paid on an ongoing basis, generally would provide sufficient resources to pay benefits as those benefits are due.
Pension Accounting - Employee contributions are recognized in the Pension Trust Funds in the period the contributions are due. Employer contributions are recognized when due and the County has made a formal commitment to provide the contributions. Benefits and refunds are

-34-
CALVERT COUNTY, MARYLAND
NOTES TO FINANCIAL STATEMENTS JUNE 30, 2012
recognized when due and payable in accordance with the terms of each plan. Administrative costs are funded from investment income.
Any net pension obligation or asset is calculated on an actuarial basis consistent with the requirements of GASB Statement No. 27 – Accounting for Pensions by State and Local Governmental Employers. Expenditures are recognized when are paid or are expected to be paid with current available resources. The net pension obligation (asset) is reported in the government-wide financial statements.
Interfund Transfers - The transfers in to the General Fund are for capital projects that have been closed out, the transfer from excise tax fund to cover a portion of debt service, and one-time fund balance transfers from special revenue funds. The transfer out from the General Fund is for operating, disbursement of grant matching funds and pay-go monies.
Encumbrances - Encumbrance accounting, under which purchase orders, contracts, and other commitments for the expenditure of monies are recorded in order to reserve that portion of the applicable appropriation, is employed as an extension of formal budgetary integration in the General Fund, Special Revenue Funds, Capital Projects Fund, and Enterprise Funds.Encumbrances outstanding at year end are reported as committed fund balances and do not constitute expenditures or liabilities because the commitments will be honored during a subsequent year.
Long –Term Obligations – In the government-wide financial statements and in the proprietary fund financial statements, long-term debt and other obligations are reported as liabilities. Bond premiums and discounts, as well as issuance costs, are deferred and amortized over the life of the bonds using the bonds outstanding method which approximates the effective interest method.
Equity – Detailed information on the presentation of net position for the government-wide and business-type funds is located page 16. Information regarding the implementation of GASB No. 54 as it relates to the governmental fund balance presentation is located on page 19.
Stabilization Arrangement – During the fiscal year ended June 30, 2011, the County implemented GASB Statement No. 54 – Fund Balance and Governmental Fund Type Definitions which required an establishment of policy by formal action. This formal action imposes the parameters and identifies the specific circumstances and need for stabilization, and these circumstances are non-routine in nature.
Establishment/Elimination of Funds – During the fiscal year ended June 30, 2011, the County implemented GASB Statement No. 54 – Fund Balance and Governmental Fund Type Definitions which updated the definitions and criteria for Special Revenue Funds which caused the County to eliminate two special revenue funds: Project Graduation and the Housing Fund. These two funds are now presented as part of the General Fund.

-35-
CALVERT COUNTY, MARYLAND
NOTES TO FINANCIAL STATEMENTS JUNE 30, 2012
Note 2 - Property Taxes
Property taxes attach an enforceable lien on property as of July 1. Taxes are levied each July 1 and the taxpayer has the option to pay in full without interest by September 30 or to pay the bill semiannually. In semi-annual bills, the first payment is payable without interest by September 30 and the second payment, including a service charge, is payable without interest by December 31. Interest is charged for each month or fraction thereof in which taxes remain unpaid beginning October 1 on accounts under the annual payment option, or January 1 for accounts under the semiannual payment option. Maryland law grants the Treasurer of Calvert County the power to advertise and sell any real property if the taxes remain delinquent for a period of one year.
Property taxes are levied at rates enacted by the Commissioners in the annual budget based on the assessed value of the property as determined by the Maryland State Department of Assessments and Taxation, an agency of the government of the State of Maryland. The rates of levy cannot exceed the constant yield tax rate furnished by the Maryland State Department of Assessments and Taxation without public notice and then only after public hearings.
The real property tax rate during the year ended June 30, 2012, was $.892 per $100 of assessed value based on the full valuation method, except that within the two incorporated towns, North Beach and Chesapeake Beach, the rate was $.556 per $100 of assessed value based on the full valuation method. The personal property tax rate during the year ended June 30, 2012 was $2.23 per $100 of assessed value except that within the two incorporated towns, North Beach and Chesapeake Beach, the rate was $1.39. The County bills and collects all property taxes.
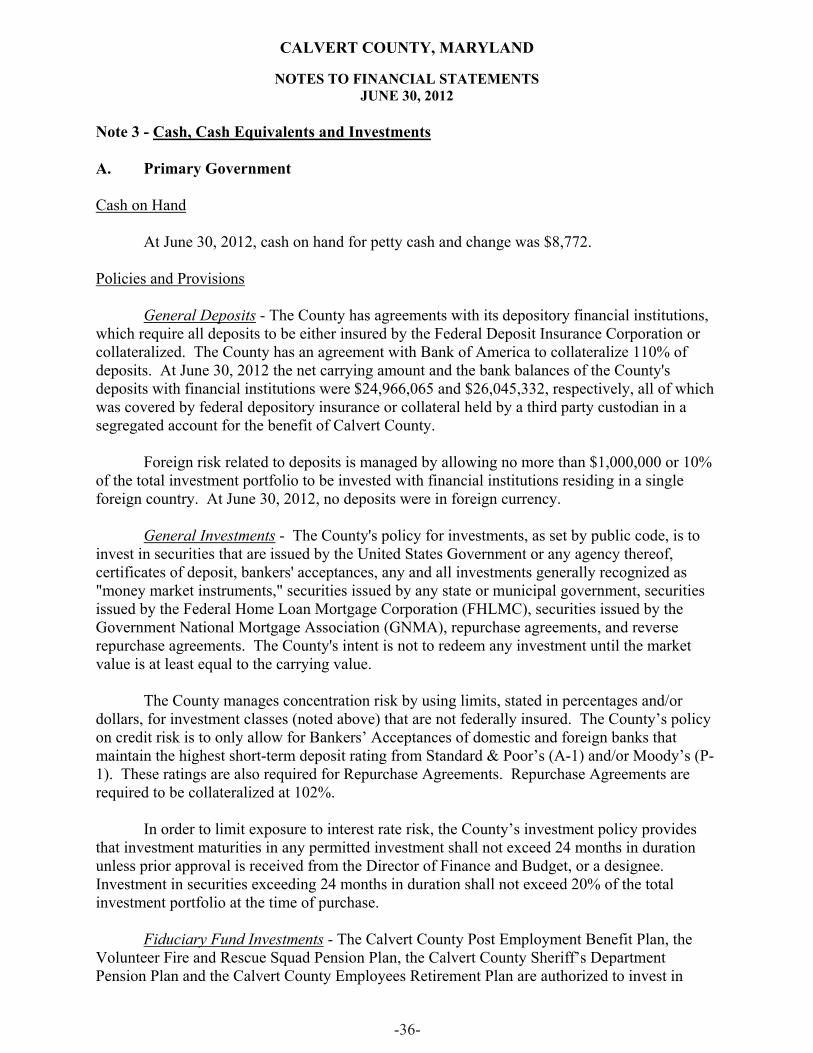
-36-
CALVERT COUNTY, MARYLAND
NOTES TO FINANCIAL STATEMENTS JUNE 30, 2012
Note 3 - Cash, Cash Equivalents and Investments
A. Primary Government
Cash on Hand
At June 30, 2012, cash on hand for petty cash and change was $8,772.
Policies and Provisions
General Deposits - The County has agreements with its depository financial institutions, which require all deposits to be either insured by the Federal Deposit Insurance Corporation or collateralized. The County has an agreement with Bank of America to collateralize 110% of deposits. At June 30, 2012 the net carrying amount and the bank balances of the County's deposits with financial institutions were $24,966,065 and $26,045,332, respectively, all of which was covered by federal depository insurance or collateral held by a third party custodian in a segregated account for the benefit of Calvert County.
Foreign risk related to deposits is managed by allowing no more than $1,000,000 or 10% of the total investment portfolio to be invested with financial institutions residing in a single foreign country. At June 30, 2012, no deposits were in foreign currency.
General Investments - The County's policy for investments, as set by public code, is to invest in securities that are issued by the United States Government or any agency thereof, certificates of deposit, bankers' acceptances, any and all investments generally recognized as "money market instruments," securities issued by any state or municipal government, securities issued by the Federal Home Loan Mortgage Corporation (FHLMC), securities issued by the Government National Mortgage Association (GNMA), repurchase agreements, and reverse repurchase agreements. The County's intent is not to redeem any investment until the market value is at least equal to the carrying value.
The County manages concentration risk by using limits, stated in percentages and/or dollars, for investment classes (noted above) that are not federally insured. The County’s policy on credit risk is to only allow for Bankers’ Acceptances of domestic and foreign banks that maintain the highest short-term deposit rating from Standard & Poor’s (A-1) and/or Moody’s (P-1). These ratings are also required for Repurchase Agreements. Repurchase Agreements are required to be collateralized at 102%.
In order to limit exposure to interest rate risk, the County’s investment policy provides that investment maturities in any permitted investment shall not exceed 24 months in duration unless prior approval is received from the Director of Finance and Budget, or a designee. Investment in securities exceeding 24 months in duration shall not exceed 20% of the total investment portfolio at the time of purchase.
Fiduciary Fund Investments - The Calvert County Post Employment Benefit Plan, the Volunteer Fire and Rescue Squad Pension Plan, the Calvert County Sheriff’s Department Pension Plan and the Calvert County Employees Retirement Plan are authorized to invest in

-37-
CALVERT COUNTY, MARYLAND
NOTES TO FINANCIAL STATEMENTS JUNE 30, 2012
common stocks, corporate bonds and any other securities in varying proportions when and for as long as, in the opinion of the respective Plan Trustees, prevailing market and economic considerations indicate that it is in the best interest of the respective Plan to do so. Note 9 presents the details of the pension plans starting on page 52.
Land Preservation Fund – The Land Preservation Fund is invested in U.S Treasury Strips (U.S. Treasury Bonds with the coupon/interest payment removed). The earliest maturity date of any of the bonds in this fund is August 15, 2013. The latest maturity date is May 15, 2026. This fund has no interest rate risk because each of the bonds was purchased to pay a specific obligation. The maturity date and amount of the bond coincides with the due date of the obligation.
Interest Rate Risk
The following schedule presents the interest rate risk (increasing interest rates decrease the value of the bonds) based on maturity of the bonds held.
Maturities Maturities
Cash and Equivalents $ 87,989,251 5-10 years 3,456,682 Less than 1 year 12,506,855 10-15 years 1,313,764 1-5 years 31,566,604 15-20 years -
Total $ 136,833,156
Foreign Currency Risk
The following schedule shows the pension plans’ exposure to foreign currency risk. This risk is created by the ownership of American Depository Receipts (ADR). ADRs are stocks that trade in the United States but represent a specified number of shares in a foreign corporation. ADRs are bought and sold on American markets just like regular stocks, and are issued/sponsored in the U.S. by a bank or brokerage. Because the value of an ADR is derived from the value of the foreign share price, fluctuations in that currency exchange rate create changes in value. Calvert County currently has no formal policy relating to foreign currency risk in the pension plans.
Country Total Exposure Country Total Exposure
United Kingdom 2,746,302$ Mexico 179,648Netherlands 492,412 Japan 2,423,665Switzerland 878,538 France 1,235,733Spain 376,309 Italy 856,595Germany 205,765 Korea 412,774Brazil 229,150 Total 10,036,891$
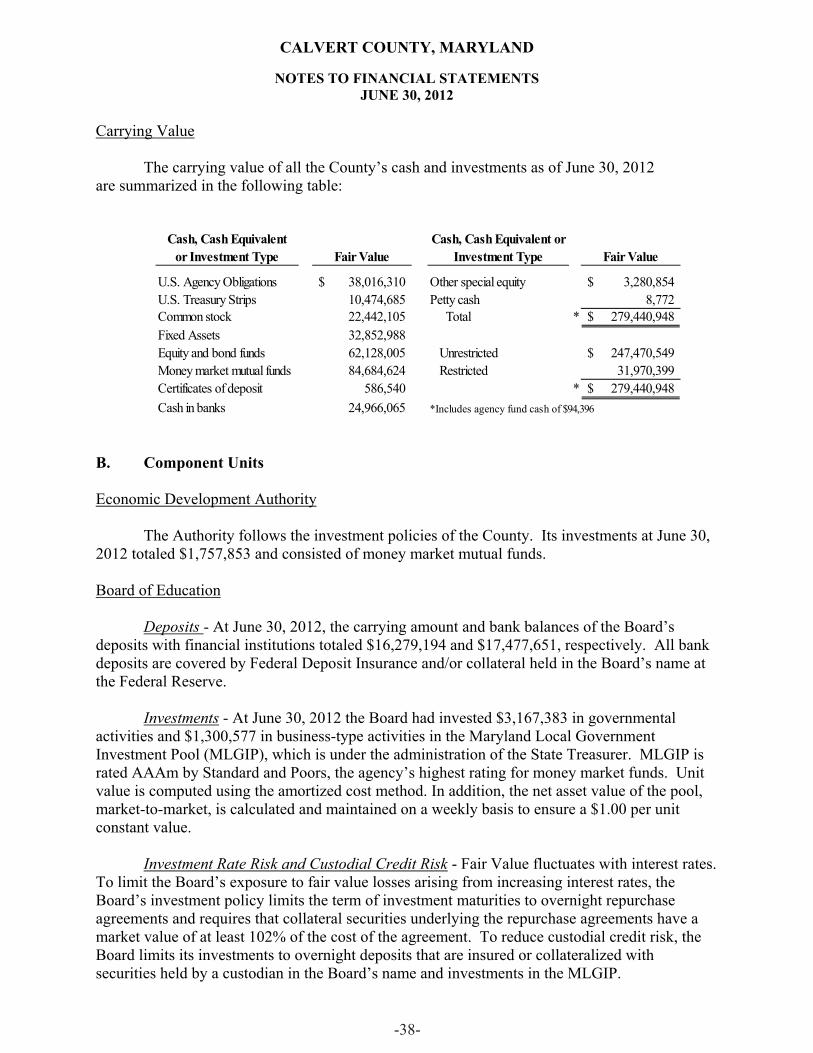
-38-
CALVERT COUNTY, MARYLAND
NOTES TO FINANCIAL STATEMENTS JUNE 30, 2012
Carrying Value
The carrying value of all the County’s cash and investments as of June 30, 2012 are summarized in the following table:
Cash, Cash Equivalent or Investment Type Fair Value
Cash, Cash Equivalent or Investment Type Fair Value
U.S. Agency Obligations 38,016,310$ Other special equity 3,280,854$ U.S. Treasury Strips 10,474,685 Petty cash 8,772 Common stock 22,442,105 Total * 279,440,948$ Fixed Assets 32,852,988 Equity and bond funds 62,128,005 Unrestricted 247,470,549$ Money market mutual funds 84,684,624 Restricted 31,970,399 Certificates of deposit 586,540 * 279,440,948$ Cash in banks 24,966,065 *Includes agency fund cash of $94,396
B. Component Units
Economic Development Authority
The Authority follows the investment policies of the County. Its investments at June 30, 2012 totaled $1,757,853 and consisted of money market mutual funds.
Board of Education
Deposits - At June 30, 2012, the carrying amount and bank balances of the Board’s deposits with financial institutions totaled $16,279,194 and $17,477,651, respectively. All bank deposits are covered by Federal Deposit Insurance and/or collateral held in the Board’s name at the Federal Reserve.
Investments - At June 30, 2012 the Board had invested $3,167,383 in governmental activities and $1,300,577 in business-type activities in the Maryland Local Government Investment Pool (MLGIP), which is under the administration of the State Treasurer. MLGIP is rated AAAm by Standard and Poors, the agency’s highest rating for money market funds. Unit value is computed using the amortized cost method. In addition, the net asset value of the pool, market-to-market, is calculated and maintained on a weekly basis to ensure a $1.00 per unit constant value.
Investment Rate Risk and Custodial Credit Risk - Fair Value fluctuates with interest rates. To limit the Board’s exposure to fair value losses arising from increasing interest rates, the Board’s investment policy limits the term of investment maturities to overnight repurchase agreements and requires that collateral securities underlying the repurchase agreements have a market value of at least 102% of the cost of the agreement. To reduce custodial credit risk, the Board limits its investments to overnight deposits that are insured or collateralized with securities held by a custodian in the Board’s name and investments in the MLGIP.

-39-
CALVERT COUNTY, MARYLAND
NOTES TO FINANCIAL STATEMENTS JUNE 30, 2012
Note 4 - Notes Receivable
A. Primary Government
General Fund
The Affordable Housing Program – The County under this program has a 20 year loan set up to fund a participant in the County’s Water and Sewer Assistance Program. This note initiated in FY2009, will mature in FY2029 and bears interest at 5% per annum. Principal and interest payments are due monthly. At June 30, 2012, $8,953 is outstanding.
Volunteer Fire Department and Rescue Squads - The County finances purchases of equipment by the volunteer fire department and rescue squads. To maintain control over the equipment purchased, the County Commissioners create non-interest bearing notes receivable, secured by the equipment, with three to twenty-nine year terms. Deferred revenue is also recorded for the total amount of the notes receivable. Repayment of the notes does not involve cash transactions, but is achieved by reducing notes receivable and deferred revenue based upon the value of services rendered by the fire and/or rescue companies over the lives of the notes. Notes receivable from fire and/or rescue companies at June 30, 2012, was $4,124,278. See detailed schedule at page 93.
Parks and Recreation Fund - The General Fund has a $358,000 note receivable from the Parks and Recreation Fund in the form of an interest-free note signed in 2004. Principal is payable annually beginning June 1, 2006 through maturity on June 1, 2014. At June 30, 2012, $107,400 is outstanding.
Water and Sewer Fund
The Water and Sewer Fund’s Due to the General Fund balance includes $5,878,435 that has been reclassified to an advance over the last three fiscal years. This advance is not expected to be repaid within the next twelve months. This amount is planned funding for the Water and Sewer Fund as rate adjustments continue, as required to balance the budget.
Funds previously advanced by the General Fund to the Water and Sewer Fund for the Dares Beach Water Supply Project was converted to a note. The note calls for annual payments of $19,969 including interest at 6.6%, commencing June 30, 1990 through maturity in 2019. At June 30, 2012, outstanding principal amounted to $109,157 and is offset by a nonspendable fund balance to indicate these funds are not available, spendable resources.
Funds previously advanced by the General Fund to the Water and Sewer Fund for the Prince Frederick Water and Sewer System was converted to an interest-free note in 1992.Principal is payable annually beginning January 1, 1993 through maturity on January 1, 2025. At June 30, 2012, $361,312 is outstanding, and is offset by a nonspendable fund balance to indicate these funds are not available, spendable resources.

-40-
CALVERT COUNTY, MARYLAND
NOTES TO FINANCIAL STATEMENTS JUNE 30, 2012
Funds previously advanced by the General Fund to the Water and Sewer Fund for the Shores of Calvert Water and Sewer System were converted to a 20 year interest bearing note.The note calls for annual payments of $9,967 including interest at 1.5%. Principal is payable annually beginning July 1, 2012 through maturity on July 1, 2031. At June 30, 2012, $171,127 is outstanding, and is offset by a nonspendable fund balance to indicate these funds are not available, spendable resources.
The Water and Sewer Fund has a note receivable from the Calvert County Detention Center and three Public Utility Payment Plans with developers, of which the total amount outstanding at June 30, 2012 was $308,348.
Economic Development Authority Revolving Loan Fund
During Fiscal year 2009 a five-year, $50,000 loan was made to Southern Maryland Business Center. The note bears interest at 7.5% per annum. Principal is payable monthly, beginning July 2009 through maturity in June 2013. At June 30, 2012, $48,607 is outstanding.
During Fiscal year 2010 a five-year, $75,000 loan was made to Little Proteges Inc. The note bears interest at 7.5% per annum. Principal is payable monthly, beginning July 2010 through maturity in June 2014. At June 30, 2012, $45,601 is outstanding.
Economic Development Incentive Fund
During Fiscal year 2008 a five-year, $200,000 loan was made to Kelly Generator Inc. The note bears interest at 1.0% per annum. Principal is payable monthly, beginning September 2007 through maturity in August 2012. At June 30, 2012, $138,799 is outstanding.
B. Component Unit
Economic Development Authority - The Authority has a $78,300 note receivable from George Larry Burdette and Karen Lynn Burdette related to the sale of lot number 20A, which was land held for resale. This note is secured by a deed of trust on the property. The note bears interest at 5.5% per annum. Principal and interest payments of $640 are due monthly beginning January 2000 and continuing monthly until December 28, 2014. As of June 30, 2012, the note balance is $22,564.
The Authority has a $78,300 note receivable from Shadow Stone, LLC related to the sale of lot number 20B, which was land held for resale. This note is secured by a deed of trust on the property. The note bears interest at 5.5 % per annum. Principal and interest payments of $640 are due monthly beginning in January 2000, and continuing monthly until December 28, 2014. As of June 30, 2012, the note balance is $22,563.

-41-
CALVERT COUNTY, MARYLAND
NOTES TO FINANCIAL STATEMENTS JUNE 30, 2012
Note 5 - Interfund Accounts and Transfers
Interfund Accounts - represent outstanding balances between funds resulting from the time lag between the dates that (1) interfund good and services are provided or reimbursable expenditures occur, (2) transactions are recorded in the accounting system, and (3) payment between funds are made. These amounts include balances of working capital loans made to the enterprise funds which the general fund expects to collect in subsequent year. These accounts are also referred to as due to/from other funds. Most deposits and cash disbursements are processed using the General Fund bank account. These deposit and cash disbursement transactions create the interfund balances.
At June 30, 2012, the interfund account balances were as shown below:
Due From Due ToPrimary Government:
General Fund Special Revenue Funds 1,358,210$ 8,764,675$ Capital Projects Fund - 15,672,431 Enterprise Funds 8,212,963 5,272,051
9,571,173 29,709,157Special Revenue Funds General Fund 8,764,675 1,358,210Capital Projects Fund General Fund 15,672,431 - Proprietary Funds General Fund 5,272,051 8,212,963
39,280,330$ 39,280,330$ Component Units:
Primary government – General Fund -$ 15,599,868$ Primary government – Capital Projects - 1,514,005 Primary government – Special Revenue Funds - 42,566 Component unit – Board of Education 17,006,571 - Component unit – Economic Development Authority 149,868 -
17,156,439$ 17,156,439$
Interfund Transfers - are used to (1) move revenues from the fund with collection authority to the enterprise and capital project funds for bond proceeds and (2) move general fund resources to provide annual operating subsidy to the capital projects, special revenue, and enterprise funds.
During the fiscal year ended June 30, 2012, the interfund transfers were as follows:
Primary Government:Governmental Funds Transfers in Transfers out Special Revenue Funds 6,181,965$ 1,574,355$ Capital Projects Fund 5,784,422 - General Fund - 13,341,285
11,966,387 14,915,640Proprietary Funds Water and Sewer Fund 47,726 - Solid Waste Fund 115,176 - Nonmajor proprietary funds 2,786,351 -
2,949,253 -Total Transfers 14,915,640$ 14,915,640$

-42-
CALVERT COUNTY, MARYLAND
NOTES TO FINANCIAL STATEMENTS JUNE 30, 2012
Note 6 - Capital Assets
A. Primary Government
A summary of changes in capital assets are as follows:
Capital assets, not being depreciatedConstruction in Progress 4,893,697$ 19,881,438$ (11,634,601)$ (1) 13,140,534$ Land Development Rights 11,245,305 - - 11,245,305 Land 30,775,992 - - 30,775,992
46,914,994 19,881,438 (11,634,601) 55,161,831
Capital assets, being depreciatedBuildings 67,670,328 254,589 - 67,924,917 Improvements 31,135,798 779,266 - 31,915,064 Machinery & Equipment 35,752,374 3,394,762 (488,905) 38,658,231 Infrastructure 113,368,176 3,696,011 - 117,064,187
247,926,676 8,124,628 (488,905) 255,562,399
Less accumulated depreciation for:Buildings (31,681,685) (2,032,832) - (33,714,517) Improvements (11,189,715) (1,668,915) - (12,858,630) Machinery & Equipment (21,933,405) (2,974,291) 482,615 (24,425,081) Infrastructure (49,862,140) (4,960,911) - (54,823,051)
(114,666,945) (11,636,949) 482,615 (125,821,279) Total capital assets, being depreciated, net 133,259,731 (3,512,321) (6,290) 129,741,120 Governmental activities capital assets, net 180,174,725$ 16,369,117$ (11,640,891)$ 184,902,951$
Business-type activities:Capital assets, not being depreciated
Construction in Progress 3,318,950$ 261,545$ (465,121)$ 3,115,374$ Land 4,561,708 - - 4,561,708
7,880,658 261,545 (465,121) 7,677,082
Capital assets, being depreciatedBuildings 58,243,453 466,853 - 58,710,306 Improvements 12,790,329 413,530 (143,455) 13,060,404 Machinery & Equipment 8,502,203 3,209,636 (264,498) 11,447,341
79,535,985 4,090,019 (407,953) 83,218,051
Less accumulated depreciation for:Buildings (31,630,814) (1,950,710) - (33,581,524) Improvements (3,565,836) (535,830) 100,418 (4,001,248) Machinery & Equipment (3,675,814) (703,217) 255,482 (4,123,549)
(38,872,464) (3,189,757) 355,900 (41,706,321) Total capital assets, being depreciated, net 40,663,521 900,262 (52,053) 41,511,730 Business-type activities capital assets, net 48,544,179$ 1,161,807$ (517,174)$ 49,188,812$
(1) Includes assets of $6,505,600 that were transferred to the Board of Education.

-43-
CALVERT COUNTY, MARYLAND
NOTES TO FINANCIAL STATEMENTS JUNE 30, 2012
B. Component Units:
Economic Development Authority
A summary of changes in capital assets for the year ended June 30, 2012 as follows:
Balance Retirements/ BalanceJune 30, 2011 Additions Reclassifications June 30, 2012
Governmental activites:Capital assets, not being depreciated
Land 22,191$ -$ -$ 22,191$ 22,191$ -$ -$ 22,191$
Board of Education
A summary of changes in capital assets for the year ended June 30, 2012 as follows:
Balance Retirements/ BalanceJune 30, 2011 Additions Reclassifications June 30, 2012
Governmental activities:Capital assets, not being depreciated
Land 3,757,711$ -$ -$ 3,757,711$ Construction in progress 20,751,182 11,199,177 (29,280,918) 2,669,441
24,508,893 11,199,177 (29,280,918) 6,427,152 Capital assets, being depreciated
Buildings and improvements 264,444,384 - 29,280,918 293,725,302Land improvements 4,657,877 - - 4,657,877 Equipment 7,406,212 196,085 (24,492) 7,577,805
276,508,473 196,085 29,256,426 305,960,984Less accumulated depreciation for:
Buildings and improvements (79,730,222) (5,773,486) - (85,503,708) Land improvements (2,302,544) (229,875) - (2,532,419) Equipment (5,261,441) (412,981) 24,492 (5,649,930)
(87,294,207) (6,416,342) 24,492 (93,686,057) Total capital assets, being depreciated, net 189,214,266 (6,220,257) 29,280,918 212,274,927Governmental activities capital assets, net 213,723,159$ 4,978,920$ -$ 218,702,079$
Business-type activities:Equipment at historical cost 1,720,892$ 71,514$ -$ 1,792,406$
Less accumulated depreciation (1,560,335) (45,935) - (1,606,270) Business-type activities capital assets, net 160,557$ 25,579$ -$ 186,136$

-44-
CALVERT COUNTY, MARYLAND
NOTES TO FINANCIAL STATEMENTS JUNE 30, 2012
Component Units, continued
Board of Education
The Board’s active school construction projects as of June 30, 2012 as follows:
Spent to Date CommitmentCalvert High 2,470,968$ 5,240,813$ Other - 167,619
Total 2,470,968$ 5,408,432$
These projects are funded primarily by capital grants from Calvert County and the State of Maryland.
Depreciation expense for the year ended June 30, 2012 for Calvert County and component units (Board of Education and Economic Development Authority) were as follows:
Primary Government: Component Units:Governmental activities: Board of Education - governmental activities:
General government 2,668,690$ Instruction:Public safety 1,439,497 Regular education 134,446$ Public works 5,439,140 Special education 10,728 Health and hospitals 16,376 Support services:Social services 96,840 Administration 204,387 Recreation and culture 1,976,406 Mid-level administration 371 Miscellaneous - Transportation 4,047
Total 11,636,949$ Operation of plant and equipment 6,021,109
Business-type activities: Maintenance of plant 41,254 Water and Sewer 2,057,354$ Total 6,416,342$
Solid Waste and Recycling 606,142 Board of Education - business-type activities:Marine Museum 350,447 Food services 45,935$
Chesapeake Hills Golf Course 175,814 3,189,757$ Economic Development: -$

-45-
CALVERT COUNTY, MARYLAND
NOTES TO FINANCIAL STATEMENTS JUNE 30, 2012
Note 7 - Long-Term Obligations
A. Primary Government
Changes in Long-term Obligations
The following is a summary of the changes in long-term obligations of the County for the year ended June 30, 2012.
Amounts Beginning Ending Due Within
Balance Additions Deductions Balance One YearGovernmental activities:
Bonds and Notes Payable General Obligation Bonds (1) 134,450,812$ 27,558,720$ (32,607,294)$ 129,402,238$ 11,603,015$ Notes Payable (2) 198,085 - (39,291) 158,794 17,738 Land Preservation Program 10,611,555 - (2,678,200) 7,933,355 - Other Liabilities: Landfill Closure Costs 480,000 - (30,000) 450,000 30,000 Compensated Absences 9,041,310 1,075,176 (1,333,984) 8,782,502 1,436,034
Total 154,781,762$ 28,633,896$ (36,688,769)$ 146,726,889$ 13,086,787$
Business-type activities:Bonds and Notes Payable General Obligation Bonds (1) 7,335,104$ 3,922,942$ (434,583)$ 10,823,463$ 721,985$ Notes Payable (1) 6,934,384 171,127 (692,848) 6,412,663 593,989 Other Liabilities: Landfill Closure Costs 1,429,517 65,000 - 1,494,517 - Compensated Absences 750,648 19,401 (22,239) 747,810 105,000
Total 16,449,653$ 4,178,470$ (1,149,670)$ 19,478,453$ 1,420,974$
(1) Indicates debt issued for the purpose of acquiring capital assets. (2) Represents debt used for other governmental purposes.
The liability for Compensated Absences, under governmental activities, the general fund normally liquidates 93 percent, the special revenue funds liquidate less than 1 percent. For the business-type activities, the solid waste fund liquidates 4 percent, the water and sewer fund liquidates 2 percent, and the nonmajor proprietary funds liquidate 1 percent.

-46-
CALVERT COUNTY, MARYLAND
NOTES TO FINANCIAL STATEMENTS JUNE 30, 2012
Obligation Balances and Terms – Governmental Activities
Long-term obligations as of June 30, 2012, consist of the following:
GovernmentalAmount Due Activities
Bond Description and Year Borrowed Rate serially through BalanceGovernmental Activities
General Obligation Bonds
Consolidated Public Improvement Project Bonds, 2003 Series 30,275,000$ 2% - 5% July 15, 2013 $ 4,240,523
Refunding Bonds, 2003 Series (replaced the 1993 Series bonds) 13,614,090 2% - 5% July 15, 2019 1,467,690
Consolidated Public Improvement Project Bonds, 2004 Series 8,910,000 2% - 5% April 1, 2014 1,210,000
Consolidated Public Improvement Project Bonds, 2005 Series 6,995,000 3.375% - 4.1% April 1, 2015 1,415,000
Consolidated Public Improvement Project Bonds, 2006 Series 10,885,000 4% - 5% April 1, 2016 2,900,000
Consolidated Public Improvement Project Bonds, 2007 Series 29,780,000 4% - 5% April 1, 2022 21,570,000
Consolidated Public Improvement Project Bonds, 2008 Series 22,250,000 3% - 5% April 1,2023 17,350,000
Consolidated Public Improvement Project Bonds, 2009 Series 18,485,000 2% - 3.5% April 1,2024 15,290,000
Consolidated Public Improvement Project Bonds, 2010 Series 13,921,232 3% - 5% July 1, 2025 13,234,024
Refunding Bonds, 2010 Series (replaced the 2002 Series bonds) 4,900,000 3% - 4% January 1, 2016 4,900,000
Consolidated Public Improvement Project Bonds, 2011 Series 19,256,271 2% - 5% May 1, 2026 17,968,164
Refunding Bonds, 2011 Series (replaced the 2003/2004 Series bonds) 15,360,000 2% - 5% July 15, 2018 15,360,000
Consolidated Public Improvement Project Bonds, 2012 Series 5,773,720 3% - 4% April 1, 2027 5,773,720
Refunding Bonds, 2012 Series (replaced the 2005/2006 Series bonds) 6,425,000 3% - 4% April 1, 2027 6,425,000
Shore Erosion Control
Western Shores (non-interest bearing) 261,042 n/a July 1, 2017 78,313
Solomons United Methodist Church (non-interest bearing) 32,150 n/a July 1, 2026 19,290
Our Lady Star of the Sea (non-interest bearing) 84,987 n/a July 1, 2029 61,191
Other
The Land Preservation Program 10,611,555 3% - 5% 7,933,355
Total General Obligation Bonds and Notes Receivables 217,820,047 137,196,270
Estimated Landfill Postclosure Costs 450,000
Premium, 2009, 2010, 2011, 2012 298,117
Accumulated Unpaid Employee Leave 8,782,502
Total Governmental Activities 217,820,047$ 146,726,889$

-47-
CALVERT COUNTY, MARYLAND
NOTES TO FINANCIAL STATEMENTS JUNE 30, 2012
Obligation Balances and Terms – Business-Type Activities
Long-term obligations as of June 30, 2012, consist of the following:
Business-TypeAmount Due Activities
Bond Description and Year Borrowed Rate serially through BalanceBusiness-Type Activities
General Obligation Bonds - Water and Sewer
Refunding Bonds, 2003 Series (replaced the 1993 Series bonds) 4,010,790$ 2% - 5% July 15, 2019 $ 432,501
Consolidated Public Improvement Project Bonds, 2010 Series 2,314,702 3% - 5% July 1, 2025 2,200,439
Consolidated Public Improvement Project Bonds, 2011 Series 2,769,000 2% - 5% May 1, 2036 2,663,845
Consolidated Public Improvement Project Bonds, 2012 Series 3,065,000 3% - 4% April 1, 2037 3,065,000
Notes Payable - Water and Sewer
Water Supply Facilities Loan Note 89,775 6.6% November 1, 2019 43,129
General Fund Note - Dares Beach Water Supply 258,225 6.6% June 30, 2019 109,157
General Fund Note - Prince Frederick (non-interest bearing) 863,254 n/a January 1, 2025 361,312
General Fund Note - Shores of Calvert (interest bearing) 171,127 1.50% July 1, 2032 171,127
Maryland Department of the Environment (MDE) Note 250,000 4.64% February 1, 2033 213,517
Maryland Water Quality Financing Admin Note - Solomons Wastewater 3,982,024 2.55% August 1, 2015 749,706
Maryland Water Quality Financing Admin Note - Dares Beach 500,000 1.6% August 1, 2020 255,142
Maryland Water Quality Financing Admin Note - Prince Frederick 6,300,000 1.5% February 1, 2022 3,384,063
Maryland Water Quality Financing Admin Note - Patuxent Business Park 400,000 1% February 1, 2024 260,697
Maryland Water Quality Financing Admin Note - Chesapeake Beach 1,071,036 1.1% February 2, 2028 864,813
Total General Obligation Bonds and Notes Receivables 26,044,933 14,774,448
Deferred Loss on Refunding, 2003 Series (87,832)
Premium, 2010, 2011 & 2012 Series 488,015
Accumulated Unpaid Employee Leave 260,913
Total Water and Sewer 26,044,933$ 15,435,544$
General Obligation Bonds - Solid Waste
Refunding Bonds, 2003 Series (replaced the 1993 Series bonds) 1,205,120$ 2% - 5% July 15, 2019 $ 130,787
Consolidated Public Improvement Project Bonds, 2010 Series 274,066 3% - 5% July 1, 2025 260,537
Consolidated Public Improvement Project Bonds, 2011 Series 1,000,000 2% - 5% May 1, 2026 937,992
Total General Obligation Bonds 2,479,186 1,329,316
Estimated Landfill Postclosure Costs 1,494,517
Premium, 2010 & 2011 Series 76,377
Accumulated Unpaid Employee Leave 460,836
Total Solid Waste 2,479,186$ 3,361,046$
General Obligation Bonds - Chesapeake Hills Golf Course
Consolidated Public Improvement Project Bonds, 2012 Series 516,280$ 2% - 5% April 1, 2027 516,280$
Total General Obligation Bonds 516,280 516,280
Premium, 2012 Series 139,522
Accumulated Unpaid Employee Leave 26,061
Total Chesapeake Hills Golf Course 516,280$ 681,863$
Total Business Type Activities 29,040,399$ 19,478,453$

-48-
CALVERT COUNTY, MARYLAND
NOTES TO FINANCIAL STATEMENTS JUNE 30, 2012
Debt Requirements
The minimum annual requirements to amortize all outstanding debt, except accumulated unpaid vacation, personal and sick leave, estimated landfill closure and postclosure costs as of June 30, 2012 are as follows:
Years Ending June 30, Principal Interest Total
2013 11,620,753$ 5,183,352$ 16,804,105$ 2014 12,144,415 4,849,222 16,993,6372015 12,170,273 4,395,727 16,566,0002016 14,643,137 3,973,783 18,616,9202017 13,005,165 3,424,047 16,429,212
2018-2022 55,420,719 7,888,951 63,309,6702023-2027 18,181,608 1,417,081 19,598,6892028- plus 10,200 - 10,200 Premium 298,117 - 298,117
137,494,387$ 31,132,163$ 168,626,550$
Governmental Activities
Years Ending June 30, Principal Interest Total 2013 1,315,974$ 514,311$ 1,830,285$ 2014 1,346,295 502,540 1,848,835 2015 1,372,418 463,381 1,835,799 2016 1,029,576 414,375 1,443,951 2017 1,043,795 386,448 1,430,243
2018-2022 5,280,163 1,468,856 6,749,019 2023-2027 2,996,287 684,504 3,680,791 2028- plus 2,235,536 411,066 2,646,602
Def. loss on ref./premium 616,082 - 616,082
17,236,126$ 4,845,481$ 22,081,607$
Business-Type Activities
Estimated Closure and Postclosure Costs
Barstow Landfill - During 1997, the County closed the Barstow Landfill. The current estimate of post closure costs is $450,000. The landfill is at 100% capacity with no remaining useful life. An amount is recorded in the general long-term debt account group for the estimated postclosure costs associated with the Barstow Landfill. This amount is required by state and federal regulations to provide for monitoring costs associated with the closed landfill. Therefore, the total estimated cost of postclosure care has been recorded.

-49-
CALVERT COUNTY, MARYLAND
NOTES TO FINANCIAL STATEMENTS JUNE 30, 2012
Appeal Landfill – This is the County’s current operating landfill. In 1998, the County entered into a long-term arrangement under which the County's waste is transferred out of the County, which has extended the life of the landfill. An accrual is recorded for the estimated closure and postclosure costs associated with the Appeal Landfill. The accrual is based upon the capacity used to date. Although closure and postclosure care costs will be paid only near or after the date the landfill stops accepting waste, a portion of these closure and postclosure care costs are reported as an operating expense in each period based on landfill capacity used as of each balance sheet date. This accrual is required by state and federal regulations to provide for the capping and monitoring costs associated with the closing of the landfill. The estimate of total closure and post closure costs, provided by an independent contractor specializing in landfills is $1,906,351.
This amount has been and will be increased by a factor of 3.5% to account for inflation, through fiscal year 2023. These cost estimates generated in fiscal year 2008 are scheduled to be updated in fiscal year 2013 by an independent contractor to ensure compliance with changing federal and state laws, potential changes in costs due to inflation or deflation, and changes in technology in an effort to maintain accurate accruals. The percentage of the landfill that is full was re-estimated in FY10 as 70%; therefore, $1,494,517 represents the accrued reserve at June 30, 2012, which is reported in the Solid Waste and Recycling fund. The amount that has not yet been recognized in the County’s financial statements is $411,834. This reserve will be increased with annual contributions.
B. Component Units
Changes in Long-term Obligations
The following is a summary of the changes in the Long-Term Obligations of the Board of Education for the year ended June 30, 2012:
AmountsBeginning Ending Due Within
Balance Additions Deductions Balance One YearGovernmental activities:
Compensated absences 3,473,814 2,032,671 (2,067,842) 3,438,643 21,293 Net OPEB obligation 18,476,979 317,763 - 18,794,742 -
21,950,793$ 2,350,434$ (2,067,842)$ 22,233,385$ 21,293$
Business-type activities:Compensated absences 31,569$ 27,543$ (24,569)$ 34,543$ -$ Net OPEB obligation 299,243 5,124 - 304,367 -
330,812$ 32,667$ (24,569)$ 338,910$ -$

-50-
CALVERT COUNTY, MARYLAND
NOTES TO FINANCIAL STATEMENTS JUNE 30, 2012
Note 8 - Fund Balances
A. Governmental Funds - Fund Balance
Fund Balance – In fiscal year 2011, Calvert County implemented Governmental Accounting Standards Board Statement No. 54 - Fund Balance Reporting and Governmental Fund Type Definitions (GASB 54). In the fund financial statements, fund balance for governmental funds is reported in classifications that comprise a hierarchy based primarily on the extent to which the County is bound to honor constraints on the specific purpose for which amounts in the funds can be spent. The new fund balance classifications are as follows:
1. Nonspendable: Amounts that cannot be spent because they are either in a nonspendable form, or are legally or contractually required to be maintained intact.
2. Restricted: Amounts that have constraints placed on them either externally by third-parties (creditors, grantors, contributors, or laws or regulations of other governments) or by law through constitutional provisions or enabling legislation.
3. Committed: Amounts that can only be used for specific purpose pursuant to constraints imposed by formal action of the County’s highest level of decision making authority. The Board of County Commissioners (BOCC) is the highest level of decision-making authority, and committed funds are established by resolution or legislation. Those committed amounts cannot be used for any other purpose unless the BOCC removes or changes the specified used by taking the same type of action it employed previously to commit those amounts.
4. Assigned: Amounts that are constrained by the County’s intent to be used for specific purposes, but are neither restricted nor committed. The authority for assigning fund balance if expressed by the BOCC or the Director of Finance and Budget as established in the County’s Fund Balance Policy.
5. Unassigned: Amounts that have not been restricted, committed or assigned to specific purposes within the general fund. The general fund is the only fund that reports a positive unassigned fund balance amount. Other governmental funds besides the general fund can only report a negative unassigned fund balance amount.
The County has passed a fund balance resolution that specifies the spending order of the different types of fund balances. Nonspendable amounts by definition can’t be spent, and restricted amounts are restricted by external parties and can only be spent in accordance with the restrictions. Therefore, it is the policy of Calvert County to spend funds in the following order: committed, then assigned, and then unassigned.

-51-
CALVERT COUNTY, MARYLAND
NOTES TO FINANCIAL STATEMENTS JUNE 30, 2012
As of June 30, 2012, fund balances were reported as follows:
Nonmajor Total Capital Governmental Governmental
General Fund Projects Funds Funds
Nonspendable:Inventory 284,936$ -$ -$ 284,936$ Long term receivables 9,260,258 - - 9,260,258 Leveraging obligations - - 7,170,057 7,170,057
Restricted for:Other purposes - - 2,110,829 2,110,829 Endowments - - 3,750 3,750
Committed to:Encumbrances:
General government 722,715 - - 722,715 Public safety 832,361 - - 832,361 Public works 497,294 - - 497,294 Health and hospital 3,956 - - 3,956 Social services 481 - - 481 Recreation and culture 172,846 - - 172,846 Other purposes 25,770 - - 25,770
Stabilization arrangement 18,550,000 - - 18,550,000 Board of education - 1,514,005 - 1,514,005 Other purposes 624,825 - 8,091,028 8,715,853
Assigned to:Vacation/sick leave 3,500,000 - - 3,500,000 OPEB 4,718,619 - - 4,718,619 Other purposes - - 14,884 14,884 Other capital projects - 34,571,945 - 34,571,945
Unassigned: 27,321,625 - - 27,321,625
Total fund balances: 66,515,686$ 36,085,950$ 17,390,548$ 119,992,184$
GOVERNMENTAL FUNDS FUND BALANCES
COUNTY COMMISSIONERS OF CALVERT COUNTY, MARYLAND
JUNE 30, 2012
Other long-term receivables - The amount of notes receivable advanced to Dares Beach Water, Prince Frederick Water and Sewer, Shores of Calvert Water and Sewer System, advances to the Water and Sewer fund, one Parks and Recreation notes and an amount due from a vendor receivable at June 30, 2012.
Reserved for other purposes - These amounts represent the portion of fund balance restricted for the special purpose of the following funds: Special Revenue Funds, Parks and Recreation Fund, and Land Preservation Fund.
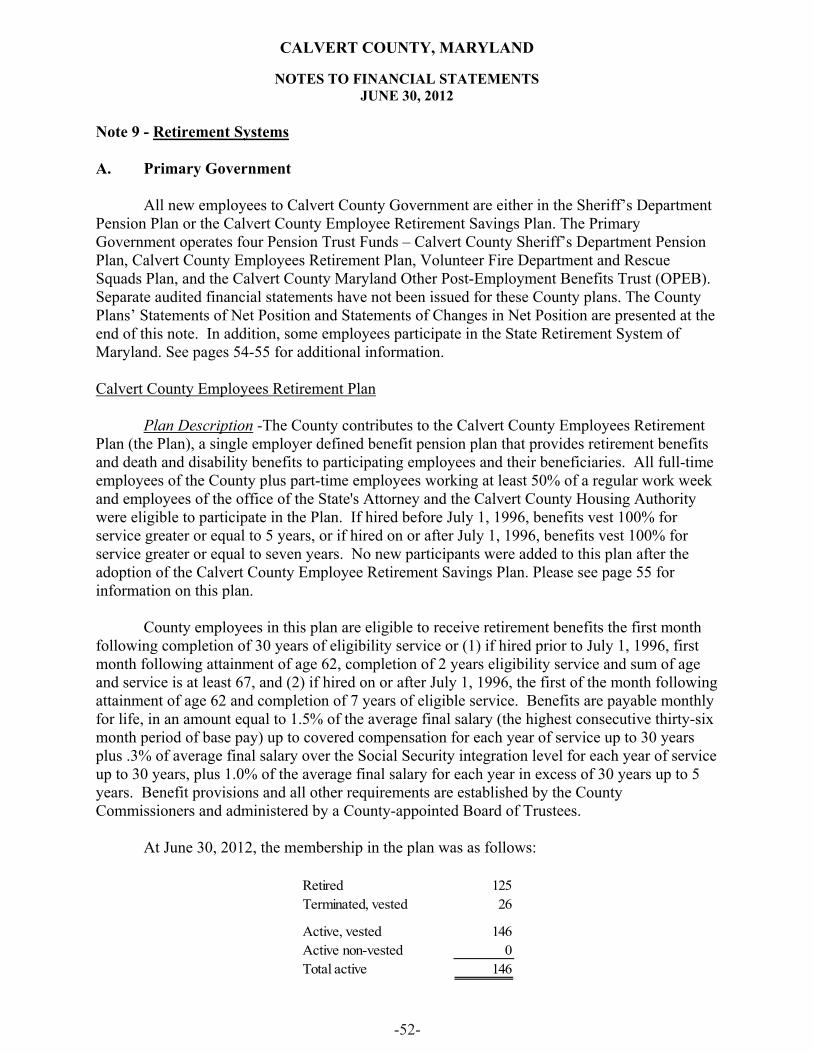
-52-
CALVERT COUNTY, MARYLAND
NOTES TO FINANCIAL STATEMENTS JUNE 30, 2012
Note 9 - Retirement Systems
A. Primary Government
All new employees to Calvert County Government are either in the Sheriff’s Department Pension Plan or the Calvert County Employee Retirement Savings Plan. The Primary Government operates four Pension Trust Funds – Calvert County Sheriff’s Department Pension Plan, Calvert County Employees Retirement Plan, Volunteer Fire Department and Rescue Squads Plan, and the Calvert County Maryland Other Post-Employment Benefits Trust (OPEB). Separate audited financial statements have not been issued for these County plans. The County Plans’ Statements of Net Position and Statements of Changes in Net Position are presented at the end of this note. In addition, some employees participate in the State Retirement System of Maryland. See pages 54-55 for additional information.
Calvert County Employees Retirement Plan
Plan Description -The County contributes to the Calvert County Employees Retirement Plan (the Plan), a single employer defined benefit pension plan that provides retirement benefits and death and disability benefits to participating employees and their beneficiaries. All full-time employees of the County plus part-time employees working at least 50% of a regular work week and employees of the office of the State's Attorney and the Calvert County Housing Authority were eligible to participate in the Plan. If hired before July 1, 1996, benefits vest 100% for service greater or equal to 5 years, or if hired on or after July 1, 1996, benefits vest 100% for service greater or equal to seven years. No new participants were added to this plan after the adoption of the Calvert County Employee Retirement Savings Plan. Please see page 55 for information on this plan.
County employees in this plan are eligible to receive retirement benefits the first month following completion of 30 years of eligibility service or (1) if hired prior to July 1, 1996, first month following attainment of age 62, completion of 2 years eligibility service and sum of age and service is at least 67, and (2) if hired on or after July 1, 1996, the first of the month following attainment of age 62 and completion of 7 years of eligible service. Benefits are payable monthly for life, in an amount equal to 1.5% of the average final salary (the highest consecutive thirty-six month period of base pay) up to covered compensation for each year of service up to 30 years plus .3% of average final salary over the Social Security integration level for each year of service up to 30 years, plus 1.0% of the average final salary for each year in excess of 30 years up to 5 years. Benefit provisions and all other requirements are established by the County Commissioners and administered by a County-appointed Board of Trustees.
At June 30, 2012, the membership in the plan was as follows:
Retired 125Terminated, vested 26
Active, vested 146Active non-vested 0Total active 146

-53-
CALVERT COUNTY, MARYLAND
NOTES TO FINANCIAL STATEMENTS JUNE 30, 2012
Funding Policy - Participating County employees are required to contribute 2% of their annual compensation to the Plan, plus an additional 2% of base salary in excess of Social Security Wage Base. The County contributes the remaining amounts necessary to fund the payments of benefits under the Plan based upon the direction of its consulting actuary. The contributions made to the Plan for fiscal year 2012 were made in accordance with the Plan requirements as of the July 1, 2011 actuarial report. The contributions consisted of amounts contributed by the employees of $208,705 (3% of current covered payroll). The County's costs for fiscal year 2012 were $2,873,160 (33% of current covered payroll).
The net pension obligation was computed using the Projected Unit Credit Method as a part of an actuarial valuation performed as of July 1, 2012. The actuarial value of assets was determined using the assumed yield method with a market value adjustment. The significant actuarial assumptions used in the valuation include an inflation rate of 2.4%, rate of return on the investments of present and future assets of 8% a year compounded annually, additional projected salary increases of 6% compounded annually for ages under 46 and 5% compounded annually for ages 46 and older, cost of living increases of 3% per year calculated on a compound interest basis, and no postretirement benefit increases.
Funded Status - The following schedule presents the funded status as of June 30, 2012:
Actuarial Valuation Date June
30,
Actuarial Value of Assets
Actuarial Accrued Liability (AAL)
Unfunded AAL
(UAAL)Funded
RatioCovered Payroll
UAAL as a % of
Covered Payroll
2012 47,684,644$ 64,920,246$ 17,235,602$ 73.45% 8,703,823$ 198.02%
The plan’s unfunded actuarial liability is being amortized using the level dollar method over a closed period of 20 years.
Funding Progress - The schedule of funding progress (presented as required supplementary information) gives multiyear trend information about whether the actuarial value of plan assets is increasing or decreasing over time relative to the actuarial accrual liability for benefits.
Annual pension cost (APC) and Net pension assets (NPA) - The following schedule gives information on the County’s APC and NPA:
Annual required contribution (ARC) 2,860,148$ Interest on NPA (4,018) Adjustment to ARC 8,739 Annual pension cost (APC) 2,864,869$ Contributions made 2,873,160 Decrease (increase) in net pension asset (8,291) Net pension asset, beginning of year (50,223) Net pension asset, end of year (58,514)$
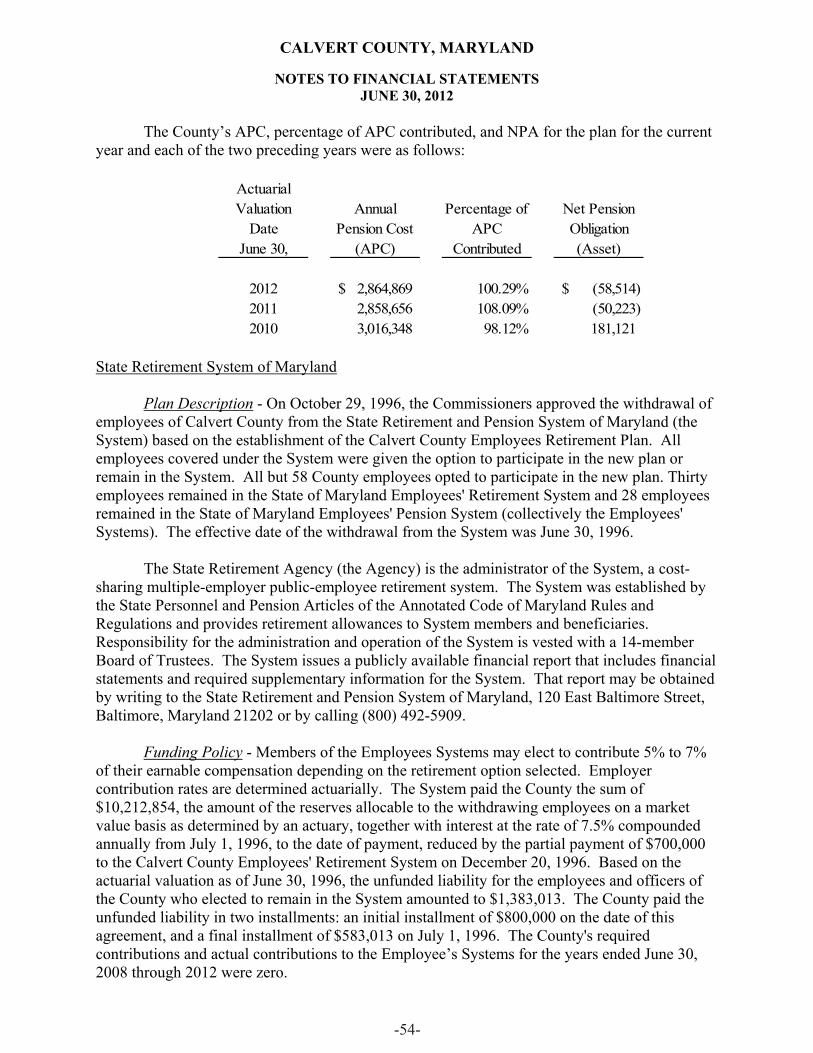
-54-
CALVERT COUNTY, MARYLAND
NOTES TO FINANCIAL STATEMENTS JUNE 30, 2012
The County’s APC, percentage of APC contributed, and NPA for the plan for the current year and each of the two preceding years were as follows:
State Retirement System of Maryland
Plan Description - On October 29, 1996, the Commissioners approved the withdrawal of employees of Calvert County from the State Retirement and Pension System of Maryland (the System) based on the establishment of the Calvert County Employees Retirement Plan. All employees covered under the System were given the option to participate in the new plan or remain in the System. All but 58 County employees opted to participate in the new plan. Thirty employees remained in the State of Maryland Employees' Retirement System and 28 employees remained in the State of Maryland Employees' Pension System (collectively the Employees' Systems). The effective date of the withdrawal from the System was June 30, 1996.
The State Retirement Agency (the Agency) is the administrator of the System, a cost- sharing multiple-employer public-employee retirement system. The System was established by the State Personnel and Pension Articles of the Annotated Code of Maryland Rules and Regulations and provides retirement allowances to System members and beneficiaries. Responsibility for the administration and operation of the System is vested with a 14-member Board of Trustees. The System issues a publicly available financial report that includes financial statements and required supplementary information for the System. That report may be obtained by writing to the State Retirement and Pension System of Maryland, 120 East Baltimore Street, Baltimore, Maryland 21202 or by calling (800) 492-5909.
Funding Policy - Members of the Employees Systems may elect to contribute 5% to 7% of their earnable compensation depending on the retirement option selected. Employer contribution rates are determined actuarially. The System paid the County the sum of $10,212,854, the amount of the reserves allocable to the withdrawing employees on a market value basis as determined by an actuary, together with interest at the rate of 7.5% compounded annually from July 1, 1996, to the date of payment, reduced by the partial payment of $700,000 to the Calvert County Employees' Retirement System on December 20, 1996. Based on the actuarial valuation as of June 30, 1996, the unfunded liability for the employees and officers of the County who elected to remain in the System amounted to $1,383,013. The County paid the unfunded liability in two installments: an initial installment of $800,000 on the date of this agreement, and a final installment of $583,013 on July 1, 1996. The County's required contributions and actual contributions to the Employee’s Systems for the years ended June 30, 2008 through 2012 were zero.
Actuarial Valuation
Date June 30,
Annual Pension Cost
(APC)
Percentage of APC
Contributed
Net Pension Obligation (Asset)
2012 2,864,869$ 100.29% (58,514)$ 2011 2,858,656 108.09% (50,223)2010 3,016,348 98.12% 181,121

-55-
CALVERT COUNTY, MARYLAND
NOTES TO FINANCIAL STATEMENTS JUNE 30, 2012
The computation of the pension contribution requirements for fiscal year 2012 was based on the same actuarial assumptions, benefits provisions, actuarial funding method and other significant factors used to determine pension contributions requirements in the previous year. Contributions by the State of Maryland on behalf of the Calvert County Public Library were $320,402, $320,784, and $286,755, for the years ended June 30, 2012, 2011 and 2010. In accordance with GASB Statement Number 24, the State’s 2012 contribution amount has been shown as State aid revenue and pension expenditure.
Calvert County’s Employee Retirement Savings Plan
On July 28, 1998, the Commissioners approved the formation of a single employer defined contribution pension plan with a 5% County contribution and a required 3% contribution from all eligible employees. The plan was put in place January 1, 1999. All employees hired after June 30, 1998 were automatically enrolled in the defined contribution pension plan.Required contributions and all other plan provisions are established by the County Commissioners and administered by a County-appointed Board of Trustees. The contributions by the County and the employees for the year ended June 30, 2012 were $925,281 and $629,085, respectively.
Length of Service Award Program
Plan Description - The County contributes to the Length of Service Awards Program(LSAP) for the Volunteer Fire and Rescue Squads personnel of Calvert County (Plan), a single-employer noncontributory retirement and pension plan. Any person who is certified as an active member with any Calvert County Volunteer Fire Company or Rescue Squad is eligible to participate in the Plan. Active members who attain age 55 and have completed 25 years of certified volunteer service shall receive $400 per month plus $4 per month additional for each year of service in excess of 25 years, with a maximum benefit of $500 per month. If an active member attains age 70 and has 2 years of qualifying service out of the last 5 years, but does not complete 25 years of service, a monthly benefit equal to $8 times the years of service will be payable. The Plan also provides for death and disability benefits to participating volunteers. Benefit provisions and all other requirements are established by the Fire and Rescue Commission and approved by the Commissioners as authorized by the legislative assembly. The County contributes all amounts necessary to fund the payments of benefits under the Plan.
At June 30, 2012, the membership was as follows:
Retired 48
Active, vested 38Active, non- vested 895Total active 933Active employees receiving benefits 28

-56-
CALVERT COUNTY, MARYLAND
NOTES TO FINANCIAL STATEMENTS JUNE 30, 2012
Funding Policy - The net pension obligation was computed using the Projected Unit Credit Cost Method as a part of an actuarial valuation performed as of July 1, 2012. The significant actuarial assumptions used in the valuation include an inflation rate of 2.4%, a rate of return on the investments of present and future assets of 8% a year compounded annually; 80% of the participants are assumed to be married with spouses four years younger; participants, who have already earned at least two years of credit and have attained age 30, are assumed to earn credit in 50% of their future years. All others are assumed to earn no credit. The actuarial value of assets was determined using the Assumed Yield Method with a Market Value adjustment.
The contributions made by the County to the Plan for fiscal 2012 totaling $376,549 were made in accordance with actuarial determined requirements computed through an actuarial valuation performed as of July 1, 2011.
Funded Status - The following schedule presents the funded status as of June 30, 2012:
Actuarial Valuation Date June
30,
Actuarial Value of Assets
Actuarial Accrued Liability (AAL)
Unfunded AAL
(UAAL)Funded
RatioCovered Payroll
UAAL as a % of
Covered Payroll
2012 2,762,898$ 6,110,725$ 3,347,827$ 45.21% N/A N/A
The plan’s unfunded actuarial liability is being amortized using the level dollar method over a closed period of 20 years.
Funding Progress - The schedule of funding progress (presented as required supplementary information) gives multiyear trend information about whether the actuarial value of plan assets is increasing or decreasing over time relative to the actuarial accrual liability for benefits.
Annual pension cost (APC) and Net pension assets (NPA) - The following schedule gives information on the County’s APC and NPA:
Annual required contribution (ARC) 453,180$ Interest on NPA (14,640) Adjustment to ARC 31,845 Annual pension cost (APC) 470,385$ Contributions made 376,549 Decrease (increase) in net pension asset 93,836 Net pension asset, beginning of year (183,006) Net pension asset, end of year (89,170)$

-57-
CALVERT COUNTY, MARYLAND
NOTES TO FINANCIAL STATEMENTS JUNE 30, 2012
The County’s APC, percentage of APC contributed, and NPA for the plan for the current year and each of the two preceding years were as follows:
Calvert County Sheriff’s Department Pension Plan
Plan Description - The County contributes to the Calvert County Sheriff’s Department Pension Plan (Plan), a single-employer defined benefit pension plan. All full-time deputy sheriffs and correctional officers employed by the County, excluding those who were hired prior to July 1, 1989, who elected to remain in the State Pension System, are eligible to participate in the Plan. Benefits vest 50% after 5 years, increasing 5% a year to 100% after 15 years. County employees who retire at or after age 55 or after 25 years of service are entitled to an annual retirement benefit, payable monthly for life, in an amount equal to 2.4% of their final average earnings for each year of service up to 20, plus 2% of final average earnings for service over 20 years and up to 27 years. The Plan also provides for death and disability benefits to participating employees. Benefit provisions and all other requirements are established by a County-appointed Board of Trustees.
At June 30, 2012, the membership was as follows:
Retired 51Terminated, vested 38
Active, vested 121Active, non-vested 63Total active 184
Funding Policy - The net pension obligation was computed using the Projected Unit Credit Method as a part of an actuarial valuation performed as of July 1, 2012. The significant actuarial assumptions used in the valuation include an inflation rate of 2.4%, a rate of return on the investments of present and future assets of 8% a year compounded annually; additional projected salary increases of 6.50% to age 37, 4.50% from age 38 to 42 and 4.00% thereafter; costs of living increases to all plan participants of 3.00% per year calculated on a compound interest basis. The actuarial value of assets was determined using an Asset Smoothing Method.
Actuarial Valuation
Date June 30,
Annual Pension Cost
(APC)
Percentage of APC
Contributed
Net Pension Obligation (Asset)
2012 470,385$ 80.05% (89,170)$ 2011 392,614 95.51% (183,006) 2010 380,653 78.55% (200,620)

-58-
CALVERT COUNTY, MARYLAND
NOTES TO FINANCIAL STATEMENTS JUNE 30, 2012
Participating County employees are required to contribute 8% of their annual compensation to the Plan, compounded annually with 5% interest. The County contributes the remaining amounts necessary to fund the payments of benefits under the Plan based upon the direction of its consulting actuary.
The contributions made to the Plan for fiscal 2012 totaling $2,524,905 were made in accordance with actuarially determined requirements computed through an actuarial valuation performed as of July 1, 2011.
Amounts contributed by the County and Employees consisted of the following:
County (23.3% of current covered payroll) 2,524,905$ Employees (8.2% of current covered payroll) 890,642
Funded Status - The following schedule presents the funded status as of June 30, 2012:
Actuarial Valuation Date June
30,
Actuarial Value of Assets
Actuarial Accrued Liability (AAL)
Unfunded AAL
(UAAL)Funded
RatioCovered Payroll
UAAL as a % of
Covered Payroll
2012 45,717,410$ 57,564,334$ 11,846,924$ 79.42% 10,817,969$ 109.51%
The plan’s unfunded actuarial liability is being amortized using the level dollar method over a closed amortization period of 20 years.
Funding Progress - The schedule of funding progress (presented as required supplementary information) gives multiyear trend information about whether the actuarial value of plan assets is increasing or decreasing over time relative to the actuarial accrual liability for benefits.
Annual pension cost (APC) and Net pension assets (NPA) - The following schedule gives information on the County’s APC and NPA:
Annual required contribution (ARC) 2,700,709$ Interest on NPA (4,528)Adjustment to ARC (10,871)Annual pension cost (APC) 2,685,310$ Contributions made 2,524,905Decrease (increase) in net pension asset 160,405Net pension asset, beginning of year (56,600)Net pension asset, end of year 103,805$

-59-
CALVERT COUNTY, MARYLAND
NOTES TO FINANCIAL STATEMENTS JUNE 30, 2012
The County’s APC, percentage of APC contributed, and NPA for the plan for the current year and each of the two preceding years were as follows:
Calvert County Maryland Other Post-Employment Benefits Trust
Plan description – The County contributes to the Calvert County Maryland Other Post-Employment Benefit Trust (Plan), an agent multiple employer defined benefit postemployment healthcare plan. Benefit provisions and all other requirements are established by the County Commissioners and the County Board of Education and administered by a jointly appointed Board of Trustees. The plan provides healthcare, prescription drug and dental benefits to retired employees, spouses and dependants, of participating governmental entities. The plan also provides life insurance benefits for retirees of the Board of Education. Active employees of a participating governmental entity who retire or are disabled and meet the eligibility criteria will participate. Generally employees must have retired from a participating entity to be eligible.
The current employee/retiree membership in the Plan as of June 30, 2012 is as follows:
County Board of EducationActive 628 1,647 Retired 136 678 Total 764 2,325
Funding Policy – The Calvert County Board of County Commissioners will establish annually a health insurance subsidy amount under the Plan. These subsidies will be reviewed annually and are subject to change based on budgetary constraints. For retirees who retired before June 30, 2008, the subsidy is 90% of the premium, for retirees who retired after June 30, 2008 the subsidy is 75% of the premium. Retirees who retired prior to August 1, 1994 receive 100% of their individual policy and 50% of the difference between the individual policy and the policy selected. Retirees will earn or vest in the subsidy based upon their years of creditable service, at a rate ranging from 20% to 100%. Current retirees, who have a 100% subsidy, equate to the Plan covering 75% of their cost of benefit coverage. The retiree is responsible for the difference between the cost of the selected Plan and the earned subsidy. The Board of Education establishes the level of benefits for its retirees which includes health care and life insurance benefits.
Actuarial Valuation
Date June 30,
Annual Pension Cost
(APC)
Percentage of APC
Contributed
Net Pension Obligation (Asset)
2012 2,685,310$ 94.03% 103,805$ 2011 2,521,430 103.71% (56,600) 2010 2,565,539 97.87% 36,970

-60-
CALVERT COUNTY, MARYLAND
NOTES TO FINANCIAL STATEMENTS JUNE 30, 2012
Contribution rates and the net other post employment benefits obligation for the year ended June 30, 2012 were actuarially determined, using the Projected Unit Credit Actuarial Cost Method, through an actuarial valuation dated July 1, 2010 . The significant actuarial assumptions used in the valuation include; a discount rate of 7%, healthcare cost trend – medical 8.4% in the 2010 plan year declining 0.4% each plan year to 5% for 2018 and later years, dental 8% in the 2010 year declining 0.25% to 0.50% each year to 5% for 2018 and later, mortality - RP 2000 combined healthy mortality table, except for the Sherriff’s Plan which uses 1983 Group Annuity Mortality Table.
The contributions to the Plan by the County for the years ended June 30 were as follows:
CountyOn behalf payments for
Board of Education Total
2012 2,384,047$ 8,566,168$ 10,950,215$ 2011 1,502,916 2,269,795 3,772,711 2010 508,179 1,491,821 2,000,000
Funding Status & Progress- The schedule of funding progress (presented as required supplementary information) gives information about whether the actuarial value of plan assets is increasing or decreasing over time relative to the actuarial accrual liability for benefits.
Funding Status - At June 30, 2012, the funding status was as follows:
Actuarial Value of Assets
Actuarial Accrued Liability (AAL)
Unfunded AAL
(UAAL)Funded
RatioCovered Payroll
UAAL as a % of
Covered Payroll
County 4,337,978$ 36,717,748$ 32,379,770$ 11.81% N/A N/ABoard of Education 17,226,681 139,625,512 122,398,831 12.34% N/A N/A
Total 21,564,659$ 176,343,260$ 154,778,601$ 12.23% N/A N/A
Actuarial valuations involve estimates of value of reported amounts and assumptions about the probability of events far into the future. Actuarially determined amounts are subject to continual revisions as actual results are compared to past expectations and new estimates are made about the future. Projection of benefits are based on the types of benefits provided under the substantive plan at the time of each valuation and on the pattern of sharing of benefit costs between the employer and plan member to that point. Actuarial calculations reflect a long-term prospective, and consistent with that perspective, actuarial methods and assumptions used include techniques that are designed to reduce short-term volatility in actuarially accrued liabilities and the actuarial value of assets.
The Plan’s unfunded actuarial liability is being amortized using the level dollar method over a closed amortization period of 30 years.

-61-
CALVERT COUNTY, MARYLAND
NOTES TO FINANCIAL STATEMENTS JUNE 30, 2012
Net OPEB Obligation - The County implemented GASB 45 in fiscal year 2008 and elected to report a zero net OPEB obligation at the beginning of the transition year. The County makes on behalf payments for the Board of Education.
The schedule on the following page presents the net OPEB obligation for the past three years:
Actuarial Valuation
Date June 30,
Annual Required
Contribution
Interest on Net Pension Obligation
Adjustment to Annual Required
ContributionAnnual OPEB
Cost
Pay as You go Payments Plus Contributions
Percentage Contributed
Increase in net OPEB Obligation
End of Year net OPEB Obligation
County
2012 3,996,491$ 323,061$ 374,456$ 3,945,096$ 3,442,226$ 87.25% 502,870$ 5,118,030$ 2011 3,641,418 242,747 115,714 3,768,451 2,621,100 69.55% 1,147,351 4,615,160 2010 3,641,418 100,512 115,714 3,626,216 1,594,299 43.97% 2,031,917 3,467,809
Board of Education
2012 14,359,874$ 1,314,336$ 1,524,438$ 14,149,772$ 13,826,883$ 97.72% 322,889$ 19,099,113$ 2011 11,319,105 892,244 516,870 11,694,479 5,664,604 48.44% 6,029,875 18,776,224 2010 11,319,105 448,969 516,870 11,251,204 4,918,693 43.45% 6,332,511 12,746,349
TOTAL
2012 18,356,365$ 1,637,397$ 1,898,894$ 18,094,868$ 17,269,109$ 95.44% 825,759$ 24,217,143$ 2011 14,960,523 1,134,991 632,584 15,462,930 8,285,704 53.58% 7,177,226 23,391,384 2010 14,960,523 549,481 632,584 14,877,420 6,512,992 43.53% 8,364,428 16,214,158
Net Asset Information (all trust funds) – The statement of net position and statement of changes in net position for all County-administered plans are shown below:
Combining Statement of Plan Net Position
Volunteer Fire and Rescue
Sheriff’s Pension
Plan
Employees Retirement
Plan
Other Post Employment
Benefits TotalAssets:
Cash and cash equivalents 46,544$ 1,346,294$ 672,221$ 3,802,754$ 5,867,813$ Investments at Fair Value
Fixed income 527,376 12,501,489 13,085,800 6,438,221 32,552,886 Common Stocks - 6,334,817 6,818,272 - 13,153,089 Equity funds 1,647,813 17,470,704 18,748,543 23,917,026 61,784,086 Foreign Assets 343,918 4,458,668 4,830,348 - 9,632,934 Other Assets - 1,602,601 1,435,345 242,909 3,280,855
Total investments at fair value 2,519,107 42,368,279 44,918,308 30,598,156 120,403,850
Total cash, cash equivalents and investments 2,565,651 43,714,573 45,590,529 34,400,910 126,271,663
Interest receivable 1,659 32,465 35,128 8 69,260
Total assets 2,567,310$ 43,747,038$ 45,625,657$ 34,400,918$ 126,340,923$
Liabilities and Net Position Total Liabilities - - - - -
Net Position held in trust for pension and other post employment benefits 2,567,310 43,747,038 45,625,657 34,400,918 126,340,923
Total liabilities and net position 2,567,310$ 43,747,038$ 45,625,657$ 34,400,918$ 126,340,923$

-62-
CALVERT COUNTY, MARYLAND
NOTES TO FINANCIAL STATEMENTS JUNE 30, 2012
Volunteer Fire and Rescue
Sheriff’s Pension Plan
Employees Retirement
Plan
Other Post Employment
Benefits TotalAdditions:
ContributionsPlan sponsor 376,549$ 2,524,905$ 2,873,160$ 10,950,215$ 16,724,829$ Employee - 890,642 208,705 - 1,099,347
Total Contributions 376,549 3,415,547 3,081,865 10,950,215 17,824,176
Investment income/(Loss):Net appreciation/(depreciation)
in fair value of investments (186,353) (855,323) (1,269,368) (704,167) (3,015,211) Interest and dividends 151,007 1,689,230 1,811,714 1,251,389 4,903,340 Net investment income/(loss) (35,346) 833,907 542,346 547,222 1,888,129 Total Additions 341,203 4,249,454 3,624,211 11,497,437 19,712,305
Expenditures:Distributions to participants 369,258 1,551,564 2,134,217 - 4,055,039 Administrative expenses 39,100 361,683 341,230 65,427 807,440
Total Expenditures 408,358 1,913,247 2,475,447 65,427 4,862,479
Net increase(decrease) (67,155) 2,336,207 1,148,764 11,432,010 14,849,826
Net Position Held in Trust for Pensionand Other Post Employment Benefits:
Beginning of the year 2,634,465 41,410,831 44,476,893 22,968,908 111,491,097
End of the year 2,567,310$ 43,747,038$ 45,625,657$ 34,400,918$ 126,340,923$
Combining Statement of Changes in Plan Net Position
B. Component Unit – Board of Education
Plan Description - The employees of the Board of Education (the Board), are covered by the Teachers Retirement System, the Teachers Pension System of the State of Maryland (the Teachers Systems) or the Employees Retirement System and Employees Pension System of the State of Maryland. These systems are part of the Maryland State Retirement and Pension System, (the System) and are cost-sharing, multiple-employer, defined benefit public employee retirement systems.
The System was established in accordance with the State Personnel and Pensions Article of the Annotated Code of Maryland. Responsibility for the administration and operation of the systems is vested in a Board of Trustees (Trustees). The Trustees also have the authority to establish and amend the respective benefit provisions. The System provides retirement and disability benefits, annual cost of living adjustments, and death benefits to system members and beneficiaries.
The System issues a publicly available comprehensive annual financial report that includes financial statements and required supplementary information for the Systems. That report may be obtained by writing to the State Retirement and Pension System of Maryland, State Retirement Agency, 120 East Baltimore Street, Baltimore, Maryland 21202, or by calling (800) 492-5909.

-63-
CALVERT COUNTY, MARYLAND
NOTES TO FINANCIAL STATEMENTS JUNE 30, 2012
Funding Policy - The State Personnel and Pensions Article require active members to contribute to the System at the rate of 5% to 7% of their covered salary depending upon the retirement option selected. Contribution rates for the Board are established by annual actuarial valuations using the entry age normal test method. The State's contribution’s on behalf of the Board to the Teachers systems for the years ended June 30, 2012, 2011, and 2010 were approximately $17.0 million, $17.0 million, and $15.2 million, respectively.
Annual Required Contributions - For the year ended June 30, 2012, the Board’s annual pension cost of $2,012,647 was equal to its required contribution. The annual required contribution was determined as part of the June 30, 2009 actuarial valuation using the entry age actuarial cost method. The actuarial assumptions included (a) 7.75% investment rate of return, compounded annually, (b) projected salary increases of 3.5% compounded annually, attributable to inflation, (c) additional projected salary increases ranging from 0.0% to 8.5% per year attributable to seniority and merit, (d) post-retirement benefit increases ranging from 2.75% to 3.5% per year depending on the system, (e) rates of mortality, termination of service, disablement and retirement based on actual experience from 2003 through 2006, and (f) the aggregate active member payroll is assumed to increase by 3.5% annually. The actuarial value of the Systems’ assets was determined using techniques that smooth the effects of short-term volatility in the market value of investments by using a simplified five-year moving average. The Board’s unfunded actuarial accrued liability is being amortized in distinct pieces. The equivalent single amortization period is 29.78 years. The Board’s annual pension cost for the last three years was:
Fiscal Year Annual Net Ending Required Percentage Pension
June 30, Contribution Contributed Obligation
2012 2,012,647$ 100% - 2011 1,654,559 100% - 2010 1,160,410 100% -
Required Supplemental Information
Schedule of Funding Progress for the
(expressed in thousands)
Actuarial Actuarial Actuarial UAAL as a Valuation Actuarial Accrued Unfunded Percentage Date Value of Liability (AAL) AAL Funded Covered of Covered(June 30) Assets Entry Age (UAAL) Ratio Payroll Payroll
2011 36,177,656$ 55,917,543$ 19,739,887$ 64.70% 10,478,800$ 188%2010 34,688,346 54,085,081 19,396,735 64.14% 10,657,944 182%2009 34,284,569 52,729,171 18,444,602 65.02% 10,714,241 172%
State Retirement and Pension Systems of Maryland

-64-
CALVERT COUNTY, MARYLAND
NOTES TO FINANCIAL STATEMENTS JUNE 30, 2012
Note 10 - Commitments and Contingent Liabilities
The Commissioners are defendants in several lawsuits. In the opinion of the County Attorney and legal counsel, pending legal proceedings are not likely to have a material adverse impact on the County's financial condition, and to the best of their knowledge, the County is in compliance with all state and local laws and ordinances.
Note 11 - Risk Management
The County is exposed to various risks of loss related to torts; theft of, damage to, and destruction of assets; errors and omissions; injuries to employees; and related disasters. The County is a capital member of the Local Government Insurance Trust (LGIT) sponsored by the Maryland Municipal League (MML), and the Maryland Association of Counties. The LGIT is a self-insured public entity risk pool offering general liability, excess liability, business auto liability, police legal liability, public official liability, environmental liability, and property coverage.
LGIT is capitalized at an actuarially determined level to provide financial stability for its local government members and to reduce the possibility of assessments. The trust is owned by the participating counties and cities and managed by a Board of Trustees elected by the members. Annual premiums are assessed for the various policy coverages. During fiscal year 2012, the County paid premiums of $546,731 to the trust. The agreement for the formation of LGIT provides that the trust will be self-sustaining through member premiums and will reinsure through commercial companies for claims in excess of $500,000 for each insured event. Settled claims resulting from these risks have not exceeded commercial insurance coverage in the past four fiscal years.
The County is under a modified retrospective billing arrangement with a commercial insurance carrier to provide group health coverage. Under this arrangement the insurance carrier assesses an initial charge paid by the County through monthly premiums. At the end of the coverage period, there is a settlement of the difference between the billed premium and the actual claims and expenses. A deficiency in the billed premium represents the callable margin, which is owed by the County, up to a maximum of 5%. If the actual claims and expenses are less than the billed premium, the County would be entitled to a refund.
Note 12 - Subsequent Events
In preparing these financial statements, the management of Calvert County, Maryland has evaluated events and transactions for potential recognition or disclosure through December 19, 2012, the date the financial statements were available to be issued.

“THIS PAGE LEFT INTENTIONALLY BLANK”

COUNTY COMMISSIONERS OF CALVERT COUNTYCALVERT COUNTY, MARYLAND
REQUIRED SUPPLEMENTARY INFORMATIONJUNE 30, 2012

-65-
COUNTY COMMISSIONERS OF CALVERT COUNTY, MARYLAND
SUMMARY SCHEDULE OF REVENUE AND EXPENDITURES,AND OTHER FINANCING SOURCES AND USES
BUDGET AND ACTUAL (BUDGETARY BASIS) - GENERAL FUNDFOR THE YEAR ENDED JUNE 30, 2012
VarianceBudget Budget (Over)
Original Final Actual UnderREVENUES
Taxes 215,356,580$ 218,607,397$ 218,215,279$ (392,118)$ Licenses and permits 254,400 254,400 304,571 50,171 Intergovernmental 3,658,361 4,833,826 4,824,069 (9,757) Charges for services 3,592,605 3,653,452 3,398,721 (254,731) Fines and forfeitures 433,650 481,896 457,748 (24,148) Miscellaneous 530,357 2,810,614 1,306,927 (1,503,687)
Total revenues 223,825,953 230,641,585 228,507,315 (2,134,270)
EXPENDITURESGeneral government 16,897,511 17,183,415 16,344,189 839,226 Public safety 26,826,137 28,303,836 27,903,667 400,169 Public works 9,165,528 10,101,187 9,587,361 513,826 Health and hospitals 2,639,344 2,793,217 2,764,613 28,604 Social services 1,650,795 1,706,744 1,647,850 58,894 Education 112,486,911 112,461,911 112,461,911 - Recreation and culture 10,558,216 10,828,261 10,607,982 220,279 Conservation of natural resources 400,761 403,761 405,860 (2,099) Urban development and housing 1,917,500 1,892,913 1,828,361 64,552 Economic development 1,256,046 1,362,297 1,238,967 123,330 Pensions and insurance 27,056,728 29,823,315 29,522,254 301,061 Debt service Principal retirement 11,570,859 10,971,706 10,971,736 (30) Interest 5,178,342 4,929,445 4,929,445 - Bond expense - 127,802 179,509 (51,707)
Total expenditures 227,604,678 232,889,810 230,393,705 2,496,105
OTHER FINANCING SOURCES (USES)Operating transfers in 8,265,834 10,049,727 9,049,727 (1,000,000) Operating transfers out (4,487,109) (7,801,502) (7,664,272) 137,230
Total other financing sources (uses) 3,778,725 2,248,225 1,385,455 (862,770)
Excess (deficiency) of revenue and other financing sources over expenditures and other financing uses -$ -$ (500,935)$ (500,935)$
Revenue and transfers in (budgetary basis) 237,557,042$ Transfer adjustment (Library) (605,843) Revenue and transfers in (GAAP basis) 236,951,199$
Expenditures and operating transfers out (budgetary basis) 238,057,977$ Encumbrance/accrual adjustment (473,554) Transfer adjustment (Library) (605,843) Expenditures and operating transfers out (GAAP basis) 236,978,580$
A reconciliation of the revenue and expenditures of the general fund to present the combined statement of revenue and expenditures on a GAAP basis follows

-66-
COUNTY COMMISSIONERS OF CALVERT COUNTY, MARYLAND
CALVERT COUNTY MARYLAND POST-EMPLOYMENT BENEFIT PLANOTHER POST EMPLOYMENT BENEFITS SCHEDULES
YEAR ENDED JUNE 30, 2012
A. Schedule of Funding Progress
ActuarialValuationDate June
30,
ActuarialValue ofAssets
ActuarialAccruedLiability(AAL)
Unfunded AAL (UAAL) Funded Ratio
CoveredPayroll
UAAL as a % of Covered
PayrollCounty
2012 4,337,978$ 36,717,748$ 32,379,770$ 11.81% N/A N/A2011 - 30,562,690 30,562,690 0.00% N/A N/A2010 - 30,562,690 30,562,690 0.00% N/A N/A2009 - 25,690,319 25,690,319 0.00% N/A N/A2008 - 25,690,319 25,690,319 0.00% N/A N/A
Board of Education
2012 17,226,681$ 139,625,512$ 122,398,831$ 12.34% N/A N/A2011 - 99,455,289 99,455,289 0.00% N/A N/A2010 - 99,455,289 99,455,289 0.00% N/A N/A2009 - 78,032,239 78,032,239 0.00% N/A N/A2008 - 78,032,239 78,032,239 0.00% N/A N/A
Total
2012 21,564,659$ 176,343,260$ 154,778,601$ 12.23% N/A N/A2011 - 130,017,979 130,017,979 0.00% N/A N/A2010 - 130,017,979 130,017,979 0.00% N/A N/A2009 - 103,722,558 103,722,558 0.00% N/A N/A2008 - 103,722,558 103,722,558 0.00% N/A N/A
B. Schedule of Employer Contributions
AnnualRequired
Contribution
Pay as You go Payments Plus Contributions % Contributed
Net OPEB Obligation
Year ended June 30, 2012:County 3,996,491$ 3,442,226$ 86.13% 5,118,030$ Board of Education 14,359,874 13,826,883 96.29% 19,099,113
18,356,365$ 17,269,109$ 94.08% 24,217,143$ Year ended June 30, 2011:
County 3,641,418$ 2,621,100$ 71.98% 4,615,160$ Board of Education 11,319,105 5,664,604 50.04% 18,776,224
14,960,523$ 8,285,704$ 55.38% 23,391,384$ Year ended June 30 2010:
County 3,641,418$ 1,594,299$ 43.78% 3,467,809$ Board of Education 11,319,105 4,918,693 43.45% 12,746,349
14,960,523$ 6,512,992$ 43.53% 16,214,158$ Year ended June 30 2009:
County 3,109,164$ 2,284,452$ 73.47% 1,435,892$ Board of Education 9,127,324 6,799,986 74.50% 6,413,838
12,236,488$ 9,084,438$ 74.24% 7,849,730$ Year ended June 30 2008:
County 3,109,164$ 2,537,968$ 81.63% 571,196$ Board of Education 9,127,324 5,308,165 58.16% 3,819,159
12,236,488$ 7,846,133$ 64.12% 4,390,355$
REQUIRED SUPPLEMENTARY INFORMATION

-67-
COUNTY COMMISSIONERS OF CALVERT COUNTY, MARYLAND
CALVERT COUNTY EMPLOYEES RETIREMENT PLANPENSION PLAN SCHEDULESYEAR ENDED JUNE 30, 2012
A. Schedule of Funding Progress
ActuarialValuationDate June
30,Actuarial
Value of Assets
ActuarialAccrued
Liability (AAL)Unfunded AAL
(UAAL) Funded RatioCoveredPayroll
UAAL as a % of Covered
Payroll
2012 47,684,644$ 64,920,246$ 17,235,602$ 73.45% 8,703,823$ 198.02%2011 43,210,780 59,398,290 16,187,510 72.75% 9,466,884 170.99%2010 38,497,686 55,158,918 16,661,232 69.79% 9,861,976 168.94%2009 34,593,965 53,007,610 18,413,645 65.26% 10,340,394 178.07%2008 39,736,110 48,932,199 9,196,089 81.21% 10,470,627 87.83%2007 36,354,279 42,656,369 6,302,090 85.23% 10,285,756 61.27%
B. Schedule of Employer Contributions
YearsEnded
June 30, Contribution
AnnualRequired
ContributionPercentage
Contributed
2012 2,873,160$ 2,860,148$ 100.45%2011 3,090,000 2,873,160 107.55%2010 2,959,622 3,024,934 97.84%2009 2,141,454 2,142,802 99.94%2008 1,662,037 1,662,037 100.00%2007 1,490,000 1,489,747 100.02%
REQUIRED SUPPLEMENTARY INFORMATION

-68-
COUNTY COMMISSIONERS OF CALVERT COUNTY, MARYLAND
CALVERT COUNTY SHERIFF'S DEPARTMENT PENSION PLAN SCHEDULESYEAR ENDED JUNE 30, 2012
A. Schedule of Funding Progress
ActuarialValuationDate June
30,
ActuarialValue ofAssets
ActuarialAccruedLiability(AAL)
UnfundedAAL
(UAAL) Funded RatioCoveredPayroll
UAAL as a % of Covered
Payroll
2012 45,717,410$ 57,564,334$ 11,846,924$ 79.42% 10,817,969$ 109.51%2011 40,503,652 54,976,319 14,472,667 73.67% 10,738,433 134.77%2010 35,424,741 49,354,357 13,929,616 71.78% 10,316,424 135.02%2009 31,118,948 45,164,336 14,045,388 68.90% 10,027,146 140.07%2008 35,102,961 41,370,310 6,267,349 84.85% 8,931,278 70.17%2007 31,577,163 37,774,661 6,197,498 83.59% 7,506,278 82.56%
B. Schedule of Employer Contributions
YearsEnded June
30, Contribution
AnnualRequired
ContributionPercentage
Contributed
2012 2,524,905$ 2,700,709$ 93.49%2011 2,615,000 2,524,905 103.57%2010 2,511,000 2,564,133 97.93%2009 1,765,284 1,766,394 99.94%2008 1,685,214 1,627,076 103.57%2007 1,520,000 1,518,586 100.09%
REQUIRED SUPPLEMENTARY INFORMATION

COUNTY COMMISSIONERS OF CALVERT COUNTY, MARYLAND
(VOLUNTEER FIRE DEPARTMENTS & RESCUE SQUADS)PENSION PLAN SCHEDULESYEAR ENDED JUNE 30, 2012
A. Schedule of Funding Progress
ActuarialValuationDate June
30,
ActuarialValue ofAssets
ActuarialAccruedLiability(AAL)
UnfundedAAL
(UAAL) Funded RatioCoveredPayroll
UAAL as a % of Covered
Payroll
2012 2,762,898$ 6,110,725$ 3,347,827$ 45.21% N/A N/A2011 2,547,402 5,967,750 3,420,348 42.69% N/A N/A2010 2,340,301 5,157,986 2,817,685 45.37% N/A N/A2009 2,228,429 5,050,340 2,821,911 44.12% N/A N/A2008 2,525,943 4,370,000 1,844,057 57.80% N/A N/A2007 2,385,639 4,248,438 1,862,799 56.15% N/A N/A
B. Schedule of Employer Contributions
YearsEnded
June 30, Contribution
AnnualRequired
ContributionPercentage
Contributed
2012 376,549$ 453,180$ 83.09%2011 375,000 376,549 99.59%2010 299,000 361,168 82.79%2009 259,000 259,000 100.00%2008 248,912 248,912 100.00%2007 240,000 237,655 100.99%
REQUIRED SUPPLEMENTARY INFORMATIONLENGTH OF SERVICE AWARD PROGRAM
-69-

COUNTY COMMISSIONERS OF CALVERT COUNTYCALVERT COUNTY, MARYLAND
OTHER SUPPLEMENTARY INFORMATIONJUNE 30, 2012

-70-
VarianceBudgeted Amounts Over
Original Final Actual (Under)Taxes
Real Estate and Personal Property TaxesReal estate levy 107,645,082$ 107,652,810$ 107,642,997$ (9,813)$Personal property levy 200,000 200,000 159,473 (40,527)Corporation levy 2,750,000 2,750,000 2,268,497 (481,503)Payment in lieu of tax (PILOT) 19,646,574 19,646,574 19,646,574 -Public utilities tax 17,650,000 17,650,000 17,868,027 218,027Additions and abatements (150,000) (150,000) 148,910 298,910Penalties and interest 500,000 500,000 854,020 354,020Tax credit (1,925,610) (1,914,887) (1,908,021) 6,866Land preservation credit (240,000) (240,000) (230,858) 9,142
Total Real Estate and Personal Property Taxes 146,076,046 146,094,497 146,449,619 355,122
Other Local TaxesIncome taxes 61,517,634 64,750,000 64,199,044 (550,956)Admissions and amusement tax 30,000 30,000 30,938 938Recordation taxes 5,500,000 5,500,000 5,180,576 (319,424)Trailer parks 120,000 120,000 127,458 7,458Hotel tax 715,000 715,000 753,981 38,981Franchise tax 1,100,000 1,100,000 1,192,010 92,010
Total Other Local Taxes 68,982,634 72,215,000 71,484,007 (730,993)
Shared State TaxesHighway user revenue 297,900 297,900 281,653 (16,247)
Total State Shared Taxes 297,900 297,900 281,653 (16,247)
Total Taxes 215,356,580 218,607,397 218,215,279 (392,118)
Licenses and PermitsBusiness Licenses and Permits
Builders' licenses 25,000 25,000 31,899 6,899Beer, wine, and liquor licenses 105,000 105,000 124,987 19,987Traders 85,000 85,000 87,121 2,121Hawkers and peddlers 2,000 2,000 2,755 755
Total Business Licenses and Permits 217,000 217,000 246,762 29,762
Other PermitsAnimal licenses 20,000 20,000 23,773 3,773Code book sales 700 700 1,681 981Marriage licenses 3,700 3,700 4,215 515Gambling permits 13,000 13,000 28,140 15,140
Total Other Permits 37,400 37,400 57,809 20,409
Total Licenses and Permits 254,400 254,400 304,571 50,171
Intergovernmental RevenueFederal Grants Federal Emergency Management 82,407 82,407 57,967 (24,440) F.E.M.A. reimbursement - 1,000,257 1,000,257 - Build America Bond Subsidy 110,437 110,437 110,437 - Federal Detention per diem 20,479 20,479 20,625 146
Total Federal Grants 213,323 1,213,580 1,189,286 (24,294)
State Grants Police Protection - state 450,000 450,000 470,600 20,600 Library - state 384,000 384,000 383,502 (498) Soil Conservation - state 61,191 61,191 61,191 - Prisoner Housing - state 90,000 90,000 145,260 55,260 Mosquito Control - state 20,000 20,000 24,740 4,740 Jury reimbursement - state 30,000 30,000 28,920 (1,080) Core Service reimbursement - state - 126,998 127,342 344 State reimbursement - - 30,379 30,379 Other state reimbursement - 8,989 7,867 (1,122)
Total State Grants 1,035,191 1,171,178 1,279,801 108,623
COUNTY COMMISSIONERS OF CALVERT COUNTY, MARYLAND
SCHEDULE OF REVENUE AND OTHER FINANCING SOURCES -BUDGET AND ACTUAL (BUDGETARY BASIS) - GENERAL FUND
FOR THE YEAR ENDED JUNE 30, 2012

-71-
VarianceBudgeted Amounts Over
Original Final Actual (Under)
COUNTY COMMISSIONERS OF CALVERT COUNTY, MARYLAND
SCHEDULE OF REVENUE AND OTHER FINANCING SOURCES -BUDGET AND ACTUAL (BUDGETARY BASIS) - GENERAL FUND
FOR THE YEAR ENDED JUNE 30, 2012
Other Intergovernmental 911 Grant 610,000$ 610,000$ 582,877$ (27,123)$ Shore Erosion 26,258 26,258 26,258 - Housing Authority 1,113,589 1,127,314 1,121,755 (5,559) Caasa payroll reimbursement - 15,000 8,644 (6,356) CMM payroll reimbursement - CMM Board of Governors 370,000 375,652 332,203 (43,449) CMM payroll reimbursement - CMM Society 290,000 294,844 283,245 (11,599)
Total Other Intergovernmental 2,409,847 2,449,068 2,354,982 (94,086)
Total Intergovernmental Revenues 3,658,361 4,833,826 4,824,069 (9,757)
Charges for servicesPublic Safety
Sheriff's fees 75,000 75,000 80,459 5,459Chesapeake Beach police reimbursement 698,934 698,934 698,934 -North Beach police reimbursement 320,193 320,193 320,193 -Dominion police reimbursement 1,240,000 1,257,926 1,229,375 (28,551)Lab fees 15,000 15,000 11,091 (3,909)Engineering inspections 100,000 100,000 81,500 (18,500)DWI facility - 7,345 2,470 (4,875)Electronic monitor - Detention Center 25,000 25,000 12,687 (12,313)Telephone commission - Detention Center 275,000 275,000 104,832 (170,168)Room and board - Detention Center 60,000 60,000 38,682 (21,318)Sick call - Detention Center 8,000 8,000 2,470 (5,530)False alarm fees 2,000 2,000 150 (1,850)False alarm registration 3,800 3,800 5,150 1,350Protective inspections 250,000 250,000 287,500 37,500Public safety tower 70,000 70,000 78,133 8,133
Total Public Safety 3,142,927 3,168,198 2,953,626 (214,572)
General ServicesWaterman's Wharf 4,200 4,200 3,875 (325)Tennison charters 50,000 50,000 42,068 (7,932)Flag Pond entrance fees 40,000 40,000 47,654 7,654Boat ramp fees 6,000 6,000 7,640 1,640Kings Landing camp fees 10,000 10,000 18,182 8,182P&R self-sustained program 15,000 15,000 - (15,000)
Total General Services 125,200 125,200 119,419 (5,781)
Public WorksRoad tax districts 70,616 70,616 75,344 4,728Developer street signs 600 600 - (600)Utility permit fee - - 12,960 12,960Waterway improvements 7,440 7,440 7,441 1
Total Public Works 78,656 78,656 95,745 17,089
Community ResourcesLibrary - other sources - 34,170 34,170 -Library - e-rate 7,000 7,000 5,653 (1,347)Library - other miscellaneous - 19,200 26,974 7,774Library - copying and miscellaneous 46,200 27,000 28,559 1,559Office on Aging - bus trip revenue 32,637 32,637 24,012 (8,625)Office on Aging - ceramics program revenue 3,859 5,265 3,970 (1,295)Office on Aging - senior class revenue 20,626 20,626 19,436 (1,190)
Total Community Resources 110,322 145,898 142,774 (3,124)
Other Charges for ServicesAdministration fees semi-annual service charges 70,000 70,000 47,320 (22,680)Rents and concessions 40,000 40,000 26,602 (13,398)Concrete Plant rent 25,000 25,000 13,005 (11,995)Map sales 500 500 230 (270)
Total Other Charges for Services 135,500 135,500 87,157 (48,343)
Total Charges for Services 3,592,605 3,653,452 3,398,721 (254,731)

-72-
VarianceBudgeted Amounts Over
Original Final Actual (Under)
COUNTY COMMISSIONERS OF CALVERT COUNTY, MARYLAND
SCHEDULE OF REVENUE AND OTHER FINANCING SOURCES -BUDGET AND ACTUAL (BUDGETARY BASIS) - GENERAL FUND
FOR THE YEAR ENDED JUNE 30, 2012
Fines, fees, and ForfeituresGeneral Government
Soil Conservation grading fees 30,000$ 30,000$ 42,350$ 12,350$Replanting fees - Planning & Zoning 4,000 4,000 4,752 752Planning and Zoning tower fees 500 500 1,140 640Board of Appeals application fees 20,000 20,000 15,761 (4,239)Administration planting bond 4,500 4,553 53 (4,500)Small lot clearing fees 100 100 - (100)
Total General Government 59,100 59,153 64,056 4,903
Other Fines, Fees, and ForfeituresDomestic master fees 800 800 779 (21)Community service programs 25,000 25,000 31,261 6,261Criminal court fines 9,000 9,000 6,952 (2,048)Home study fees 2,000 2,000 8,619 6,619Animal citation fines 15,000 15,000 5,100 (9,900)State's attorney fees - 6,667 8,046 1,379Forfeiture - State's attorney 15,000 20,681 20,681 -Forfeiture - sheriff operating - 35,845 35,845 -Administration fee - Grant Coordinator 150,000 150,000 133,745 (16,255)Filing fees Election Office 150 150 125 (25)Auto license fees 2,600 2,600 2,304 (296)Library fines 135,000 135,000 126,985 (8,015)Zoning fees 20,000 20,000 13,250 (6,750)
Total Other Fines, Fees, and Forfeitures 374,550 422,743 393,692 (29,051)
Total Fines, Fees, and Forfeitures 433,650 481,896 457,748 (24,148)
Investment RevenueInterest and dividends 250,000 250,000 136,129 (113,871)Interest on notes - - 7,989 7,989Appreciation of investment - - (8,965) (8,965)
Total Investment Revenue 250,000 250,000 135,153 (114,847)
ReimbursementsSalary reimbursement 35,000 47,872 39,192 (8,680)Battle Creek PR reimbursement 7,418 7,418 9,020 1,602General insurance reimbursement - 147,686 277,331 129,645Heath insurance reimbursement - - 539,561 539,561Circuit ct. clerks office reimbursements - - 4,391 4,391
Total Reimbursements 42,418 202,976 869,495 666,519
Other RevenueBalance from prior year fund balance 50,000 2,102,531 - (2,102,531)Private contributions - 1,859 1,859 -Private contributions econ development - 42,750 42,750 -Miscellaneous income 187,939 210,498 257,670 47,172
Total Other Revenue 237,939 2,357,638 302,279 (2,055,359)
Total Revenue 223,825,953 230,641,585 228,507,315 (2,134,270)
Other financing sourcesTransfer from Board of Education - Resident Trooper 135,834 169,512 169,512 -Transfer from Board of Education - Sheriffs Office - 100,000 100,000 -Transfer from BOE wireless 30,000 30,000 30,000 -Transfer from BOE for OPEB 7,100,000 8,750,215 8,750,215 -Transfer from Excise Tax Fund 1,000,000 1,000,000 - (1,000,000)
Total Other Financing Sources 8,265,834 10,049,727 9,049,727 (1,000,000)
Total Revenue and Other Financing Sources 232,091,787$ 240,691,312$ 237,557,042$ (3,134,270)$

-73-
Variance(Over)
Original Final Actual UnderGeneral Government
County Commissioners
Salaries 249,046$ 254,086$ 252,363$ 1,723$Operating expense 42,334 46,508 47,043 (535)Contracted services 600 7,800 8,283 (483)
Total County Commissioners 291,980 308,394 307,689 705
Clerk to CommissionersSalaries 60,952 62,452 71,326 (8,874)Operating expense 1,676 1,676 172 1,504Contracted services 489 489 - 489
Total Clerk to Commissioners 63,117 64,617 71,498 (6,881)
County AdministratorSalaries 247,888 249,388 247,852 1,536Operating expense 21,808 27,308 23,245 4,063Contracted services 14,407 12,407 11,762 645
Total County Administrator 284,103 289,103 282,859 6,244
Technology ServicesSalaries 1,323,354 1,338,224 1,339,413 (1,189)Operating expense 129,722 132,322 126,952 5,370Contracted services 668,846 666,246 596,115 70,131Capital outlay 321,029 321,029 310,032 10,997
Total Technology Services 2,442,951 2,457,821 2,372,512 85,309
Circuit CourtSalaries 509,888 518,888 541,116 (22,228)Operating expense 81,120 77,120 70,039 7,081Contracted services 85,886 79,168 75,142 4,026Capital outlay 16,650 27,368 11,632 15,736
Total Circuit Court 693,544 702,544 697,929 4,615
Orphans' CourtSalaries 26,450 26,450 26,552 (102)Operating expense 2,020 2,020 350 1,670
Total Orphans' Court 28,470 28,470 26,902 1,568
State's AttorneySalaries 1,366,233 1,381,233 1,400,014 (18,781)Operating expense 94,117 96,466 78,721 17,745Contracted services 15,600 16,912 16,569 343Capital outlay 58,000 66,687 66,685 2
Total State's Attorney 1,533,950 1,561,298 1,561,989 (691)
Grand JurySalary and operating expense 5,000 5,000 5,420 (420).
PersonnelSalaries 498,357 503,232 510,502 (7,270)Operating expense 60,925 61,118 27,768 33,350Tuition program 35,000 35,000 32,220 2,780Contracted services 72,425 96,987 88,229 8,758Capital outlay 3,700 3,945 3,890 55
Total Personnel 670,407 700,282 662,609 37,673
Budgeted Amount
COUNTY COMMISSIONERS OF CALVERT COUNTY, MARYLAND
SCHEDULE OF EXPENDITURES AND OTHER FINANCING USES -BUDGET AND ACTUAL (BUDGETARY BASIS) - GENERAL FUND
FOR THE YEAR ENDED JUNE 30, 2012

-74-
Variance(Over)
Original Final Actual UnderBudgeted Amount
COUNTY COMMISSIONERS OF CALVERT COUNTY, MARYLAND
SCHEDULE OF EXPENDITURES AND OTHER FINANCING USES -BUDGET AND ACTUAL (BUDGETARY BASIS) - GENERAL FUND
FOR THE YEAR ENDED JUNE 30, 2012
ElectionsSalaries 301,999$ 305,749$ 301,812$ 3,937$Operating expense 62,999 62,881 43,628 19,253Contracted services 166,175 166,175 97,404 68,771Election judges 43,700 43,700 37,573 6,127Capital outlay 500 618 618 -
Total Elections 575,373 579,123 481,035 98,088
Finance and BudgetSalaries 1,369,567 1,430,722 1,436,390 (5,668)Operating expense 85,048 71,259 66,359 4,900Contracted services 159,135 158,631 123,245 35,386Capital outlay 7,550 7,550 6,642 908
Total Finance and Budget 1,621,300 1,668,162 1,632,636 35,526
TreasurySalaries 308,457 312,957 316,160 (3,203)Operating expense 45,325 54,120 39,280 14,840Contracted services 17,850 20,783 20,762 21
Total Treasury 371,632 387,860 376,202 11,658
Independent Accounting and Auditing 76,775 77,279 76,079 1,200
County AttorneySalaries 299,961 301,461 296,993 4,468Operating expense 21,339 30,655 28,770 1,885Contracted services 38,000 28,317 10,978 17,339Capital outlay - 367 367 -
Total County Attorney 359,300 360,800 337,108 23,692
Planning and ZoningSalaries 1,053,451 1,042,774 1,037,012 5,762Operating expense 58,911 59,674 57,926 1,748Contracted services 27,849 27,519 27,519 -Capital outlay 17,600 84,495 88,886 (4,391)
Total Planning and Zoning 1,157,811 1,214,462 1,211,343 3,119
General ServicesSalaries 275,616 277,866 286,284 (8,418)Operating expense 9,331 8,654 7,250 1,404Capital outlay - 677 676 1
Total General Services 284,947 287,197 294,210 (7,013)
Buildings and GroundsSalaries 1,309,538 1,335,816 1,360,272 (24,456)Operating expense 826,827 1,145,770 1,031,808 113,962Utilities 1,251,839 1,199,663 968,817 230,846Maintenance and repair projects 628,182 393,388 279,134 114,254Contracted services 514,159 516,777 481,249 35,528Capital outlay 124,000 153,000 102,066 50,934
Total Buildings and Grounds 4,654,545 4,744,414 4,223,346 521,068

-75-
Variance(Over)
Original Final Actual UnderBudgeted Amount
COUNTY COMMISSIONERS OF CALVERT COUNTY, MARYLAND
SCHEDULE OF EXPENDITURES AND OTHER FINANCING USES -BUDGET AND ACTUAL (BUDGETARY BASIS) - GENERAL FUND
FOR THE YEAR ENDED JUNE 30, 2012
Other General GovernmentMaryland Association of Counties 17,000$ 17,000$ 16,987$ 13$Commission for Women 3,895 3,895 2,367 1,528Environmental Commission 3,900 4,400 3,509 891MD State Dept. of Assessments 620,000 630,723 631,203 (480)Non-county agencies 1,137,511 1,090,571 1,068,757 21,814
Total Other General Government 1,782,306 1,746,589 1,722,823 23,766
Total General Government 16,897,511 17,183,415 16,344,189 839,226
Public SafetyPublic Safety
Salaries 146,906 150,847 153,274 (2,427)Operating expense 50,390 52,442 34,981 17,461Contracted services 1,800 2,000 1,309 691
Total Public Safety 199,096 205,289 189,564 15,725
Transportation ChiefSalaries 134,599 145,585 151,485 (5,900)Operating expense 27,235 39,235 32,018 7,217Transportation subsidy 57,000 57,000 36,154 20,846Contracted services 45,000 63,791 64,709 (918)
Total Transportation Chief 263,834 305,611 284,366 21,245
Sheriff's OfficeSalaries 9,472,281 9,652,541 9,936,239 (283,698)Operating expense 810,375 1,395,475 1,370,533 24,942Vehicle supplies and repairs 759,757 302,794 298,732 4,062Contracted services 73,975 101,276 92,389 8,887Capital outlay 266,318 875,660 867,653 8,007
Total Sheriff's Office 11,382,706 12,327,746 12,565,546 (237,800)
Control CenterSalaries 1,845,055 1,868,655 1,618,584 250,071Operating expense 152,034 152,033 136,723 15,310Radio maintenance 259,422 259,422 248,257 11,165Contracted services 313,470 311,470 307,571 3,899Capital outlay 33,833 35,834 34,733 1,101
Total Control Center 2,603,814 2,627,414 2,345,868 281,546
Resident Trooper Program 178,232 211,910 211,910 -
Volunteer Fire Companies & Rescue SquadsOperating expense 2,069,035 2,161,386 2,107,435 53,951Insurance 738,180 729,180 668,535 60,645Capital outlay 149,000 149,000 142,525 6,475
Total Volunteer Fire Companies & Rescue Squads 2,956,215 3,039,566 2,918,495 121,071
Detention CenterSalaries 5,087,980 5,090,072 5,191,410 (101,338)Operating expense 214,194 477,879 428,485 49,394Utilities 446,398 355,188 384,485 (29,297)Inmate care 104,025 143,359 137,139 6,220Food 370,257 370,257 320,552 49,705Contracted services 598,426 594,726 564,400 30,326Capital outlay 42,520 75,890 51,921 23,969
Total Detention Center 6,863,800 7,107,371 7,078,392 28,979

-76-
Variance(Over)
Original Final Actual UnderBudgeted Amount
COUNTY COMMISSIONERS OF CALVERT COUNTY, MARYLAND
SCHEDULE OF EXPENDITURES AND OTHER FINANCING USES -BUDGET AND ACTUAL (BUDGETARY BASIS) - GENERAL FUND
FOR THE YEAR ENDED JUNE 30, 2012
Inspections and PermitsSalaries 717,098$ 731,098$ 740,156$ (9,058)$Operating expense 53,275 53,275 45,382 7,893Vehicle supplies and repair 5,675 5,675 5,851 (176)Contracted services 27,500 27,500 27,500 -Capital outlay 9,500 9,500 5,850 3,650
Total Inspections and Permits 813,048 827,048 824,739 2,309
Residential Substance Abuse TreatmentContracted services 162,450 162,450 155,434 7,016
Total Residential Substance Abuse Treatment 162,450 162,450 155,434 7,016
Emergency ManagementSalaries 155,665 162,649 150,178 12,471Operating expense 34,543 47,142 37,477 9,665Contracted services 25,956 25,956 23,300 2,656
Total Emergency Management 216,164 235,747 210,955 24,792
Liquor BoardSalaries 24,720 24,720 22,775 1,945Operating expense 700 700 184 516Contracted services 25,000 25,000 18,388 6,612
Total Liquor Board 50,420 50,420 41,347 9,073
Fire, Rescue, and Emergency ServicesSalaries 234,538 238,523 247,360 (8,837)Operating expense 176,525 184,196 143,151 41,045Contracted services 65,830 57,330 52,053 5,277Capital outlay - 829 830 (1)
Total Fire, Rescue, and Emergency Services 476,893 480,878 443,394 37,484
Animal ControlSalaries 324,850 332,771 327,621 5,150Operating expense 33,865 71,882 59,306 12,576Vehicle supplies and repairs 53,000 13,000 9,515 3,485Contracted services 230,750 230,750 174,887 55,863Capital outlay 17,000 73,983 62,328 11,655
Total Animal Control 659,465 722,386 633,657 88,729
Total Public Safety 26,826,137 28,303,836 27,903,667 400,169
Public WorksEngineering Services
Salaries 1,134,484 1,112,795 1,012,947 99,848Operating expense 74,223 106,460 101,073 5,387Contracted services 52,497 72,737 72,488 249Capital outlay - 734 600 134
Total Engineering Services 1,261,204 1,292,726 1,187,108 105,618
Highway LightingOperating expense 261,250 261,250 256,676 4,574
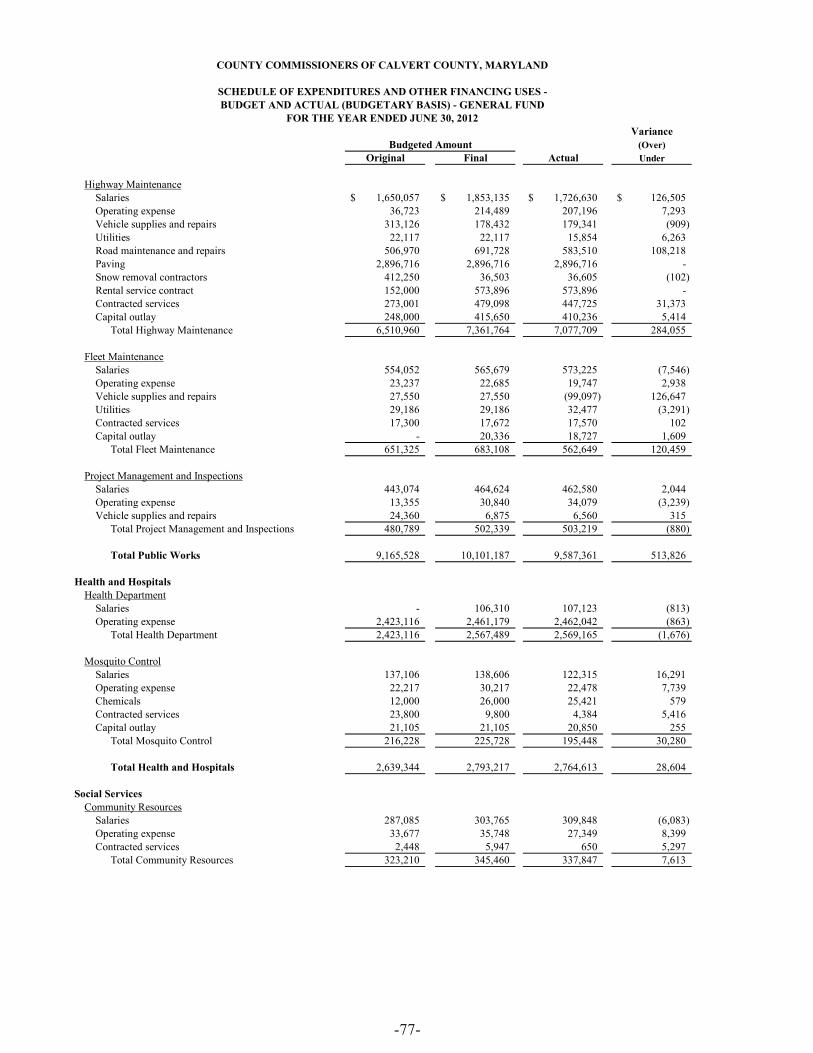
-77-
Variance(Over)
Original Final Actual UnderBudgeted Amount
COUNTY COMMISSIONERS OF CALVERT COUNTY, MARYLAND
SCHEDULE OF EXPENDITURES AND OTHER FINANCING USES -BUDGET AND ACTUAL (BUDGETARY BASIS) - GENERAL FUND
FOR THE YEAR ENDED JUNE 30, 2012
Highway MaintenanceSalaries 1,650,057$ 1,853,135$ 1,726,630$ 126,505$Operating expense 36,723 214,489 207,196 7,293Vehicle supplies and repairs 313,126 178,432 179,341 (909)Utilities 22,117 22,117 15,854 6,263Road maintenance and repairs 506,970 691,728 583,510 108,218Paving 2,896,716 2,896,716 2,896,716 -Snow removal contractors 412,250 36,503 36,605 (102)Rental service contract 152,000 573,896 573,896 -Contracted services 273,001 479,098 447,725 31,373Capital outlay 248,000 415,650 410,236 5,414
Total Highway Maintenance 6,510,960 7,361,764 7,077,709 284,055
Fleet MaintenanceSalaries 554,052 565,679 573,225 (7,546)Operating expense 23,237 22,685 19,747 2,938Vehicle supplies and repairs 27,550 27,550 (99,097) 126,647Utilities 29,186 29,186 32,477 (3,291)Contracted services 17,300 17,672 17,570 102Capital outlay - 20,336 18,727 1,609
Total Fleet Maintenance 651,325 683,108 562,649 120,459
Project Management and InspectionsSalaries 443,074 464,624 462,580 2,044Operating expense 13,355 30,840 34,079 (3,239)Vehicle supplies and repairs 24,360 6,875 6,560 315
Total Project Management and Inspections 480,789 502,339 503,219 (880)
Total Public Works 9,165,528 10,101,187 9,587,361 513,826
Health and HospitalsHealth Department
Salaries - 106,310 107,123 (813)Operating expense 2,423,116 2,461,179 2,462,042 (863)
Total Health Department 2,423,116 2,567,489 2,569,165 (1,676)
Mosquito ControlSalaries 137,106 138,606 122,315 16,291Operating expense 22,217 30,217 22,478 7,739Chemicals 12,000 26,000 25,421 579Contracted services 23,800 9,800 4,384 5,416Capital outlay 21,105 21,105 20,850 255
Total Mosquito Control 216,228 225,728 195,448 30,280
Total Health and Hospitals 2,639,344 2,793,217 2,764,613 28,604
Social ServicesCommunity Resources
Salaries 287,085 303,765 309,848 (6,083)Operating expense 33,677 35,748 27,349 8,399Contracted services 2,448 5,947 650 5,297
Total Community Resources 323,210 345,460 337,847 7,613

-78-
Variance(Over)
Original Final Actual UnderBudgeted Amount
COUNTY COMMISSIONERS OF CALVERT COUNTY, MARYLAND
SCHEDULE OF EXPENDITURES AND OTHER FINANCING USES -BUDGET AND ACTUAL (BUDGETARY BASIS) - GENERAL FUND
FOR THE YEAR ENDED JUNE 30, 2012
Department of Social ServicesCounty contribution 64,982$ 64,982$ 64,982$ -$
Pauper's Burial 1,000 1,000 - 1,000
Office on AgingSalaries 1,143,918 1,165,199 1,135,255 29,944Operating expense 97,059 101,495 82,378 19,117Contracted services 20,626 20,726 19,506 1,220Capital outlay - 7,882 7,882 -
Total Office on Aging 1,261,603 1,295,302 1,245,021 50,281
Total Social Services 1,650,795 1,706,744 1,647,850 58,894
EducationCollege of Southern Maryland 3,426,964 3,401,964 3,401,964 -Board of Education 109,059,947 109,059,947 109,059,947 -
Total Education 112,486,911 112,461,911 112,461,911 -
Recreation and CultureParks and Recreation
Salaries 2,647,570 2,690,317 2,550,510 139,807Operating expense 448,097 448,274 382,120 66,154Utilities 160,338 160,338 154,980 5,358Maintenance and repair projects 85,000 84,800 76,831 7,969Contracted services 75,000 60,279 44,998 15,281Capital outlay 97,000 128,920 128,173 747
Total Parks and Recreation 3,513,005 3,572,928 3,337,612 235,316
Railway MuseumSalaries 97,807 99,307 101,379 (2,072)Operating expense 10,195 10,980 10,989 (9)Utilities 6,412 4,112 3,341 771Contracted services 26,046 29,561 29,461 100Capital outlay 2,000 - - -
Total Railway Museum 142,460 143,960 145,170 (1,210)
Marine MuseumSalaries 1,992,083 2,022,050 2,068,237 (46,187)Operating expense 185,575 221,814 209,313 12,501Utilities 190,785 187,035 164,024 23,011Maintenance and repair projects 23,866 23,366 22,949 417Contracted services 61,202 66,560 64,522 2,038Capital outlay 31,347 48,536 48,114 422
Total Marine Museum 2,484,858 2,569,361 2,577,159 (7,798)
Public LibrariesSalaries - 2,394,225 2,381,466 12,759Operating expense 3,641,857 1,198,031 1,180,167 17,864Contracted services - 80,281 80,281 -Capital outlay - 36,490 36,490 -
Total Public Libraries 3,641,857 3,709,027 3,678,404 30,623

-79-
Variance(Over)
Original Final Actual UnderBudgeted Amount
COUNTY COMMISSIONERS OF CALVERT COUNTY, MARYLAND
SCHEDULE OF EXPENDITURES AND OTHER FINANCING USES -BUDGET AND ACTUAL (BUDGETARY BASIS) - GENERAL FUND
FOR THE YEAR ENDED JUNE 30, 2012
Natural Resources DivisionSalaries 653,381$ 665,330$ 723,897$ (58,567)$Operating expense 66,734 73,995 62,680 11,315Utilities 39,972 33,411 29,600 3,811Maintenance and repair projects 6,700 7,700 5,448 2,252Contracted services 9,249 32,549 29,800 2,749Capital outlay - 20,000 18,212 1,788
Total Natural Resources Division 776,036 832,985 869,637 (36,652)
Total Recreation and Culture 10,558,216 10,828,261 10,607,982 220,279
Conservation of Natural ResourcesAgricultural Extension Service
Operating expense 86,189 86,189 81,941 4,248Total Agricultural Extension Service 86,189 86,189 81,941 4,248
Soil Conservation ServiceSalaries 290,108 293,108 299,439 (6,331)Operating expense 3,486 3,486 3,502 (16)
Total Soil Conservation Service 293,594 296,594 302,941 (6,347)
ForestryOperating expense 20,978 20,978 20,978 -
Total Conservation of Natural Resources 400,761 403,761 405,860 (2,099)
Urban Development and HousingHousing
Salaries 857,278 871,003 869,794 1,209Total Housing 857,278 871,003 869,794 1,209
Historical District CommissionSalaries 4,623 4,623 4,641 (18)Operating expense 3,888 3,888 1,421 2,467Contracted services 6,313 8,198 8,194 4
Total Historical District Commission 14,824 16,709 14,256 2,453
Board of AppealsSalaries 122,413 123,913 124,384 (471)Operating expense 13,200 37,170 25,355 11,815Contracted services 24,000 24,000 20,858 3,142Honorarium 25,000 1,030 696 334
Total Board of Appeals 184,613 186,113 171,293 14,820
Planning CommissionSalaries 661,635 636,885 655,045 (18,160)Operating expense 21,000 22,653 15,786 6,867Contracted services 56,150 37,550 29,479 8,071Honorarium 72,000 72,000 63,400 8,600
Total Planning Commission 810,785 769,088 763,710 5,378
Affordable HousingOperating expense 50,000 50,000 9,308 40,692
Total Affordable Housing 50,000 50,000 9,308 40,692
Total Urban Development and Housing 1,917,500 1,892,913 1,828,361 64,552

-80-
Variance(Over)
Original Final Actual UnderBudgeted Amount
COUNTY COMMISSIONERS OF CALVERT COUNTY, MARYLAND
SCHEDULE OF EXPENDITURES AND OTHER FINANCING USES -BUDGET AND ACTUAL (BUDGETARY BASIS) - GENERAL FUND
FOR THE YEAR ENDED JUNE 30, 2012
Economic DevelopmentEDA/EDC/Tourism
Salaries 731,892$ 741,902$ 694,698$ 47,204$Operating expense 113,690 172,533 149,062 23,471Advertising 252,325 219,305 171,906 47,399Chamber of Commerce 103,979 103,979 100,462 3,517Small Business Development Center 20,400 20,400 20,400 -Contracted services 30,600 103,267 101,528 1,739Capital outlay 3,160 911 911 -
Total Economic Development 1,256,046 1,362,297 1,238,967 123,330
Pension and InsurancePension contribution 9,785,655 9,835,132 9,748,837 86,295Workmen's' compensation 1,506,151 1,508,599 804,344 704,255General insurance 722,999 708,000 572,532 135,468Health insurance 7,141,923 6,631,992 7,446,326 (814,334)Other post employment benefits (OPEB) 200,000 2,200,000 2,200,000 -Other post employment benefits - BOE 7,100,000 8,750,215 8,750,215 -Contingency 600,000 189,377 - 189,377
Total Pension and Insurance 27,056,728 29,823,315 29,522,254 301,061
Debt serviceBond principal retirement
General obligations 11,570,859 10,971,706 10,971,736 (30)
Bond interestGeneral obligations 5,178,342 4,929,445 4,929,445 -
Bond expenseDebt refunding expense - 127,802 179,509 (51,707)
Total Debt Service 16,749,201 16,028,953 16,080,690 (51,737)
Total expenditures 227,604,678 232,889,810 230,393,705 2,496,105
Other financing usesOperating transfers out
Capital Projects Fund 1,277,000 4,398,600 4,398,600 -Transfer to Grants Fund 1,740,526 1,798,440 1,661,210 137,230Transfer to P&R Self-Sustaining 402,083 402,539 402,539 -Transfer to Land Preservation 857,000 857,000 857,000 -Transfer to Chesapeake Hills Golf Course 180,500 182,021 182,021 -Transfer to Water and Sewer - 47,726 47,726 -Transfer to Solid Waste 30,000 115,176 115,176 -
Total other financing uses 4,487,109 7,801,502 7,664,272 137,230
Total expenditures and other financing uses 232,091,787$ 240,691,312$ 238,057,977$ 2,633,335$

COUNTY COMMISSIONERS OF CALVERT COUNTYCALVERT COUNTY, MARYLAND
NONMAJOR FUNDS & OTHER SCHEDULESJUNE 30, 2012

-81-
Planning Economicand Zoning Development
Parks and Special AuthorityRecreation Revenue Bar Library Revolving Loan Revolving
Fund Fund Fund Fund Loan Fund
ASSETSCash, cash equivalents and investments 37,819$ -$ -$ -$ -$Taxes receivable - - - - -Accounts receivable 8,995 25,000 - - 94,208Accrued interest receivable - - - - -Due from other funds 1,723,502 491,674 42,277 12,100 228,628Inventory 16,188 - - - -Total assets 1,786,504$ 516,674$ 42,277$ 12,100$ 322,836$
LIABILITIESVouchers and accounts payable 217,955 470,555 10,015 - -Notes payable 107,400 - - - -Due to other funds - - - - -Due to component units - - - - -Deferred revenue 160,780 - - - -
Total liabilities 486,135 470,555 10,015 - -
FUND BALANCESNonspendable - - - - -Restricted 3,750 - - -Committed 1,296,619 46,119 32,262 12,100 322,836Assigned - - - - -Unassigned - - - - -
Total fund balances 1,300,369 46,119 32,262 12,100 322,836
Total liabilities and fund balances 1,786,504$ 516,674$ 42,277$ 12,100$ 322,836$
COUNTY COMMISSIONERS OF CALVERT COUNTY, MARYLAND
COMBINING BALANCE SHEETNONMAJOR GOVERNMENTAL FUNDS
JUNE 30, 2012

-82-
Board ofEconomic Library
Calvert Co. Development Land Trustee forFamily Grants Incentive Excise Tax Preservation Calvert
Network Fund Fund Fund Fund County Total
-$ -$ -$ -$ 10,474,685$ 14,884$ 10,527,388$- - - 877,578 - - 877,578
163,202 1,115,468 138,799 - 27 - 1,545,699- - - - - - -- 31,478 169,425 6,065,591 - - 8,764,675- - - - - - 16,188
163,202$ 1,146,946$ 308,224$ 6,943,169$ 10,474,712$ 14,884$ 21,731,528$
61,658 614,242 - - - - 1,374,425- - - - - - 107,400
34,459 - - - 1,323,751 - 1,358,21042,566 - - - - - 42,56624,519 402,779 - 870,301 - - 1,458,379
163,202 1,017,021 - 870,301 1,323,751 - 4,340,980
- - - - 7,170,057 - 7,170,057- 129,925 - - 1,980,904 - 2,114,579- - 308,224 6,072,868 - - 8,091,028- - - - - 14,884 14,884- - - - - - -- 129,925 308,224 6,072,868 9,150,961 14,884 17,390,548
163,202$ 1,146,946$ 308,224$ 6,943,169$ 10,474,712$ 14,884$ 21,731,528$
JUNE 30, 2012
COUNTY COMMISSIONERS OF CALVERT COUNTY, MARYLAND
COMBINING BALANCE SHEETNONMAJOR GOVERNMENTAL FUNDS

-83-
Planning Economicand Zoning Development
Parks and Special AuthorityRecreation Revenue Bar Library Revolving Loan Revolving
Fund Fund Fund Fund Loan FundREVENUE
Taxes -$ -$ -$ -$ -$ Intergovernmental 3,521 - - - - Fines and forfeitures - 1,540 18,518 - - Miscellaneous 2,751,623 108,468 27,878 - 4,514
Total revenue 2,755,144 110,008 46,396 - 4,514
EXPENDITURESSalaries and fringe benefits 1,356,771 86,759 45,181 - - Education and miscellaneous 1,393,458 79,878 43,377 - -
Total expenditures 2,750,229 166,637 88,558 - -
Excess (deficiency) of revenue over (under) expenditures 4,915 (56,629) (42,162) - 4,514
OTHER FINANCING SOURCES (USES)Operating transfer in 402,539 - - - - Operating transfer out - - - - -
Total other financing sources (uses) 402,539 - - - -
Net change in fund balance 407,454 (56,629) (42,162) - 4,514
Fund balance - beginning of year 892,915 102,748 74,424 12,100 318,322
Fund balance - end of year 1,300,369$ 46,119$ 32,262$ 12,100$ 322,836$
COUNTY COMMISSIONERS OF CALVERT COUNTY, MARYLAND
COMBINING SCHEDULE OF REVENUE, EXPENDITURES AND CHANGES IN FUND BALANCENONMAJOR GOVERNMENTAL FUNDS
YEAR ENDED JUNE 30, 2012

-84-
Planning Economicand Zoning Development
Parks and Special AuthorityRecreation Revenue Bar Library Revolving Loan Revolving
Fund Fund Fund Fund Loan FundREVENUE
Taxes -$ -$ -$ -$ -$ Intergovernmental 3,521 - - - - Fines and forfeitures - 1,540 18,518 - - Miscellaneous 2,751,623 108,468 27,878 - 4,514
Total revenue 2,755,144 110,008 46,396 - 4,514
EXPENDITURESSalaries and fringe benefits 1,356,771 86,759 45,181 - - Education and miscellaneous 1,393,458 79,878 43,377 - -
Total expenditures 2,750,229 166,637 88,558 - -
Excess (deficiency) of revenue over (under) expenditures 4,915 (56,629) (42,162) - 4,514
OTHER FINANCING SOURCES (USES)Operating transfer in 402,539 - - - - Operating transfer out - - - - -
Total other financing sources (uses) 402,539 - - - -
Net change in fund balance 407,454 (56,629) (42,162) - 4,514
Fund balance - beginning of year 892,915 102,748 74,424 12,100 318,322
Fund balance - end of year 1,300,369$ 46,119$ 32,262$ 12,100$ 322,836$
COUNTY COMMISSIONERS OF CALVERT COUNTY, MARYLAND
COMBINING SCHEDULE OF REVENUE, EXPENDITURES AND CHANGES IN FUND BALANCENONMAJOR GOVERNMENTAL FUNDS
YEAR ENDED JUNE 30, 2012
Board ofEconomic Library
Calvert Co. Development Land Trustee forFamily Grants Incentive Excise Tax Preservation Calvert
Network Fund Fund Fund Fund County Total
-$ -$ -$ 2,608,709$ -$ -$ 2,608,709$ - 3,911,850 - - 170,414 703,904 4,789,689 - - - - - 126,985 147,043
518,445 576,098 1,585 32,940 960,922 126,443 5,108,916
518,445 4,487,948 1,585 2,641,649 1,131,336 957,332 12,654,357
90,676 2,528,547 - - - 3,418,260 7,526,194 427,769 3,657,034 - 81,684 3,192,135 607,387 9,482,722
518,445 6,185,581 - 81,684 3,192,135 4,025,647 17,008,916
- (1,697,633) 1,585 2,559,965 (2,060,799) (3,068,315) (4,354,559)
- 1,661,210 - 188,533 857,000 3,072,683 6,181,965 - - - (1,574,355) - - (1,574,355)
- 1,661,210 - (1,385,822) 857,000 3,072,683 4,607,610
- (36,423) 1,585 1,174,143 (1,203,799) 4,368 253,051
- 166,348 306,639 4,898,725 10,354,760 10,516 17,137,497
-$ 129,925$ 308,224$ 6,072,868$ 9,150,961$ 14,884$ 17,390,548$
YEAR ENDED JUNE 30, 2012
COUNTY COMMISSIONERS OF CALVERT COUNTY, MARYLAND
COMBINING SCHEDULE OF REVENUE, EXPENDITURES AND CHANGES IN FUND BALANCENONMAJOR GOVERNMENTAL FUNDS

-85-
COUNTY COMMISSIONERS OF CALVERT COUNTY, MARYLAND
COMBINING STATEMENT OF NET POSITIONNONMAJOR PROPRIETARY FUNDS
JUNE 30, 2012
Chesapeake CalvertHills Golf Marine
Course Museum TotalASSETSCurrent assets:Cash and cash equivalents 37,520$ 150,412$ 187,932$ Investments - 98,892 98,892
Total cash, cash equivalents and investments 37,520 249,304 286,824
Accrued interest receivable 3 - 3 Deferred expenses 12,144 - 12,144 Prepaid expenses - 542 542 Inventory 17,890 33,635 51,525
Total current assets 67,557 283,481 351,038
Non-current assets:Restricted assets
Cash and investments 657,369 554,619 1,211,988
Capital assets not being depreciated 1,552,330 845,471 2,397,801 Depreciable capital assets - net 2,199,613 1,816,873 4,016,486 Total non-current assets 4,409,312 3,216,963 7,626,275
Total assets 4,476,869 3,500,444 7,977,313
LIABILITIESCurrent liabilities:Vouchers and accounts payable 20,329 - 20,329 Accrued expenses 24,915 37,599 62,514 Due to other funds 43,539 - 43,539 Unearned revenue - 9,235 9,235 Compensated absences, current portion 5,000 - 5,000 Long-term debt, current portion 34,063 - 34,063 Total current liabilities 127,846 46,834 174,680
Noncurrent liabilities:Compensated Absenses, net of current portion 21,061 - 21,061 Bond premium/deferred loss on refunding 139,522 - 139,522 Long-term debt, net of current portion 482,217 - 482,217
Total liabilities 770,646 46,834 817,480
NET POSITIONInvested in capital assets, net of related debt 3,235,663 2,662,344 5,898,007 Restricted capital connection - - - Restricted gifts and bequests 657,369 554,619 1,211,988 Unrestricted (186,809) 236,647 49,838
Total net position 3,706,223$ 3,453,610$ 7,159,833$

-86-
COUNTY COMMISSIONERS OF CALVERT COUNTY, MARYLAND
COMBINING STATEMENT OF REVENUE, EXPENSES, AND CHANGES IN FUND NET POSITIONNONMAJOR PROPRIETARY FUNDS
YEAR ENDED JUNE 30, 2012
Chesapeake CalvertHills Golf Marine
Course Museum TotalOperating revenue:
Charges for services 643,352$ 151,744$ 795,096$
Operating expenses:Salaries & benefits 491,705 2,417,878 2,909,583 Contracted services 10,715 161,489 172,204 Supplies 12,005 150,154 162,159 Heat, light and power 30,920 164,024 194,944 Depreciation 175,814 350,447 526,261 Miscellaneous 203,213 151,091 354,304 Telephone 3,594 7,805 11,399 Compensated absences 11,823 - 11,823 Maintenance and repairs 111,021 62,476 173,497 Capital outlay - 48,114 48,114 Grant & restricted expenses - 70,466 70,466
Total operating expenses 1,050,810 3,583,944 4,634,754
Operating income (loss) (407,458) (3,432,200) (3,839,658)
Non-operating revenue (expenses):
Grants 2,125 63,060 65,185 Contributions and fund-raising - 258,744 258,744 Miscellaneous income 81 116,438 116,519 Investment income 1,568 6,963 8,531
Total non-operating revenue (expenses) 3,774 445,205 448,979
Income (loss) before contributions and transfers - (403,684) (2,986,995) (3,390,679)
Operating transfers in (out) 182,021 2,604,330 2,786,351 Capital contributions - 65,374 65,374
Change in net position (221,663) (317,291) (538,954)
Total net position - beginning 3,927,886 3,770,901 7,698,787
Total net position - ending 3,706,223$ 3,453,610$ 7,159,833$

-87-
COUNTY COMMISSIONERS OF CALVERT COUNTY, MARYLAND
COMBINING STATEMENT OF CASH FLOWS NONMAJOR PROPRIETARY FUNDS
FOR THE YEAR ENDED JUNE 30, 2012
Chesapeake CalvertHills Marine
Golf Course Museum TotalCASH FLOWS FROM OPERATING ACTIVITIES
Receipts from customers 643,352$ 145,939$ 789,291$ Payments to suppliers (409,104) (773,587) (1,182,691) Payments to employees (477,011) (2,417,878) (2,894,889) Receipts from other funds 492,534 - 492,534
Net cash provided by (used in) operating activities 249,771 (3,045,526) (2,795,755)
CASH FLOWS FROM NON-CAPITAL FINANCING ACTIVITIESOperating transfers from other funds 182,021 2,604,330 2,786,351 Contribution and fundraising receipts/misc. 2,206 375,182 377,388
Net cash provided by (used in) non-capital financing activities 184,227 2,979,512 3,163,739
CASH FLOWS FROM CAPITAL AND RELATED FINANCING ACTIVITIESAdditions to capital assets and construction-in-progress (449,610) (303,665) (753,275) Proceeds from issuance of long term debt 655,802 - 655,802 Grant funds received - 63,060 63,060 Capital contributions - 65,374 65,374 Interest paid on long-term obligations (6,566) - (6,566)
Net cash provided by (used in) capital and related financing activities 199,626 (175,231) 24,395
CASH FLOWS FROM INVESTING ACTIVITIESInterest received on deposits 3,886 6,963 10,849 Purchase of investments (657,369) 211,572 (445,797)
Net cash provided by (used in) investing activities (653,483) 218,535 (434,948)
Increase in cash and cash equivalents (19,859) (22,710) (42,569) Cash and cash equivalents, beginning of year 57,379 173,122 230,501
Cash and cash equivalents, end of year 37,520$ 150,412$ 187,932$
PROVIDED BY (USED IN) OPERATING ACTIVITIESOperating income (loss) (407,458)$ (3,432,200)$ (3,839,658)$ Adjustments to reconcile operating income (loss) to
Net cash provided by (used in) operating activitiesDepreciation 175,814 350,447 526,261
Changes in assets and liabilitiesInventory (1,099) 2,316 1,217 Prepaid expenses - 2,117 2,117 Deferred expenditures - (5,805) (5,805) Due from other funds 492,534 - 492,534 Accounts payable (20,701) - (20,701) Accrued expenses 10,681 37,599 48,280 Due to other funds - - -
Net cash provided by (used in) operating activities 249,771$ (3,045,526)$ (2,795,755)$
Reconciliation of cash and cash equivalents to the balance sheet:Cash and investments, unrestricted 37,520$ 249,304$ 286,824$ Cash and investments, restricted 657,369 554,619 1,211,988
694,889 803,923 1,498,812 Less - noncash equivalent investments 657,369 653,511 1,310,880
Cash and cash equivalents 37,520$ 150,412$ 187,932$
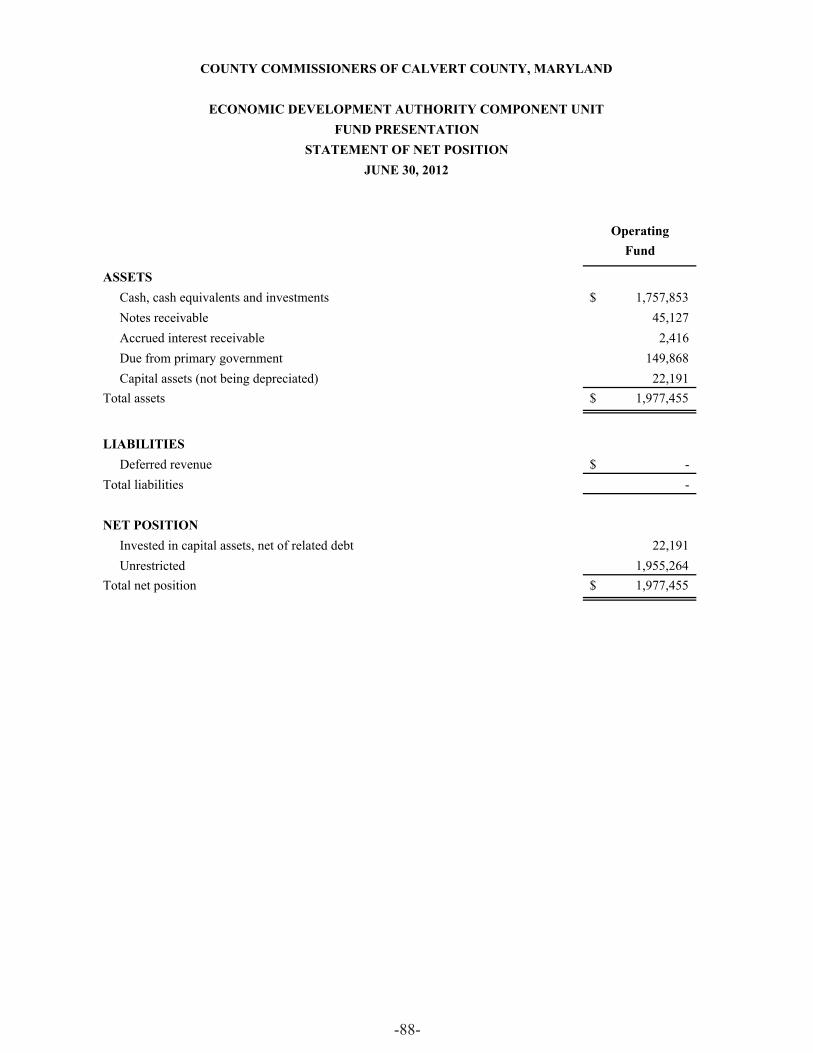
-88-
OperatingFund
ASSETSCash, cash equivalents and investments 1,757,853$ Notes receivable 45,127 Accrued interest receivable 2,416 Due from primary government 149,868 Capital assets (not being depreciated) 22,191
Total assets 1,977,455$
LIABILITIESDeferred revenue -$
Total liabilities -
NET POSITIONInvested in capital assets, net of related debt 22,191 Unrestricted 1,955,264
Total net position 1,977,455$
COUNTY COMMISSIONERS OF CALVERT COUNTY, MARYLAND
ECONOMIC DEVELOPMENT AUTHORITY COMPONENT UNITFUND PRESENTATION
STATEMENT OF NET POSITIONJUNE 30, 2012

-89-
OperatingFund
Operating revenue:Charges for services 4,532$ Miscellaneous income 47
Total operating revenue 4,579
Operating expenses:Contracted services 3,371 Miscellaneous -
Total operating expenses 3,371
Operating income (loss) 1,208
Non-operating revenue (expenses):Investment income 11,482 Investment expense (1,918)
Total non-operating revenue (expenses) 9,564
Change in net position 10,772
Total net position - beginning 1,966,683
Total net position - ending 1,977,455$
COUNTY COMMISSIONERS OF CALVERT COUNTY, MARYLAND
STATEMENT OF REVENUE, EXPENSES, AND CHANGES IN FUND NET POSITION
ECONOMIC DEVELOPMENT AUTHORITY COMPONENT UNIT
YEAR ENDED JUNE 30, 2012
FUND PRESENTATION

-90-
OperatingFund
CASH FLOWS FROM OPERATING ACTIVITIESNote receipts from customers 16,470$ Interest receipts from customers 4,579 Payments from (to) primary government (16,683) Payments to suppliers (3,371)
Net cash provided by (used in) operating activities 995
CASH FLOWS FROM INVESTING ACTIVITIESInterest received on investments 10,152 Investment expenses (1,918)
Net cash provided by (used in) investing activities 8,234
Increase in cash and cash equivalents 9,229
Cash and cash equivalents, beginning of year 1,748,624 Cash and cash equivalents, end of year 1,757,853$
PROVIDED BY (USED IN) OPERATING ACTIVITIESOperating income (loss) 1,208$ Adjustments to reconcile operating income (loss) to
Net cash provided by (used in) operating activitiesChanges in assets and liabilities
Notes receivable 16,470 Due from primary government (16,683)
Net cash provided by (used in) operating activities 995$
Reconciliation of cash and cash equivalents to the balance sheet:Cash and investments, unrestricted -$ Cash and investments, restricted 1,757,853
1,757,853 Less - noncash equivalent investments - Cash and cash equivalents 1,757,853$
COUNTY COMMISSIONERS OF CALVERT COUNTY, MARYLAND
ECONOMIC DEVELOPMENT AUTHORITY COMPONENT UNITFUND PRESENTATION
STATEMENT OF CASH FLOWS FOR THE YEAR ENDED JUNE 30, 2012
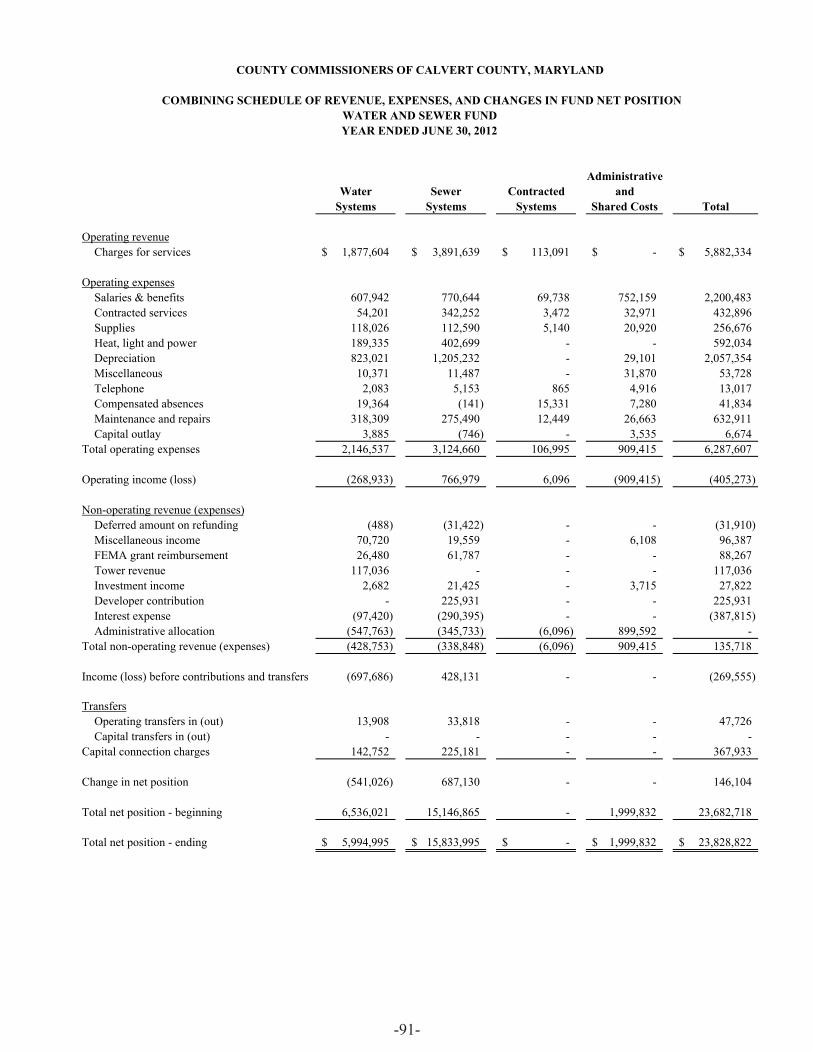
-91-
AdministrativeWater Sewer Contracted and
Systems Systems Systems Shared Costs Total
Operating revenueCharges for services 1,877,604$ 3,891,639$ 113,091$ -$ 5,882,334$
Operating expensesSalaries & benefits 607,942 770,644 69,738 752,159 2,200,483 Contracted services 54,201 342,252 3,472 32,971 432,896 Supplies 118,026 112,590 5,140 20,920 256,676 Heat, light and power 189,335 402,699 - - 592,034 Depreciation 823,021 1,205,232 - 29,101 2,057,354 Miscellaneous 10,371 11,487 - 31,870 53,728 Telephone 2,083 5,153 865 4,916 13,017 Compensated absences 19,364 (141) 15,331 7,280 41,834 Maintenance and repairs 318,309 275,490 12,449 26,663 632,911 Capital outlay 3,885 (746) - 3,535 6,674
Total operating expenses 2,146,537 3,124,660 106,995 909,415 6,287,607
Operating income (loss) (268,933) 766,979 6,096 (909,415) (405,273)
Non-operating revenue (expenses)Deferred amount on refunding (488) (31,422) - - (31,910) Miscellaneous income 70,720 19,559 - 6,108 96,387 FEMA grant reimbursement 26,480 61,787 - - 88,267 Tower revenue 117,036 - - - 117,036 Investment income 2,682 21,425 - 3,715 27,822 Developer contribution - 225,931 - - 225,931 Interest expense (97,420) (290,395) - - (387,815) Administrative allocation (547,763) (345,733) (6,096) 899,592 -
Total non-operating revenue (expenses) (428,753) (338,848) (6,096) 909,415 135,718
(697,686) 428,131 - - (269,555)
TransfersOperating transfers in (out) 13,908 33,818 - - 47,726 Capital transfers in (out) - - - - -
Capital connection charges 142,752 225,181 - - 367,933
Change in net position (541,026) 687,130 - - 146,104
Total net position - beginning 6,536,021 15,146,865 - 1,999,832 23,682,718
Total net position - ending 5,994,995$ 15,833,995$ -$ 1,999,832$ 23,828,822$
COUNTY COMMISSIONERS OF CALVERT COUNTY, MARYLAND
Income (loss) before contributions and transfers
COMBINING SCHEDULE OF REVENUE, EXPENSES, AND CHANGES IN FUND NET POSITIONWATER AND SEWER FUNDYEAR ENDED JUNE 30, 2012

-92-
Balance Balance
July 1, 2011 Additions Deductions June 30, 2012
Tax Redemption Fund
AssetsCash 89,292$ 263,240$ (258,136)$ 94,396$ Accounts receivable 6,125 61 - 6,186
Total assets 95,417$ 263,301$ (258,136)$ 100,582$
LiabilitiesAccounts payable 95,417$ 263,240$ (258,075)$ 100,582$
Total liabilities 95,417$ 263,240$ (258,075)$ 100,582$
COUNTY COMMISSIONERS OF CALVERT COUNTY, MARYLAND
STATEMENT OF CHANGES IN ASSETS AND LIABILITIESAGENCY FUNDJUNE 30, 2012

-93-
COUNTY COMMISSIONERS OF CALVERT COUNTY, MARYLAND
SCHEDULE OF NOTES RECEIVABLE - VOLUNTEER FIRE DEPARTMENTSAND RESCUE SQUADS - GENERAL FUND
JUNE 30, 2012
VolunteerFire Departments Payment Balance Balance
and Rescue Squads Term Period June 30, 2011 Additions Reductions June 30, 2012
North Beach 25 years Semiannually 144,605$ -$ 10,329$ 134,276$ 12 years Semiannually 6,520 - 2,608 3,912
8 years Semiannually 79,784 - 15,957 63,827 19 years Semiannually 3,750 - 3,750 -
8 years Semiannually 161,000 - 10,062 150,938 24 years Semiannually 96,291 - 9,629 86,662
491,950 - 52,335 439,615
Prince Frederick (PF) 25 years Semiannually 2,084 - 2,084 - 10 years Semiannually 2,255 - 2,255 - 25 years Semiannually 39,200 - 7,840 31,360 25 years Semiannually 313,900 - 14,600 299,300 19 years Semiannually 34,875 - 13,950 20,925 25 years Semiannually 442,000 - 26,000 416,000 12 years Semiannually 13,312 - 3,328 9,984 25 years Semiannually - 461,000 - 461,000 25 years Semiannually - 380,000 - 380,000
847,626 841,000 70,057 1,618,569
Solomons 25 years Semiannually 55,635 - 11,127 44,508 25 years Semiannually 79,488 - 15,898 63,590
7 years Semiannually 71,806 - 15,957 55,849 19 years Semiannually 19,600 - 9,800 9,800 19 years Semiannually 20,000 - 8,000 12,000 12 years Semiannually 22,950 - 3,530 19,420
9 years Semiannually 14,587 - 4,168 10,419 8 years Semiannually 52,688 - 52,688 - 8 years Semiannually 125,504 - 17,929 107,575 8 years Semiannually - 161,000 10,062 150,938
462,258 161,000 149,159 474,099
PF Second District 8 years Semiannually 13,375 - 13,375 - 8 years Semiannually 35,474 - 14,190 21,284 8 years Semiannually 71,806 - 15,957 55,849
120,655 - 43,522 77,133
Dunkirk 24 years Semiannually 113,714 - 9,476 104,238 8 years Semiannually 20,063 - 13,375 6,688 8 years Semiannually 20,665 - 13,776 6,889 9 years Semiannually 4,169 - 4,169 -
25 years Semiannually 266,500 - 13,000 253,500 12 years Semiannually 13,709 - 3,427 10,282
438,820 - 57,223 381,597
Huntingtown 25 years Semiannually 39,200 - 7,840 31,360 24 years Semiannually 82,800 - 7,200 75,600 24 years Semiannually 91,446 - 9,144 82,302 24 years Semiannually 26,750 - 13,375 13,375
9 years Semiannually 4,168 - 4,168 - 12 years Semiannually 38,850 - 4,090 34,760 25 years Semiannually 310,050 - 13,780 296,270
8 years Semiannually 6,493 - 6,493 - 599,757 - 66,090 533,667
St. Leonard 25 years Semiannually 62,537 - 12,507 50,030 25 years Semiannually 164,902 - 10,639 154,263 24 years Semiannually 129,182 - 9,569 119,613
9 years Semiannually 28,168 - 5,122 23,046 8 years Semiannually 13,375 - 13,375 -
12 years Semiannually 13,712 - 3,428 10,284 8 years Semiannually - 161,000 - 161,000
411,876 161,000 54,640 518,236
Calvert Advanced Life 3 years Semiannually 24,602 - 24,602 - Support Unit 3 years Semiannually 24,602 - 24,602 -
3 years Semiannually 52,155 - 26,078 26,077 2.5 years Semiannually 82,927 - 27,642 55,285
184,286 - 102,924 81,362
3,557,228$ 1,163,000$ 595,950$ 4,124,278$

-94-
COUNTY COMMISSIONERS OF CALVERT COUNTY, MARYLAND
SCHEDULE OF REAL AND PERSONAL TAXES RECEIVABLE GENERAL FUND
JUNE 30, 2012
Total Assessed Tax RateValue of Per $100 of BalanceTaxable Assessed Actual Amount of TaxesProperty Value Tax Levy Collected Receivable
County PortionCurrent year property - locally assessedReal property:
For full year levy 11,443,420,045$ 0.892$ 102,075,307$ 99,607,307$ 2,468,000$ For half year levy 26,832,520 0.446 119,673 119,673 - North Beach 242,078,083 0.556 1,345,954 1,345,954 - Chesapeake Beach 729,875,577 0.556 4,058,108 4,058,108 - Total real property 12,442,206,225 107,599,042 105,131,042 2,468,000
Personal property, including corporations and banks 118,200,810 2.230 2,635,878 2,310,378 325,500 Public utilities operating and personal property 802,925,230 2.230 17,905,233 17,903,503 1,730
Total current year 13,363,332,265$ 128,140,153$ 125,344,923$ 2,795,230$
Prior years, real, personal, and corporate property 1,576,922 Accrued interest receivable and service charge 1,078,918
Total prior years, accrued interest and interest and outstanding tax credit 2,655,840
Total taxes receivable - county portion 5,451,070 Taxes receivable - state portion, net of tax credits 445,295 Taxes receivable - towns portion, net of tax credits 338,851 Bay Restoration fee due to state - billed with Real estate taxes 21,867
Total taxes receivable 6,257,083$

-95-
Hea
lthy
Satu
rday
Rei
nves
tC
CFN
Fam
ilies
Scho
ols
YSB
Fund
sL
AM
Adm
inis
trat
ive
Tot
alR
EV
EN
UE
S
Fede
ral r
even
ue-
$
-$
-$
-
$
-
$
-$
-
$
St
ate
reve
nue
253,
780
30,0
00
38
,992
3,
620
116,
901
75,1
52
518,
445
Tota
l rev
enue
s25
3,78
0
30
,000
38,9
92
3,62
0
11
6,90
1
75
,152
51
8,44
5
EX
PEN
DIT
UR
ES
Sala
ries
8,57
2
-
-
2,
934
-
50
,787
62
,293
Po
stag
e-
-
-
-
-
89
89
Mile
age
allo
wan
ce-
-
-
-
-
106
10
6
Boa
rd o
f Edu
catio
n24
1,78
0
30
,000
-
-
-
-
27
1,78
0
C
ontra
cted
serv
ices
-
-
38
,992
-
11
6,90
1
(1
,000
)
154,
893
Tele
phon
e/co
mm
-
-
-
-
-
90
1
901
B
enef
its3,
428
-
-
686
-
24,2
69
28,3
83
Tota
l exp
endi
ture
s25
3,78
0
30
,000
38,9
92
3,62
0
11
6,90
1
75
,152
51
8,44
5
Exce
ss (d
efic
ienc
y) o
f rev
enue
over
exp
endi
ture
s-
-
-
-
-
-
-
Fund
bal
ance
- be
ginn
ing
of y
ear
-
-
-
-
-
-
-
Fund
bal
ance
- en
d of
yea
r-
$
-$
-$
-
$
-
$
-$
-
$
CO
UN
TY
CO
MM
ISSI
ON
ER
S O
F C
AL
VE
RT
CO
UN
TY
, MA
RY
LA
ND
CO
MB
ININ
G S
TA
TE
ME
NT
OF
RE
VE
NU
ES,
EX
PEN
DIT
UR
ES
AN
D C
HA
NG
ES
IN F
UN
D E
QU
ITY
C
AL
VE
RT
CO
UN
TY
FA
MIL
Y N
ET
WO
RK
FOR
TH
E Y
EA
R E
ND
ED
JU
NE
30,
201
2
REPORT ON INTERNAL CONTROL OVER FINANCIAL REPORTING AND ON COMPLIANCE AND OTHER MATTERS BASED ON AN AUDIT OF FINANCIAL
STATEMENTS PERFORMED IN ACCORDANCE WITH GOVERNMENT AUDITING STANDARDS
County Commissioners of Calvert County, MarylandPrince Frederick, Maryland
We have audited the financial statements of the governmental activities, the business-type activities, the aggregate discretely presented component units, each major fund, and the aggregate remaining fund information of the County Commissioners of Calvert County, Maryland, as of and for the year ended June 30, 2012, which collectively comprise the County Commissioners of Calvert County, Maryland’s basic financial statements and have issued our report thereon dated December 19, 2012.Our report includes a reference to other auditors. We conducted our audit in accordance with auditing standards generally accepted in the United States of America and the standards applicable to financial audits contained in Government Auditing Standards, issued by the Comptroller General of the United States. Other auditors audited the financial statements of the Calvert County Board of Education, as described in our report on the County Commissioners of Calvert County, Maryland’s financial statements. This report does not include the results of the other auditors’ testing of internal control over financial reporting or compliance and other matters that are reported on separately by those auditors.
Internal Control Over Financial Reporting
Management of the County Commissioners of Calvert County, Maryland, is responsible for establishing and maintaining effective internal control over financial reporting. In planning and performing our audit, we considered the County Commissioners of Calvert County, Maryland’s internal control over financial reporting as a basis for designing our auditing procedures for the purpose of expressing our opinions on the financial statements, but not for the purpose of expressing an opinion on the effectiveness of the County Commissioners of Calvert County, Maryland’s internal control over financial reporting. Accordingly, we do not express an opinion on the effectiveness of the County Commissioners of Calvert County, Maryland’s internal control over financial reporting.

-96-
REPORT ON INTERNAL CONTROL OVER FINANCIAL REPORTING AND ON COMPLIANCE AND OTHER MATTERS BASED ON AN AUDIT OF FINANCIAL
STATEMENTS PERFORMED IN ACCORDANCE WITH GOVERNMENT AUDITING STANDARDS
County Commissioners of Calvert County, MarylandPrince Frederick, Maryland
We have audited the financial statements of the governmental activities, the business-type activities, the aggregate discretely presented component units, each major fund, and the aggregate remaining fund information of the County Commissioners of Calvert County, Maryland, as of and for the year ended June 30, 2012, which collectively comprise the County Commissioners of Calvert County, Maryland’s basic financial statements and have issued our report thereon dated December 19, 2012.Our report includes a reference to other auditors. We conducted our audit in accordance with auditing standards generally accepted in the United States of America and the standards applicable to financial audits contained in Government Auditing Standards, issued by the Comptroller General of the United States. Other auditors audited the financial statements of the Calvert County Board of Education, as described in our report on the County Commissioners of Calvert County, Maryland’s financial statements. This report does not include the results of the other auditors’ testing of internal control over financial reporting or compliance and other matters that are reported on separately by those auditors.
Internal Control Over Financial Reporting
Management of the County Commissioners of Calvert County, Maryland, is responsible for establishing and maintaining effective internal control over financial reporting. In planning and performing our audit, we considered the County Commissioners of Calvert County, Maryland’s internal control over financial reporting as a basis for designing our auditing procedures for the purpose of expressing our opinions on the financial statements, but not for the purpose of expressing an opinion on the effectiveness of the County Commissioners of Calvert County, Maryland’s internal control over financial reporting. Accordingly, we do not express an opinion on the effectiveness of the County Commissioners of Calvert County, Maryland’s internal control over financial reporting.

-97-
A deficiency in internal control exists when the design or operation of a control does not allow management or employees, in the normal course of performing their assigned functions, to prevent or detect and correct misstatements on a timely basis. Amaterial weakness is a deficiency, or a combination of deficiencies, in internal control such that there is a reasonable possibility that a material misstatement of the entity’s financial statements will not be prevented, or detected and corrected on a timely basis.
Our consideration of internal control over financial reporting was for the limited purpose described in the first paragraph of this section and was not designed to identify all deficiencies in internal control over financial reporting that might be deficiencies, significant deficiencies or material weaknesses. We did not identify any deficiencies in internal control over financial reporting that we consider to be material weaknesses, as defined above.
Compliance and Other Matters
As part of obtaining reasonable assurance about whether the County Commissioners of Calvert County, Maryland’s financial statements are free of material misstatement, we performed tests of its compliance with certain provisions of laws, regulations, contracts, and grant agreements, noncompliance with which could have a direct and material effect on the determination of financial statement amounts.However, providing an opinion on compliance with those provisions was not an objective of our audit, and accordingly, we do not express such an opinion. The results of our tests disclosed no instances of noncompliance or other matters that are required to be reported under Government Auditing Standards.
This report is intended solely for the information and use of the County Commissioners of Calvert County, Maryland, management, others within the entity and federal awarding agencies and pass-through entities and is not intended to be and should not be used by anyone other than these specified parties.
Clinton, Maryland December 19, 2012

Statistical Section

“THIS PAGE LEFT INTENTIONALLY BLANK”

COUNTY COMMISSIONERS OF CALVERT COUNTYCALVERT COUNTY, MARYLAND
FINANCIAL TREND DATAJUNE 30, 2012
The following schedules contain information to help the reader understand how the government’s financial performance and well-being have changed over the last eight years.
The financial trend data schedules are: • Net postion by category• Changes in net postion• General tax revenue-government activities• Fund balance of governmental funds

-98-
Coun
ty C
omm
issi
oner
s of
Cal
vert
Coun
ty, M
aryl
and
Net P
ositi
on b
y Co
mpo
nent
sLa
st T
en F
isca
l Yea
rs(a
ccru
al b
asis
of a
ccou
ntin
g)(u
naud
ited,
see
rela
ted
note
s be
low
)Sc
hedu
le 1
FY20
03FY
2004
FY20
05FY
2006
FY20
07FY
2008
FY20
09FY
2010
FY20
11FY
2012
Gov
ernm
enta
l act
ivitie
sIn
vest
ed in
cap
ital a
sset
s, n
et o
f rel
ated
deb
t56
,233
,384
$
61,1
46,2
24$
63
,129
,333
$
78,8
66,5
12$
96
,731
,172
$
100,
994,
016
$ 10
9,94
2,36
0$
110,
447,
873
$ 10
9,94
3,24
6$
116,
545,
107
$Re
stric
ted
4,88
3,35
9
5,05
5,70
7
5,51
6,11
6
5,88
4,50
9
9,24
6,06
7
7,76
3,48
1
11,9
68,4
98
13
,275
,882
17,1
37,4
97
17
,390
,548
Unre
stric
ted
54,1
35,9
18
45
,990
,097
63,1
68,0
41
67
,514
,862
69,0
49,3
48
78
,491
,069
49,4
70,2
23
33
,885
,557
43,1
42,0
24
36
,476
,103
Tota
l gov
ernm
enta
l act
ivitie
s ne
t pos
ition
115,
252,
661
$ 11
2,19
2,02
8$
131,
813,
490
$15
2,26
5,88
3$
175,
026,
587
$18
7,24
8,56
6$
171,
381,
081
$15
7,60
9,31
2$
170,
222,
767
$17
0,41
1,75
8$
Busin
ess-
type
act
ivitie
sIn
vest
ed in
cap
ital a
sset
s, n
et o
f rel
ated
deb
t27
,314
,438
$
28,8
43,5
60$
30
,186
,513
$
30,2
15,4
02$
32
,980
,825
$
34,7
22,5
81$
38
,558
,942
$
34,3
65,8
14$
34
,549
,717
$
32,5
68,7
68$
Rest
ricte
d4,
845,
269
4,
604,
303
4,
091,
718
4,
903,
917
4,
386,
023
5,
674,
336
2,
704,
915
2,
359,
895
2,
336,
457
2,
787,
892
Un
rest
ricte
d1,
919,
870
1,
330,
155
16
,967
(1,5
79,4
73)
(3,5
35,3
83)
(5,9
65,7
71)
(2,8
23,5
74)
1,53
9,58
8
897,
574
2,13
4,59
6
Tota
l bus
ines
s-ty
pe a
ctivi
ties
net p
ositio
n34
,079
,577
$
34,7
78,0
18$
34
,295
,198
$
33,5
39,8
46$
33
,831
,465
$
34,4
31,1
46$
38
,440
,283
$
38,2
65,2
97$
37
,783
,748
$
37,4
91,2
56$
Prim
ary
gove
rnm
ent
Inve
sted
in c
apita
l ass
ets,
net
of r
elat
ed d
ebt
83,5
47,8
22$
89
,989
,784
$
93,3
15,8
46$
10
9,08
1,91
4$
129,
711,
997
$ 13
5,71
6,59
7$
148,
501,
302
$ 14
4,81
3,68
7$
144,
492,
963
$ 14
9,11
3,87
5$
Rest
ricte
d9,
728,
628
9,
660,
010
9,
607,
834
10
,788
,426
13,6
32,0
90
13
,437
,817
14,6
73,4
13
15
,635
,777
19,4
73,9
54
20
,178
,440
Unre
stric
ted
56,0
55,7
88
47
,320
,252
63,1
85,0
08
65
,935
,389
65,5
13,9
65
72
,525
,298
46,6
46,6
49
35
,425
,145
44,0
39,5
98
38
,610
,699
Tota
l prim
ary
gove
rnm
ent n
et p
ositio
n14
9,33
2,23
8$
146,
970,
046
$16
6,10
8,68
8$
185,
805,
729
$20
8,85
8,05
2$
221,
679,
712
$ 20
9,82
1,36
4$
195,
874,
609
$20
8,00
6,51
5$
207,
903,
014
$
NOTE
S:(1
) Acc
ount
ing
stan
dard
s re
quire
the
net p
ositio
n be
repo
rted
in th
ree
com
pone
nts
in th
e fin
ancia
l sta
tem
ents
: cap
ital a
sset
s, n
et o
f rel
ated
debt
: res
trict
ed: a
nd u
nres
trict
ed.
Net p
ositio
n is
cons
ider
ed re
stric
ted
when
(1) a
n ex
tern
al p
arty
, suc
h as
the
stat
e or
fede
ral g
over
nmen
t,pl
aces
a re
stric
tion
on h
ow th
e re
sour
ces
may
be
used
, or (
2) e
nabl
ing
legi
slatio
n is
enac
ted
by th
e Co
unty
.

“THIS PAGE LEFT INTENTIONALLY BLANK”

-99-
Coun
ty C
omm
issi
oner
s of
Cal
vert
Coun
ty, M
aryl
and
Chan
ges
in N
et P
ositi
onLa
st T
en F
isca
l Yea
rs(a
ccru
al b
asis
of a
ccou
ntin
g)(u
naud
ited,
see
rela
ted
note
s be
low
)Sc
hedu
le 2
Expe
nses
FY20
03FY
2004
FY20
05FY
2006
FY20
07FY
2008
FY20
09FY
2010
FY20
11FY
2012
Gov
ernm
enta
l act
iviti
es:
Gen
eral
gov
ernm
ent
12,5
87,5
97$
13,3
69,2
18$
14,6
41,0
34$
15,8
37,4
98$
19,3
78,2
01$
21,1
18,9
28$
19,0
68,7
59$
10,7
29,4
59$
20,4
54,6
75$
21,0
42,1
97$
Publ
ic s
afet
y17
,249
,535
17
,642
,496
18
,794
,313
18
,104
,991
25
,832
,813
28
,440
,488
31
,997
,935
31
,297
,136
28
,670
,766
31
,304
,000
Publ
ic w
orks
10,5
61,3
11
10,3
79,2
11
4,95
4,30
8
8,65
6,50
7
16,2
94,5
62
12,7
47,6
10
18,1
72,3
91
24,1
31,8
44
15,0
59,8
70
17,8
75,7
24H
ealth
and
hos
pita
ls2,
604,
086
2,
581,
456
2,
439,
169
2,
547,
571
3,
091,
069
3,
059,
513
3,
451,
586
2,
128,
412
3,
407,
428
3,
513,
583
Soci
al s
ervi
ces
6,44
3,02
4
7,03
1,03
4
7,67
1,90
1
7,68
9,16
7
9,20
5,32
8
9,67
4,76
0
10,7
21,1
94
11,6
60,2
59
10,9
31,1
98
10,6
34,9
75Ed
ucat
ion
1,80
2,88
2
1,62
4,35
6
2,02
0,19
4
2,39
1,36
0
2,99
1,38
2
3,04
8,93
9
3,47
8,08
7
4,61
4,64
7
4,26
3,19
6
4,40
2,80
3Bo
ard
of E
duca
tion
78,0
87,4
40
93,3
20,8
07
87,3
72,3
70
85,7
12,6
12
90,3
78,7
44
108,
689,
460
122,
637,
685
133,
561,
524
128,
257,
599
129,
357,
909
Rec
reat
ion
and
cultu
re6,
297,
878
6,
564,
078
6,
831,
068
2,
547,
771
10
,608
,677
11
,230
,664
9,
561,
064
4,
993,
041
10
,430
,206
15
,328
,415
Con
serv
atio
n of
nat
ural
reso
urce
s29
1,65
1
77
0,37
7
1,
050,
357
3,
201,
679
1,
422,
798
1,
816,
478
1,
601,
851
1,
573,
710
3,
393,
562
4,
534,
680
Urb
an d
evel
opm
ent a
nd h
ousi
ng82
0,51
1
93
9,44
1
97
0,28
8
1,
076,
102
1,
326,
831
1,
378,
660
2,
603,
275
2,
643,
490
2,
521,
746
2,
870,
632
Econ
omic
dev
elop
men
t89
9,80
3
1,
232,
521
1,
179,
816
1,
204,
049
1,
430,
435
1,
209,
545
1,
465,
651
1,
852,
710
1,
580,
260
1,
621,
325
Mis
cella
neou
s8,
641,
126
9,
753,
996
10
,455
,449
12
,480
,849
-
-
-
-
-
-C
apita
l pro
ject
s3,
328,
279
4,
973,
978
4,
769,
708
13
,792
,519
2,
034,
100
-
-
-
-
-
Deb
t ser
vice
2,66
6,96
8
3,07
1,80
9
3,20
3,82
0
3,28
4,36
5
3,64
0,05
0
4,18
0,76
1
4,82
2,82
8
4,72
6,86
7
4,85
9,41
4
4,98
0,10
2Su
btot
al g
over
nmen
tal a
ctiv
ities
exp
ense
s15
2,28
2,09
1
17
3,25
4,77
8
16
6,35
3,79
5
17
8,52
7,04
0
18
7,63
4,99
0
20
6,59
5,80
6
22
9,58
2,30
6
23
3,91
3,09
9
23
3,82
9,92
0
24
7,46
6,34
5Bu
sine
ss-ty
pe a
ctiv
ities
:W
ater
and
sew
er4,
773,
683
5,
186,
540
5,
179,
836
5,
813,
095
5,
782,
763
6,
063,
824
6,
383,
249
6,
955,
914
6,
595,
252
6,
707,
332
Solid
was
te10
,048
,130
11
,495
,314
12
,041
,497
12
,280
,864
11
,588
,833
11
,110
,091
10
,848
,552
10
,101
,302
9,
877,
661
10
,717
,986
Cul
ture
2,52
7,05
6
2,92
2,80
6
2,94
2,14
1
2,94
3,97
2
3,29
8,65
5
3,39
5,57
4
4,01
2,68
6
4,35
0,81
7
4,53
9,55
0
4,63
4,75
4Su
btot
al b
usin
ess-
type
act
iviti
es e
xpen
ses
17,3
48,8
69
19,6
04,6
60
20,1
63,4
74
21,0
37,9
31
20,6
70,2
51
20,5
69,4
89
21,2
44,4
87
21,4
08,0
33
21,0
12,4
63
22,0
60,0
72To
tal p
rimar
y go
vern
men
t exp
ense
s16
9,63
0,96
0$
19
2,85
9,43
8$
18
6,51
7,26
9$
19
9,56
4,97
1$
20
8,30
5,24
1$
22
7,16
5,29
5$
25
0,82
6,79
3$
25
5,32
1,13
2$
25
4,84
2,38
3$
26
9,52
6,41
7$
Prog
ram
Rev
enue
sG
over
nmen
tal a
ctiv
ities
:G
ener
al g
over
nmen
t1,
566,
147
$
2,
163,
364
$
1,
979,
433
$
3,
084,
507
$
2,
733,
752
$
4,
234,
723
$
4,
595,
411
$
4,
985,
993
$
4,
851,
711
$
4,
268,
793
$Pu
blic
saf
ety
4,12
3,39
8
5,60
4,44
4
6,34
3,75
0
5,84
8,00
1
6,92
5,88
1
7,16
6,20
6
7,36
4,29
9
7,71
3,00
6
7,10
7,18
5
8,61
1,18
9Pu
blic
wor
ks5,
373,
336
7,
849,
342
5,
439,
168
6,
446,
786
7,
282,
186
6,
388,
285
6,
434,
341
1,
642,
677
2,
799,
539
1,
852,
926
Hea
lth a
nd h
ospi
tals
41,3
29
82,6
08
54,3
43
58,1
87
70,6
87
58,3
99
38,7
37
47,2
13
52,9
58
288,
278
Soci
al s
ervi
ces
814,
116
682,
748
753,
748
754,
048
1,01
4,71
2
797,
476
1,04
9,52
7
698,
277
1,23
9,01
6
1,76
1,83
3Ed
ucat
ion
5,14
8
12
,103
34
,193
34
,193
8,
299
4,00
0
-
107,
940
-
15
5,68
0Bo
ard
of E
duca
tion
-
-
-
-
-
-
-
96
5,78
7
14
0,20
3
4,
573,
994
Rec
reat
ion
and
cultu
re2,
026,
048
4,
323,
459
2,
563,
470
3,
226,
166
3,
549,
745
3,
353,
666
3,
385,
992
3,
584,
768
4,
133,
659
5,
143,
001
Con
serv
atio
n of
nat
ural
reso
urce
s15
5,45
8
15
1,27
9
16
6,76
8
14
3,70
2
74
4,52
2
33
6,47
3
1,
330,
446
18
4,61
0
24
8,85
3
36
8,64
0U
rban
dev
elop
men
t and
hou
sing
700,
488
744,
894
845,
954
1,01
8,47
8
997,
111
961,
195
1,02
2,37
6
1,07
1,63
6
1,10
9,51
0
1,22
3,25
8Ec
onom
ic d
evel
opm
ent
1,29
3,68
9
1,08
3,52
2
989,
167
1,00
7,39
8
1,05
8,56
2
929,
119
838,
483
698,
198
591,
273
615,
199
Mis
cella
neou
s1,
126,
307
1,
353,
007
2,
097,
004
1,
730,
581
-
-
-
-
-
-C
apita
l pro
ject
s10
,644
,669
1,
987,
109
83
8,89
4
1,
823,
092
1,
707,
441
1,
356,
301
2,
334,
409
-
-
-
Deb
t ser
vice
641,
103
638,
943
640,
651
641,
346
636,
098
639,
458
636,
352
636,
802
7,44
1
7,
441
Subt
otal
gov
ernm
enta
l act
iviti
es re
venu
es28
,511
,236
26
,676
,822
22
,746
,543
25
,816
,485
26
,728
,996
26
,225
,301
29
,030
,373
22
,336
,907
22
,281
,348
28
,870
,232
Busi
ness
-type
act
iviti
es:
Wat
er a
nd s
ewer
3,63
2,58
0
5,15
2,44
7
4,51
8,24
1
4,50
4,97
3
4,69
6,93
1
5,52
9,76
0
6,19
7,14
3
6,05
1,78
6
6,13
2,56
8
6,77
7,88
8So
lid w
aste
10,4
33,6
75
11,8
06,4
48
12,3
18,4
89
12,5
69,9
22
12,5
24,4
86
11,6
26,4
94
11,2
38,2
60
10,2
35,4
71
10,1
00,1
42
10,6
66,6
77C
ultu
re49
7,52
2
1,
181,
133
60
7,40
6
66
8,81
2
73
2,75
5
83
7,52
8
1,
201,
750
1,
750,
751
1,
488,
473
1,
300,
918
Subt
otal
bus
ines
s-ty
pe a
ctiv
ities
reve
nues
14,5
63,7
77
18,1
40,0
28
17,4
44,1
36
17,7
43,7
07
17,9
54,1
72
17,9
93,7
82
18,6
37,1
53
18,0
38,0
08
17,7
21,1
83
18,7
45,4
83To
tal p
rimar
y go
vern
men
t rev
enue
s43
,075
,013
$
44
,816
,850
$
40
,190
,679
$
43
,560
,192
$
44
,683
,168
$
44
,219
,083
$
47
,667
,526
$
40
,374
,915
$
40
,002
,531
$
47
,615
,715
$

-100-
Coun
ty C
omm
issi
oner
s of
Cal
vert
Coun
ty, M
aryl
and
Chan
ges
in N
et P
ositi
onLa
st N
ine
Fisc
al Y
ears
(acc
rual
bas
is o
f acc
ount
ing)
(una
udite
d, s
ee re
late
d no
tes
belo
w)
Sche
dule
2
Net (
Expe
nse)
/Rev
enue
FY20
03FY
2004
FY20
05FY
2006
FY20
07FY
2008
FY20
09FY
2010
FY20
11FY
2012
Gov
ernm
enta
l act
iviti
es:
Gen
eral
gov
ernm
ent
(11,
021,
450)
$
(11,
205,
854)
$
(12,
661,
601)
$
(12,
752,
991)
$
(16,
644,
449)
$
(16,
884,
205)
$
(14,
473,
348)
$
(5,7
43,4
66)
$
(1
5,60
2,96
4)$
(1
6,77
3,40
4)$
Publ
ic s
afet
y(1
3,12
6,13
7)
(1
2,03
8,05
2)
(1
2,45
0,56
3)
(1
2,25
6,99
0)
(1
8,90
6,93
2)
(2
1,27
4,28
2)
(2
4,63
3,63
6)
(2
3,58
4,13
0)
(2
1,56
3,58
1)
(2
2,69
2,81
1)Pu
blic
wor
ks(5
,187
,975
)
(2,5
29,8
69)
48
4,86
0
(2
,209
,721
)
(9,0
12,3
76)
(6
,359
,325
)
(11,
738,
050)
(22,
489,
167)
(12,
260,
331)
(16,
022,
798)
Hea
lth a
nd h
ospi
tals
(2,5
62,7
57)
(2
,498
,848
)
(2,3
84,8
26)
(2
,489
,384
)
(3,0
20,3
82)
(3
,001
,114
)
(3,4
12,8
49)
(2
,081
,199
)
(3,3
54,4
70)
(3
,225
,305
)So
cial
ser
vice
s(5
,628
,908
)
(6,3
48,2
86)
(6
,918
,153
)
(6,9
35,1
19)
(8
,190
,616
)
(8,8
77,2
84)
(9
,671
,667
)
(10,
961,
982)
(9,6
92,1
82)
(8
,873
,142
)Ed
ucat
ion
(1,7
97,7
34)
(1
,612
,253
)
(1,9
86,0
01)
(2
,357
,167
)
(2,9
83,0
83)
(3
,044
,939
)
(3,4
78,0
87)
(4
,506
,707
)
(4,2
63,1
96)
(4
,247
,123
)Bo
ard
of E
duca
tion
(78,
087,
440)
(93,
320,
807)
(87,
372,
370)
(85,
712,
612)
(90,
378,
744)
(108
,689
,460
)
(122
,637
,685
)
(132
,595
,737
)
(128
,117
,396
)
(124
,783
,915
)R
ecre
atio
n an
d cu
lture
(4,2
71,8
30)
(2
,240
,619
)
(4,2
67,5
98)
67
8,39
5
(7
,058
,932
)
(7,8
76,9
98)
(6
,175
,072
)
(1,4
08,2
73)
(6
,296
,547
)
(10,
185,
414)
Con
serv
atio
n of
nat
ural
reso
urce
s(1
36,1
93)
(619
,098
)
(8
83,5
89)
(3,0
57,9
77)
(6
78,2
76)
(1,4
80,0
05)
(2
71,4
05)
(1,3
89,1
00)
(3
,144
,709
)
(4,1
66,0
40)
Urb
an d
evel
opm
ent a
nd h
ousi
ng(1
20,0
23)
(194
,547
)
(1
24,3
34)
(57,
624)
(329
,720
)
(4
17,4
65)
(1,5
80,8
99)
(1
,571
,854
)
(1,4
12,2
36)
(1
,647
,374
)Ec
onom
ic d
evel
opm
ent
393,
886
(148
,999
)
(1
90,6
49)
(196
,651
)
(3
71,8
73)
(280
,426
)
(6
27,1
68)
(1,1
54,5
12)
(9
88,9
87)
(1,0
06,1
26)
Mis
cella
neou
s(7
,514
,819
)
(8,4
00,9
89)
(8
,358
,445
)
(10,
750,
268)
-
-
-
-
-
-
Cap
ital p
roje
cts
7,31
6,39
0
(2,9
86,8
69)
(3
,930
,814
)
(11,
969,
427)
(326
,659
)
1,
356,
301
2,
334,
409
-
-
-
Deb
t ser
vice
(2,0
25,8
65)
(2
,432
,866
)
(2,5
63,1
69)
(2
,643
,019
)
(3,0
03,9
52)
(3
,541
,303
)
(4,1
86,4
76)
(4
,090
,065
)
(4,8
51,9
73)
(4
,972
,661
)Su
btot
al g
over
nmen
tal a
ctiv
ities
exp
ense
s(1
23,7
70,8
55)
(1
46,5
77,9
56)
(1
43,6
07,2
52)
(1
52,7
10,5
55)
(1
60,9
05,9
94)
(1
80,3
70,5
05)
(2
00,5
51,9
33)
(2
11,5
76,1
92)
(2
11,5
48,5
72)
(2
18,5
96,1
13)
Busi
ness
-type
act
iviti
es:
Wat
er a
nd s
ewer
(1,1
41,1
03)
(3
4,09
3)
(6
61,5
95)
(1,3
08,1
22)
(1
,085
,832
)
(534
,064
)
(1
86,1
06)
(904
,128
)
(4
62,6
84)
70,5
56So
lid w
aste
385,
545
311,
134
276,
992
289,
058
935,
653
516,
403
389,
708
134,
169
222,
481
(51,
309)
Cul
ture
(2,0
29,5
34)
(1
,741
,673
)
(2,3
34,7
35)
(2
,275
,160
)
(2,5
65,9
00)
(2
,558
,046
)
(2,8
10,9
36)
(2
,600
,066
)
(3,0
51,0
77)
(3
,333
,836
)Su
btot
al b
usin
ess-
type
act
iviti
es e
xpen
ses
(2,7
85,0
92)
(1
,464
,632
)
(2,7
19,3
38)
(3
,294
,224
)
(2,7
16,0
79)
(2
,575
,707
)
(2,6
07,3
34)
(3
,370
,025
)
(3,2
91,2
80)
(3
,314
,589
)To
tal p
rimar
y go
vern
men
t exp
ense
s(1
26,5
55,9
47)
$ (1
48,0
42,5
88)
$ (1
46,3
26,5
90)
$ (1
56,0
04,7
79)
$ (1
63,6
22,0
73)
$ (1
82,9
46,2
12)
$ (2
03,1
59,2
67)
$ (2
14,9
46,2
17)
$ (2
14,8
39,8
52)
$ (2
21,9
10,7
02)
$
Gen
eral
Rev
enue
s an
d O
ther
Cha
nges
in N
et P
ositi
onG
over
nmen
tal a
ctiv
ities
: P
rope
rty ta
xes
69,9
22,2
60$
77,4
71,7
02$
85,1
33,6
07$
90,8
33,1
50$
98,9
94,2
36$
109,
907,
718
$
126,
502,
446
$
137,
559,
596
$
150,
043,
755
$
150,
000,
842
$ In
com
e ta
xes
39,7
53,3
12
49,9
78,6
22
56,8
80,1
09
58,6
47,6
05
61,8
86,5
20
63,4
77,7
15
54,2
80,0
21
55,4
75,4
03
69,7
11,2
37
64,0
71,3
20 R
ecor
datio
n ta
xes
9,06
7,97
9
11,3
22,2
87
13,6
30,1
56
14,4
81,8
19
11,6
64,6
98
9,11
4,66
1
5,79
9,98
5
5,69
0,34
8
5,33
0,74
6
5,18
0,57
6 A
dmis
sion
and
am
usem
ent t
axes
40
,472
19
8,06
3
26
9,04
9
29
3,73
5
10
7,31
0
23
,377
30
,212
25
,009
25
,803
30
,938
Fra
nchi
se ta
xes
551,
667
618,
105
714,
446
778,
416
892,
707
984,
342
1,07
8,08
0
1,11
0,31
1
1,16
9,77
6
1,19
2,01
0 O
ther
mis
cella
neou
s ta
xes
970,
841
154,
886
182,
573
132,
064
157,
516
148,
115
119,
546
114,
013
113,
753
127,
458
Sta
te re
imbu
rsem
ent o
f ele
ctric
ity d
ereg
ulat
ion
6,09
6,57
4
5,42
5,07
9
6,09
6,57
4
6,09
6,57
4
6,09
6,57
4
5,89
7,43
7
-
-
-
-
Inte
rest
and
div
iden
ds
1,57
1,30
7
460,
472
2,36
6,40
3
4,06
6,07
5
6,35
8,18
9
5,87
1,25
8
3,36
2,35
3
933,
632
442,
937
1,13
1,21
3 M
isce
llane
ous
(1,1
18,9
00)
(2
,111
,893
)
(2,0
44,2
03)
(2
,166
,490
)
(2,4
91,0
52)
(2
,832
,139
)
(6,4
88,1
95)
(3
,103
,889
)
(2,6
75,9
80)
(2
,949
,253
)Su
btot
al g
over
nmen
tal a
ctiv
ities
reve
nues
126,
855,
512
143,
517,
323
163,
228,
714
173,
162,
948
183,
666,
698
192,
592,
484
184,
684,
448
197,
804,
423
224,
162,
027
218,
785,
104
Busi
ness
-type
act
iviti
es:
Stat
e re
imbu
rsem
ent o
f ele
ctric
der
egul
atio
n34
9,53
9
51
,180
19
2,31
5
37
2,38
2
-
-
-
-
-
-M
isce
llane
ous
1,72
7,03
1
2,11
1,89
3
2,04
4,20
3
2,16
6,49
0
3,00
7,69
8
3,17
5,38
8
6,61
6,47
0
3,19
5,03
9
2,80
9,73
1
3,02
2,09
7Su
btot
al b
usin
ess-
type
act
iviti
es re
venu
es2,
076,
570
2,
163,
073
2,
236,
518
2,
538,
872
3,
007,
698
3,
175,
388
6,
616,
470
3,
195,
039
2,
809,
731
3,
022,
097
Tota
l prim
ary
gove
rnm
ent r
even
ues
128,
932,
082
$
145,
680,
396
$
165,
465,
232
$
175,
701,
820
$
186,
674,
396
$
195,
767,
872
$
191,
300,
918
$
200,
999,
462
$
226,
971,
758
$
221,
807,
201
$
Chan
ge in
net
pos
ition
Gov
ernm
enta
l act
iviti
es3,
084,
657
$
(3
,060
,633
)$
19,6
21,4
62$
20,4
52,3
93$
22,7
60,7
04$
12,2
21,9
79$
(15,
867,
485)
$
(13,
771,
769)
$
12,6
13,4
55$
188,
991
$Bu
sine
ss-ty
pe a
ctiv
ities
(708
,522
)
69
8,44
1
(4
82,8
20)
(755
,352
)
29
1,61
9
59
9,68
1
4,
009,
136
(1
74,9
86)
(481
,549
)
(2
92,4
92)
Tota
l prim
ary
gove
rnm
ent
2,37
6,13
5$
(2,3
62,1
92)
$
19
,138
,642
$
19
,697
,041
$
23
,052
,323
$
12
,821
,660
$
(1
1,85
8,34
9)$
(1
3,94
6,75
5)$
12
,131
,906
$
(1
03,5
01)
$
NO
TES:
(1) N
et (e
xpen
se)/r
even
ue is
the
diffe
renc
e be
twee
n th
e ex
pens
es a
nd p
rogr
am re
venu
es o
f a fu
nctio
n or
pro
gram
. It
indi
cate
s th
e de
gree
whi
ch a
func
tion
or p
rogr
am is
sup
porte
d w
ith it
s ow
n fe
es
and
prog
ram
-spe
cific
gra
nts
vers
us it
s re
lianc
e up
on fu
ndin
g fro
m ta
xes
and
grea
ter t
han
prog
ram
reve
nues
and
ther
efor
e ge
nera
l rev
enue
s ot
her g
ener
al re
venu
es.
Num
bers
in p
aren
thes
es in
dica
te
that
exp
ense
s w
ere
need
ed to
fina
nce
that
func
tion
or p
rogr
am.
Num
bers
with
out p
aren
thes
es m
ean
that
pro
gram
reve
nues
wer
e m
ore
than
suf
ficie
nt to
cov
er e
xpen
ses.
(2) G
over
nmen
t-wid
e ne
t ass
et in
form
atio
n is
repo
rted
on th
e ac
crua
l bas
is o
f acc
ount
ing.
(3) N
ine
year
s of
sta
tistic
al d
ata
is re
porte
d on
this
sch
edul
e. P
rior t
o G
ASB
34, t
he c
ount
y di
d no
t mai
ntai
n th
is ty
pe o
f inf
orm
atio
n.

-101-
Coun
ty C
omm
issi
oner
s of
Cal
vert
Coun
ty, M
aryl
and
Gen
eral
Tax
Rev
enue
s - G
over
nmen
tal A
ctiv
ities
Last
Ten
Fis
cal Y
ears
(acc
rual
bas
is o
f acc
ount
ing)
(una
udite
d, s
ee re
late
d no
tes
belo
w)
Sche
dule
3
FY20
03FY
2004
FY20
05FY
2006
FY20
07FY
2008
FY20
09FY
2010
FY20
11FY
2012
Rea
l and
per
sona
l pro
perty
taxe
s65
,763
,330
$
70,8
20,3
49$
78
,790
,203
$
86,0
51,2
17$
94
,728
,796
$
106,
121,
819
$ 12
2,91
8,02
0$
133,
981,
114
$ 14
6,79
0,79
9$
146,
449,
619
$In
com
e ta
xes
40,1
61,4
99
46
,585
,767
54,3
86,9
67
55
,625
,569
59,0
64,8
89
62
,153
,000
58,3
70,2
05
56
,136
,128
62,6
68,4
88
64
,199
,044
Adm
issi
on a
nd a
mus
emen
ts40
,472
198,
063
269,
049
293,
735
107,
310
23,3
77
30
,212
25,0
09
25
,803
30,9
38
R
ecor
datio
n9,
067,
979
11
,322
,287
13,6
30,1
56
14
,481
,819
11,6
64,6
98
9,
114,
661
5,
799,
985
5,
690,
348
5,
330,
746
5,
180,
576
Tr
aile
r par
ks15
4,84
4
15
4,88
5
14
9,03
6
13
2,06
3
15
7,51
6
14
8,11
5
11
9,54
6
11
4,01
3
11
3,75
3
12
7,45
8
H
otel
(2)
-
528,
181
498,
039
519,
919
644,
328
785,
519
763,
877
693,
265
815,
416
753,
981
Hig
hway
use
r rev
enue
(3)
4,47
0,53
8
3,63
2,85
8
4,61
1,14
2
5,68
3,14
7
5,94
7,23
4
5,70
1,04
4
5,07
7,19
5
256,
759
410,
452
281,
653
Fran
chis
e55
1,66
7
61
8,10
5
71
4,44
6
77
8,41
6
89
2,70
7
98
4,34
2
1,
078,
080
1,
110,
311
1,
169,
776
1,
192,
010
T
otal
Tax
es12
0,21
0,32
9$
133,
860,
495
$ 15
3,04
9,03
8$
163,
565,
885
$17
3,20
7,47
8$
185,
031,
877
$ 19
4,15
7,12
0$
198,
006,
947
$21
7,32
5,23
3$
218,
215,
279
$
NO
TES:
(1) G
over
nmen
t-wid
e ge
nera
l tax
reve
nue
info
rmat
ion
is re
porte
d on
the
accr
ual b
asis
of a
ccou
ntin
g.(2
) Cal
vert
Cou
nty
bega
n co
llect
ing
hote
l tax
in F
Y200
4.(3
) Sig
nific
ant H
ighw
ay U
ser r
even
ue d
ecre
ases
by
the
stat
e st
artin
g in
FY2
010.

-102-
Coun
ty C
omm
issi
oner
s of
Cal
vert
Coun
ty, M
aryl
and
Fund
Bal
ance
of G
over
nmen
tal F
unds
Last
Ten
Fis
cal Y
ears
(mod
ified
acc
rual
bas
is o
f acc
ount
ing)
(una
udite
d, s
ee re
late
d no
tes
belo
w)
Sche
dule
4
FY20
03FY
2004
FY20
05FY
2006
FY20
07FY
2008
FY20
09FY
2010
FY20
11(2
)FY
2012
(2)
Gen
eral
Fun
d(p
rior t
o G
ASB
54)
Rese
rved
4,62
5,00
4$
4,
968,
812
$
5,38
3,57
1$
5,
839,
319
$
9,19
5,51
8$
12
,562
,828
$
11,4
52,7
88$
10
,438
,949
$
-$
-$
Unre
serv
ed U
ndes
igna
ted
38,8
83,8
63
39
,447
,501
47,7
19,8
07
56
,039
,767
37,6
71,2
95
37
,969
,096
30,7
03,1
97
28
,650
,914
-
-
Unde
signa
ted
-
-
-
-
16,5
52,0
00
17
,710
,000
17,6
20,0
00
18
,159
,691
-
-
(pos
t GAS
B 54
)No
n-sp
enda
ble
-
-
-
-
-
-
-
-
9,55
4,96
5
9,
545,
194
Rest
ricte
d-
-
-
-
-
-
-
-
64
,861
-
Com
mitt
ed-
-
-
-
-
-
-
-
20
,913
,418
21,4
30,2
48As
signe
d-
-
-
-
-
-
-
-
9,
246,
000
8,21
8,61
9Un
assig
ned
-
-
-
-
-
-
-
-
26,7
63,8
23
27
,321
,625
Tota
l Gen
eral
Fun
d43
,508
,867
$
44,4
16,3
13$
53
,103
,378
$ 61
,879
,086
$ 63
,418
,813
$ 68
,241
,924
$
59,7
75,9
85$
57,2
49,5
54$
66,5
43,0
67$
66,5
15,6
86$
All o
ther
gov
ernm
enta
l fun
ds(p
rior t
o G
ASB
54)
Rese
rved
258,
355
$
86
,895
$
132,
545
$
45
,190
$
50,5
49$
7,
763,
481
$
11,9
68,4
98$
13
,099
,967
$
-$
-$
Unre
serv
ed, r
epor
ted
in:
Spec
ial r
even
ue fu
nds
11,2
50,1
73
17
,421
,221
15,7
17,9
39
13
,174
,434
17,1
70,6
51
12
,666
,097
6,74
0,23
5
6,
348,
586
-
-
Capi
tal p
roje
cts
fund
s44
,647
,155
27,2
67,2
49
32
,317
,075
31,9
75,7
00
45
,555
,272
51,5
00,0
54
44
,067
,347
34,3
30,0
86
-
-
(pos
t GAS
B 54
)No
nspe
ndab
le10
,354
,760
7,17
0,05
7Re
stric
ted
3,75
0
2,11
4,57
9Co
mm
itted
6,76
8,47
1
9,
605,
033
Assig
ned
44,7
21,7
70
34
,586
,829
Unas
signe
d-
-
To
tal a
ll oth
er g
over
nmen
tal f
unds
56,1
55,6
83$
44
,775
,365
$
48,1
67,5
59$
45,1
95,3
24$
62,7
76,4
72$
71,9
29,6
32$
62
,776
,080
$ 53
,778
,639
$ 61
,848
,751
$ 53
,476
,498
$
NOTE
S:(1
) Fun
d ba
lanc
e in
form
atio
n fo
r gov
ernm
enta
l fun
ds is
repo
rted
on th
e m
odifie
d ac
crua
l bas
is of
acc
ount
ing.
(2) C
alve
rt Co
unty
impl
emen
ted
GAS
B 54
sta
rting
with
FY2
011.

-103-
Coun
ty C
omm
issi
oner
s of
Cal
vert
Coun
ty, M
aryl
and
Chan
ges
in F
und
Bala
nce
of G
over
nmen
tal F
unds
Last
Ten
Fis
cal Y
ears
(mod
ified
acc
rual
bas
is o
f acc
ount
ing)
(una
udite
d, s
ee re
late
d no
tes
belo
w)
Sche
dule
5
FY20
03FY
2004
FY20
05FY
2006
FY20
07FY
2008
FY20
09FY
2010
FY20
11FY
2012
REVE
NUES
Taxe
s12
3,64
2,16
1$
13
8,45
6,05
8$
159,
070,
686
$
16
8,86
8,17
4$
177,
201,
666
$
18
8,24
1,05
6$
196,
977,
670
$
200,
892,
163
$
21
9,76
2,77
3$
220,
823,
988
$
Li
cens
es a
nd p
erm
its18
8,95
3
169,
960
21
6,01
4
232,
123
25
7,51
8
281,
266
23
8,14
3
32
8,67
1
292,
301
30
4,57
1
Inte
rgov
ernm
enta
l18
,128
,762
15
,855
,731
15
,758
,563
18
,350
,527
16
,779
,720
15
,069
,474
12
,250
,124
10
,635
,443
10
,939
,016
10
,137
,812
C
harg
es fo
r ser
vice
s3,
118,
582
3,23
6,32
3
3,
294,
505
2,90
0,48
7
3,
202,
758
3,67
0,16
7
3,
768,
064
3,
585,
775
3,33
7,11
1
3,
303,
365
Fine
s an
d fo
rfeitu
res
236,
545
27
3,92
0
252,
017
32
8,28
0
289,
052
35
6,04
9
319,
280
340,
061
59
8,17
5
477,
806
M
isce
llane
ous
5,18
8,80
7
3,
949,
023
7,11
0,81
6
8,
479,
435
12,0
16,6
03
12,6
25,9
51
10,7
39,9
18
8,12
3,83
1
7,
147,
229
15,4
96,2
37
Tota
l rev
enue
s15
0,50
3,81
0
16
1,94
1,01
5
18
5,70
2,60
1
19
9,15
9,02
6
20
9,74
7,31
7
22
0,24
3,96
3
22
4,29
3,19
9
22
3,90
5,94
4
24
2,07
6,60
5
25
0,54
3,77
9
EXPE
NDIT
URES
Gen
eral
gov
ernm
ent
11,3
12,2
44
11,8
02,0
03
12,7
64,6
13
14,9
70,7
98
15,3
49,8
33
16,7
36,5
65
16,0
78,9
13
15,1
89,9
84
15,5
11,1
72
16,1
64,7
78
Publ
ic s
afet
y16
,070
,048
16
,851
,428
17
,999
,869
19
,319
,261
21
,663
,919
24
,008
,176
26
,237
,282
25
,987
,152
26
,616
,262
27
,372
,685
Pu
blic
wor
ks7,
793,
754
7,16
1,35
2
6,
917,
035
7,71
5,59
2
10
,599
,520
7,
656,
572
11,2
24,9
01
10,9
84,7
25
9,10
3,25
2
9,
758,
758
Hea
lth a
nd h
ospi
tals
2,61
3,22
4
2,
569,
591
2,55
6,87
7
2,
539,
528
2,60
0,70
7
2,
667,
985
2,81
9,93
7
2,77
4,76
8
2,
627,
530
2,76
7,52
0
So
cial
ser
vice
s6,
411,
220
6,98
2,93
7
7,
184,
652
7,74
6,18
3
7,
672,
234
8,34
7,84
4
8,
765,
417
8,
957,
279
8,31
4,07
6
8,
351,
728
Educ
atio
n - o
ther
1,80
2,88
2
1,
624,
356
2,02
0,19
4
2,
391,
360
2,52
1,89
5
2,
660,
762
2,85
6,29
8
3,03
1,58
6
3,
268,
987
3,49
0,52
2
Bo
ard
of E
duca
tion
78,0
87,4
40
92,8
92,3
36
87,3
72,3
70
90,5
52,7
91
95,1
04,1
49
97,7
82,3
59
110,
611,
519
114,
137,
687
105,
010,
110
109,
059,
947
Rec
reat
ion
and
cultu
re5,
971,
106
6,57
3,89
9
6,
817,
349
7,48
8,24
4
8,
266,
634
8,90
0,44
3
9,
783,
163
9,
916,
945
10,9
87,1
98
11,2
02,6
74
Con
serv
atio
n of
nat
ural
reso
urce
s28
9,60
9
770,
448
1,
050,
019
3,23
0,18
7
1,
302,
107
1,68
1,50
7
1,
308,
871
1,
034,
321
2,61
0,09
4
3,
597,
704
Urb
an d
evel
opm
ent a
nd h
ousi
ng80
3,42
9
914,
646
94
8,48
7
1,08
3,34
9
1,
124,
533
1,23
9,21
4
1,
978,
608
1,
982,
486
1,91
4,85
7
2,
003,
182
Econ
omic
dev
elop
men
t86
7,64
2
1,23
5,26
5
1,
169,
234
1,21
1,75
2
1,
215,
905
1,06
2,99
5
1,
205,
616
1,
209,
744
1,23
4,89
1
1,
273,
769
Mis
cella
neou
s8,
641,
126
9,73
3,41
1
10
,427
,891
12
,457
,865
14
,370
,535
18
,279
,910
19
,880
,661
18
,890
,672
23
,205
,341
29
,522
,254
C
apita
l pro
ject
s11
,443
,746
12
,104
,557
11
,163
,377
20
,124
,272
24
,649
,617
20
,687
,852
24
,807
,060
21
,249
,637
16
,350
,785
21
,690
,541
D
ebt s
ervi
cePr
inci
pal r
etire
men
t5,
187,
841
5,14
1,94
6
6,
920,
962
7,94
0,39
1
8,
724,
561
9,96
7,11
1
11
,513
,920
12
,024
,609
11
,233
,501
10
,971
,736
In
tere
st2,
406,
741
2,85
3,81
9
3,
235,
987
3,31
7,09
2
3,
441,
562
4,32
6,30
6
4,
807,
328
4,
851,
414
4,63
1,14
3
5,
108,
954
Tota
l exp
endi
ture
s15
9,70
2,05
2
17
9,21
1,99
4
17
8,54
8,91
6
20
2,08
8,66
5
21
8,60
7,71
1
22
6,00
5,60
1
25
3,87
9,49
4
25
2,22
3,00
9
24
2,61
9,19
9
26
2,33
6,75
2
Exce
ss (d
efic
ienc
y) o
f rev
enue
s ov
er e
xpen
ditu
res
(9,1
98,2
42)
(1
7,27
0,97
9)
7,15
3,68
5
(2
,929
,639
)
(8,8
60,3
94)
(5
,761
,638
)
(29,
586,
295)
(28,
317,
065)
(5
42,5
94)
(11,
792,
973)
OTH
ER F
INAN
CING
SO
URCE
S (U
SES)
Proc
eeds
from
bon
d is
suan
ce45
,527
,719
8,
910,
000
6,99
5,00
0
10
,885
,000
29
,780
,000
22
,250
,000
18
,485
,000
24
,344
,988
19
,256
,000
5,
773,
720
Amou
nt d
epos
ited
in re
fund
ing
escr
ow(1
4,33
4,95
2)
-
-
-
-
-
-
(5,1
91,3
44)
-
-
Pr
emiu
m o
f iss
uanc
e of
deb
t-
-
-
-
69
2,32
2
290,
047
50
,806
74
3,43
6
1,32
6,19
9
56
8,87
2
Ref
undi
ng b
onds
issu
ed-
-
-
-
-
-
-
-
-
21
,785
,000
Pr
emiu
m o
n re
fund
ing
bond
s is
sued
-
-
-
-
-
-
-
-
-
2,42
2,13
9
Am
ount
dep
osite
d in
refu
ndin
g es
crow
-
-
-
-
-
-
-
-
-
(24,
207,
139)
Fo
rgiv
enes
s of
deb
t42
8,04
9
-
-
-
-
-
-
-
-
-
Tran
sfer
s in
- ot
her
15,1
38,7
68
13,9
31,3
33
21,7
82,8
80
18,5
65,3
70
15,9
20,1
76
10,1
80,7
40
14,0
92,6
43
10,2
96,0
56
11,3
55,5
42
11,9
66,3
87
Tran
sfer
s ou
t - o
ther
(16,
899,
797)
(1
6,04
3,22
6)
(23,
852,
306)
(2
0,71
7,25
8)
(18,
411,
229)
(1
3,01
2,87
9)
(20,
631,
644)
(13,
399,
945)
(1
4,03
1,52
2)
(14,
915,
640)
To
tal o
ther
fina
ncin
g so
urce
s (u
ses)
29,8
59,7
87
6,79
8,10
7
4,
925,
574
8,73
3,11
2
27
,981
,269
19
,707
,908
11
,996
,805
16
,793
,191
17
,906
,219
3,
393,
339
Net
cha
nge
in fu
nd b
alan
ces
20,6
61,5
45$
(10,
472,
872)
$
12
,079
,259
$
5,
803,
473
$
19
,120
,875
$
13
,946
,270
$
(1
7,58
9,49
0)$
(1
1,52
3,87
2)$
17,3
63,6
25$
(8,3
99,6
34)
$
Deb
t ser
vice
as
a pe
rcen
tage
of n
onca
pita
l exp
endi
ture
s5.
33%
5.02
%6.
32%
6.93
%7.
18%
7.64
%8.
80%
8.76
%7.
50%
6.86
%(3
)(3
)(3
)(3
)(3
)(3
)(3
)(3
)(3
)N
OTE
S:(1
) Gov
ernm
enta
l fun
d in
form
atio
n is
repo
rted
on th
e m
odifi
ed a
ccru
al b
asis
of a
ccou
ntin
g.(1
) Deb
t ser
vice
repr
esen
ts d
ebt s
ervi
ce p
rinci
pal,
inte
rest
and
any
pro
ceed
s of
bon
d is
suan
ce.
(2) N
onca
pita
l exp
endi
ture
s co
mes
from
the
reco
ncilia
tion
of th
e st
atem
ent o
f rev
enue
s, e
xpen
ditu
res
and
chan
ges
in fu
nd b
alan
ce o
f the
gov
ernm
enta
l fun
ds to
the
stat
emen
t of a
ctiv
ities
. (3
) Cal
cula
tion
base
d on
Exp
ense
s m
inus
Cap
ital O
utla
ys p
g. 2
1 di
vide
d by
deb
t ser
vice
.

The following schedules contain information to help the reader access the government’s most significant local revenue source, property taxes.
The revenue capacity schedules are: • Assessed and estimated actual value of taxable property• Direct and overlapping real property tax rates• Principal property taxpayers• Summary of property tax levies and collections
COUNTY COMMISSIONERS OF CALVERT COUNTYCALVERT COUNTY, MARYLAND
REVENUE CAPACITYJUNE 30, 2012

-104-
Coun
ty C
omm
issi
oner
s of
Cal
vert
Coun
ty, M
aryl
and
Asse
ssed
and
Est
imat
ed A
ctua
l Val
ue o
f Tax
able
Pro
perty
Last
Ten
Fis
cal Y
ears
(una
udite
d, s
ee re
late
d no
tes
belo
w)
Sche
dule
6
% T
axab
le
Rea
l Pro
perty
Pers
onal
Pro
perty
Tota
lAs
sess
ed to
Taxa
ble
Taxa
ble
tota
lFi
scal
Asse
ssed
Ex
empt
Asse
ssed
Dire
ctAs
sess
ed
Estim
ated
Dire
ctAs
sess
ed
Asse
ssed
Estim
ated
Dire
ctEs
timat
ed
Year
Valu
ePr
oper
tyVa
lue
Rat
eVa
lue
Actu
al V
alue
Rat
eVa
lue
Valu
eAc
tual
Val
ueR
ate
Actu
al V
alue
2003
6,07
2,54
9,17
9
495,
002,
976
5,57
7,54
6,20
3
0.89
2
82
2,60
6,88
0
82
2,60
6,88
0
2.
23
6,89
5,15
6,05
9
6,40
0,15
3,08
3
6,89
5,15
6,05
9
1.06
40
92
.82%
2004
6,53
1,07
6,13
5
563,
391,
239
5,96
7,68
4,89
6
0.89
2
88
2,39
3,92
0
88
2,39
3,92
0
2.
23
7,41
3,47
0,05
5
6,85
0,07
8,81
6
7,41
3,47
0,05
5
1.06
44
92
.40%
2005
7,09
3,44
0,83
5
570,
848,
991
6,52
2,59
1,84
4
0.89
2
1,
026,
470,
460
1,
026,
470,
460
2.
23
8,11
9,91
1,29
5
7,54
9,06
2,30
4
8,11
9,91
1,29
5
1.07
39
92
.97%
2006
7,95
0,40
8,15
3
594,
754,
848
7,35
5,65
3,30
5
0.89
2
1,
087,
505,
840
1,
087,
505,
840
2.
23
9,03
7,91
3,99
3
8,44
3,15
9,14
5
9,03
7,91
3,99
3
1.06
43
93
.42%
2007
9,28
6,51
2,82
0
656,
267,
485
8,63
0,24
5,33
5
0.89
2
1,
123,
614,
063
1,
123,
614,
063
2.
23
10,4
10,1
26,8
83
9,
753,
859,
398
10
,410
,126
,883
1.04
61
93
.70%
2008
11,4
64,5
56,2
20
788,
968,
756
10,6
75,5
87,4
64
0.
892
1,05
2,40
5,75
0
1,05
2,40
5,75
0
2.23
12
,516
,961
,970
11,7
27,9
93,2
14
12
,516
,961
,970
1.01
21
93
.70%
2009
(1)
14,2
23,3
48,9
81
888,
112,
994
13,3
35,2
35,9
87
0.
892
(1)
470,
449,
610
470,
449,
610
2.23
14
,693
,798
,591
13,8
05,6
85,5
97
14
,693
,798
,591
0.93
76
93
.96%
2010
15,5
71,9
90,0
76
987,
183,
072
14,5
84,8
07,0
04
0.
892
504,
475,
135
504,
475,
135
2.23
16
,076
,465
,211
15,0
89,2
82,1
39
16
,076
,465
,211
0.93
67
93
.86%
2011
14,3
34,9
49,4
86
1,02
2,42
0,83
1
13,3
12,5
28,6
55
0.
892
874,
351,
230
874,
351,
230
2.23
15
,209
,300
,716
14,1
86,8
79,8
85
15
,209
,300
,716
0.97
45
93
.28%
2012
13,4
73,1
42,4
94
1,03
0,93
6,26
9
12,4
42,2
06,2
25
0.
892
921,
126,
040
921,
126,
040
2.23
14
,394
,268
,534
13,3
63,3
32,2
65
14
,394
,268
,534
0.98
42
92
.84%
NO
TES:
(1) A
sig
nific
ant p
ortio
n of
Con
stel
latio
n En
ergy
's as
sess
able
bas
e w
as re
clas
sifie
d fro
m p
erso
nal p
rope
rty to
real
pro
perty
.
Sour
ce: S
tate
of M
aryl
and,
Dep
artm
ent o
f Ass
esm
ents
and
Tax
atio
n

-105-
County Commissioners of Calvert County, MarylandDirect and Overlapping Property Tax Rates (Per $100 of Assessed Value)Last Ten Fiscal Years
(unaudited, see related notes below)Schedule 7
County Town County TownRate (1) Rate (1) Rate (1) Rate (1)
Total Town of Town of TotalFiscal Calvert Town of Town of Direct and Chesapeake Chesapeake Direct andYear County North Beach North Beach Overlapping Beach Beach Overlapping2003 0.892 0.556 0.72 1.276 0.556 0.50 1.062004 0.892 0.556 0.72 1.276 0.556 0.50 1.062005 0.892 0.556 0.72 1.276 0.556 0.50 1.062006 0.892 0.556 0.72 1.276 0.556 0.50 1.062007 0.892 0.556 0.67 1.226 0.556 0.44 1.002008 0.892 0.556 0.67 1.226 0.556 0.44 1.002009 0.892 0.556 0.61 1.166 0.556 0.37 0.932010 0.892 0.556 0.61 1.166 0.556 0.37 0.932011 0.892 0.556 0.63 1.186 0.556 0.37 0.932012 0.892 0.556 0.63 1.186 0.556 0.36 0.92
NOTES:(1) Towns of North Beach and Chesapeake Beach pay only the overlapping rates for County and Townrespectively.
Overlapping RatesOverlapping Rates

-106-
Coun
ty C
omm
issi
oner
s of
Cal
vert
Coun
ty, M
aryl
and
Prin
cipa
l Pro
perty
Tax
paye
rsCu
rren
t Yea
r and
Nin
e Ye
ars
Ago
(una
udite
d, s
ee re
late
d no
tes
belo
w)
Sche
dule
8
Perc
enta
ge o
fPe
rcen
tage
of
Taxa
ble
Tota
l Tax
able
Taxa
ble
Tota
l Tax
able
Nam
e of
Tax
paye
r A
sses
ed V
alue
(1)
Rank
Asse
ssed
Val
ue A
sses
ed V
alue
(2)
Rank
Asse
ssed
Val
ueCo
nste
llatio
n En
ergy
Gro
up1,
286,
711,
557
$
(3
)
1
9.63
%57
0,09
2,35
0$
28.
91%
Dom
inio
n (C
ove
Poin
t)67
9,37
4,79
0
2
5.08
%88
,055
,900
11.
38%
Sout
hern
Mar
yland
Ele
ctric
Co.
36,4
34,6
00
30.
27%
40,5
51,2
30
3
0.63
%As
bury
-Sol
omon
s31
,374
,500
4
0.23
%32
,743
,600
50.
51%
Fox
Run
Ltd.
Par
tner
ship
28,6
52,8
00
50.
21%
23,5
79,2
00
6
Hold
iay
Inn
- Sol
omon
s26
,557
,100
6
0.20
%17
,886
,400
70.
28%
Dunk
irk G
atew
ay24
,077
,500
7
0.18
%Ve
rizon
23,7
38,2
30
80.
18%
36,2
15,4
30
4
0.57
%M
arke
t Squ
are
Shop
ping
Cen
ter
16,1
17,7
33
90.
12%
Dunk
irk M
arke
t Pla
ce11
,438
,700
10
0.09
%8,
527,
800
90.
13%
Calve
rt Co
unty
Hos
pita
l7,
901,
000
100.
12%
Town
Squ
are
Shop
ping
Cen
ter
9,01
8,60
0
8
0.14
%2,
164,
477,
510
$
16
.20%
834,
571,
510
$
12
.67%
NOTE
S:(1
) Sou
rce:
Mar
yland
Sta
te D
epar
tmen
t of A
sses
smen
ts a
nd T
axat
ion
(2) S
ourc
e: D
epar
tmen
t of F
inan
ce a
nd B
udge
t(3
) Est
imat
ed v
alue
due
to c
hang
es in
Mar
yland
pro
perty
tax
law
durin
g FY
08 a
PIL
OT
(pay
men
ts in
lieu
of ta
xes)
agr
eem
ent w
as
ent
ered
into
with
Con
stel
latio
n wh
ich c
hang
ed th
e ta
xabl
e as
sess
men
t.FY12
FY03

-107-
County Commissioners of Calvert County, MarylandSummary of Property Tax Levies and CollectionsLast Ten Fiscal Years (unaudited)Schedule 9
Total Tax Collections inFiscal Levy for Percent Subsequent PercentYear Fiscal Year Amount of levy Years Amount of Levy2003 66,188,158 64,420,874 97.33% 1,693,931 66,114,805 99.89%2004 71,093,332 69,525,551 97.79% 1,464,226 70,989,777 99.85%2005 78,990,817 77,613,438 98.26% 1,294,300 78,907,738 99.89%2006 87,749,160 86,285,379 98.33% 1,308,330 87,593,709 99.82%2007 99,359,697 97,787,042 98.42% 1,377,991 99,165,033 99.80%2008 115,850,743 113,954,907 98.36% 1,842,551 115,797,458 99.95%2009 126,099,233 123,501,219 97.94% 2,094,900 125,596,119 99.60%2010 137,446,533 133,596,703 97.20% 2,468,876 136,065,579 99.00%2011 134,047,010 130,037,865 97.01% 2,578,268 132,616,133 98.93%2012 128,140,153 125,344,923 97.82% 4,644,889 129,989,812 101.44%
Total Collections to DateFiscal Year of the LevyCollected within the

“THIS PAGE LEFT INTENTIONALLY BLANK”

COUNTY COMMISSIONERS OF CALVERT COUNTYCALVERT COUNTY, MARYLAND
DEBT CAPACITYJUNE 30, 2012
The following schedules present information to help the reader access the affordability of government’s current levels of outstanding debt and government’s ability to issue additional debt in the future.
The debt capacity schedules are: • Ratios of outstanding debt by type• Ratios of net general bonded debt per capita• Pledged-revenue coverage

-108-
Coun
ty C
omm
issi
oner
s of
Cal
vert
Coun
ty, M
aryl
and
Ratio
s of
Out
stan
ding
Deb
t by
Type
La
st T
en F
isca
l Yea
rs(in
thou
sand
s of
dol
lars
, exc
ept p
er c
apita
)(u
naud
ited,
see
rela
ted
note
s be
low
)Sc
hedu
le 1
0
Gen
eral
Gen
eral
Tota
lPe
rcen
tage
Deb
tFi
scal
Obl
igat
ion
Offi
ceN
otes
Obl
igat
ion
Out
stan
ding
of P
erso
nal
Per
Year
Bond
sBu
ildin
gLe
vera
ging
Mis
c.Pa
yabl
eBo
nds
Deb
tIn
com
e (a
)Po
pula
tion
Cap
ita20
0370
,740
4,
295
5,
589
3,11
7
10,1
57
7,
253
101,
151
3.57
%81
,600
1,24
020
0475
,290
3,
830
5,
931
2,79
7
9,88
5
6,71
5
10
4,44
8
3.
42%
83,4
00
1,
252
2005
76,1
78
3,34
5
5,93
1
2,
528
9,
461
6,
055
103,
498
3.15
%84
,900
1,21
920
0679
,973
2,
840
6,
882
2,17
0
8,84
1
5,16
9
10
5,87
5
3.
03%
86,2
00
1,
228
2007
101,
907
2,32
0
7,96
1
1,
800
8,
248
4,
057
126,
293
3.40
%87
,100
1,45
020
0811
5,09
9
1,
775
10
,414
1,42
1
8,17
6
3,01
8
13
9,90
3
3.
55%
87,7
00
1,
595
2009
123,
013
1,21
0
10,4
14
1,
029
8,
152
1,
927
145,
745
3.68
%88
,100
1,65
420
1012
6,01
9
62
0
10
,414
621
7,61
2
3,87
1
14
9,15
7
3.
63%
88,7
37
1,
681
2011
134,
451
-
10,6
12
19
8
6,
934
7,
335
159,
530
N/A
(2)
89,0
00
1,
792
2012
129,
402
-
7,93
3
15
9
6,
413
10
,823
154,
730
N/A
(2)
89,9
51
1,
720
NO
TES:
(1) S
ee th
e D
emog
raph
ic a
nd E
cono
mic
Sta
tistic
s sc
hedu
le fo
r per
sona
l inc
ome.
(2) N
/A -
curre
nt d
ata
is n
ot a
vaila
ble
at th
is ti
me.
Gov
ernm
enta
l Act
ivity
Busi
ness
Typ
e Ac
tivity

-109-
Coun
ty C
omm
issi
oner
s of
Cal
vert
Coun
ty, M
aryl
and
Ratio
of N
et G
ener
al B
onde
d De
bt to
Ass
esse
d Va
lue
and
Ne
t Bon
ded
Debt
Per
Cap
itaLa
st T
en F
isca
l Yea
rs(u
naud
ited)
Sche
dule
11
Taxa
ble
Taxa
ble
Rat
io o
f Net
Asse
ssed
Val
ueAs
sess
ed V
alue
Self
Net
Bond
ed D
ebt
Net
Rea
l & P
erso
nal
Fisc
alR
eal &
Per
sona
lG
ross
Su
ppor
ting
Bond
edto
Ass
esse
dBo
nded
Deb
tPr
oper
tyYe
arPo
pula
tion
Prop
erty
Bond
ed D
ebt
Deb
t (1)
Deb
tVa
lue
Per C
apita
Per C
apita
2003
81,6
00
6,
400,
153,
083
78
,151
,519
4,
665,
831
73,4
85,6
88
1.
15%
901
78
,433
2004
83,4
00
6,
850,
078,
816
81
,916
,937
4,
175,
533
77,7
41,4
04
1.
13%
932
82
,135
2005
84,9
00
7,
549,
062,
304
82
,051
,874
3,
697,
306
78,3
54,5
68
1.
04%
923
88
,917
2006
86,2
00
8,
193,
159,
145
99
,150
,704
3,
158,
657
95,9
92,0
47
1.
17%
1,11
4
95
,048
2007
87,1
00
9,
753,
859,
398
11
8,26
9,86
8
2,
606,
446
115,
663,
422
1.
19%
1,32
8
11
1,98
5
2008
87,7
00
11
,464
,556
,220
12
9,31
1,37
4
2,
035,
916
127,
275,
458
1.
11%
1,45
1
13
0,72
5
2009
88,1
00
13
,805
,685
,597
13
5,33
8,42
6
1,
456,
138
133,
882,
288
0.
97%
1,52
0
15
6,70
5
2010
88,7
37
15
,089
,282
,139
13
1,13
1,13
5
82
9,85
6
130,
301,
279
0.
86%
1,46
8
17
0,04
5
2011
89,0
00
14
,186
,879
,885
14
1,78
5,91
6
18
4,32
5
141,
601,
591
1.
00%
1,59
1
15
9,40
3
2012
89,9
51
13
,363
,332
,265
14
0,22
5,70
1
15
8,79
4
140,
066,
907
1.
05%
1,55
7
14
8,56
2
NO
TES:
(1) -
Incl
udes
Wat
erw
ay Im
prov
emen
t, Sh
ore
Eros
ion
and
Stat
e O
ffice
Bui
ldin
g D
ebt.
(Sta
te O
ffice
Bui
ldin
g co
mpl
eted
in F
Y201
0)

-110-
Coun
ty C
omm
issi
oner
s of
Cal
vert
Coun
ty, M
aryl
and
Pled
ged-
Reve
nue
Cove
rage
Last
Ten
Fis
cal Y
ears
(una
udite
d)Sc
hedu
le 1
2
Stat
e O
ffice
Shor
eW
ater
way
Fisc
alBu
ildin
g Er
osio
nIm
prov
emen
tYe
arRe
ceip
tsPr
incip
alIn
tere
stCo
vera
geBi
lled
Prin
cipal
Inte
rest
Cove
rage
Bille
dPr
incip
alIn
tere
stCo
vera
ge20
0363
4,26
6
45
0,00
0
184,
266
1.
0027
,012
19,9
22
-
1.
366,
837
8,
122
-
0.84
2004
632,
106
465,
000
16
7,10
6
1.00
27,0
12
19
,922
-
1.36
6,83
7
8,12
2
-
0.
8420
0563
3,81
4
48
5,00
0
148,
814
1.
0026
,258
23,3
22
-
1.
136,
837
8,
122
-
0.84
2006
634,
509
505,
000
12
9,50
9
1.00
26,2
58
23
,322
-
1.13
6,83
7
6,67
6-
1.02
2007
629,
261
520,
000
10
9,26
1
1.00
26,2
58
23
,322
-
1.13
-
-
-
0.00
2008
632,
621
545,
000
87
,621
1.00
26,2
58
23
,322
-
1.13
-
-
-
0.00
2009
629,
515
565,
000
64
,515
1.00
26,2
58
23
,322
-
1.13
-
-
-
0.00
2010
629,
965
590,
000
39
,965
1.00
26,2
58
23
,322
-
1.13
-
-
-
0.00
2011
-
-
-
-
26
,258
23,3
22-
1.
13-
-
-0.
0020
12-
-
-
-
26,2
58
23
,322
-
1.13
-
-
-
0.00
(1) S
tate
Offi
ce B
uild
ing
agre
emen
t was
com
plet
ed in
FY2
010.
Wat
erwa
y Im
prov
emen
t Bon
ds
Debt
Ser
vice
Debt
Ser
vice
Stat
e O
ffice
Bui
ldin
g (1
)
Debt
Ser
vice
Shor
e Er
osio
n Bo
nds

The following schedules offer demographic and economic indicators to help the reader understand the environment within which the government’s financial activities take place, and to understand economic trends.
The demographic and economic schedules are:• Demographic and economic statistics• Principal employers
COUNTY COMMISSIONERS OF CALVERT COUNTYCALVERT COUNTY, MARYLAND
DEMOGRAPHIC AND ECONOMIC INFORMATIONJUNE 30, 2012

-111-
County Commissioners of Calvert County, MarylandDemographic and Economic StatisticsLast Ten Fiscal Years(unaudited, see related notes below)Schedule 13
PublicPersonal Civilian Unemploy- School
Fiscal Income Per Capita Labor ment Rate EnrollmentYear Population (1) ($ thousands)(1) Income (1) Force (2) Percent (2) (3)2003 83,007 2,834,014 32,950 41,365 3.00% 16,745 2004 84,928 3,051,852 34,465 42,339 2.80% 16,904 2005 86,294 3,286,123 36,706 45,503 3.40% 16,842 2006 87,043 3,492,251 38,396 47,085 3.50% 17,113 2007 87,445 3,714,419 40,392 47,448 3.60% 17,468 2008 87,788 3,944,776 42,561 48,265 3.70% 17,029 2009 88,244 3,955,122 42,716 47,347 6.40% 16,729 2010 88,912 4,103,932 44,193 48,220 6.80% 16,406 2011 89,256 N/A N/A 48,070 6.40% 16,305 2012 89,951 N/A N/A 47,997 6.20% 16,136
NOTES:(1) Source: Maryland Department of Planning, planning data sources from U.S. Bureau of Economic Analysis(2) Source: U.S. Department of Labor Bureau of Labor Statistics(3) Source: Calvert County Public Schools Budget Book
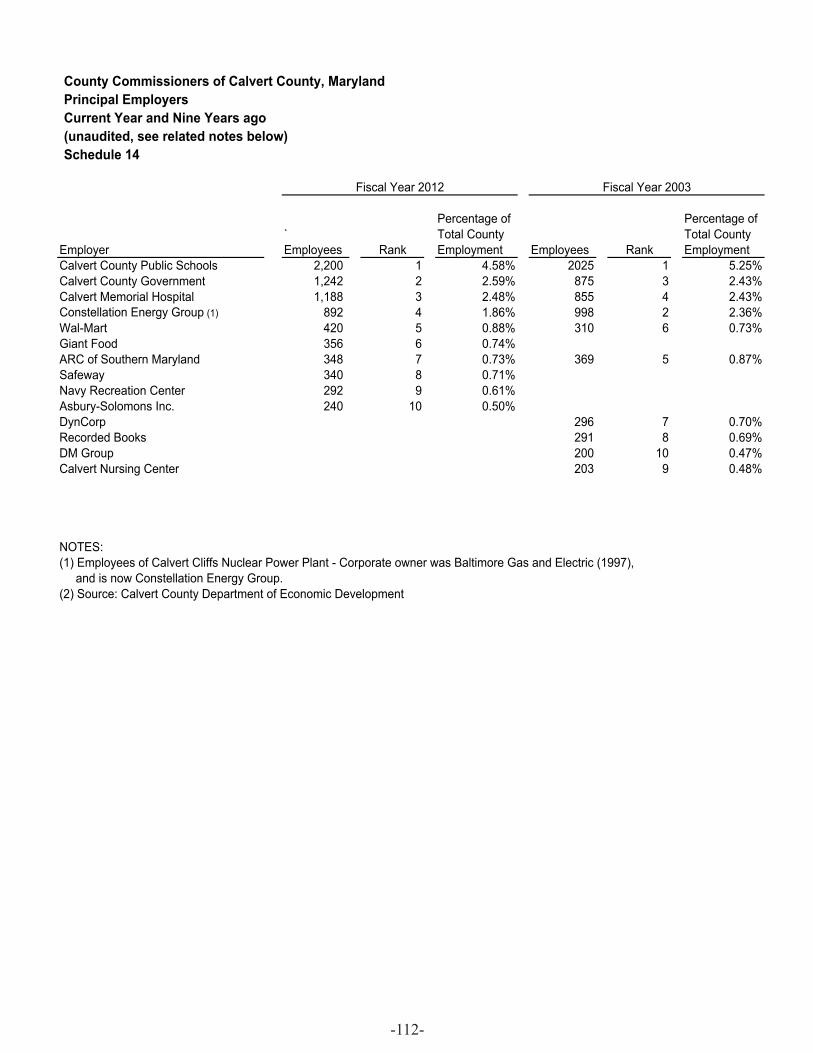
-112-
County Commissioners of Calvert County, MarylandPrincipal EmployersCurrent Year and Nine Years ago(unaudited, see related notes below)Schedule 14
Percentage of Percentage of` Total County Total County
Employer Employees Rank Employment Employees Rank EmploymentCalvert County Public Schools 2,200 1 4.58% 2025 1 5.25%Calvert County Government 1,242 2 2.59% 875 3 2.43%Calvert Memorial Hospital 1,188 3 2.48% 855 4 2.43%Constellation Energy Group (1) 892 4 1.86% 998 2 2.36%Wal-Mart 420 5 0.88% 310 6 0.73%Giant Food 356 6 0.74%ARC of Southern Maryland 348 7 0.73% 369 5 0.87%Safeway 340 8 0.71%Navy Recreation Center 292 9 0.61%Asbury-Solomons Inc. 240 10 0.50%DynCorp 296 7 0.70%Recorded Books 291 8 0.69%DM Group 200 10 0.47%Calvert Nursing Center 203 9 0.48%
NOTES:(1) Employees of Calvert Cliffs Nuclear Power Plant - Corporate owner was Baltimore Gas and Electric (1997), and is now Constellation Energy Group.(2) Source: Calvert County Department of Economic Development
Fiscal Year 2012 Fiscal Year 2003

“THIS PAGE LEFT INTENTIONALLY BLANK”

COUNTY COMMISSIONERS OF CALVERT COUNTYCALVERT COUNTY, MARYLAND
OPERATING INFORMATIONJUNE 30, 2012
The following schedules contain service and infrastructure data that demonstrates how the information in the government’s financial report relates to the services the government provides and the activities it performs.
The operating information schedules are: • Full-time Calvert County employees by function• Operating indicators by function• Capital asset statistics by function

-113-
County Commissioners of Calvert County, MarylandFull-time Calvert County Employees by FunctionLast Eight Fiscal Years(see related notes below)Schedule 15
Function: FY2005 FY2006 FY2007 FY2008 FY2009 FY2010 FY2011 FY2012General Government Commissioners 7 7 7 6 6 6 6 6 Circuit court 10 10 10.7 10.9 10.9 10.9 10.9 10.9 Clerk of the commissioners 1 1 1 1 1 1 1 1 County administration 2 2 3 3 3 3 3 2 County attorney 3 3 4 4 4 4 4 4 Treasurers 6 6 7.6 7.6 7.6 7.6 7.6 7.6 Election 8 9 9 9 9 9 9 6 Finance 20 22 22.6 22.6 23.6 23.6 23.6 25.6 General services 2 2 2 2 2 4 5 5 Buildings and grounds 26 28 31.7 32.7 32.7 32.7 32.7 31.7 Orphans court 3 3 3 3 3 3 3 3 Personnel 5 6 7.6 7.6 8.6 8.6 8.6 8.6 States attorney 18 18 20.1 20.1 20.1 21.1 22.1 22.1 Technology services 17 17 18.6 19.6 21.8 21.8 21.8 22.8
Public Safety Transportation 1 2 2.8 2.8 2.8 2.8 2.8 2.8 Mosquito control 1 1 4.1 4.1 4.1 4.1 4.1 4.1 Public safety 2 2 2 2 2 2 2 2 Control center 25 29 30 30 30 30 30 34 Emergency management 2 2 3 3 3 3 3 3 Fire and rescue 3 4 4 4 4 4.5 5.5 5.5 Inspections and permits 13 13 14.2 14.2 14.2 14.2 14.2 14.2 Animal control 5 5 5 6 7 7 7 7 Detention center 64 65 67 77.6 81.6 81.6 85.6 88.6 Sheriffs office 105 115 131.2 134.2 139.2 139.2 142.2 146.2 Liquor board 3 3 3 3 3 3.2 3.2 5
Public Works Public works 14 14 16.6 16.6 16.6 14.6 15.2 15.2 Planning commission 1 1 2 1 1 10.1 10 10 Project anagement 8 8 8 8 7 7 7 7 Fleet maintenance 7 8 9 9 10 10 10 10 Highway maintenance 33 33 33.6 33.6 36.6 36.6 36 36
Social Services Community resources 4 4 4.5 4.5 4.5 4.5 4.5 5 Office on aging 23 23 23.5 24.6 24.6 24.6 24.6 24.6
Recreation Marine museum 36 36 40.2 40.2 40.2 40.2 40.2 40.2 Railway museum 1 1 2 2 2 2 2 2 Recreation programs 59 62 68.7 69.7 70 70.7 68.6 69.2
Library 45.3 45.3 50.2 52.2 52.2 52.8 52.8 62
Conservation of Natural Resources 12 13.2 13.2 13.2 13.2 13.2 13.2 13.7
Soil Conservation 4 4 4 4 5 5 5 5
Urban Development Planning and zoning 21 21 26.1 26.1 16.1 16.1 16.1 16.1
Economic Development 8 9 9.1 10.1 12.1 12.1 12.5 12.5
Water and Sewer 30 30 30 33 34 33 33 32
Solid Waste 32 33 36.8 37.8 37.8 38.8 38.8 41.3
Chesapeake Hills Golf Course - - - - - 10.9 10.9 10.9
Total 690.3 720.5 791.7 815.6 827.1 850.1 858.3 881.4
NOTES:(1) Source: Calvert County's Adopted Operating and Capital Budgets FY2005-FY2012

-114-
County Commissioners of Calvert County, MarylandOperating Indicators by FunctionLast Ten Fiscal Years(unaudited, see related notes)Schedule 16
FY2003 FY2004 FY2005 FY2006 FY2007 FY2008 FY2009 FY2010 FY2011 FY2012Function: Actual Actual Actual Actual Actual Actual Actual Actual Actual ActualGeneral Government Circuit court Case transactions 5,927 6,680 7,007 9,763 12,028 13,884 14,363 15,123 16,085 16,981 Technology services Work orders completed N/A N/A N/A 3,945 4,348 4,124 4,050 3,375 4,209 4,300 Support to desktop/laptop computers N/A N/A N/A 512 665 750 795 835 875 930 Treasurers office Credit card dollars collected 55,692 146,477 182,444 300,051 283,659 480,062 466,182 537,611 598,705 630,000 Credit card transactions 58 139 168 287 247 323 291 346 363 380 Real estate tax bills N/A 39,765 40,468 40,988 41,265 41,390 41,757 42,236 42,297 42,327 Finance and budget Purchase orders processed 5,916 5,632 5,641 6,705 7,046 7,291 7,273 6,717 6,759 6,780 Accounts payable checks 15,374 15,949 15,493 15,015 17,050 16,349 15,693 14,852 15,334 14,834 Average number of employees per pay 860 906 930 936 945 992 1,017 1,049 1,112 1,130 Fixed assets maintained 12,491 13,326 14,551 15,364 15,973 14,503 15,255 15,804 16,749 16,900 Health care benefits managed 667 692 717 738 935 958 997 1,021 1,020 1,030
Public Safety Transportation Yearly ridership 108,094 107,753 113,354 132,648 132,728 133,270 134,786 109,705 135,500 109,658 Inspections and permits Building permits issued 2,410 2,430 2,425 2,504 2,098 1,812 1,428 1,472 1,492 1,689 Grading permits issued 1,256 1,053 855 820 717 672 707 672 783 795 Electrical permits issued 2,298 2,007 2,424 2,438 1,986 1,666 1,425 1,471 1,437 1,659 Plumbing permits issued 1,746 1,625 1,667 1,279 1,074 943 757 744 873 870 Control center Number of incidents handled 106,560 N/A 117,936 130,478 148,947 160,063 164,807 151,224 140,031 147,033 Fire and rescue Total calls responded 16,100 16,500 16,900 17,560 19,747 20,743 20,021 19,708 21,000 21,000 Animal control Calls for service 4,955 5,103 5,354 7,377 7,506 8,139 8,063 5,601 6,129 6,500 Detention center Average daily population 181 212 227 212 238 228 237 288 233 240 Work release (adp) 69 74 73 68 75 85 67 39 32 27 Sheriff's office Calls for service 49,148 54,789 71,959 65,454 76,223 85,941 83,062 84,513 87,045 89,659 Murder cases 2 1 1 - 2 1 - - - - Rape cases 7 8 11 4 - 6 10 17 10 10 Robbery cases 15 10 20 9 16 15 27 26 27 29 Aggravated assault cases 177 120 121 171 173 272 187 123 56 56 Theft cases 753 677 899 935 947 1,051 1,067 1,204 1,100 1,100 Auto theft cases 69 62 65 77 92 92 82 92 55 55 Domestic violence incidents responded to N/A N/A N/A 1,103 1,189 1,231 1,203 1,287 1,325 1,364 Business & community patrol checks N/A N/A N/A 23,414 30,419 38,032 35,538 33,977 29,724 30,615 Sex offenders registered in Calvert County N/A N/A N/A 99 108 110 103 107 109 112 School related incidents/investigations N/A N/A N/A 351 403 293 333 1,574 1,621 1,669
Public Works Major and minor subdivisions 1,073 989 1,040 205 227 175 143 149 196 196 Road plans 48 67 120 32 33 41 17 24 30 30 Project management Miles of roadway resurfaced 20 17 13 11 13 15 14 12 8 8 Fleet maintenance Work orders 2,350 2,500 2,600 2,226 2,211 2,371 3,529 2,837 3,500 3,600
Recreation Public library Circulation of materials 808,178 879,152 930,098 920,727 962,246 * 1,035,223 1,114,737 1,154,634 1,153,773 1,142,301 Railway museum Outreach participants N/A 3,300 3,924 3,621 3,900 4,000 4,100 4,150 4,200 4,200 Participants in programs N/A N/A N/A N/A 2,547 2,434 3,569 5,118 4,200 4,200
Urban Development Planning and zoning Major and minor subdivisions (new applications) 60 49 47 47 63 40 21 34 45 45
Water and Sewer Number of customers N/A N/A N/A 4,587 4,788 4,799 5,037 5,076 5,104 5,153
NOTES:(1) Source: Calvert County's Adopted Operating and Capital Budget FY2002-2012(2) Source: Calvert County Sheriff's Office

-115-
County Commissioners of Calvert County, MarylandCapital Asset Statistics by FunctionLast Eight Fiscal Years(unaudited, see related notes below)Schedule 17
Function: FY2005 FY2006 FY2007 FY2008 FY2009 FY2010 FY2011 FY2012Public Safety Police: Stations 1 1 1 1 1 1 1 1 Patrol units 89 115 115 120 141 140 141 141 Special purpose units 0 0 0 0 0 5 6 6 Fire protection: Fire stations 7 7 7 7 7 5 6 6 Pumpers 12 12 12 12 12 12 12 12 Ambulances 15 15 15 15 15 14 14 14 Rescue trucks 6 6 6 6 6 7 7 6 Aerial trucks/towers 3 3 3 3 3 3 3 3 Brush units 12 12 12 12 12 13 13 13 Tankers 5 5 5 5 5 5 5 5 Jet skis 2 2 2 2 2 2 2 2 Dive rescue van 1 1 1 1 1 1 1 1 Fire-rescue boats 3 3 3 3 3 3 3 3 Mass casualty unit/trailer 1 1 1 1 1 1 1 1 Inflatable boats 6 6 6 6 6 6 6 6 Paramedic units 5 5 5 5 5 5 5 5 Air cascade units 0 0 1 1 1 2 2 2 Other utility types 24 24 24 24 24 25 25 25
Community Resources Transportation: Passenger buses 17 17 18 18 17 17 17 17
Public Works County owned streets in miles 435 446 446 446 446 452 452 452
Recreation Baseball fields 20 20 20 20 20 20 20 20 Football fields 7 7 7 7 7 7 7 7 Basketball courts 6 6 6 6 6 6 6 6 Tennis courts 10 10 10 10 10 10 10 12 Pools 1 2 2 2 2 3 3 3 Golf course 0 0 0 0 0 1 1 1 Playgrounds and parks in acres 360 360 360 360 360 360 375 375
Water and Sewer Water mains in miles 75 75 75 75 75 77 77 77 Water systems 21 21 21 21 21 21 21 20 Storage tanks 14 14 14 14 14 14 14 14 Sewer mains in miles 66 66 66 66 66 66 66 66 Sewer treatment plants 9 9 9 9 9 9 9 8 Sewer pumping stations 27 27 27 27 39 39 39 39
NOTES:(1) Source: Various county departments