
Anne Arundel County, Maryland
166
Anne Arundel County, Maryland Comprehensive Annual Financial Report For the Fiscal Year Ended June 30, 2007 County Executive John R. Leopold County Council Ronald C. Dillon, Jr. – Chairperson C. Edward Middlebrooks – Vice-Chairperson Daryl Jones G. James Benoit, Jr. Cathleen M. Vitale Joshua J. Cohen Edward R. Reilly Prepared by: Office of Finance - William R. Brown, Jr., Controller
-
Upload
khangminh22 -
Category
Documents
-
view
1 -
download
0
Transcript of Anne Arundel County, Maryland

Anne Arundel County, Maryland
Comprehensive Annual Financial Report
For the Fiscal Year Ended June 30, 2007
County Executive
John R. Leopold
County Council
Ronald C. Dillon, Jr. – Chairperson C. Edward Middlebrooks – Vice-Chairperson
Daryl Jones G. James Benoit, Jr. Cathleen M. Vitale
Joshua J. Cohen Edward R. Reilly
Prepared by: Office of Finance - William R. Brown, Jr., Controller

Anne Arundel County, MarylandComprehensive Annual Financial ReportFor the Fiscal Year Ended June 30, 2007
Table of Contents
Introductory SectionTransmittal Letter . . . . . . . . . . . . . . . . . . . . . . . . . . . . . . . . . . . . . . . . . . . . . . . . . . . . . . . . . . . . . . . . . . . . . . . . . . . . . . . . . . . . . . . . . . . . . . . . . . 1GFOA Certificate of Achievement . . . . . . . . . . . . . . . . . . . . . . . . . . . . . . . . . . . . . . . . . . . . . . . . . . . . . . . . . . . . . . . . . . . . . . . . . . . . . . . . . . . . . 7Organizational Chart . . . . . . . . . . . . . . . . . . . . . . . . . . . . . . . . . . . . . . . . . . . . . . . . . . . . . . . . . . . . . . . . . . . . . . . . . . . . . . . . . . . . . . . . . . . . . . . . 8
Financial SectionIndependent Auditor's Report . . . . . . . . . . . . . . . . . . . . . . . . . . . . . . . . . . . . . . . . . . . . . . . . . . . . . . . . . . . . . . . . . . . . . . . . . . . . . . . . . . . . . . . . . 9County Auditor's Report . . . . . . . . . . . . . . . . . . . . . . . . . . . . . . . . . . . . . . . . . . . . . . . . . . . . . . . . . . . . . . . . . . . . . . . . . . . . . . . . . . . . . . . . . . . . . 11Management Discussion and Analysis . . . . . . . . . . . . . . . . . . . . . . . . . . . . . . . . . . . . . . . . . . . . . . . . . . . . . . . . . . . . . . . . . . . . . . . . . . . . . . . . . . 13Basic Financial Statements
Government-wide Financial StatementsStatement of Net Assets . . . . . . . . . . . . . . . . . . . . . . . . . . . . . . . . . . . . . . . . . . . . . . . . . . . . . . . . . . . . . . . . . . . . . . . . . . . . . . . . . . . . . . . 28Statement of Activities . . . . . . . . . . . . . . . . . . . . . . . . . . . . . . . . . . . . . . . . . . . . . . . . . . . . . . . . . . . . . . . . . . . . . . . . . . . . . . . . . . . . . . . . 30
Fund Financial StatementsBalance Sheet - Governmental Funds . . . . . . . . . . . . . . . . . . . . . . . . . . . . . . . . . . . . . . . . . . . . . . . . . . . . . . . . . . . . . . . . . . . . . . . . . . . . 32Reconciliaton of Governmental Fund Balance to Governmental Net Assets - Governmental Funds . . . . . . . . . . . . . . . . . . . . . . . . . . . . 33Statement of Revenues, Expenditures, and Changes in Fund Balance - Governmental Funds . . . . . . . . . . . . . . . . . . . . . . . . . . . . . . . . . 34Reconciliation of Changes in Fund Balances to Changes in Net Assets - Governmental Funds . . . . . . . . . . . . . . . . . . . . . . . . . . . . . . . 35Statement of Revenues, Expenditures, and Changes in Fund Balances - Budget and Actual - General Fund . . . . . . . . . . . . . . . . . . . . . . 36Statement of Net Assets - Proprietary Funds . . . . . . . . . . . . . . . . . . . . . . . . . . . . . . . . . . . . . . . . . . . . . . . . . . . . . . . . . . . . . . . . . . . . . . . 37Reconciliaton of Enterprise Funds Net Assets to Business-type Net Assets . . . . . . . . . . . . . . . . . . . . . . . . . . . . . . . . . . . . . . . . . . . . . . . 38Statement of Revenues, Expenses, and Changes in Fund Net Assets - Proprietary Funds . . . . . . . . . . . . . . . . . . . . . . . . . . . . . . . . . . . . . 39Statement of Cash Flows - Proprietary Funds . . . . . . . . . . . . . . . . . . . . . . . . . . . . . . . . . . . . . . . . . . . . . . . . . . . . . . . . . . . . . . . . . . . . . . . 40Statement of Fiduciary Net Assets - Fiduciary Funds . . . . . . . . . . . . . . . . . . . . . . . . . . . . . . . . . . . . . . . . . . . . . . . . . . . . . . . . . . . . . . . . . 42Statement of Changes in Fiduciary Net Assets - Pension Trust Funds . . . . . . . . . . . . . . . . . . . . . . . . . . . . . . . . . . . . . . . . . . . . . . . . . . . . 43
Notes to the Basic Financial Statements . . . . . . . . . . . . . . . . . . . . . . . . . . . . . . . . . . . . . . . . . . . . . . . . . . . . . . . . . . . . . . . . . . . . . . . . . . . . . . 44Required Supplementary Information
Schedule of Funding Progress for Single Employer Defined Benefit Pension Plans . . . . . . . . . . . . . . . . . . . . . . . . . . . . . . . . . . . . . . . . . . . . 70Combining Fund Statements, Budgetary Statements, and Other Supporting Schedules
Detail Schedule of Revenues - Estimated and Actual - General Fund . . . . . . . . . . . . . . . . . . . . . . . . . . . . . . . . . . . . . . . . . . . . . . . . . . . . 72Detail Schedule of Appropriations, Expenditures, and Encumbrances - General Fund . . . . . . . . . . . . . . . . . . . . . . . . . . . . . . . . . . . . . . . 74
Combining Fund StatementsCombining Balance Sheet - Nonmajor Governmental Funds . . . . . . . . . . . . . . . . . . . . . . . . . . . . . . . . . . . . . . . . . . . . . . . . . . . . . . . . . . . 78Combining Statement of Revenues, Expenditures, and Changes in Fund Balances - Nonmajor Governmental Funds . . . . . . . . . . . . . . 82Schedules of Revenues, Expenditures, and Changes in Fund Balances - Budget and Actual - Special Revenue Funds . . . . . . . . . . . . . . 86Schedule of Revenues and Expenditures - Budget and Actual - Roads and Special Benefit Districts . . . . . . . . . . . . . . . . . . . . . . . . . . . . 92Schedule of Funding Sources Authorized - General County Capital Projects . . . . . . . . . . . . . . . . . . . . . . . . . . . . . . . . . . . . . . . . . . . . . . 94Schedule of Appropriations, Expenditures, and Encumbrances - General County Capital Projects . . . . . . . . . . . . . . . . . . . . . . . . . . . . . 96Schedule of Revenues and Expenditures - Budget and Actual - Erosion District Funds . . . . . . . . . . . . . . . . . . . . . . . . . . . . . . . . . . . . . . 98Schedules of Revenues, Expenditures, and Changes in Fund Balances - Budget and Actual - Debt Service Funds . . . . . . . . . . . . . . . . . 99Schedule of Revenues and Expenditures- Budget and Actual - Special Taxing Districts . . . . . . . . . . . . . . . . . . . . . . . . . . . . . . . . . . . . . 102Combining Statement of Net Assets - Water and Wastewater Fund . . . . . . . . . . . . . . . . . . . . . . . . . . . . . . . . . . . . . . . . . . . . . . . . . . . . . 104Combining Statement of Revenues, Expenses, and Changes in Fund Net Assets - Water and Wastewater Fund . . . . . . . . . . . . . . . . . . . 105Combining Statement of Cash Flows - Water and Wastewater Fund . . . . . . . . . . . . . . . . . . . . . . . . . . . . . . . . . . . . . . . . . . . . . . . . . . . . . 106Schedule of Revenues, Expenses, and Encumbrances - Budget and Actual - Enterprise Funds . . . . . . . . . . . . . . . . . . . . . . . . . . . . . . . . 108Schedule of Funding Sources Authorized and Realized - Enterprise Funds Capital Projects . . . . . . . . . . . . . . . . . . . . . . . . . . . . . . . . . . 110Schedule of Appropriations, Expenditures, and Encumbrances - Enterprise Funds Capital Projects . . . . . . . . . . . . . . . . . . . . . . . . . . . . 112
Anne Arundel County, MarylandComprehensive Annual Financial ReportFor the Fiscal Year Ended June 30, 2007
Table of Contents (continued)
Combining Statement of Net Assets - Internal Service Funds . . . . . . . . . . . . . . . . . . . . . . . . . . . . . . . . . . . . . . . . . . . . . . . . . . . . . . . . . . 114Combining Statement of Revenues, Expenses, and Changes in Fund Net Assets - Internal Service Funds . . . . . . . . . . . . . . . . . . . . . . . 115Combining Statement of Cash Flows - Internal Service Funds . . . . . . . . . . . . . . . . . . . . . . . . . . . . . . . . . . . . . . . . . . . . . . . . . . . . . . . . . 116Schedule of Revenues, Expenses, and Encumbrances - Budget and Actual - Internal Service Funds . . . . . . . . . . . . . . . . . . . . . . . . . . . . 117Combining Statement of Plan Net Assets - Pension Trust Funds . . . . . . . . . . . . . . . . . . . . . . . . . . . . . . . . . . . . . . . . . . . . . . . . . . . . . . . . 120Combining Statement of Changes in Net Assets - Pension Trust Funds . . . . . . . . . . . . . . . . . . . . . . . . . . . . . . . . . . . . . . . . . . . . . . . . . . 121Combining Statement of Changes in Assets and Liabilities - All Agency Funds . . . . . . . . . . . . . . . . . . . . . . . . . . . . . . . . . . . . . . . . . . . . 122
Component Unit Financial StatementsCombining Statements
Combining Statement of Net Assets - Nonmajor Component Units . . . . . . . . . . . . . . . . . . . . . . . . . . . . . . . . . . . . . . . . . . . . . . . . . 124Combining Statement of Activities - Nonmajor Component Units . . . . . . . . . . . . . . . . . . . . . . . . . . . . . . . . . . . . . . . . . . . . . . . . . . 126
Library Component Unit Fund Financial StatementsBalance Sheet . . . . . . . . . . . . . . . . . . . . . . . . . . . . . . . . . . . . . . . . . . . . . . . . . . . . . . . . . . . . . . . . . . . . . . . . . . . . . . . . . . . . . . . . . . . 128Statement of Revenues, Expenditures, and Changes in Fund Balances . . . . . . . . . . . . . . . . . . . . . . . . . . . . . . . . . . . . . . . . . . . . . . . 129Statement of Revenues, Expenditures, and Changes in Fund Balance - Budget and Actual . . . . . . . . . . . . . . . . . . . . . . . . . . . . . . . 130
Other SchedulesDetails of Long-term Debt and Interest . . . . . . . . . . . . . . . . . . . . . . . . . . . . . . . . . . . . . . . . . . . . . . . . . . . . . . . . . . . . . . . . . . . . . . . . . . . . 132Schedule of Debt Service Requirements for Long-term Debt and Interest . . . . . . . . . . . . . . . . . . . . . . . . . . . . . . . . . . . . . . . . . . . . . . . . . 136
Statistical SectionNet Assets by Category . . . .. . . . . . .. . . . . . . . . . . . . . . . . . . . . . . . . . . . . . . . . . . . . . . . . . . . . . . . . . . . . . . . . . . . . . . . . . . . . . . . . . . . . . . . . . 141Changes in Net Assets . . . . . . . . . . . . . . . . . . . . . . . . . . . . . . . . . . . . . . . . . . . . . . . . . . . . . . . . . . . . . . . . . . . . . . . . . . . . . . . . . . . . . . . . . . . . 142Fund Balances, Governmental Funds . . . . . . . . . . . . . . . . . . . . . . . . . . . . . . . . . . . . . . . . . . . . . . . . . . . . . . . . . . . . . . . . . . . . . . . . . . . . . . . . 144Changes in Fund Balances, Governmental Funds . . . . . . . . . . . . . . . . . . . . . . . . . . . . . . . . . . . . . . . . . . . . . . . . . . . . . . . . . . . . . . . . . . . . . . . 145Taxable Assessed Value and Estimated Actual Value of Property . .. . . . . . . . . . . . . . . . . . . . . . . . . . . . . . . . . . . . . . . . . . . . . . . . . . . . . . . . . 146Direct and Overlapping Property Tax Rates . . . . . . . . . . .. . . . . . . . . . . . . . . . . . . . . . . . . . . . . . . . . . . . . . . . . . . . . . . . . . . . . . . . . . . . . . . . 147Principal Property Tax Payers .. . . . . . . . . . . . . . . . . . . . . . . . . . . . . . . . . . . . . . . . . . . . . . . . . . . . . . . . . . . . . . . . . . . . . . . . . . . . . . . . . . . . . 148Property Tax Levies and Collections . . . . . . . . . . . . . . . . . . . . . . . . . . . . . . . . . . . . . . . . . . . . . . . . . . . . . . . . . . . . . . . . . . . . . . . . . . . . . . . . 149Ratio of Outstanding Debt by Type . . . . . . . . . . . . . . . . . . . . . . . . . . . . . . . . . . . . . . . . . . . . . . . . . . . . . . . . . . . . . . . . . . . . . . . . . . . . . . . . . . 150Ratios of General Bonded Debt Outstanding . . . . . . . . . . . . . . . . . . . . . . . . . . . . . . . . . . . . . . . . . . . . . . . . . . . . . . . . . . . . . . . . . . . . . . . . . . . 151Direct and Overlapping Governmental Activities Debt . . . . . . . . . . . . . . . . . . . . . . . . . . . . . . . . . . . . . . . . . . . . . . . . . . . . . . . . . . . . . . . . . . . 152Legal Debt Margin . . . . . . . . . . . . . . . . . . . . . . . . . . . . . . . . . . . . . . . . . . . . . . . . . . . . . . . . . . . . . . . . . . . . . . . . . . . . . . . . . . . . . . . . . . . . . . . 153Pledged Revenue Bond Coverage . . . . . . . . . . . . . . . . . . . . . . . . . . . . . . . . . . . . . . . . . . . . . . . . . . . . . . . . . . . . . . . . . . . . . . . . . . . . . . . . . . . 154Demographic and Economic Statistics . . . . . . . . . . . . . . . . . . . . . . . . . . . . . . . . . . . . . . . . . . . . . . . . . . . . . . . . . . . . . . . . . . . . . . . . . . . . . . . 155Principal Employers . . . . . . . . . . . . . . . . . . . . . . . . . . . . . . . . . . . . . . . . . . . . . . . . . . . . . . . . . . . . . . . . . . . . . . . . . . . . . . . . . . . . . . . . . . . . . . 156County Government Employees by Function . . . . . . . . . . . . . . . . . . . . . . . . . . . . . . . . . . . . . . . . . . . . . . . . . . . . . . . . . . . . . . . . . . . . . . . . . . . 157Operating Indicators by Function / Program . . . . . . . . . . . . . . . . . . . . . . . . . . . . . . . . . . . . . . . . . . . . . . . . . . . . . . . . . . . . . . . . . . . . . . . . . . 158Capital Asset Statistics by Function . . . . . . . . . . . . . . . . . . . . . . . . . . . . . . . . . . . . . . . . . . . . . . . . . . . . . . . . . . . . . . . . . . . . . . . . . . . . . . . . . . 159
1
ANNE ARUNDEL COUNTY
OFFICE OF FINANCE Telephone: Fax: (410) 222-1781 ARUNDEL CENTER (410) 222-1354
P.O. BOX 2700 ANNAPOLIS, MARYLAND 21404-2700
December 14, 2007 The Honorable County Executive, The Honorable Members of the County Council and Citizens of Anne Arundel County, Maryland I am pleased to submit to you the Comprehensive Annual Financial Report of the County for the fiscal year ended June 30, 2007. The purpose of this report is to provide you and the taxpayers of Anne Arundel County with sufficient information to evaluate the County’s financial performance during fiscal year 2007. This report was prepared by the Office of Finance of Anne Arundel County. The basic financial state-ments have been audited by the County’s independent auditors, Clifton Gunderson LLP, in conjunction with the County Auditor, Teresa Sutherland. Opinions from Clifton Gunderson LLP and the County Auditor are included in the report. The responsibility for the accuracy and fairness of the presentation, including all disclosures, rests with the County. We believe the data as presented to be accurate in all material respects and to reflect fairly the financial position and results of operations for the various funds. Management is responsible for establishing and maintaining an internal control structure designed to ensure that the assets of the government are protected from loss, theft or misuse and to ensure that adequate accounting data are compiled for the preparation of financial statements in con-formity with accounting principles generally accepted in the United States of America (GAAP). The internal control structure is designed to provide reasonable, but not absolute, assurance that the financial statements will be free from material misstatement. The concept of reasonable assurance recognizes that: 1) the cost of a control should not ex-ceed the benefits likely to be derived and 2) the valuation of costs and benefits requires estimates and judgments by management.
About Anne Arundel County Anne Arundel County was named for England’s Lady Anne of Arundell, beloved wife of Cecil Cal-vert, second Baron Baltimore. Married at 13 and the mother of many, her intellect was legend, and her love of the arts strong. The expedition to St. Mary’s in Maryland was planned in her sitting room in Tisbury, England. History records that both she and Cecil Calvert longed to voyage to the New World, although neither made it. Her son Charles, the third Lord Baltimore, and Cecil’s younger brother Leonard Calvert, who later became Maryland’s first proprietary governor, were the first family members to step on Maryland soil. Anne of Arundell died at the age of 34. Her husband had engraved on her tombstone, “Farewell, you most lovely of earthly beauties”. The following year, in 1650, the General Assembly of the Maryland Colony named this county in her honor.
2
ANNE ARUNDEL COUNTY
The County is located thirteen miles east of Washington, D. C. with Baltimore City and Baltimore County as its northern boundary and the Chesapeake Bay as its entire eastern boundary. The State’s capital, Annapo-lis, is an incorporated municipality located within the County.
Government Under a home rule charter, the County’s executive functions are vested in the elected County Execu-tive, who is the chief executive officer of the County and is generally responsible for the proper and efficient ad-ministration of the affairs of the County. The County Council, which consists of seven members, is the County’s legislative body. The Council members are elected by election district and the County Executive is elected at-large to serve four-year terms; the County Council members and the County Executive are limited to two consecutive four-year terms. The County provides the full range of basic services as articulated in its Charter. These services in-clude Public Safety (Police, Fire and Detention Center), Street Construction and Maintenance, Planning and Code Enforcement, Recreation and Parks, Human Services, Education, a Community College, Libraries and General Ad-ministrative Services. The County also operates, in conjunction with the State of Maryland, services related to gen-eral community health and social services. In addition, a water and wastewater utility, solid waste disposal, and childcare facilities are operated as business-type activities.
Economic Condition and Outlook Anne Arundel County has one of the strongest economies in Maryland and continues to be a leader for job growth in the State. The County is fortunate to have a diverse economic base ranging from a strong govern-ment sector supported by the presence of Fort George G. Meade and the National Security Agency, a healthy tour-ism sector, and a growing professional and business service sector. Anne Arundel County is also home to the Bal-timore/Washington International Thurgood Marshall Airport, one of the State’s most important economic engines. One key driver of the County’s strong economic performance is federal procurement spending. Ac-cording to the most recent U.S. Census Bureau data, Anne Arundel County ranks third among Maryland counties for defense procurement dollars spent, receiving $1.5 billion in defense procurement contracts. This represents an in-crease of 35.6% over the previous fiscal year. The County will continue to sustain this growth as Fort George G. Meade receives 5,695 new direct jobs over the next five to seven years as a result of the Base Realignment and Clo-sure process (BRAC). The BRAC process represents the largest single employment growth activity in Maryland since World War II. The National Security Agency (NSA) is also on track to hire 4,000 additional personnel over the next five to seven years. Additional growth of 10,000 personnel is projected as contractors cluster around Fort Meade to support NSA and other government agencies located on the base. This contractor growth will be accom-modated by the Enhanced Use Lease (EUL) project which will add an additional two million square feet of office space. It is estimated that BRAC-related activities will add $1 billion to Ft. Meade’s economic impact in the County, bringing the total impact of the federal campus to $5 billion annually. Anne Arundel County continues to sustain a healthy tourism sector as people visit the County to en-joy the 524 miles of shoreline, the historic Annapolis area, the annual boat shows and many festivals and the myriad shopping choices the County has to offer. Anne Arundel County is ranked number one in the State of Maryland for tourism. Travelers spend an estimated $1.8 billion in Anne Arundel County, representing 17.1% of the total State tourism dollars spent, the largest share in the State. These visitors generate $183.0 million in state and local tax revenue. The tourism industry directly employs 28,595 people in Anne Arundel County and generates $644.7 mil-lion in wages for the County. To accommodate the tourism growth in the County, six new hotels opened in FY2007 and currently there are an additional 15 hotels in the planning or construction phase. The Baltimore/Washington International Thurgood Marshall Airport (BWI) is another important economic driver for Anne Arundel County. BWI supports 10,659 direct jobs in the County and generates $5.1 bil-lion in business revenues for Maryland. Airport activities generate $153 million in state and local tax revenue. The
3
ANNE ARUNDEL COUNTY
first major phase of the $1.4 billion improvement and expansion program at BWI was completed in late 2006, add-ing additional parking, improved infrastructure, consolidated rental car facilities and additional gates to accommo-date Southwest Airline’s growth. With this phase complete, the focus has shifted to improving safety, security and efficiency to ensure that BWI will be prepared for future growth and continue to be a leading airport in the region. BWI set a record for passenger traffic in 2006, serving more than 20.7 million passengers. During 2006, Anne Arundel County sustained positive trends in employment and job growth. The County’s unemployment rate averaged 3.3%, which is below the State of Maryland at 3.9% and well below the Na-tional average of 4.5%. Anne Arundel County’s job growth remained robust with 3,585 additional people on the payrolls. The County’s 14,343 businesses employed some 225,000 workers in industry sectors ranging from profes-sional and business services, trade and transportation, leisure and hospitality to financial and education and health services. The largest job gains in the County in 2006 were professional and business services (+1,910), government (+1,552) and education and health services (+1,115).
Anne Arundel County has proven it is an economic engine for the State of Maryland and the region. This is evidenced by consistent job growth, a low unemployment rate, and industry growth across most sectors. Anne Arundel County’s proximity to Washington and Baltimore, coupled with the attractive quality of life and ac-cess to a highly skilled workforce, will ensure that the County will experience a healthy economy as businesses con-tinue to choose the County as a business location.
Financial Information
Funds and Component Units The County’s accounting system is organized and operated on the basis of funds. A fund is defined as a fiscal and accounting entity with a self-balancing set of accounts in which cash and other financial resources, all related liabilities and residual equities or balances, and changes therein, are recorded and segregated to carry on spe-cific activities or attain certain objectives in accordance with special regulations, restrictions or limitations. All funds of the County are included in this Comprehensive Annual Financial Report. In addition, in the fiscal year 2002 the County implemented several new statements issued by the Gov-ernmental Accounting Standards Board, including Statement No. 34, which significantly changed the form and con-tent of the Comprehensive Annual Financial Report. In addition to fund statements, a set of government-wide finan-cial statements are presented that use the full accrual method of accounting. Also included is management’s discus-sion and analysis of the basic financial statements. I urge you to read the Management Discussion and Analysis, Ba-sic Financial Statements, and the Notes to the Basic Financial Statements to better understand the new reporting format. In addition to general government activities, the governing body has financial accountability for the Anne Arundel County Board of Education and the Public Schools, the Anne Arundel Community College and its Foundation, the Public Library of Annapolis and Anne Arundel County, the Anne Arundel County Economic De-velopment Corporation, the Tipton Airport Authority, and Anne Arundel Workforce Development Corporation. These agencies are included in the financial report as discretely presented component units. Budgetary Controls The County maintains budgetary controls to ensure compliance with legal provisions embodied in the annual appropriation ordinance approved by the County Council. The County budget is comprised of the current ex-pense budget and the capital budget. Activities of the General Fund (annually appropriated major governmental fund) and certain special revenue funds (annually appropriated non-major governmental funds) are included in the current expense budget. An annual budget is adopted for the following special revenue funds: County Parking Ga-rage, Street Light, Forfeiture and Asset Seizure Team, Economic Development, Conference and Visitors, Incentive
4
ANNE ARUNDEL COUNTY
Loan Program, Roads and Special Benefits, Piney Orchard Wastewater Service, Local Management Board, Inmate Benefit and Morale, Reforestation, Laurel Racetrack Community Benefit, Workforce Development, and Arundel Development Community Services (refer to budgetary comparisons on Pages 84-88). An annual budget (appropri-ated annually) is also adopted for the following debt service funds: Nursery Road Tax Increment District, West County Tax Increment District, Arundel Mills Tax Increment District, Parole Tax Increment District, Park Place Tax Increment District, Special Taxing Districts, and Installment Purchase Agreements (refer to budgetary comparisons on Pages 97-99). The capital budget, included in the six-year capital program, sets forth capital projects to be under-taken and the proposed sources of funding the capital projects. The Office of Finance is responsible for budgetary control. The level of control at which expenditures cannot legally exceed the appropriated amount is set at the department level for the operating budget and at the pro-ject level for the capital budget. Management cannot overspend the budget without the approval of the governing body. The County maintains an encumbrance system for budgetary control. All unencumbered appropriations of the operating budget lapse at year-end. Unencumbered capital appropriations continue until the specific capital project is closed. Revenue Stabilization Fund The balance of the Revenue Stabilization Fund was $ 44,952,851 at June 30, 2007. This fund may only be used upon request of the County Executive, with the approval of the County Council, to cover existing ap-propriations when revenues are not attained. In September 2002, legislation was enacted to change the maximum amount that may be retained in the Revenue Stabilization Fund as a percentage of the total general fund appropriation. The legislation provides that the amount of the annual appropriation to the Revenue Stabilization Fund may not cause the sum of the balance of the Revenue Stabilization Fund plus the appropriation to exceed an amount equal to 10% of the estimated average aggregate annual revenue derived from the income tax, real property transfer tax, recordation tax, and investment in-come of the General Fund in the three fiscal years preceding the fiscal year for which the appropriation is made. If credited interest earnings cause the total amount of the fund to exceed an amount equal to 10% of the estimated av-erage aggregate annual revenue derived from the income tax, real property transfer tax, recordation tax, and invest-ment income of the General Fund in the three fiscal years preceding the fiscal year for which the appropriation is made, the Controller may credit interest earnings of the Revenue Stabilization Fund to the General Fund. Cash Management County funds, excluding component units, held for operation and capital purposes are managed by the Office of Finance with strict guidelines as to investment vehicles. Investments are restricted by State of Maryland law, with which the County complies. The County does not invest in derivatives or reverse repurchase agreements. It does no borrowing or lending of securities. It invests primarily in obligations of the United States Government, its agencies or instrumentalities, and repurchase agreements with primary dealers. The repurchase agreements are col-lateralized by United States Government treasuries, agencies, and instrumentalities held by the County’s custodian bank and marked to market daily. Pension funds are separately administered by the Anne Arundel County Retirement and Pension Sys-tem. These funds are managed separately through contracts with professional money managers. Debt Management The County Charter established a Spending Affordability Committee for the County in Fiscal Year 1990. This committee is charged to make advisory recommendations to the Office of Budget, the County Executive and the County Council relating to spending affordability, including County spending levels to reflect the afforda-bility of the taxpayers to finance County operations and service long-term debt. With input from the Spending Af-fordability Committee, the County administration develops debt management policies to be used in planning future
5
ANNE ARUNDEL COUNTY
debt issuance levels. The objective is to maintain creditworthiness while at the same time ensuring that necessary capital projects will be funded. The County has an internal debt affordability model that is updated annually. Risk Management It is the policy of the County to retain risks of losses in those areas where it believes it is more eco-nomical to manage its risks internally and set aside assets for claims settlement in its internal service fund. The County purchases insurance for real and personal property, boilers and machinery, and faithful performance bonds, as well as school bus insurance for the bus contractors of the Board of Education. The County maintains the self-insurance fund to provide workers’ compensation and directors and of-ficers’ coverage for the County government, the Board of Education, and the Community College, and general li-ability and vehicle liability coverage for the County government and the Board of Education. Retirement Plans and Other Post Employment Benefits Anne Arundel County sponsors four single-employer defined benefit pension plans in separate trust funds administered by the Anne Arundel County Retirement and Pension System, a corporation that is an agency in the Executive Branch of County Government. County employees also participate in two multi-employer cost-sharing pension plans administered by the State. The County plans were established under authority created by the County Charter and legislation, while the State plans were created under authority created by State legislation. Each year an independent actuary engaged by the pension plans calculates the amount of the annual contribution that the County must make to each pension plan to ensure that the plan will be able to fully meet its ob-ligations to retired employees on a timely basis. The County also provides post retirement health and dental care benefits for certain retirees and their dependents. Currently Generally Accepted Accounting Principles (GAAP) do not require governments to report a li-ability in the financial statements in connection with an employer’s obligation to provide these benefits. However, for reporting periods beginning after December 15, 2006, the County will need to implement Governmental Ac-counting Standards Board (GASB) Statement #45 providing guidance to employers who offer other post employ-ment benefits (OPEB). Thus, in the fiscal year ended June 30, 2008, the County will report the liability for OPEB. Long-Term Financial Planning As part of the County’s long-term financial planning, revenues are projected over a number of years and compared with expenditure levels based on certain assumptions, including maintenance of effort service levels, enhanced service levels, and factoring in inflation, the fiscal impact of negotiated labor agreements, health and pen-sion costs, etc. The capital budget and improvement program covers six years and the impact of improvements on the County’s operating budget is also factored in expenditure projections. The County’s debt affordability model is based upon six-year projections of operating revenue, property assessments, personal income and population. In re-cent years, the County has provided pay-go funding for capital projects using excess revenues from property recor-dation and transfer taxes.
Awards and Acknowledgements
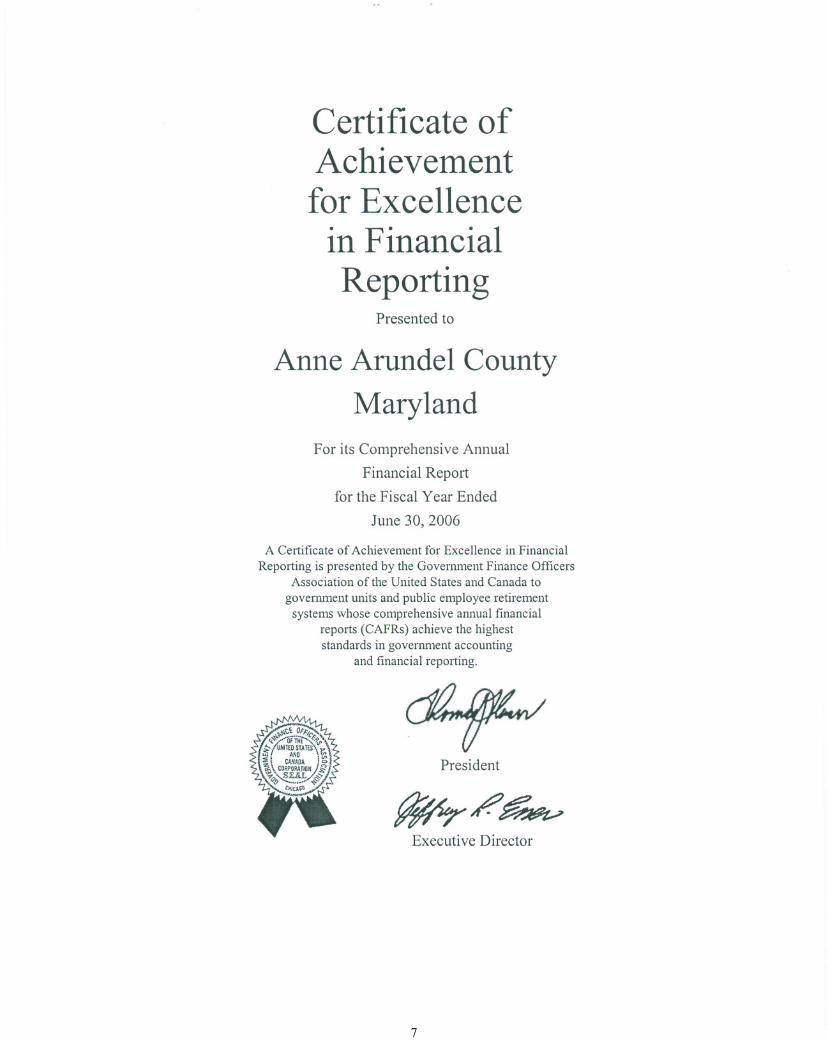
The Government Finance Officers Association of the United States and Canada (GFOA) awarded a Certificate of Achievement in Financial Reporting to Anne Arundel County, Maryland for its comprehensive annual financial report for the fiscal year ended June 30, 2006. This was the twenty-sixth consecutive year that the County has received this prestigious award. In order to be awarded a Certificate of Achievement, the government published an easily readable and efficiently organized comprehensive annual financial report, the contents of which conform to program standards.

ANNE ARUNDEL COUNTY
This report satisfies both accounting principles generally accepted in the United States of America and applicablelegal requirements.
A Certificate of Achievement is valid for a period of one year only. We believe that our current comprehensive annual financial report continues to meet the Certificate of Achievement Program's requirements and weare submitting it to the GFOA to determine its eligibility for another certificate.
On behalf of the Office of Finance, I would like to thank the County Executive for his leadership andsupport in planning and conducting the financial operations of the County in a responsible and progressive manner. Iwould like to express my appreciation to the entire accounting staff in the Office of Finance, and especially to JodeeDickinson, Assistant Controller.
Sincerely,
~~.~~ ~William R. Brown, Jr., CGFil"Controller
6
Certificate ofAchievementfor Excellence
in FinancialReporting
Presented to
Anne Anlndel County
MarylandFor its Comprehensive Annual
Financial Report
for the Fiscal Year Ended
June 30, 2006
A Certificate of Achievement for Excellence in Financial
Reporting is presented by the Government Finance OfficersAssociation of the United States and Canada to
government units and public employee retirementsystems whose comprehensive annual financial
reports (CAFRs) achieve the higheststandards in government accounting
and financial reporting.
President
Executive Director
7
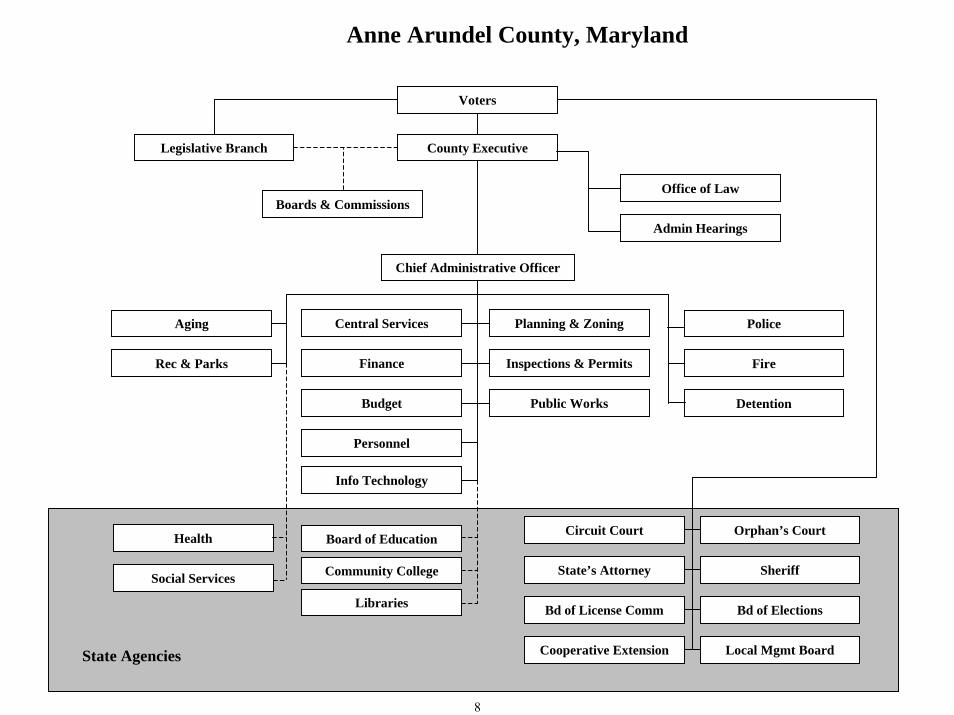
Chief Administrative Officer
County Executive
Office of Law
Bd of License Comm
Admin Hearings
Orphan’s CourtCircuit Court
State’s Attorney Sheriff
Bd of Elections
Rec & Parks
Cooperative Extension Local Mgmt Board
Health
Boards & Commissions
Social Services
Legislative Branch
Planning & Zoning
Inspections & Permits
Police
Public Works Detention
Fire
Central Services
Finance
Personnel
Budget
Info Technology
Board of Education
Libraries
Community College
Voters
Aging
Anne Arundel County, Maryland
State Agencies
8

A1
Offices in 15 states and Washington, DC 9 h
Independent Auditor’s Report
The County Executive and the Honorable Members of the County Council Anne Arundel County, Maryland We have audited the accompanying financial statements of the governmental activities, the business-type activities, the aggregate discretely presented component units, each major fund, and the aggregate remaining fund information of Anne Arundel County, Maryland (the County), as of and for the year ended June 30, 2007, which collectively comprise the County’s basic financial statements as listed in the table of contents. These financial statements are the responsibility of Anne Arundel County’s management. Our responsibility is to express opinions on these financial statements based on our audit. We did not audit (1) the component unit financial statements of the Anne Arundel Community College; and (2) the component unit financial statements of the Anne Arundel Economic Development Corporation, the Tipton Airport Authority and the Anne Arundel Workforce Development Corporation, which represent 55 percent, 53 percent, and 30 percent, respectively, of the assets, net assets and revenues of the other nonmajor component units. Those financial statements were audited by other auditors whose reports thereon have been furnished to us, and our opinion, insofar as it relates to the amounts included for the above mentioned component units, is based solely on the reports of the other auditors. We conducted our audit in accordance with auditing standards generally accepted in the United States of America and the standards applicable to financial audits contained in Government Auditing Standards, issued by the Comptroller General of the United States. Those standards require that we plan and perform the audit to obtain reasonable assurance about whether the financial statements are free of material misstatement. An audit includes examining, on a test basis, evidence supporting the amounts and disclosures in the financial statements. An audit also includes assessing the accounting principles used and significant estimates made by management, as well as evaluating the overall financial statement presentation. We believe that our audit and the reports of other auditors provide a reasonable basis for our opinions. In our opinion, based on our audit and the reports of other auditors, the financial statements referred to above present fairly, in all material respects, the respective financial position of the governmental activities, the business-type activities, the aggregate discretely presented component units, each major fund, and the aggregate remaining fund information of Anne Arundel County, Maryland, as of June 30, 2007, and the respective changes in financial position and cash flows, where applicable, thereof, and the respective budgetary comparison for the general fund, for the year then ended in conformity with accounting principles generally accepted in the United States of America. The Management’s Discussion and Analysis and Schedule of Funding Progress for Single Employer Defined Benefit Pension Plans as referenced in the table of contents are not required parts of the basic financial statements but are supplementary information required by accounting principles generally accepted in the United States of America. We have applied certain limited procedures, which consisted principally of inquiries of management regarding the methods of measurement and presentation of the required supplementary information. However, we did not audit the information and express no opinion on it.

10
Our audit was conducted for the purpose of forming opinions on the financial statements that collectively comprise Anne Arundel County, Maryland’s basic financial statements. The accompanying introductory section and combining fund statements, budgetary statements, and other supporting schedules, and statistical section, as listed in the table of contents, are presented for purposes of additional analysis and are not a required part of the basic financial statements. The combining fund statements, budgetary statements, and other supporting schedules section have been subjected to the auditing procedures applied by us and other auditors in the audit of the basic financial statements and, in our opinion, based on our audit and the report of other auditors, are fairly stated in all material respects in relation to the basic financial statements taken as a whole. The introductory and statistical sections have not been subjected to the auditing procedures applied by us and the other auditors in the audit of the basic financial statements and, accordingly, we express no opinion on them. In accordance with Government Auditing Standards, we have also issued our report dated December 14, 2007 on our consideration of the County’s internal control over financial reporting and on our tests of its compliance with certain provisions of laws, regulations, contracts, and grant agreements and other matters. The purpose of that report is to describe the scope of our testing of internal control over financial reporting and compliance and the results of that testing, and not to provide an opinion on the internal control over financial reporting or on compliance. That report is an integral part of an audit performed in accordance with Government Auditing Standards and should be considered in assessing the results of our audit.
A1 Baltimore, Maryland December 14, 2007
ANNE ARUNDEL COUNTYOFFICE OF THE COUNTY AUDITOR
Independent Auditor's Report
The County ExecutiveAnd Members of the County CouncilAnne Arundel County, Maryland
We have audited the accompanying financial statements of the governmental activities, thebusiness-type activities, the aggregate discretely presented component units, each major fund,and the aggregate remaining fund information of Anne Arundel County, Maryland (theCounty), as of and for the year ended June 30, 2007, which collectively comprise theCounty's basic financial statements as listed in the table of contents. These financialstatements are the responsibility of Anne Arundel County's management. Our responsibilityis to express opinions on these financial statements based on our audit. We did not audit (1)the component unit financial statements of the Anne Arundel County Board of Education; (2)the component unit financial statements of the Anne Arundel Community College; (3) thecomponent unit financial statements of the Anne Arundel Economic DevelopmentCorporation, the Tipton Airport Authority and the Anne Arundel Workforce DevelopmentCorporation, which represent 55 percent, 53 percent, and 30 percent, respectively, of theassets, net assets and revenues of the other nonmajor component units and (4) the financialstatements of the Pension Trust Fund. Those financial statements were audited by otherauditors whose reports thereon have been furnished to us, and our opinion, insofar as it relatesto the amounts included for the above mentioned component units and the Pension TrustFund, is based solely on the reports of the other auditors.
We conducted our audit in accordance with auditing standards generally accepted in theUnited States of America and the standards applicable to financial audits contained inGovernment Auditing Standards, issued by the Comptroller General of the United States.Those standards require that we plan and perform the audit to obtain reasonable assuranceabout whether the financial statements are free of material misstatement. An audit includes
examining, on a test basis, evidence supporting the amounts and disclosures in the financialstatements. An audit also includes assessing the accounting principles used and significantestimates made by management, as well as evaluating the overall financial statementpresentation. We believe that our audit and the reports of other auditors provide a reasonablebasis for our opinions.
11
P.O. BOX 1768 • ANNAPOLIS, MARYLAND 21404 • TELEPHONE 410-222-1138 • 301-970-8250 • FAX 410-222-1346
Recycled Paper
In our opinion, based on our audit and the reports of other auditors, the financial statementsreferred to above present fairly, in all material respects, the respective financial position of thegovernmental activities, the business-type activities, the aggregate discretely presentedcomponent units, each major fund, and the aggregate remaining fund information of AnneArundel County, Maryland, as of June 30, 2007, and the respective changes in financialposition and cash flows, where applicable, thereof, and the respective budgetary comparisonfor the general fund, for the year then ended in conformity with accounting principlesgenerally accepted in the United States of America.
The Management's Discussion and Analysis and Schedule of Funding Progress for SingleEmployer Defined Benefit Pension Plans as referenced in the table of contents are notrequired parts of the basic financial statements but are supplementary information required byaccounting principles generally accepted in the United States of America. We and the otherauditors have applied certain limited procedures, which consisted principally of inquiries ofmanagement regarding the methods of measurement and presentation of the requiredsupplementary information. However, we and the other auditors did not audit the informationand express no opinion on it.
Our audit was conducted for the purpose of forming opinions on the financial statements thatcollectively comprise Anne Arundel County, Maryland's basic financial statements. Theaccompanying introductory section and combining fund statements, budgetary statements, andother supporting schedules, and statistical section, as listed in the table of contents, arepresented for purposes of additional analysis and are not a required part of the basic financialstatements. The combining fund statements, budgetary statements, and other supportingschedules section have been subjected to the auditing procedures applied by us and otherauditors in the audit of the basic financial statements and, in our opinion, based on our auditand the report of other auditors, are fairly stated in all material respects in relation to the basicfinancial statements taken as a whole. The introductory and statistical sections have not beensubjected to the auditing procedures applied by us and the other auditors in the audit of thebasic financial statements and, accordingly, we express no opinion on them.
In accordance with Government Auditing Standards, we have also issued our report datedDecember 14,2007 on our consideration of the County's internal control over financialreporting and on our tests of its compliance with certain provisions of laws, regulations,contracts, and grant agreements and other matters. The purpose of that report is to describethe scope of our testing of internal control over financial reporting and compliance and theresults of that testing, and not to provide an opinion on the internal control over financialreporting or on compliance. The report is an integral part of an audit performed in accordancewith Government Auditing Standards and should be considered in assessing the results of ouraudit.
Annapolis, MarylandDecember 14, 2007
12

Anne Arundel County, Maryland Management Discussion and Analysis Year Ended June 30, 2007
13
As Management of Anne Arundel County, Maryland (the County), we have prepared the following discussion and analysis to inform readers of the County’s annual financial report about the financial information that the enclosed statements present. We encourage readers to consider the discussion and analysis along with the other information in this report, including the transmittal letter and notes to the basic financial statements. In this section we have provided an overview of the basic financial statements, selected condensed financial data and highlights, and analysis of the County’s financial position and changes in financial position. Comparable amounts from the fiscal year ended June 30, 2006 have been provided herein. Overview of Basic Financial Statements The basic financial statements consist of the government-wide financial statements, fund financial statements, budgetary statements, and notes to the basic financial statements. Each component intends to provide a different perspective of the County’s financial results. These components are discussed below.
Government-wide Financial Statements – These statements are designed to provide a broad, entity-wide perspective of the County’s financial position and changes in financial position. These statements are prepared using a full-accrual accounting method that measures changes when the underlying economic activity occurs regardless of the timing of the related cash flows. This method is consistent with that used in the private sector.
The government-wide statements have consolidated the Primary government’s operations into two columns
– governmental activities and business-type activities. In addition, the component units’ entity-wide statements are presented. The governmental activities are those functions of the Primary government that are principally supported by taxes and other general revenue sources. Such activities include education, public safety, general government, health and human services, public works, recreation and community services, judicial, code enforcement, land use, and economic development. The business-type activities include the Primary government’s functions that are primarily supported by user-fees and charges, such as utility services, waste collection, and child care services.
Statement of Net Assets – The statement of net assets presents the composition of the County’s assets,
liabilities, and net asset position at the end of the fiscal year. This statement includes long-term capital assets and long-term liabilities. In addition, capital assets are shown at their depreciated value. Net assets are divided into three components: capital assets, net of related debt; restricted net assets; and unrestricted net assets. These components highlight the composition of the County’s net asset position. Changes in these net asset categories over time may indicate an improvement in, or deterioration of, the County’s financial condition.
Statement of Activities - The statement of activities summarizes the transactions that resulted in changes to net assets during the fiscal year. The statement presents these results of operations in a net expense format. The total expenses are presented first and grouped on a functional basis. Program revenues, which represent charges for services, grants, and contributions from outside parties, are subtracted from the functional expenses to derive the County’s net expenses. Finally, the general revenue sources, such as taxes, investment earnings, and other general revenue, are applied to net expenses to derive the change in net assets for the year.
Both statements include the Primary government’s component units, including the Board of Education,
Community College, Library, Economic Development Corporation, Tipton Airport, and Workforce Development. These entities are included because the County provides a substantial amount of their funding or the County Executive appoints a majority of the Board members, implying a substantial degree of control over their management. In addition, the County approves the budgets of these entities.
Fund Financial Statements – The Primary government segregates its financial operations into several
funds in order to account separately for funding sources and activities that the government undertakes. This provides better control over resources that are designated for specific activities or objectives. These funds are grouped into three different types: governmental funds, proprietary funds, and fiduciary funds.
Governmental Funds – The governmental funds of the Primary government include the General Fund; the
General County Capital Projects Fund, which is used to accumulate and spend resources to construct capital assets; the special revenue funds, which segregate restricted revenue sources to ensure these funds are spent on the intended

Anne Arundel County, Maryland Management Discussion and Analysis Year Ended June 30, 2007
14
purpose; and debt service funds, which accumulate resources to pay certain long term debt issued by the County or separate districts.
The perspective of these statements is narrower than the government-wide statements discussed previously.
These statements present the financial position and changes in financial position resulting from currently available resources and currently due liabilities. Therefore, revenues are not recorded until available and expenses are primarily recorded when the underlying economic activity occurs. In addition, because these statements focus on current resources, long-term assets and liabilities are not included.
The statements focus on the Primary government’s major funds. Major governmental funds include the
General Fund, the Impact Fee Fund and the General County Capital Projects Fund. Separate columns are presented for those funds considered major either by size or by importance. The other funds are aggregated into one column called “other nonmajor funds”.
Proprietary Funds – The proprietary funds include those activities within the Primary government that are
self-supporting. These funds include enterprise funds, which provide services to citizens in exchange for user fees, and internal service funds, which provide services to the Primary government and its component units, in exchange for fees. Transactions for these funds are recorded using the full-accrual basis of accounting, whereby transactions are recorded when the underlying economic event takes place regardless of the timing of cash flows. Moreover, long-term assets and liabilities are recorded on the statements. The enterprise funds include the Water and Wastewater Utilities Fund, the Solid Waste Fund, and the Child Care Fund. Internal service funds include the Self Insurance, Health Insurance, and Central Garage Funds. The Print Shop Fund was closed at beginning of the fiscal year. These statements also focus on major funds and, therefore, include separate columns for the Water and Wastewater and Solid Waste Funds.
Fiduciary Funds – The fiduciary funds accumulate assets that are managed, but not owned, by the Primary
government. The County’s four defined benefit pension plans that form the Retirement System Pension Trust Fund are included in this category. In addition, this category includes agency funds that are used to accumulate temporary deposits and other funds that are collected from outside parties in order to be returned to the payor or passed on to a third party. The Pension Trust Fund follows the full-accrual method of accounting. The agency funds are presented as balances only and record no revenue or expenses.
Budgetary Statements – A budgetary statement of revenue and expenditures for the General Fund has been
presented in the basic financial statements. This statement provides the results of the County’s General Fund operations compared to the legally adopted budget. The statement uses the budgetary method when accounting for transactions. Revenues are generally recognized when available and expenditures are recognized as soon as a commitment, in the form of a purchase order or contract, has been issued to a vendor.
Notes to the Basic Financial Statements - The notes follow the basic financial statements and provide
additional information that is essential to a full understanding of the data provided in the government-wide and fund financial statements.
Other Required Supplementary Information - There is one required supplementary schedule that provides
trend data about the Pension Trust Fund.
Financial Highlights Overall Financial Position – During fiscal year 2007 the County’s net assets resulting from governmental
activities have increased by $48.3 million. All three components of net assets reflect this increase. Capital assets, net of related debt increased by $29.1 million, restricted net assets increased $12.9 million, and unrestricted net assets increased $6.4 million. In fiscal year 2007 results for the County’s business-type activities increased $32.8 million, or 3%. This increase was generated by additional capital assets of $17 million, additional restricted net assets of $9.5 million, and an increase in the unrestricted net assets of $6.4 million. The capital asset increase is modest compared to prior years. The restricted net assets increase occurred as the balances set aside for debt service payments increased by $7.9 million, and the $6.4 million increase in unrestricted net assets occurred as the landfills
Anne Arundel County, Maryland Management Discussion and Analysis Year Ended June 30, 2007
15
reserve estimates were significantly reduced. Changes to Statement of Net Assets’ Components - In governmental activities the increase in total assets of
$111.2 million outpaced the increase in total liabilities of $62.9 million. The current assets and current restricted assets increased by $50.6 million (17%) and $27 million (16%), respectively, while the capital assets increased by $33.7 million, or 4%. The increases in the two current categories were seen across the board in cash, accounts receivable, and other assets.
While the assets increased by 8%, so did the liabilities, which rose $62.9 million. The increases occurred in
current liabilities by $14.5 million (9%), current restricted liabilities by $650,097 (2%), and noncurrent liabilities by $47.8 million (8%). The current liabilities’ increases were apparent in most categories; the increase in current liabilities was primarily the result of an additional $7.8 million due to the component units for capital projects. The increase in noncurrent liabilities was caused by additional net debt in fiscal year 2007, in which $92.4 million in debt was issued and $48.3 million was liquidated.
Net assets related to business-type activities increased $32.8 million or 3% in fiscal year 2007, which is
consistent with the increase in fiscal year 2006 of $30.1 million. Assets increased by $81.7 million, while liabilities increased by $48.9 million. Asset increases were primarily caused by the net change of $45 million in restricted current assets. This increase is due to the significant increase in cash reserved for debt service and capital projects of $28.4 million and $13.5 million, respectively. Because of a planned wastewater connection price increase in fiscal year 2008, many developers paid the connection fees in June to obtain the lower rate. Approximately $20 million in connection fees were collected through this prepayment program. The capital projects cash increase was due to the additional fiscal year 2007 funding added to capital projects coupled with a reduced number of closed projects.
The $48.9 million increase in business-type liabilities was caused by increases in both current restricted liabilities of $16.1 million and noncurrent liabilities of $33.6 million. Current restricted liabilities increased primarily because the prepaid connection fees discussed above were deferred on the balance sheet for recognition in subsequent years. The increase in noncurrent liabilities was caused by the increased outstanding amount for general obligation bonds, which increased by $31.7 million from fiscal year 2006.
Significant changes in revenues and expenses – Fiscal year 2007 showed continuing growth in property and sales taxes as the economy continued to improve. Significant Federal defense and intelligence presence help support this growth. However, the rising interest rates caused a slow down in the real estate market, which had a negative impact on the recordation and transfer taxes collected by the County. General revenues in governmental activities increased $58 million, or 6% from fiscal year 2006. The County experienced growth in property tax revenues of $32.8 million, or 8% and local income taxes of $38.7 million (11%). Recordation and transfer taxes declined by $20.7 million, or 16%.
The governmental activities’ program revenues increased by $13 million. This change comprises an
increase in charges for services of $6 million, or 7%, an increase in operating grants and contributions of $3.3 million, or 4%, and an increase in capital grants & contributions of $3.7 million, or 10%. The modest increases in these categories occurred in most sources.
The business-type activities show an increase in total program revenue of $1.2 million. There was an
increase in charges for services of $2.1 million, or 2%, while the capital grants and contributions declined by $913,013. The decline in the real estate market has resulted in fewer capital connections to the water and waste water system, which has caused a slow down in capital connection revenue. General revenue sources have increased by $926,772, a 5% increase from the previous year.
Business-type expenses declined by $586,515 from the previous year expenses. The water and wastewater
expenses increase of $6 million and the Child Care Fund increase of $251,699 were offset by the decline in waste collection costs of $6.9 million. The decline was due to the downward adjustment to landfill closure and post closure reserves.
Changes to debt – The County’s total bonded debt balance increased by $75.4 million in fiscal year 2007.

Anne Arundel County, Maryland Management Discussion and Analysis Year Ended June 30, 2007
16
The County issued $92.4 million of bonds for governmental activities and $46 million for business-type activities. Of the issue of $138.4 million, $59 million of the proceeds were used to liquidate BANS issued in April of 2006, and $79.4 million was used to fund ongoing capital projects. The County issued $58 million of BANS in April 2007 to fund capital expenditures in fiscal year 2008. Of this amount, $39 million is related to governmental activities, including education, public safety, infrastructure improvements, recreation, libraries, and general government improvements. The business-type activities received the remaining $19 million of proceeds, which will be used for utility and waste collection improvements. Factors Affecting Comparability – As discussed in the footnotes to the basic financial statements, there were adjustments to beginning net assets. In addition, there was a minor change to the presentation in the fiscal year 2007 Statement of Net Assets for business-type activities, in which the current portion of a note receivable was moved to the current asset category. Therefore, the fiscal year 2006 amounts were adjusted herein to enhance comparability. Financial Data and Management’s Analysis - Government-wide Statements
Below is a condensed statement of net assets with comparative amounts from the previous fiscal year. We have also provided an analysis of the contents and fluctuations noted in the schedule.
Anne Arundel County, MarylandCondensed Statement of Net Assets
Governmental Business-typeActivities Activities Total
2007 2006 2007 2006 2007 2006Assets: - -
Current $ 352,899,757 $ 302,284,316 $ 57,059,461 $ 47,905,265 $ 409,959,218 $ 350,189,581 Restricted - Current 199,436,686 172,466,220 208,532,413 163,551,070 407,969,099 336,017,290 Restricted - Noncurrent - - 56,091,505 60,097,862 56,091,505 60,097,862 Capital 991,557,618 957,897,959 1,082,832,441 1,051,247,029 2,074,390,059 2,009,144,988 Total 1,543,894,061 1,432,648,495 1,404,515,820 1,322,801,226 2,948,409,881 2,755,449,721 - - - -
Liabilities: - - - - Current 167,538,631 153,061,655 51,116,773 51,943,720 218,655,404 205,005,375 Restricted - current 41,065,594 40,415,497 37,220,616 21,144,496 78,286,210 61,559,993 Noncurrent 667,074,340 619,286,809 334,591,494 300,945,153 1,001,665,834 920,231,962 Total 875,678,565 812,763,961 422,928,883 374,033,369 1,298,607,448 1,186,797,330
- - - - Net Assets: - - - -
Invested in capital assets, - - - - net of related debt 591,560,429 562,505,745 780,708,037 763,729,810 1,372,268,466 1,326,235,555 Restricted 177,126,422 164,234,565 184,510,742 174,990,646 361,637,164 339,225,211 Unrestricted (100,471,355) (106,855,776) 16,368,158 10,047,401 (84,103,197) (96,808,375) Total $ 668,215,496 $ 619,884,534 $ 981,586,937 $ 948,767,857 $ 1,649,802,433 $ 1,568,652,391
Discussion of components – This statement condenses the statement of net assets into broad categories. Current assets are those unrestricted assets that are readily convertible to cash and available to pay the liabilities of the County. Current restricted assets are those readily convertible to cash but legally restricted for a specific use. Noncurrent restricted assets are also limited as to use but are due to the County over several years. Restrictions can originate from Federal, State, or local law, grant agreements, or other contracts. Capital assets are those with an extended useful life that are not readily convertible to cash. These assets depreciate in value over their respective useful lives. Current liabilities are those obligations that will be paid with currently available resources within a year, while the current restricted liabilities will be paid with restricted assets. Noncurrent liabilities are not expected to be liquidated within one year. Noncurrent liabilities are those not expected to be paid within a year, including long term debt balances, accrued liabilities for annual and sick leave, estimates for long term insurance claims, long term escrow deposits, and revenue recorded but not yet earned.
Anne Arundel County, Maryland Management Discussion and Analysis Year Ended June 30, 2007
17
Net assets represent equity remaining once amounts due are subtracted from assets available. Net assets are shown in three categories: capital assets, net of any related debt issued to construct or buy the assets, restricted net assets remaining after restricted liabilities are covered by restricted assets, and unrestricted net asset balances. Management’s Analysis – Current assets of governmental activities are $50.6 million higher in fiscal year 2007 primarily due to an increase in the State income tax receivable of $20.1 million and higher cash balances in the County’s Self Insurance and Health Insurance funds. The business-type activities increased its current assets of $9.2 million, due to higher levels of cash.
Restricted assets in governmental activities increased by $27 million as cash in the capital projects fund continues to build. County funding of bond proceeds and paygo has not yet been tapped for construction costs. The fluctuation in current restricted assets in business-type activities is $45 million, or 28%. This substantial increase is a result of growing cash balances in the cash reserved for utility debt service, a $28 million increase, and the cash used for utility capital projects, an increase of $13.5 million. The pending rate increases for wastewater connection fees discussed earlier and the growing and untapped cash balances in the capital projects fund are the causes.
Restricted noncurrent assets in business-type activities decreased by $4 million from fiscal year 2006,
which is a 7% decrease. These assets result from long-term receivables for front foot benefit charges, capital connection charges, and a note receivable due from a developer. These balances continue to decrease as the number of properties allowed to defer the charges are declining and the developer is paying down the principal balance of the note. Newer developments are generally required to pay front foot and capital connection fees in advance.
The governmental capital assets net balance increased by $33.7 million from the previous year, a 4%
increase. There was no significant increase in any one category of capital assets. Capital assets in the business-type activities increased by $31.6 million, or 3%. These capital asset fluctuations are consistent with the increases in the prior year. In reviewing the categories of fixed assets, the primary cause for the increase in governmental capital assets was the completion of the Compass Pointe Golf Course improvements and the renovations of Bates High School.
Current liabilities for governmental activities increased by $14.5 million, or 9% from the previous fiscal
year. The increase was caused by increases in accrued liabilities of $4.8 million, increases in the current portion of long-term debt and additional outstanding bond anticipation notes of $1 million from the previous year. The current liabilities in business-type activities decreased by $826,947, or 2%, from fiscal year 2006. Modest increases in most current liability categories were offset by a $2.5 million decrease in Solid Waste bond anticipation notes from fiscal year 2006.
Restricted current liabilities for governmental activities increased $650,097, or 2% from fiscal year 2006.
The increase was caused by a $7.5 million increase in the amount due to the Board of Education at year end for capital projects in process and modest increases in other liabilities, offset by a $7.4 million decrease in accrued liabilities for General County, Highways, and Recreation capital projects. Restricted current liabilities for business-type activities increased by $16.1 million, or 76%. The prepaid wastewater connection fees discussed earlier were substantially deferred into subsequent years, which has caused restricted deferred revenue to increase by $18.3 million.
Noncurrent liabilities consist of bonded debt, self insurance reserves, loans, capital leases, and other
liabilities. These liabilities increased $47.8 million, or 8% in governmental activities, and increased by $33.7 million, or 11% in business-type activities. Both of these increases are substantially higher than the fluctuations noted in the prior year’s statements. For governmental activities the net bonded debt balances increased by $44.2 million. This was due to the new issue of $92.4 million in fiscal year 2007 exceeding the $64 million new issue in 2006. Insurance reserves have increased by $4.5 million due to increases in health care costs and self insurance reserves. The increase noted in the noncurrent liabilities in business-type activities was primarily caused by the fiscal year 2007 bond issue of $42.5 million, which exceeded the 2006 issue of $21 million.
The components of governmental and business-type net assets were discussed in the financial highlights
above. It should be noted the negative unrestricted net assets in governmental activities have increased from ($106.9) million to ($100.5) million, an increase of 6%. It is important to note that although Counties in the State of
Anne Arundel County, Maryland Management Discussion and Analysis Year Ended June 30, 2007
18
Maryland issue debt for the construction of schools, the schools are owned by the local Boards of Education. Ownership reverts to the County if the building is no longer needed. The County also funds projects for the Community College and others that do not result in County assets. Therefore, while the County’s statements include this outstanding debt, there are no capital assets recorded on the primary government’s statements. The negative unrestricted governmental activities fund balance of $100.5 million reflects this treatment. The Board of Education and Community College capital net assets of approximately $608.2 million and $61.8 million, respectively, are evidence of the significant level of capital assets that were constructed primarily from County incurred debt.
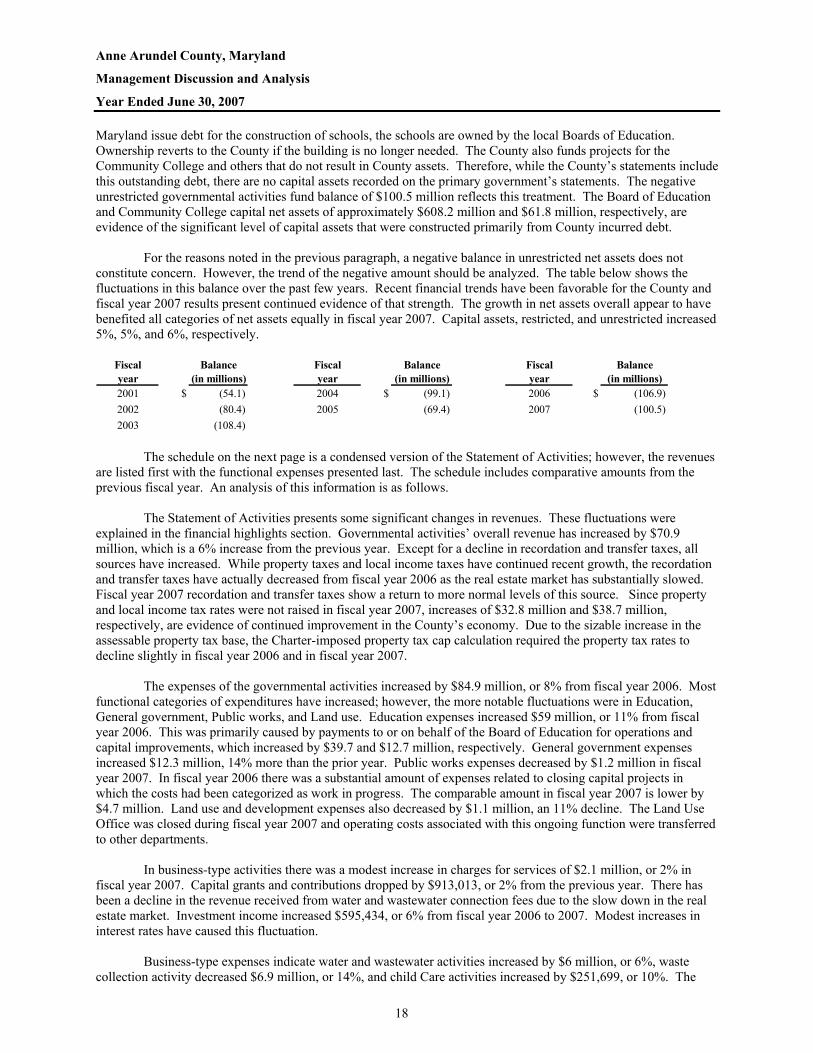
For the reasons noted in the previous paragraph, a negative balance in unrestricted net assets does not
constitute concern. However, the trend of the negative amount should be analyzed. The table below shows the fluctuations in this balance over the past few years. Recent financial trends have been favorable for the County and fiscal year 2007 results present continued evidence of that strength. The growth in net assets overall appear to have benefited all categories of net assets equally in fiscal year 2007. Capital assets, restricted, and unrestricted increased 5%, 5%, and 6%, respectively.
Fiscal Balance Fiscal Balance Fiscal Balanceyear (in millions) year (in millions) year (in millions)2001 $ (54.1) 2004 $ (99.1) 2006 $ (106.9)2002 (80.4) 2005 (69.4) 2007 (100.5)2003 (108.4)
The schedule on the next page is a condensed version of the Statement of Activities; however, the revenues
are listed first with the functional expenses presented last. The schedule includes comparative amounts from the previous fiscal year. An analysis of this information is as follows.
The Statement of Activities presents some significant changes in revenues. These fluctuations were
explained in the financial highlights section. Governmental activities’ overall revenue has increased by $70.9 million, which is a 6% increase from the previous year. Except for a decline in recordation and transfer taxes, all sources have increased. While property taxes and local income taxes have continued recent growth, the recordation and transfer taxes have actually decreased from fiscal year 2006 as the real estate market has substantially slowed. Fiscal year 2007 recordation and transfer taxes show a return to more normal levels of this source. Since property and local income tax rates were not raised in fiscal year 2007, increases of $32.8 million and $38.7 million, respectively, are evidence of continued improvement in the County’s economy. Due to the sizable increase in the assessable property tax base, the Charter-imposed property tax cap calculation required the property tax rates to decline slightly in fiscal year 2006 and in fiscal year 2007.
The expenses of the governmental activities increased by $84.9 million, or 8% from fiscal year 2006. Most
functional categories of expenditures have increased; however, the more notable fluctuations were in Education, General government, Public works, and Land use. Education expenses increased $59 million, or 11% from fiscal year 2006. This was primarily caused by payments to or on behalf of the Board of Education for operations and capital improvements, which increased by $39.7 and $12.7 million, respectively. General government expenses increased $12.3 million, 14% more than the prior year. Public works expenses decreased by $1.2 million in fiscal year 2007. In fiscal year 2006 there was a substantial amount of expenses related to closing capital projects in which the costs had been categorized as work in progress. The comparable amount in fiscal year 2007 is lower by $4.7 million. Land use and development expenses also decreased by $1.1 million, an 11% decline. The Land Use Office was closed during fiscal year 2007 and operating costs associated with this ongoing function were transferred to other departments.
In business-type activities there was a modest increase in charges for services of $2.1 million, or 2% in
fiscal year 2007. Capital grants and contributions dropped by $913,013, or 2% from the previous year. There has been a decline in the revenue received from water and wastewater connection fees due to the slow down in the real estate market. Investment income increased $595,434, or 6% from fiscal year 2006 to 2007. Modest increases in interest rates have caused this fluctuation.
Business-type expenses indicate water and wastewater activities increased by $6 million, or 6%, waste
collection activity decreased $6.9 million, or 14%, and child Care activities increased by $251,699, or 10%. The

Anne Arundel County, Maryland Management Discussion and Analysis Year Ended June 30, 2007
19
decrease in waste collection activities was primarily caused by changes in landfill closure and post closure estimates, which were adjusted downward in fiscal year 2007 by $2.2 million, compared to an additional charge of $5.8 million in the previous year.
Anne Arundel County, Maryland
Statement of Activities
Governmental Business type Activities Activities Total
2007 2006 2007 2006 2007 2006Program revenues:
Charges for services $ 89,519,721 $ 83,563,485 $ 115,583,882 $ 113,444,032 $ 205,103,603 $ 197,007,517 Operating grants & contributions 89,644,284 86,392,388 - - 89,644,284 86,392,388 Capital grants & contributions 41,767,457 38,022,877 43,077,787 43,990,800 84,845,244 82,013,677
220,931,462 207,978,750 158,661,669 157,434,832 379,593,131 365,413,582 General revenue:
General property taxes 470,163,256 437,323,072 470,163,256 437,323,072 Local income taxes 378,250,270 339,522,458 378,250,270 339,522,458 State shared taxes 7,191,853 7,119,854 7,191,853 7,119,854 Recordation & transfer taxes 109,257,440 129,932,542 109,257,440 129,932,542 Local sales taxes 36,546,370 34,175,913 36,546,370 34,175,913 Investment incoome 13,262,845 10,594,765 9,841,180 9,245,746 23,104,025 19,840,511 Other revenue 1,968,910 45,417 8,019,340 7,688,002 9,988,250 7,733,419
1,016,640,944 958,714,021 17,860,520 16,933,748 1,034,501,464 975,647,769 Total revenues 1,237,572,406 1,166,692,771 176,522,189 174,368,580 1,414,094,595 1,341,061,351
Expenses:Education 604,272,803 545,274,308 604,272,803 545,274,308 Public safety 211,406,101 208,105,539 211,406,101 208,105,539 General government 99,787,089 87,480,194 99,787,089 87,480,194 Health & human services 77,363,293 72,130,374 77,363,293 72,130,374 Public works 61,128,634 62,299,800 61,128,634 62,299,800 Recreation & community services 56,820,623 53,132,411 56,820,623 53,132,411 Judicial 21,449,798 20,647,728 21,449,798 20,647,728 Code enforcement 11,455,519 11,175,710 11,455,519 11,175,710 Land use & development 9,343,623 10,456,642 9,343,623 10,456,642 Economic development 3,731,000 3,445,000 3,731,000 3,445,000 Interest expense on debt 32,482,961 30,145,870 32,482,961 30,145,870 Water & wastewater 100,135,704 94,108,900 100,135,704 94,108,900 Waste collection 40,773,206 47,638,224 40,773,206 47,638,224 Child care 2,794,199 2,542,500 2,794,199 2,542,500 Total expenses 1,189,241,444 1,104,293,576 143,703,109 144,289,624 1,332,944,553 1,248,583,200 Change in net assets 48,330,962 62,399,195 32,819,080 30,078,956 81,150,042 92,478,151
Net assets, beg of year, as restated 619,884,534 557,485,339 948,767,857 918,688,901 1,568,652,391 1,476,174,240 Net assets, end of year $ 668,215,496 $ 619,884,534 $ 981,586,937 $ 948,767,857 $ 1,649,802,433 $ 1,568,652,391
Distribution of Revenues and Expenses
The two pie charts on the next page show the percentage distribution of revenues from governmental activities and the percentage expended on each function, respectively. Discussion of the 2007 distribution and significant changes since 2006 follows.
General revenue sources continue to provide the vast majority of the County’s revenue. Tax revenues from
property assessments, income, State shared sources, recordation and transfer, and sales of certain goods provided 81% of our revenue base, remaining consistent with fiscal year 2006. Charges for services, in which the users pay the County for services obtained, increased as a percent of the total from 7.1% in fiscal year 2006 to 7.2% in 2007. The increase in this revenue source occurred in all functional categories but is primarily from an increase in fees from recreation programs, such as the County’s golf courses and swim centers.
An analysis of the percentage distribution of expenses by function revealed that there were no significant
changes in any of the functions as a percent of the total. Education expenses increased from 49.4% of total expenses to 50.8%, due to increased capital improvement activity. Education expenses represent those for Anne Arundel Public Schools and Anne Arundel Community College.
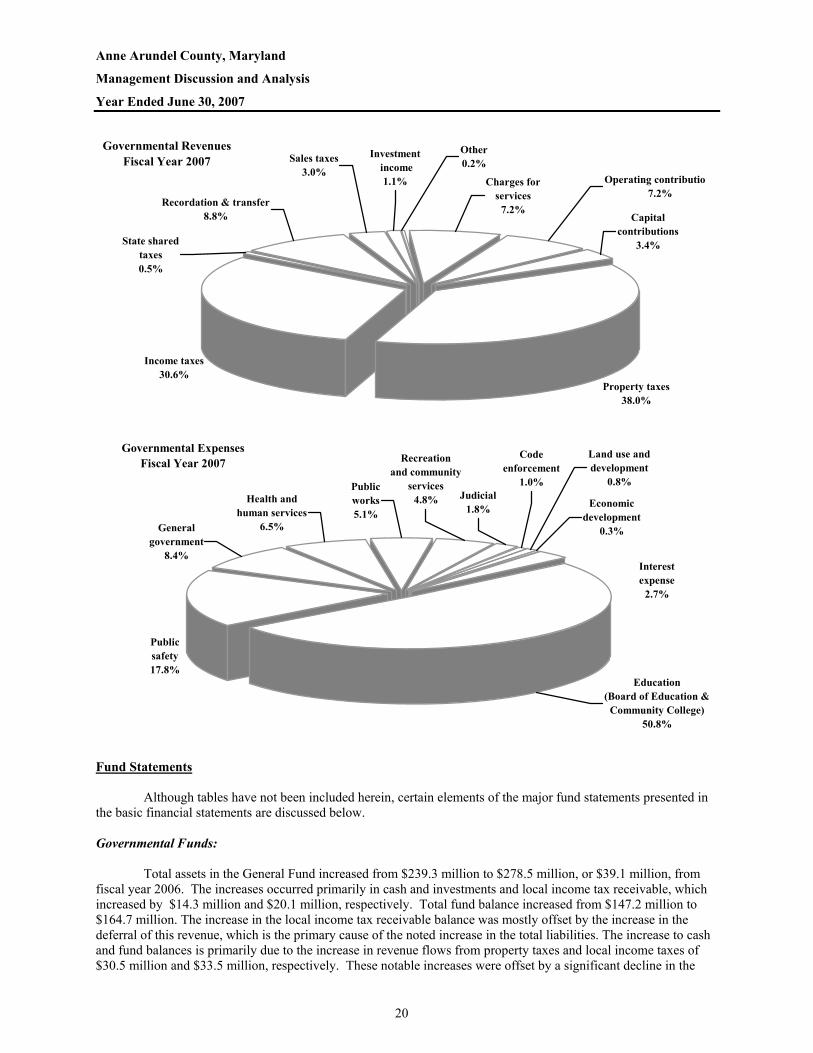
Anne Arundel County, Maryland Management Discussion and Analysis Year Ended June 30, 2007
20
Governmental Revenues Fiscal Year 2007
Property taxes38.0%
Income taxes30.6%
Investment income
1.1%
Other0.2%
Charges for services
7.2%
Operating contribution7.2%
Capital contributions
3.4%
Sales taxes3.0%
Recordation & transfer8.8%
State shared taxes0.5%
Governmental Expenses Fiscal Year 2007
Education (Board of Education &
Community College)50.8%
Judicial1.8%
Code enforcement
1.0%
Land use and development
0.8%
Economicdevelopment
0.3%
Interestexpense
2.7%
Recreation and community
services4.8%
Public works5.1%
Health and human services
6.5%General government
8.4%
Public safety17.8%
Fund Statements
Although tables have not been included herein, certain elements of the major fund statements presented in the basic financial statements are discussed below. Governmental Funds: Total assets in the General Fund increased from $239.3 million to $278.5 million, or $39.1 million, from fiscal year 2006. The increases occurred primarily in cash and investments and local income tax receivable, which increased by $14.3 million and $20.1 million, respectively. Total fund balance increased from $147.2 million to $164.7 million. The increase in the local income tax receivable balance was mostly offset by the increase in the deferral of this revenue, which is the primary cause of the noted increase in the total liabilities. The increase to cash and fund balances is primarily due to the increase in revenue flows from property taxes and local income taxes of $30.5 million and $33.5 million, respectively. These notable increases were offset by a significant decline in the
Anne Arundel County, Maryland Management Discussion and Analysis Year Ended June 30, 2007
21
recordation and transfer tax revenue of $20.7 million.
General Fund expenditures increased from $1,020 million to $1,101 million, or $80.8 million. This growth outpaced the revenue increases; however, other sources and uses brought a net $6.3 million to the General Fund in fiscal year 2007 compared to an net outflow of $28 million in 2006. This change was caused by a decrease in the amount of pay as you go funding allocated to capital projects, which declined by $18.9 million, and a $9.7 million increase in the excess surpluses of governmental funds coming back to the General Fund in fiscal year 2007.
The unreserved and undesignated General Fund balance increased from $33.1 million in fiscal year 2006 to $43 million in 2007. Of the $17.6 million increase in fund balance in fiscal year 2007, $9.9 million remained in this category. The remaining increase in the General Fund balance was primarily allocated to the Revenue Reserve Fund. This fund increased by $6.2 million, and the debt service reserve, increased by $1.9 million from the previous year.
The County has a Revenue Reserve Fund of $45 million at the end of fiscal year 2007. The growth in this fund from the prior year of $6.2 million was due to an additional contribution of $3.9 million in fiscal year 2007 and interest earnings of $2.3 million. This reserve may only be used when revenues fall short of expectations. Use of the reserve requires legislative action. Further, legislation passed in September 2002 increased the amount of funding that can be allocated to this reserve each year. The fiscal year 2008 budget provides for an additional $500,000, the maximum allowed contribution. This fund has been in existence since fiscal year 1994 and has not been utilized by Management. The General Fund balance sheet also includes a $6.1 million reserve for debt service. The County received premiums from its March 2006 and 2007 general obligation bond sales. These premiums have been recognized as revenue in the fund statements and will be used to pay interest on the bonds issued as required by restrictions in the bond sale’s tax certificate. The Impact Fees Fund retains developer impact fees until utilized for the construction of capital assets. The total assets and fund balances within this fund are down from $52.3 million in fiscal year 2006 to $51.2 million in 2007. Impact fees recognized dropped $1.8 million, from $11.1 million in fiscal year 2006 to $9.3 million in 2007. This decline, due to the slow down in new development, was offset slightly by a $647,793 increase in investment income. The transfers to other funds appear consistent as $13.5 million was transferred in fiscal year 2006 compared to $13.2 million in 2007. However the fiscal year 2006 transfer was used to fund eligible capital projects, while the 2007 transfer consisted of an $8 million transfer of unused waiver fees to the General Fund and the remaining $5.2 million to capital projects. The General County Capital Projects Fund’s total assets increased from $95.1 in fiscal year 2006 to $117.7 million in 2007, or $22.6 million. This increase is due to the additional cash in the fund at the end of the fiscal year as fiscal year 2007 bond and BANS issues exceeded the 2006 issues by $26.9 million. The increased cash balance is the primary cause of the increase in fund balance from $56.2 million (as restated) in fiscal year 2006 to $79.1 million in 2007. Liabilities decreased by $210,780, primarily due to an additional $7.8 million amount due to the Board of Education for its capital improvement projects offset by decreases in accrued liabilities. Revenues in the General County Capital Projects Fund declined from $20.2 million (as restated) in fiscal year 2006 to $14.7 million in 2007. This was caused by a drop in grant revenues of $8.9 million in fiscal year 2007. As discussed in the financial highlights section above, a slow down in the receipt of State Program Open Space monies caused this decline. Expenditures in this fund dropped by $7.3 million. A drop in the capital outlay for County managed projects of $24.6 million was offset by a $17.3 million increase in the amounts paid to the Board of Education and Community College. Proprietary Funds:
The Water and Wastewater Fund’s assets, totaling $1.3 billion at the end of fiscal year 2007, increased by $78.2 million during fiscal year 2007. The increase was a result of an additional $41.9 million in cash and investments restricted for debt service and capital projects and a net increase of $32.5 million in capital assets. Cash increases were a result of the prepaid water and wastewater connection fees mentioned earlier and increases in the

Anne Arundel County, Maryland Management Discussion and Analysis Year Ended June 30, 2007
22
amount of unspent pay as you go and bond proceeds in the Utility Capital Projects Fund. Capital assets increase each year as capital projects are completed and developer donated water and sewer facilities are added. Liabilities have increased by $53.7 million. Additional long-term bonded debt and Maryland water quality loans caused this increase. As a result of the changes in assets and liabilities the Water and Wastewater Fund’s net assets increased $24.5 million, or 2.6%.
The Statement of Revenues, Expenses, and Changes in Fund Net Assets shows an increase in operating
revenues of $1.6 million, or 2.3%. Rates for water and wastewater services increased in January 2007. Water rates increased from $2.00 per thousand gallons to $2.10 per thousand and wastewater rates increased from $3.52 per thousand gallons to $3.70 per thousand. Operating expenses have increased by $5.7 million, or 6.6%. Nonoperating components also show little change as well as capital contributions, fees and grants, which increased by $913,013. These contributions represent the capital assets built by developers and fees collected from properties connecting to the County’s water and wastewater systems.
The Solid Waste Fund’s assets increased by $3.4 million, or 5.3%. Liabilities decreased by $4.6 million,
primarily due to adjustments in the estimates for landfill closure and post closure reserves, which ended fiscal year 2007 with a balance of $34.3 million at the end of fiscal year 2007, compared to $36.5 million at the end of fiscal year 2006. In addition, there were no bond anticipation notes outstanding at the end of fiscal year 2007, compared to $2.5 million outstanding at the end of 2006.
Operating revenue increased by $1.5 million. The increase was caused by additional waste collection
activity as the rate for household pick-up remained $275 for both fiscal years 2006 and 2007. Expenses decreased by $7.3 million, as the adjustment of the landfill reserves declined by $2.2 million, compared to an increase of $5.8 million, in fiscal year 2006. Fiduciary Funds: Fiduciary funds include the Pension Trust Funds and the Agency Funds. The Pension Trust Funds are presented for the calendar year ended December 31, 2006. Investment growth increased since calendar 2005. The contributions of $43.2 million during 2006, and the investment activity increase of $75.6 million, resulted in larger increase in net assets of $145.5 million, compared to the $77.7 million in 2005, and $100.2 million in 2004. Agency funds decreased from $22.1 million to $20.5 million. The decrease was caused by the liquidation of the Compass Pointe Golf Escrow, in which the balance of $897,338 was moved to the General Fund and the decline in Subdivision Deposits and Sediment Control escrow accounts, which have been drawn down by a net $956,395 during fiscal year 2007. Budgetary Variations
The budgetary statements of the General Fund show actual revenues of $1.153 billion compared to budgeted amounts of $1.106 billion, resulting in $46.9 million more revenue than anticipated. The most significant budgetary variation within components of revenue was local income taxes, which exceeded budget by $16.5 million, or 4.8% and interfund recoveries, which exceed budgetary expectation by $10.8 million, or 40%. Local income taxes were favorable due to continued economic growth in the County. Interfund recoveries were significantly higher due to the fiscal year 2007 transfer of accumulating surpluses from the General County Capital Projects Fund and unspent waiver fees from the Impact Fee Fund.
Functional expenditures were within budget for all categories. Total expenditures on a budgetary basis
were $1.142 billion compared to appropriation authority of $1.166 billion, resulting in $23.3 million, or 2%, less than planned. As a result, the amended budget anticipated using fund balance of $59.7 million; however, $10.5 million of fund balance was actually added.
The only notable variances in expenditures were Land use and development, which under spent by $2.3
million or 20.9%; and General government, which under spent by $8.9 million, or 9.2%. The Land Use and Development Office was closed during fiscal year 2007 and the existing positions and costs were moved to other departments. In anticipation of the closure of this office, many positions were vacant and spending had slowed. The variance in the general government category occurred because the County did not use $5.9 million of the
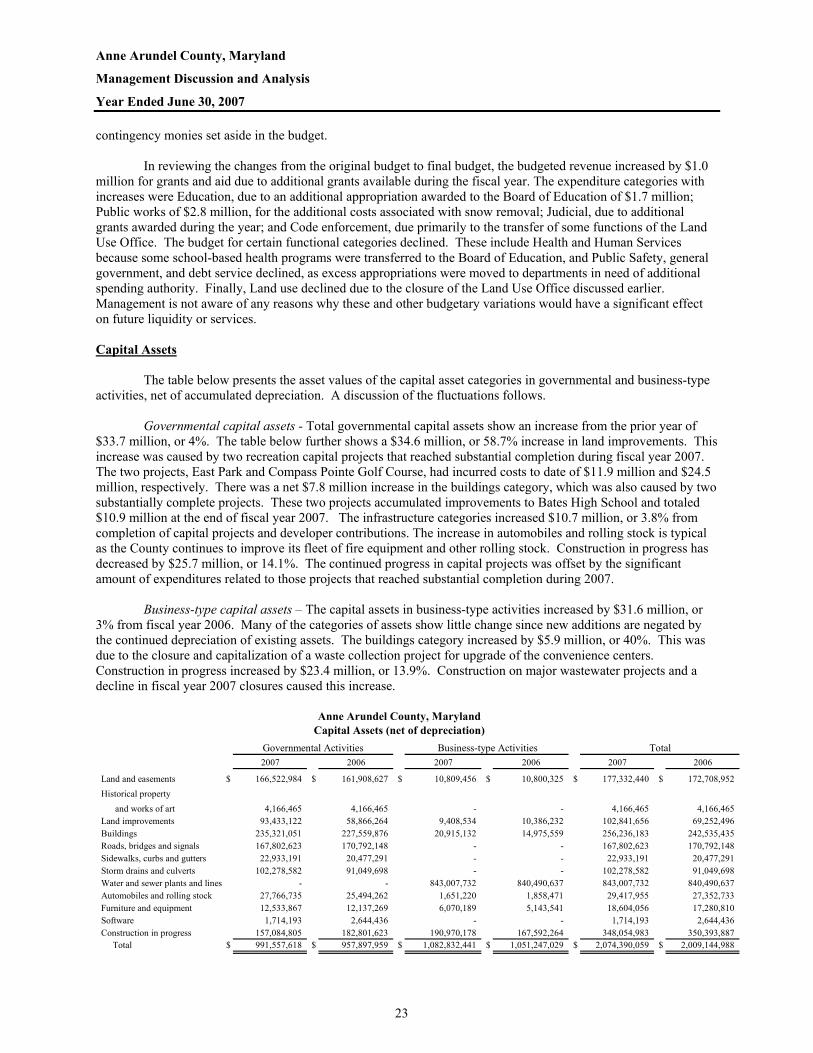
Anne Arundel County, Maryland Management Discussion and Analysis Year Ended June 30, 2007
23
contingency monies set aside in the budget. In reviewing the changes from the original budget to final budget, the budgeted revenue increased by $1.0
million for grants and aid due to additional grants available during the fiscal year. The expenditure categories with increases were Education, due to an additional appropriation awarded to the Board of Education of $1.7 million; Public works of $2.8 million, for the additional costs associated with snow removal; Judicial, due to additional grants awarded during the year; and Code enforcement, due primarily to the transfer of some functions of the Land Use Office. The budget for certain functional categories declined. These include Health and Human Services because some school-based health programs were transferred to the Board of Education, and Public Safety, general government, and debt service declined, as excess appropriations were moved to departments in need of additional spending authority. Finally, Land use declined due to the closure of the Land Use Office discussed earlier. Management is not aware of any reasons why these and other budgetary variations would have a significant effect on future liquidity or services. Capital Assets The table below presents the asset values of the capital asset categories in governmental and business-type activities, net of accumulated depreciation. A discussion of the fluctuations follows.
Governmental capital assets - Total governmental capital assets show an increase from the prior year of $33.7 million, or 4%. The table below further shows a $34.6 million, or 58.7% increase in land improvements. This increase was caused by two recreation capital projects that reached substantial completion during fiscal year 2007. The two projects, East Park and Compass Pointe Golf Course, had incurred costs to date of $11.9 million and $24.5 million, respectively. There was a net $7.8 million increase in the buildings category, which was also caused by two substantially complete projects. These two projects accumulated improvements to Bates High School and totaled $10.9 million at the end of fiscal year 2007. The infrastructure categories increased $10.7 million, or 3.8% from completion of capital projects and developer contributions. The increase in automobiles and rolling stock is typical as the County continues to improve its fleet of fire equipment and other rolling stock. Construction in progress has decreased by $25.7 million, or 14.1%. The continued progress in capital projects was offset by the significant amount of expenditures related to those projects that reached substantial completion during 2007.
Business-type capital assets – The capital assets in business-type activities increased by $31.6 million, or
3% from fiscal year 2006. Many of the categories of assets show little change since new additions are negated by the continued depreciation of existing assets. The buildings category increased by $5.9 million, or 40%. This was due to the closure and capitalization of a waste collection project for upgrade of the convenience centers. Construction in progress increased by $23.4 million, or 13.9%. Construction on major wastewater projects and a decline in fiscal year 2007 closures caused this increase.
Anne Arundel County, Maryland
Capital Assets (net of depreciation)Governmental Activities Business-type Activities Total2007 2006 2007 2006 2007 2006
Land and easements $ 166,522,984 $ 161,908,627 $ 10,809,456 $ 10,800,325 $ 177,332,440 $ 172,708,952 Historical property and works of art 4,166,465 4,166,465 - - 4,166,465 4,166,465 Land improvements 93,433,122 58,866,264 9,408,534 10,386,232 102,841,656 69,252,496 Buildings 235,321,051 227,559,876 20,915,132 14,975,559 256,236,183 242,535,435 Roads, bridges and signals 167,802,623 170,792,148 - - 167,802,623 170,792,148 Sidewalks, curbs and gutters 22,933,191 20,477,291 - - 22,933,191 20,477,291 Storm drains and culverts 102,278,582 91,049,698 - - 102,278,582 91,049,698 Water and sewer plants and lines - - 843,007,732 840,490,637 843,007,732 840,490,637 Automobiles and rolling stock 27,766,735 25,494,262 1,651,220 1,858,471 29,417,955 27,352,733 Furniture and equipment 12,533,867 12,137,269 6,070,189 5,143,541 18,604,056 17,280,810 Software 1,714,193 2,644,436 - - 1,714,193 2,644,436 Construction in progress 157,084,805 182,801,623 190,970,178 167,592,264 348,054,983 350,393,887 Total $ 991,557,618 $ 957,897,959 $ 1,082,832,441 $ 1,051,247,029 $ 2,074,390,059 $ 2,009,144,988
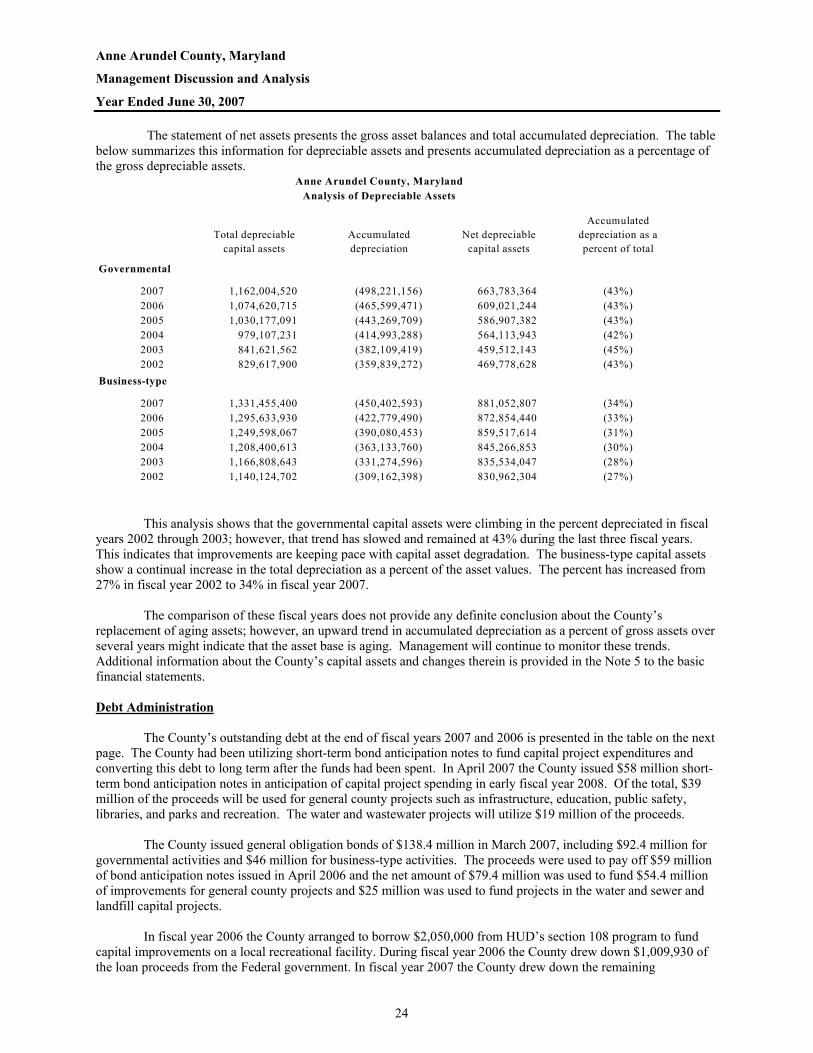
Anne Arundel County, Maryland Management Discussion and Analysis Year Ended June 30, 2007
24
The statement of net assets presents the gross asset balances and total accumulated depreciation. The table below summarizes this information for depreciable assets and presents accumulated depreciation as a percentage of the gross depreciable assets.
Anne Arundel County, MarylandAnalysis of Depreciable Assets
Total depreciable capital assets
Accumulated depreciation
Net depreciable capital assets
Accumulated depreciation as a percent of total
Governmental
2007 1,162,004,520 (498,221,156) 663,783,364 (43%)2006 1,074,620,715 (465,599,471) 609,021,244 (43%)2005 1,030,177,091 (443,269,709) 586,907,382 (43%)2004 979,107,231 (414,993,288) 564,113,943 (42%)2003 841,621,562 (382,109,419) 459,512,143 (45%)2002 829,617,900 (359,839,272) 469,778,628 (43%)
Business-type
2007 1,331,455,400 (450,402,593) 881,052,807 (34%)2006 1,295,633,930 (422,779,490) 872,854,440 (33%)2005 1,249,598,067 (390,080,453) 859,517,614 (31%)2004 1,208,400,613 (363,133,760) 845,266,853 (30%)2003 1,166,808,643 (331,274,596) 835,534,047 (28%)2002 1,140,124,702 (309,162,398) 830,962,304 (27%)
This analysis shows that the governmental capital assets were climbing in the percent depreciated in fiscal
years 2002 through 2003; however, that trend has slowed and remained at 43% during the last three fiscal years. This indicates that improvements are keeping pace with capital asset degradation. The business-type capital assets show a continual increase in the total depreciation as a percent of the asset values. The percent has increased from 27% in fiscal year 2002 to 34% in fiscal year 2007.
The comparison of these fiscal years does not provide any definite conclusion about the County’s
replacement of aging assets; however, an upward trend in accumulated depreciation as a percent of gross assets over several years might indicate that the asset base is aging. Management will continue to monitor these trends. Additional information about the County’s capital assets and changes therein is provided in the Note 5 to the basic financial statements. Debt Administration The County’s outstanding debt at the end of fiscal years 2007 and 2006 is presented in the table on the next page. The County had been utilizing short-term bond anticipation notes to fund capital project expenditures and converting this debt to long term after the funds had been spent. In April 2007 the County issued $58 million short-term bond anticipation notes in anticipation of capital project spending in early fiscal year 2008. Of the total, $39 million of the proceeds will be used for general county projects such as infrastructure, education, public safety, libraries, and parks and recreation. The water and wastewater projects will utilize $19 million of the proceeds.
The County issued general obligation bonds of $138.4 million in March 2007, including $92.4 million for governmental activities and $46 million for business-type activities. The proceeds were used to pay off $59 million of bond anticipation notes issued in April 2006 and the net amount of $79.4 million was used to fund $54.4 million of improvements for general county projects and $25 million was used to fund projects in the water and sewer and landfill capital projects.
In fiscal year 2006 the County arranged to borrow $2,050,000 from HUD’s section 108 program to fund capital improvements on a local recreational facility. During fiscal year 2006 the County drew down $1,009,930 of the loan proceeds from the Federal government. In fiscal year 2007 the County drew down the remaining

Anne Arundel County, Maryland Management Discussion and Analysis Year Ended June 30, 2007
25
$1,040,070 of the loan. The changes to the State loans were not significant as there was one new loan fiscal year 2007 of $190,308, which was offset by the principal payments on existing loans. There were no new capital leases added in 2007 and the decline reflects the amortization of the liability. The County’s initiative to purchase agricultural easements through installment purchase agreements resulted in one new agreement in fiscal year 2007, totaling $926,000. Other changes to debt balances resulted from principal payments during fiscal year 2007. Additional information about the County’s debt and changes therein is provided in Note 8 to the basic financial statements.
Anne Arundel County, Maryland
Outstanding DebtGovernmental Activities Business-type Activities Total
2007 2006 2007 2006 2007 2006
Bond anticipation notes $ 39,000,000 $ 38,000,000 $ 19,000,000 $ 21,000,000 $ 58,000,000 $ 59,000,000 General obligation bonds 595,201,252 550,153,824 314,546,578 282,826,949 909,747,830 832,980,773 Special assessment debt 53,960,000 54,795,000 - - 53,960,000 54,795,000 HUD Section 108 Loan 1,640,000 1,009,930 - - 1,640,000 1,009,930 State loans 2,163,208 2,166,992 - - 2,163,208 2,166,992 Capital leases 277 57,382 - - 277 57,382 Installment purchase agreements 9,939,000 9,030,814 - - 9,939,000 9,030,814 Total $ 701,903,737 $ 655,213,942 $ 333,546,578 $ 303,826,949 $ 1,035,450,315 $ 959,040,891
Fiscal Year 2008 and Beyond
Promulgations by the Governmental Accounting Standards Board require Management to include
descriptions of currently known facts, decisions, or conditions that are expected to have a significant effect on financial position (net assets) or results of operations (revenues, expenses, or other changes in net assets.)
GASB Statement 45 - In fiscal year 2008 the County will implement GASB Statement 45. This statement
requires the County to set aside annual contributions for other post employment benefits in an irrevocable trust or record the unfunded contributions as a liability on the statement of net assets. In the fall of 2005 the County assembled a task force to examine the requirements of the GASB pronouncement, quantify the liability resulting from its implementation, and identify options to address this issue.
The task force issued its report on November 8, 2006. According to actuarial estimates the County and its
component units’ total actuarial accrued liability is $1.27 billion. Using a discount rate of 8%, the annual required contribution is estimated at $117.6 million compared to the current pay as you go funding level of $42.2 million. This leaves a funding gap of $75.4 million. The County has earmarked $5 million in its fiscal year 2008 budget for post retirement health care benefits and has segregated this amount in its records. Footnote 1-N provides more information about the financial impact and Management’s plans to address this issue.
The County continues to see strength in its major revenue sources as new residents move into the area.
Federal government and supporting industries are expected to expand over the next few years as current BRAC plans are implemented. The County expects revenue in fiscal year 2008 to be consistent with expectations. This differs from recent years when actual revenues, particularly in the area of recordation and transfer taxes, significantly exceeded budget estimates. With respect to fiscal year 2008, the County expects growth in the property tax and income tax revenue; however, recordation and transfer taxes are expected to decline again in fiscal year 2008 as the real estate market has slowed considerably.
The County’s Comprehensive Annual Financial Report is available upon request at Anne Arundel County
Office of Finance, 44 Calvert Street, Annapolis, MD, 21401. For copies of this report or questions about its contents, please contact William R. Brown, Jr., Controller.

26
(This page left blank intentionally)

Basic Financial
Statements

27
(This page left blank intentionally)
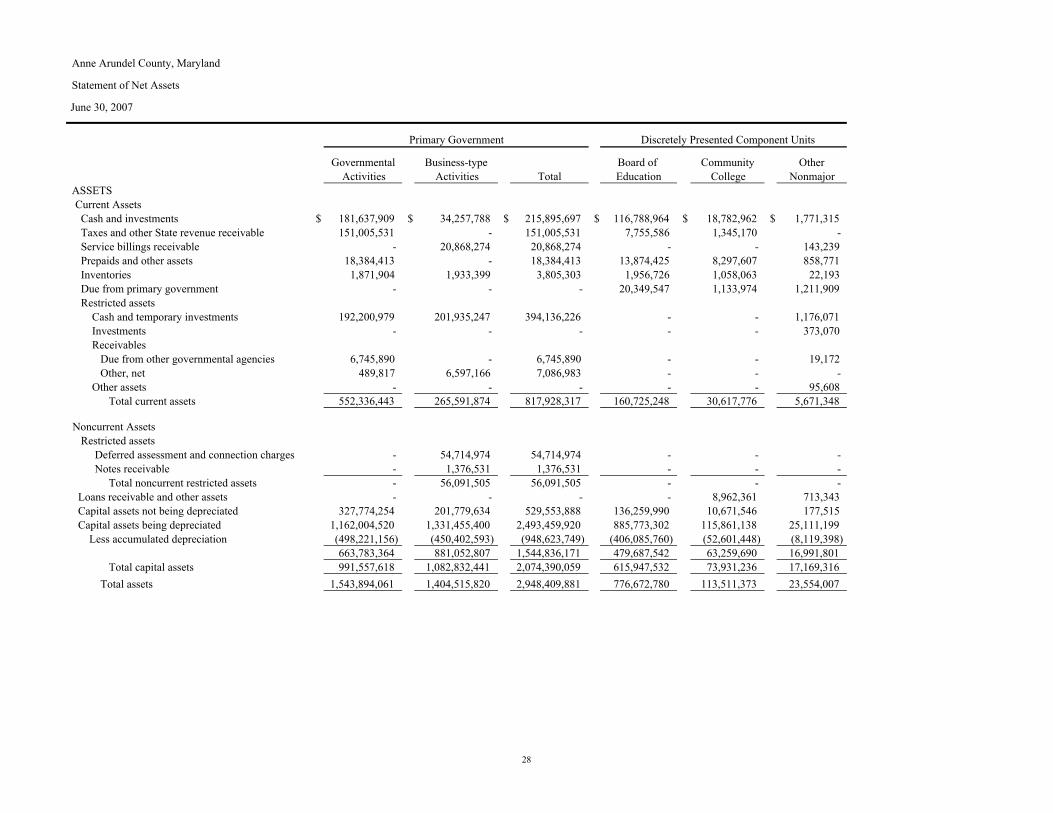
Anne Arundel County, Maryland
Statement of Net Assets
June 30, 2007
Primary Government Discretely Presented Component Units
Governmental Business-type Board of Community OtherActivities Activities Total Education College Nonmajor
ASSETS Current Assets Cash and investments $ 181,637,909 $ 34,257,788 $ 215,895,697 $ 116,788,964 $ 18,782,962 $ 1,771,315 Taxes and other State revenue receivable 151,005,531 - 151,005,531 7,755,586 1,345,170 - Service billings receivable - 20,868,274 20,868,274 - - 143,239 Prepaids and other assets 18,384,413 - 18,384,413 13,874,425 8,297,607 858,771 Inventories 1,871,904 1,933,399 3,805,303 1,956,726 1,058,063 22,193 Due from primary government - - - 20,349,547 1,133,974 1,211,909 Restricted assets Cash and temporary investments 192,200,979 201,935,247 394,136,226 - - 1,176,071 Investments - - - - - 373,070 Receivables Due from other governmental agencies 6,745,890 - 6,745,890 - - 19,172 Other, net 489,817 6,597,166 7,086,983 - - - Other assets - - - - - 95,608 Total current assets 552,336,443 265,591,874 817,928,317 160,725,248 30,617,776 5,671,348
Noncurrent Assets Restricted assets Deferred assessment and connection charges - 54,714,974 54,714,974 - - - Notes receivable - 1,376,531 1,376,531 - - - Total noncurrent restricted assets - 56,091,505 56,091,505 - - - Loans receivable and other assets - - - - 8,962,361 713,343 Capital assets not being depreciated 327,774,254 201,779,634 529,553,888 136,259,990 10,671,546 177,515 Capital assets being depreciated 1,162,004,520 1,331,455,400 2,493,459,920 885,773,302 115,861,138 25,111,199 Less accumulated depreciation (498,221,156) (450,402,593) (948,623,749) (406,085,760) (52,601,448) (8,119,398)
663,783,364 881,052,807 1,544,836,171 479,687,542 63,259,690 16,991,801 Total capital assets 991,557,618 1,082,832,441 2,074,390,059 615,947,532 73,931,236 17,169,316 Total assets 1,543,894,061 1,404,515,820 2,948,409,881 776,672,780 113,511,373 23,554,007
28
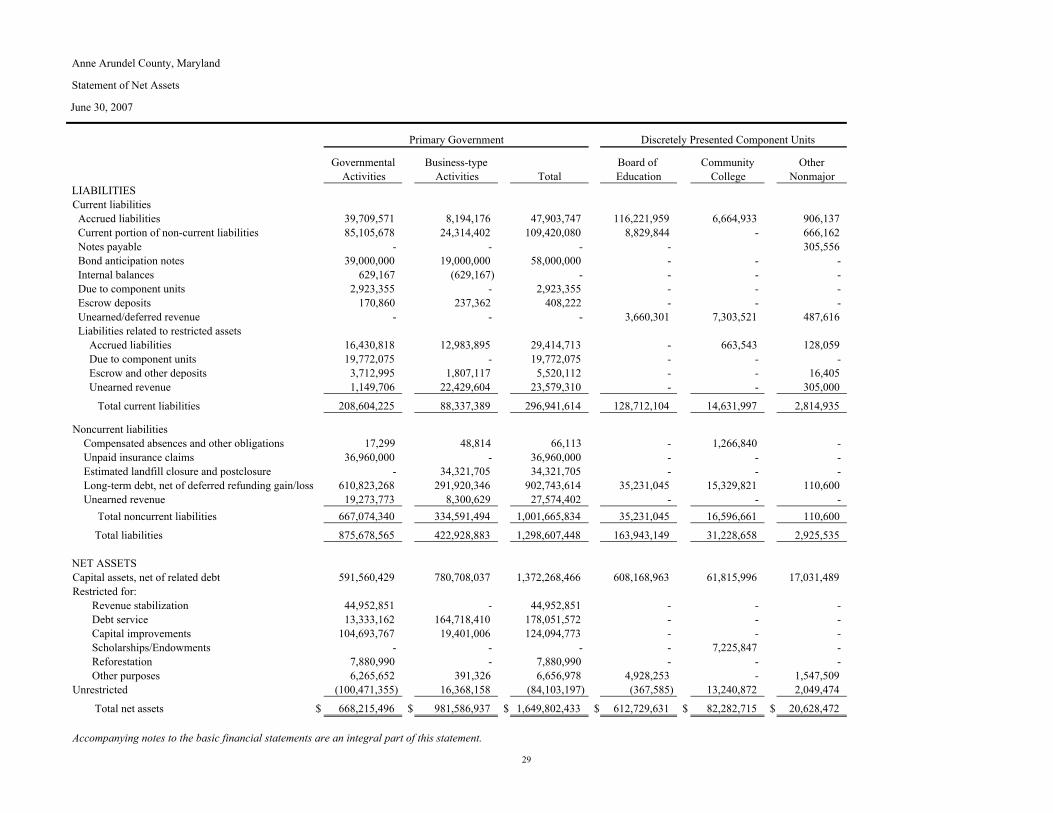
Anne Arundel County, Maryland
Statement of Net Assets
June 30, 2007
Primary Government Discretely Presented Component Units
Governmental Business-type Board of Community OtherActivities Activities Total Education College Nonmajor
LIABILITIESCurrent liabilities Accrued liabilities 39,709,571 8,194,176 47,903,747 116,221,959 6,664,933 906,137 Current portion of non-current liabilities 85,105,678 24,314,402 109,420,080 8,829,844 - 666,162 Notes payable - - - - 305,556 Bond anticipation notes 39,000,000 19,000,000 58,000,000 - - - Internal balances 629,167 (629,167) - - - - Due to component units 2,923,355 - 2,923,355 - - - Escrow deposits 170,860 237,362 408,222 - - - Unearned/deferred revenue - - - 3,660,301 7,303,521 487,616 Liabilities related to restricted assets Accrued liabilities 16,430,818 12,983,895 29,414,713 - 663,543 128,059 Due to component units 19,772,075 - 19,772,075 - - - Escrow and other deposits 3,712,995 1,807,117 5,520,112 - - 16,405 Unearned revenue 1,149,706 22,429,604 23,579,310 - - 305,000
Total current liabilities 208,604,225 88,337,389 296,941,614 128,712,104 14,631,997 2,814,935
Noncurrent liabilities Compensated absences and other obligations 17,299 48,814 66,113 - 1,266,840 - Unpaid insurance claims 36,960,000 - 36,960,000 - - - Estimated landfill closure and postclosure - 34,321,705 34,321,705 - - - Long-term debt, net of deferred refunding gain/loss 610,823,268 291,920,346 902,743,614 35,231,045 15,329,821 110,600 Unearned revenue 19,273,773 8,300,629 27,574,402 - - - Total noncurrent liabilities 667,074,340 334,591,494 1,001,665,834 35,231,045 16,596,661 110,600
Total liabilities 875,678,565 422,928,883 1,298,607,448 163,943,149 31,228,658 2,925,535
NET ASSETSCapital assets, net of related debt 591,560,429 780,708,037 1,372,268,466 608,168,963 61,815,996 17,031,489 Restricted for: Revenue stabilization 44,952,851 - 44,952,851 - - - Debt service 13,333,162 164,718,410 178,051,572 - - - Capital improvements 104,693,767 19,401,006 124,094,773 - - - Scholarships/Endowments - - - - 7,225,847 - Reforestation 7,880,990 - 7,880,990 - - - Other purposes 6,265,652 391,326 6,656,978 4,928,253 - 1,547,509 Unrestricted (100,471,355) 16,368,158 (84,103,197) (367,585) 13,240,872 2,049,474
Total net assets $ 668,215,496 $ 981,586,937 $ 1,649,802,433 $ 612,729,631 $ 82,282,715 $ 20,628,472
Accompanying notes to the basic financial statements are an integral part of this statement.
29
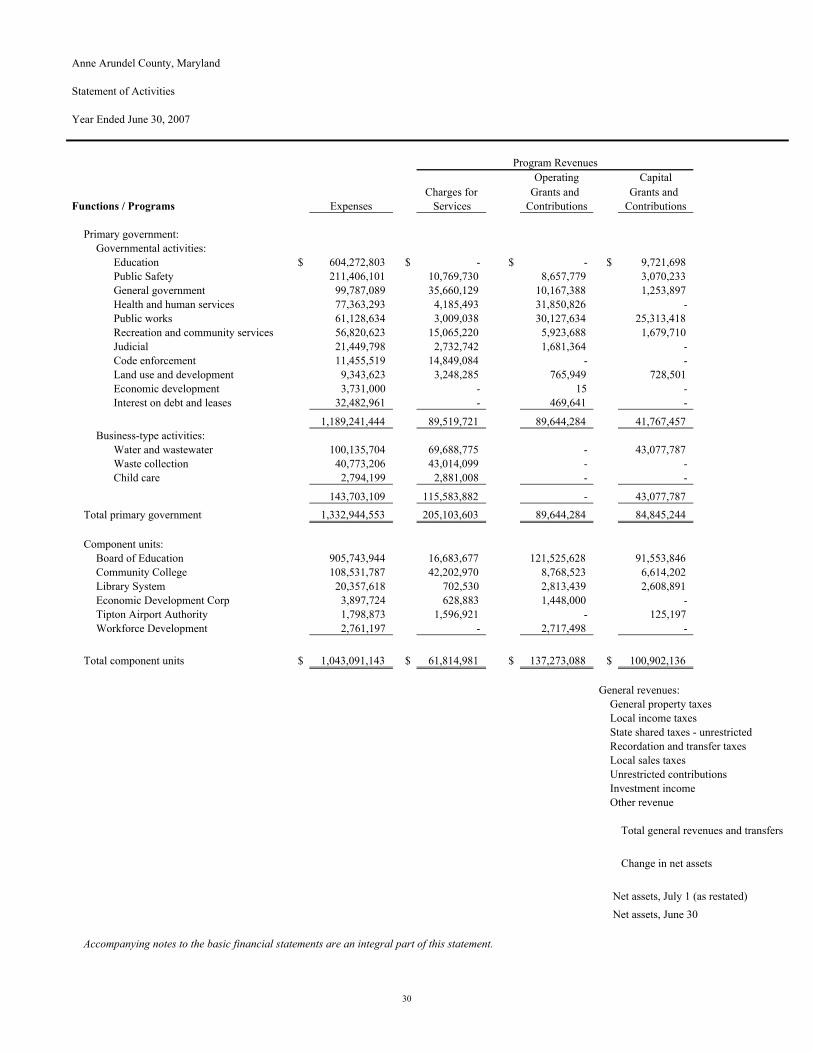
Anne Arundel County, Maryland
Statement of Activities
Year Ended June 30, 2007
Operating CapitalCharges for Grants and Grants and
Functions / Programs Expenses Services Contributions Contributions
Primary government:Governmental activities:
Education $ 604,272,803 $ - $ - $ 9,721,698 Public Safety 211,406,101 10,769,730 8,657,779 3,070,233 General government 99,787,089 35,660,129 10,167,388 1,253,897 Health and human services 77,363,293 4,185,493 31,850,826 - Public works 61,128,634 3,009,038 30,127,634 25,313,418 Recreation and community services 56,820,623 15,065,220 5,923,688 1,679,710 Judicial 21,449,798 2,732,742 1,681,364 - Code enforcement 11,455,519 14,849,084 - - Land use and development 9,343,623 3,248,285 765,949 728,501 Economic development 3,731,000 - 15 - Interest on debt and leases 32,482,961 - 469,641 -
1,189,241,444 89,519,721 89,644,284 41,767,457 Business-type activities:
Water and wastewater 100,135,704 69,688,775 - 43,077,787 Waste collection 40,773,206 43,014,099 - - Child care 2,794,199 2,881,008 - -
143,703,109 115,583,882 - 43,077,787 Total primary government 1,332,944,553 205,103,603 89,644,284 84,845,244
Component units:Board of Education 905,743,944 16,683,677 121,525,628 91,553,846 Community College 108,531,787 42,202,970 8,768,523 6,614,202 Library System 20,357,618 702,530 2,813,439 2,608,891 Economic Development Corp 3,897,724 628,883 1,448,000 - Tipton Airport Authority 1,798,873 1,596,921 - 125,197 Workforce Development 2,761,197 - 2,717,498 -
Total component units $ 1,043,091,143 $ 61,814,981 $ 137,273,088 $ 100,902,136
General revenues: General property taxes Local income taxes State shared taxes - unrestricted Recordation and transfer taxes Local sales taxes Unrestricted contributions Investment income Other revenue
Total general revenues and transfers
Change in net assets
Net assets, July 1 (as restated) Net assets, June 30
Accompanying notes to the basic financial statements are an integral part of this statement.
Program Revenues
30
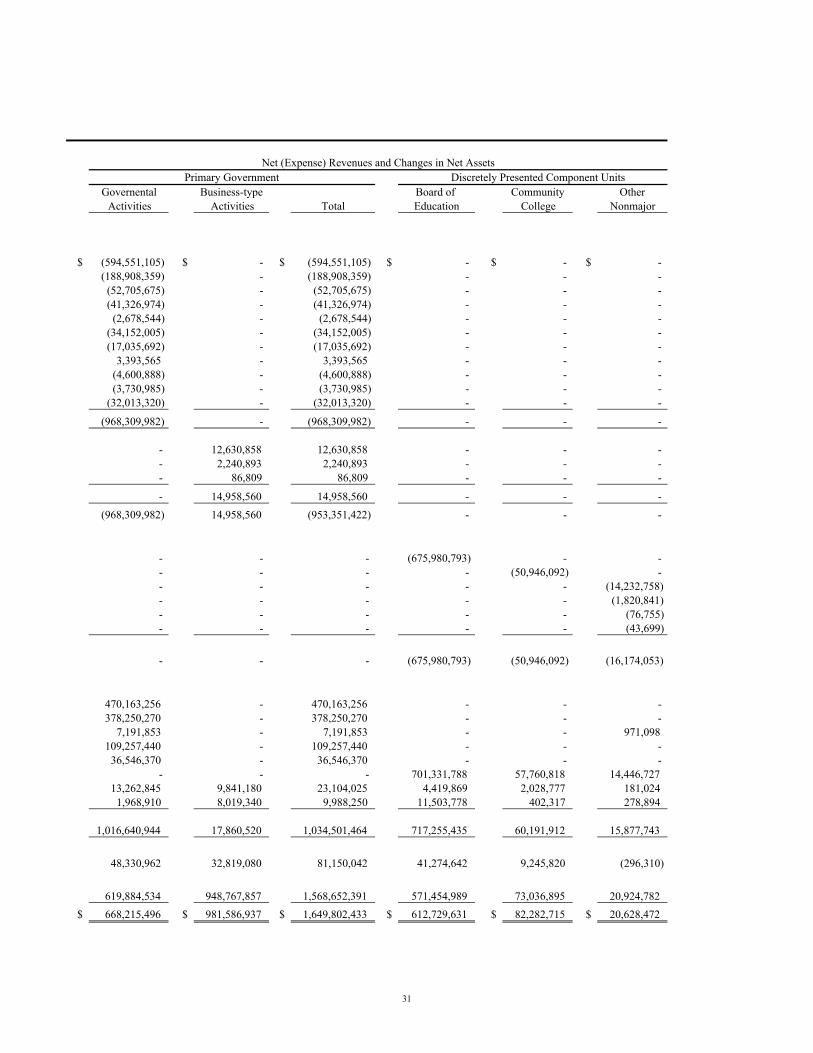
Primary Government Discretely Presented Component UnitsGovernental Business-type Board of Community Other
Activities Activities Total Education College Nonmajor
$ (594,551,105) $ - $ (594,551,105) $ - $ - $ - (188,908,359) - (188,908,359) - - -
(52,705,675) - (52,705,675) - - - (41,326,974) - (41,326,974) - - -
(2,678,544) - (2,678,544) - - - (34,152,005) - (34,152,005) - - - (17,035,692) - (17,035,692) - - -
3,393,565 - 3,393,565 - - - (4,600,888) - (4,600,888) - - - (3,730,985) - (3,730,985) - - -
(32,013,320) - (32,013,320) - - -
(968,309,982) - (968,309,982) - - -
- 12,630,858 12,630,858 - - - - 2,240,893 2,240,893 - - - - 86,809 86,809 - - -
- 14,958,560 14,958,560 - - - (968,309,982) 14,958,560 (953,351,422) - - -
- - - (675,980,793) - - - - - - (50,946,092) - - - - - - (14,232,758) - - - - - (1,820,841) - - - - - (76,755) - - - - - (43,699)
- - - (675,980,793) (50,946,092) (16,174,053)
470,163,256 - 470,163,256 - - - 378,250,270 - 378,250,270 - - -
7,191,853 - 7,191,853 - - 971,098 109,257,440 - 109,257,440 - - -
36,546,370 - 36,546,370 - - - - - - 701,331,788 57,760,818 14,446,727
13,262,845 9,841,180 23,104,025 4,419,869 2,028,777 181,024 1,968,910 8,019,340 9,988,250 11,503,778 402,317 278,894
1,016,640,944 17,860,520 1,034,501,464 717,255,435 60,191,912 15,877,743
48,330,962 32,819,080 81,150,042 41,274,642 9,245,820 (296,310)
619,884,534 948,767,857 1,568,652,391 571,454,989 73,036,895 20,924,782 $ 668,215,496 $ 981,586,937 $ 1,649,802,433 $ 612,729,631 $ 82,282,715 $ 20,628,472
Net (Expense) Revenues and Changes in Net Assets
31

Anne Arundel County, Maryland
Balance Sheet
Governmental Funds
June 30, 2007
Major Funds NonmajorGeneral County Governmental
General Impact Fees Capital Projects Funds TotalsASSETS
Cash and investments $ 115,450,156 $ 51,195,501 $ 111,792,804 $ 29,212,674 $ 307,651,135 Receivables
Property taxes (net of $1,435,729 allowance) 2,090,552 - - - 2,090,552
Local sales taxes 4,210,988 - - - 4,210,988 State shared revenues 22,919,522 - - - 22,919,522 Due from other governmental agencies
(net of $295,000 allowance) 9,161,955 - 5,816,669 929,221 15,907,845 Due from other funds 590,519 - - - 590,519 Local income tax 112,622,516 - - - 112,622,516 Other, net 10,164,599 24,798 68,048 396,971 10,654,416
Inventories 1,275,968 - - - 1,275,968 Total assets 278,486,775 51,220,299 117,677,521 30,538,866 477,923,461
LIABILITIESAccrued liabilities 26,659,527 - 14,420,353 2,010,465 43,090,345 Due to other funds - - - 181,042 181,042 Due to component units
Board of Education 1,888,009 - 18,461,538 - 20,349,547 Community College - - 1,133,974 - 1,133,974 Library 1,035,346 - - - 1,035,346 Economic Development - - - 176,563 176,563
Escrow and other deposits 170,860 - - 3,712,995 3,883,855 Deferred revenue 84,013,084 - 4,583,099 175,598 88,771,781
Total liabilities 113,766,826 - 38,598,964 6,256,663 158,622,453 FUND BALANCES:
Reserved for:Encumbrances 7,821,979 - 28,988,127 5,235,194 42,045,300 Revenue stabilization fund 44,952,851 - - - 44,952,851 Golf courses reserves 634,863 - - - 634,863 Reserved for debt service 6,071,789 - - 879 6,072,668 Reserved for other purposes 121,743 - - - 121,743 Inventories 1,275,968 - - - 1,275,968
Unreserved:Designated for next year's expenditures in:
General fund 60,880,400 - - - 60,880,400 Special revenue funds - 41,879,259 - 4,257,435 46,136,694 Capital projects funds - - - 533,300 533,300 Debt service funds - - - 2,103,086 2,103,086
Undesignated in:General fund 42,960,356 - - - 42,960,356 Special revenue funds - 9,341,040 - 6,858,670 16,199,710 Capital projects funds - - 50,090,430 156,231 50,246,661 Debt service funds - - - 5,137,408 5,137,408 Total fund balances 164,719,949 51,220,299 79,078,557 24,282,203 319,301,008 Total liabilities and fund balances $ 278,486,775 $ 51,220,299 $ 117,677,521 $ 30,538,866 $ 477,923,461
32
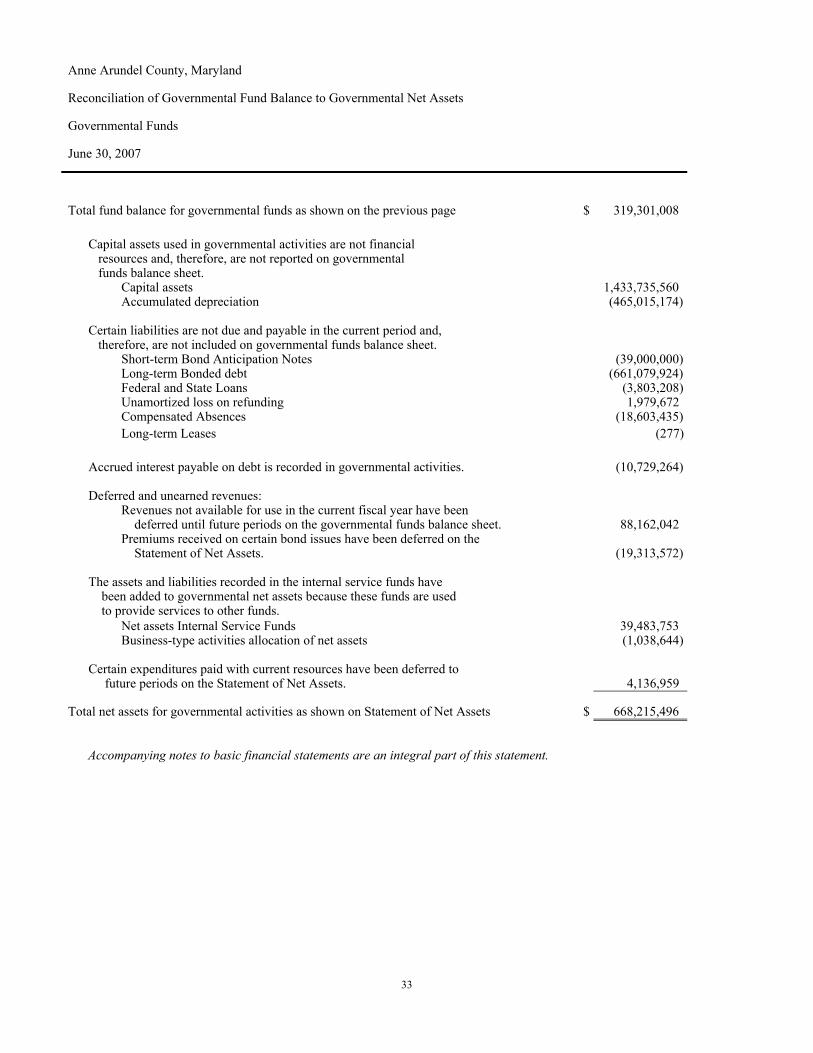
Anne Arundel County, Maryland
Reconciliation of Governmental Fund Balance to Governmental Net Assets
Governmental Funds
June 30, 2007
Total fund balance for governmental funds as shown on the previous page $ 319,301,008
Capital assets used in governmental activities are not financial resources and, therefore, are not reported on governmental funds balance sheet.
Capital assets 1,433,735,560 Accumulated depreciation (465,015,174)
Certain liabilities are not due and payable in the current period and, therefore, are not included on governmental funds balance sheet.
Short-term Bond Anticipation Notes (39,000,000) Long-term Bonded debt (661,079,924) Federal and State Loans (3,803,208) Unamortized loss on refunding 1,979,672 Compensated Absences (18,603,435) Long-term Leases (277)
Accrued interest payable on debt is recorded in governmental activities. (10,729,264)
Deferred and unearned revenues: Revenues not available for use in the current fiscal year have been deferred until future periods on the governmental funds balance sheet. 88,162,042 Premiums received on certain bond issues have been deferred on the Statement of Net Assets. (19,313,572)
The assets and liabilities recorded in the internal service funds have been added to governmental net assets because these funds are used to provide services to other funds.
Net assets Internal Service Funds 39,483,753 Business-type activities allocation of net assets (1,038,644)
Certain expenditures paid with current resources have been deferred to future periods on the Statement of Net Assets. 4,136,959
Total net assets for governmental activities as shown on Statement of Net Assets $ 668,215,496
Accompanying notes to basic financial statements are an integral part of this statement.
33

Anne Arundel County, Maryland
Statement of Revenues, Expenditures and Changes in Fund Balances
Governmental Funds
Year Ended June 30, 2007
Major Funds NonmajorGeneral County Governmental
General Impact Fees Capital Projects Funds TotalsREVENUES
General property taxes $ 457,825,362 $ - $ - $ 15,056,729 $ 472,882,091 Local income taxes 361,956,043 - - - 361,956,043 State shared taxes 37,005,207 - - - 37,005,207 Grants and aid 45,313,435 - 5,779,912 11,791,526 62,884,873 Recordation and transfer taxes 109,257,440 - - - 109,257,440 Local sales taxes 34,604,174 - - 1,942,196 36,546,370 License and permit fees 17,681,827 - - - 17,681,827 Impact fees - 9,268,611 - - 9,268,611 Special community benefit taxes - - - 5,354,940 5,354,940 Investment income 8,428,398 2,883,014 4,073,421 917,464 16,302,297 Fees for services and other revenue 40,349,736 - 4,820,888 6,568,436 51,739,060
Total revenues 1,112,421,622 12,151,625 14,674,221 41,631,291 1,180,878,759
EXPENDITURESCurrent
Education 519,439,452 - 84,196,363 - 603,635,815 Public safety 210,094,524 - - 1,179,214 211,273,738 General government 73,567,009 - - 451,813 74,018,822 Health and human services 72,740,484 - - 4,687,576 77,428,060 Public works 30,512,823 32,611 - 953,157 31,498,591 Recreation and community services 35,043,576 - - 11,188,073 46,231,649 Judicial 20,224,216 - - - 20,224,216 Code enforcement 11,599,781 - - - 11,599,781 Land use and development 8,305,230 - - 1,074,244 9,379,474 Economic development 1,841,000 - - 1,890,000 3,731,000
Capital outlay 4,268,966 - 65,140,296 372,819 69,782,081 Debt service
Interest payments on debt 26,770,718 - - 3,196,600 29,967,318 Principal payments on debt 86,672,851 - - 1,138,258 87,811,109 Interest payments on leases 3,743 - - - 3,743 Principal payments on leases 57,105 - - - 57,105
Total expenditures 1,101,141,478 32,611 149,336,659 26,131,754 1,276,642,502
Revenues over (under) expenditures 11,280,144 12,119,014 (134,662,438) 15,499,537 (95,763,743)
OTHER FINANCING SOURCES (USES)Transfers in 27,726,215 - 123,682,221 2,217,678 153,626,114 Transfers out (119,039,273) (13,150,283) (8,265,494) (13,171,064) (153,626,114) General obligation bonds issued 92,400,000 - - - 92,400,000 Bond anticipation notes issued - - 39,000,000 - 39,000,000 Installment purchase contracts issued - - 926,000 - 926,000 Issuance of debt - Federal and State Loans - - 1,248,943 - 1,248,943 Premiums from sale of bonds 5,101,149 - - - 5,101,149 Transfers from proprietary funds 99,489 - 900,000 - 999,489
Total other financing sources (uses) 6,287,580 (13,150,283) 157,491,670 (10,953,386) 139,675,581
Net change in fund balances 17,567,724 (1,031,269) 22,829,232 4,546,151 43,911,838
Fund balances, July 1 (as restated) 147,152,225 52,251,568 56,249,325 19,736,052 275,389,170
Fund balances, June 30 $ 164,719,949 $ 51,220,299 $ 79,078,557 $ 24,282,203 $ 319,301,008
Accompanying notes to basic financial statements are an integral part of this statement.
34

Anne Arundel County, Maryland
Reconciliation of Changes in Fund Balances to Changes in Net Assets
Governmental Funds
Year Ended June 30, 2007
Changes in fund balances as shown on Statement of Revenues,Expenditures, and Changes in Fund Balances, Governmental Funds $ 43,911,838
Governmental funds report capital outlays as expenditures. However, in the Statement of Activities, the cost of capital assets is allocated over the estimated useful lives of those assets through an annual depreciation charge. The differences are as follows: Current year additions and donations of capital assets 69,270,476 Current year disposals of capital assets (830,423) Depreciation expense recorded in the Statement of Activities (35,971,872)
Governmental funds report the additions and payments of long term liabilities in the period that current resources are provided or used. However, in the Statement of Activities, new debt is recorded as a liability and payments of principal are charged against that liability. In addition, interest payable must be accrued from the date of the last interest payment to the end of the fiscal year. Debt related differences are as follows: New debt issued in current year (155,164,022) Principal payments on debt 108,916,253 Change in accrued interest payable (2,382,146) Amortization of prior year refunding gain/loss (983,066)
Certain charges paid with current financial resources are deferred and amortized over one or more periods on the Statement of Activities. The differences are as follows: Expense was deferred to future periods 1,935,453 Amortization of expenditures deferred in previous years (731,182)
Premiums received on bond issues have been deferred in the government-wide statements. The revenue will be recognized over the life of the related bonds. The differences are as follows: Deferred revenue (5,101,149) Amortization of amounts deferred 1,739,669
Certain revenue was deferred on the governmental fund statements because it was not available to pay expenditures of the current period. These deferred amounts are recognized as revenue in the Statement of Activities. 14,725,569
The current year activity in the internal service funds has been combined and eliminated against the governmental activities in the Statement of Activities. However, the net activity in the internal service funds that resulted from provision of services to business-type activities, component units, and outside agencies must be recognized in the Statement of Activities. 8,995,564
Changes in Net assets as shown in governmental activities on the Statement of Activities $ 48,330,962
Accompanying notes to basic financial statements are an integral part of this statement.
35
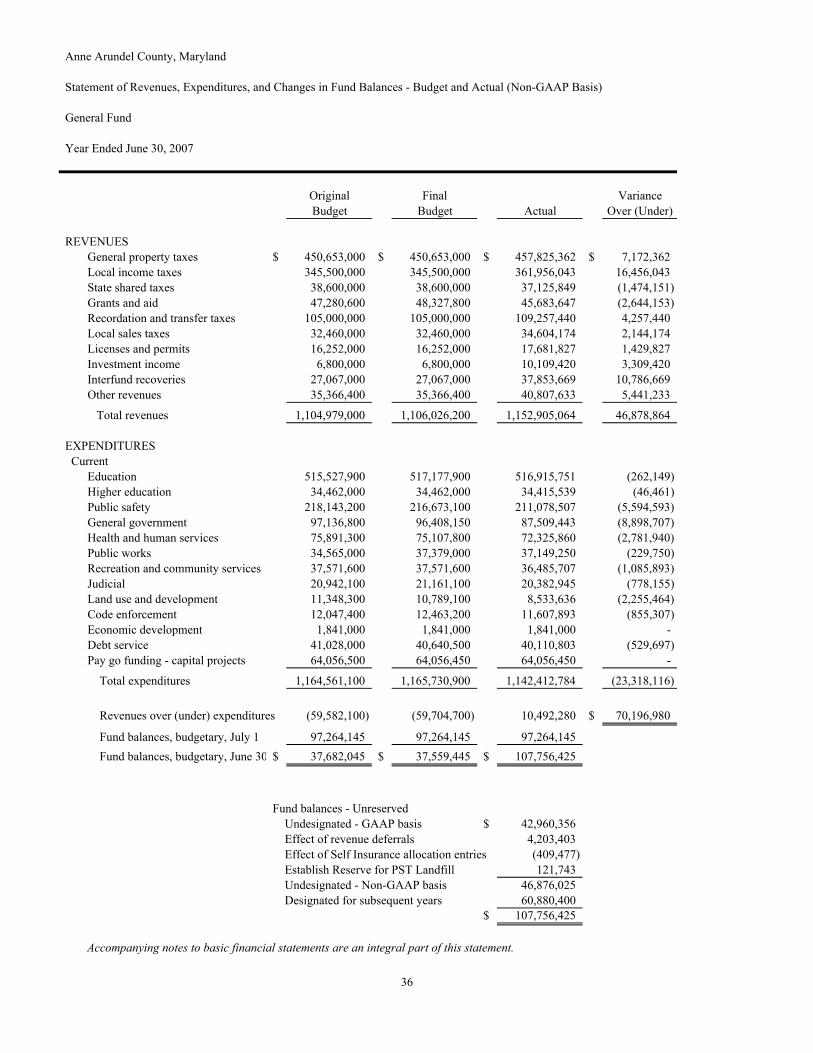
Anne Arundel County, Maryland
Statement of Revenues, Expenditures, and Changes in Fund Balances - Budget and Actual (Non-GAAP Basis)
General Fund
Year Ended June 30, 2007
Original Final VarianceBudget Budget Actual Over (Under)
REVENUESGeneral property taxes $ 450,653,000 $ 450,653,000 $ 457,825,362 $ 7,172,362 Local income taxes 345,500,000 345,500,000 361,956,043 16,456,043 State shared taxes 38,600,000 38,600,000 37,125,849 (1,474,151) Grants and aid 47,280,600 48,327,800 45,683,647 (2,644,153) Recordation and transfer taxes 105,000,000 105,000,000 109,257,440 4,257,440 Local sales taxes 32,460,000 32,460,000 34,604,174 2,144,174 Licenses and permits 16,252,000 16,252,000 17,681,827 1,429,827 Investment income 6,800,000 6,800,000 10,109,420 3,309,420 Interfund recoveries 27,067,000 27,067,000 37,853,669 10,786,669 Other revenues 35,366,400 35,366,400 40,807,633 5,441,233
Total revenues 1,104,979,000 1,106,026,200 1,152,905,064 46,878,864
EXPENDITURES Current
Education 515,527,900 517,177,900 516,915,751 (262,149) Higher education 34,462,000 34,462,000 34,415,539 (46,461) Public safety 218,143,200 216,673,100 211,078,507 (5,594,593) General government 97,136,800 96,408,150 87,509,443 (8,898,707) Health and human services 75,891,300 75,107,800 72,325,860 (2,781,940) Public works 34,565,000 37,379,000 37,149,250 (229,750) Recreation and community services 37,571,600 37,571,600 36,485,707 (1,085,893) Judicial 20,942,100 21,161,100 20,382,945 (778,155) Land use and development 11,348,300 10,789,100 8,533,636 (2,255,464) Code enforcement 12,047,400 12,463,200 11,607,893 (855,307) Economic development 1,841,000 1,841,000 1,841,000 - Debt service 41,028,000 40,640,500 40,110,803 (529,697) Pay go funding - capital projects 64,056,500 64,056,450 64,056,450 -
Total expenditures 1,164,561,100 1,165,730,900 1,142,412,784 (23,318,116)
Revenues over (under) expenditures (59,582,100) (59,704,700) 10,492,280 $ 70,196,980
Fund balances, budgetary, July 1 97,264,145 97,264,145 97,264,145 Fund balances, budgetary, June 30 $ 37,682,045 $ 37,559,445 $ 107,756,425
Fund balances - Unreserved Undesignated - GAAP basis $ 42,960,356 Effect of revenue deferrals 4,203,403 Effect of Self Insurance allocation entries (409,477) Establish Reserve for PST Landfill 121,743 Undesignated - Non-GAAP basis 46,876,025 Designated for subsequent years 60,880,400
$ 107,756,425
Accompanying notes to basic financial statements are an integral part of this statement.
36

Anne Arundel County, Maryland
Statement of Net Assets
Proprietary Funds
June 30, 2007
Governmental Activities
Major Funds Nonmajor Fund
Water and Solid Internal Wastewater Waste Child Care Totals Service Funds
ASSETSCurrent Assets Cash and investments $ 15,320,712 $ 17,712,632 $ 1,224,444 $ 34,257,788 $ 66,187,753 Service billings receivable 19,194,874 1,673,395 5 20,868,274 3,441,601 Inventories 1,823,132 110,267 - 1,933,399 595,936 Other - - - - 641,252 Restricted assets Cash and temporary investments 184,656,655 17,278,592 - 201,935,247 - Receivables Other, net 6,597,166 - - 6,597,166 - Total current assets 227,592,539 36,774,886 1,224,449 265,591,874 70,866,542 Noncurrent assets Restricted assets Deferred connection and assessment charges 54,714,974 - - 54,714,974 - Notes receivable 1,376,531 - - 1,376,531 - Capital assets 1,469,147,908 64,087,126 - 1,533,235,034 56,043,214 Less accumulated depreciation (416,536,257) (33,866,336) - (450,402,593) (33,205,982) Total capital assets, net of depreciation 1,052,611,651 30,220,790 - 1,082,832,441 22,837,232 Total noncurrent assets 1,108,703,156 30,220,790 - 1,138,923,946 22,837,232 Total assets 1,336,295,695 66,995,676 1,224,449 1,404,515,820 93,703,774
LIABILITIES
Current liabilities Accrued liabilities 6,007,258 2,057,049 129,869 8,194,176 2,320,780 Current portion of long-term debt and obligations 20,908,916 3,371,005 34,481 24,314,402 14,421,774 Bond anticipation notes 19,000,000 - - 19,000,000 - Due to other funds 380,909 16,665 11,903 409,477 - Escrow deposits 128,796 108,566 - 237,362 - Deferred revenue - - - - 500,168 Liabilities related to restricted assets Accrued liabilities 12,983,145 750 - 12,983,895 - Escrow deposits 1,807,117 - - 1,807,117 - Deferred revenue 22,429,604 - - 22,429,604 - Total current liabilities 83,645,745 5,554,035 176,253 89,376,033 17,242,722
Noncurrent liabilities Accrued liability for compensated absences - 44,953 3,861 48,814 17,299 Unpaid insurance claims - - - - 36,960,000 Estimated landfill closure and postclosure - 34,321,705 - 34,321,705 - Long-term debt, net of deferred refunding loss 274,695,220 17,225,126 - 291,920,346 - Deferred revenue 8,300,629 - - 8,300,629 - Total noncurrent liabilities 282,995,849 51,591,784 3,861 334,591,494 36,977,299 Total liabilities 366,641,594 57,145,819 180,114 423,967,527 54,220,021
NET ASSETSInvested in capital assets, net of related debt 766,225,115 14,482,922 - 780,708,037 22,837,232 Restricted for debt service 164,718,410 - - 164,718,410 - Restricted for capital improvements 18,633,399 767,607 - 19,401,006 - Restricted for other purposes - 391,326 - 391,326 - Unrestricted 20,077,177 (5,791,998) 1,044,335 15,329,514 16,646,521 Total net assets $ 969,654,101 $ 9,849,857 $ 1,044,335 $ 980,548,293 $ 39,483,753
Accompanying notes to basic financial statements are an integral part of this statement.
Business-Type Activities - Enterprise Funds
37

Anne Arundel County, Maryland
Reconciliation of Enterprise Funds Net Assets to Business-type Net Assets
Proprietary Funds
June 30, 2007
Net assets as shown on previous page $ 980,548,293
The cumulative net results of Internal Service Funds activity, as it relates to Enterprise Funds' customers has been accumulated as a receivable in business-type activities. 1,038,644 Net assets shown on government wide statement of net assets $ 981,586,937
Accompanying notes to basic financial statements are an integral part of this statement.
38
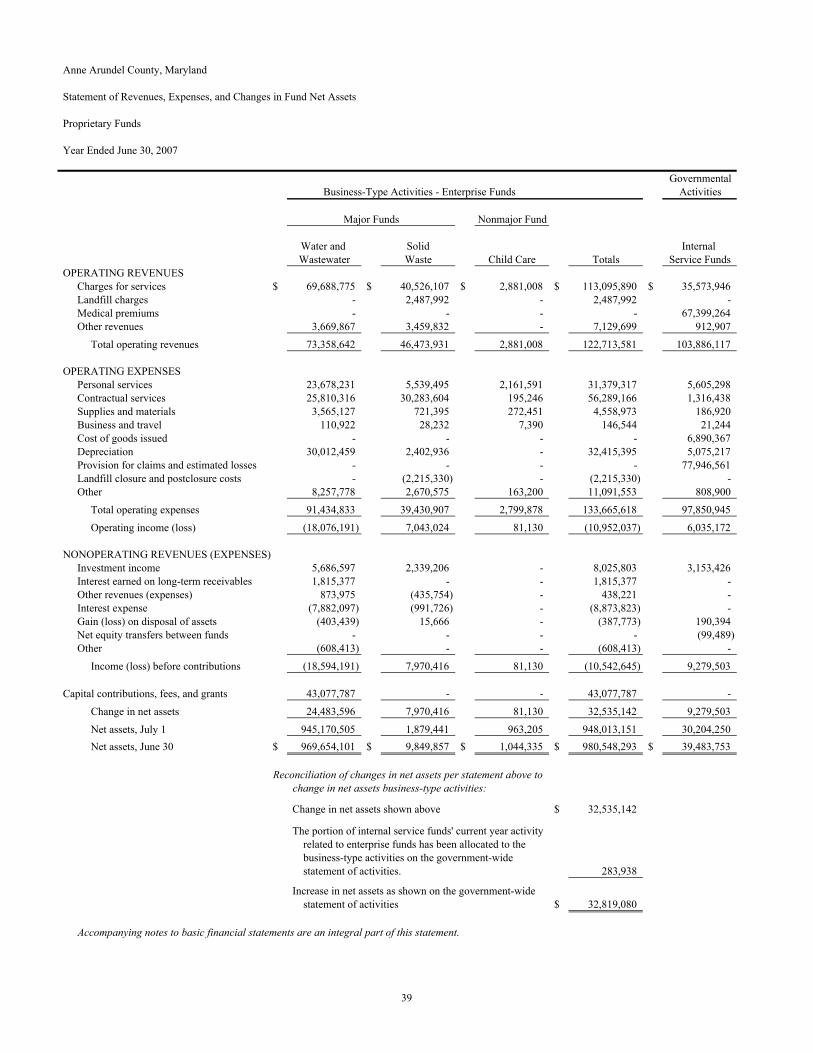
Anne Arundel County, Maryland
Statement of Revenues, Expenses, and Changes in Fund Net Assets
Proprietary Funds
Year Ended June 30, 2007
GovernmentalBusiness-Type Activities - Enterprise Funds Activities
Major Funds Nonmajor Fund
Water and Solid Internal Wastewater Waste Child Care Totals Service Funds
OPERATING REVENUESCharges for services $ 69,688,775 $ 40,526,107 $ 2,881,008 $ 113,095,890 $ 35,573,946 Landfill charges - 2,487,992 - 2,487,992 - Medical premiums - - - - 67,399,264 Other revenues 3,669,867 3,459,832 - 7,129,699 912,907
Total operating revenues 73,358,642 46,473,931 2,881,008 122,713,581 103,886,117
OPERATING EXPENSESPersonal services 23,678,231 5,539,495 2,161,591 31,379,317 5,605,298 Contractual services 25,810,316 30,283,604 195,246 56,289,166 1,316,438 Supplies and materials 3,565,127 721,395 272,451 4,558,973 186,920 Business and travel 110,922 28,232 7,390 146,544 21,244 Cost of goods issued - - - - 6,890,367 Depreciation 30,012,459 2,402,936 - 32,415,395 5,075,217 Provision for claims and estimated losses - - - - 77,946,561 Landfill closure and postclosure costs - (2,215,330) - (2,215,330) - Other 8,257,778 2,670,575 163,200 11,091,553 808,900
Total operating expenses 91,434,833 39,430,907 2,799,878 133,665,618 97,850,945
Operating income (loss) (18,076,191) 7,043,024 81,130 (10,952,037) 6,035,172
NONOPERATING REVENUES (EXPENSES)Investment income 5,686,597 2,339,206 - 8,025,803 3,153,426 Interest earned on long-term receivables 1,815,377 - - 1,815,377 - Other revenues (expenses) 873,975 (435,754) - 438,221 - Interest expense (7,882,097) (991,726) - (8,873,823) - Gain (loss) on disposal of assets (403,439) 15,666 - (387,773) 190,394 Net equity transfers between funds - - - - (99,489) Other (608,413) - - (608,413) -
Income (loss) before contributions (18,594,191) 7,970,416 81,130 (10,542,645) 9,279,503
Capital contributions, fees, and grants 43,077,787 - - 43,077,787 -
Change in net assets 24,483,596 7,970,416 81,130 32,535,142 9,279,503
Net assets, July 1 945,170,505 1,879,441 963,205 948,013,151 30,204,250 Net assets, June 30 $ 969,654,101 $ 9,849,857 $ 1,044,335 $ 980,548,293 $ 39,483,753
Reconciliation of changes in net assets per statement above to change in net assets business-type activities:
Change in net assets shown above $ 32,535,142
The portion of internal service funds' current year activity related to enterprise funds has been allocated to the business-type activities on the government-wide statement of activities. 283,938
Increase in net assets as shown on the government-wide statement of activities $ 32,819,080
Accompanying notes to basic financial statements are an integral part of this statement.
39

Anne Arundel County, Maryland
Statement of Cash Flows
Proprietary Funds
Year Ended June 30, 2007
GovernmentalBusiness-Type Activities - Enterprise Funds Activities
Major Funds Nonmajor Fund
Water and Solid Internal Wastewater Waste Child Care Totals Service Funds
CASH FLOWS FROM OPERATING ACTIVITIES: Cash received for services $ 73,455,914 $ 45,860,084 $ 2,883,048 $ 122,199,046 $ 101,368,606 Cash received for expense reimbursement - - - - 282,308 Cash payments to suppliers for goods and services (37,732,929) (31,088,104) (633,382) (69,454,415) (8,365,889) Cash payments to employees for services (23,398,273) (5,600,167) (2,121,997) (31,120,437) (5,609,315) Cash payments for insurance claims - - - - (74,483,821) Other receipts (expenses) - (2,699,200) - (2,699,200) 91,234
Net cash provided by operating activities 12,324,712 6,472,613 127,669 18,924,994 13,283,123
CASH FLOWS FROM NONCAPITAL FINANCING ACTIVITIES: Payments of long-term debt related to closure activities - (436,560) - (436,560) - Interest payments related to closure activities - (240,981) - (240,981) - Asset transfers between funds - - - - (72,754)
Net cash used for noncapital financing activities - (677,541) - (677,541) (72,754)
CASH FLOWS FROM CAPITAL AND RELATED FINANCING ACTIVITIES: Proceeds from sale of bonds and bond anticipation notes 61,500,000 3,500,000 - 65,000,000 - Proceeds from loan 7,462,041 - - 7,462,041 - Proceeds from developers' contributions 1,066,147 - - 1,066,147 - Refunds to developers (611,290) - - (611,290) - Assessments and connection charges 46,731,334 - - 46,731,334 - Environmental protection fees for capital assets 4,521,401 - - 4,521,401 - Payments of long-term debt (19,086,724) (2,627,802) - (21,714,526) - Payments of bond anticipation notes (18,500,000) (2,500,000) - (21,000,000) - Interest payments (12,269,531) (753,105) - (13,022,636) - Acquisition and construction of capital assets (45,586,533) (2,084,246) - (47,670,779) (6,963,384) Payments of debt issuance costs (151,725) - - (151,725) - Premium on sale of bonds 1,327,068 - - 1,327,068 - Payments received on note receivable 1,874,505 - - 1,874,505 - Other costs (565,654) - - (565,654) -
Net cash provided by (used for) capital and related financing activities 27,711,039 (4,465,153) - 23,245,886 (6,963,384)
40
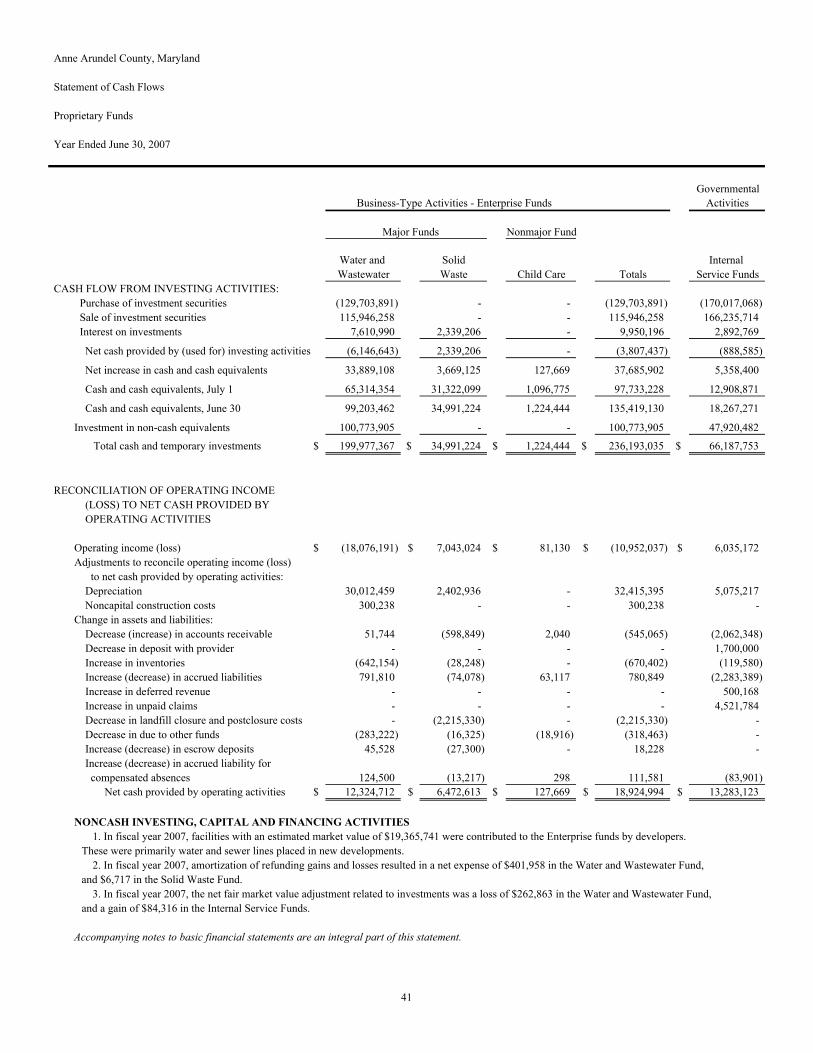
Anne Arundel County, Maryland
Statement of Cash Flows
Proprietary Funds
Year Ended June 30, 2007
GovernmentalBusiness-Type Activities - Enterprise Funds Activities
Major Funds Nonmajor Fund
Water and Solid Internal Wastewater Waste Child Care Totals Service Funds
CASH FLOW FROM INVESTING ACTIVITIES: Purchase of investment securities (129,703,891) - - (129,703,891) (170,017,068) Sale of investment securities 115,946,258 - - 115,946,258 166,235,714 Interest on investments 7,610,990 2,339,206 - 9,950,196 2,892,769
Net cash provided by (used for) investing activities (6,146,643) 2,339,206 - (3,807,437) (888,585)
Net increase in cash and cash equivalents 33,889,108 3,669,125 127,669 37,685,902 5,358,400
Cash and cash equivalents, July 1 65,314,354 31,322,099 1,096,775 97,733,228 12,908,871
Cash and cash equivalents, June 30 99,203,462 34,991,224 1,224,444 135,419,130 18,267,271
Investment in non-cash equivalents 100,773,905 - - 100,773,905 47,920,482
Total cash and temporary investments $ 199,977,367 $ 34,991,224 $ 1,224,444 $ 236,193,035 $ 66,187,753
RECONCILIATION OF OPERATING INCOME (LOSS) TO NET CASH PROVIDED BY OPERATING ACTIVITIES
Operating income (loss) $ (18,076,191) $ 7,043,024 $ 81,130 $ (10,952,037) $ 6,035,172 Adjustments to reconcile operating income (loss) to net cash provided by operating activities: Depreciation 30,012,459 2,402,936 - 32,415,395 5,075,217 Noncapital construction costs 300,238 - - 300,238 - Change in assets and liabilities: Decrease (increase) in accounts receivable 51,744 (598,849) 2,040 (545,065) (2,062,348) Decrease in deposit with provider - - - - 1,700,000 Increase in inventories (642,154) (28,248) - (670,402) (119,580) Increase (decrease) in accrued liabilities 791,810 (74,078) 63,117 780,849 (2,283,389) Increase in deferred revenue - - - - 500,168 Increase in unpaid claims - - - - 4,521,784 Decrease in landfill closure and postclosure costs - (2,215,330) - (2,215,330) - Decrease in due to other funds (283,222) (16,325) (18,916) (318,463) - Increase (decrease) in escrow deposits 45,528 (27,300) - 18,228 - Increase (decrease) in accrued liability for compensated absences 124,500 (13,217) 298 111,581 (83,901) Net cash provided by operating activities $ 12,324,712 $ 6,472,613 $ 127,669 $ 18,924,994 $ 13,283,123
NONCASH INVESTING, CAPITAL AND FINANCING ACTIVITIES 1. In fiscal year 2007, facilities with an estimated market value of $19,365,741 were contributed to the Enterprise funds by developers. These were primarily water and sewer lines placed in new developments. 2. In fiscal year 2007, amortization of refunding gains and losses resulted in a net expense of $401,958 in the Water and Wastewater Fund, and $6,717 in the Solid Waste Fund. 3. In fiscal year 2007, the net fair market value adjustment related to investments was a loss of $262,863 in the Water and Wastewater Fund, and a gain of $84,316 in the Internal Service Funds.
Accompanying notes to basic financial statements are an integral part of this statement.
41

Anne Arundel County, Maryland
Statement of Fiduciary Net Assets
Fiduciary Funds
June 30, 2007
PensionTrust Funds Agency
(As of December 31, 2006) Funds
ASSETSInvestments, at fair value: Cash and temporary investments $ 129,179,624 $ 20,546,500 U. S. Government obligations 24,462,735 - Corporate obligations 175,953,309 - Corporate obligation investment pools 69,488,714 - International obligations 468,195 - Common stocks 492,538,536 - Common stock investment pools 40,206,520 - International stock investment pools 309,360,506 - Private markets 5,496,453 - Real estate investment pools 64,805,049 - Insurance company general accounts 42,064,903 - Absolute Return funds 58,719,391 -
Total investments 1,412,743,935 20,546,500 Collateral from securities lending transactions 119,560,341 - Receivables: Employer contributions 2,978,898 - Participant contributions 704,156 - Accrued interest and dividends 3,660,813 - Investment sales proceeds 148,545,169 -
Total receivables 155,889,036 -
Deposits on hand 224,075 -
Total assets 1,688,417,387 20,546,500
LIABILITIESAccounts payable 1,001,552 - Escrow and other deposits - 20,546,500 Investment commitments payable 200,551,865 - Obligation for collateral received under securities lending transactions 119,560,341 -
Total liabilities 321,113,758 20,546,500
NET ASSETS HELD IN TRUST FOR PENSION BENEFITS $ 1,367,303,629 $ - (A schedule of funding progress for each plan is presented on page 70.)
Accompanying notes to the basic financial statements are an integral part of this statement.
42
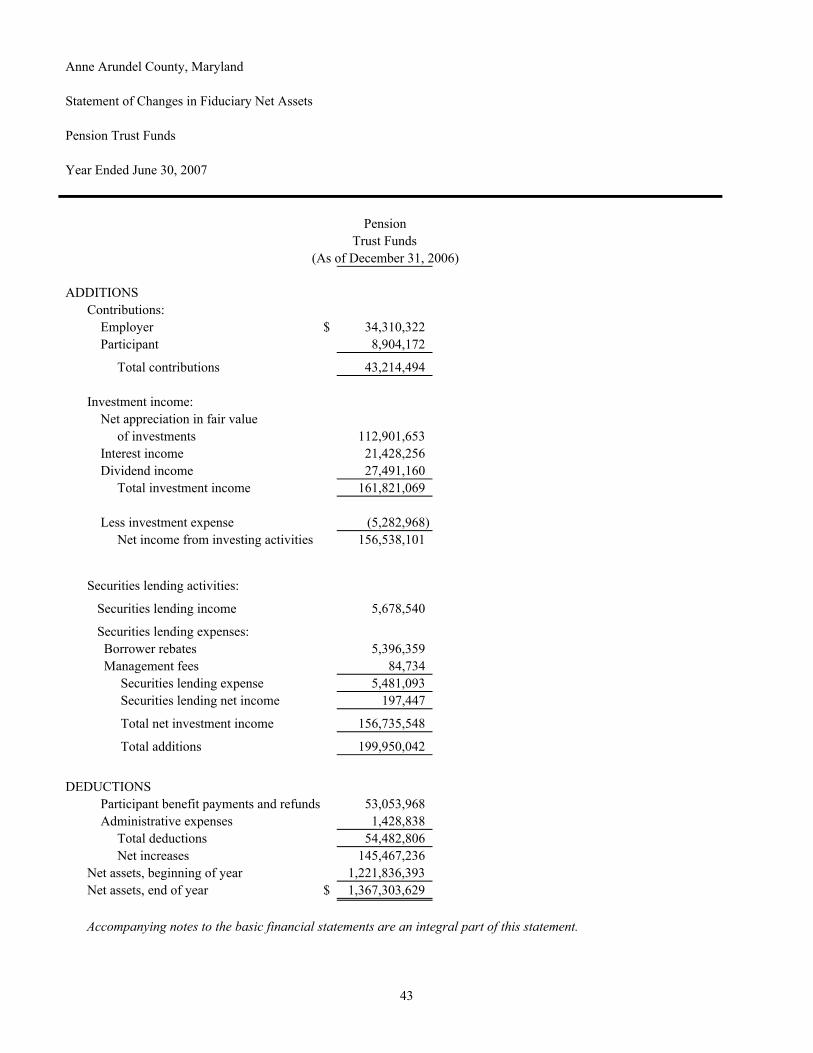
Anne Arundel County, Maryland
Statement of Changes in Fiduciary Net Assets
Pension Trust Funds
Year Ended June 30, 2007
PensionTrust Funds
(As of December 31, 2006)
ADDITIONSContributions: Employer $ 34,310,322 Participant 8,904,172
Total contributions 43,214,494
Investment income: Net appreciation in fair value of investments 112,901,653 Interest income 21,428,256 Dividend income 27,491,160 Total investment income 161,821,069
Less investment expense (5,282,968) Net income from investing activities 156,538,101
Securities lending activities:
Securities lending income 5,678,540
Securities lending expenses: Borrower rebates 5,396,359 Management fees 84,734 Securities lending expense 5,481,093 Securities lending net income 197,447
Total net investment income 156,735,548
Total additions 199,950,042
DEDUCTIONS Participant benefit payments and refunds 53,053,968 Administrative expenses 1,428,838 Total deductions 54,482,806 Net increases 145,467,236 Net assets, beginning of year 1,221,836,393 Net assets, end of year $ 1,367,303,629
Accompanying notes to the basic financial statements are an integral part of this statement.
43
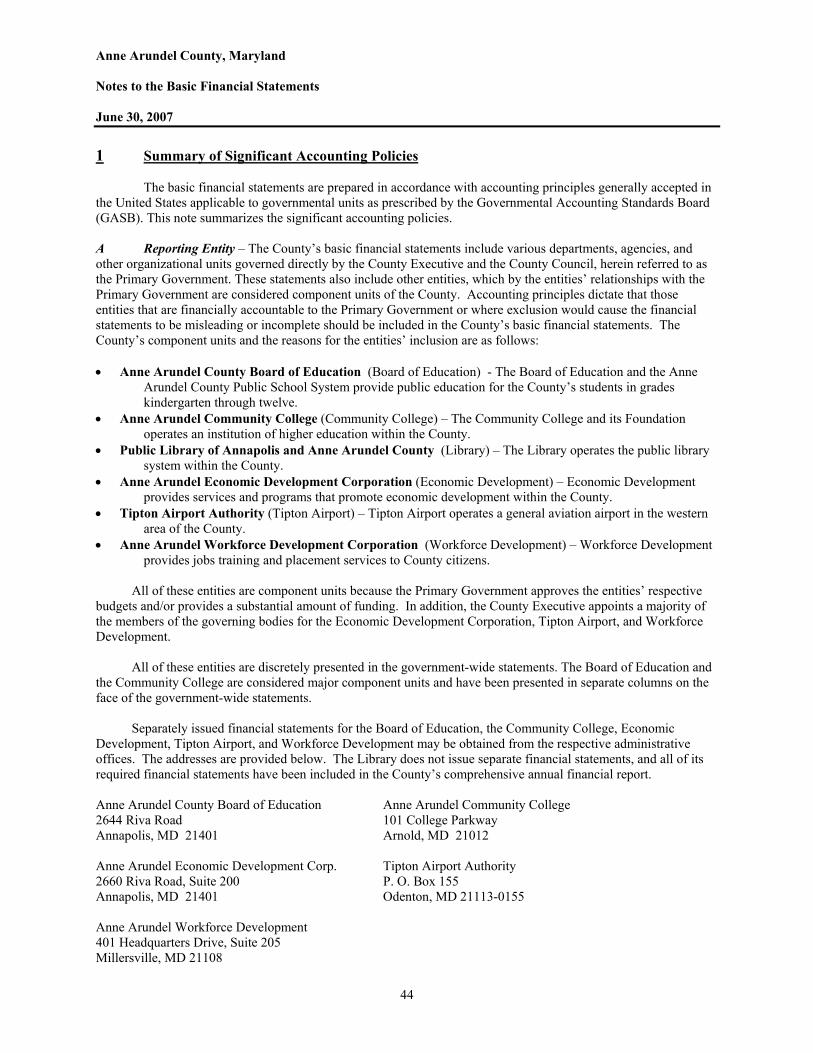
Anne Arundel County, Maryland Notes to the Basic Financial Statements June 30, 2007
44
1 Summary of Significant Accounting Policies The basic financial statements are prepared in accordance with accounting principles generally accepted in the United States applicable to governmental units as prescribed by the Governmental Accounting Standards Board (GASB). This note summarizes the significant accounting policies. A Reporting Entity – The County’s basic financial statements include various departments, agencies, and other organizational units governed directly by the County Executive and the County Council, herein referred to as the Primary Government. These statements also include other entities, which by the entities’ relationships with the Primary Government are considered component units of the County. Accounting principles dictate that those entities that are financially accountable to the Primary Government or where exclusion would cause the financial statements to be misleading or incomplete should be included in the County’s basic financial statements. The County’s component units and the reasons for the entities’ inclusion are as follows: • Anne Arundel County Board of Education (Board of Education) - The Board of Education and the Anne
Arundel County Public School System provide public education for the County’s students in grades kindergarten through twelve.
• Anne Arundel Community College (Community College) – The Community College and its Foundation operates an institution of higher education within the County.
• Public Library of Annapolis and Anne Arundel County (Library) – The Library operates the public library system within the County.
• Anne Arundel Economic Development Corporation (Economic Development) – Economic Development provides services and programs that promote economic development within the County.
• Tipton Airport Authority (Tipton Airport) – Tipton Airport operates a general aviation airport in the western area of the County.
• Anne Arundel Workforce Development Corporation (Workforce Development) – Workforce Development provides jobs training and placement services to County citizens.
All of these entities are component units because the Primary Government approves the entities’ respective
budgets and/or provides a substantial amount of funding. In addition, the County Executive appoints a majority of the members of the governing bodies for the Economic Development Corporation, Tipton Airport, and Workforce Development.
All of these entities are discretely presented in the government-wide statements. The Board of Education and
the Community College are considered major component units and have been presented in separate columns on the face of the government-wide statements.
Separately issued financial statements for the Board of Education, the Community College, Economic
Development, Tipton Airport, and Workforce Development may be obtained from the respective administrative offices. The addresses are provided below. The Library does not issue separate financial statements, and all of its required financial statements have been included in the County’s comprehensive annual financial report. Anne Arundel County Board of Education Anne Arundel Community College 2644 Riva Road 101 College Parkway Annapolis, MD 21401 Arnold, MD 21012 Anne Arundel Economic Development Corp. Tipton Airport Authority 2660 Riva Road, Suite 200 P. O. Box 155 Annapolis, MD 21401 Odenton, MD 21113-0155 Anne Arundel Workforce Development 401 Headquarters Drive, Suite 205 Millersville, MD 21108

Anne Arundel County, Maryland Notes to the Basic Financial Statements
45
B Financial Statement Presentation, Measurement Focus, and Bases of Accounting – The basic financial statements are divided into three categories: government–wide financial statements, fund financial statements, and budgetary statements. Government-Wide Financial Statements
The government-wide financial statements, consisting of the Statement of Net Assets and the Statement of Activities, are reported using the economic resources measurement focus and the accrual basis of accounting. Revenues are recorded when earned, and expenses are recorded when a liability is incurred, regardless of the timing of related cash flows. Property taxes are recognized in the year levied, and grants and similar revenues are recognized when all eligibility requirements imposed by the provider have been met.
The government-wide statements present governmental activities, which are primarily supported by taxes
and intergovernmental revenues, separately from business-type activities, which are primarily funded by user fees. In addition, the Primary Government’s activity is presented separately from its discretely presented component units. The government-wide statements do not include the net assets or activities of the fiduciary funds, which include the pension trust funds and the agency funds, because these funds account for assets that are not owned by the County.
Interfund activity within the Primary Government’s governmental activities and business-type activities has
been eliminated from the government-wide statements. Residual balances between the governmental and business-type categories are presented on the Statement of Net Assets as “Internal balances.” In addition, transactions between these activities and the internal service funds, which primarily serve the Primary Government, have been eliminated. Residual assets, liabilities, and net assets of the internal service funds have been added to governmental activities. In addition, transactions between the internal service funds and components units or other non-County agencies have been included in governmental activities. Fund Financial Statements The fund financial statements herein include statements for the governmental funds, the proprietary funds, and the fiduciary funds. Major funds within each category have been presented in separate columns, while all nonmajor funds are combined in one column.
Governmental fund financial statements - The governmental funds are reported using the current financial resources measurement focus and the modified accrual basis of accounting. Revenues are recognized when measurable and available. Revenues are considered available if those revenues are collectible within the current period or shortly thereafter to pay liabilities of the current period. Expenditures are generally recorded when incurred; however, expenditures for debt service, compensated absences, claims, and judgments are recorded when payments are due.
The County considers revenue collected within 90 days of the end of the year as available, except for
property taxes, which must be collected within 60 days. Therefore, the property taxes, income taxes, and grants that have not been received within the availability period have been deferred to future periods.
The governmental fund financial statements separately present the following major funds:
• General Fund – This fund is the primary operating fund. It accounts for all financial resources of the Primary
Government, except those accounted for in another fund. • Impact Fee Fund – This special revenue fund accounts for impact fees collected from developers to pay a
share of the cost of additional school capacity and road improvements necessitated by the development. • General County Capital Projects Fund – This fund accounts for all resources, both restricted and
unrestricted, that are received and used for the acquisition or development of major capital improvements. Resources received are applied in the following order: pay-as-you-go, dedicated revenues such as developer contributions, grants, and bonds.
Proprietary fund financial statements - The proprietary funds are reported using the economic resources measurement focus and the accrual basis of accounting. Revenues are recognized when earned, and expenses are recognized when a liability is incurred, regardless of the timing of cash flows. These funds account for County
Anne Arundel County, Maryland Notes to the Basic Financial Statements
46
services that operate as self-supporting activities. Those who benefit from these services bear the cost through the payment of user fees. The proprietary fund financial statements separately present the following major enterprise funds: • Water and Wastewater – This fund accounts for the operating, debt service, and capital improvement
activities of the water and wastewater utility services provided to County residents and businesses. • Solid Waste – This fund accounts for the costs associated with the collection and disposal of refuse for County
residents and businesses. This includes the cost of operations, debt service, capital improvement, and landfill restoration.
The proprietary fund statements also include a column that presents totals for internal service funds. These
funds operate as self-supporting activities, which primarily serve the Primary Government and its component units. The following funds comprise the internal service funds of the County: • Self Insurance – The County is self-insured for workers’ compensation, auto liability, and general liability
insurance. This fund accounts for this self-insured activity and the purchase of policies from commercial insurers for certain specific exposures. These services, provided to the Primary Government and certain component units, are funded through charges to the users.
• Health Insurance – The County is self-insured for employee medical benefits. This fund accounts for this health insurance activity and the payment to outside administrators and medical service providers. These services are provided to the Primary Government and certain component units and other agencies and are funded through premiums charged to the users.
• Print Shop – This fund accounted for the activity in the County’s print shop. These services are provided to the County, its component units, and agencies, and costs are recouped through user charges. Since the beginning of fiscal year 2007 these activities have been accounted for in the General Fund.
• Central Garage and Transportation – This fund accounts for activity in the County’s Central Garage, which provides the Primary Government and its component units with vehicle maintenance and fuel usage, and motor pool vehicles. Costs are recovered through fees to users for maintenance, fuel use, and vehicle lease charges.
• Garage Replacement – This fund accounts for the collection of replacement fees from participating funds within the Primary Government and its component units. The fees are used to replace motor pool vehicles as needed.
Fiduciary fund financial statements - The fiduciary statements include columns for the following:
• Pension Trust Funds – This column includes the activities of the Anne Arundel County Retirement and
Pension System (Retirement System). The Retirement System accounts for the activity in the Primary Government’s four defined-benefit pension plans and reports on a calendar year basis. The Pension Trust funds are reported using the economic resources measurement focus and accrual basis of accounting. Revenues are recognized when earned, and expenses are recognized when a liability is incurred, regardless of the timing of related cash flows. These plans accumulate employer and employee contributions and invest these funds to provide guaranteed pension benefits after retirement. Employer contributions are based on actuarial recommendations.
• Agency Funds – This column includes the balances of assets and liabilities maintained in the Primary Government’s agency funds. Since agency funds report only assets and liabilities, these funds do not use a measurement focus. Transactions in these funds are recorded using the accrual basis of accounting. These funds account for deposits that are collected and held on behalf of individuals, organizations, or other governments. These monies include escrow deposits for developer subdivisions, sediment control, recreation land, tax sale, and other miscellaneous purposes; monies held in trust on behalf of the Special Assessment Districts or other agreements; and taxes collected for other governments.
Budgetary Statements The basic financial statements include a Statement of Revenues, Expenditures, and Changes in Fund Balances – Budget and Actual for the General Fund. This statement is compiled using the budgetary basis of accounting in which revenues are recognized when measurable and available, except for grant revenue, which is recognized when the grant-related reimbursable expenditures are made. Budgetary expenditures are recognized

Anne Arundel County, Maryland Notes to the Basic Financial Statements
47
when encumbered. The Impact Fee Fund, a major governmental fund, does not have a legally adopted budget as the fees are expended through the capital projects fund. The General County Capital Projects Fund does not have an annually adopted budget. Rather the Capital budgets are established for the duration of the respective projects. All non-major governmental funds have legally adopted budgets except for the Storm Drain Fees Fund, the Recreational Land Fees Fund, and the Area Agency on Aging Fund. These funds are expended through the General Fund or Capital Projects Fund. Combining and Other Supplementary Schedules
For all columns in the basic financial statements that accumulate the data for nonmajor funds or component units, we have provided combining statements herein that present the individual funds included in these nonmajor categories. In addition, we have provided budgetary statements of revenue and expenditures for all of the Primary government’s funds. Separate financial statements for the Library, a nonmajor component unit, are also presented here because the Library does not issue separate financial statements. C Cash, Investments, and Related Income – Cash includes bank deposits in checking and savings accounts. Investments are external pools and fixed income issues which generally mature within one year. Investments may extend longer than one year to facilitate the specific purpose of a fund. Details on investment types and term are displayed in Note 3, “Cash and Investments”.
Investments are recorded at fair value, except for repurchase agreements, which are valued at cost. Available cash from the Primary Government and Library is pooled in the General Fund and invested in overnight or other investments. To facilitate the pooling, cash belonging to other funds is transferred to and from the General Fund. On the Statement of Cash Flows for the proprietary funds, cash and cash equivalents include bank deposits and highly liquid investments readily convertible to cash or maturing within three months of the time of purchase.
Investment income earned on investments is generally allocated to each fund based on its proportionate share of the average daily cash balance each month. However, investment income earned on the balances in certain special revenue funds, certain internal service funds, Agency funds, and by the Library is retained in the General Fund. In addition, investment earnings recognized in the General County Capital Projects Fund are transferred to the General Fund.
Investments of the Retirement System are reported at fair value. Securities traded on a national or international exchange are valued at the last reported sales price using current exchange rates. The fair value of underlying assets in the real estate investment pools is based on independent appraisals. Investments that do not have an established market are reported at estimated fair value. D Inventories and Prepaid Expenses – Inventories of parts and supplies, recorded in the General Fund and certain proprietary funds, are valued at cost assuming a first-in, first-out consumption pattern. The government-wide and the fund statements record the cost of inventory as it is consumed, while the budgetary statements record the cost when the inventory is purchased. For the government-wide statements only, prepaid expenses are recognized as the services are consumed. E Program Revenues – The government-wide Statement of Activities is presented using a net-cost format. Total costs are presented on a functional basis. Some of these functional activities are financed in whole or in part by program revenues received from parties outside the County government. These program revenues are subtracted from the functional costs to arrive at net costs. General County revenues are then applied against the net costs to arrive at changes in net assets for the fiscal year. Program revenues include amounts received from those who purchase, use, or directly benefit from a program; amounts received from outside parties that are restricted to one or more specific programs; and earnings on investments that are legally restricted for a specific purpose. Program revenues include user fees and charges, impact fees, fines, license and permit fees, special community benefit district assessments, grants and contributions, and restricted investment income. F Capital Assets – Capital assets of the Primary Government are recorded in the applicable governmental or business-type activities columns on the government-wide Statement of Net Assets. These asset balances include all constructed, purchased, or developer-donated public domain infrastructure (roads, bridges, and similar items). Only
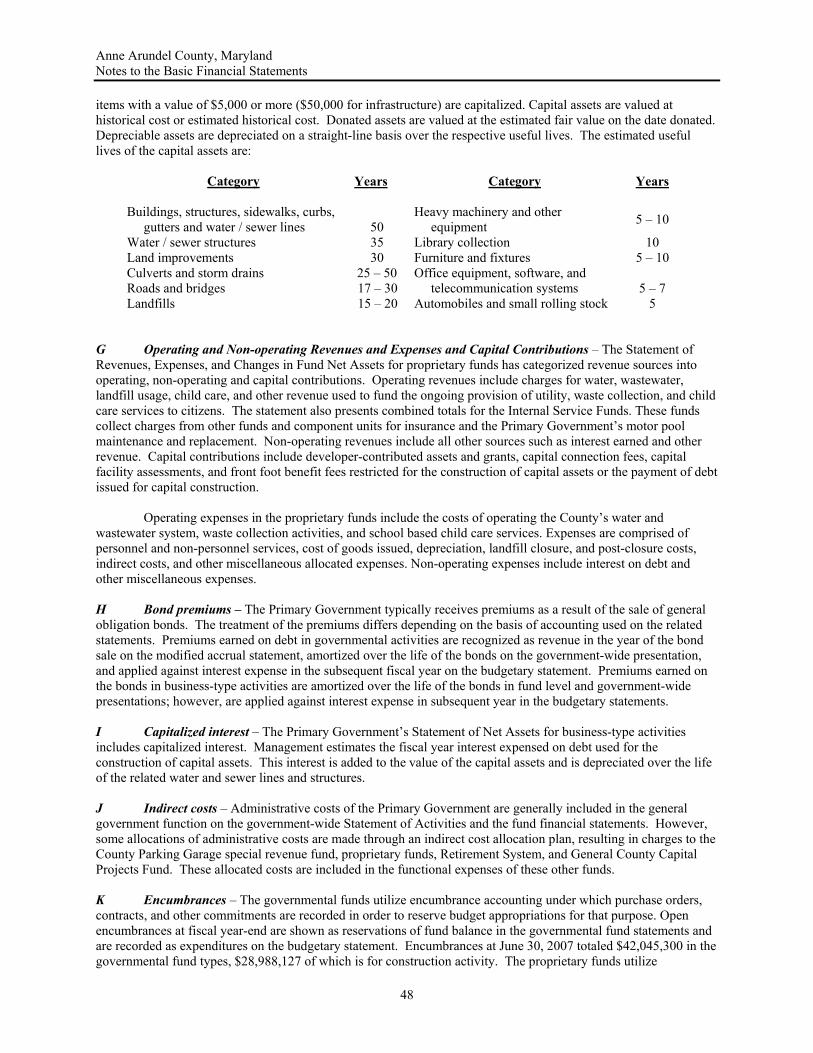
Anne Arundel County, Maryland Notes to the Basic Financial Statements
48
items with a value of $5,000 or more ($50,000 for infrastructure) are capitalized. Capital assets are valued at historical cost or estimated historical cost. Donated assets are valued at the estimated fair value on the date donated. Depreciable assets are depreciated on a straight-line basis over the respective useful lives. The estimated useful lives of the capital assets are:
Category
Years
Category
Years
Buildings, structures, sidewalks, curbs, gutters and water / sewer lines
50
Heavy machinery and other equipment 5 – 10
Water / sewer structures 35 Library collection 10 Land improvements 30 Furniture and fixtures 5 – 10 Culverts and storm drains Roads and bridges
25 – 50 17 – 30
Office equipment, software, and telecommunication systems
5 – 7
Landfills 15 – 20 Automobiles and small rolling stock 5
G Operating and Non-operating Revenues and Expenses and Capital Contributions – The Statement of Revenues, Expenses, and Changes in Fund Net Assets for proprietary funds has categorized revenue sources into operating, non-operating and capital contributions. Operating revenues include charges for water, wastewater, landfill usage, child care, and other revenue used to fund the ongoing provision of utility, waste collection, and child care services to citizens. The statement also presents combined totals for the Internal Service Funds. These funds collect charges from other funds and component units for insurance and the Primary Government’s motor pool maintenance and replacement. Non-operating revenues include all other sources such as interest earned and other revenue. Capital contributions include developer-contributed assets and grants, capital connection fees, capital facility assessments, and front foot benefit fees restricted for the construction of capital assets or the payment of debt issued for capital construction. Operating expenses in the proprietary funds include the costs of operating the County’s water and wastewater system, waste collection activities, and school based child care services. Expenses are comprised of personnel and non-personnel services, cost of goods issued, depreciation, landfill closure, and post-closure costs, indirect costs, and other miscellaneous allocated expenses. Non-operating expenses include interest on debt and other miscellaneous expenses. H Bond premiums – The Primary Government typically receives premiums as a result of the sale of general obligation bonds. The treatment of the premiums differs depending on the basis of accounting used on the related statements. Premiums earned on debt in governmental activities are recognized as revenue in the year of the bond sale on the modified accrual statement, amortized over the life of the bonds on the government-wide presentation, and applied against interest expense in the subsequent fiscal year on the budgetary statement. Premiums earned on the bonds in business-type activities are amortized over the life of the bonds in fund level and government-wide presentations; however, are applied against interest expense in subsequent year in the budgetary statements. I Capitalized interest – The Primary Government’s Statement of Net Assets for business-type activities includes capitalized interest. Management estimates the fiscal year interest expensed on debt used for the construction of capital assets. This interest is added to the value of the capital assets and is depreciated over the life of the related water and sewer lines and structures. J Indirect costs – Administrative costs of the Primary Government are generally included in the general government function on the government-wide Statement of Activities and the fund financial statements. However, some allocations of administrative costs are made through an indirect cost allocation plan, resulting in charges to the County Parking Garage special revenue fund, proprietary funds, Retirement System, and General County Capital Projects Fund. These allocated costs are included in the functional expenses of these other funds. K Encumbrances – The governmental funds utilize encumbrance accounting under which purchase orders, contracts, and other commitments are recorded in order to reserve budget appropriations for that purpose. Open encumbrances at fiscal year-end are shown as reservations of fund balance in the governmental fund statements and are recorded as expenditures on the budgetary statement. Encumbrances at June 30, 2007 totaled $42,045,300 in the governmental fund types, $28,988,127 of which is for construction activity. The proprietary funds utilize
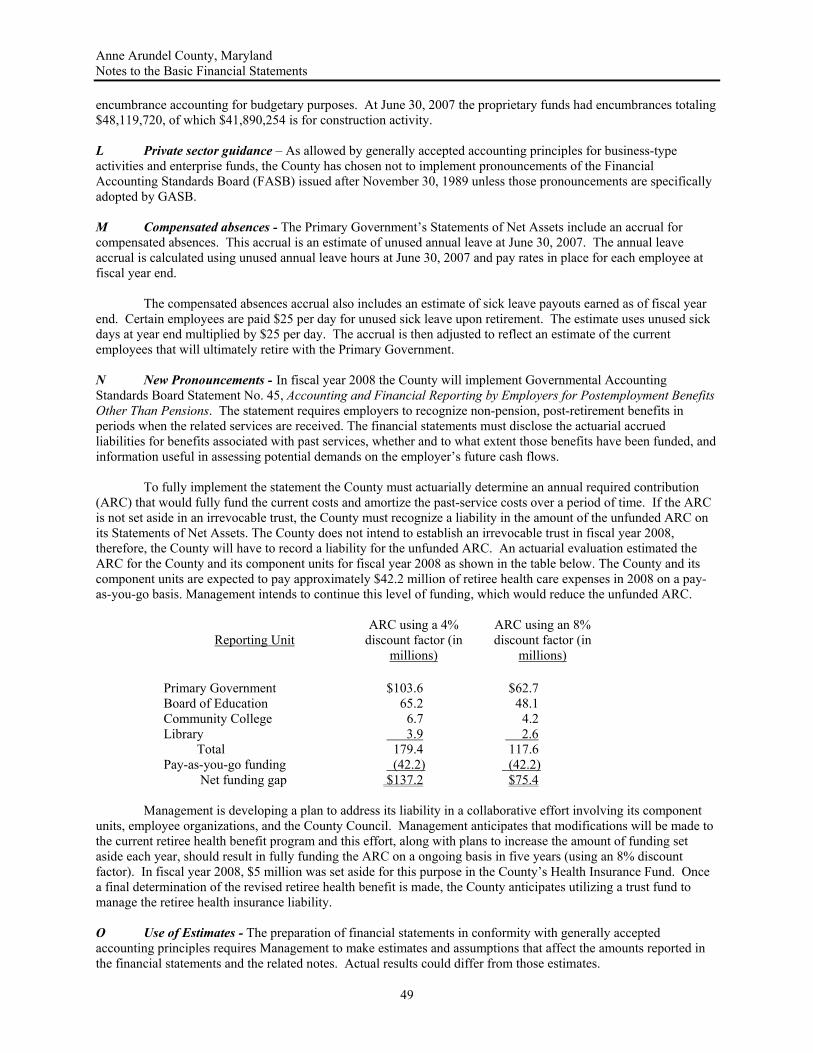
Anne Arundel County, Maryland Notes to the Basic Financial Statements
49
encumbrance accounting for budgetary purposes. At June 30, 2007 the proprietary funds had encumbrances totaling $48,119,720, of which $41,890,254 is for construction activity. L Private sector guidance – As allowed by generally accepted accounting principles for business-type activities and enterprise funds, the County has chosen not to implement pronouncements of the Financial Accounting Standards Board (FASB) issued after November 30, 1989 unless those pronouncements are specifically adopted by GASB. M Compensated absences - The Primary Government’s Statements of Net Assets include an accrual for compensated absences. This accrual is an estimate of unused annual leave at June 30, 2007. The annual leave accrual is calculated using unused annual leave hours at June 30, 2007 and pay rates in place for each employee at fiscal year end. The compensated absences accrual also includes an estimate of sick leave payouts earned as of fiscal year end. Certain employees are paid $25 per day for unused sick leave upon retirement. The estimate uses unused sick days at year end multiplied by $25 per day. The accrual is then adjusted to reflect an estimate of the current employees that will ultimately retire with the Primary Government. N New Pronouncements - In fiscal year 2008 the County will implement Governmental Accounting Standards Board Statement No. 45, Accounting and Financial Reporting by Employers for Postemployment Benefits Other Than Pensions. The statement requires employers to recognize non-pension, post-retirement benefits in periods when the related services are received. The financial statements must disclose the actuarial accrued liabilities for benefits associated with past services, whether and to what extent those benefits have been funded, and information useful in assessing potential demands on the employer’s future cash flows.
To fully implement the statement the County must actuarially determine an annual required contribution (ARC) that would fully fund the current costs and amortize the past-service costs over a period of time. If the ARC is not set aside in an irrevocable trust, the County must recognize a liability in the amount of the unfunded ARC on its Statements of Net Assets. The County does not intend to establish an irrevocable trust in fiscal year 2008, therefore, the County will have to record a liability for the unfunded ARC. An actuarial evaluation estimated the ARC for the County and its component units for fiscal year 2008 as shown in the table below. The County and its component units are expected to pay approximately $42.2 million of retiree health care expenses in 2008 on a pay-as-you-go basis. Management intends to continue this level of funding, which would reduce the unfunded ARC.
Reporting Unit
ARC using a 4% discount factor (in
millions)
ARC using an 8% discount factor (in
millions)
Primary Government $103.6 $62.7 Board of Education 65.2 48.1 Community College 6.7 4.2 Library 3.9 2.6 Total 179.4 117.6 Pay-as-you-go funding (42.2) (42.2) Net funding gap $137.2 $75.4
Management is developing a plan to address its liability in a collaborative effort involving its component
units, employee organizations, and the County Council. Management anticipates that modifications will be made to the current retiree health benefit program and this effort, along with plans to increase the amount of funding set aside each year, should result in fully funding the ARC on a ongoing basis in five years (using an 8% discount factor). In fiscal year 2008, $5 million was set aside for this purpose in the County’s Health Insurance Fund. Once a final determination of the revised retiree health benefit is made, the County anticipates utilizing a trust fund to manage the retiree health insurance liability. O Use of Estimates - The preparation of financial statements in conformity with generally accepted accounting principles requires Management to make estimates and assumptions that affect the amounts reported in the financial statements and the related notes. Actual results could differ from those estimates.

Anne Arundel County, Maryland Notes to the Basic Financial Statements
50
P Restatement of Beginning Net Assets - During fiscal year 2007, Management determined that $5,111,035 of advanced Federal grant revenue received during fiscal years 2005 and 2006 had not been expended for eligible purposes and/or within the related time restrictions. The grant monies plus accumulated interest were returned to the grantor in September 2007. The beginning net assets have been adjusted to reflect the prior years' reduction in grant revenue recognized. 2 Budgetary Information A Excess Expenditures over Appropriations and Fund Deficits – The County limits the spending of departments and funds by granting budgetary appropriation authority. These limits are established at the department level in the General Fund, separate funds are controlled at the fund level, and capital projects are controlled at the project level. B Reconciliation Between Fund Financial Statements and Budgetary Statements - Since the General Fund’s Statement of Revenues, Expenditures and Changes in Fund Balances and the Statement of Revenues, Expenditures, and Changes in Fund Balances – Budget and Actual use different revenue and expenditure recognition policies, a reconciliation of these two statements is provided below:
Revenue over expenditures - budgetary basis $ 10,492,280Net effect of encumbrances (2,325,569)Changes in revenue stabilization and golf courses reserves 6,442,639Timing differences in revenue recognition 1,027,329Net effect of Self Insurance Fund deficits allocation (318,463)Changes in bond proceeds reserved for debt service 1,933,274Net inventory change 316,234Change in fund balance - modified accrual basis $ 17,567,724
3 Cash and Investments The Primary Government pools available cash and centrally invests these funds to maximize earnings. The component units also pool available cash in this manner. The Retirement System cash is held separately. Significant accounting policies related to cash and investments are included in Note 1C. A Policies – The Primary Government is authorized to invest available cash in obligations of the U.S. Government, its agencies and instrumentalities; repurchase agreements that are fully collateralized by direct U.S. Government obligations and U.S. Government agency and instrumentality obligations, including fixed rate Mortgage-Backed Securities; Bankers’ Acceptances; mutual funds that are registered with the Securities and Exchange Commission (SEC) under the Investment Company Act of 1940 (the Act), are operating in accordance with Rule 2A-7 of the Act, and have received the highest possible rating from at least one Nationally Recognized Statistical Rating Organization as designated by the SEC; Certificates of Deposit; and Commercial Paper. In addition the Primary Government can participate in the local government investment pool authorized and maintained by the State of Maryland. The fair value of the position in the pool is the same as the value of the shares. Finally, the Primary Government is also authorized to invest bond proceeds that are subject to arbitrage rebate requirements in state and local government obligations. Pooled cash is primarily used to purchase short-term investments and the bank invests any remaining collected bank deposits in overnight repurchase agreements prior to the close of each business day. Policy requires that the initial collateral securities underlying repurchase agreements have a market value of at least 102% of the cost of the repurchase agreement. When the collateral falls under 101% or is $100,000 less than the 102%, additional collateral is required to bring the total to the required level.
The Retirement System is authorized to invest in U.S. Government securities, insurance company general accounts, commercial paper, money market mutual funds, corporate bonds, common and international stocks, limited partnerships, absolute return funds, private equity, as well as mortgage participations and real estate. The Retirement System lends its securities to broker-dealers and other entities with a simultaneous agreement to return the collateral for the same securities in the future. The Retirement System’s custodian lends securities, of the type

Anne Arundel County, Maryland Notes to the Basic Financial Statements
51
on loan at year-end, for collateral in the form of cash or other securities in an amount equal to 102% for domestic securities and 105% for international of the market value of the securities loaned.
Either the Retirement System or the borrower may terminate security loans on demand, although the
average term of the loans is one week. Cash collateral is invested in the lending agent’s money market mutual fund, which at December 31, 2006, the year-end for the Retirement System, had a weighted average maturity of 195 days. The relationship between the maturities of the investment pool and the Retirement System’s loans is affected by the maturities of the security loans made by other entities that use the agent’s pool, which the Retirement System cannot determine. Because the loans were terminable at will, the loans’ durations did not generally match the durations of the investments made with cash collateral. The Retirement System cannot pledge or sell collateral securities received unless the borrower defaults. B Balances and Custodial Credit Risk – At June 30, 2007, the carrying amount of the Primary Government’s bank deposits was $11,013,882, while bank balances were $11,430,529. Available cash invested overnight in Repurchase agreements, as discussed above, was $3,473,048. Bank balances of $177,224 were fully secured by Federal Deposit insurance and the balance of $11,353,593 represents uncollected bank deposits. Cash balances of the Board of Education are fully securitized by Federal Deposit Insurance and/or collateral held in the Board’s name at the Federal Reserve. Deposits for Anne Arundel Community College are secured and properly protected. The cash balances of the other nonmajor component units are insured or collateralized except $325,201, which is neither insured nor collateralized.
Custodial credit risk is the risk that the Primary Government will not be able to recover deposits, in the event of the failure of a depository financial institution or will not be able to recover collateral securities that are in the possession of an outside party. Investment securities are exposed to custodial credit risk if the securities are uninsured, are not registered in the name of the Primary Government, and are held by either a counterparty or the counterparty’s trust department or agent but not in the Primary Government’s name. The Primary Government’s Investment Policy requires that the Controller maintain a list of financial institutions authorized to provide investment services, including custodial services, and collateral requirements. Internal procedures establish the methods for evaluating eligible institutions. Custodial credit risk for deposits is not addressed in the policy. C Concentration Risk - Concentration risk is the risk of loss attributed to the magnitude of the Government’s investment in a single issuer. As of June 30, 2007, Federal Home Loan Bank represented 18.8% of the Primary Government’s investments with Federal National Mortgage Association and Federal Home Loan Mortgage at 6.9% and 5.2% respectively. Exposure to all other issuers was less than 5.0% each excluding investment pools. The Primary Government’s Investment Policy requires diversification of investments by security type and institution. Issuer limits are not addressed. There was no investment greater than 5% for the Board of Education or the Community College excluding pools. The Retirement System’s Investment Policy Statement (IPS) sets maximum concentration limits by asset type and manager style. As of December 31, 2006 there was no exposure to a single issuer greater than 5.0% of the System’s plan net assets, excluding investment pools. D Interest Rate Risk – Interest rate risk is the risk that changes in interest rates will adversely affect the value of an investment. The fair market value of fixed income (debt) securities is affected by increases and declines in interest rates. These investments may also have embedded call features allowing the issuer to redeem part or all of the issue prior to maturity at a pre-set price. In addition, debt issues may have interest rates that vary according to a pre-determined external index (such as the London Inter-Bank Offered Rate) or a pre-determined step-up in the interest rate at a pre-determined date(s). The Primary Government’s Investment Policy does not specifically address interest rate risk. However, term limits are established for certain investments, which serve to minimize interest rate risk. The Retirement System’s IPS sets limits on floating rates for mortgage backed securities and establishes limits on the average duration of some investment types. The table on the following page uses the Segmented Time Distribution method to display debt holdings by maturity for the Primary Government and the Component Units by term and investment type. Market values for issues within the Primary Government’s agency/instrumentalities category include, $169,280,776 of callable issues, and $7,992,500 for issues that have both callable and rate step-up features. Within the Component Units issues with variable rate coupons total $126,057 in market value.

Anne Arundel County, Maryland Notes to the Basic Financial Statements
52
Investment Type Fair Value Less than 1 year 1 to 5 6 to 10 over 10
Primary Government Repurchase agreements $ 234,623,125 $ 234,000,000 $ - $ - $ 623,125 U.S. Government securities 3,300,039 - - - 3,300,039 Agency/Instrumentalities 208,806,857 154,725,370 54,081,487 - - Bankers' Acceptances 12,491,888 12,491,888 - - - Commercial paper 50,192,251 50,192,251 - - - Money market pools 56,925,325 56,925,325 - - - Tax exempt municipal bonds 53,221,615 16,808,973 36,412,642 - -
$ 619,561,100 $ 525,143,807 $ 90,494,129 $ - $ 3,923,164 Board of Education Repurchase agreements $ 767,214 $ 767,214 $ - $ - $ - Money market pools 116,021,750 116,021,750 - - -
$ 116,788,964 $ 116,788,964 $ - $ - $ - Community College Certificates of Depost $ 537,092 $ 537,092 $ - $ - $ - Money market pools 12,965,965 12,965,965 - - - Bond mutual funds 1,015,600 1,015,600 - - - Guaranteed investment trusts 1,174,939 - - - 1,174,939
$ 15,693,596 $ 14,518,657 $ - $ - $ 1,174,939
Other nonmajor component units Agency/Instrumentalities $ 290,201 $ 164,144 $ 126,057 $ - $ - Certificates of Deposit 373,070 - 373,070 - - Money market pools 406,543 406,543 - - - Corporate bonds 172,599 172,599 - - -
$ 1,242,413 $ 743,286 $ 499,127 $ - $ -
Investment Maturities (in years)
The table on the next page uses Segmented Time Distribution to display the Retirement System’s debt holdings by maturity term, investment type as of December 31, 2006. Some issues within the categories agencies/ instrumentalities, corporate bonds, collateralized mortgage obligations, and other asset-backed securities have variable rate features. The total fair value of these securities was $15,523,024 as of December 31, 2006. The segmented time distribution table includes issues with call features and assumes that these issues will be held to maturity. The total fair market value of callable securities totals $80,041,038 with call dates ranging from January 1, 2007, for continuously callable issues, to April 20, 2024. Stated call prices are generally at par or reflect premiums as great as 5.81%. There are also securities that do not have a stated call price, but include a “make whole” provision. This allows the issuer to pay off remaining debt but requires a lump sum payment equal to the net present value of future coupon payments that will not be paid due to the call.

Anne Arundel County, Maryland Notes to the Basic Financial Statements
53
Less than 1 year
U.S. Treasuries $ 24,462,735 $ 1,896,044 $ 10,623,369 $ 5,699,621 $ 6,243,701Agency/Instrumentalities 55,154,518 467,767 1,775,339 391,935 52,519,477Corporate Bonds 85,520,237 3,918,675 28,021,125 42,544,785 11,035,652Bond Mutual Funds 112,021,812 4,499,966 107,521,846 - -Collateralized Mrtg Obligations 20,708,980 - - - 20,708,980Other Asset-Backed Securities 8,294,757 - - 744,840 7,549,917Foreign Denominated Bonds 6,374,818 395,107 1,928,553 2,732,507 1,318,651
Totals $ 312,537,857 $ 11,177,559 $ 149,870,232 $ 52,113,688 $ 99,376,378
over 10Investment Type Fair Value 1 to 5 6 to 10
E Credit Risk – Credit risk is the risk that an issuer or other counterparty to an investment will not fulfill its obligations. Debt securities are rated by Nationally Recognized Statistical Rating Organizations to provide purchasers with an opinion of the capability and willingness of a borrower to re-pay its debt. The Primary Government’s Investment Policy does not address credit risk. The following table displays the County’s debt holdings and quality ratings from Standard & Poor’s and Moody’s with the highest rating in each asset type listed first. Ratings for the Component Units and Retirement System are listed separately.
Investment Type S&P Moody's % Investment Type S&P Moody's %
Primary Government Federal Home Loan Bank AAA Aaa 18.85 Tax Exempt Municipal AAA Aaa 4.14 Federal Home Loan Mortgage AAA Aaa 5.16 " AA A 1.15 Federal National Mort Assoc. NR Aaa 6.92 " A A 0.66 Federal Agricultural Mort Corp NR NR 2.64 " AAA NR 0.73 Federal Farm Credit AAA Aaa 0.32 " AA NR 0.96 Bankers Acceptances A-1 P-1 2.03 " NR Aaa 0.29 Money market pools AAAm Aaa 6.84 " NR Aa 0.70
" AAAm NR 2.02 Commercial paper A-1 P-1 8.14" NR NR 0.38
Repurchase agreement NR NR 38.07 100.00Board of Education Repurchase Agreement NR NR 0.66 Money Market pool AAAm NR 99.34
100.00Community College Money market pool AAAm NR 80.48 Guaranteed Invt Trust NR NR 7.49 Money market pool NR NR 2.14 Certificates of Deposit NR NR 3.42 Bond Mutual Funds NR NR 6.47 100.00
Nonmajor component units Federal Home Loan Bank AAA Aaa 11.21 Corporate Bonds AA Aa 13.89 Federal Home Loan Mtg Corp AAA Aaa 12.15 Money market pools AAAm NR 2.03 Certificates of Deposit NR NR 30.03 Money market pools NR NR 30.69
100.00
The Retirement System’s Investment Policy Statement (IPS) provides guidelines to all fixed income managers related to allowable quality ratings. Holdings as of December 31, 2006 are displayed in the following page.
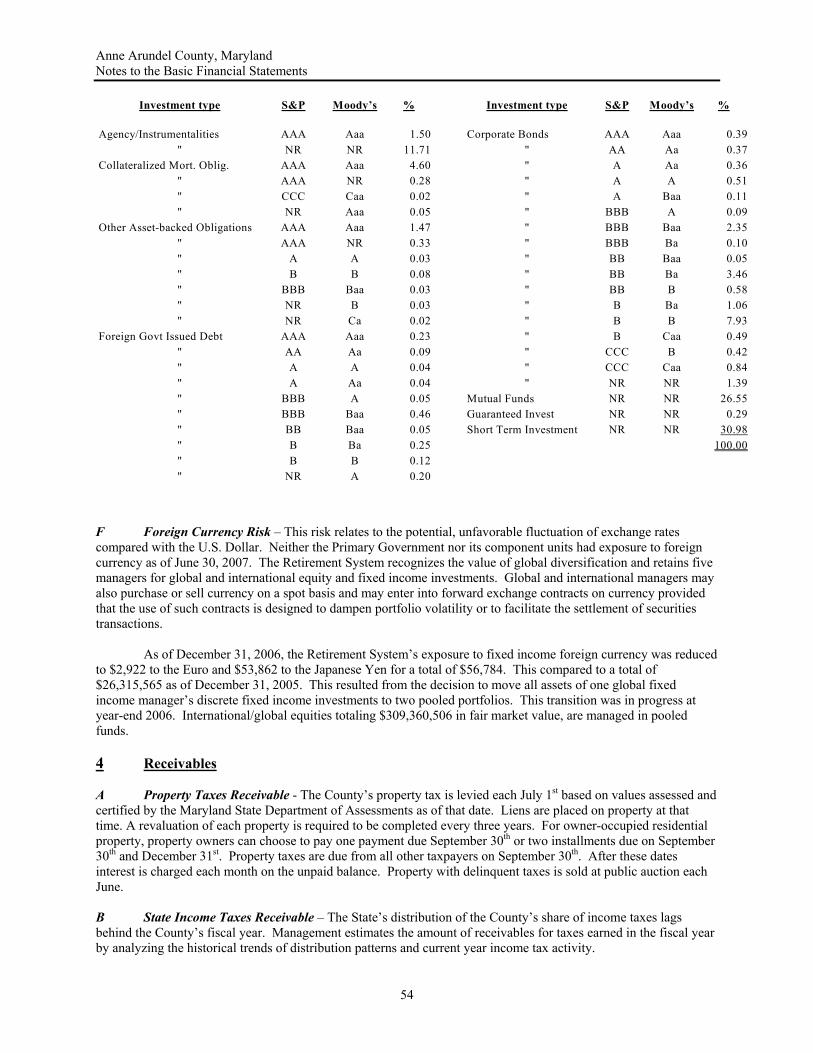
Anne Arundel County, Maryland Notes to the Basic Financial Statements
54
Investment type S&P Moody’s % Investment type S&P Moody’s %
Agency/Instrumentalities AAA Aaa 1.50 Corporate Bonds AAA Aaa 0.39" NR NR 11.71 " AA Aa 0.37
Collateralized Mort. Oblig. AAA Aaa 4.60 " A Aa 0.36" AAA NR 0.28 " A A 0.51" CCC Caa 0.02 " A Baa 0.11" NR Aaa 0.05 " BBB A 0.09
Other Asset-backed Obligations AAA Aaa 1.47 " BBB Baa 2.35" AAA NR 0.33 " BBB Ba 0.10" A A 0.03 " BB Baa 0.05" B B 0.08 " BB Ba 3.46" BBB Baa 0.03 " BB B 0.58" NR B 0.03 " B Ba 1.06" NR Ca 0.02 " B B 7.93
Foreign Govt Issued Debt AAA Aaa 0.23 " B Caa 0.49" AA Aa 0.09 " CCC B 0.42" A A 0.04 " CCC Caa 0.84" A Aa 0.04 " NR NR 1.39" BBB A 0.05 Mutual Funds NR NR 26.55" BBB Baa 0.46 Guaranteed Invest NR NR 0.29" BB Baa 0.05 Short Term Investment NR NR 30.98" B Ba 0.25 100.00" B B 0.12" NR A 0.20
F Foreign Currency Risk – This risk relates to the potential, unfavorable fluctuation of exchange rates compared with the U.S. Dollar. Neither the Primary Government nor its component units had exposure to foreign currency as of June 30, 2007. The Retirement System recognizes the value of global diversification and retains five managers for global and international equity and fixed income investments. Global and international managers may also purchase or sell currency on a spot basis and may enter into forward exchange contracts on currency provided that the use of such contracts is designed to dampen portfolio volatility or to facilitate the settlement of securities transactions. As of December 31, 2006, the Retirement System’s exposure to fixed income foreign currency was reduced to $2,922 to the Euro and $53,862 to the Japanese Yen for a total of $56,784. This compared to a total of $26,315,565 as of December 31, 2005. This resulted from the decision to move all assets of one global fixed income manager’s discrete fixed income investments to two pooled portfolios. This transition was in progress at year-end 2006. International/global equities totaling $309,360,506 in fair market value, are managed in pooled funds. 4 Receivables A Property Taxes Receivable - The County’s property tax is levied each July 1st based on values assessed and certified by the Maryland State Department of Assessments as of that date. Liens are placed on property at that time. A revaluation of each property is required to be completed every three years. For owner-occupied residential property, property owners can choose to pay one payment due September 30th or two installments due on September 30th and December 31st. Property taxes are due from all other taxpayers on September 30th. After these dates interest is charged each month on the unpaid balance. Property with delinquent taxes is sold at public auction each June. B State Income Taxes Receivable – The State’s distribution of the County’s share of income taxes lags behind the County’s fiscal year. Management estimates the amount of receivables for taxes earned in the fiscal year by analyzing the historical trends of distribution patterns and current year income tax activity.
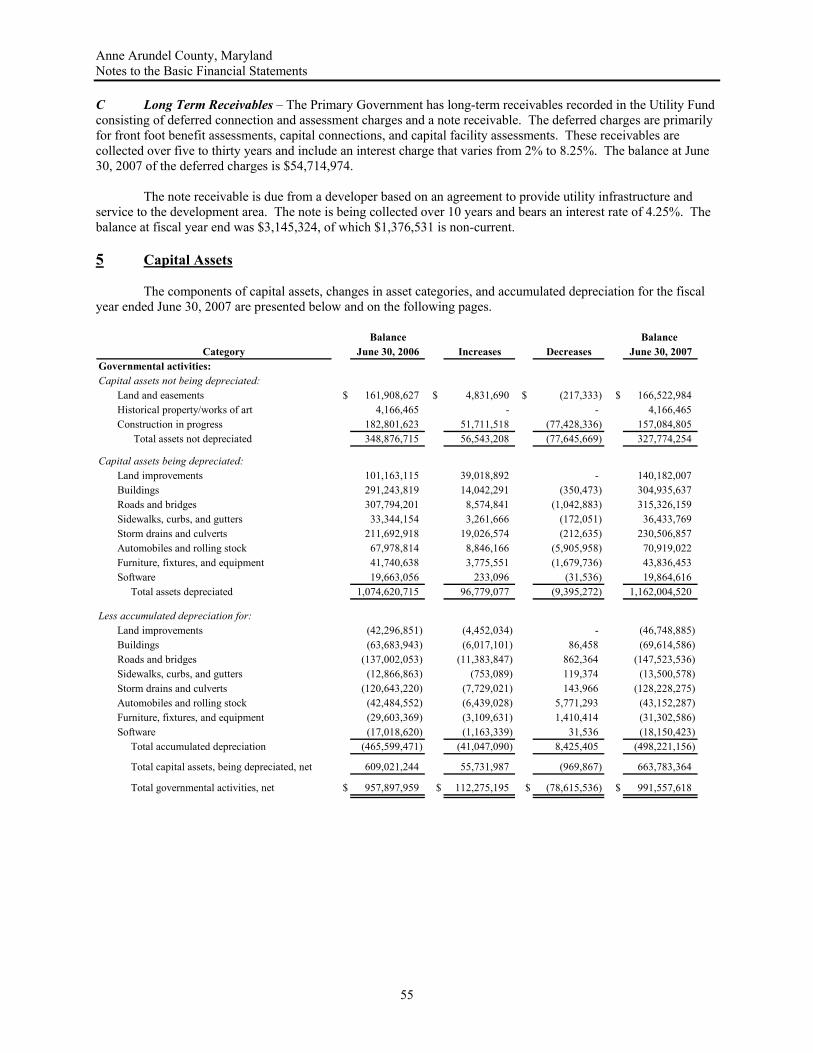
Anne Arundel County, Maryland Notes to the Basic Financial Statements
55
C Long Term Receivables – The Primary Government has long-term receivables recorded in the Utility Fund consisting of deferred connection and assessment charges and a note receivable. The deferred charges are primarily for front foot benefit assessments, capital connections, and capital facility assessments. These receivables are collected over five to thirty years and include an interest charge that varies from 2% to 8.25%. The balance at June 30, 2007 of the deferred charges is $54,714,974. The note receivable is due from a developer based on an agreement to provide utility infrastructure and service to the development area. The note is being collected over 10 years and bears an interest rate of 4.25%. The balance at fiscal year end was $3,145,324, of which $1,376,531 is non-current. 5 Capital Assets
The components of capital assets, changes in asset categories, and accumulated depreciation for the fiscal year ended June 30, 2007 are presented below and on the following pages.
Balance Balance Category June 30, 2006 Increases Decreases June 30, 2007
Governmental activities:Capital assets not being depreciated:
Land and easements $ 161,908,627 $ 4,831,690 $ (217,333) $ 166,522,984 Historical property/works of art 4,166,465 - - 4,166,465 Construction in progress 182,801,623 51,711,518 (77,428,336) 157,084,805 Total assets not depreciated 348,876,715 56,543,208 (77,645,669) 327,774,254
Capital assets being depreciated:Land improvements 101,163,115 39,018,892 - 140,182,007 Buildings 291,243,819 14,042,291 (350,473) 304,935,637 Roads and bridges 307,794,201 8,574,841 (1,042,883) 315,326,159 Sidewalks, curbs, and gutters 33,344,154 3,261,666 (172,051) 36,433,769 Storm drains and culverts 211,692,918 19,026,574 (212,635) 230,506,857 Automobiles and rolling stock 67,978,814 8,846,166 (5,905,958) 70,919,022 Furniture, fixtures, and equipment 41,740,638 3,775,551 (1,679,736) 43,836,453 Software 19,663,056 233,096 (31,536) 19,864,616 Total assets depreciated 1,074,620,715 96,779,077 (9,395,272) 1,162,004,520
Less accumulated depreciation for:Land improvements (42,296,851) (4,452,034) - (46,748,885) Buildings (63,683,943) (6,017,101) 86,458 (69,614,586) Roads and bridges (137,002,053) (11,383,847) 862,364 (147,523,536) Sidewalks, curbs, and gutters (12,866,863) (753,089) 119,374 (13,500,578) Storm drains and culverts (120,643,220) (7,729,021) 143,966 (128,228,275) Automobiles and rolling stock (42,484,552) (6,439,028) 5,771,293 (43,152,287) Furniture, fixtures, and equipment (29,603,369) (3,109,631) 1,410,414 (31,302,586) Software (17,018,620) (1,163,339) 31,536 (18,150,423) Total accumulated depreciation (465,599,471) (41,047,090) 8,425,405 (498,221,156)
Total capital assets, being depreciated, net 609,021,244 55,731,987 (969,867) 663,783,364
Total governmental activities, net $ 957,897,959 $ 112,275,195 $ (78,615,536) $ 991,557,618

Anne Arundel County, Maryland Notes to the Basic Financial Statements
56
Balance Balance Category June 30, 2006 Increases Decreases June 30, 2007
Business-type activities:Capital assets not being depreciated:
Land and easements $ 10,800,325 $ 9,131 $ - $ 10,809,456 Construction in progress 167,592,264 43,278,188 (19,900,274) 190,970,178 Total assets not depreciated 178,392,589 43,287,319 (19,900,274) 201,779,634
Capital assets being depreciated:Buildings 20,864,199 6,348,033 (39,427) 27,172,805 Landfills 34,818,431 645,318 - 35,463,749 Water and sewer plants and lines 1,218,796,147 38,264,836 (9,328,216) 1,247,732,767 Automobiles and rolling stock 7,529,382 214,648 (619,325) 7,124,705 Furniture, fixtures, and equipment 13,625,771 1,757,631 (1,422,028) 13,961,374 Total assets depreciated 1,295,633,930 47,230,466 (11,408,996) 1,331,455,400
Less accumulated depreciation for:Buildings (5,888,640) (370,609) 1,576 (6,257,673) Landfills (24,432,199) (1,623,016) - (26,055,215) Water and sewer plants and lines (378,305,510) (29,233,201) 2,813,676 (404,725,035) Automobiles and rolling stock (5,670,911) (421,899) 619,325 (5,473,485) Furniture, fixtures, and equipment (8,482,230) (766,670) 1,357,715 (7,891,185) Total accumulated depreciation (422,779,490) (32,415,395) 4,792,292 (450,402,593)
Total capital assets, being depreciated, net 872,854,440 14,815,071 (6,616,704) 881,052,807
Total business-type activities, net $ 1,051,247,029 $ 58,102,390 $ (26,516,978) $ 1,082,832,441
Board of Education:Capital assets not being depreciated:
Land and improvements $ 48,785,317 $ - $ - $ 48,785,317 Construction in progress 79,997,315 75,539,259 (68,061,901) 87,474,673 Total assets not depreciated 128,782,632 75,539,259 (68,061,901) 136,259,990
Capital assets being depreciated:Buildings 807,903,405 59,368,849 (3,354,891) 863,917,363 Furniture, fixtures, and equipment 20,987,450 1,140,803 (272,314) 21,855,939 Total assets depreciated 828,890,855 60,509,652 (3,627,205) 885,773,302
Less accumulated depreciation for:Buildings (366,719,669) (28,879,209) 3,308,233 (392,290,645) Furniture, fixtures, and equipment (12,140,217) (1,884,617) 229,719 (13,795,115) Total accumulated depreciation (378,859,886) (30,763,826) 3,537,952 (406,085,760)
Total capital assets, being depreciated, net 450,030,969 29,745,826 (89,253) 479,687,542
Total Board of Education, net $ 578,813,601 $ 105,285,085 $ (68,151,154) $ 615,947,532

Anne Arundel County, Maryland Notes to the Basic Financial Statements
57
The County has established tax increment and special taxing districts to aid in development efforts within certain geographical areas. The proceeds of debt issued on behalf of the districts are primarily used for capital improvements. Expenditures related to the improvements are recorded in the County’s capital projects and are included as construction in progress until the projects are completed. Upon project completion, the amounts recorded in construction in progress are expensed, and the related assets are capitalized when developer construction agreements are finalized and the assets inspected. The assets are depreciated over the estimated useful lives. Depreciation expense has been included in the functional categories on the Statement of Activities based on the governmental department, business-type activity, or component unit responsible for the asset. The table on the following page shows the depreciation expense for each functional category.
Balance Balance Category June 30, 2006 Increases Decreases June 30, 2007
Community College:Capital assets not being depreciated:
Land $ 2,377,654 $ - $ - $ 2,377,654 Construction in progress 827,662 7,876,956 (410,726) 8,293,892 Total assets not depreciated 3,205,316 7,876,956 (410,726) 10,671,546
Capital assets being depreciated:Land improvements 3,936,119 - - 3,936,119 Buildings and improvements 89,408,412 11,550 - 89,419,962 Furniture, fixtures, and equipment 21,600,309 1,695,187 (790,439) 22,505,057 Total assets depreciated 114,944,840 1,706,737 (790,439) 115,861,138
Less accumulated depreciation for:Land improvements (3,100,878) (166,165) - (3,267,043) Buildings and improvements (30,101,496) (2,564,370) - (32,665,866) Furniture, fixtures, and equipment (15,150,727) (2,279,274) 761,462 (16,668,539) Total accumulated depreciation (48,353,101) (5,009,809) 761,462 (52,601,448)
Total capital assets, being depreciated, net 66,591,739 (3,303,072) (28,977) 63,259,690
Total Community College, net $ 69,797,055 $ 4,573,884 $ (439,703) $ 73,931,236
Other non-major:Capital assets not being depreciated:
Construction in progress $ 43,243 $ 177,515 $ (43,243) $ 177,515
Capital assets being depreciated:Airport improvements 8,106,489 75,426 - 8,181,915 Library collection 13,932,832 2,608,891 (2,563,751) 13,977,972 Automobiles and rolling stock 58,587 - - 58,587 Furniture, fixtures, and equipment 2,902,800 123,451 (133,526) 2,892,725 Total assets depreciated 25,000,708 2,807,768 (2,697,277) 25,111,199
Less accumulated depreciation for:Airport improvements (939,989) (377,112) - (1,317,101) Library collection (4,832,402) (1,262,924) 1,102,105 (4,993,221) Automobiles and rolling stock (32,154) (8,810) - (40,964) Furniture, fixtures, and equipment (1,608,158) (288,794) 128,840 (1,768,112) Total accumulated depreciation (7,412,703) (1,937,640) 1,230,945 (8,119,398)
Total capital assets, being depreciated, net 17,588,005 870,128 (1,466,332) 16,991,801
Total other non-major, net $ 17,631,248 $ 1,047,643 $ (1,509,575) $ 17,169,316

Anne Arundel County, Maryland Notes to the Basic Financial Statements
58
6 Restricted Assets and Liabilities The revenue stabilization fund is restricted in the net assets of the General Fund. The assets of the impact fees, general county capital projects, and other nonmajor governmental funds are being retained in separate funds for each funds’ respective purposes and are, therefore, shown as restricted assets on the Statement of Net Assets. In addition, fees collected by the Water and Wastewater proprietary fund, including capital connection, front foot benefit, and environmental protection fees are restricted for the payment of debt service incurred for the construction of capital facilities. The Water and Sewer capital project funding from grants, developer contributions, and other sources are restricted for the construction of capital assets. These restricted debt service and capital projects funds are restricted in the business-type activities of the Statement of Net Assets. 7 Interfund and Inter Entity Balances and Transfers The interfund balances of the Primary Government consist of the following at June 30, 2007:
Interfund balances between the General Fund and internal service funds have been eliminated on the government-wide Statement of Net Assets; however, this government-wide statement does include a balance due to the business-type activities from the governmental activities of the Primary Government of $629,167. This represents the proprietary funds’ share of the residual equity of the internal service funds of $1,038,644 less the proprietary funds’ share of the Self Insurance Fund’s deficits of $409,477. The $181,042 balance represents special revenue funds’ implicit borrowing from the General Fund at June 30, 2007. Transfers between the Primary Government’s funds, presented on the following page, totaled $153,626,114 for fiscal year 2007. The purposes of these transfers are General Fund bond proceeds and pay-as-you-go funds for capital projects and agricultural easements; impact fee funding for capital projects; General Fund’s share of grant programs transferred to Arundel Community Development Service Fund; capital project investment earnings retained by the General Fund; transfers from special revenue fund grants to the General Fund; excess Parking Garage funds transferred to the General Fund; and tax increment funds legally appropriated for transfer to the General Fund.
Fund With Receivable Fund With Payable Amount
General Fund Enterprise Funds $ 409,477 General Fund Special Revenue Funds 181,042
$ 590,519
Governmental activities: Business-type activities:Education $ 42,024 Water and wastewater $ 30,012,459 Public Safety 4,327,256 Waste collection 2,402,936 General government 8,806,551 $ 32,415,395 Health and human services 380,268 Component units:Public works 20,591,589 Board of Education $ 30,763,826 Recreation and community services 5,586,270 Community College 5,009,809 Judicial 1,288,926 Library System 1,425,123 Code enforcement 5,353 Economic Development Corp 93,640 Land use and development 18,853 Tipton Airport Authority 385,682
$ 41,047,090 Workforce Development 33,195 $ 37,711,275

Anne Arundel County, Maryland Notes to the Basic Financial Statements
59
At June 30, 2007, receivable and payable balances remained between the Primary Government and its discretely presented component units. These balances and transactions are a result of the Primary Government’s ongoing funding of the component units’ capital and operating costs. Those balances and the payments from the Primary Government to or on behalf of these parties are presented below:
8 Bonded Debt and Other Obligations
The Primary Government’s Statement of Net Assets includes short and long-term debt and obligations comprised of bond anticipation notes, general obligation bonds, special assessment debt, leases, installment purchase agreements, and liabilities related to State loans, unpaid insurance claims, compensated absences and claims and judgments. Descriptions of certain of these obligations and the respective balances, debt service requirements, and changes during fiscal year 2007 are provided below and on the following page.
A Bond Anticipation Notes – The County periodically incurs short-term debt by issuing bond anticipation notes in the form of commercial paper. Notes are sold with an initial maturity from 1 to 270 days, and on refinancing at the notes’ maturities with additional notes marketed at then current interest rates. This remarketing is backed for liquidity purposes by a letter of credit, the terms of which provide that no principal repayments are due by the County (if there is a call on the letter of credit) until the termination of the agreement, which is maintained at two years at all times. The maturity date of this liquidity arrangement is December 15, 2015. The maturities of notes outstanding during fiscal year 2007 ranged from 20 to 223 days and interest rates ranged from 3.50% to 3.90%. The County plans to issue long-term debt in the Spring of 2008 to payoff bond anticipation notes outstanding at June 30, 2007. The terms of this refinancing have not been determined. B General Obligation Bonds – Substantially all long-term bonded debt is issued as general obligation bonds and guaranteed by the full faith and credit of the County, subject to limitations set forth in section 710 (d) of the County Charter, which restricts the growth of revenue derived from property taxes. The debt service requirements for the bonds outstanding at June 30, 2007 are presented on the following page:
Originating Fund Recipient Fund AmountGeneral General County Capital Projects $ 118,456,450 General Nonmajor Governmental 582,823 Nonmajor Governmental General 13,171,064 Impact Fees General County Capital Projects 5,225,771 Impact Fees General 7,924,512 General County Capital Projects Nonmajor Governmental 1,634,855 General County Capital Projects General 6,630,639
$ 153,626,114
Between Component Units and Primary Government
Receivables/Payables
Entity with Receivable Entity with Payable AmountBoard of Education Primary Government $ 20,349,547 Community College Primary Government 1,133,974 Other Nonmajor Primary Government 1,211,909
$ 22,695,430 Primary Government Expenditures
Originating Entity Recipient Entity AmountPrimary Government Board of Education $ 594,497,912 Primary Government Community College 38,029,741 Primary Government Other Nonmajor 18,564,009
$ 651,091,662

Anne Arundel County, Maryland Notes to the Basic Financial Statements
60
General Obligation Bonds
Year ended Governmental Business-type TotalJune 30, Principal Interest Principal Interest Principal Interest
2008 $ 51,932,017 $ 27,711,298 $ 22,986,352 $ 13,612,177 $ 74,918,369 $ 41,323,475 2009 49,481,016 25,480,014 22,045,004 12,721,647 71,526,020 38,201,661 2010 46,871,142 23,129,575 18,527,943 11,738,703 65,399,085 34,868,278 2011 44,538,229 20,845,498 17,400,551 10,894,115 61,938,780 31,739,613 2012 43,231,628 18,716,752 17,424,365 10,112,304 60,655,993 28,829,056
2013-2017 177,504,277 64,796,343 81,505,604 38,934,167 259,009,881 103,730,510 2018-2022 121,364,190 28,771,540 59,128,677 23,322,377 180,492,867 52,093,917 2023-2027 60,433,425 7,044,684 42,526,932 12,783,077 102,960,357 19,827,761 2028-2032 1,825,000 75,280 25,920,215 5,287,152 27,745,215 5,362,432 2033-2037 9,805,000 903,282 9,805,000 903,282
$ 597,180,924 $ 216,570,984 $ 317,270,643 $ 140,309,001 $ 914,451,567 $ 356,879,985
C Tax Increment and Other Debt - At June 30, 2007, there was $53,960,000 of Special Obligation Tax Increment Bonds payable from property tax revenue generated from assessment increases occurring since the formation of the tax increment districts. This debt is included in the Primary Government’s long-term debt on the Statement of Net Assets. Except for the Parole Town Center issue with $5,455,000 outstanding, the County has pledged its full faith and credit for these bonds. During the fiscal year ended June 30, 2007, $15,056,729 of incremental property tax revenue was collected and available for debt service purposes as reported on the Combining Statement of Revenues, Expenditures and Changes in Fund Balances for the Non-major Governmental Funds. The table below outlines the debt service requirements for these bonds.
June 30, Principal Interest June 30, Principal Interest2008 $ 875,000 $ 2,612,666 2013-2017 $ 8,945,000 $ 10,650,142 2009 915,000 2,570,166 2018-2022 12,055,000 8,301,138 2010 1,150,000 2,522,457 2023-2027 17,830,000 4,532,978 2011 1,690,000 2,461,848 2028-2032 8,325,000 440,059 2012 2,175,000 2,381,943 Total $ 53,960,000 $ 36,473,397
In addition, there were $5,837,000 and $3,633,000 of special tax district bonds related to the Farmington Village Project and the Villages of Dorchester outstanding at June 30, 2007, respectively. The proceeds of these bonds were used to finance infrastructure improvements within the special district. These bonds are payable solely from the proceeds of a special tax levied on parcels within the district and are not backed by the County’s full faith and credit. This debt does not appear on the Statement of Net Assets. The County acts only as a fiduciary in collecting the taxes and servicing the debt. D State Loans – The County has loans outstanding at June 30, 2007 of $2,163,208. These loans were received from the State for highway improvements and waterway improvements. During fiscal year 2007 the County paid $212,657 for principal. The table below outlines the debt service requirements.
Federal Loans – As of June 30, 2007, the County had one HUD Section 108 Loan outstanding for a community development capital improvement project. In September of 2006, the variable fixed rate loan was
Year ended Year ended June 30, Principal Interest June 30, Principal Interest
2008 $ 221,501 $ - 2013-2017 $ 814,048 $ -2009 202,146 - 2018-2022 267,505 -2010 183,021 - 2023-2027 79,416 -2011 183,021 - 2028-2032 46,830 -2012 165,720 - Total $ 2,163,208 $ -

Anne Arundel County, Maryland Notes to the Basic Financial Statements
61
converted to a fixed rate long-term loan with scheduled principal payments of $410,000 due in August with a fixed percentage rate of interest. The table below outlines the debt service requirements.
E Leases – The County has entered into various lease agreements for assets, which qualify as capital leases for accounting purposes. These agreements have resulted in capital assets totaling $153,400 all of which are used for governmental activities. Mechanical equipment leased consists of golf carts used by the Department of Recreation and Parks. These equipment leases are five years in length and annual payments for all total about $3,000. Computer hardware comprises the remaining capital leases. These agreements are primarily three years in length with annual payments totaling about $58,000. The net present value of these minimum lease payments as of June 30, 2007 and the future minimum lease obligations were as follows:
Present ValueYear ended of Minimum Total Minimum
June 30, Lease Payments Interest Payments
2008 $ 277 $ 2 $ 279
The County has also entered into several operating lease arrangements for office space and equipment. All leases are cancelable at the option of the County. Many of the agreements contain renewal options and some have rent escalation clauses. Total lease expenses for fiscal year 2007 were $3,646,320. Anne Arundel County has a fifty-year lease with the City of Annapolis for Eisenhower Golf Course. The lease terms state the rent shall be the sum of fifty percent (50%) of the annual net profits derived from the operation of the facilities. Because the amount varies, the future value of these lease payments is not included in the table below. The lease payments for fiscal years 2007 and 2006 are $222,740 and $260,021 respectively. Minimum annual rental costs required by the leases are summarized below:
F Installment Purchase Agreements – The County has instituted an Installment Purchase Program to facilitate County purchases of real property easements to maintain farmland and other open space. Under this program the County signs long-term debt agreements with property holders with a minimal down payment, typically $1,000. Interest and nominal principal payments are made over the life of the agreement and a balloon payment is due at the end of the term to pay off the remaining principal balance. In order to pay the balloon payment, the County purchases and reserves a zero coupon U.S. Treasury Strip. This investment matures when the agreement expires and effectively earns the same interest rate that the County pays on the debt. The debt requirements as of June 30, 2007 are presented on the following page:
Year ending Annual Year ending AnnualJune 30, Rentals June 30, Rentals
2008 $ 3,391,089 2012 $ 1,387,308 2009 3,079,770 2013-2017 3,580,522 2010 2,326,016 2018-2022 447,356 2011 2,084,872 $ 16,296,933
June 30, Principal Interest2008 $ - $ 81,918 2009 410,000 71,648 2010 410,000 51,209 2011 410,000 30,811 2013 410,000 10,291
Total $ 1,640,000 $ 245,877
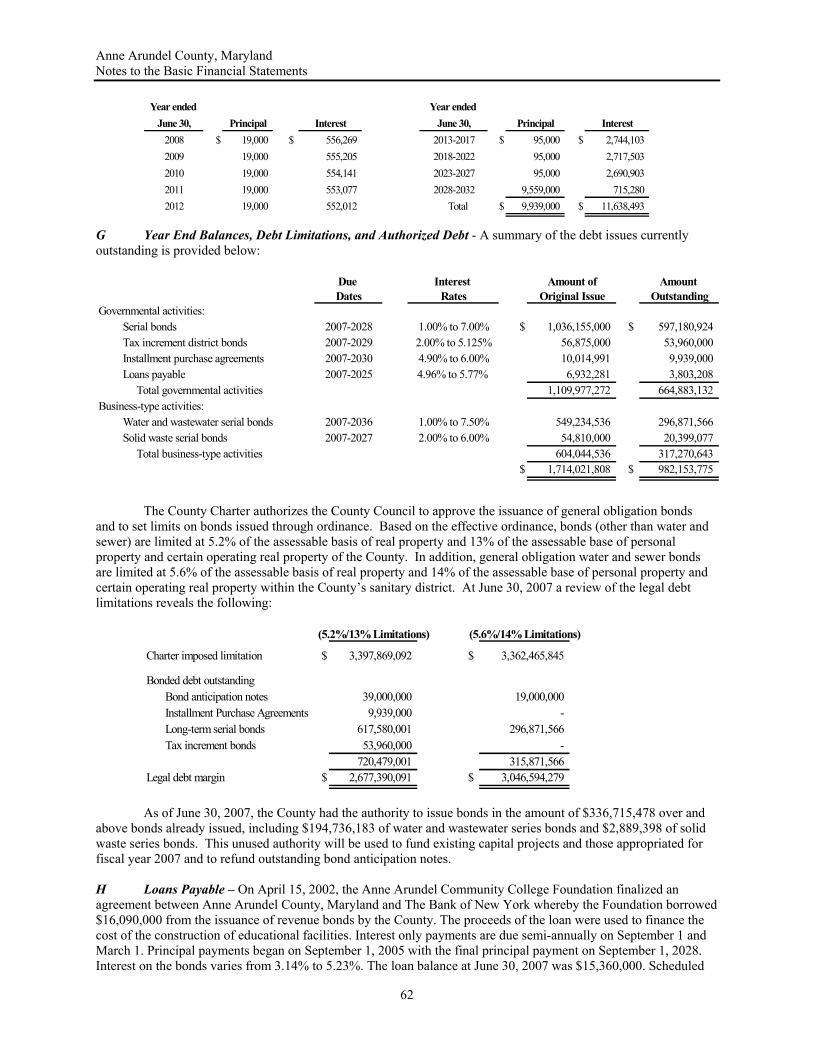
Anne Arundel County, Maryland Notes to the Basic Financial Statements
62
Year ended Year ended June 30, Principal Interest June 30, Principal Interest
2008 $ 19,000 $ 556,269 2013-2017 $ 95,000 $ 2,744,103 2009 19,000 555,205 2018-2022 95,000 2,717,503 2010 19,000 554,141 2023-2027 95,000 2,690,903 2011 19,000 553,077 2028-2032 9,559,000 715,280 2012 19,000 552,012 Total $ 9,939,000 $ 11,638,493
G Year End Balances, Debt Limitations, and Authorized Debt - A summary of the debt issues currently outstanding is provided below:
Due Interest Amount of Amount Dates Rates Original Issue Outstanding
Governmental activities:Serial bonds 2007-2028 1.00% to 7.00% $ 1,036,155,000 $ 597,180,924 Tax increment district bonds 2007-2029 2.00% to 5.125% 56,875,000 53,960,000 Installment purchase agreements 2007-2030 4.90% to 6.00% 10,014,991 9,939,000 Loans payable 2007-2025 4.96% to 5.77% 6,932,281 3,803,208 Total governmental activities 1,109,977,272 664,883,132
Business-type activities:Water and wastewater serial bonds 2007-2036 1.00% to 7.50% 549,234,536 296,871,566 Solid waste serial bonds 2007-2027 2.00% to 6.00% 54,810,000 20,399,077 Total business-type activities 604,044,536 317,270,643
$ 1,714,021,808 $ 982,153,775
The County Charter authorizes the County Council to approve the issuance of general obligation bonds and to set limits on bonds issued through ordinance. Based on the effective ordinance, bonds (other than water and sewer) are limited at 5.2% of the assessable basis of real property and 13% of the assessable base of personal property and certain operating real property of the County. In addition, general obligation water and sewer bonds are limited at 5.6% of the assessable basis of real property and 14% of the assessable base of personal property and certain operating real property within the County’s sanitary district. At June 30, 2007 a review of the legal debt limitations reveals the following:
(5.2%/13% Limitations) (5.6%/14% Limitations)
Charter imposed limitation $ 3,397,869,092 $ 3,362,465,845
Bonded debt outstandingBond anticipation notes 39,000,000 19,000,000 Installment Purchase Agreements 9,939,000 - Long-term serial bonds 617,580,001 296,871,566 Tax increment bonds 53,960,000 -
720,479,001 315,871,566 Legal debt margin $ 2,677,390,091 $ 3,046,594,279
As of June 30, 2007, the County had the authority to issue bonds in the amount of $336,715,478 over and above bonds already issued, including $194,736,183 of water and wastewater series bonds and $2,889,398 of solid waste series bonds. This unused authority will be used to fund existing capital projects and those appropriated for fiscal year 2007 and to refund outstanding bond anticipation notes. H Loans Payable – On April 15, 2002, the Anne Arundel Community College Foundation finalized an agreement between Anne Arundel County, Maryland and The Bank of New York whereby the Foundation borrowed $16,090,000 from the issuance of revenue bonds by the County. The proceeds of the loan were used to finance the cost of the construction of educational facilities. Interest only payments are due semi-annually on September 1 and March 1. Principal payments began on September 1, 2005 with the final principal payment on September 1, 2028. Interest on the bonds varies from 3.14% to 5.23%. The loan balance at June 30, 2007 was $15,360,000. Scheduled
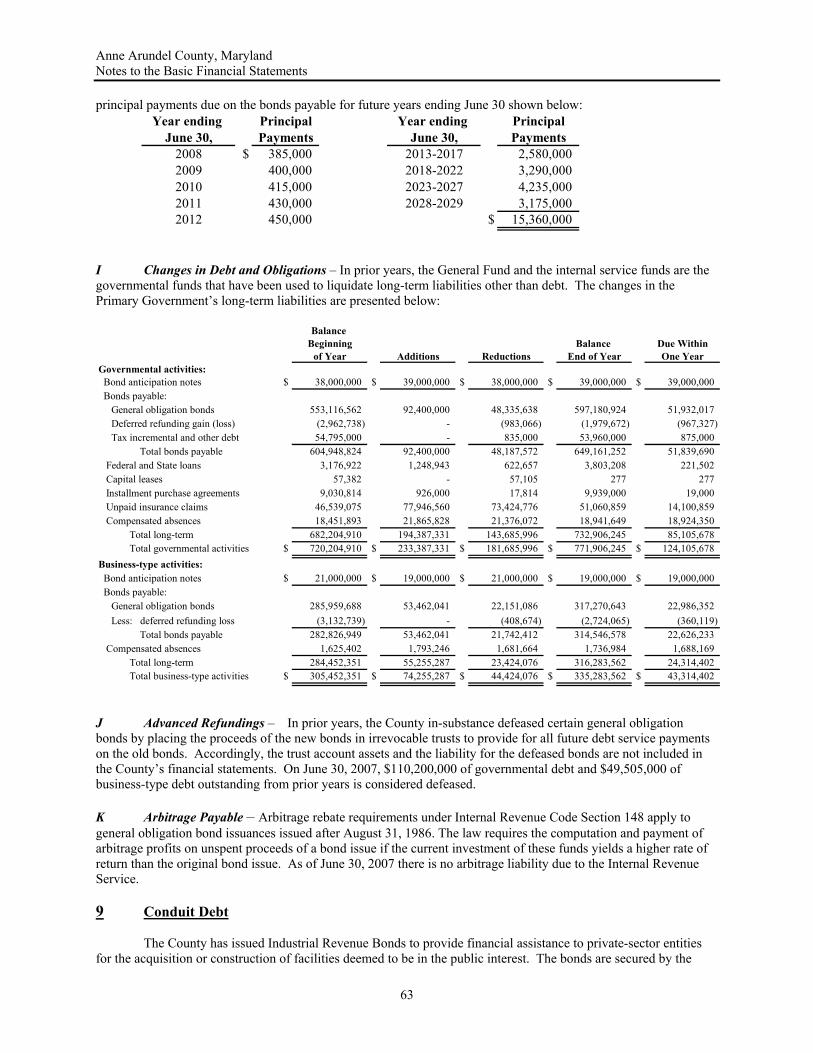
Anne Arundel County, Maryland Notes to the Basic Financial Statements
63
principal payments due on the bonds payable for future years ending June 30 shown below:
I Changes in Debt and Obligations – In prior years, the General Fund and the internal service funds are the governmental funds that have been used to liquidate long-term liabilities other than debt. The changes in the Primary Government’s long-term liabilities are presented below:
Balance Beginning Balance Due Within
of Year Additions Reductions End of Year One YearGovernmental activities: Bond anticipation notes $ 38,000,000 $ 39,000,000 $ 38,000,000 $ 39,000,000 $ 39,000,000 Bonds payable: General obligation bonds 553,116,562 92,400,000 48,335,638 597,180,924 51,932,017 Deferred refunding gain (loss) (2,962,738) - (983,066) (1,979,672) (967,327) Tax incremental and other debt 54,795,000 - 835,000 53,960,000 875,000 Total bonds payable 604,948,824 92,400,000 48,187,572 649,161,252 51,839,690 Federal and State loans 3,176,922 1,248,943 622,657 3,803,208 221,502 Capital leases 57,382 - 57,105 277 277 Installment purchase agreements 9,030,814 926,000 17,814 9,939,000 19,000 Unpaid insurance claims 46,539,075 77,946,560 73,424,776 51,060,859 14,100,859 Compensated absences 18,451,893 21,865,828 21,376,072 18,941,649 18,924,350 Total long-term 682,204,910 194,387,331 143,685,996 732,906,245 85,105,678 Total governmental activities $ 720,204,910 $ 233,387,331 $ 181,685,996 $ 771,906,245 $ 124,105,678 Business-type activities: Bond anticipation notes $ 21,000,000 $ 19,000,000 $ 21,000,000 $ 19,000,000 $ 19,000,000 Bonds payable: General obligation bonds 285,959,688 53,462,041 22,151,086 317,270,643 22,986,352 Less: deferred refunding loss (3,132,739) - (408,674) (2,724,065) (360,119) Total bonds payable 282,826,949 53,462,041 21,742,412 314,546,578 22,626,233 Compensated absences 1,625,402 1,793,246 1,681,664 1,736,984 1,688,169 Total long-term 284,452,351 55,255,287 23,424,076 316,283,562 24,314,402 Total business-type activities $ 305,452,351 $ 74,255,287 $ 44,424,076 $ 335,283,562 $ 43,314,402
J Advanced Refundings – In prior years, the County in-substance defeased certain general obligation bonds by placing the proceeds of the new bonds in irrevocable trusts to provide for all future debt service payments on the old bonds. Accordingly, the trust account assets and the liability for the defeased bonds are not included in the County’s financial statements. On June 30, 2007, $110,200,000 of governmental debt and $49,505,000 of business-type debt outstanding from prior years is considered defeased. K Arbitrage Payable – Arbitrage rebate requirements under Internal Revenue Code Section 148 apply to general obligation bond issuances issued after August 31, 1986. The law requires the computation and payment of arbitrage profits on unspent proceeds of a bond issue if the current investment of these funds yields a higher rate of return than the original bond issue. As of June 30, 2007 there is no arbitrage liability due to the Internal Revenue Service. 9 Conduit Debt The County has issued Industrial Revenue Bonds to provide financial assistance to private-sector entities for the acquisition or construction of facilities deemed to be in the public interest. The bonds are secured by the
Year ending Principal Year ending PrincipalJune 30, Payments June 30, Payments
2008 $ 385,000 2013-2017 2,580,000 2009 400,000 2018-2022 3,290,000 2010 415,000 2023-2027 4,235,000 2011 430,000 2028-2029 3,175,000 2012 450,000 $ 15,360,000
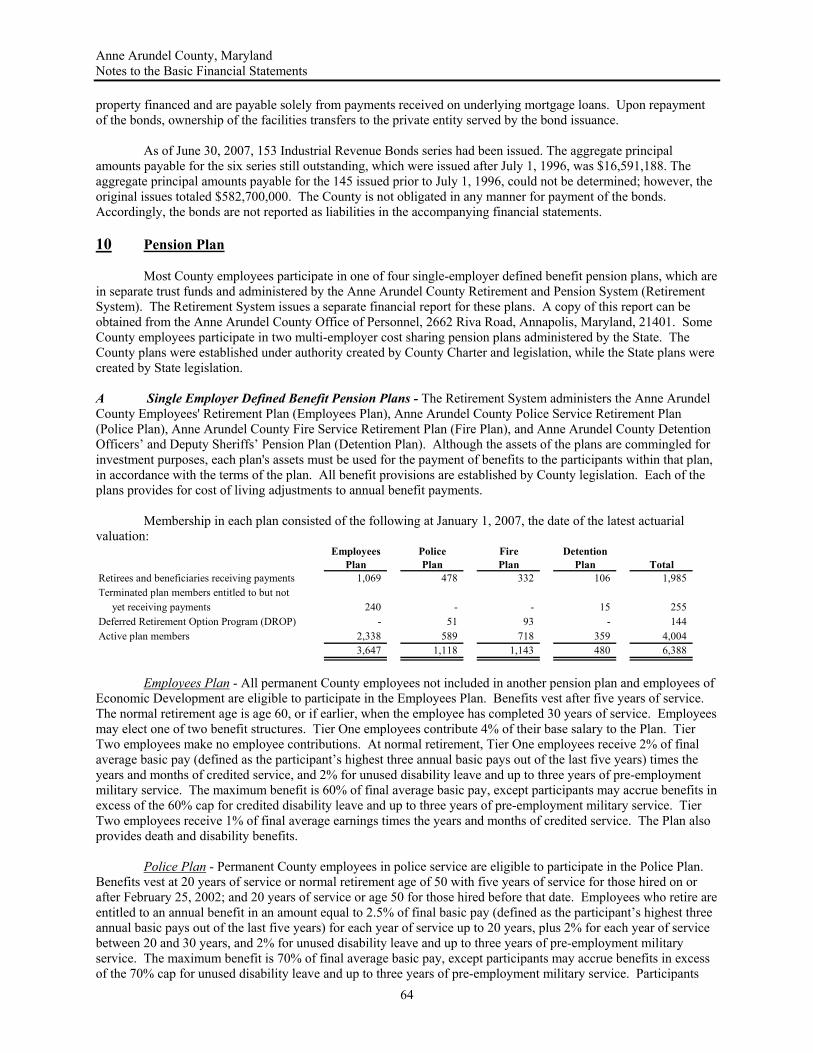
Anne Arundel County, Maryland Notes to the Basic Financial Statements
64
property financed and are payable solely from payments received on underlying mortgage loans. Upon repayment of the bonds, ownership of the facilities transfers to the private entity served by the bond issuance. As of June 30, 2007, 153 Industrial Revenue Bonds series had been issued. The aggregate principal amounts payable for the six series still outstanding, which were issued after July 1, 1996, was $16,591,188. The aggregate principal amounts payable for the 145 issued prior to July 1, 1996, could not be determined; however, the original issues totaled $582,700,000. The County is not obligated in any manner for payment of the bonds. Accordingly, the bonds are not reported as liabilities in the accompanying financial statements. 10 Pension Plan
Most County employees participate in one of four single-employer defined benefit pension plans, which are in separate trust funds and administered by the Anne Arundel County Retirement and Pension System (Retirement System). The Retirement System issues a separate financial report for these plans. A copy of this report can be obtained from the Anne Arundel County Office of Personnel, 2662 Riva Road, Annapolis, Maryland, 21401. Some County employees participate in two multi-employer cost sharing pension plans administered by the State. The County plans were established under authority created by County Charter and legislation, while the State plans were created by State legislation.
A Single Employer Defined Benefit Pension Plans - The Retirement System administers the Anne Arundel County Employees' Retirement Plan (Employees Plan), Anne Arundel County Police Service Retirement Plan (Police Plan), Anne Arundel County Fire Service Retirement Plan (Fire Plan), and Anne Arundel County Detention Officers’ and Deputy Sheriffs’ Pension Plan (Detention Plan). Although the assets of the plans are commingled for investment purposes, each plan's assets must be used for the payment of benefits to the participants within that plan, in accordance with the terms of the plan. All benefit provisions are established by County legislation. Each of the plans provides for cost of living adjustments to annual benefit payments.
Membership in each plan consisted of the following at January 1, 2007, the date of the latest actuarial valuation:
Employees Police Fire DetentionPlan Plan Plan Plan Total
Retirees and beneficiaries receiving payments 1,069 478 332 106 1,985 Terminated plan members entitled to but not yet receiving payments 240 - - 15 255 Deferred Retirement Option Program (DROP) - 51 93 - 144 Active plan members 2,338 589 718 359 4,004
3,647 1,118 1,143 480 6,388
Employees Plan - All permanent County employees not included in another pension plan and employees of Economic Development are eligible to participate in the Employees Plan. Benefits vest after five years of service. The normal retirement age is age 60, or if earlier, when the employee has completed 30 years of service. Employees may elect one of two benefit structures. Tier One employees contribute 4% of their base salary to the Plan. Tier Two employees make no employee contributions. At normal retirement, Tier One employees receive 2% of final average basic pay (defined as the participant’s highest three annual basic pays out of the last five years) times the years and months of credited service, and 2% for unused disability leave and up to three years of pre-employment military service. The maximum benefit is 60% of final average basic pay, except participants may accrue benefits in excess of the 60% cap for credited disability leave and up to three years of pre-employment military service. Tier Two employees receive 1% of final average earnings times the years and months of credited service. The Plan also provides death and disability benefits.
Police Plan - Permanent County employees in police service are eligible to participate in the Police Plan. Benefits vest at 20 years of service or normal retirement age of 50 with five years of service for those hired on or after February 25, 2002; and 20 years of service or age 50 for those hired before that date. Employees who retire are entitled to an annual benefit in an amount equal to 2.5% of final basic pay (defined as the participant’s highest three annual basic pays out of the last five years) for each year of service up to 20 years, plus 2% for each year of service between 20 and 30 years, and 2% for unused disability leave and up to three years of pre-employment military service. The maximum benefit is 70% of final average basic pay, except participants may accrue benefits in excess of the 70% cap for unused disability leave and up to three years of pre-employment military service. Participants

Anne Arundel County, Maryland Notes to the Basic Financial Statements
65
with 20 years service may elect normal retirement, regardless of age. The Plan also provides death and disability benefits.
Participants in the Police Service Retirement Plan may participate in the deferred retirement option
program (DROP) if they were actively employed by the County in a position covered by the Plan and have completed 20 years of actual Plan service. The participant’s initial DROP term is three years, but he or she may extend participation for two additional one-year terms. A DROP participant continues as an active employee of the County but the participant no longer makes employee contributions to the plan and accrues no additional pension benefit. During the term of DROP participation, the participant’s annual retirement benefit as of the date DROP participation begins is credited to the participant in an account earning 8% interest annually. When the DROP participation ends and the employee terminates service to the County, the account balance is distributed to the participant.
Fire Plan - Permanent County employees in fire service are eligible to participate in the Fire Plan. Benefits vest at normal retirement age. Participants may retire when they have 20 years of service, regardless of age or at age 50 with 5 years of actual service. Employees who retire are entitled to an annual benefit in an amount equal to 2.5% of final average basic pay (defined as the participant’s highest three annual basic pays out of the last five years) for each year of service up to 20 years, plus 2% for each year of service between 20 and 30 years, and 2% for unused disability leave and up to three years of pre-employment military service. The maximum benefit is 70% of final earnings, except participants may accrue benefits in excess of the 70% cap for unused disability leave and up to three years of pre-employment military service. The Plan also provides death and disability benefits.
Through June 30, 2002, participants with 20 years of County service who are at least age 50 may
participate in a deferred retirement option program with provisions similar to those described for the Police Plan. After June 30, 2002, any participant with 20 years of service may participate, regardless of age. Detention Plan - Permanent County detention center officers, personnel, and sheriff deputies are eligible to participate in the Detention Plan. Benefits vest after five years of service. The normal retirement age for the members is age 50. Members are entitled to an annual benefit in the amount of 2.5% of final average basic pay (defined as the participant’s highest three annual basic pays out of the last five years) for each year of service up to 20 years, plus 2% of final average basic pay for each additional year, and 2% for unused disability leave and up to three years of pre-employment military service. The maximum benefit is 70% of final earnings, except participants may accrue benefits in excess of the 70% cap for unused disability leave and up to 3 years of active military service. The Plan also provides death and disability benefits. In 2004 the County implemented provisions of the County labor contracts that redefined participants in the Plan so that one group can be afforded different benefits. A new “20 and out” benefit was provided to uniformed Detention Officers and Deputy Sheriffs. B Multiple-Employer Pension Plans - Primary Government employees hired prior to July 1, 1969 who elected not to transfer to the Employees Plan and substantially all employees of the Board of Education, Library and Community College participate in plans of the State Retirement and Pension Systems of Maryland, which are multi-employer cost sharing defined benefit pension plans. The system plans provide retirement and disability benefits, annual cost-of-living adjustments, and death benefits to plan members and beneficiaries. The State Retirement and Pension System of Maryland issues a financial report that includes financial statements and required supplementary information. That report may be obtained by writing to State Retirement Agency of Maryland, 120 East Baltimore Street, Baltimore, MD 21202. C Funding Policy and Annual Pension Costs – The employee contribution requirements for each employer defined benefit plan in the Retirement System are set by County legislation. The County’s annual contribution is based on annual actuarial valuations. The table on the following page provides the actuarial assumptions, funding methods and contributions related to the fiscal year 2007 financial statements.
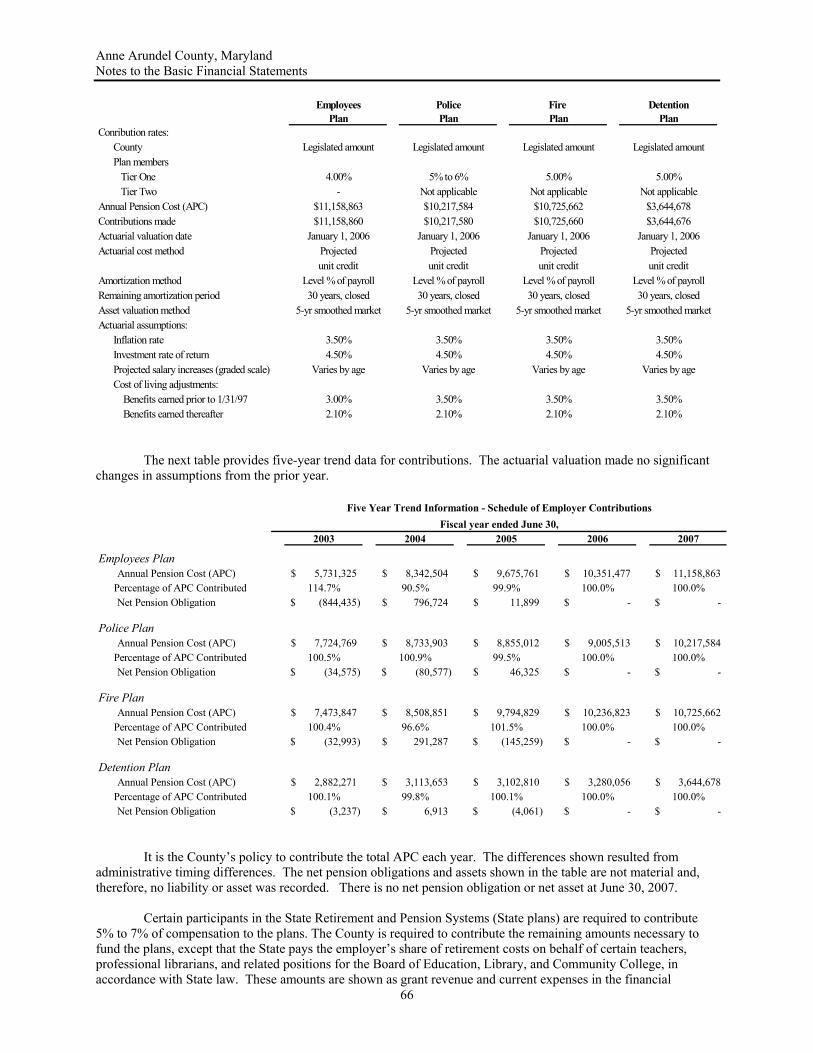
Anne Arundel County, Maryland Notes to the Basic Financial Statements
66
Employees Police Fire DetentionPlan Plan Plan Plan
Conribution rates:County Legislated amount Legislated amount Legislated amount Legislated amountPlan members Tier One 4.00% 5% to 6% 5.00% 5.00% Tier Two - Not applicable Not applicable Not applicable
Annual Pension Cost (APC) $11,158,863 $10,217,584 $10,725,662 $3,644,678Contributions made $11,158,860 $10,217,580 $10,725,660 $3,644,676Actuarial valuation date January 1, 2006 January 1, 2006 January 1, 2006 January 1, 2006Actuarial cost method Projected Projected Projected Projected
unit credit unit credit unit credit unit creditAmortization method Level % of payroll Level % of payroll Level % of payroll Level % of payrollRemaining amortization period 30 years, closed 30 years, closed 30 years, closed 30 years, closedAsset valuation method 5-yr smoothed market 5-yr smoothed market 5-yr smoothed market 5-yr smoothed marketActuarial assumptions:
Inflation rate 3.50% 3.50% 3.50% 3.50%Investment rate of return 4.50% 4.50% 4.50% 4.50%Projected salary increases (graded scale) Varies by age Varies by age Varies by age Varies by ageCost of living adjustments: Benefits earned prior to 1/31/97 3.00% 3.50% 3.50% 3.50% Benefits earned thereafter 2.10% 2.10% 2.10% 2.10%
The next table provides five-year trend data for contributions. The actuarial valuation made no significant
changes in assumptions from the prior year.
2003 2004 2005 2006 2007
Employees PlanAnnual Pension Cost (APC) 5,731,325$ 8,342,504$ 9,675,761$ 10,351,477$ 11,158,863$
Percentage of APC Contributed 114.7% 90.5% 99.9% 100.0% 100.0%Net Pension Obligation (844,435)$ 796,724$ 11,899$ -$ -$
Police PlanAnnual Pension Cost (APC) 7,724,769$ 8,733,903$ 8,855,012$ 9,005,513$ 10,217,584$
Percentage of APC Contributed 100.5% 100.9% 99.5% 100.0% 100.0%Net Pension Obligation (34,575)$ (80,577)$ 46,325$ -$ -$
Fire PlanAnnual Pension Cost (APC) 7,473,847$ 8,508,851$ 9,794,829$ 10,236,823$ 10,725,662$
Percentage of APC Contributed 100.4% 96.6% 101.5% 100.0% 100.0%Net Pension Obligation (32,993)$ 291,287$ (145,259)$ -$ -$
Detention PlanAnnual Pension Cost (APC) 2,882,271$ 3,113,653$ 3,102,810$ 3,280,056$ 3,644,678$
Percentage of APC Contributed 100.1% 99.8% 100.1% 100.0% 100.0%Net Pension Obligation (3,237)$ 6,913$ (4,061)$ -$ -$
Fiscal year ended June 30,Five Year Trend Information - Schedule of Employer Contributions
It is the County’s policy to contribute the total APC each year. The differences shown resulted from administrative timing differences. The net pension obligations and assets shown in the table are not material and, therefore, no liability or asset was recorded. There is no net pension obligation or net asset at June 30, 2007. Certain participants in the State Retirement and Pension Systems (State plans) are required to contribute 5% to 7% of compensation to the plans. The County is required to contribute the remaining amounts necessary to fund the plans, except that the State pays the employer’s share of retirement costs on behalf of certain teachers, professional librarians, and related positions for the Board of Education, Library, and Community College, in accordance with State law. These amounts are shown as grant revenue and current expenses in the financial

Anne Arundel County, Maryland Notes to the Basic Financial Statements
67
statements of these component units. County expenditures for those employees in the State plans for the year ended June 30, 2007, 2006, and 2005 equal the required contributions and are summarized below along with the State’s contribution on behalf on the employees discussed on the previous page.
Fiscal Year Ended June 30,2007 2006 2005
County contributions:Primary Government $ 1,255,125 $ 1,195,355 $ 1,138,433 Board of Education 6,021,256 5,305,219 4,883,055 Community College 150,519 139,927 120,534
State contributions on behalf of:
Board of Education 35,211,266 32,027,371 32,189,217 Community College 1,700,000 1,500,000 1,600,000 Library 810,704 738,928 728,882 Total $ 45,148,870 $ 40,906,800 $ 40,660,121
11 Other Post-retirement Benefits Retirees of the Primary Government, Library, and Economic Development continue to receive medical coverage. The Primary Government pays eighty percent of the cost. These retirees have the option of retaining dental and vision coverage, but must pay the full cost of these benefits. Health benefits are provided to retirees through an agreement between the Primary Government and the Police labor union, and are extended to others by administrative policy. There were 2,157 retirees and spouses receiving health benefits as of June 30, 2007. Retirees of the Board of Education who receive benefits from the State Retirement System may elect to continue medical coverage. Retirees may also continue in the Board’s dental or vision programs. The Board pays eighty percent of the cost of the basic health care and dental programs with the balance of the cost deducted from the retirees’ monthly check. These benefits are provided through an agreement between the Board and Anne Arundel County Retired Teachers Association. There were approximately 3,780 retirees eligible for benefits at June 30, 2007. Retirees of the Community College receive certain health care and dental benefits. The Community College contributes to the cost of these health and dental benefits at a rate of 2.5 percent per year for each year of service. Employees must have at least 10 years of service to qualify and the maximum paid by the College is 75%. Retirees have no vested rights to these benefits, which are subject to modifications by the Board of Trustees. There were 416 active College employees and retirees eligible to receive post-retirement benefits at June 30, 2007. These costs are recognized when paid. Total costs incurred for these benefits for the year ended June 30, 2007 were as follows:
Entity Amount
Primary Government $ 11,329,132 Board of Education 26,699,639 Community College 615,918 Other Nonmajor Component Units 427,368
$ 39,072,057 12 Risk Management The County retains the risk of loss for workers’ compensation and Directors and Officers coverage for the Primary Government, the Library, the Board of Education, and the Community College; general liability and vehicle liability coverage for the Primary Government, Library and the Board of Education; and health coverage for the Primary Government. The County purchases insurance coverage for real and personal property and money and security coverage, as well as school bus insurance for the bus contractors of the Board of Education. All insurance activities are recorded in the Self Insurance Fund, except for health activity, which is recorded in the Health Insurance Fund. The Self Insurance Fund has recognized a liability at fiscal year-end for those claims where a loss has occurred and the amount of loss can be reasonably estimated. This estimate includes reserves for non-incremental

Anne Arundel County, Maryland Notes to the Basic Financial Statements
68
claims adjustment expense. An actuarial review of all claims is used as the basis for determining the liability at the end of the year. Management, with the assistance of claims administrators, estimates the liabilities for the Health Insurance Fund. Both funds include estimated liabilities for claims that have been incurred but not reported. Claims are reevaluated periodically to take into consideration recently settled claims, the frequency of claims, and other economic and social factors. The liability as of June 30, 2007 is undiscounted. Settlements have not exceeded coverages for each of the past three fiscal years. Changes in the balances of claims liabilities during fiscal years 2007 and 2006 were as follows:
2007 2006Liability balance, July 1 $ 46,539,075 $ 43,595,433
Current year claims and changes in estimates: Changes in estimates - prior periods 1,913,000 132,000 Changes in estimates - current year 76,033,560 71,770,077 Claims payments (73,424,776) (68,958,435)
Liability balance, June 30 $ 51,060,859 $ 46,539,075
13 Landfill Closure, Postclosure, and Remediation The Primary Government has utilized three landfill sites; however, only one site, the Millersville Landfill, is still accepting trash. The others, Glen Burnie and Sudley, were closed in 1983 and 1993, respectively. The Millersville site consists of nine individual cells. Cells 1 through 7 are closed, cell 8 is active and 75.7 % full and cell 9 has not yet opened. Cells 8 and 9 have useful lives to at least 2015 and 2055, respectively. The table that follows presents the costs and liabilities related to all sites. The costs for cells 8 and 9 at the Millersville Landfill are determined by applying the percent of capacity used to the total estimated closure and postclosure costs.
The Primary Government accounts for landfill activities in the Solid Waste Fund. Management uses federal and state regulations to estimate the costs of closure, remediation, and monitoring the landfills. These estimates are recorded at current costs and are management’s best judgment of the minimum cost required to correct identified problems and close and remediate open cells. These estimates are subject to periodic reevaluation and actual costs may differ due to inflation or deflation, changes in technology, or changes in applicable laws and regulations. Closure reserves increased by a net of $847,044 and post closure reserves decreased by a net of $3,062,374. These increases/decreases include changes to the estimates in the reserves, payments, and other adjustments. The Primary Government has financial assurance requirements that require the reservation of funds to pay landfill liabilities. The financial assurance reservation totaled $16,024,470 at June 30, 2007. 14 Contingent Liabilities A Impact Fees – At June 30, 2007, the Primary Government held impact fees accumulated for construction of schools and roads in designated districts of the County. The legislation authorizing the collection of such fees requires the Primary Government to expend or encumber these funds within specified times after collection.
Millersville Closed Sites TotalTotal costs: Closure $ 50,291,392 $ 18,163,719 $ 68,455,111 Post closure 35,678,726 6,532,034 42,210,760
85,970,118 24,695,753 110,665,871Less: Amount recognized thru June 30, 2007 48,857,645 24,695,753 73,553,398
Costs remaining to be recognized $ 37,112,473 $ - $ 37,112,473
Liability recorded at June 30, 2007: Closure $ 8,665,459 $ - $ 8,665,459 Post closure 19,124,212 6,532,034 25,656,246
$ 27,789,671 $ 6,532,034 $ 34,321,705

Anne Arundel County, Maryland Notes to the Basic Financial Statements
69
Although as of June 30, 2007, $51,195,501 is subject to return if not spent, management believes the refund of these fees is unlikely. The County has entered into impact fee agreements with developers who provide offsite improvements designed to lessen the impact of the development on the immediate community. Unredeemed impact fee credits totaled $5,131,289 at June 30, 2007. B Lawsuits – Property owners and taxpayers have filed a class action suit against the County seeking refunds of development impact fees paid to the County. The case was originally dismissed by the Circuit Court, however, the Court of Special Appeals remanded the case back to Circuit Court. On December 15, 2006, the Circuit Court issued a final judgment, finding that impact fees of $4,719,359, plus interest, are due to the current owners of the specified impact fee paying properties. In the opinion of the County Attorney, the likelihood of an outcome unfavorable to the County is reasonably possible but the possibility that the loss might exceed $5,000,000 is remote. The County believes that significant legal issues are preserved for appeal and substantial and compelling defenses remain in favor of the County, and no loss related to this issue has been accrued. The County is party to other legal proceedings that normally occur in governmental operations. Such proceedings include developer’s claims, property damage, employee liability, and workers compensation. These proceedings are not, in the opinion of the County Attorney, likely to have a material, adverse impact on the financial position of the County as a whole, as reserves for losses have been established in the Self Insurance Fund. C Federal Financial Assistance - The County receives significant financial assistance from the U.S. Government. Entitlement to the resources is generally conditioned upon compliance with terms and conditions of the grant agreements and applicable federal regulations, including the expenditure of the resources for eligible purposes. Substantially all grants are subject to financial and compliance audits. Any disallowances as a result of these audits become a liability of the fund that received the grants. As of June 30, 2007, the County estimates that no material liabilities will result from such audits.

Anne Arundel County, Maryland Required Supplementary Information Year Ended June 30, 2007
70
The information below is intended to help users assess pension plan funding status on a going-concern basis, assess progress made in accumulating assets to pay benefits when due, and make comparisons with other public employee retirement systems.
Notes to Required Supplementary Information A. Analysis of the dollar amounts of plan net assets, actuarial accrued liability, and unfunded actuarial accrued liability in isolation can be misleading. Expressing plan net assets as a percentage of the actuarial accrued liability provides one indication of pension plan funding status on a going-concern basis. Analysis of this percentage over time indicates whether the system is becoming financially stronger or weaker. Generally, the greater this percentage, the stronger the pension plan. B. Trends in the unfunded actuarial accrued liability and annual covered payroll are both affected by inflation. Expressing the unfunded actuarial accrued liability as a percentage of annual covered payroll approximately adjusts for the effects of inflation and aids analysis of pension plan progress made in accumulating sufficient assets to pay benefits when due. Generally, the smaller this percentage, the stronger the pension plan.
(A) (B) (B - A) (A / B) ( C) (B - A/ C)Actuarial Actuarial Unfunded UAAL as aValue of Accrued AAL Funded Covered % of Covered
Assets Liability (AAL) (UAAL) Ratio Payroll PayrollEmployees Retirement Plan:
January 1, 2005 395,501,876 405,171,824 9,669,948 97.6% 103,105,736 9.4%2006 422,234,496 439,232,236 16,997,830 96.1% 107,290,189 15.8%2007 456,656,849 481,971,630 25,314,781 94.7% 116,709,102 21.7%
Police Service Retirement Plan:January 1, 2005 337,113,153 346,154,153 9,041,000 97.4% 33,530,370 27.0%
2006 360,268,341 376,560,903 16,292,562 95.7% 36,694,307 44.4%2007 389,877,885 401,698,105 11,820,220 97.1% 37,805,038 31.3%
Fire Service Retirement PlanJanuary 1, 2005 313,478,279 326,860,256 13,381,977 95.9% 34,871,614 38.4%
2006 340,274,675 355,786,396 15,511,721 95.6% 38,592,322 40.2%2007 368,413,752 383,694,268 15,280,516 96.0% 43,527,351 35.1%
Pension Plan for Detention Officers and Personnel:January 1, 2005 52,200,204 60,272,753 8,072,549 86.6% 15,355,590 52.6%
2006 58,379,332 69,092,726 10,713,394 84.5% 16,794,068 63.8%2007 66,233,757 75,946,236 9,712,479 87.2% 17,367,873 55.9%
State Retirement and Pension System of Maryland (dollar amounts in thousands):June 30, 2004 33,484,657 36,325,704 2,841,047 92.2% 8,069,481 35.0%
2005 34,519,500 39,133,450 4,613,949 88.2% 8,603,761 54.0%2006 35,795,025 43,243,492 7,448,467 82.8% 9,287,576 80.0%

Combining Fund Statements, Budgetary Schedules, and
Other Supporting Schedules

71
(This page left blank intentionally)

Anne Arundel County, Maryland
Detail Schedule of Revenue - Estimated and Actual (Non-GAAP Basis)
General Fund
Year Ended June 30, 2007
Original Final VarianceBudget Budget Actual Over (Under)
GENERAL PROPERTY TAXES Real and personal taxes $ 450,018,000 $ 450,018,000 $ 457,043,517 $ 7,025,517 Interest and penalties 635,000 635,000 781,845 146,845
450,653,000 450,653,000 457,825,362 7,172,362
LOCAL INCOME TAXES 345,500,000 345,500,000 361,956,043 16,456,043
STATE SHARED TAXES Highway user 31,770,000 31,770,000 29,933,996 (1,836,004) Admissions 6,825,000 6,825,000 7,187,118 362,118 Auto-boat 5,000 5,000 4,735 (265)
38,600,000 38,600,000 37,125,849 (1,474,151)
GRANTS AND AID Programs for the aging 3,172,000 3,507,000 3,650,971 143,971 Public safety 8,783,300 9,132,700 8,022,608 (1,110,092) Mental health 542,900 542,900 564,275 21,375 Health 20,702,300 20,702,300 20,853,547 151,247 Other 14,080,100 14,442,900 12,592,246 (1,850,654)
47,280,600 48,327,800 45,683,647 (2,644,153)
RECORDATION AND TRANSFER TAXES Recordation 53,000,000 53,000,000 57,226,551 4,226,551 Transfer 52,000,000 52,000,000 52,030,889 30,889
105,000,000 105,000,000 109,257,440 4,257,440
LOCAL SALES TAXES Electricity 5,270,000 5,270,000 5,075,320 (194,680) Gas 715,000 715,000 711,205 (3,795) Telephone 7,500,000 7,500,000 8,632,997 1,132,997 Fuel 80,000 80,000 63,202 (16,798) Hotel-Motel 13,000,000 13,000,000 13,942,409 942,409 Parking 4,965,000 4,965,000 5,236,625 271,625 Trailer Park Rental Pmts 930,000 930,000 942,416 12,416
32,460,000 32,460,000 34,604,174 2,144,174
72

Anne Arundel County, Maryland
Detail Schedule of Revenue - Estimated and Actual (Non-GAAP Basis)
General Fund
Year Ended June 30, 2007
Original Final VarianceBudget Budget Actual Over (Under)
LICENSES AND PERMITS Amusements 281,500 281,500 213,562 (67,938) Special events 4,500 4,500 8,450 3,950 Beer, wine, liquor 711,500 711,500 761,157 49,657 Trade licenses 285,600 285,600 285,667 67 Traders 760,000 760,000 845,508 85,508 Permits 10,114,200 10,114,200 11,329,751 1,215,551 Fines 55,000 55,000 154,816 99,816 Mobile home parks 34,800 34,800 34,223 (577) Taxicabs 102,400 102,400 106,494 4,094 Animal control 363,400 363,400 343,523 (19,877) Other 1,566,100 1,566,100 1,608,848 42,748 Health Department 1,257,000 1,257,000 872,522 (384,478) Public space 716,000 716,000 1,117,306 401,306
16,252,000 16,252,000 17,681,827 1,429,827
INVESTMENT INCOME 6,800,000 6,800,000 10,109,420 3,309,420
INTER-FUND RECOVERIES 27,067,000 27,067,000 37,853,669 10,786,669
OTHER REVENUES Sale of surplus property 50,000 50,000 1,984,034 1,934,034 Health department fees 680,100 680,100 792,189 112,089 Certification of liens 85,000 85,000 82,400 (2,600) Recreation and Parks 10,658,400 10,658,400 9,566,482 (1,091,918) Developers fees - Street lighting 50,000 50,000 87,921 37,921 Sheriff 105,000 105,000 111,699 6,699 Sub-division 1,900,000 1,900,000 1,704,042 (195,958) Administrative fees 120,000 120,000 118,591 (1,409) Rental income 497,300 497,300 836,300 339,000 Cable Fees 6,089,000 6,089,000 7,502,174 1,413,174 Reimbursements 9,539,800 9,539,800 9,515,041 (24,759) Fines and Fees 350,000 350,000 360,967 10,967 Miscellaneous 5,241,800 5,241,800 8,145,793 2,903,993
35,366,400 35,366,400 40,807,633 5,441,233 Total revenues $ 1,104,979,000 $ 1,106,026,200 $ 1,152,905,064 $ 46,878,864
73
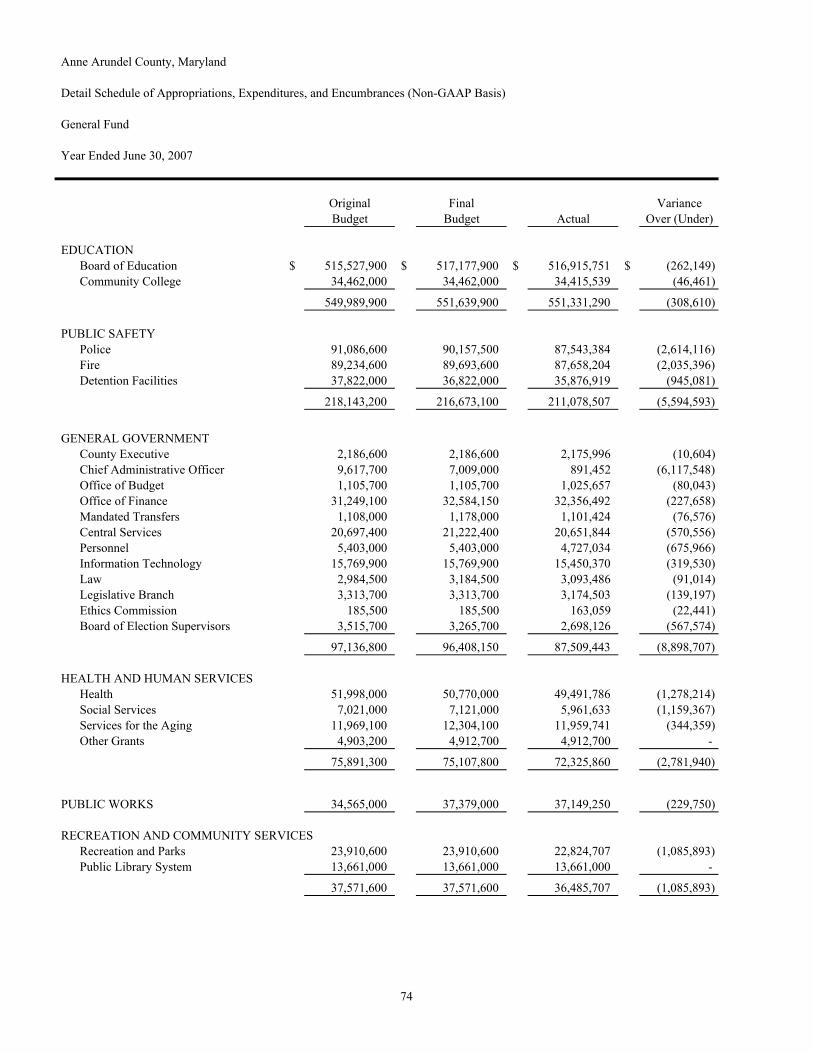
Anne Arundel County, Maryland
Detail Schedule of Appropriations, Expenditures, and Encumbrances (Non-GAAP Basis)
General Fund
Year Ended June 30, 2007
Original Final VarianceBudget Budget Actual Over (Under)
EDUCATION Board of Education $ 515,527,900 $ 517,177,900 $ 516,915,751 $ (262,149) Community College 34,462,000 34,462,000 34,415,539 (46,461)
549,989,900 551,639,900 551,331,290 (308,610)
PUBLIC SAFETY Police 91,086,600 90,157,500 87,543,384 (2,614,116) Fire 89,234,600 89,693,600 87,658,204 (2,035,396) Detention Facilities 37,822,000 36,822,000 35,876,919 (945,081)
218,143,200 216,673,100 211,078,507 (5,594,593)
GENERAL GOVERNMENT County Executive 2,186,600 2,186,600 2,175,996 (10,604) Chief Administrative Officer 9,617,700 7,009,000 891,452 (6,117,548) Office of Budget 1,105,700 1,105,700 1,025,657 (80,043) Office of Finance 31,249,100 32,584,150 32,356,492 (227,658) Mandated Transfers 1,108,000 1,178,000 1,101,424 (76,576) Central Services 20,697,400 21,222,400 20,651,844 (570,556) Personnel 5,403,000 5,403,000 4,727,034 (675,966) Information Technology 15,769,900 15,769,900 15,450,370 (319,530) Law 2,984,500 3,184,500 3,093,486 (91,014) Legislative Branch 3,313,700 3,313,700 3,174,503 (139,197) Ethics Commission 185,500 185,500 163,059 (22,441) Board of Election Supervisors 3,515,700 3,265,700 2,698,126 (567,574)
97,136,800 96,408,150 87,509,443 (8,898,707)
HEALTH AND HUMAN SERVICES Health 51,998,000 50,770,000 49,491,786 (1,278,214) Social Services 7,021,000 7,121,000 5,961,633 (1,159,367) Services for the Aging 11,969,100 12,304,100 11,959,741 (344,359) Other Grants 4,903,200 4,912,700 4,912,700 -
75,891,300 75,107,800 72,325,860 (2,781,940)
PUBLIC WORKS 34,565,000 37,379,000 37,149,250 (229,750)
RECREATION AND COMMUNITY SERVICES Recreation and Parks 23,910,600 23,910,600 22,824,707 (1,085,893) Public Library System 13,661,000 13,661,000 13,661,000 -
37,571,600 37,571,600 36,485,707 (1,085,893)
74

Anne Arundel County, Maryland
Detail Schedule of Appropriations, Expenditures, and Encumbrances (Non-GAAP Basis)
General Fund
Year Ended June 30, 2007
Original Final VarianceBudget Budget Actual Over (Under)
JUDICIAL States Attorney 8,086,700 8,163,900 8,065,285 (98,615) Sheriffs Office 6,973,200 6,975,800 6,650,870 (324,930) Circuit Court 5,771,400 5,910,600 5,557,987 (352,613) Orphans Court 110,800 110,800 108,803 (1,997)
Total Judicial 20,942,100 21,161,100 20,382,945 (778,155)
LAND USE AND DEVELOPMENT Planning and Zoning 8,668,000 9,550,200 7,783,282 (1,766,918) Office of Administrative Hearings 291,100 291,100 278,239 (12,861) Cooperative Extension Service 243,600 243,600 160,416 (83,184) Land Use and Environment 2,145,600 704,200 311,699 (392,501)
11,348,300 10,789,100 8,533,636 (2,255,464)
CODE ENFORCEMENT Inspections and Permits 11,523,000 11,938,800 11,099,944 (838,856) Board of License Commissioners 524,400 524,400 507,949 (16,451)
12,047,400 12,463,200 11,607,893 (855,307)
ECONOMIC DEVELOPMENT 1,841,000 1,841,000 1,841,000 -
DEBT SERVICE 41,028,000 40,640,500 40,110,803 (529,697)
PAY GO FUNDING - CAPITAL PROJECTS 64,056,500 64,056,450 64,056,450 -
Total expenditures and encumbrances $ 1,164,561,100 $ 1,165,730,900 $ 1,142,412,784 $ (23,318,116)
75
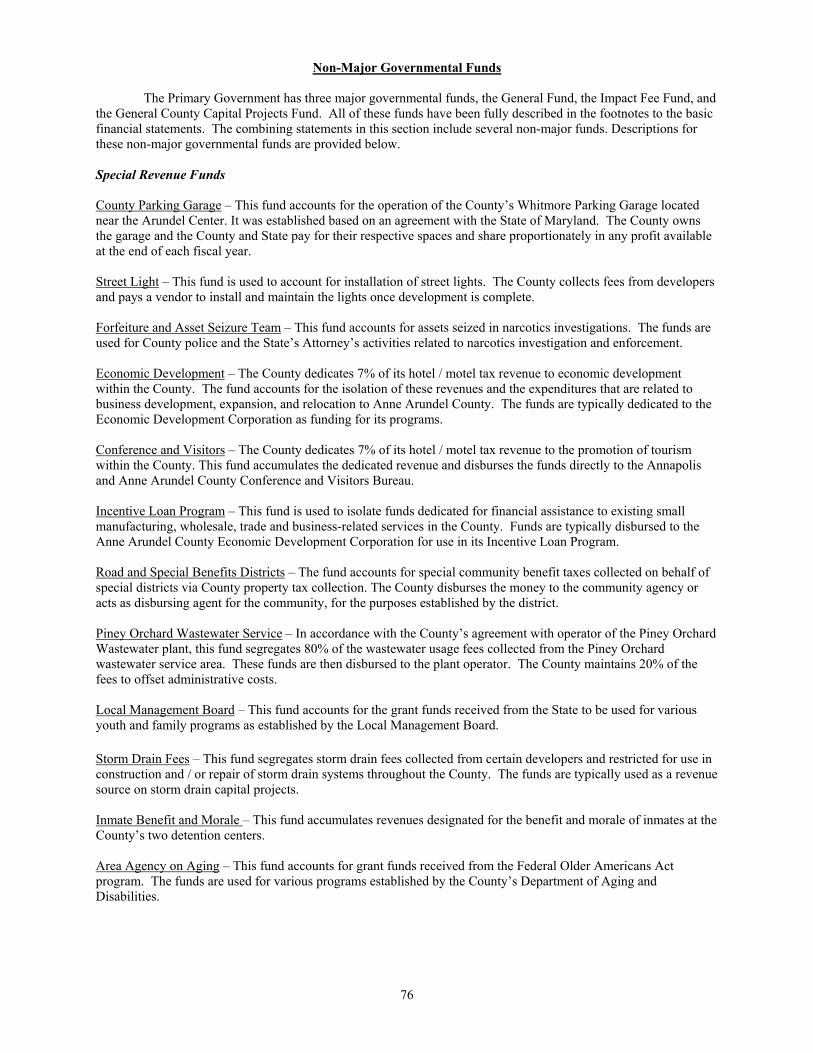
76
Non-Major Governmental Funds The Primary Government has three major governmental funds, the General Fund, the Impact Fee Fund, and the General County Capital Projects Fund. All of these funds have been fully described in the footnotes to the basic financial statements. The combining statements in this section include several non-major funds. Descriptions for these non-major governmental funds are provided below. Special Revenue Funds County Parking Garage – This fund accounts for the operation of the County’s Whitmore Parking Garage located near the Arundel Center. It was established based on an agreement with the State of Maryland. The County owns the garage and the County and State pay for their respective spaces and share proportionately in any profit available at the end of each fiscal year. Street Light – This fund is used to account for installation of street lights. The County collects fees from developers and pays a vendor to install and maintain the lights once development is complete. Forfeiture and Asset Seizure Team – This fund accounts for assets seized in narcotics investigations. The funds are used for County police and the State’s Attorney’s activities related to narcotics investigation and enforcement. Economic Development – The County dedicates 7% of its hotel / motel tax revenue to economic development within the County. The fund accounts for the isolation of these revenues and the expenditures that are related to business development, expansion, and relocation to Anne Arundel County. The funds are typically dedicated to the Economic Development Corporation as funding for its programs. Conference and Visitors – The County dedicates 7% of its hotel / motel tax revenue to the promotion of tourism within the County. This fund accumulates the dedicated revenue and disburses the funds directly to the Annapolis and Anne Arundel County Conference and Visitors Bureau. Incentive Loan Program – This fund is used to isolate funds dedicated for financial assistance to existing small manufacturing, wholesale, trade and business-related services in the County. Funds are typically disbursed to the Anne Arundel County Economic Development Corporation for use in its Incentive Loan Program. Road and Special Benefits Districts – The fund accounts for special community benefit taxes collected on behalf of special districts via County property tax collection. The County disburses the money to the community agency or acts as disbursing agent for the community, for the purposes established by the district. Piney Orchard Wastewater Service – In accordance with the County’s agreement with operator of the Piney Orchard Wastewater plant, this fund segregates 80% of the wastewater usage fees collected from the Piney Orchard wastewater service area. These funds are then disbursed to the plant operator. The County maintains 20% of the fees to offset administrative costs. Local Management Board – This fund accounts for the grant funds received from the State to be used for various youth and family programs as established by the Local Management Board. Storm Drain Fees – This fund segregates storm drain fees collected from certain developers and restricted for use in construction and / or repair of storm drain systems throughout the County. The funds are typically used as a revenue source on storm drain capital projects. Inmate Benefit and Morale – This fund accumulates revenues designated for the benefit and morale of inmates at the County’s two detention centers. Area Agency on Aging – This fund accounts for grant funds received from the Federal Older Americans Act program. The funds are used for various programs established by the County’s Department of Aging and Disabilities.
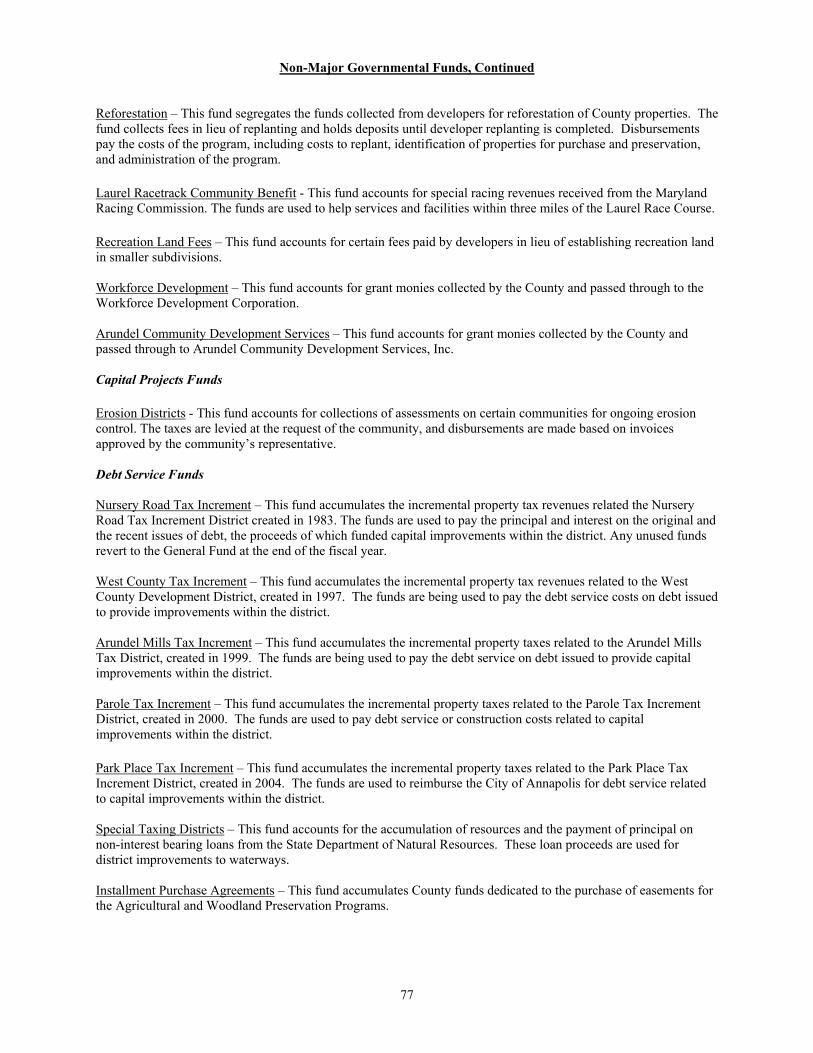
77
Non-Major Governmental Funds, Continued
Reforestation – This fund segregates the funds collected from developers for reforestation of County properties. The fund collects fees in lieu of replanting and holds deposits until developer replanting is completed. Disbursements pay the costs of the program, including costs to replant, identification of properties for purchase and preservation, and administration of the program. Laurel Racetrack Community Benefit - This fund accounts for special racing revenues received from the Maryland Racing Commission. The funds are used to help services and facilities within three miles of the Laurel Race Course. Recreation Land Fees – This fund accounts for certain fees paid by developers in lieu of establishing recreation land in smaller subdivisions. Workforce Development – This fund accounts for grant monies collected by the County and passed through to the Workforce Development Corporation. Arundel Community Development Services – This fund accounts for grant monies collected by the County and passed through to Arundel Community Development Services, Inc. Capital Projects Funds Erosion Districts - This fund accounts for collections of assessments on certain communities for ongoing erosion control. The taxes are levied at the request of the community, and disbursements are made based on invoices approved by the community’s representative. Debt Service Funds Nursery Road Tax Increment – This fund accumulates the incremental property tax revenues related the Nursery Road Tax Increment District created in 1983. The funds are used to pay the principal and interest on the original and the recent issues of debt, the proceeds of which funded capital improvements within the district. Any unused funds revert to the General Fund at the end of the fiscal year. West County Tax Increment – This fund accumulates the incremental property tax revenues related to the West County Development District, created in 1997. The funds are being used to pay the debt service costs on debt issued to provide improvements within the district. Arundel Mills Tax Increment – This fund accumulates the incremental property taxes related to the Arundel Mills Tax District, created in 1999. The funds are being used to pay the debt service on debt issued to provide capital improvements within the district. Parole Tax Increment – This fund accumulates the incremental property taxes related to the Parole Tax Increment District, created in 2000. The funds are used to pay debt service or construction costs related to capital improvements within the district. Park Place Tax Increment – This fund accumulates the incremental property taxes related to the Park Place Tax Increment District, created in 2004. The funds are used to reimburse the City of Annapolis for debt service related to capital improvements within the district. Special Taxing Districts – This fund accounts for the accumulation of resources and the payment of principal on non-interest bearing loans from the State Department of Natural Resources. These loan proceeds are used for district improvements to waterways. Installment Purchase Agreements – This fund accumulates County funds dedicated to the purchase of easements for the Agricultural and Woodland Preservation Programs.

Anne Arundel County, Maryland
Combining Balance Sheet
Nonmajor Governmental Funds
June 30, 2007
County ForfeitureParking Street and Asset Economic Conference Incentive LoanGarage Light Seizure Team Development and Visitors Program
ASSETSCash and investments $ - $ 2,340,300 $ 972,612 $ 203,138 $ 203,138 $ 287 Receivables Due from other governmental agencies - - - - - - Other, net 24,299 - 95,500 - - -
Total assets $ 24,299 $ 2,340,300 $ 1,068,112 $ 203,138 $ 203,138 $ 287
LIABILITIESAccrued liabilities $ 13,182 $ 62,395 $ 11,931 $ - $ 176,563 $ - Due to General Fund 7,302 - - - - - Due to Component Unit - - - 176,563 - - Escrow deposits - - 424,142 - - - Deferred revenue - - - - - -
Total liabilities 20,484 62,395 436,073 176,563 176,563 -
FUND BALANCESReserved Encumbrances 969 531,308 23,870 - - - Held by trustee - - - - - - Unreserved Designated for next year's expenditures - - 100,000 - - - Undesignated 2,846 1,746,597 508,169 26,575 26,575 287
Total fund balances 3,815 2,277,905 632,039 26,575 26,575 287
Total liabilities and fund balances $ 24,299 $ 2,340,300 $ 1,068,112 $ 203,138 $ 203,138 $ 287
Special Revenue Funds
78

Road and Piney Orchard LocalSpecial Benefits Wastewater Management Storm Drain Inmate Benefit Area Agency
Districts Service Board Fees and Morale on Aging Reforestation
$ 473,742 $ 146,960 $ 1,189,897 $ 1,786,687 $ 992,258 $ 38,952 $ 11,479,676
- - 179,318 - - - - 11,175 - - - 46,000 - -
$ 484,917 146,960 $ 1,369,215 $ 1,786,687 $ 1,038,258 $ 38,952 $ 11,479,676
$ 9,375 $ 146,960 $ 550,762 $ - $ 88,731 $ - $ 359,461 - - - - - - - - - - - - - - - - - - 49,628 - 3,239,225 - - 175,598 - - - -
9,375 146,960 726,360 - 138,359 - 3,598,686
- - 34,625 - 10,408 - 5,298 - - - - - - -
242,070 - 250,000 1,706,365 130,000 - 1,824,000 233,472 - 358,230 80,322 759,491 38,952 6,051,692
475,542 - 642,855 1,786,687 899,899 38,952 7,880,990
$ 484,917 $ 146,960 $ 1,369,215 $ 1,786,687 $ 1,038,258 $ 38,952 $ 11,479,676
Special Revenue Funds
79

Anne Arundel County, Maryland
Combining Balance Sheet
Nonmajor Governmental Funds
June 30, 2007
Capital Debt ServiceProjects Fund Funds
Laurel ArundelRacetrack Community
Community Recreational Workforce Development Erosion Nursery RoadBenefit Land Fees Development Services Districts Tax Increment
ASSETSCash and investments $ 1,114,051 $ 307,127 $ 7,802 $ - $ 695,134 $ 27,015 Receivables Due from other governmental agencies - - - 749,903 - - Other, net 218,000 - - - 1,147 -
Total assets $ 1,332,051 $ 307,127 $ 7,802 $ 749,903 $ 696,281 $ 27,015
LIABILITIESAccrued liabilities $ - $ - $ 7,802 $ 576,163 $ 6,750 $ - Due to General Fund - - - 173,740 - - Due to Component Unit - - - - - - Escrow deposits - - - - - - Deferred revenue - - - - - -
Total liabilities - - 7,802 749,903 6,750 -
FUND BALANCESReserved Encumbrances - - - 4,608,716 - - Held by trustee - - - - - - Unreserved Designated for next year's expenditures 5,000 - - - 533,300 - Undesignated 1,327,051 307,127 - (4,608,716) 156,231 27,015
Total fund balances 1,332,051 307,127 - - 689,531 27,015
Total liabilities and fund balances $ 1,332,051 $ 307,127 $ 7,802 $ 749,903 $ 696,281 $ 27,015
Special Revenue Funds
80

InstallmentWest County Arundel Mills Parole Park Place Special Taxing Purchase
Tax Increment Tax Increment Tax Increment Tax Increment Districts Agreements Totals
$ 879 $ 97,856 $ 195,910 $ 101,252 $ 679,676 $ 6,158,325 $ 29,212,674
- - - - - - 929,221 - - - - 850 - 396,971
$ 879 $ 97,856 $ 195,910 $ 101,252 $ 680,526 $ 6,158,325 $ 30,538,866
$ 195 $ 195 $ - $ - $ - $ - $ 2,010,465 - - - - - - 181,042 - - - - - - 176,563 - - - - - - 3,712,995 - - - - - - 175,598
195 195 - - - - 6,256,663
- - - - - 20,000 5,235,194 879 - - - - - 879
- - - - 503,086 1,600,000 6,893,821 (195) 97,661 195,910 101,252 177,440 4,538,325 12,152,309
684 97,661 195,910 101,252 680,526 6,158,325 24,282,203
$ 879 $ 97,856 $ 195,910 $ 101,252 $ 680,526 $ 6,158,325 $ 30,538,866
Debt Service Funds
81
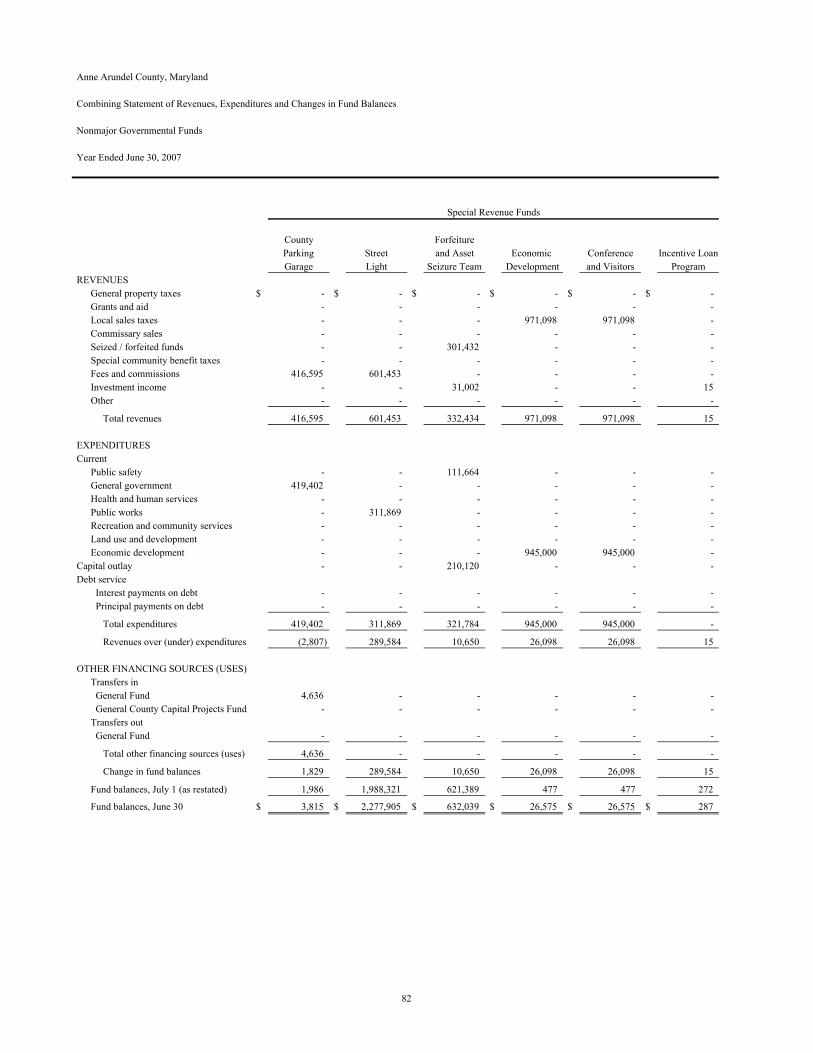
Anne Arundel County, Maryland
Combining Statement of Revenues, Expenditures and Changes in Fund Balances
Nonmajor Governmental Funds
Year Ended June 30, 2007
County ForfeitureParking Street and Asset Economic Conference Incentive LoanGarage Light Seizure Team Development and Visitors Program
REVENUESGeneral property taxes $ - $ - $ - $ - $ - $ - Grants and aid - - - - - - Local sales taxes - - - 971,098 971,098 - Commissary sales - - - - - - Seized / forfeited funds - - 301,432 - - - Special community benefit taxes - - - - - - Fees and commissions 416,595 601,453 - - - - Investment income - - 31,002 - - 15 Other - - - - - -
Total revenues 416,595 601,453 332,434 971,098 971,098 15
EXPENDITURESCurrent
Public safety - - 111,664 - - - General government 419,402 - - - - - Health and human services - - - - - - Public works - 311,869 - - - - Recreation and community services - - - - - - Land use and development - - - - - - Economic development - - - 945,000 945,000 -
Capital outlay - - 210,120 - - - Debt service
Interest payments on debt - - - - - - Principal payments on debt - - - - - -
Total expenditures 419,402 311,869 321,784 945,000 945,000 -
Revenues over (under) expenditures (2,807) 289,584 10,650 26,098 26,098 15
OTHER FINANCING SOURCES (USES)Transfers in General Fund 4,636 - - - - - General County Capital Projects Fund - - - - - - Transfers out General Fund - - - - - -
Total other financing sources (uses) 4,636 - - - - -
Change in fund balances 1,829 289,584 10,650 26,098 26,098 15
Fund balances, July 1 (as restated) 1,986 1,988,321 621,389 477 477 272
Fund balances, June 30 $ 3,815 $ 2,277,905 $ 632,039 $ 26,575 $ 26,575 $ 287
Special Revenue Funds
82

Special Revenue Funds
Road and Piney Orchard LocalSpecial Benefits Wastewater Management Storm Drain Inmate Benefit Area Agency
Districts Service Board Fees and Morale on Aging Reforestation
$ - $ - $ - $ - $ - $ - $ - - - 3,251,756 - - 1,282,665 - - - - - - - - - - - - 776,025 - - - - - - - -
4,712,405 - - - - - - - 641,288 - 615,719 419,635 - 2,387,569 - - 24,173 - 48,339 - - - - - - 5,586 - -
4,712,405 641,288 3,275,929 615,719 1,249,585 1,282,665 2,387,569
- - - - 1,067,550 - - - - - - - - - - - 3,293,292 - - - - - 641,288 - - - - -
4,715,401 - - - - - - - - - - - - 1,065,604 - - - - - - - - - - - - - -
- - - - - - - - - - - - - -
4,715,401 641,288 3,293,292 - 1,067,550 - 1,065,604
(2,996) - (17,363) 615,719 182,035 1,282,665 1,321,965
- - - - - - - - - - - - - -
- - - - - (1,316,000) -
- - - - - (1,316,000) -
(2,996) - (17,363) 615,719 182,035 (33,335) 1,321,965
478,538 - 660,218 1,170,968 717,864 72,287 6,559,025
$ 475,542 $ - $ 642,855 $ 1,786,687 $ 899,899 $ 38,952 $ 7,880,990
83
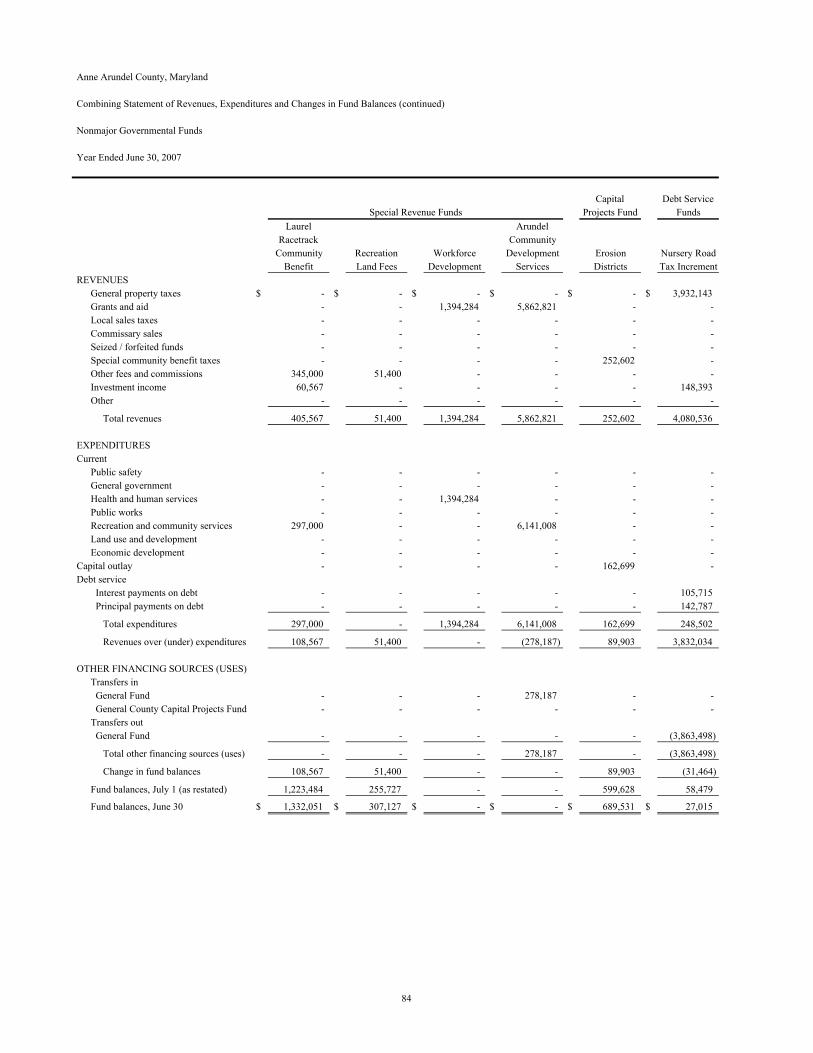
Anne Arundel County, Maryland
Combining Statement of Revenues, Expenditures and Changes in Fund Balances (continued)
Nonmajor Governmental Funds
Year Ended June 30, 2007
Capital Debt ServiceProjects Fund Funds
Laurel ArundelRacetrack Community
Community Recreation Workforce Development Erosion Nursery RoadBenefit Land Fees Development Services Districts Tax Increment
REVENUESGeneral property taxes $ - $ - $ - $ - $ - $ 3,932,143 Grants and aid - - 1,394,284 5,862,821 - - Local sales taxes - - - - - - Commissary sales - - - - - - Seized / forfeited funds - - - - - - Special community benefit taxes - - - - 252,602 - Other fees and commissions 345,000 51,400 - - - - Investment income 60,567 - - - - 148,393 Other - - - - - -
Total revenues 405,567 51,400 1,394,284 5,862,821 252,602 4,080,536
EXPENDITURESCurrent
Public safety - - - - - - General government - - - - - - Health and human services - - 1,394,284 - - - Public works - - - - - - Recreation and community services 297,000 - - 6,141,008 - - Land use and development - - - - - - Economic development - - - - - -
Capital outlay - - - - 162,699 - Debt service
Interest payments on debt - - - - - 105,715 Principal payments on debt - - - - - 142,787
Total expenditures 297,000 - 1,394,284 6,141,008 162,699 248,502
Revenues over (under) expenditures 108,567 51,400 - (278,187) 89,903 3,832,034
OTHER FINANCING SOURCES (USES)Transfers in General Fund - - - 278,187 - - General County Capital Projects Fund - - - - - - Transfers out General Fund - - - - - (3,863,498)
Total other financing sources (uses) - - - 278,187 - (3,863,498)
Change in fund balances 108,567 51,400 - - 89,903 (31,464)
Fund balances, July 1 (as restated) 1,223,484 255,727 - - 599,628 58,479
Fund balances, June 30 $ 1,332,051 $ 307,127 $ - $ - $ 689,531 $ 27,015
Special Revenue Funds
84
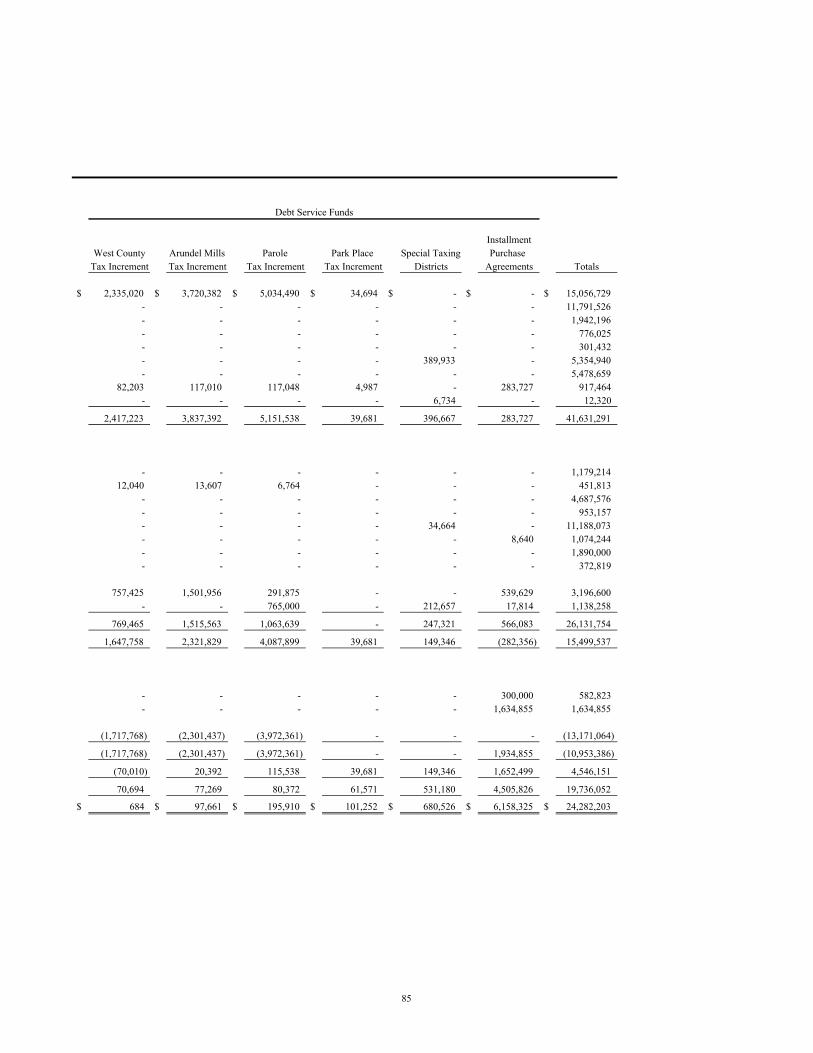
InstallmentWest County Arundel Mills Parole Park Place Special Taxing Purchase
Tax Increment Tax Increment Tax Increment Tax Increment Districts Agreements Totals
$ 2,335,020 $ 3,720,382 $ 5,034,490 $ 34,694 $ - $ - $ 15,056,729 - - - - - - 11,791,526 - - - - - - 1,942,196 - - - - - - 776,025 - - - - - - 301,432 - - - - 389,933 - 5,354,940 - - - - - - 5,478,659
82,203 117,010 117,048 4,987 - 283,727 917,464 - - - - 6,734 - 12,320
2,417,223 3,837,392 5,151,538 39,681 396,667 283,727 41,631,291
- - - - - - 1,179,214 12,040 13,607 6,764 - - - 451,813
- - - - - - 4,687,576 - - - - - - 953,157 - - - - 34,664 - 11,188,073 - - - - - 8,640 1,074,244 - - - - - - 1,890,000 - - - - - - 372,819
757,425 1,501,956 291,875 - - 539,629 3,196,600 - - 765,000 - 212,657 17,814 1,138,258
769,465 1,515,563 1,063,639 - 247,321 566,083 26,131,754
1,647,758 2,321,829 4,087,899 39,681 149,346 (282,356) 15,499,537
- - - - - 300,000 582,823 - - - - - 1,634,855 1,634,855
(1,717,768) (2,301,437) (3,972,361) - - - (13,171,064)
(1,717,768) (2,301,437) (3,972,361) - - 1,934,855 (10,953,386)
(70,010) 20,392 115,538 39,681 149,346 1,652,499 4,546,151
70,694 77,269 80,372 61,571 531,180 4,505,826 19,736,052
$ 684 $ 97,661 $ 195,910 $ 101,252 $ 680,526 $ 6,158,325 $ 24,282,203
Debt Service Funds
85

Anne Arundel County, Maryland
Schedules of Revenue, Expenditures, and Changes in Fund Balances - Budget and Actual (Non-GAAP Basis)
Special Revenue Funds
Year Ended June 30, 2007
Original Final VarianceBudget Budget Actual Over (Under)
COUNTY PARKING GARAGERevenues
Parking fees $ 378,000 $ 413,000 $ 411,829 $ (1,171)
Expenditures General government 378,000 413,000 408,983 (4,017)
Revenues over expenditures - - 2,846 $ 2,846
Fund balance, budgetary, July 1 - - - Fund balance, budgetary, June 30 $ - $ - $ 2,846
STREET LIGHTRevenues
Developer fees $ 1,000,000 $ 1,000,000 $ 601,453 $ (398,547) Other - - 27,607 27,607
1,000,000 1,000,000 629,060 (370,940)
ExpendituresPublic Works 1,000,000 1,000,000 63,692 (936,308)
Revenues over expenditures - - 565,368 $ 565,368
Fund balance, budgetary, July 1 1,181,229 1,181,229 1,181,229 Fund balance, budgetary, June 30 $ 1,181,229 $ 1,181,229 $ 1,746,597
FORFEITURE AND ASSET SEIZURE TEAMRevenues
Seized and forfeited funds $ 510,700 $ 510,700 $ 301,432 $ (209,268) Investment income 31,002 31,002
510,700 510,700 332,434 (178,266) Expenditures
Public Safety 130,000 130,000 111,664 (18,336) Capital Outlay 380,700 380,700 233,990 (146,710)
510,700 510,700 345,654 (165,046) Revenues over (under) expenditures - - (13,220) $ (13,220)
Fund balance, budgetary, July 1 621,389 621,389 621,389 Fund balance, budgetary, June 30 $ 621,389 $ 621,389 $ 608,169
Budgeted revenues exclude fund balance appropriated to fund expenditures in the current fiscal year.
86
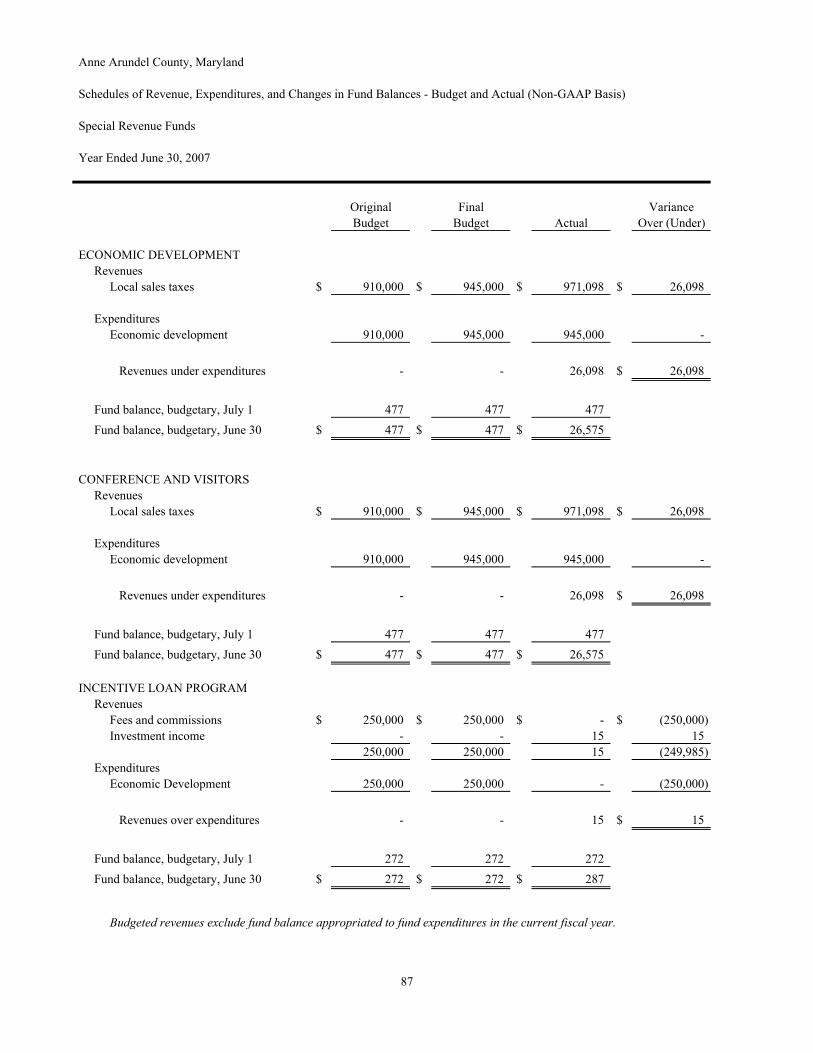
Anne Arundel County, Maryland
Schedules of Revenue, Expenditures, and Changes in Fund Balances - Budget and Actual (Non-GAAP Basis)
Special Revenue Funds
Year Ended June 30, 2007
Original Final VarianceBudget Budget Actual Over (Under)
ECONOMIC DEVELOPMENTRevenues
Local sales taxes $ 910,000 $ 945,000 $ 971,098 $ 26,098
ExpendituresEconomic development 910,000 945,000 945,000 -
Revenues under expenditures - - 26,098 $ 26,098
Fund balance, budgetary, July 1 477 477 477 Fund balance, budgetary, June 30 $ 477 $ 477 $ 26,575
CONFERENCE AND VISITORSRevenues
Local sales taxes $ 910,000 $ 945,000 $ 971,098 $ 26,098
ExpendituresEconomic development 910,000 945,000 945,000 -
Revenues under expenditures - - 26,098 $ 26,098
Fund balance, budgetary, July 1 477 477 477 Fund balance, budgetary, June 30 $ 477 $ 477 $ 26,575
INCENTIVE LOAN PROGRAMRevenues
Fees and commissions $ 250,000 $ 250,000 $ - $ (250,000) Investment income - - 15 15
250,000 250,000 15 (249,985) Expenditures
Economic Development 250,000 250,000 - (250,000)
Revenues over expenditures - - 15 $ 15
Fund balance, budgetary, July 1 272 272 272 Fund balance, budgetary, June 30 $ 272 $ 272 $ 287
Budgeted revenues exclude fund balance appropriated to fund expenditures in the current fiscal year.
87

Anne Arundel County, Maryland
Schedules of Revenue, Expenditures, and Changes in Fund Balances - Budget and Actual (Non-GAAP Basis)
Special Revenue Funds
Year Ended June 30, 2007
Original Final VarianceBudget Budget Actual Over (Under)
ROADS AND SPECIAL BENEFITSRevenues
Special community benefit taxes $ 4,558,065 $ 4,558,065 $ 4,712,405 $ 154,340
ExpendituresRecreation and community services 6,991,642 6,991,642 4,715,401 (2,276,241)
Revenues over (under) expenditures (2,433,577) (2,433,577) (2,996) $ 2,430,581
Fund balance, budgetary, July 1 478,538 478,538 478,538 Fund balance, budgetary, June 30 $ (1,955,039) $ (1,955,039) $ 475,542
PINEY ORCHARD WASTEWATER SERVICERevenues
Commissions and fees $ 715,000 $ 715,000 $ 641,288 $ (73,712)
ExpendituresPublic works 715,000 715,000 641,288 (73,712)
Revenues over expenditures - - - $ -
Fund balance, budgetary, July 1 - - - Fund balance, budgetary, June 30 $ - $ - $ -
LOCAL MANAGEMENT BOARDRevenues
Grants and aid $ 2,926,200 $ 3,578,400 $ 3,251,756 $ (326,644) Investment income - - 24,173 24,173 Other - - - -
2,926,200 3,578,400 3,275,929 (302,471) Expenditures
Health and human services 3,176,200 3,828,400 3,327,917 (500,483)
Revenues under expenditures (250,000) (250,000) (51,988) $ 198,012
Fund balance, budgetary, July 1 660,218 660,218 660,218 Fund balance, budgetary, June 30 $ 410,218 $ 410,218 $ 608,230
Budgeted revenues exclude fund balance appropriated to fund expenditures in the current fiscal year.
88

Anne Arundel County, Maryland
Schedules of Revenue, Expenditures, and Changes in Fund Balances - Budget and Actual (Non-GAAP Basis)
Special Revenue Funds
Year Ended June 30, 2007
Original Final VarianceBudget Budget Actual Over (Under)
INMATE BENEFIT AND MORALERevenues
Commissary sales $ 754,000 $ 754,000 $ 776,025 $ 22,025 Commissions and fees 308,000 308,000 419,635 111,635 Investment income 18,000 18,000 48,339 30,339 Other - - 17,993 17,993
1,080,000 1,080,000 1,261,992 181,992 Expenditures
Commissary purchases 730,000 830,000 767,548 (62,452) Inmate benefits/morale 350,000 350,000 297,627 (52,373)
1,080,000 1,180,000 1,065,175 (114,825)
Revenues over (under) expenditures - (100,000) 196,817 $ 296,817
Fund balance, budgetary, July 1 692,674 692,674 692,674 Fund balance, budgetary, June 30 $ 692,674 $ 592,674 $ 889,491
REFORESTATIONRevenues
Commissions and fees $ 1,500,000 $ 1,500,000 $ 2,387,605 $ 887,605
ExpendituresLand use and development 1,594,600 1,594,600 894,702 (699,898)
Revenues over expenditures (94,600) (94,600) 1,492,903 $ 1,587,503
Fund balance, budgetary, July 1 6,382,789 6,382,789 6,382,789 Fund balance, budgetary, June 30 $ 6,288,189 $ 6,288,189 $ 7,875,692
LAUREL RACETRACK COMMUNITY BENEFITRevenues
Fees and commissions $ 400,000 $ 400,000 $ 345,000 $ (55,000) Other - - 60,567 60,567
400,000 400,000 405,567 5,567 Expenditures
Recreation and community services 322,000 322,000 297,000 (25,000)
Revenues over expenditures 78,000 78,000 108,567 $ 30,567
Fund balance, budgetary, July 1 1,223,484 1,223,484 1,223,484 Fund balance, budgetary, June 30 $ 1,301,484 $ 1,301,484 $ 1,332,051
Budgeted revenues exclude fund balance appropriated to fund expenditures in the current fiscal year.
89

Anne Arundel County, Maryland
Schedules of Revenue, Expenditures, and Changes in Fund Balances - Budget and Actual (Non-GAAP Basis)
Special Revenue Funds
Year Ended June 30, 2007
Original Final VarianceBudget Budget Actual Over (Under)
WORKFORCE DEVELOPMENTRevenues
Grants and aid $ 1,800,000 $ 1,800,000 $ 1,394,284 $ (405,716)
ExpendituresHealth and human services 1,800,000 1,800,000 1,394,284 (405,716)
Revenues over expenditures - - - $ -
Fund balance, budgetary, July 1 - - - Fund balance, budgetary, June 30 $ - $ - $ -
ARUNDEL COMMUNITY DEVELOPMENT SERVICESRevenues
Grants and aid $ 6,324,400 $ 6,327,200 $ 6,326,993 $ (207)
ExpendituresHealth and human services 6,324,400 6,327,200 6,326,993 (207)
Revenues over expenditures - - - $ -
Fund balance, budgetary, July 1 - - - Fund balance, budgetary, June 30 $ - $ - $ -
Budgeted revenues exclude fund balance appropriated to fund expenditures in the current fiscal year.
90

91
(This page left blank intentionally)

Anne Arundel County, Maryland
Schedule of Revenues and Expenditures - Budget and Actual (Non-GAAP Basis)
Roads and Special Benefit Districts
Year Ended June 30, 2007
Original Final VarianceBudget Budget Actual Over (Under)
REVENUESAmberly $ 32,182 $ 32,182 $ 37,602 $ 5,420 Annapolis Roads - Roads 257,423 257,423 274,728 17,305 Arundel on the Bay-Special Benefits 96,700 96,700 106,414 9,714 Avalon Shores - Special Benefits 22,742 22,742 22,862 120 Bay Highlands - Roads 46,200 46,200 51,121 4,921 Bay Ridge - Special Officer 220,410 220,410 221,349 939 Beverly Beach - Special Benefits 27,225 27,225 27,450 225 Birchwood - Special Benefits 2,486 2,486 2,487 1 Bittersweet 7,700 7,700 7,700 - Cape Anne - Special Benefits 7,600 7,600 7,600 - Cape St. Claire-Special Benefits 138,840 138,840 135,899 (2,941) Carrolton Manor 79,050 79,050 79,050 - Cedarhurst-Special Benefits 91,580 91,580 100,883 9,303 Chartwell-Special Benefits 33,450 33,450 33,449 (1) Columbia Beach - Roads 24,332 24,332 29,761 5,429 Crofton - Special Benefits 738,209 738,209 769,720 31,511 Eden Woods - Special Benefits 14,880 14,880 14,880 - Epping Forest - Special Benefits 189,600 189,600 200,709 11,109 Fairhaven Cliffs - Special Benefits 3,500 3,500 3,500 - Felicity Cove - Special Benefits 39,579 39,579 39,579 - Franklin Manor - Special Benefits 37,600 37,600 40,692 3,092 Gibson Island - Roads 195,800 195,800 209,620 13,820 Greenbriar Gardens 9,075 9,075 9,075 - Greenbriar II 21,000 21,000 21,000 - Heritage Pool 38,380 38,380 38,759 379 Hillsmere Estates - Roads 151,417 151,417 153,834 2,417 Holland Point - Special Officer 14,384 14,384 17,651 3,267 Hunters Harbor - Roads 15,450 15,450 15,450 - Indian Hills (Winchester)-Special Benefits 90,160 90,160 89,760 (400) Landhaven - Special Benefits 2,771 2,771 2,770 (1) Little Magothy River 35,350 35,350 35,349 (1) Long Point on the Severn - Roads 13,250 13,250 13,250 - Magothy Beach 3,900 3,900 3,900 - Manhattan Beach - Roads 14,825 14,825 14,800 (25) Owings Beach - Roads 23,940 23,940 28,202 4,262 Oyster Harbor - Roads 229,440 229,440 256,436 26,996 Parke West-Special Benefits 31,800 31,800 31,800 - Pine Grove Village Special Benefits 11,040 11,040 11,039 (1) Provinces - Special Benefits 10,596 10,596 10,595 (1) Queen's Park - Special Benefits 33,675 33,675 33,675 - Rockview Beach / Riviera Isles 4,692 4,692 4,692 - Selby on the Bay - Roads 74,610 74,610 72,330 (2,280) Severndale - Special Benefits 4,238 4,238 4,238 - Sherwood Forest - Special Benefits 916,267 916,267 916,267 - Shoreham Beach - Roads 19,764 19,764 19,906 142 Southgate - Special Benefits - - - - South River Heights - Roads 8,502 8,502 8,501 (1) South River Manor-Special Benefits 4,650 4,650 4,500 (150) South River Park - Roads 33,300 33,300 33,299 (1) Steedman Point - Roads 3,750 3,750 3,751 1 Stone Haven 2,835 2,835 2,834 (1) Sylvan View on the Magothy 12,696 12,696 12,697 1 Tanglewood Lane - Roads 7,150 7,150 7,150 - Upper Magothy Beach 14,900 14,900 14,850 (50) Venice Beach - Roads 26,780 26,780 32,532 5,752 Venice on the Bay 6,060 6,060 6,060 - Warthen Knolls 18,730 18,730 18,730 - Wilenor 22,800 22,800 22,800 - Woodland Beach - Roads 312,500 312,500 316,568 4,068 Woodland Beach/Pasadena 6,300 6,300 6,300 -
Total revenues $ 4,558,065 $ 4,558,065 $ 4,712,405 $ 154,340
Budgeted revenues exclude fund balance appropriated to fund expenditures in the current fiscal year.
92

Anne Arundel County, Maryland
Schedule of Revenues and Expenditures - Budget and Actual (Non-GAAP Basis)
Roads and Special Benefit Districts
Year Ended June 30, 2007
Original Final VarianceBudget Budget Actual Over (Under)
EXPENDITURESAmberly $ 32,182 $ 32,182 $ 32,175 $ (7) Annapolis Roads - Roads 329,597 329,597 269,815 (59,782) Arundel on the Bay-Special Benefits 132,170 132,170 102,193 (29,977) Avalon Shores - Special Benefits 26,242 26,242 22,715 (3,527) Bay Highlands - Roads 97,700 97,700 46,990 (50,710) Bay Ridge - Special Officer 272,954 272,954 220,497 (52,457) Beverly Beach - Special Benefits 30,280 30,280 27,284 (2,996) Birchwood - Special Benefits 4,224 4,224 124 (4,100) Bittersweet 13,440 13,440 7,697 (5,743) Cape Anne - Special Benefits 21,672 21,672 7,595 (14,077) Cape St. Claire-Special Benefits 257,536 257,536 135,950 (121,586) Carrolton Manor 79,050 79,050 79,045 (5) Cedarhurst-Special Benefits 126,080 126,080 126,075 (5) Chartwell-Special Benefits 102,775 102,775 33,442 (69,333) Columbia Beach - Roads 68,286 68,286 27,499 (40,787) Crofton - Special Benefits 1,107,719 1,107,719 758,900 (348,819) Eden Woods - Special Benefits 26,880 26,880 10,544 (16,336) Epping Forest - Special Benefits 392,550 392,550 204,890 (187,660) Fairhaven Cliffs - Special Benefits 3,748 3,748 475 (3,273) Felicity Cove - Special Benefits 39,579 39,579 39,569 (10) Franklin Manor - Special Benefits 50,600 50,600 41,990 (8,610) Gibson Island - Roads 240,266 240,266 210,190 (30,076) Greenbriar Gardens 11,063 11,063 9,174 (1,889) Greenbriar II 21,000 21,000 20,989 (11) Heritage Pool 38,380 38,380 38,366 (14) Hillsmere Estates - Roads 174,064 174,064 155,700 (18,364) Holland Point - Special Officer 14,384 14,384 13,880 (504) Hunters Harbor - Roads 15,450 15,450 11,180 (4,270) Indian Hills (Winchester)-Special Benefits 94,260 94,260 92,914 (1,346) Landhaven - Special Benefits 7,892 7,892 2,748 (5,144) Little Magothy River 69,333 69,333 35,342 (33,991) Long Point on the Severn - Roads 63,955 63,955 20,743 (43,212) Magothy Beach 4,390 4,390 3,895 (495) Manhattan Beach - Roads 14,825 14,825 14,820 (5) Owings Beach - Roads 33,999 33,999 24,904 (9,095) Oyster Harbor - Roads 1,063,046 1,063,046 289,563 (773,483) Parke West-Special Benefits 88,218 88,218 31,795 (56,423) Pine Grove Village Special Benefits 18,515 18,515 11,528 (6,987) Provinces - Special Benefits 22,187 22,187 10,881 (11,306) Queen's Park - Special Benefits 39,675 39,675 33,362 (6,313) Rockview Beach / Riviera Isles 5,942 5,942 4,662 (1,280) Selby on the Bay - Roads 130,766 130,766 71,800 (58,966) Severndale - Special Benefits 21,992 21,992 4,235 (17,757) Sherwood Forest - Special Benefits 916,267 916,267 916,249 (18) Shoreham Beach - Roads 19,847 19,847 19,760 (87) Southgate - Special Benefits 4,300 4,300 - (4,300) South River Heights - Roads 8,502 8,502 8,495 (7) South River Manor-Special Benefits 5,052 5,052 195 (4,857) South River Park - Roads 41,153 41,153 33,290 (7,863) Steedman Point - Roads 26,263 26,263 187 (26,076) Stone Haven 2,942 2,942 2,832 (110) Sylvan View on the Magothy 16,806 16,806 12,690 (4,116) Tanglewood Lane - Roads 11,350 11,350 358 (10,992) Upper Magothy Beach 14,900 14,900 14,820 (80) Venice Beach - Roads 68,987 68,987 27,567 (41,420) Venice on the Bay 12,457 12,457 6,053 (6,404) Warthen Knolls 18,730 18,730 18,720 (10) Wilenor 24,520 24,520 22,790 (1,730) Woodland Beach - Roads 371,500 371,500 315,975 (55,525) Woodland Beach/Pasadena 19,200 19,200 7,285 (11,915)
Total revenues $ 6,991,642 $ 6,991,642 $ 4,715,401 $ (2,276,241)
93

Anne Arundel County, Maryland
Schedule of Funding Sources Authorized and Realized (Non-GAAP Basis)
General County Capital Projects
Year Ended June 30, 2007
School Higher StormTotal Construction Education Drains Recreation
AUTHORIZED PER ORIGINAL BUDGETCounty bonds $ 611,962,857 $ 231,257,258 $ 24,225,000 $ 18,605,578 $ 63,115,564 Grants and aid 264,461,762 133,142,000 15,512,000 400,000 43,771,282 Contributions from other funds 308,101,092 174,165,460 6,763,497 5,256,902 14,552,198 Special fees 58,609,000 19,155,000 - - - Impact fees 98,302,150 52,928,000 - - - Other sources 12,600,001 592,900 - 2,054,190 75,455
Total $ 1,354,036,862 $ 611,240,618 $ 46,500,497 $ 26,316,670 $ 121,514,499
AUTHORIZED PER FINAL BUDGETCounty bonds $ 514,242,040 $ 200,603,258 $ 18,809,000 $ 16,889,216 $ 60,713,805 Grants and aid 193,872,401 98,132,431 11,687,000 400,000 40,771,282 Contributions from other funds 256,379,112 143,253,603 5,169,497 3,925,773 13,614,902 Special fees 31,920,000 9,068,000 - - - Impact fees 94,664,150 50,339,000 - - - Other sources 12,056,848 592,900 - 2,037,525 75,455
Total 1,103,134,551 501,989,192 35,665,497 23,252,514 115,175,444 Less: Completed projects 55,299,962 15,638,380 850,000 1,400,266 4,949,129
1,047,834,589 486,350,812 34,815,497 21,852,248 110,226,315
REALIZEDCurrent year Bonds and bond anticipation notes 94,325,999 33,000,000 2,500,000 4,000,000 6,500,000 Grants and aid 4,979,692 - 1,635,849 274,439 809,445 Contributions from the general fund 64,956,450 37,648,450 1,850,000 1,350,000 2,685,000 Special fees 2,752,009 2,197,864 - - - Impact fees 3,027,905 855,564 - - - Other sources 3,515,405 3,424,000 - 360 (1)
Total 173,557,460 77,125,878 5,985,849 5,624,799 9,994,444 Prior years 650,635,865 271,325,454 27,317,863 12,205,198 86,248,407
Total realized funding sources 824,193,325 348,451,332 33,303,712 17,829,997 96,242,851 Less: Completed projects and adjustments 51,987,630 15,511,033 797,036 1,398,171 1,649,129
772,205,695 332,940,299 32,506,676 16,431,826 94,593,722
Funding sources authorized - June 30, 2007 $ 275,628,894 $ 153,410,513 $ 2,308,821 $ 5,420,422 $ 15,632,593
Budgeted revenues exclude fund balance appropriated to fund expenditures in the current fiscal year.
94

Community Roads and Police Development Waterway
Libraries Bridges and Fire Block Grant Improvements Other
$ 14,172,331 $ 107,966,948 $ 57,642,097 $ - $ 20,451,140 $ 74,526,941 - 4,344,000 37,184,063 2,050,000 11,231,098 16,827,319
20,134,153 24,369,095 7,521,189 - 1,101,296 54,237,302 - 32,774,000 - - - 6,680,000 - 42,938,150 2,436,000 - - - - 6,670,505 - - 572,000 2,634,951
$ 34,306,484 $ 219,062,698 $ 104,783,349 $ 2,050,000 $ 33,355,534 $ 154,906,513
$ 10,156,131 $ 92,158,562 $ 28,015,900 $ - $ 18,581,851 $ 68,314,317 - 4,083,000 9,930,000 2,050,000 10,400,646 16,418,042
11,285,418 20,261,907 4,284,189 - 1,022,312 53,561,511 - 16,172,000 - - - 6,680,000 - 41,889,150 2,436,000 - - - - 6,350,505 - - 572,000 2,428,463
21,441,549 180,915,124 44,666,089 2,050,000 30,576,809 147,402,333 83,094 12,328,483 5,292,000 - 1,651,398 13,107,212
21,358,455 168,586,641 39,374,089 2,050,000 28,925,411 134,295,121
400,000 34,999,999 2,500,000 - 4,000,000 6,426,000 - 10,024 375,000 203,077 1,610,967 60,891
3,350,000 5,686,000 2,755,000 - 297,000 9,335,000 - - - - - 554,145 - 1,261,260 911,081 - - - - 360,036 (1,497) - - (267,493)
3,750,000 42,317,319 6,539,584 203,077 5,907,967 16,108,543 17,662,275 95,703,216 23,430,939 1,846,923 11,357,701 103,537,889
21,412,275 138,020,535 29,970,523 2,050,000 17,265,668 119,646,432 83,094 12,232,949 5,656,913 - 1,571,119 13,088,186
21,329,181 125,787,586 24,313,610 2,050,000 15,694,549 106,558,246
$ 29,274 $ 42,799,055 $ 15,060,479 $ - $ 13,230,862 $ 27,736,875
95

Anne Arundel County, Maryland
Schedule of Appropriations, Expenditures, and Encumbrances (Non-GAAP Basis)
General County Capital Projects
Year Ended June 30, 2007
School Higher StormAPPROPRIATIONS Total Construction Education Drains
Original Budget $ 1,355,036,362 $ 611,240,618 $ 46,500,497 $ 26,316,670
Final BudgetPrior years $ 900,959,499 $ 396,232,780 $ 33,129,497 $ 18,058,545 Current year 202,309,052 105,756,412 2,536,000 5,193,969
1,103,268,551 501,989,192 35,665,497 23,252,514 Less: Completed projects 55,299,962 15,638,380 850,000 1,400,266
Total appropriations 1,047,968,589 486,350,812 34,815,497 21,852,248
EXPENDITURES AND ENCUMBRANCESPrior years expenditures and transfers 584,128,120 238,849,963 23,668,375 11,578,311 Current year expenditures 65,124,414 - - 3,455,275 Operating transfers 84,196,363 77,582,161 6,614,202 -
733,448,897 316,432,124 30,282,577 15,033,586 Less: Completed projects 51,650,476 15,601,565 797,714 1,398,171
Total 681,798,421 300,830,559 29,484,863 13,635,415 Encumbrances outstanding 28,988,127 - - 1,323,478
Total expenditures and encumbrances 710,786,548 300,830,559 29,484,863 14,958,893 Unencumbered appropriations - June 30, 2007 $ 337,182,041 $ 185,520,253 $ 5,330,634 $ 6,893,355
96

CommunityRoads and Police Development Waterway
Recreation Libraries Bridges and Fire Block Grant Improvements Other
$ 121,514,499 $ 34,306,484 $ 219,062,698 $ 104,783,349 $ 2,050,000 $ 34,355,034 $ 154,906,513
$ 105,038,461 $ 18,091,559 $ 148,678,155 $ 27,153,089 $ 2,050,000 $ 22,530,766 $ 129,996,647 10,136,983 3,349,990 32,236,969 17,513,000 - 8,180,043 17,405,686
115,175,444 21,441,549 180,915,124 44,666,089 2,050,000 30,710,809 147,402,333 4,949,129 83,094 12,328,483 5,292,000 - 1,651,398 13,107,212
110,226,315 21,358,455 168,586,641 39,374,089 2,050,000 29,059,411 134,295,121
79,378,240 15,344,735 96,713,682 16,754,834 1,846,923 9,268,963 90,724,094 10,076,866 3,545,515 23,283,707 2,626,282 180,329 4,277,644 17,678,796
- - - - - - -
89,455,106 18,890,250 119,997,389 19,381,116 2,027,252 13,546,607 108,402,890 1,649,129 83,094 12,188,089 5,281,783 - 1,571,120 13,079,811
87,805,977 18,807,156 107,809,300 14,099,333 2,027,252 11,975,487 95,323,079 2,332,992 1,361,162 13,315,689 3,902,630 22,748 1,033,780 5,695,648
90,138,969 20,168,318 121,124,989 18,001,963 2,050,000 13,009,267 101,018,727 $ 20,087,346 $ 1,190,137 $ 47,461,652 $ 21,372,126 $ - $ 16,050,144 $ 33,276,394
97

Anne Arundel County, Maryland
Schedule of Revenues and Expenditures - Budget and Actual (Non-GAAP Basis)
Erosion Districts Fund
Year Ended June 30, 2007
Original Final VarianceBudget Budget Actual Over (Under)
REVENUESCape Anne $ 7,708 $ 7,708 $ 8,570 $ 862 Cedarhurst 38,560 38,560 42,478 3,918 Columbia Beach 42,000 42,000 51,689 9,689 Franklin Manor 37,600 37,600 40,698 3,098 Holland Point 23,808 23,808 29,216 5,408 Idlewilde - - - - Riviera Beach 77,600 77,600 79,951 2,351 Total revenues $ 227,276 $ 227,276 $ 252,602 $ 25,326
EXPENDITURES
Cape Anne $ 24,108 $ 24,108 $ 426 $ (23,682) Cedarhurst 65,160 65,160 36,830 (28,330) Columbia Beach 71,700 71,700 2,000 (69,700) Franklin Manor 39,900 39,900 2,000 (37,900) Holland Point 55,608 55,608 2,937 (52,671) Idlewilde 27,300 27,300 24,300 (3,000) Riviera Beach 385,600 385,600 94,206 (291,394) Total expenditures $ 669,376 $ 669,376 $ 162,699 $ (506,677)
Budgeted revenues exclude fund balance appropriated to fund expenditures in the current fiscal year.
98

Anne Arundel County, Maryland
Schedules of Revenues, Expenditures, and Changes in Fund Balances - Budget and Actual (Non-GAAP Basis)
Debt Service Funds
Year Ended June 30, 2007
Original Final VarianceBudget Budget Actual Over (Under)
NURSERY ROAD TAX INCREMENT DISTRICTRevenues
General property taxes $ 4,092,000 $ 4,092,000 $ 3,932,143 $ (159,857) Investment income 20,000 20,000 148,393 128,393
4,112,000 4,112,000 4,080,536 (31,464) Expenditures
Contractual services 10,000 10,000 - (10,000) Interest payments on debt 105,700 105,700 105,715 15 Principal payments on debt 142,800 142,800 142,787 (13) Other 3,853,500 3,853,500 3,863,498 9,998
4,112,000 4,112,000 4,112,000 -
Revenues over (under) expenditures - - (31,464) $ (31,464)
Fund balance, budgetary, July 1 58,479 58,479 58,479
Fund balance, budgetary, June 30 $ 58,479 $ 58,479 $ 27,015
WEST COUNTY TAX INCREMENT DISTRICTRevenues
General property taxes $ 2,382,000 $ 2,442,000 $ 2,335,020 $ (106,980) Investment income 20,000 74,000 82,203 8,203
2,402,000 2,516,000 2,417,223 (98,777) Expenditures
Contractual services 41,200 41,200 12,040 (29,160) Interest payments on debt 757,400 757,400 757,425 25 Other 1,603,400 1,717,400 1,717,768 368
2,402,000 2,516,000 2,487,233 (28,767)
Revenues over (under) expenditures - - (70,010) $ (70,010)
Fund balance, budgetary, July 1 70,694 70,694 70,694
Fund balance, budgetary, June 30 $ 70,694 $ 70,694 $ 684
ARUNDEL MILLS TAX INCREMENT DISTRICTRevenues
General property taxes $ 3,685,000 $ 3,727,000 $ 3,720,382 $ (6,618) Investment income 30,000 90,000 117,010 27,010
3,715,000 3,817,000 3,837,392 20,392 Expenditures
Interest payments on debt 1,502,000 1,502,000 1,501,956 (44) Other 2,213,000 2,315,000 2,315,044 44
3,715,000 3,817,000 3,817,000 -
Revenues over (under) expenditures - - 20,392 $ 20,392
Fund balance, budgetary, July 1 77,269 77,269 77,269
Fund balance, budgetary, June 30 $ 77,269 $ 77,269 $ 97,661
Budgeted revenues exclude fund balance appropriated to fund expenditures in the current fiscal year.
99
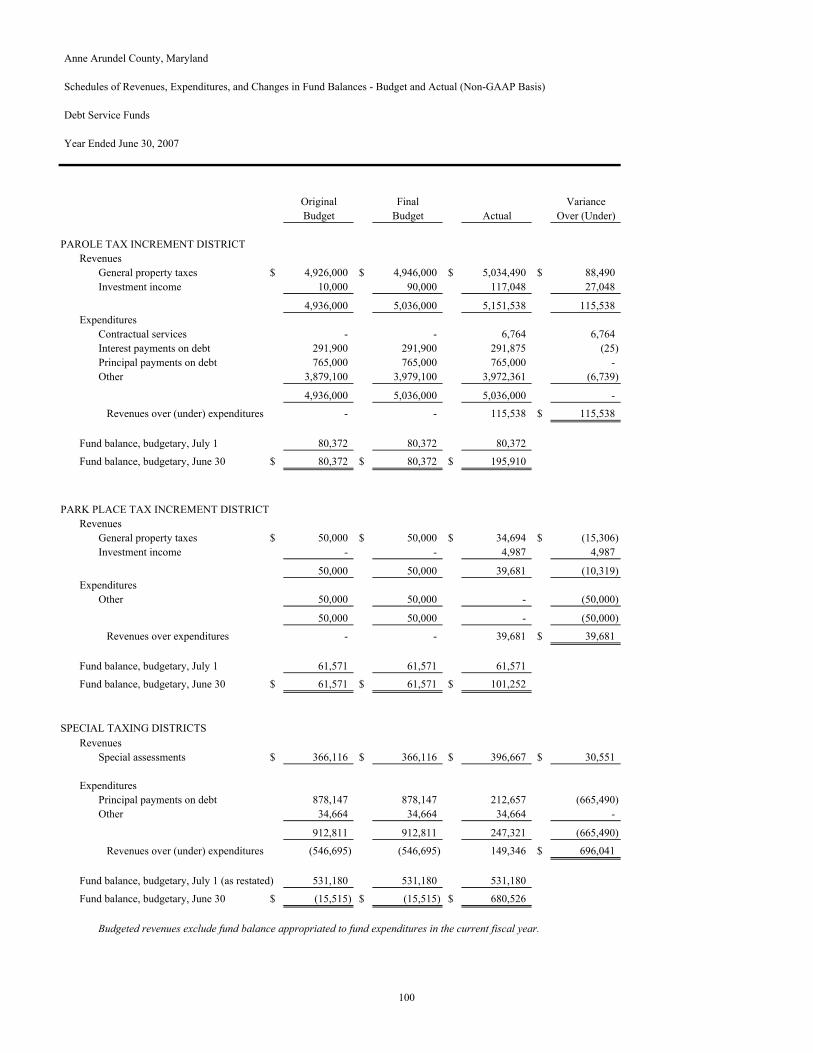
Anne Arundel County, Maryland
Schedules of Revenues, Expenditures, and Changes in Fund Balances - Budget and Actual (Non-GAAP Basis)
Debt Service Funds
Year Ended June 30, 2007
Original Final VarianceBudget Budget Actual Over (Under)
PAROLE TAX INCREMENT DISTRICTRevenues
General property taxes $ 4,926,000 $ 4,946,000 $ 5,034,490 $ 88,490 Investment income 10,000 90,000 117,048 27,048
4,936,000 5,036,000 5,151,538 115,538 Expenditures
Contractual services - - 6,764 6,764 Interest payments on debt 291,900 291,900 291,875 (25) Principal payments on debt 765,000 765,000 765,000 - Other 3,879,100 3,979,100 3,972,361 (6,739)
4,936,000 5,036,000 5,036,000 -
Revenues over (under) expenditures - - 115,538 $ 115,538
Fund balance, budgetary, July 1 80,372 80,372 80,372
Fund balance, budgetary, June 30 $ 80,372 $ 80,372 $ 195,910
PARK PLACE TAX INCREMENT DISTRICTRevenues
General property taxes $ 50,000 $ 50,000 $ 34,694 $ (15,306) Investment income - - 4,987 4,987
50,000 50,000 39,681 (10,319) Expenditures
Other 50,000 50,000 - (50,000)
50,000 50,000 - (50,000)
Revenues over expenditures - - 39,681 $ 39,681
Fund balance, budgetary, July 1 61,571 61,571 61,571
Fund balance, budgetary, June 30 $ 61,571 $ 61,571 $ 101,252
SPECIAL TAXING DISTRICTSRevenues
Special assessments $ 366,116 $ 366,116 $ 396,667 $ 30,551
ExpendituresPrincipal payments on debt 878,147 878,147 212,657 (665,490) Other 34,664 34,664 34,664 -
912,811 912,811 247,321 (665,490)
Revenues over (under) expenditures (546,695) (546,695) 149,346 $ 696,041
Fund balance, budgetary, July 1 (as restated) 531,180 531,180 531,180
Fund balance, budgetary, June 30 $ (15,515) $ (15,515) $ 680,526
Budgeted revenues exclude fund balance appropriated to fund expenditures in the current fiscal year.
100

Anne Arundel County, Maryland
Schedules of Revenues, Expenditures, and Changes in Fund Balances - Budget and Actual (Non-GAAP Basis)
Debt Service Funds
Year Ended June 30, 2007
Original Final VarianceBudget Budget Actual Over (Under)
INSTALLMENT PURCHASE AGREEMENTSRevenues
Investment income $ 50,000 $ 50,000 $ 283,727 $ 233,727 General fund contribution and other 300,000 300,000 1,934,855 1,634,855
350,000 350,000 2,218,582 1,868,582
ExpendituresContractual services 100,000 100,000 3,640 (96,360) Interest payments on debt 680,000 680,000 539,629 (140,371) Principal payments on debt 20,000 20,000 17,814 (2,186)
800,000 800,000 561,083 (238,917)
Revenues under expenditures (450,000) (450,000) 1,657,499 $ 2,107,499
Fund balance, budgetary, July 1 4,480,826 4,480,826 4,480,826
Fund balance, budgetary, June 30 $ 4,030,826 $ 4,030,826 $ 6,138,325
Budgeted revenues exclude fund balance appropriated to fund expenditures in the current fiscal year.
101

Anne Arundel County, Maryland
Schedule of Revenues and Expenditures - Budget and Actual (Non-GAAP Basis)
Special Taxing Districts
Year Ended June 30, 2007
Original Final VarianceBudget Budget Actual Over (Under)
REVENUES Annapolis Cove $ 5,460 $ 5,460 $ 5,460 $ - Annapolis Landing 8,217 8,217 8,217 - Arundel on the Bay 24,150 24,150 26,596 2,446 Bay Ridge 110,054 110,054 130,543 20,489 Browns Pond - Waterway 11,469 11,469 11,469 - Buckingham Cove 9,000 9,000 9,000 - Cattail Creek 5,400 5,400 5,363 (37) Elizabeths Landing 14,646 14,646 15,028 382 John's Creek - Waterway 7,650 7,650 7,650 - Lake Hillsmere - Waterway 4,680 4,680 5,884 1,204 Lake Hillsmere II - Waterway 8,050 8,050 8,050 - Lake Placid - Waterway 14,450 14,450 17,572 3,122 Masons Beach 31,200 31,200 33,289 2,089 Pine Grove Village 2,512 2,512 2,512 - Romar Estates 12,875 12,875 12,875 - Snug Harbor - Erosion 10,510 10,510 10,620 110 Snug Harbor - Special Benefits 21,109 21,109 21,331 222 Snug Harbor - Waterway 44,000 44,000 44,000 - Spriggs Pond - Waterway 13,596 13,596 13,596 - Whitehall 7,088 7,088 7,612 524 Total debt service $ 366,116 $ 366,116 $ 396,667 $ 30,551
EXPENDITURES Annapolis Cove $ 5,210 $ 5,210 $ 5,122 $ (88) Annapolis Landing 8,217 8,217 8,090 (127) Arundel on the Bay 50,450 50,450 28,205 (22,245) Bay Ridge 441,804 441,804 32,834 (408,970) Browns Pond - Waterway 28,869 28,869 7,618 (21,251) Buckingham Cove 10,700 10,700 9,153 (1,547) Cattail Creek 10,000 10,000 5,361 (4,639) Elizabeths Landing 22,646 22,646 17,455 (5,191) John's Creek - Waterway 7,950 7,950 7,302 (648) Lake Hillsmere - Waterway 7,580 7,580 3,732 (3,848) Lake Hillsmere II - Waterway 8,350 8,350 7,948 (402) Lake Placid - Waterway 20,650 20,650 8,413 (12,237) Masons Beach 120,500 120,500 18,126 (102,374) Pine Grove Village 2,662 2,662 2,637 (25) Romar Estates 12,975 12,975 12,843 (132) Snug Harbor - Erosion 11,610 11,610 9,743 (1,867) Snug Harbor - Special Benefits 65,474 65,474 4,723 (60,751) Snug Harbor - Waterway 54,000 54,000 38,454 (15,546) Spriggs Pond - Waterway 15,676 15,676 12,616 (3,060) Whitehall 7,488 7,488 6,946 (542) Total expenditures $ 912,811 $ 912,811 $ 247,321 $ (665,490)
Budgeted revenues exclude fund balance appropriated to fund expenditures in the current fiscal year.
102
103
Proprietary Funds
The Primary Government has two major proprietary funds, the Water and Wastewater Fund and the Solid Waste Fund. Both of these funds have been fully described in the footnotes to the basic financial statements. The statements in this section include columns for components of the Water and Wastewater Fund, the Internal Service Funds, which are considered to be non-major, and the budgetary statements for all proprietary funds. Descriptions for all proprietary funds and related components are provided below. Enterprise Funds Water and Wastewater Enterprise – This fund consists of three component funds, operating, debt service, and capital projects.
Operating – This fund accounts for the operation of public water supply systems and sewage collection and treatment systems in the County. Revenues consist mainly of user fees, and developer and grant contributions.
Debt Service – This fund accounts for the collection of front foot, user connections, and capital connection fees and the use of these funds to pay the principal and interest on water and wastewater debt.
Capital Projects – This fund accounts for the construction of water and wastewater plants and lines used to provide services to County residents. Funding sources and costs are accumulated by individual project and, when completed, the assets are capitalized in the Operating Fund. Solid Waste Enterprise – This fund accounts for the costs associated with the collection and disposal of refuse at the County landfills. Revenues originate primarily from annual service charges to customers and tipping fees from commercial trash haulers, which are intended to cover all operating expenses, including interest on long-term debt. The Solid Waste Enterprise Fund also includes capital project accounts for landfill construction and closure costs. Funding sources are primarily from the sale of County General Obligation Bonds, Federal and State Grants, and pay-as-you-go monies provided by the Solid Waste operating fund. Child Care – This fund accounts for the school age child care program provided by the County’s Recreation and Parks Department. Revenues consist of child care fees collected from those participating in the program. Costs of the fund include operations at several child care sites as well as administrative expenses. Internal Service Funds Self Insurance – This fund accounts for insurance activity of the County, including self-insured workmen’s compensation, auto liability, and general liability. The revenues herein are premiums paid by other County funds and the Board of Education. The disbursements relate to payments of claims and the purchase of insurance policies for property insurance and bonding. Health Insurance – This fund accounts for the health insurance activity of the County, which is primarily self-insured for medical benefits. Premiums are received from County funds and some component units and disbursements are made to claims administrators or insurers. Print Shop – This fund accounted for the activities of the print shop. Revenues were received from County funds or component units. Since the beginning of fiscal year 2007 these activities have been accounted for in the General Fund. Central Garage and Transportation – This fund accounts for the operation of the County’s garages and motor pool. Revenues consist of charges to County funds for lease charges, vehicle repair, and gasoline usage. Garage Replacements – This fund accounts for a replacement reserve for of the County’s motor pool. Revenues consist of charges to County funds for replacement of vehicles, and gasoline usage.
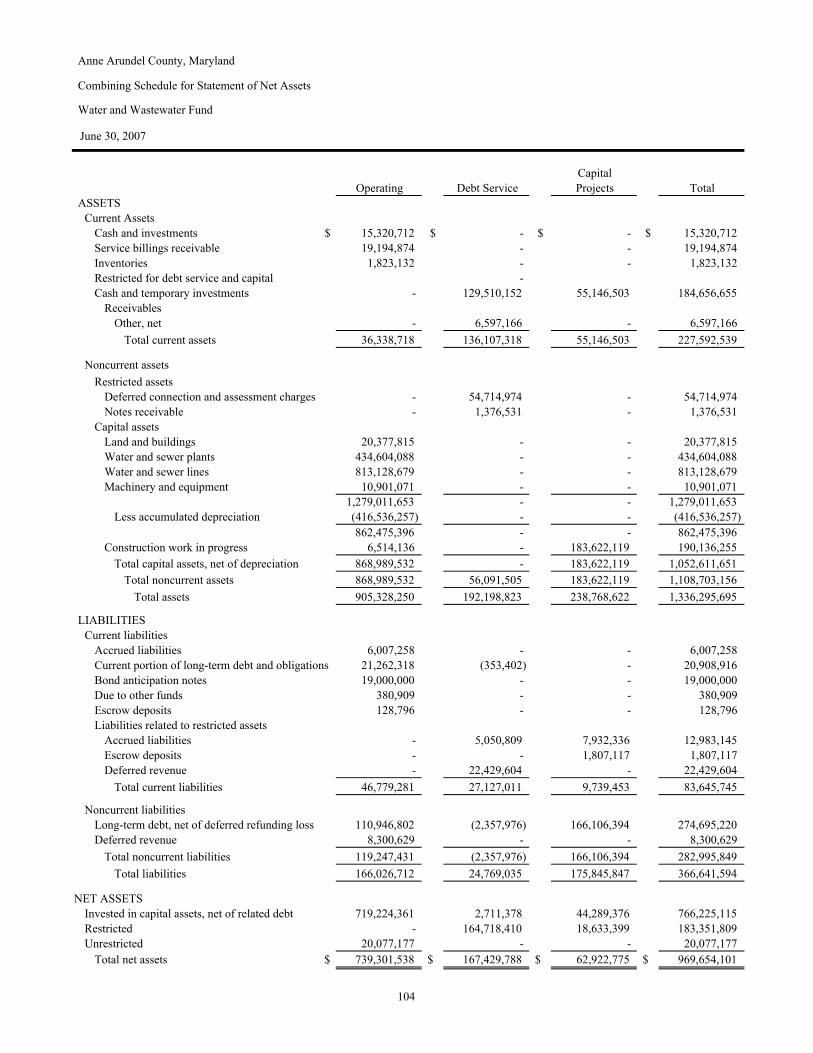
Anne Arundel County, Maryland
Combining Schedule for Statement of Net Assets
Water and Wastewater Fund
June 30, 2007
CapitalOperating Debt Service Projects Total
ASSETSCurrent Assets
Cash and investments $ 15,320,712 $ - $ - $ 15,320,712 Service billings receivable 19,194,874 - - 19,194,874 Inventories 1,823,132 - - 1,823,132 Restricted for debt service and capital -
Cash and temporary investments - 129,510,152 55,146,503 184,656,655 Receivables
Other, net - 6,597,166 - 6,597,166 Total current assets 36,338,718 136,107,318 55,146,503 227,592,539
Noncurrent assets Restricted assets
Deferred connection and assessment charges - 54,714,974 - 54,714,974 Notes receivable - 1,376,531 - 1,376,531
Capital assetsLand and buildings 20,377,815 - - 20,377,815 Water and sewer plants 434,604,088 - - 434,604,088 Water and sewer lines 813,128,679 - - 813,128,679 Machinery and equipment 10,901,071 - - 10,901,071
1,279,011,653 - - 1,279,011,653 Less accumulated depreciation (416,536,257) - - (416,536,257)
862,475,396 - - 862,475,396 Construction work in progress 6,514,136 - 183,622,119 190,136,255
Total capital assets, net of depreciation 868,989,532 - 183,622,119 1,052,611,651 Total noncurrent assets 868,989,532 56,091,505 183,622,119 1,108,703,156
Total assets 905,328,250 192,198,823 238,768,622 1,336,295,695
LIABILITIESCurrent liabilities
Accrued liabilities 6,007,258 - - 6,007,258 Current portion of long-term debt and obligations 21,262,318 (353,402) - 20,908,916 Bond anticipation notes 19,000,000 - - 19,000,000 Due to other funds 380,909 - - 380,909 Escrow deposits 128,796 - - 128,796 Liabilities related to restricted assets
Accrued liabilities - 5,050,809 7,932,336 12,983,145 Escrow deposits - - 1,807,117 1,807,117 Deferred revenue - 22,429,604 - 22,429,604
Total current liabilities 46,779,281 27,127,011 9,739,453 83,645,745
Noncurrent liabilitiesLong-term debt, net of deferred refunding loss 110,946,802 (2,357,976) 166,106,394 274,695,220 Deferred revenue 8,300,629 - - 8,300,629
Total noncurrent liabilities 119,247,431 (2,357,976) 166,106,394 282,995,849 Total liabilities 166,026,712 24,769,035 175,845,847 366,641,594
NET ASSETSInvested in capital assets, net of related debt 719,224,361 2,711,378 44,289,376 766,225,115 Restricted - 164,718,410 18,633,399 183,351,809 Unrestricted 20,077,177 - - 20,077,177
Total net assets $ 739,301,538 $ 167,429,788 $ 62,922,775 $ 969,654,101
104

Anne Arundel County, Maryland
Combining Schedule for Statement of Revenues, Expenses, and Changes in Fund Net Assets
Water and Wastewater Fund
Year Ended June 30, 2007
CapitalOperating Debt Service Projects Total
OPERATING REVENUESCharges for services $ 69,688,775 $ - $ - $ 69,688,775 Other revenues 3,669,867 - - 3,669,867
Total operating revenues 73,358,642 - - 73,358,642
OPERATING EXPENSESPersonal services 23,678,231 - - 23,678,231 Contractual services 25,810,316 - - 25,810,316 Supplies and materials 3,565,127 - - 3,565,127 Business and travel 110,922 - - 110,922 Depreciation 30,012,459 - - 30,012,459 Other 8,257,778 - - 8,257,778
Total operating expenses 91,434,833 - - 91,434,833
Operating loss (18,076,191) - - (18,076,191)
NONOPERATING REVENUES AND EXPENSESInvestment income 71,562 5,615,035 - 5,686,597 Interest on long-term receivables - 1,815,377 - 1,815,377 Other revenues - 873,975 - 873,975 Interest expense - (7,882,097) - (7,882,097) Loss on the disposal of assets (403,439) - - (403,439) Other - (608,413) - (608,413)
Net loss before other revenues (18,408,068) (186,123) - (18,594,191)
OTHERCapital contributions and grants 13,234,764 23,589,206 140,474 36,964,444 Environmental protection fees - 6,113,343 - 6,113,343 Net equity transfers between funds 12,757,214 (22,054,299) 9,297,085 -
Change in net assets 7,583,910 7,462,127 9,437,559 24,483,596
Net assets, July 1 731,717,628 159,967,661 53,485,216 945,170,505 Net assets, June 30 $ 739,301,538 $ 167,429,788 $ 62,922,775 $ 969,654,101
105

Anne Arundel County, Maryland
Combining Schedule for Statement of Cash Flows
Water and Wastewater Fund
Year Ended June 30, 2007
TotalCapital Water and
Operating Debt Service Projects Wastewater
CASH FLOWS FROM OPERATING ACTIVITIES Cash received for services $ 73,455,914 $ - $ - $ 73,455,914 Cash payments to suppliers for goods and services (37,732,929) - - (37,732,929) Cash payments to employees for services (23,398,273) - - (23,398,273)
Net cash provided by operating activities 12,324,712 - - 12,324,712
CASH FLOWS FROM CAPITAL AND RELATED FINANCING ACTIVITIES
Proceeds from sale of County bonds and bond anticipation notes - 18,500,000 43,000,000 61,500,000 Proceeds from loan - - 7,462,041 7,462,041 Proceeds from developers' contributions - - 1,066,147 1,066,147 Refunds to developers - (183,248) (428,042) (611,290) Assessment and connection charges 1,290,561 45,440,773 - 46,731,334 Environmental protection fees for capital assets - 4,521,401 - 4,521,401 Payments of long-term debt - (19,086,724) - (19,086,724) Payments of bond anticipation notes - (18,500,000) - (18,500,000) Interest payments - (12,269,531) - (12,269,531) Operations funds used in construction (14,455,000) - 14,455,000 - Acquisition and construction of capital assets (522,892) - (45,063,641) (45,586,533) Payments of debt issuance costs - (151,725) - (151,725) Premium on sale of bonds - 1,327,068 - 1,327,068 Payments received on note receivable - 1,874,505 - 1,874,505 Intrafund surplus transfers 7,000,000 - (7,000,000) - Other costs - (565,654) - (565,654) Net cash provided by (used for) capital and related financing activities (6,687,331) 20,906,865 13,491,505 27,711,039
CASH FLOW FROM INVESTING ACTIVITIES Purchase of investment securities - (129,703,891) - (129,703,891) Sale of investment securities - 115,946,258 - 115,946,258 Interest on investments 71,562 7,539,428 - 7,610,990 Net cash provided by (used for) investing activities 71,562 (6,218,205) - (6,146,643) Net increase in cash and cash equivalents 5,708,943 14,688,660 13,491,505 33,889,108 Cash and cash equivalents, July 1 9,611,769 14,047,587 41,654,998 65,314,354 Cash and cash equivalents, June 30 15,320,712 28,736,247 55,146,503 99,203,462 Investment in non-cash equivalents - 100,773,905 - 100,773,905
Total cash and temporary investments $ 15,320,712 $ 129,510,152 $ 55,146,503 $ 199,977,367
106
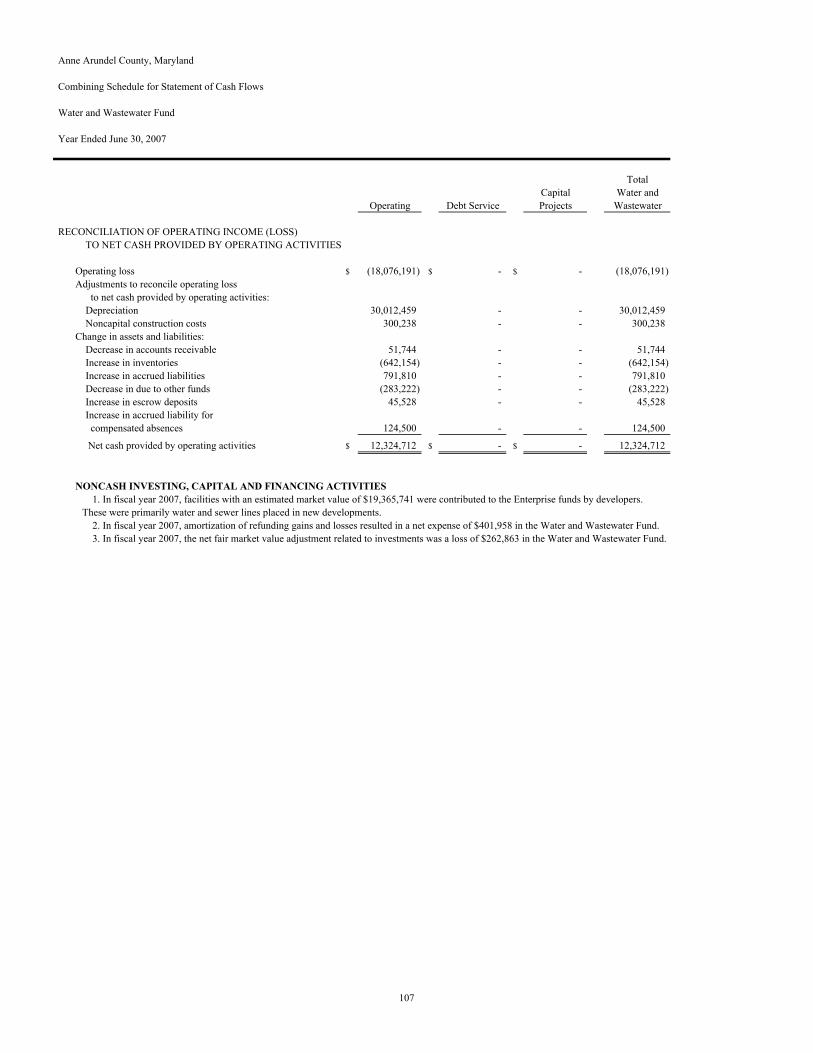
Anne Arundel County, Maryland
Combining Schedule for Statement of Cash Flows
Water and Wastewater Fund
Year Ended June 30, 2007
TotalCapital Water and
Operating Debt Service Projects Wastewater
RECONCILIATION OF OPERATING INCOME (LOSS) TO NET CASH PROVIDED BY OPERATING ACTIVITIES
Operating loss $ (18,076,191) $ - $ - (18,076,191) Adjustments to reconcile operating loss to net cash provided by operating activities: Depreciation 30,012,459 - - 30,012,459 Noncapital construction costs 300,238 - - 300,238 Change in assets and liabilities: Decrease in accounts receivable 51,744 - - 51,744 Increase in inventories (642,154) - - (642,154) Increase in accrued liabilities 791,810 - - 791,810 Decrease in due to other funds (283,222) - - (283,222) Increase in escrow deposits 45,528 - - 45,528 Increase in accrued liability for compensated absences 124,500 - - 124,500
Net cash provided by operating activities $ 12,324,712 $ - $ - 12,324,712
NONCASH INVESTING, CAPITAL AND FINANCING ACTIVITIES 1. In fiscal year 2007, facilities with an estimated market value of $19,365,741 were contributed to the Enterprise funds by developers. These were primarily water and sewer lines placed in new developments. 2. In fiscal year 2007, amortization of refunding gains and losses resulted in a net expense of $401,958 in the Water and Wastewater Fund. 3. In fiscal year 2007, the net fair market value adjustment related to investments was a loss of $262,863 in the Water and Wastewater Fund.
107
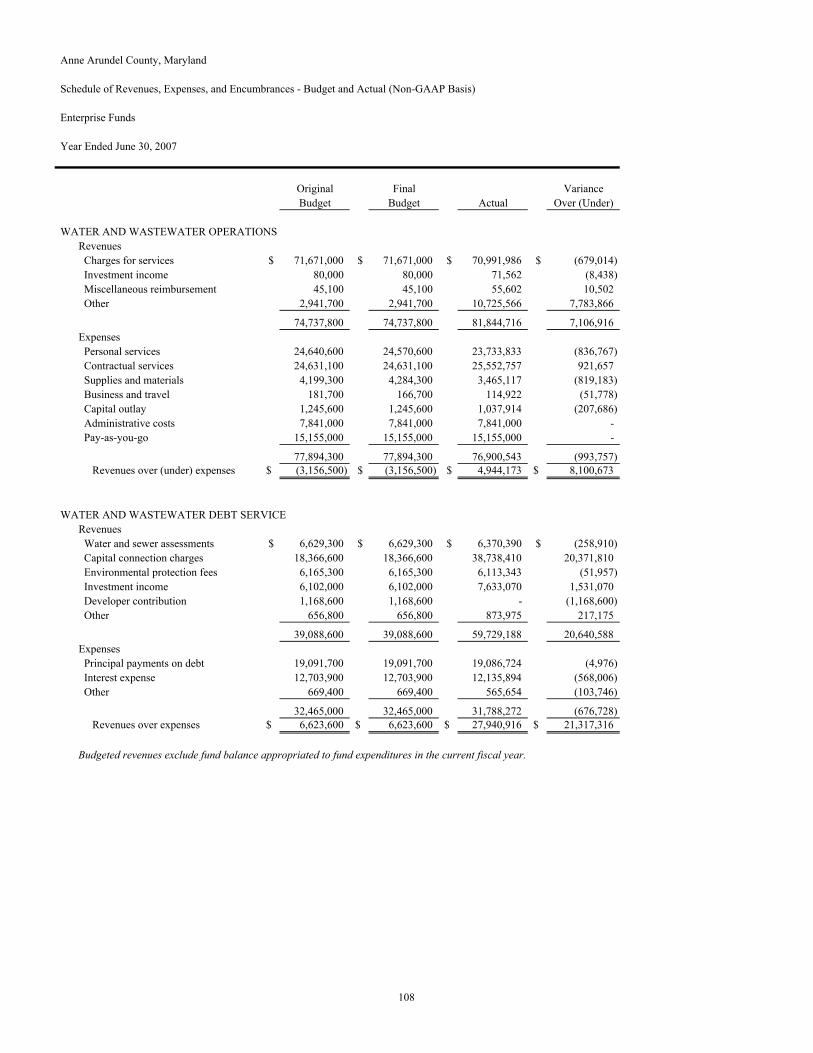
Anne Arundel County, Maryland
Schedule of Revenues, Expenses, and Encumbrances - Budget and Actual (Non-GAAP Basis)
Enterprise Funds
Year Ended June 30, 2007
Original Final VarianceBudget Budget Actual Over (Under)
WATER AND WASTEWATER OPERATIONSRevenues Charges for services $ 71,671,000 $ 71,671,000 $ 70,991,986 $ (679,014) Investment income 80,000 80,000 71,562 (8,438) Miscellaneous reimbursement 45,100 45,100 55,602 10,502 Other 2,941,700 2,941,700 10,725,566 7,783,866
74,737,800 74,737,800 81,844,716 7,106,916 Expenses Personal services 24,640,600 24,570,600 23,733,833 (836,767) Contractual services 24,631,100 24,631,100 25,552,757 921,657 Supplies and materials 4,199,300 4,284,300 3,465,117 (819,183) Business and travel 181,700 166,700 114,922 (51,778) Capital outlay 1,245,600 1,245,600 1,037,914 (207,686) Administrative costs 7,841,000 7,841,000 7,841,000 - Pay-as-you-go 15,155,000 15,155,000 15,155,000 -
77,894,300 77,894,300 76,900,543 (993,757) Revenues over (under) expenses $ (3,156,500) $ (3,156,500) $ 4,944,173 $ 8,100,673
WATER AND WASTEWATER DEBT SERVICERevenues Water and sewer assessments $ 6,629,300 $ 6,629,300 $ 6,370,390 $ (258,910) Capital connection charges 18,366,600 18,366,600 38,738,410 20,371,810 Environmental protection fees 6,165,300 6,165,300 6,113,343 (51,957) Investment income 6,102,000 6,102,000 7,633,070 1,531,070 Developer contribution 1,168,600 1,168,600 - (1,168,600) Other 656,800 656,800 873,975 217,175
39,088,600 39,088,600 59,729,188 20,640,588 Expenses Principal payments on debt 19,091,700 19,091,700 19,086,724 (4,976) Interest expense 12,703,900 12,703,900 12,135,894 (568,006) Other 669,400 669,400 565,654 (103,746)
32,465,000 32,465,000 31,788,272 (676,728) Revenues over expenses $ 6,623,600 $ 6,623,600 $ 27,940,916 $ 21,317,316
Budgeted revenues exclude fund balance appropriated to fund expenditures in the current fiscal year.
108

Anne Arundel County, Maryland
Schedule of Revenues, Expenses, and Encumbrances - Budget and Actual (Non-GAAP Basis)
Enterprise Funds
Year Ended June 30, 2007
Original Final VarianceBudget Budget Actual Over (Under)
SOLID WASTE Revenues Charges for services $ 40,110,700 $ 40,110,700 $ 40,526,107 $ 415,407 Landfill charges 2,733,100 2,733,100 2,487,992 (245,108) Host fees 1,200,000 1,200,000 1,229,005 29,005 Other 2,735,100 2,735,100 3,876,631 1,141,531
46,778,900 46,778,900 48,119,735 1,340,835 Expenses Personal services 6,050,800 6,050,800 5,539,495 (511,305) Contractual services 30,330,300 30,308,300 29,912,444 (395,856) Supplies and materials 1,131,700 1,273,700 894,405 (379,295) Business and travel 56,700 58,700 28,232 (30,468) Capital outlay 894,000 772,000 673,197 (98,803) Principal payments on debt 3,064,400 3,064,400 3,064,362 (38) Interest expense 983,500 983,500 985,009 1,509 Administrative costs 2,475,900 2,475,900 2,375,900 (100,000) Contributions/Solid Waste Assurance Fund 485,800 485,800 485,800 - Contributions/Self Insurance Fund 86,000 86,000 86,000 - Contributions/Northeast Maryland Solid 25,000 25,000 25,000 - Capital improvements 700,000 700,000 700,000 -
46,284,100 46,284,100 44,769,844 (1,514,256) Revenues over expenses $ 494,800 $ 494,800 $ 3,349,891 $ 2,855,091
SOLID WASTE FINANCIAL ASSURANCE Revenues Payments from other funds $ 485,800 $ 485,800 $ 485,800 $ - Other - - 815,638 815,638
485,800 485,800 1,301,438 815,638 Expenses Other - - - -
- - - - Revenues over expenses $ 485,800 $ 485,800 $ 1,301,438 $ 815,638
CHILD CARE Revenues Child Care Fees $ 2,892,400 $ 2,892,400 $ 2,881,008 $ (11,392)
2,892,400 2,892,400 2,881,008 (11,392) Expenses Personal services 2,320,900 2,320,900 2,161,591 (159,309) Contractual services 207,000 207,000 214,162 7,162 Supplies and materials 251,400 251,400 230,382 (21,018) Business and travel 9,500 9,500 7,390 (2,110) Capital outlay 73,600 73,600 39,693 (33,907) Other 163,200 163,200 163,200 -
3,025,600 3,025,600 2,816,418 (209,182) Revenues over (under) expenses $ (133,200) $ (133,200) $ 64,590 $ 197,790
Budgeted revenues exclude fund balance appropriated to fund expenditures in the current fiscal year.
109
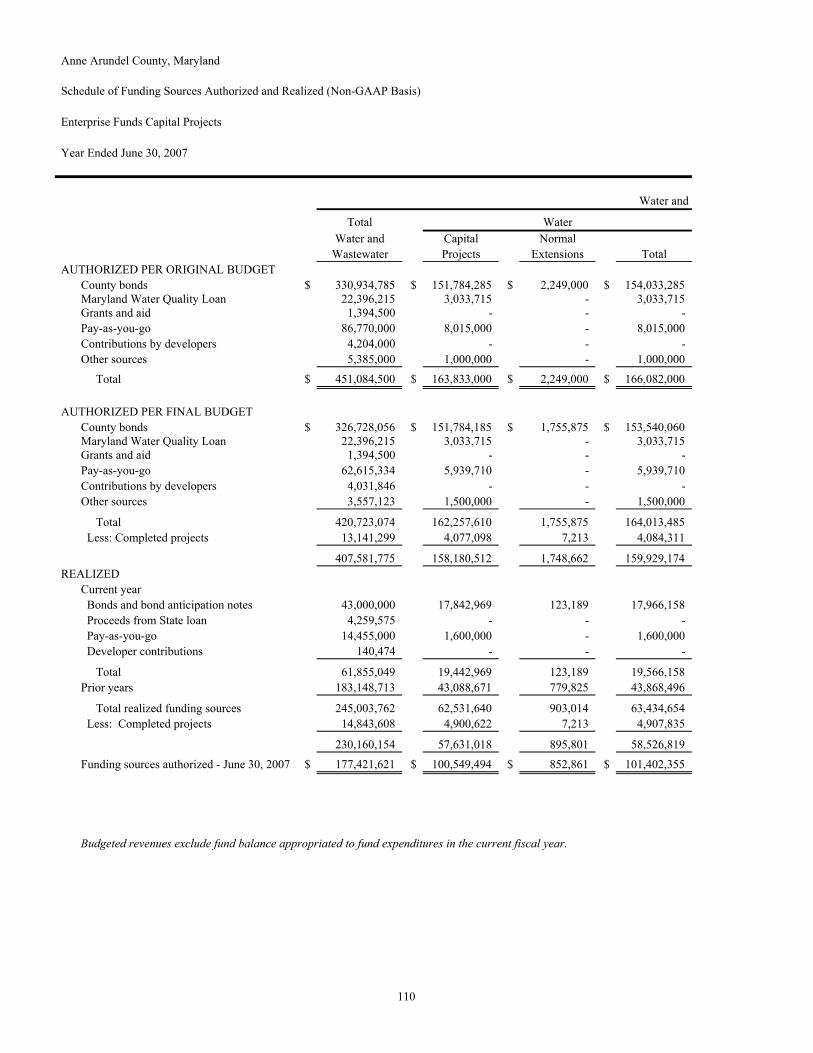
Anne Arundel County, Maryland Schedule of Funding Sources Authorized and Realized (Non-GAAP Basis)
Enterprise Funds Capital Projects
Year Ended June 30, 2007
Water and
Total WaterWater and Capital Normal
Wastewater Projects Extensions TotalAUTHORIZED PER ORIGINAL BUDGET
County bonds $ 330,934,785 $ 151,784,285 $ 2,249,000 $ 154,033,285 Maryland Water Quality Loan 22,396,215 3,033,715 - 3,033,715 Grants and aid 1,394,500 - - - Pay-as-you-go 86,770,000 8,015,000 - 8,015,000 Contributions by developers 4,204,000 - - - Other sources 5,385,000 1,000,000 - 1,000,000
Total $ 451,084,500 $ 163,833,000 $ 2,249,000 $ 166,082,000
AUTHORIZED PER FINAL BUDGETCounty bonds $ 326,728,056 $ 151,784,185 $ 1,755,875 $ 153,540,060 Maryland Water Quality Loan 22,396,215 3,033,715 - 3,033,715 Grants and aid 1,394,500 - - - Pay-as-you-go 62,615,334 5,939,710 - 5,939,710 Contributions by developers 4,031,846 - - - Other sources 3,557,123 1,500,000 - 1,500,000
Total 420,723,074 162,257,610 1,755,875 164,013,485 Less: Completed projects 13,141,299 4,077,098 7,213 4,084,311
407,581,775 158,180,512 1,748,662 159,929,174 REALIZED
Current year Bonds and bond anticipation notes 43,000,000 17,842,969 123,189 17,966,158 Proceeds from State loan 4,259,575 - - - Pay-as-you-go 14,455,000 1,600,000 - 1,600,000 Developer contributions 140,474 - - -
Total 61,855,049 19,442,969 123,189 19,566,158 Prior years 183,148,713 43,088,671 779,825 43,868,496
Total realized funding sources 245,003,762 62,531,640 903,014 63,434,654 Less: Completed projects 14,843,608 4,900,622 7,213 4,907,835
230,160,154 57,631,018 895,801 58,526,819
Funding sources authorized - June 30, 2007 $ 177,421,621 $ 100,549,494 $ 852,861 $ 101,402,355
Budgeted revenues exclude fund balance appropriated to fund expenditures in the current fiscal year.
110

Wastewater
WastewaterCapital Normal Oversize SolidProjects Extension Total Connections Waste
$ 164,817,500 $ 2,222,000 $ 167,039,500 $ 9,862,000 $ 11,874,000 19,362,500 - 19,362,500 - -
1,394,500 - 1,394,500 - - 26,219,000 44,000 26,263,000 52,492,000 12,222,849
475,000 - 475,000 3,729,000 - 3,150,000 - 3,150,000 1,235,000 750,000
$ 215,418,500 $ 2,266,000 $ 217,684,500 $ 67,318,000 $ 24,846,849
$ 161,677,600 $ 1,648,700 $ 163,326,300 $ 9,861,696 $ 11,874,000 19,362,500 - 19,362,500 - -
1,394,500 - 1,394,500 - - 22,914,895 44,438 22,959,333 33,716,291 12,014,332
475,000 - 475,000 3,556,846 - 2,032,000 - 2,032,000 25,123 750,000
207,856,495 1,693,138 209,549,633 47,159,956 24,638,332 6,728,380 73,857 6,802,237 2,254,751 6,844,992
201,128,115 1,619,281 202,747,396 44,905,205 17,793,340
23,844,857 215,738 24,060,595 973,247 1,000,000 4,259,575 - 4,259,575 - - 5,725,000 - 5,725,000 7,130,000 500,000
20,000 - 20,000 120,474 -
33,849,432 215,738 34,065,170 8,223,721 1,500,000 111,189,986 621,811 111,811,797 27,468,420 19,503,408
145,039,418 837,549 145,876,967 35,692,141 21,003,408 7,432,487 73,857 7,506,344 2,429,429 6,844,992
137,606,931 763,692 138,370,623 33,262,712 14,158,416
$ 63,521,184 $ 855,589 $ 64,376,773 $ 11,642,493 $ 3,634,924
111
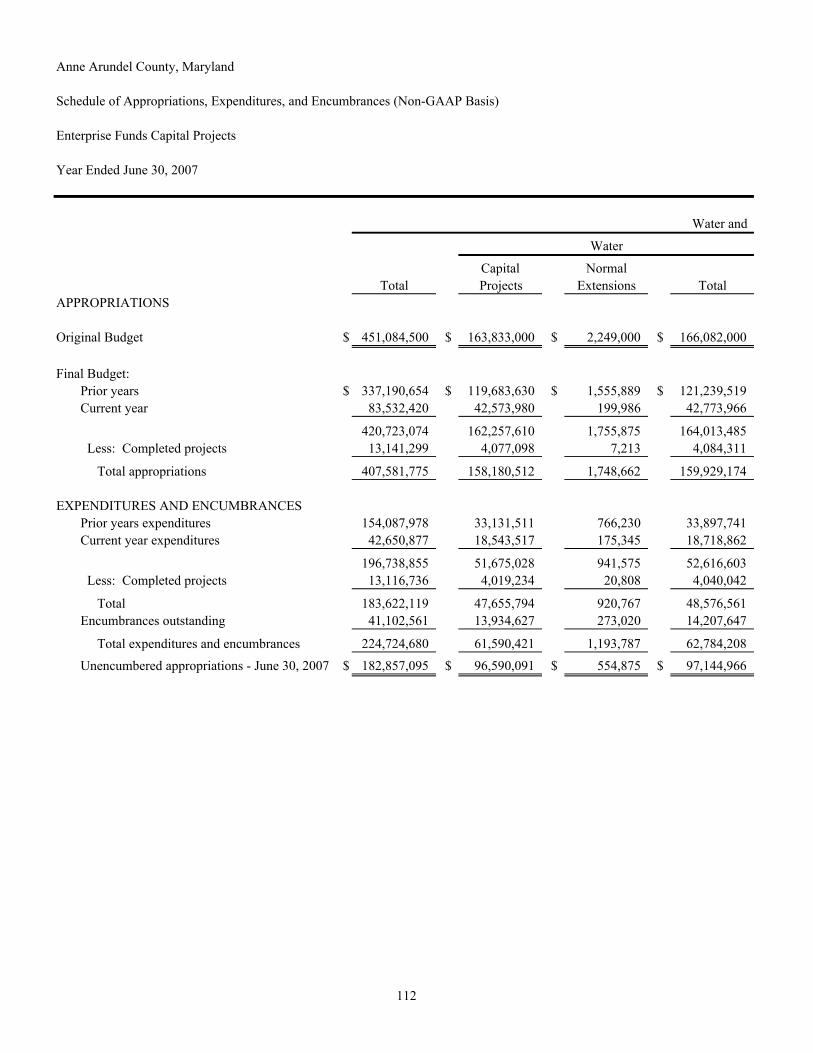
Anne Arundel County, Maryland
Schedule of Appropriations, Expenditures, and Encumbrances (Non-GAAP Basis)
Enterprise Funds Capital Projects
Year Ended June 30, 2007
Water and
Capital NormalTotal Projects Extensions Total
APPROPRIATIONS
Original Budget $ 451,084,500 $ 163,833,000 $ 2,249,000 $ 166,082,000
Final Budget:Prior years $ 337,190,654 $ 119,683,630 $ 1,555,889 $ 121,239,519 Current year 83,532,420 42,573,980 199,986 42,773,966
420,723,074 162,257,610 1,755,875 164,013,485 Less: Completed projects 13,141,299 4,077,098 7,213 4,084,311
Total appropriations 407,581,775 158,180,512 1,748,662 159,929,174
EXPENDITURES AND ENCUMBRANCESPrior years expenditures 154,087,978 33,131,511 766,230 33,897,741 Current year expenditures 42,650,877 18,543,517 175,345 18,718,862
196,738,855 51,675,028 941,575 52,616,603 Less: Completed projects 13,116,736 4,019,234 20,808 4,040,042
Total 183,622,119 47,655,794 920,767 48,576,561 Encumbrances outstanding 41,102,561 13,934,627 273,020 14,207,647
Total expenditures and encumbrances 224,724,680 61,590,421 1,193,787 62,784,208
Unencumbered appropriations - June 30, 2007 $ 182,857,095 $ 96,590,091 $ 554,875 $ 97,144,966
Water
112

Wastewater
Capital Normal Oversize SolidProjects Extension Total Connections Waste
$ 215,418,500 $ 2,266,000 $ 217,684,500 $ 67,318,000 $ 24,846,849
$ 179,026,514 $ 1,294,619 $ 180,321,133 $ 35,630,002 $ 23,758,332 28,829,981 398,519 29,228,500 11,529,954 880,000
207,856,495 1,693,138 209,549,633 47,159,956 24,638,332 6,728,380 73,857 6,802,237 2,254,751 6,844,992
201,128,115 1,619,281 202,747,396 44,905,205 17,793,340
97,687,550 519,316 98,206,866 21,983,371 18,910,852 16,382,439 273,039 16,655,478 7,276,537 1,067,615
114,069,989 792,355 114,862,344 29,259,908 19,978,467 6,728,012 96,521 6,824,533 2,252,161 6,810,028
107,341,977 695,834 108,037,811 27,007,747 13,168,439 21,103,498 232,736 21,336,234 5,558,680 787,693
128,445,475 928,570 129,374,045 32,566,427 13,956,132
$ 72,682,640 $ 690,711 $ 73,373,351 $ 12,338,778 $ 3,837,208
Wastewater
113

Anne Arundel County, Maryland
Combining Statement of Net Assets
Internal Service Funds
June 30, 2007
Central GarageSelf Health and Garage
Insurance Insurance Print Shop Transportation Replacement TotalsASSETS
Current assets Cash and investments $ 48,382,230 $ 8,605,876 $ - $ 2,718,481 $ 6,481,166 $ 66,187,753 Receivable 633,899 2,807,702 - - - 3,441,601 Inventories - - - 595,936 - 595,936 Other assets - - - - 641,252 641,252
Total current assets 49,016,129 11,413,578 - 3,314,417 7,122,418 70,866,542
Noncurrent assets
Capital assets Land and buildings - - - 2,073,990 - 2,073,990 Machinery and equipment - - - 578,084 53,391,140 53,969,224
- - - 2,652,074 53,391,140 56,043,214
Less accumulated depreciation - - - (1,842,511) (31,363,471) (33,205,982)
Total capital assets, net of depreciation - - - 809,563 22,027,669 22,837,232
Total noncurrent assets - - - 809,563 22,027,669 22,837,232
Total assets 49,016,129 11,413,578 - 4,123,980 29,150,087 93,703,774
LIABILITIESCurrent liabilities Accrued liabilities 99,041 210,257 - 995,113 1,016,369 2,320,780 Current portion of long-term obligations 10,058,418 4,113,859 - 249,497 - 14,421,774 Deferred revenue - 500,168 - - - 500,168
Total current liabilities 10,157,459 4,824,284 - 1,244,610 1,016,369 17,242,722
Noncurrent liabilities Unpaid claims 36,960,000 - - - - 36,960,000 Accrued liability for compensated absences 13,036 - - 4,263 - 17,299 Total noncurrent liabilities 36,973,036 - - 4,263 - 36,977,299
Total liabilities 47,130,495 4,824,284 - 1,248,873 1,016,369 54,220,021
NET ASSETSInvested in capital assets, net of related debt - - - 809,563 22,027,669 22,837,232 Unrestricted 1,885,634 6,589,294 - 2,065,544 6,106,049 16,646,521 Total net assets $ 1,885,634 $ 6,589,294 $ - $ 2,875,107 $ 28,133,718 $ 39,483,753
114

Anne Arundel County, Maryland
Combining Statement of Revenues, Expenses, and Changes in Fund Net Assets
Internal Service Funds
Year Ended June 30, 2007
Central GarageSelf Health and Garage
Insurance Insurance Print Shop Transportation Replacement Totals
OPERATING REVENUESCharges for services $ 14,580,000 $ - $ - $ 13,780,396 $ 7,213,550 $ 35,573,946 Medical premiums - 67,399,264 - - - 67,399,264 Other - 12,773 - 51,072 849,062 912,907
Total operating revenues 14,580,000 67,412,037 - 13,831,468 8,062,612 103,886,117
OPERATING EXPENSESPersonal services 1,240,560 355,899 - 4,008,839 - 5,605,298 Contractual services 143,092 444,041 57,578 665,704 6,023 1,316,438 Supplies and materials 39,657 20,037 - 114,356 12,870 186,920 Business and travel 12,027 3,776 - 5,441 - 21,244 Cost of goods issued - - - 6,890,367 - 6,890,367 Depreciation - - - 49,117 5,026,100 5,075,217 Provision for claims and estimated losses 15,662,804 62,283,757 - - - 77,946,561 Other - 25,000 - 783,900 - 808,900
Total operating expenses 17,098,140 63,132,510 57,578 12,517,724 5,044,993 97,850,945
Operating income (loss) (2,518,140) 4,279,527 (57,578) 1,313,744 3,017,619 6,035,172
NONOPERATING REVENUESInvestment income 2,861,772 291,654 - - - 3,153,426 Gain on disposal of assets - - - - 190,394 190,394 Net equity transfers between funds - - (99,489) - - (99,489)
Change in net assets 343,632 4,571,181 (157,067) 1,313,744 3,208,013 9,279,503
Net assets, July 1 1,542,002 2,018,113 157,067 1,561,363 24,925,705 30,204,250 Net assets, June 30 $ 1,885,634 $ 6,589,294 $ - $ 2,875,107 $ 28,133,718 $ 39,483,753
115
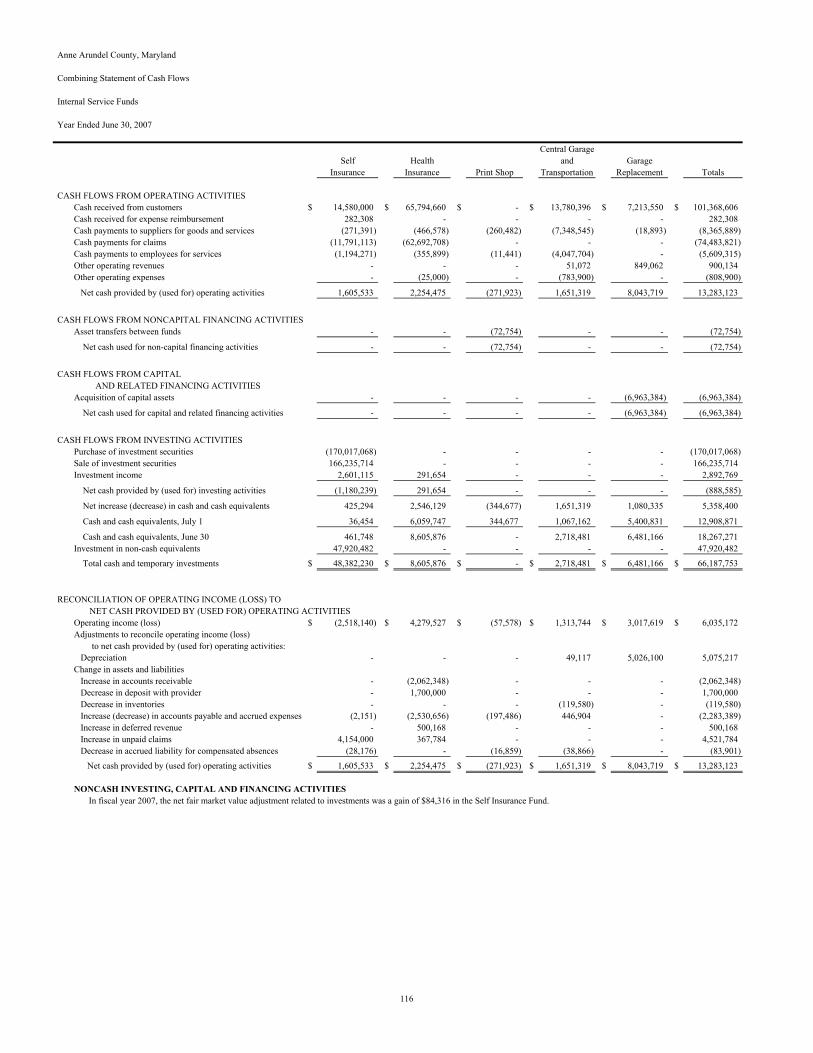
Anne Arundel County, Maryland
Combining Statement of Cash Flows
Internal Service Funds
Year Ended June 30, 2007
Central GarageSelf Health and Garage
Insurance Insurance Print Shop Transportation Replacement Totals
CASH FLOWS FROM OPERATING ACTIVITIESCash received from customers $ 14,580,000 $ 65,794,660 $ - $ 13,780,396 $ 7,213,550 $ 101,368,606 Cash received for expense reimbursement 282,308 - - - - 282,308 Cash payments to suppliers for goods and services (271,391) (466,578) (260,482) (7,348,545) (18,893) (8,365,889) Cash payments for claims (11,791,113) (62,692,708) - - - (74,483,821) Cash payments to employees for services (1,194,271) (355,899) (11,441) (4,047,704) - (5,609,315) Other operating revenues - - - 51,072 849,062 900,134 Other operating expenses - (25,000) - (783,900) - (808,900)
Net cash provided by (used for) operating activities 1,605,533 2,254,475 (271,923) 1,651,319 8,043,719 13,283,123
CASH FLOWS FROM NONCAPITAL FINANCING ACTIVITIESAsset transfers between funds - - (72,754) - - (72,754)
Net cash used for non-capital financing activities - - (72,754) - - (72,754)
CASH FLOWS FROM CAPITAL AND RELATED FINANCING ACTIVITIESAcquisition of capital assets - - - - (6,963,384) (6,963,384)
Net cash used for capital and related financing activities - - - - (6,963,384) (6,963,384)
CASH FLOWS FROM INVESTING ACTIVITIESPurchase of investment securities (170,017,068) - - - - (170,017,068) Sale of investment securities 166,235,714 - - - - 166,235,714 Investment income 2,601,115 291,654 - - - 2,892,769
Net cash provided by (used for) investing activities (1,180,239) 291,654 - - - (888,585)
Net increase (decrease) in cash and cash equivalents 425,294 2,546,129 (344,677) 1,651,319 1,080,335 5,358,400
Cash and cash equivalents, July 1 36,454 6,059,747 344,677 1,067,162 5,400,831 12,908,871
Cash and cash equivalents, June 30 461,748 8,605,876 - 2,718,481 6,481,166 18,267,271 Investment in non-cash equivalents 47,920,482 - - - - 47,920,482
Total cash and temporary investments $ 48,382,230 $ 8,605,876 $ - $ 2,718,481 $ 6,481,166 $ 66,187,753
RECONCILIATION OF OPERATING INCOME (LOSS) TO NET CASH PROVIDED BY (USED FOR) OPERATING ACTIVITIESOperating income (loss) $ (2,518,140) $ 4,279,527 $ (57,578) $ 1,313,744 $ 3,017,619 $ 6,035,172 Adjustments to reconcile operating income (loss) to net cash provided by (used for) operating activities: Depreciation - - - 49,117 5,026,100 5,075,217 Change in assets and liabilities Increase in accounts receivable - (2,062,348) - - - (2,062,348) Decrease in deposit with provider - 1,700,000 - - - 1,700,000 Decrease in inventories - - - (119,580) - (119,580) Increase (decrease) in accounts payable and accrued expenses (2,151) (2,530,656) (197,486) 446,904 - (2,283,389) Increase in deferred revenue - 500,168 - - - 500,168 Increase in unpaid claims 4,154,000 367,784 - - - 4,521,784 Decrease in accrued liability for compensated absences (28,176) - (16,859) (38,866) - (83,901)
Net cash provided by (used for) operating activities $ 1,605,533 $ 2,254,475 $ (271,923) $ 1,651,319 $ 8,043,719 $ 13,283,123
NONCASH INVESTING, CAPITAL AND FINANCING ACTIVITIES In fiscal year 2007, the net fair market value adjustment related to investments was a gain of $84,316 in the Self Insurance Fund.
116

Anne Arundel County, Maryland
Schedule of Revenues, Expenses, and Encumbrances - Budget and Actual (Non-GAAP Basis)
Internal Service Funds
Year Ended June 30, 2007
Original Final VarianceBudget Budget Actual Over (Under)
SELF INSURANCERevenues Charges for services $ 14,580,000 $ 14,580,000 $ 14,580,000 $ - Investment income 1,420,000 1,420,000 2,861,772 1,441,772 Reimbursements 200,000 200,000 282,308 82,308 Other - - 2,264 2,264
16,200,000 16,200,000 17,726,344 1,526,344 Expenses Personal services 1,244,200 1,244,200 1,240,560 (3,640) Contractual services 14,941,500 14,941,500 14,273,327 (668,173) Supplies and materials 20,000 20,000 34,127 14,127 Business and travel 21,800 21,800 12,027 (9,773) Capital outlay 10,000 10,000 5,530 (4,470)
16,237,500 16,237,500 15,565,571 (671,929) Revenues over (under) expenses $ (37,500) $ (37,500) $ 2,160,773 $ 2,198,273
HEALTH INSURANCERevenues Charges for services $ 68,489,900 $ 69,689,900 $ 67,399,264 $ (2,290,636) Investment income - - 291,654 291,654 Other - - 14,660 14,660
68,489,900 69,689,900 67,705,578 (1,984,322) Expenses Medical claim costs 67,816,300 69,016,300 62,283,757 (6,732,543) Personal services 205,200 205,200 355,899 150,699 Contractual services 413,200 413,200 407,788 (5,412) Supplies and materials 24,900 24,900 20,037 (4,863) Business and travel 5,300 5,300 3,776 (1,524) Other 25,000 25,000 25,000 -
68,489,900 69,689,900 63,096,257 (6,593,643) Revenues over (under) expenses $ - $ - $ 4,609,321 $ 4,609,321
PRINT SHOPRevenues Other $ - $ - $ 22,930 $ 22,930
- - 22,930 22,930 Expenses Personal services - - - - Contractual services - - - - Supplies and materials - - - - Capital outlay - - - - Business and travel - - - -
- - - - Revenues over (under) expenses $ - $ - $ 22,930 $ 22,930
Budgeted revenues exclude fund balance appropriated to fund expenditures in the current fiscal year.
117

Anne Arundel County, Maryland
Schedule of Revenues, Expenses, and Encumbrances - Budget and Actual (Non-GAAP Basis)
Internal Service Funds
Year Ended June 30, 2007
Original Final VarianceBudget Budget Actual Over (Under)
CENTRAL GARAGE AND TRANSPORTATION Revenues Charges for services $ 13,322,900 $ 13,322,900 $ 13,780,395 $ 457,495 Other 23,200 23,200 53,384 30,184
13,346,100 13,346,100 13,833,779 487,679 Expenses Personal services 4,202,800 4,202,800 4,008,839 (193,961) Contractual services 667,900 667,900 665,662 (2,238) Supplies and materials 7,640,800 7,640,800 6,981,239 (659,561) Business and travel 16,800 16,800 5,441 (11,359) Capital outlay 33,900 33,900 24,241 (9,659) Other 783,900 783,900 783,900 -
13,346,100 13,346,100 12,469,322 (876,778) Revenues over (under) expenses $ - $ - $ 1,364,457 $ 1,364,457
GARAGE REPLACEMENT FUNDRevenues Charges for services $ 7,405,600 $ 7,405,600 $ 7,213,550 $ (192,050) Other 666,200 666,200 849,062 182,862
8,071,800 8,071,800 8,062,612 (9,188) Expenses Contractual services 5,000 2,500 6,023 3,523 Capital outlay 8,205,600 8,208,100 7,109,979 (1,098,121)
8,210,600 8,210,600 7,116,002 (1,094,598) Revenues over expenses $ (138,800) $ (138,800) $ 946,610 $ 1,085,410
Budgeted revenues exclude fund balance appropriated to fund expenditures in the current fiscal year.
118

119
Fiduciary Pension Trust Funds Defined Benefit Pensions Plans – These funds account for pension investments for the four County single employer pension plans. The four plans are the Employees’ Retirement Plan, Police Service Retirement Plan, Fire Service Retirement Plan, and Detention Officers’ and Deputy Sheriffs’ Retirement Plan. The nature of each plan and the respective terms are described in detail in the footnotes to the basic financial statements. Agency Funds Subdivision Deposits – This fund accounts for amounts placed on deposit from contractors and developers pertaining primarily to road maintenance. Sediment Control – This fund accounts for amounts received from developers as deposits in lieu of performance bonds for construction site sediment control. Recreation – This fund accounts for lease payments from Arundel Golf Park. City and State Tax Collection – This fund accounts for taxes collected for the City of Annapolis and the State of Maryland. These taxes are collected by the County along with County taxes, and are then remitted to the proper jurisdiction. Tax Sale Escrow Deposits – This fund accounts for payments made during the annual tax sale process. Payments received for delinquent property taxes are deposited in the fund and subsequently distributed to the appropriate revenue accounts. Farmington Special Assessment – This fund accounts for the transactions of a special taxing district. Taxes are collected and used to pay the debt for the infrastructure improvements within the district. Dorchester Special Assessment – This fund accounts for the transactions of a special taxing district. Taxes are collected and used to pay the debt for the infrastructure improvements within the district. Medco AA Golf Course Escrow – This fund accounts for the balances in Medco’s trust accounts received at the time of the purchase of Compass Pointe Golf Course. These funds will be used to pay any remaining costs related to 2005 and prior golf course operations. Miscellaneous Escrow Deposits – This fund accounts for any other escrow deposits collected by County departments or agencies that are not in one of the other agency funds. The deposits are held until the depositor meets certain requirements at which time the funds are returned.
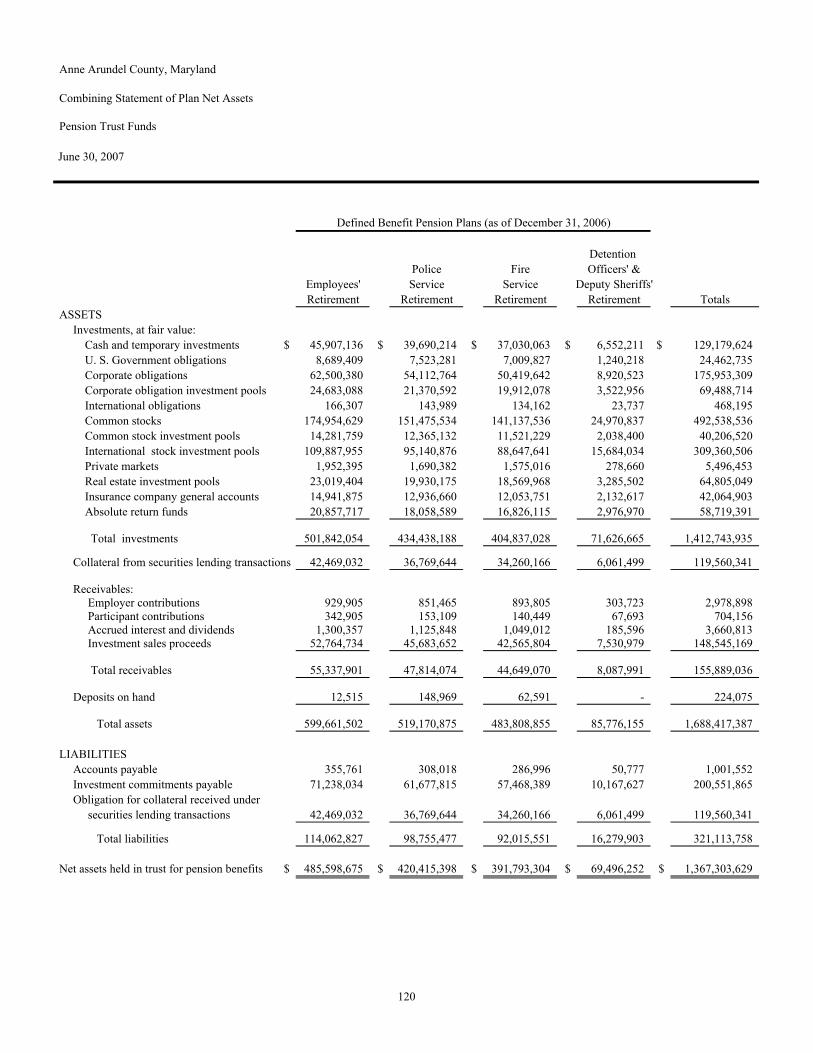
Anne Arundel County, Maryland
Combining Statement of Plan Net Assets
Pension Trust Funds
June 30, 2007
Defined Benefit Pension Plans (as of December 31, 2006)
Detention Police Fire Officers' &
Employees' Service Service Deputy Sheriffs'Retirement Retirement Retirement Retirement Totals
ASSETSInvestments, at fair value: Cash and temporary investments $ 45,907,136 $ 39,690,214 $ 37,030,063 $ 6,552,211 $ 129,179,624 U. S. Government obligations 8,689,409 7,523,281 7,009,827 1,240,218 24,462,735 Corporate obligations 62,500,380 54,112,764 50,419,642 8,920,523 175,953,309 Corporate obligation investment pools 24,683,088 21,370,592 19,912,078 3,522,956 69,488,714 International obligations 166,307 143,989 134,162 23,737 468,195 Common stocks 174,954,629 151,475,534 141,137,536 24,970,837 492,538,536 Common stock investment pools 14,281,759 12,365,132 11,521,229 2,038,400 40,206,520 International stock investment pools 109,887,955 95,140,876 88,647,641 15,684,034 309,360,506 Private markets 1,952,395 1,690,382 1,575,016 278,660 5,496,453 Real estate investment pools 23,019,404 19,930,175 18,569,968 3,285,502 64,805,049 Insurance company general accounts 14,941,875 12,936,660 12,053,751 2,132,617 42,064,903 Absolute return funds 20,857,717 18,058,589 16,826,115 2,976,970 58,719,391
Total investments 501,842,054 434,438,188 404,837,028 71,626,665 1,412,743,935
Collateral from securities lending transactions 42,469,032 36,769,644 34,260,166 6,061,499 119,560,341
Receivables: Employer contributions 929,905 851,465 893,805 303,723 2,978,898 Participant contributions 342,905 153,109 140,449 67,693 704,156 Accrued interest and dividends 1,300,357 1,125,848 1,049,012 185,596 3,660,813 Investment sales proceeds 52,764,734 45,683,652 42,565,804 7,530,979 148,545,169
Total receivables 55,337,901 47,814,074 44,649,070 8,087,991 155,889,036
Deposits on hand 12,515 148,969 62,591 - 224,075
Total assets 599,661,502 519,170,875 483,808,855 85,776,155 1,688,417,387
LIABILITIESAccounts payable 355,761 308,018 286,996 50,777 1,001,552 Investment commitments payable 71,238,034 61,677,815 57,468,389 10,167,627 200,551,865 Obligation for collateral received under securities lending transactions 42,469,032 36,769,644 34,260,166 6,061,499 119,560,341
Total liabilities 114,062,827 98,755,477 92,015,551 16,279,903 321,113,758
Net assets held in trust for pension benefits $ 485,598,675 $ 420,415,398 $ 391,793,304 $ 69,496,252 $ 1,367,303,629
120

Anne Arundel County, Maryland
Combining Statement of Changes in Net Assets
Pension Trust Funds
For the Year Ended June 30, 2007
Defined Benefit Pension Trust (as of December 31, 2006)
Detention Police Fire Officers' &
Employees' Service Service Deputy Sheriffs'Retirement Retirement Retirement Retirement Totals
ADDITIONSContributions: Employer $ 10,755,168 $ 9,611,544 $ 10,481,244 $ 3,462,366 $ 34,310,322 Participant 4,376,510 1,925,644 1,741,476 860,542 8,904,172
Total contributions 15,131,678 11,537,188 12,222,720 4,322,908 43,214,494
Investment income: Net appreciation in fair value of investments 40,163,069 34,763,472 32,346,289 5,628,823 112,901,653 Interest income 7,618,363 6,596,686 6,147,919 1,065,288 21,428,256 Dividend income 9,767,449 8,458,710 7,888,657 1,376,344 27,491,160
Total investment income 57,548,881 49,818,868 46,382,865 8,070,455 161,821,069
Less investment expense (1,879,212) (1,627,140) (1,510,805) (265,811) (5,282,968)
Net income from investing activities 55,669,669 48,191,728 44,872,060 7,804,644 156,538,101
Securities lending activities: Securities lending income 2,018,460 1,747,785 1,629,456 282,839 5,678,540 Securities lending expenses: Borrower rebates 1,918,157 1,660,934 1,548,484 268,784 5,396,359 Management fees 30,119 26,080 24,315 4,220 84,734
Securities lending expense 1,948,276 1,687,014 1,572,799 273,004 5,481,093
Securities lending net income 70,184 60,771 56,657 9,835 197,447
Total net investment income 55,739,853 48,252,499 44,928,717 7,814,479 156,735,548
Total additions 70,871,531 59,789,687 57,151,437 12,137,387 199,950,042
DEDUCTIONS Participant benefit payments and refunds 19,733,152 15,638,571 15,570,004 2,112,241 53,053,968 Administrative expenses 508,917 431,925 416,838 71,158 1,428,838
Total deductions 20,242,069 16,070,496 15,986,842 2,183,399 54,482,806
Net increases 50,629,462 43,719,191 41,164,595 9,953,988 145,467,236 Net assets, beginning of year 434,969,213 376,696,207 350,628,709 59,542,264 1,221,836,393
Net assets, end of year $ 485,598,675 $ 420,415,398 $ 391,793,304 $ 69,496,252 $ 1,367,303,629
121
Anne Arundel County, Maryland
Combining Statement of Changes in Assets and Liabilities
All Agency Funds
Year Ended June 30, 2007
Balance BalanceJune 30, 2006 Additions Deductions June 30, 2007
SUBDIVISION DEPOSITSAssets Cash $ 2,072,584 $ 235,451 $ 647,542 $ 1,660,493 Total Assets $ 2,072,584 $ 235,451 $ 647,542 $ 1,660,493
Liabilities Escrow Deposits $ 2,072,584 $ 235,451 $ 647,542 $ 1,660,493 Total Liabilities $ 2,072,584 $ 235,451 $ 647,542 $ 1,660,493
SEDIMENT CONTROLAssets Cash $ 5,128,585 $ 1,156,271 $ 1,700,575 $ 4,584,281 Total Assets $ 5,128,585 $ 1,156,271 $ 1,700,575 $ 4,584,281
Liabilities Escrow and other deposits $ 5,128,585 $ 1,156,271 $ 1,700,575 $ 4,584,281 Total Liabilities $ 5,128,585 $ 1,156,271 $ 1,700,575 $ 4,584,281
RECREATIONAssets Cash $ 426,724 $ 78,891 $ - $ 505,615 Total Assets $ 426,724 $ 78,891 $ - $ 505,615
Liabilities Deposits $ 426,724 $ 78,891 $ - $ 505,615 Total Liabilities $ 426,724 $ 78,891 $ - $ 505,615
CITY AND STATE TAX COLLECTIONAssets Cash $ 2,172,243 $ 8,955,460 $ 9,007,042 $ 2,120,661 Total Assets $ 2,172,243 $ 8,955,460 $ 9,007,042 $ 2,120,661
Liabilities Escrow Deposits $ 2,172,243 $ 8,955,460 $ 9,007,042 $ 2,120,661 Total Liabilities $ 2,172,243 $ 8,955,460 $ 9,007,042 $ 2,120,661
TAX SALE ESCROW DEPOSITSAssets Cash $ 8,210,973 $ 8,626,660 $ 8,358,706 $ 8,478,927 Total Assets $ 8,210,973 $ 8,626,660 $ 8,358,706 $ 8,478,927
Liabilities Escrow Deposits $ 8,210,973 $ 8,626,660 $ 8,358,706 $ 8,478,927 Total Liabilities $ 8,210,973 $ 8,626,660 $ 8,358,706 $ 8,478,927
122

Anne Arundel County, Maryland
Combining Statement of Changes in Assets and Liabilities
All Agency Funds
Year Ended June 30, 2007
Balance BalanceJune 30, 2006 Additions Deductions June 30, 2007
FARMINGTON SPECIAL ASSESSMENTAssets Investments $ 797,544 $ 940,505 $ 932,996 $ 805,053 Total Assets $ 797,544 $ 940,505 $ 932,996 $ 805,053
Liabilities Escrow Deposits $ 797,544 $ 940,505 $ 932,996 $ 805,053 Total Liabilities $ 797,544 $ 940,505 $ 932,996 $ 805,053
DORCHESTER SPECIAL TAX DISTRICTAssets Investments $ 2,192,091 $ 2,905,250 $ 2,891,047 $ 2,206,294 Total Assets $ 2,192,091 $ 2,905,250 $ 2,891,047 $ 2,206,294
Liabilities Escrow Deposits $ 2,192,091 $ 2,905,250 $ 2,891,047 $ 2,206,294 Total Liabilities $ 2,192,091 $ 2,905,250 $ 2,891,047 $ 2,206,294
MEDCO AA GOLF PROJECT ESCROWAssets Investments $ 881,146 $ 16,192 $ 897,338 $ - Total Assets $ 881,146 $ 16,192 $ 897,338 $ -
Liabilities Escrow Deposits $ 881,146 $ 16,192 $ 897,338 $ - Total Liabilities $ 881,146 $ 16,192 $ 897,338 $ -
MISCELLANEOUS ESCROW DEPOSITSAssets Cash $ 233,620 $ 60,849 $ 109,293 $ 185,176 Total Assets $ 233,620 $ 60,849 $ 109,293 $ 185,176
Liabilities Escrow and other deposits $ 233,620 $ 60,849 $ 109,293 $ 185,176 Total Liabilities $ 233,620 $ 60,849 $ 109,293 $ 185,176
TOTALS - ALL FUNDSAssets Cash and investments $ 22,115,510 $ 22,975,529 $ 24,544,539 $ 20,546,500 Total Assets $ 22,115,510 $ 22,975,529 $ 24,544,539 $ 20,546,500
Liabilities Escrow and other deposits $ 22,115,510 $ 22,975,529 $ 24,544,539 $ 20,546,500 Total Liabilities $ 22,115,510 $ 22,975,529 $ 24,544,539 $ 20,546,500
123
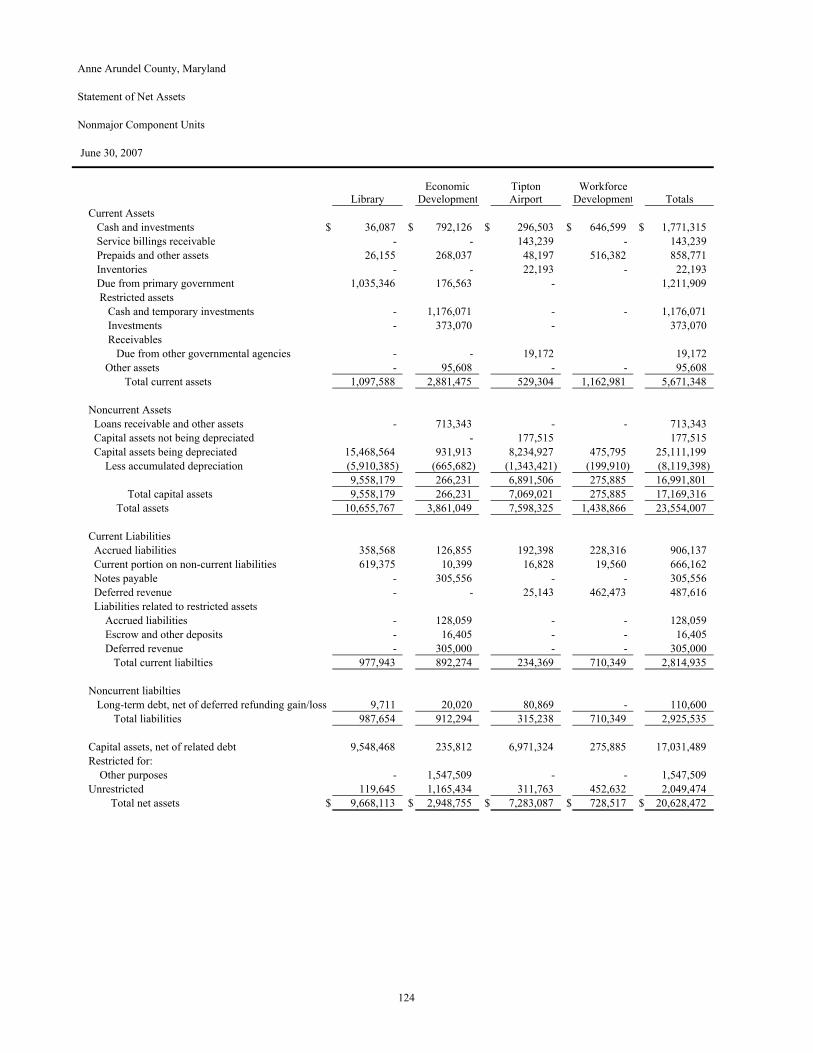
Anne Arundel County, Maryland
Statement of Net Assets
Nonmajor Component Units
June 30, 2007
Economic Tipton WorkforceLibrary Development Airport Development Totals
Current Assets Cash and investments $ 36,087 $ 792,126 $ 296,503 $ 646,599 $ 1,771,315 Service billings receivable - - 143,239 - 143,239 Prepaids and other assets 26,155 268,037 48,197 516,382 858,771 Inventories - - 22,193 - 22,193 Due from primary government 1,035,346 176,563 - 1,211,909 Restricted assets Cash and temporary investments - 1,176,071 - - 1,176,071 Investments - 373,070 - 373,070 Receivables Due from other governmental agencies - - 19,172 19,172 Other assets - 95,608 - - 95,608 Total current assets 1,097,588 2,881,475 529,304 1,162,981 5,671,348
Noncurrent Assets Loans receivable and other assets - 713,343 - - 713,343 Capital assets not being depreciated - 177,515 177,515 Capital assets being depreciated 15,468,564 931,913 8,234,927 475,795 25,111,199 Less accumulated depreciation (5,910,385) (665,682) (1,343,421) (199,910) (8,119,398)
9,558,179 266,231 6,891,506 275,885 16,991,801 Total capital assets 9,558,179 266,231 7,069,021 275,885 17,169,316 Total assets 10,655,767 3,861,049 7,598,325 1,438,866 23,554,007
Current Liabilities Accrued liabilities 358,568 126,855 192,398 228,316 906,137 Current portion on non-current liabilities 619,375 10,399 16,828 19,560 666,162 Notes payable - 305,556 - - 305,556 Deferred revenue - - 25,143 462,473 487,616 Liabilities related to restricted assets Accrued liabilities - 128,059 - - 128,059 Escrow and other deposits - 16,405 - - 16,405 Deferred revenue - 305,000 - - 305,000 Total current liabilties 977,943 892,274 234,369 710,349 2,814,935
Noncurrent liabilties Long-term debt, net of deferred refunding gain/loss 9,711 20,020 80,869 - 110,600 Total liabilities 987,654 912,294 315,238 710,349 2,925,535
Capital assets, net of related debt 9,548,468 235,812 6,971,324 275,885 17,031,489 Restricted for: Other purposes - 1,547,509 - - 1,547,509 Unrestricted 119,645 1,165,434 311,763 452,632 2,049,474 Total net assets $ 9,668,113 $ 2,948,755 $ 7,283,087 $ 728,517 $ 20,628,472
124

125
(This page left blank intentionally)

Anne Arundel County, Maryland
Statement of Activities
Nonmajor Component Units
Year Ended June 30, 2007
Program RevenuesOperating Capital
Charges for Grants and Grants and Expenses Services Contributions Contributions
Library Community services $ 20,357,618 $ 702,530 $ 2,813,439 $ 2,608,891
Economic Development Arundel Business Loan Program 352,698 91,463 150,000 - Training and other grants 446,797 - 800,000 - Chesapeake Innovation Center 1,131,493 537,420 498,000 - Administrative 1,873,096 - - - Unallocated depreciation 93,640 - - -
3,897,724 628,883 1,448,000 -
Tipton Airport Authority Airport Operations 1,798,873 1,596,921 - 125,197
Workforce Development Workforce development programs Adult Services 381,963 - 381,963 - Dislocated worker services 169,057 - 169,057 - Youth services 212,540 - 212,540 - Other WIA Programs 786,789 - 786,789 - Administration 118,979 - 118,979 - Other grants, projects, initiatives 1,091,869 - 1,048,170 -
2,761,197 - 2,717,498 -
General revenues: Unrestricted contributions Hotel tax Interest earnings Miscellaneous
Total general revenues
Changes in net assets
Net assets, July 1
Net assets, June 30
126

Net (Expense) Revenues and Changes in Net Assets
Economic Tipton WorkforceLibrary Development Airport Development Total
$ (14,232,758) $ - $ - $ - $ (14,232,758)
- (111,235) - - (111,235) - 353,203 - - 353,203 - (96,073) - - (96,073) - (1,873,096) - - (1,873,096) - (93,640) - - (93,640) - (1,820,841) - - (1,820,841)
- - (76,755) - (76,755)
- - - - - - - - - - - - - - - - - - - - - - - - - - - - (43,699) (43,699) - - - (43,699) (43,699)
13,661,000 774,725 - 11,002 14,446,727 - 971,098 - - 971,098 - 155,262 4,951 20,811 181,024
52,286 226,608 - - 278,894 13,713,286 2,127,693 4,951 31,813 15,877,743
(519,472) 306,852 (71,804) (11,886) (296,310)
10,187,585 2,641,903 7,354,891 740,403 20,924,782
$ 9,668,113 $ 2,948,755 $ 7,283,087 $ 728,517 $ 20,628,472
127

Anne Arundel County, Maryland
Balance Sheet
Library Component Unit
June 30, 2007
Governmental Fund Types
DedicatedOperating Revenue
Fund Fund TotalASSETS
Cash and investments $ 10,806 $ 25,281 $ 36,087 Due from primary government 1,005,763 29,583 1,035,346 Receivables 26,155 - 26,155 Total assets $ 1,042,724 $ 54,864 $ 1,097,588
LIABILITIESAccrued liabilities $ 354,970 $ 3,598 $ 358,568 Total liabilities 354,970 3,598 358,568
FUND BALANCESReserved Encumbrances 320,834 5,100 325,934 Unreserved Undesignated 366,920 46,166 413,086 Total fund balances 687,754 51,266 739,020 Total liabilities and fund balances $ 1,042,724 $ 54,864 $ 1,097,588
128

Anne Arundel County, Maryland
Statement of Revenues, Expenditures, and Changes in Fund Balances
Library Component Unit
Year Ended June 30, 2007
Governmental Fund Types
DedicatedOperating Revenue
Fund Fund Total
REVENUESGrants and aid $ 16,375,521 $ 98,917 $ 16,474,438 Fines and fees 702,530 - 702,530 Other 31,791 20,495 52,286 Total revenues 17,109,842 119,412 17,229,254
EXPENDITURESCurrent Recreation and community services 16,929,741 110,223 17,039,964 Capital outlay 479,569 678 480,247 Total expenditures 17,409,310 110,901 17,520,211 Revenues over expenditures (299,468) 8,511 (290,957)
Fund balances, July 1 987,222 42,755 1,029,977 Fund balances, June 30 $ 687,754 $ 51,266 $ 739,020
129

Anne Arundel County, Maryland
Statement of Revenues, Expenditures, and Changes in Fund Balances - Budget and Actual (Non-GAAP Basis)
Library Component Unit - General Fund
Year Ended June 30, 2007
Original Final VarianceBudget Budget Actual Over (under)
REVENUESGrants and aid $ 1,843,800 $ 1,843,800 $ 1,843,817 $ 17 Primary government contribution 13,661,000 13,661,000 13,661,000 - Fines and fees 759,000 759,000 702,530 (56,470) Other 69,000 69,000 233,083 164,083 Total revenues 16,332,800 16,332,800 16,440,430 107,630
EXPENDITURESCurrent Recreation and community services 15,882,400 15,882,400 15,780,257 (102,143) Capital outlay 450,400 450,400 430,531 (19,869) Total expenditures 16,332,800 16,332,800 16,210,788 (122,012) Revenues over (under) expenditures - - 229,642 $ 229,642 Fund balances, budgetary, July 1 137,277 137,277 137,277 Fund balances, budgetary, June 30 $ 137,277 $ 137,277 $ 366,919
130

131
(This page left blank intentionally)
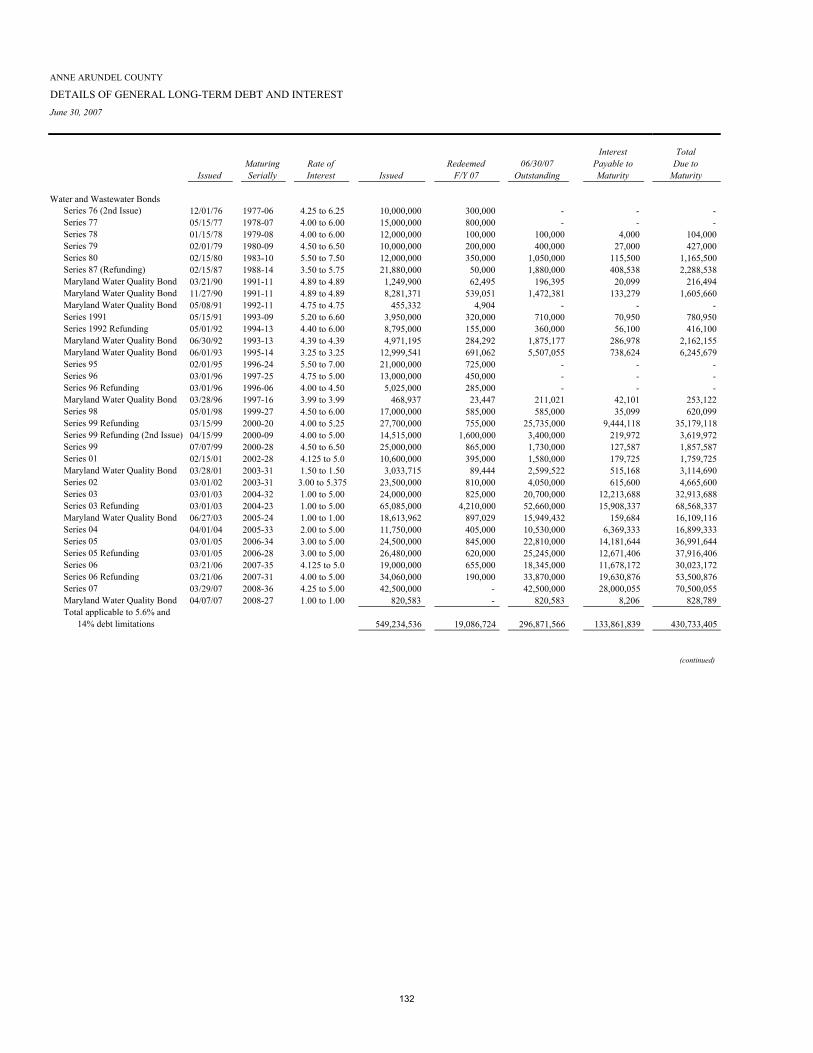
ANNE ARUNDEL COUNTY
DETAILS OF GENERAL LONG-TERM DEBT AND INTERESTJune 30, 2007
Interest TotalMaturing Rate of Redeemed 06/30/07 Payable to Due to
Issued Serially Interest Issued F/Y 07 Outstanding Maturity Maturity
Water and Wastewater BondsSeries 76 (2nd Issue) 12/01/76 1977-06 4.25 to 6.25 10,000,000 300,000 - - - Series 77 05/15/77 1978-07 4.00 to 6.00 15,000,000 800,000 - - - Series 78 01/15/78 1979-08 4.00 to 6.00 12,000,000 100,000 100,000 4,000 104,000 Series 79 02/01/79 1980-09 4.50 to 6.50 10,000,000 200,000 400,000 27,000 427,000 Series 80 02/15/80 1983-10 5.50 to 7.50 12,000,000 350,000 1,050,000 115,500 1,165,500 Series 87 (Refunding) 02/15/87 1988-14 3.50 to 5.75 21,880,000 50,000 1,880,000 408,538 2,288,538 Maryland Water Quality Bond 03/21/90 1991-11 4.89 to 4.89 1,249,900 62,495 196,395 20,099 216,494 Maryland Water Quality Bond 11/27/90 1991-11 4.89 to 4.89 8,281,371 539,051 1,472,381 133,279 1,605,660 Maryland Water Quality Bond 05/08/91 1992-11 4.75 to 4.75 455,332 4,904 - - - Series 1991 05/15/91 1993-09 5.20 to 6.60 3,950,000 320,000 710,000 70,950 780,950 Series 1992 Refunding 05/01/92 1994-13 4.40 to 6.00 8,795,000 155,000 360,000 56,100 416,100 Maryland Water Quality Bond 06/30/92 1993-13 4.39 to 4.39 4,971,195 284,292 1,875,177 286,978 2,162,155 Maryland Water Quality Bond 06/01/93 1995-14 3.25 to 3.25 12,999,541 691,062 5,507,055 738,624 6,245,679 Series 95 02/01/95 1996-24 5.50 to 7.00 21,000,000 725,000 - - - Series 96 03/01/96 1997-25 4.75 to 5.00 13,000,000 450,000 - - - Series 96 Refunding 03/01/96 1996-06 4.00 to 4.50 5,025,000 285,000 - - - Maryland Water Quality Bond 03/28/96 1997-16 3.99 to 3.99 468,937 23,447 211,021 42,101 253,122 Series 98 05/01/98 1999-27 4.50 to 6.00 17,000,000 585,000 585,000 35,099 620,099 Series 99 Refunding 03/15/99 2000-20 4.00 to 5.25 27,700,000 755,000 25,735,000 9,444,118 35,179,118 Series 99 Refunding (2nd Issue) 04/15/99 2000-09 4.00 to 5.00 14,515,000 1,600,000 3,400,000 219,972 3,619,972 Series 99 07/07/99 2000-28 4.50 to 6.50 25,000,000 865,000 1,730,000 127,587 1,857,587 Series 01 02/15/01 2002-28 4.125 to 5.0 10,600,000 395,000 1,580,000 179,725 1,759,725 Maryland Water Quality Bond 03/28/01 2003-31 1.50 to 1.50 3,033,715 89,444 2,599,522 515,168 3,114,690 Series 02 03/01/02 2003-31 3.00 to 5.375 23,500,000 810,000 4,050,000 615,600 4,665,600 Series 03 03/01/03 2004-32 1.00 to 5.00 24,000,000 825,000 20,700,000 12,213,688 32,913,688 Series 03 Refunding 03/01/03 2004-23 1.00 to 5.00 65,085,000 4,210,000 52,660,000 15,908,337 68,568,337 Maryland Water Quality Bond 06/27/03 2005-24 1.00 to 1.00 18,613,962 897,029 15,949,432 159,684 16,109,116 Series 04 04/01/04 2005-33 2.00 to 5.00 11,750,000 405,000 10,530,000 6,369,333 16,899,333 Series 05 03/01/05 2006-34 3.00 to 5.00 24,500,000 845,000 22,810,000 14,181,644 36,991,644 Series 05 Refunding 03/01/05 2006-28 3.00 to 5.00 26,480,000 620,000 25,245,000 12,671,406 37,916,406 Series 06 03/21/06 2007-35 4.125 to 5.0 19,000,000 655,000 18,345,000 11,678,172 30,023,172 Series 06 Refunding 03/21/06 2007-31 4.00 to 5.00 34,060,000 190,000 33,870,000 19,630,876 53,500,876 Series 07 03/29/07 2008-36 4.25 to 5.00 42,500,000 - 42,500,000 28,000,055 70,500,055 Maryland Water Quality Bond 04/07/07 2008-27 1.00 to 1.00 820,583 - 820,583 8,206 828,789 Total applicable to 5.6% and 14% debt limitations 549,234,536 19,086,724 296,871,566 133,861,839 430,733,405
(continued)
132

DETAILS OF GENERAL LONG-TERM DEBT AND INTEREST (continued)
June 30, 2007
Interest TotalMaturing Rate of Redeemed 06/30/07 Payable to Due to
Issued Serially Interest Issued F/Y 07 Outstanding Maturity Maturity
Consolidated General Improvements 02/01/95 1996-24 5.50 to 7.00 65,900,000 2,510,000 - - - Bonds 08/01/95 1996-11 4.00 to 5.38 66,745,000 6,841,000 13,359,000 1,379,755 14,738,755
03/01/96 1997-25 4.75 to 6.00 48,270,000 2,660,000 - - - 05/01/98 1999-27 4.50 to 6.00 67,000,000 3,460,000 3,460,000 207,600 3,667,600 03/15/99 2000-20 4.00 to 5.25 50,060,000 2,075,000 42,395,000 10,941,175 53,336,175 07/07/99 2000-19 4.50 to 6.50 58,000,000 3,480,000 6,960,000 513,300 7,473,300 02/15/01 2002-20 4.125 to 5.0 47,000,000 3,000,000 11,000,000 1,195,000 12,195,000 03/01/02 2003-22 3.00 to 5.375 91,500,000 5,490,000 27,450,000 4,172,400 31,622,400 03/01/03 2004-23 1.00 to 5.00 101,000,000 6,060,000 76,760,000 26,800,350 103,560,350 03/01/03 2005-14 1.00 to 5.00 21,510,000 1,330,000 18,835,000 3,752,250 22,587,250 04/01/04 2005-24 2.00 to 5.00 49,500,000 2,970,000 40,590,000 14,883,165 55,473,165 03/01/05 2006-25 3.00 to 5.00 55,000,000 3,313,439 48,373,123 18,861,724 67,234,847 03/01/05 2006-26 3.00 to 5.00 46,625,000 1,470,000 43,630,000 14,659,549 58,289,549 06/30/05 2007-28 3.00 to 5.00 24,530,000 10,000 24,520,000 13,996,394 38,516,394 03/21/06 2007-26 4.00 to 5.00 64,000,000 3,236,199 60,763,801 27,039,429 87,803,230 03/21/06 2007-27 4.00 to 5.00 87,115,000 430,000 86,685,000 37,802,169 124,487,169 03/29/07 2008-27 4.25 to 5.00 92,400,000 - 92,400,000 40,366,724 132,766,724
1,036,155,000 48,335,638 597,180,924 216,570,984 813,751,908
Solid Waste Bonds 07/15/93 1994-08 4.63 to 5.13 10,000,000 670,000 1,340,000 68,675 1,408,675 02/01/94 1995-08 4.40 to 4.80 16,000,000 1,140,000 1,140,000 54,720 1,194,720 08/01/95 1996-10 4.00 to 5.30 2,060,000 119,000 701,000 81,496 782,496 03/01/96 1997-16 5.00 to 5.50 12,000,000 600,000 6,000,000 1,611,300 7,611,300 05/01/98 1999-17 4.65 to 6.00 7,000,000 350,000 3,850,000 1,189,300 5,039,300 04/01/04 2005-24 2.00 to 5.00 1,250,000 75,000 1,025,000 375,838 1,400,838 03/01/05 2006-24 3.00 to 5.00 1,000,000 46,561 906,878 368,676 1,275,554 03/21/06 2007-26 4.00 to 5.00 2,000,000 63,801 1,936,199 951,997 2,888,196 03/29/07 2008-27 4.25 to 5.00 3,500,000 - 3,500,000 1,745,160 5,245,160
Total Waste Collection Enterprise Fund 54,810,000 3,064,362 20,399,077 6,447,162 26,846,239 Total applicable to 5.2% and 13% debt limitations 1,090,965,000 51,400,000 617,580,001 223,018,146 840,598,147
133

DETAILS OF GENERAL LONG-TERM DEBT AND INTEREST (continued)
June 30, 2007
Interest TotalMaturing Rate of Redeemed 06/30/07 Payable to Due to
Issued Serially Interest Issued F/Y 07 Outstanding Maturity Maturity
Installment Purchase Agreements - Agricultural Easement ProgramAdelaide F. Colhoun Trust 09/19/00 2002-30 5.85 to 5.85 401,000 1,000 395,000 516,672 911,672 Ellen H. Shepard Trust 09/22/00 2002-30 5.85 to 5.85 161,000 1,000 155,000 193,754 348,754 Harold & Jean Touchette 09/19/00 2002-30 5.85 to 5.85 378,000 1,000 372,000 485,726 857,726 Farm of the Four Winds, LLC 11/13/00 2002-30 6.00 to 6.00 587,000 1,000 581,000 786,600 1,367,600 Kenneth P. Franklin, Trustee 12/28/00 2002-30 5.60 to 5.60 142,055 1,000 136,000 161,000 297,000 Richard F. Moreland 07/18/01 2003-28 5.90 to 5.90 274,000 1,000 269,000 320,901 589,901 Mary M. Smith 07/18/01 2003-28 5.90 to 5.90 831,000 1,000 826,000 1,011,024 1,837,024 Francis R. Windsor 07/26/01 2003-28 5.90 to 5.90 411,174 1,000 406,000 490,644 896,644 Anita Froe/Rian LLC 03/06/02 2003-28 5.90 to 5.90 657,000 1,000 652,000 795,437 1,447,437 Lauer & Company 09/20/02 2004-28 5.25 to 5.25 197,000 1,000 193,000 201,758 394,758 Weeems Dodd Ltd 10/17/02 2004-28 5.45 to 5.45 1,521,000 1,000 1,517,000 1,724,761 3,241,761 Edward Hall III 12/19/02 2004-28 5.55 to 5.55 180,000 1,000 176,000 193,473 369,473 Bristol Farms LLC 01/28/03 2004-28 5.50 to 5.50 700,000 1,000 696,000 785,127 1,481,127 Shearman Talbott 05/22/03 2005-28 4.95 to 4.95 263,948 1,000 261,000 260,916 521,916 Anne Brice 06/23/04 2006-28 5.80 to 5.80 316,000 1,000 314,000 370,272 684,272 Thackray Seznec 06/30/04 2006-28 5.80 to 5.80 1,405,000 1,000 1,403,000 1,696,674 3,099,674 James Parks 07/07/04 2006-28 5.60 to 5.60 295,000 1,000 293,000 332,808 625,808 Dorothy Horky 12/05/05 2006-28 4.90 to 4.90 368,814 814 368,000 368,382 736,382 Virginia Tucker 10/05/06 2007-28 4.90 to 4.90 926,000 - 926,000 942,564 1,868,564
10,014,991 17,814 9,939,000 11,638,493 21,577,493 Tax Increment Bonds
Parole Town Center 07/12/02 2003-12 5.00 to 5.00 8,300,000 765,000 5,455,000 857,624 6,312,624 Arundel Mills Refunding 05/11/04 2010-29 3.00 to 5.125 30,350,000 - 30,350,000 23,162,836 53,512,836 National Business Park Ref 05/11/04 2009-28 3.00 to 5.125 15,655,000 - 15,655,000 11,006,476 26,661,476 West Nursery Road 05/11/04 2006-29 2.00 to 4.70 2,570,000 70,000 2,500,000 1,446,461 3,946,461
56,875,000 835,000 53,960,000 36,473,397 90,433,397
Federal Loans Section 108 09/14/06 2007-11 4.96 to 5.77 1,640,000 - 1,640,000 245,877 1,885,877 State LoansDepartment of Natural Resources
Annapolis Cove 09/16/88 1989-13 0.00 121,220 4,849 33,941 - 33,941 Annapolis Landing 07/21/92 1993-17 0.00 78,570 3,142 34,572 - 34,572 Annapolis Landing 05/03/95 1995-09 0.00 68,075 4,538 18,156 - 18,156 Arundel on the Bay 44-76 08/25/81 1983-07 0.00 200,000 8,000 8,000 - 8,000 Arundel on the Bay 44-76B 07/20/83 1984-08 0.00 247,833 9,913 19,829 - 19,829 Arundel on the Bay 04/28/92 1993-17 0.00 74,220 2,969 32,657 - 32,657 Bay Ridge 11/19/90 1992-16 0.00 669,275 26,771 267,709 - 267,709 Brown's Pond 11/25/91 1992-16 0.00 185,128 7,045 74,410 - 74,410 Buckingham Cove 04/07/97 1997-21 0.00 217,570 8,703 130,540 - 130,540 Camp Wabanna SECD 04/26/05 2011-31 0.00 6,490 - 6,490 - 6,490 Cape Anne SECD 11/30/06 2008-33 0.00 190,308 - 190,308 - 190,308 Cattail Creek 04/03/98 1998-22 0.00 127,628 5,105 81,683 - 81,683 Elizabeth's Landing 09/26/91 1993-17 0.00 161,310 6,452 70,980 - 70,980 Elizabeth's Landing 05/15/95 1996-10 0.00 153,764 10,251 41,003 - 41,003 John's Creek 12/15/93 1994-19 0.00 173,206 6,920 83,040 - 83,040 Holland Point SECD 10/11/04 2011-31 0.00 5,125 - 5,125 - 5,125 Lake Hillsmere 04/08/82 1983-08 0.00 85,950 3,438 3,438 - 3,438 Lake Hillsmere II 04/03/98 1998-22 0.00 188,660 7,546 120,736 - 120,736 Lake Placid 12/04/81 1983-07 0.00 188,355 7,534 7,536 - 7,536 Pine Grove Village 05/03/95 1996-10 0.00 37,689 2,513 10,045 - 10,045 Mason's Beach 06/03/96 1997-06 0.00 277,098 13,855 138,548 - 138,548 Romar Estates 03/27/97 1997-21 0.00 304,987 12,199 182,989 - 182,989 Snug Harbor 05/13/83 1984-09 0.00 230,294 9,212 18,421 - 18,421 Snug Harbor 11/21/91 1992-16 0.00 738,599 29,544 295,440 - 295,440 Snug Harbor Pier 04/13/92 1992-16 0.00 91,443 3,656 36,560 - 36,560 Snug Harbor SECD 10/11/04 2011-31 0.00 6,950 - 6,950 - 6,950 Spriggs Pond 02/28/92 1993-17 0.00 298,400 11,936 119,358 - 119,358 Whitehall Cove 12/19/01 2001-25 0.00 164,134 6,565 124,744 - 124,744 Total not applicable to debt limitations 6,932,281 212,657 3,803,208 245,877 4,049,085
Total long-term debt $ 1,714,021,808 71,552,195 $ 982,153,775 $ 405,237,752 $ 1,387,391,527
134

135
(This page left blank intentionally)

ANNE ARUNDEL COUNTY
SCHEDULE OF DEBT SERVICE REQUIREMENTS FOR LONG-TERM DEBT AND INTEREST
As of June 30, 2007
General County Bonds (a)General Government Solid Waste
Principal Interest Principal Interest Principal Interest Principal InterestFISCAL YEARENDING2008 $ 51,932,017 $ 27,711,298 $ 3,167,983 $ 972,927 $ 875,000 $ 2,612,666 $ 19,000 $ 556,269 2009 49,481,016 25,480,014 2,298,984 830,039 915,000 2,570,166 19,000 555,205 2010 46,871,142 23,129,575 1,503,858 731,004 1,150,000 2,522,457 19,000 554,141 2011 44,538,229 20,845,498 1,291,771 654,844 1,690,000 2,461,848 19,000 553,077 2012 43,231,628 18,716,752 1,363,372 589,272 2,175,000 2,381,943 19,000 552,012 2013 41,426,628 16,660,971 1,363,372 519,646 2,340,000 2,284,268 19,000 550,948 2014 37,796,628 14,664,614 1,363,372 448,677 1,430,000 2,199,210 19,000 549,885 2015 34,107,588 12,804,233 1,357,412 377,234 1,580,000 2,131,383 19,000 548,820 2016 32,972,395 11,123,291 1,367,605 305,613 1,720,000 2,057,808 19,000 547,757 2017 31,201,038 9,543,234 1,773,962 233,183 1,875,000 1,977,473 19,000 546,693 2018 27,857,838 8,048,057 397,162 156,385 2,035,000 1,889,985 19,000 545,628 2019 26,072,838 6,767,673 397,162 137,543 2,205,000 1,788,469 19,000 544,565 2020 23,777,838 5,660,931 397,162 119,830 2,395,000 1,671,605 19,000 543,500 2021 21,807,838 4,644,383 397,162 103,077 2,600,000 1,544,548 19,000 542,437 2022 21,847,838 3,650,496 397,162 85,329 2,820,000 1,406,531 19,000 541,373 2023 18,302,838 2,709,195 397,162 68,592 3,055,000 1,256,776 19,000 540,308 2024 14,287,838 1,910,881 397,162 51,231 3,290,000 1,094,888 19,000 539,245 2025 12,389,518 1,293,473 295,482 33,871 3,550,000 920,218 19,000 538,182 2026 9,399,512 776,375 295,488 20,932 3,825,000 731,859 19,000 537,116 2027 6,053,719 354,760 176,282 7,933 4,110,000 529,237 19,000 536,052 2028 1,825,000 75,280 - - 4,410,000 311,650 8,025,000 534,988 2029 - - - - 3,335,000 113,959 5,000 90,292 2030 - - - - 580,000 14,450 1,529,000 90,000 2031 - - - - - - - - 2032 - - - - - - - - 2033 - - - - - - - - 2034 - - - - - - - - 2035 - - - - - - - - 2036 - - - - - - - - 2037 - - - - - - - -
$ 597,180,924 $ 216,570,984 $ 20,399,077 $ 6,447,162 $ 53,960,000 $ 36,473,397 $ 9,939,000 $ 11,638,493
Notes: (a)
(b) The Highway Construction advance from the State of Maryland does not impose a requirement on the County to levy taxes. Thisadvance is retired by revenues collected by the State which would otherwise be remitted to the County.
(c) Bonded debt subject to (1) 5.6% of the assessable basis of real property in the Sanitary District of Anne Arundel County; (2) 14% of the assesable basis of personal property in the Sanitary District of Anne Arundel County; and (3) 14% of the operating real property described in section 8-109(c) of the Tax-Property Article of he Annotated Code of Maryland (1994 replacement Volume and 2000 Supplement).
Tax Increment Installment Purchase Agreements
Bonded Debt subject to (1) 5.2% of the assessable basis of real property; (2) 13% of the County's assessable basis of personal property; and (3) 13% of the operating real property described in Section 8-109© of the Tax-Property Article of the Annotated Code of Maryland (1994 Replacement Volume and 2000 Supplement).
136

TotalState Advances (b) Water and Sewer Bonds (c) Debt Service
Principal Interest Principal Interest Principal Interest Principal Interest Charge
$ 221,502 $ - $ - $ 81,918 $ 19,818,369 $ 12,639,250 $ 76,033,871 $ 44,574,328 $ 120,608,199 202,146 - 410,000 71,648 19,746,020 11,891,608 73,072,166 41,398,679 114,470,845 183,021 - 410,000 51,209 17,024,085 11,007,699 67,161,106 37,996,085 105,157,191 183,021 - 410,000 30,812 16,108,780 10,239,271 64,240,801 34,785,350 99,026,151 165,720 - 410,000 10,291 16,060,993 9,523,032 63,425,713 31,773,302 95,199,015 165,720 - - - 15,925,668 8,809,421 61,240,388 28,825,254 90,065,642 165,720 - - - 15,587,188 8,087,392 56,361,908 25,949,778 82,311,686 160,871 - - - 14,655,559 7,381,895 51,880,430 23,243,565 75,123,995 160,871 - - - 14,371,784 6,714,270 50,611,655 20,748,739 71,360,394 160,866 - - - 13,739,682 6,056,836 48,769,548 18,357,419 67,126,967 67,706 - - - 12,736,148 5,480,704 43,112,854 16,120,759 59,233,613 55,139 - - - 11,622,736 4,967,198 40,371,875 14,205,448 54,577,323 48,220 - - - 11,024,448 4,517,895 37,661,668 12,513,761 50,175,429 48,220 - - - 10,891,286 4,095,994 35,763,506 10,930,439 46,693,945 48,220 - - - 10,868,249 3,658,422 36,000,469 9,342,151 45,342,620 27,317 - - - 10,150,341 3,251,386 31,951,658 7,826,257 39,777,915 14,666 - - - 8,453,924 2,850,240 26,462,590 6,446,485 32,909,075 14,666 - - - 8,091,934 2,496,331 24,360,600 5,282,075 29,642,675 14,666 - - - 7,353,688 2,161,939 20,907,354 4,228,221 25,135,575
8,101 - - - 6,915,469 1,840,622 17,282,571 3,268,604 20,551,175 8,101 - - - 6,352,274 1,539,040 20,620,375 2,460,958 23,081,333 8,101 - - - 5,124,110 1,267,243 8,472,211 1,471,494 9,943,705 8,101 - - - 5,120,971 1,046,975 7,238,071 1,151,425 8,389,496 8,101 - - - 5,117,861 826,894 5,125,961 826,895 5,952,856 8,101 - - - 4,205,000 607,000 4,213,101 607,000 4,820,101 6,325 - - - 3,375,000 422,288 3,381,325 422,288 3,803,613
- - - - 2,965,000 275,962 2,965,000 275,962 3,240,962 - - - - 2,125,000 148,081 2,125,000 148,081 2,273,081 - - - - 1,340,000 56,950 1,340,000 56,950 1,396,950 - - - - - - - - -
$ 2,163,208 $ - $ 1,640,000 $ 245,877 296,871,566 $ 133,861,839 $ 982,153,775 $ 405,237,752 $ 1,387,391,527
Federal Advances
137

138
(This page left blank intentionally)

Statistical Section

139
Statistical Section
The Statistical Section presents detailed information as a context for understanding what the information in the financial statements, note disclosures, and required supplementary information says about the County’s overall financial health. Contents Financial Trends – The following schedules contain trend information that presents how the County’s financial performance and strength have changed over time:
• Net Assets by Category • Changes in Net Assets • Fund Balances, Governmental Funds • Changes in Fund Balances, Governmental Funds
Revenue Capacity – The following schedules contain information to assess the County’s most significant local revenue source, Property Taxes:
• Taxable Assessed Value and Estimated Actual Value of Property • Direct and Overlapping Property Tax Rates • Principal Property Tax Payers • Property Tax Levies and Collections
Debt Capacity – The following schedules present information to assess the affordability of the County’s current levels of outstanding debt and its ability to issue additional debt:
• Ratios of Outstanding Debt by Type • Ratios of General Bonded Debt Outstanding • Direct and Overlapping Governmental Activities Debt • Legal Debt Margin • Pledged-Revenue Bond Coverage
Demographic and Economic Information – The following schedules offer demographic and economic indicators that present the environment within which the County’s financial activities take place:
• Demographic and Economic Statistics • Principal Employers
Operating Information – The following schedules contain service and infrastructure data that shows how the information in the County’s financial report relates to the services the County provides and the activities it performs:
• County Government Employees by Function • Operating Indicators by Function/Program • Capital Asset Statistics by Function

140
(This page left blank intentionally)
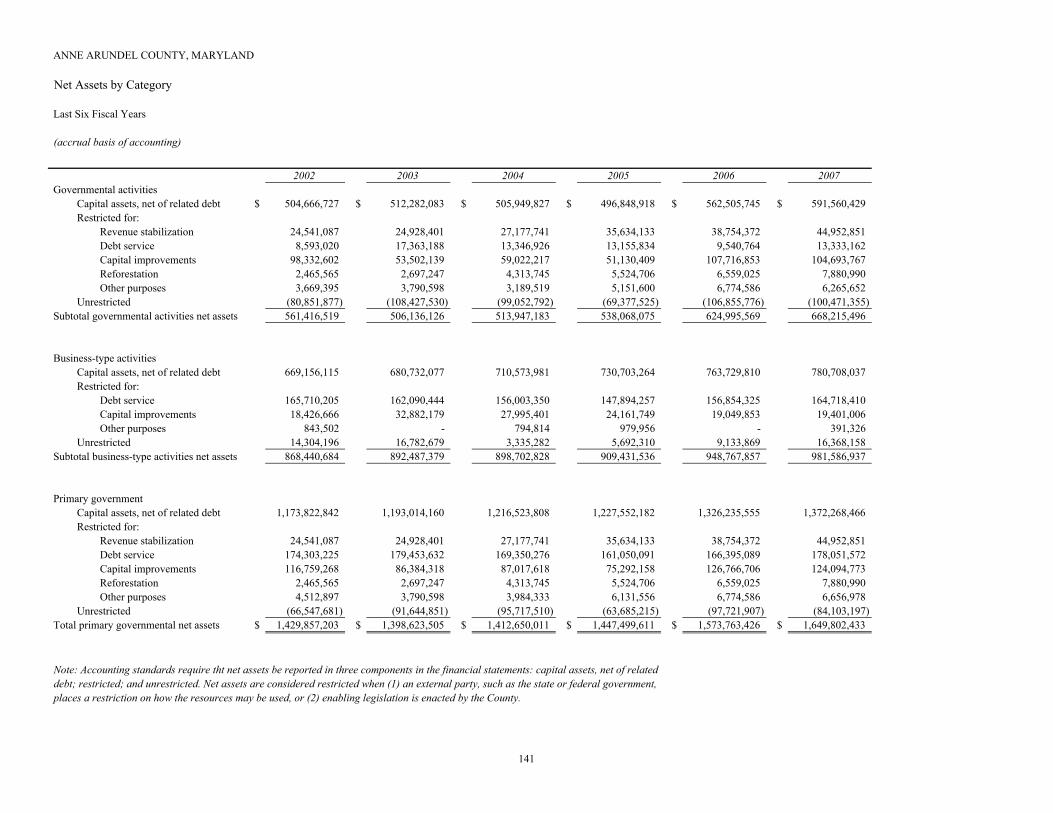
ANNE ARUNDEL COUNTY, MARYLAND
Net Assets by Category
Last Six Fiscal Years
(accrual basis of accounting)
2002 2003 2004 2005 2006 2007Governmental activities
Capital assets, net of related debt $ 504,666,727 $ 512,282,083 $ 505,949,827 $ 496,848,918 $ 562,505,745 $ 591,560,429 Restricted for:
Revenue stabilization 24,541,087 24,928,401 27,177,741 35,634,133 38,754,372 44,952,851 Debt service 8,593,020 17,363,188 13,346,926 13,155,834 9,540,764 13,333,162 Capital improvements 98,332,602 53,502,139 59,022,217 51,130,409 107,716,853 104,693,767 Reforestation 2,465,565 2,697,247 4,313,745 5,524,706 6,559,025 7,880,990 Other purposes 3,669,395 3,790,598 3,189,519 5,151,600 6,774,586 6,265,652
Unrestricted (80,851,877) (108,427,530) (99,052,792) (69,377,525) (106,855,776) (100,471,355) Subtotal governmental activities net assets 561,416,519 506,136,126 513,947,183 538,068,075 624,995,569 668,215,496
Business-type activitiesCapital assets, net of related debt 669,156,115 680,732,077 710,573,981 730,703,264 763,729,810 780,708,037 Restricted for:
Debt service 165,710,205 162,090,444 156,003,350 147,894,257 156,854,325 164,718,410 Capital improvements 18,426,666 32,882,179 27,995,401 24,161,749 19,049,853 19,401,006 Other purposes 843,502 - 794,814 979,956 - 391,326
Unrestricted 14,304,196 16,782,679 3,335,282 5,692,310 9,133,869 16,368,158 Subtotal business-type activities net assets 868,440,684 892,487,379 898,702,828 909,431,536 948,767,857 981,586,937
Primary governmentCapital assets, net of related debt 1,173,822,842 1,193,014,160 1,216,523,808 1,227,552,182 1,326,235,555 1,372,268,466 Restricted for:
Revenue stabilization 24,541,087 24,928,401 27,177,741 35,634,133 38,754,372 44,952,851 Debt service 174,303,225 179,453,632 169,350,276 161,050,091 166,395,089 178,051,572 Capital improvements 116,759,268 86,384,318 87,017,618 75,292,158 126,766,706 124,094,773 Reforestation 2,465,565 2,697,247 4,313,745 5,524,706 6,559,025 7,880,990 Other purposes 4,512,897 3,790,598 3,984,333 6,131,556 6,774,586 6,656,978
Unrestricted (66,547,681) (91,644,851) (95,717,510) (63,685,215) (97,721,907) (84,103,197) Total primary governmental net assets $ 1,429,857,203 $ 1,398,623,505 $ 1,412,650,011 $ 1,447,499,611 $ 1,573,763,426 $ 1,649,802,433
Note: Accounting standards require tht net assets be reported in three components in the financial statements: capital assets, net of relateddebt; restricted; and unrestricted. Net assets are considered restricted when (1) an external party, such as the state or federal government,places a restriction on how the resources may be used, or (2) enabling legislation is enacted by the County.
141

Anne Arundel County, MarylandChanges in Net Assets, Last Six Fiscal Years(accrual basis of accounting)(in thousands of dollars)
2002 2003 2004 2005 2006 2007ExpensesGovernmental activities:
Education $ 451,384 $ 444,903 $ 460,911 $ 506,795 $ 545,274 $ 604,273 Public Safety 162,155 184,600 174,599 185,399 208,106 211,406 General government 69,487 99,789 89,832 90,538 87,480 99,787 Health and human services 64,606 68,448 68,205 69,009 72,130 77,363 Public works 51,215 72,830 53,981 57,416 62,300 61,129 Recreation and community services 32,265 44,485 40,949 50,097 53,132 56,820 Judicial 21,721 19,838 18,962 19,673 20,648 21,450 Code enforcement 10,108 10,512 9,996 10,700 11,176 11,455 Land use and development 8,422 9,458 10,262 9,686 10,457 9,344 Economic development 3,571 3,520 3,342 3,330 3,445 3,731 Interest on debt and leases 20,646 25,506 27,974 26,436 30,146 32,483
Subtotal governmental activities expenses 895,580 983,889 959,013 1,029,079 1,104,294 1,189,241 Business-type activities:
Water and wastewater 82,591 85,254 85,920 94,416 94,109 100,136 Waste collection 33,857 36,066 42,946 38,996 47,638 40,773 Child care 1,476 1,819 2,015 2,362 2,543 2,794
Subtotal business-type activities expenses 117,924 123,139 130,881 135,774 144,290 143,703
Total primary government expenses 1,013,504 1,107,028 1,089,894 1,164,853 1,248,584 1,332,944
Program RevenuesGovernmental activities: Charges for services:
Public Safety $ 7,239 $ 5,377 $ 8,939 $ 11,936 $ 10,439 $ 10,770 General government 17,014 24,338 23,232 27,057 34,595 35,660 Health and human services 2,941 3,112 3,464 3,134 4,010 4,186 Public works 2,790 3,916 1,723 1,905 2,770 3,009 Recreation and community services 7,742 7,785 8,042 9,265 12,223 15,065 Judicial 2,357 2,461 2,542 2,589 2,672 2,733 Code enforcement 8,233 7,889 13,282 13,610 14,287 14,849 Land use and development 1,242 968 2,657 2,756 2,568 3,248 Economic development 136 22 27 - - -
Operating Grants and Contributions 51,564 76,083 68,019 75,548 86,392 89,644 Capital Grants and Contributions 65,244 51,392 38,717 38,942 41,829 41,767
Subtotal governmental activities revenues 166,502 183,343 170,644 186,742 211,785 220,931 Business-type activities: Charges for services:
Water and wastewater 56,412 58,291 59,600 61,805 68,464 69,689 Waste collection 34,144 35,284 35,449 36,153 42,291 43,014 Child care 1,675 1,922 2,084 2,428 2,689 2,881
Capital Grants and Contributions 24,532 37,769 28,947 38,539 43,991 43,078
Subtotal business-type activities revenues 116,763 133,266 126,080 138,925 157,435 158,662
Total primary government program revenues 283,265 316,609 296,724 325,667 369,220 379,593
Net (Expense)/RevenueGovernmental activities (729,078) (800,546) (788,369) (842,337) (892,509) (968,310) Business-type activities (1,161) 10,127 (4,801) 3,151 13,145 14,959 Total primary government net (expense)/revenue (730,239) (790,419) (793,170) (839,186) (879,364) (953,351)
142
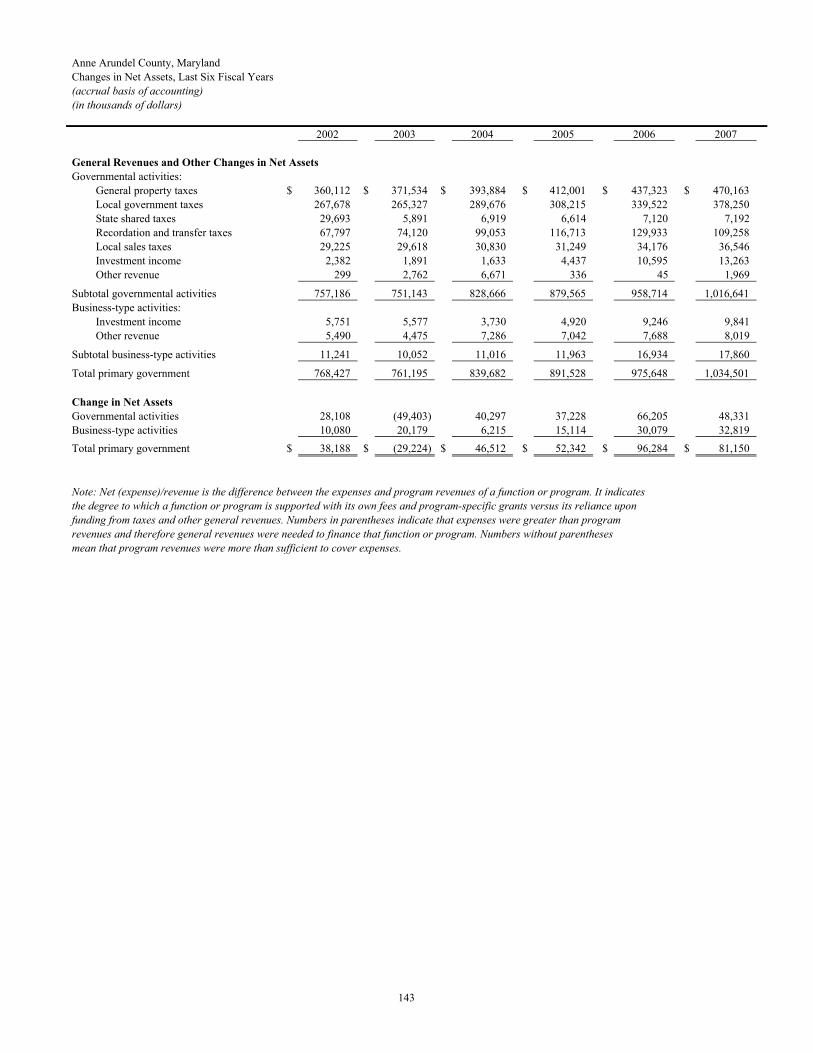
Anne Arundel County, MarylandChanges in Net Assets, Last Six Fiscal Years(accrual basis of accounting)(in thousands of dollars)
2002 2003 2004 2005 2006 2007
General Revenues and Other Changes in Net AssetsGovernmental activities:
General property taxes $ 360,112 $ 371,534 $ 393,884 $ 412,001 $ 437,323 $ 470,163 Local government taxes 267,678 265,327 289,676 308,215 339,522 378,250 State shared taxes 29,693 5,891 6,919 6,614 7,120 7,192 Recordation and transfer taxes 67,797 74,120 99,053 116,713 129,933 109,258 Local sales taxes 29,225 29,618 30,830 31,249 34,176 36,546 Investment income 2,382 1,891 1,633 4,437 10,595 13,263 Other revenue 299 2,762 6,671 336 45 1,969
Subtotal governmental activities 757,186 751,143 828,666 879,565 958,714 1,016,641 Business-type activities:
Investment income 5,751 5,577 3,730 4,920 9,246 9,841 Other revenue 5,490 4,475 7,286 7,042 7,688 8,019
Subtotal business-type activities 11,241 10,052 11,016 11,963 16,934 17,860
Total primary government 768,427 761,195 839,682 891,528 975,648 1,034,501
Change in Net AssetsGovernmental activities 28,108 (49,403) 40,297 37,228 66,205 48,331 Business-type activities 10,080 20,179 6,215 15,114 30,079 32,819 Total primary government $ 38,188 $ (29,224) $ 46,512 $ 52,342 $ 96,284 $ 81,150
Note: Net (expense)/revenue is the difference between the expenses and program revenues of a function or program. It indicatesthe degree to which a function or program is supported with its own fees and program-specific grants versus its reliance uponfunding from taxes and other general revenues. Numbers in parentheses indicate that expenses were greater than programrevenues and therefore general revenues were needed to finance that function or program. Numbers without parenthesesmean that program revenues were more than sufficient to cover expenses.
143
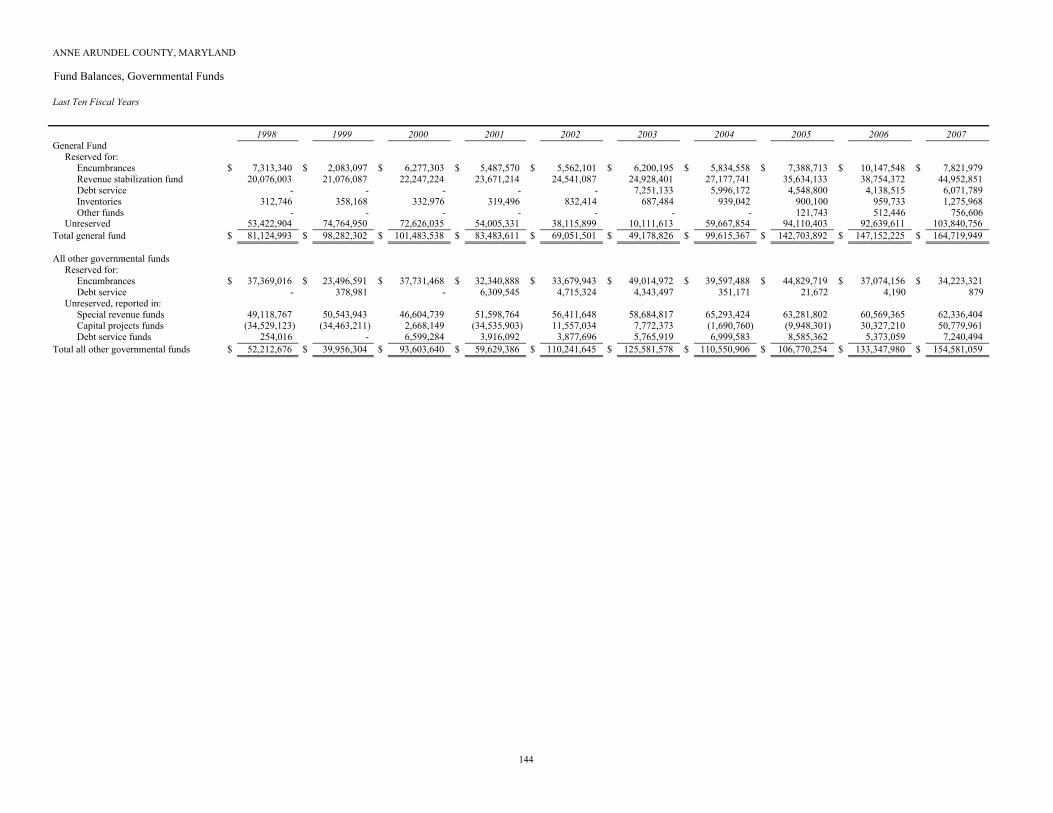
ANNE ARUNDEL COUNTY, MARYLAND
Fund Balances, Governmental Funds
Last Ten Fiscal Years
1998 1999 2000 2001 2002 2003 2004 2005 2006 2007General Fund
Reserved for:Encumbrances $ 7,313,340 $ 2,083,097 $ 6,277,303 $ 5,487,570 $ 5,562,101 $ 6,200,195 $ 5,834,558 $ 7,388,713 $ 10,147,548 $ 7,821,979 Revenue stabilization fund 20,076,003 21,076,087 22,247,224 23,671,214 24,541,087 24,928,401 27,177,741 35,634,133 38,754,372 44,952,851 Debt service - - - - - 7,251,133 5,996,172 4,548,800 4,138,515 6,071,789 Inventories 312,746 358,168 332,976 319,496 832,414 687,484 939,042 900,100 959,733 1,275,968 Other funds - - - - - - - 121,743 512,446 756,606
Unreserved 53,422,904 74,764,950 72,626,035 54,005,331 38,115,899 10,111,613 59,667,854 94,110,403 92,639,611 103,840,756Total general fund $ 81,124,993 $ 98,282,302 $ 101,483,538 $ 83,483,611 $ 69,051,501 $ 49,178,826 $ 99,615,367 $ 142,703,892 $ 147,152,225 $ 164,719,949
All other governmental funds Reserved for:
Encumbrances $ 37,369,016 $ 23,496,591 $ 37,731,468 $ 32,340,888 $ 33,679,943 $ 49,014,972 $ 39,597,488 $ 44,829,719 $ 37,074,156 $ 34,223,321 Debt service - 378,981 - 6,309,545 4,715,324 4,343,497 351,171 21,672 4,190 879
Unreserved, reported in: Special revenue funds 49,118,767 50,543,943 46,604,739 51,598,764 56,411,648 58,684,817 65,293,424 63,281,802 60,569,365 62,336,404 Capital projects funds (34,529,123) (34,463,211) 2,668,149 (34,535,903) 11,557,034 7,772,373 (1,690,760) (9,948,301) 30,327,210 50,779,961 Debt service funds 254,016 - 6,599,284 3,916,092 3,877,696 5,765,919 6,999,583 8,585,362 5,373,059 7,240,494
Total all other governmental funds $ 52,212,676 $ 39,956,304 $ 93,603,640 $ 59,629,386 $ 110,241,645 $ 125,581,578 $ 110,550,906 $ 106,770,254 $ 133,347,980 $ 154,581,059
144

Anne Arundel County, Maryland
Changes in Fund Balances, Governmental Funds
Last Six Fiscal Years
2002 2003 2004 2005 2006 2007REVENUES
General property taxes $ 359,779,665 $ 376,141,261 $ 395,347,946 $ 411,488,309 $ 439,755,427 $ 472,882,091 Local income taxes 266,409,098 264,729,935 298,065,106 308,536,927 328,424,355 361,956,043 State shared taxes 29,656,317 29,336,273 25,613,319 30,308,838 36,025,864 37,005,207 Grants and aid 71,213,502 65,309,289 71,002,284 73,676,115 73,526,717 62,884,873 Recordation and transfer taxes 67,796,645 74,120,137 99,053,108 116,713,326 129,932,542 109,257,440 Local sales taxes 29,225,328 29,617,564 30,830,077 31,249,156 34,175,913 36,546,370 License and permit fees 10,919,271 11,517,360 15,154,020 15,400,144 16,766,915 17,681,827 Impact fees 7,200,089 9,055,776 10,715,560 10,845,055 11,056,677 9,268,611 Special community benefit taxes 3,305,255 3,473,476 3,829,032 4,640,447 5,047,941 5,354,940 Investment income 4,230,221 3,037,046 2,230,723 6,875,983 12,484,636 16,302,297 Fees for services and other revenue 30,322,621 29,227,728 33,060,102 37,503,663 40,055,997 51,739,060
Total revenues 880,058,012 895,565,845 984,901,277 1,047,237,963 1,127,252,984 1,180,878,759
EXPENDITURESCurrent
Education 451,294,192 444,836,532 460,752,519 506,228,900 544,142,829 603,635,815 Public safety 154,665,392 168,686,401 171,085,550 183,418,356 201,470,724 211,273,738 General government 52,664,161 68,443,012 65,081,101 65,989,704 65,705,062 74,018,822 Health and human services 64,834,644 69,340,942 68,568,311 68,169,033 71,986,178 77,428,060 Public works 27,473,901 31,765,444 29,590,177 26,748,272 27,410,756 31,498,591 Recreation and community services 26,635,195 28,039,450 28,792,726 31,320,458 43,307,136 46,231,649 Judicial 19,553,878 17,679,442 17,531,229 18,551,403 19,300,693 20,224,216 Code enforcement 10,030,974 10,503,196 9,980,085 10,600,396 11,057,654 11,599,781 Land use and development 8,218,991 8,857,750 8,600,126 9,672,108 10,354,631 9,379,474 Economic development 3,571,254 3,520,112 3,342,050 3,330,000 3,445,000 3,731,000
Capital outlay 87,482,099 81,476,365 77,290,143 98,203,317 94,058,820 69,782,081 Debt service
Interest payments on debt 21,174,747 21,407,053 27,488,181 26,865,677 29,309,560 29,967,318 Principal payments on debt 69,572,826 96,150,951 72,977,428 77,649,091 81,229,529 87,811,109 Interest payments on leases 86,581 31,317 18,406 12,325 7,358 3,743 Principal payments on leases 850,750 437,999 48,244 53,496 54,009 57,105
Total expenditures 998,109,585 1,051,175,966 1,041,146,276 1,126,812,536 1,202,839,939 1,276,642,502
Revenues over (under) expenditures (118,051,573) (155,610,121) (56,244,999) (79,574,573) (75,586,955) (95,763,743)
OTHER FINANCING SOURCES (USES)Transfers in 117,391,978 74,149,736 46,860,616 80,248,583 144,849,136 153,626,114 Transfers out (117,391,978) (74,149,736) (46,860,616) (80,248,583) (144,849,136) (153,626,114) General obligation bonds issued 91,500,000 108,251,133 49,500,000 56,000,000 64,000,000 92,400,000 Bond anticipation notes issued 56,000,000 29,000,000 32,500,000 34,500,000 38,000,000 39,000,000 Proceeds from Parole Tax Increment bonds - 8,300,000 - - - - Proceeds from Nursery Road Tax Increment bonds - - 2,570,000 - - - Proceeds from Dorchester Taxing District - 8,223,335 5,388,744 - - - Proceeds from Compass Pointe bonds - - - 24,530,000 - - Installment purchase contracts issued 2,173,174 2,861,948 1,721,000 295,000 368,814 926,000 Proceeds from HUD section 108 loan - - - - 1,009,930 1,040,070 Proceeds from DNR loans - - - - - 208,873 Proceeds from lease financing - 261,764 - - - - Proceeds from refunding issue - 24,096,726 47,724,175 50,538,271 87,115,000 - Premiums (discounts) from sale of bonds - - 3,294,922 3,417,648 7,481,071 5,101,149 Transfers from proprietary funds - - - - - 999,489 Payments to escrow agent - (24,039,670) (51,047,973) (50,398,473) (91,361,801) -
Total other financing sources (uses) 149,673,174 156,955,236 91,650,868 118,882,446 106,613,014 139,675,581
Net change in fund balances $ 31,621,601 $ 1,345,115 $ 35,405,869 $ 39,307,873 $ 31,026,059 $ 43,911,838
Debt service as a percentage of noncapital expenditures 10.8% 12.7% 11.0% 10.9% 10.6% 10.5%
145

ANNE ARUNDEL COUNTY, MARYLAND
Taxable Assessed Value and Estimated Actual Value of PropertyLast Ten Fiscal Years(in thousands of dollars)
AssessedTotal Taxable Estimated Value as a
Residential Commercial Agricultural Use Value Total Real Railroad/Utility Other Business Total Personal Assessed Actual Percentage ofFiscal Year Property Property Property Property Property Property Property Property Value Value Actual ValueEnded June 30,1998 $ 9,137,376 $ 2,124,633 $ 93,950 $ 5,772 $ 11,361,731 $ 1,531,395 $ 808,983 $ 2,340,378 $ 13,702,109 $ 30,744,706 44.57%1999 9,424,070 2,190,308 97,132 7,744 11,719,254 1,553,235 830,083 2,383,318 14,102,572 31,681,453 44.51%2000 9,738,635 2,284,258 97,891 8,293 12,129,077 1,639,652 892,728 2,532,380 14,661,457 32,855,073 44.62%2001 10,182,016 2,417,021 105,964 5,839 12,710,840 1,458,739 950,392 2,409,131 15,119,971 34,186,231 44.23%2002 26,685,494 6,604,609 264,319 7,293 33,561,715 1,286,234 1,133,798 2,420,032 35,981,747 35,981,747 100.00%2003 28,208,386 7,225,669 273,617 7,923 35,715,595 1,234,663 1,211,291 2,445,954 38,161,549 38,161,549 100.00%2004 31,063,571 7,752,955 295,573 4,163 39,116,262 1,260,098 1,119,634 2,379,732 41,495,994 41,495,994 100.00%2005 35,055,021 8,418,040 321,853 7,808 43,802,722 1,318,689 1,088,197 2,406,886 46,209,608 46,209,608 100.00%2006 40,599,140 9,279,649 348,915 25,746 50,253,450 1,323,793 1,155,926 2,479,719 52,733,169 52,733,169 100.00%2007 47,987,113 10,434,965 418,476 29,211 58,869,765 1,380,834 1,208,714 2,589,548 61,459,313 61,459,313 100.00%
(a) In the fiscal year which began July 1, 2001, the Maryland Truth in Taxation Act requires that real property be assessed at 100%of market value. Upon becoming effective on October 1, 2000, this legislation provided that real property tax rates generally shallbe reduced to 40% of the current rates effective July 1, 2000. The legislation is intended to be revenue neutral.
Real Property (a) Personal Property
146
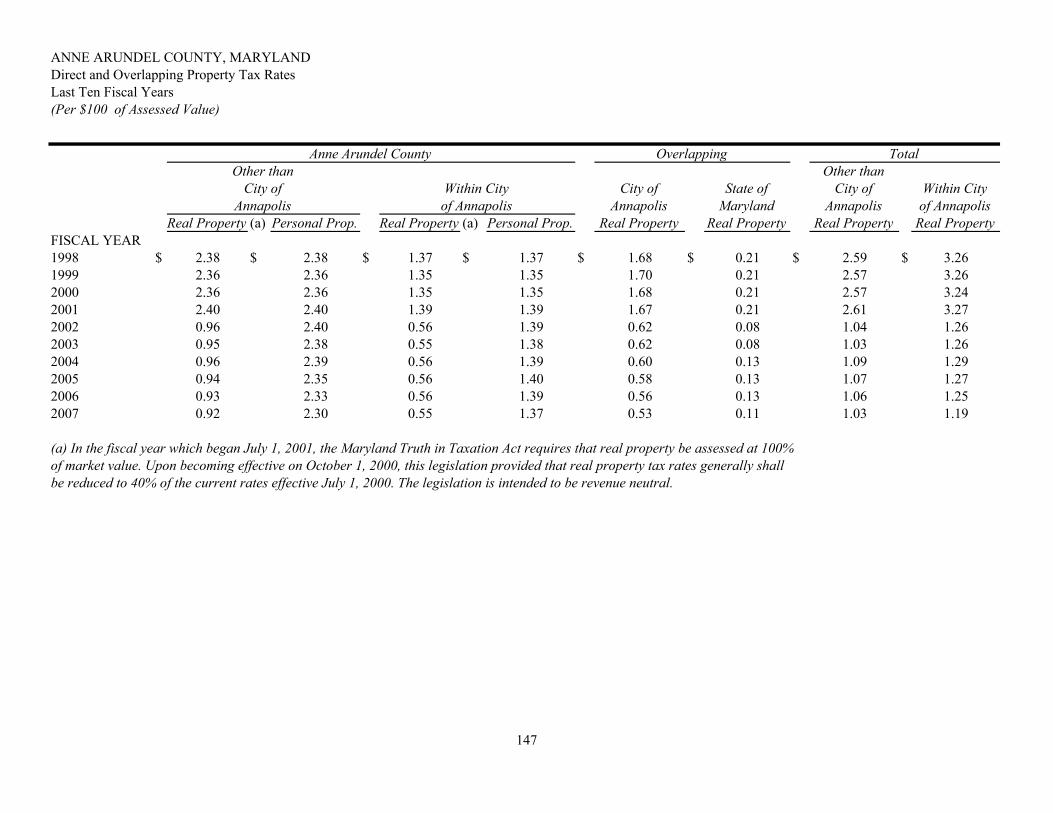
ANNE ARUNDEL COUNTY, MARYLANDDirect and Overlapping Property Tax RatesLast Ten Fiscal Years(Per $100 of Assessed Value)
Other thanCity of State of City of Within City
Annapolis Maryland Annapolis of AnnapolisReal Property (a) Personal Prop. Real Property (a) Personal Prop. Real Property Real Property Real Property Real Property
FISCAL YEAR1998 $ 2.38 $ 2.38 $ 1.37 $ 1.37 $ 1.68 $ 0.21 $ 2.59 $ 3.261999 2.36 2.36 1.35 1.35 1.70 0.21 2.57 3.262000 2.36 2.36 1.35 1.35 1.68 0.21 2.57 3.242001 2.40 2.40 1.39 1.39 1.67 0.21 2.61 3.272002 0.96 2.40 0.56 1.39 0.62 0.08 1.04 1.262003 0.95 2.38 0.55 1.38 0.62 0.08 1.03 1.262004 0.96 2.39 0.56 1.39 0.60 0.13 1.09 1.292005 0.94 2.35 0.56 1.40 0.58 0.13 1.07 1.272006 0.93 2.33 0.56 1.39 0.56 0.13 1.06 1.252007 0.92 2.30 0.55 1.37 0.53 0.11 1.03 1.19
(a) In the fiscal year which began July 1, 2001, the Maryland Truth in Taxation Act requires that real property be assessed at 100%of market value. Upon becoming effective on October 1, 2000, this legislation provided that real property tax rates generally shallbe reduced to 40% of the current rates effective July 1, 2000. The legislation is intended to be revenue neutral.
AnnapolisWithin City
of Annapolis
TotalAnne Arundel CountyOther than
City of
Overlapping
147

ANNE ARUNDEL COUNTY, MARYLAND
Principal Property Tax Payers
Current Year and Nine Years Ago
Percentage PercentageTaxable of Total County Taxable of Total CountyAssessed Taxable Assessed Assessed Taxable Assessed
Taxpayer Value Value Taxpayer Value Value
Baltimore Gas and Electric Company 1,099,347,676$ 1.79% Baltimore Gas and Electric Company 1,309,583,300$ 9.56%Arundel Mills Limited Partnership (Arundel Mills Mall) 272,279,722 0.44% Bell Atlantic 221,021,290 1.61%Annapolis Mall Limited Partnership (Annapolis Mall) 236,008,646 0.38% Annapolis Mall Limited Partnership (Annapolis Mall) 52,742,540 0.38%Verizon 234,886,750 0.38% Northrop Grumman Corp. 49,840,650 0.36%TKL East (Marley Station Mall) 103,285,660 0.17% TKL East (Marley Station Mall) 47,800,880 0.35%Northrop Grumman Corp. 97,311,686 0.16% Aeronautical Radio, Inc. 34,224,590 0.25%Wal-mart Stores, Inc. 87,330,153 0.14% Wal-mart 20,394,930 0.15%Annapolis Harbour Center Assoc. LLLP 67,484,476 0.11% Aetna Life Insurance Company 19,415,580 0.14%Baywoods Cooperative Apartments LLC 55,294,242 0.09% State of Maryland - Board of Trustees 14,175,890 0.10%Harbour Gates, Inc. (Harbour Gates Apts) 53,780,232 0.09% Parole Town Center Association 13,892,870 0.10%
2,307,009,243$ 3.75% 1,783,092,520$ 13.01%
Note - In the fiscal year which began July 1, 2001, the Maryland Truth in Taxation Act requires that real property be assessed at 100%of market value. Upon becoming effective on October 1, 2000, this legislation provided that real property tax rates generally shallbe reduced to 40% of the current rates effective July 1, 2000. The legislation is intended to be revenue neutral.
2007 1998
148

ANNE ARUNDEL COUNTY, MARYLANDProperty Tax Levies and CollectionsLast Ten Fiscal Years
Taxes Levied Collectionfor the Percentage in Subsequent Percentage
Fiscal Year Amount of Levy Years Amount of LevyFiscal Year1998 $ 310,283,682 $ 306,891,526 98.91% $ 3,378,041 $ 310,269,567 100.00%1999 316,838,803 314,140,913 99.15% 2,693,812 316,834,725 100.00%2000 329,847,238 326,352,858 98.94% 3,491,613 329,844,471 100.00%2001 345,227,111 342,441,550 99.19% 2,557,271 344,998,821 99.93%2002 361,424,971 355,998,775 98.50% 5,113,176 361,111,951 99.91%2003 375,682,304 373,310,763 99.37% 2,162,997 375,473,760 99.94%2004 393,762,892 391,557,058 99.44% 1,896,380 393,453,438 99.92%2005 412,089,133 410,206,824 99.54% 1,617,452 411,824,276 99.94%2006 439,775,209 438,118,642 99.62% 1,161,449 439,280,091 99.89%2007 472,038,379 470,209,494 99.61% - 470,209,494 99.61%
Total Collection to DateCollected within the
Fiscal Year of the Levy
149
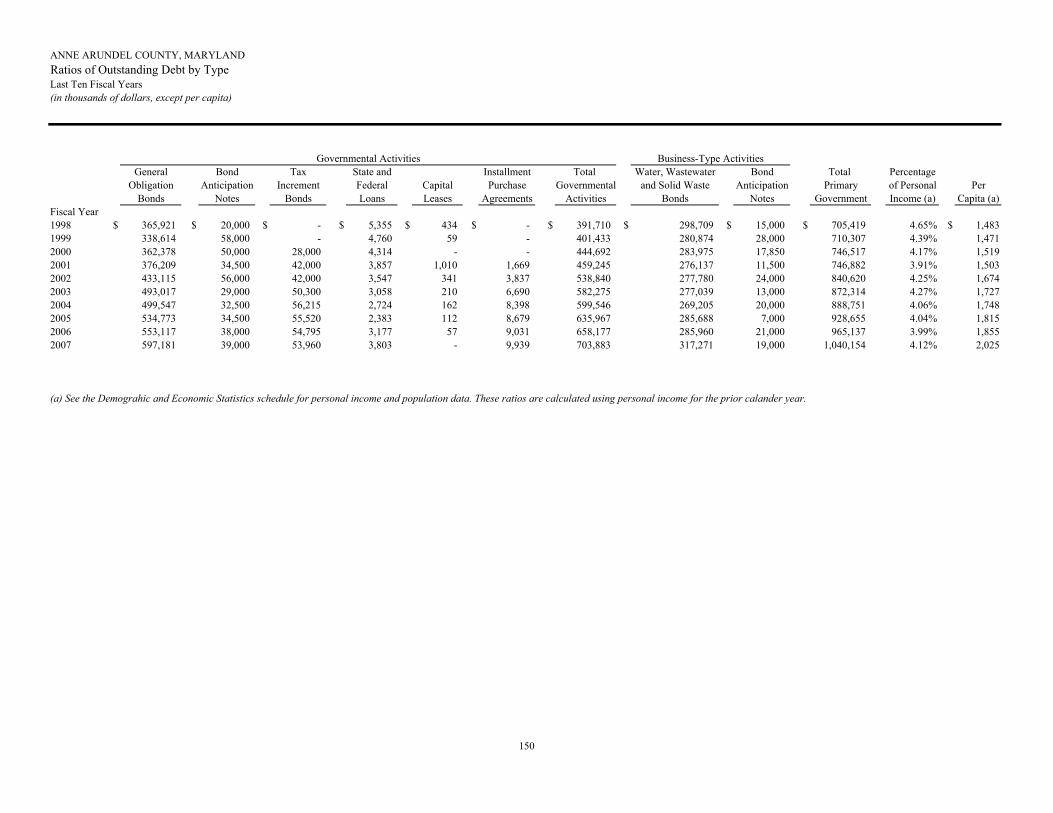
ANNE ARUNDEL COUNTY, MARYLANDRatios of Outstanding Debt by TypeLast Ten Fiscal Years(in thousands of dollars, except per capita)
General Bond Tax State and Installment Total Water, Wastewater Bond Total PercentageObligation Anticipation Increment Federal Capital Purchase Governmental and Solid Waste Anticipation Primary of Personal Per
Bonds Notes Bonds Loans Leases Agreements Activities Bonds Notes Government Income (a) Capita (a)Fiscal Year1998 $ 365,921 $ 20,000 $ - $ 5,355 $ 434 $ - $ 391,710 $ 298,709 $ 15,000 $ 705,419 4.65% $ 1,4831999 338,614 58,000 - 4,760 59 - 401,433 280,874 28,000 710,307 4.39% 1,4712000 362,378 50,000 28,000 4,314 - - 444,692 283,975 17,850 746,517 4.17% 1,5192001 376,209 34,500 42,000 3,857 1,010 1,669 459,245 276,137 11,500 746,882 3.91% 1,5032002 433,115 56,000 42,000 3,547 341 3,837 538,840 277,780 24,000 840,620 4.25% 1,6742003 493,017 29,000 50,300 3,058 210 6,690 582,275 277,039 13,000 872,314 4.27% 1,7272004 499,547 32,500 56,215 2,724 162 8,398 599,546 269,205 20,000 888,751 4.06% 1,7482005 534,773 34,500 55,520 2,383 112 8,679 635,967 285,688 7,000 928,655 4.04% 1,8152006 553,117 38,000 54,795 3,177 57 9,031 658,177 285,960 21,000 965,137 3.99% 1,8552007 597,181 39,000 53,960 3,803 - 9,939 703,883 317,271 19,000 1,040,154 4.12% 2,025
(a) See the Demograhic and Economic Statistics schedule for personal income and population data. These ratios are calculated using personal income for the prior calander year.
Business-Type ActivitiesGovernmental Activities
150
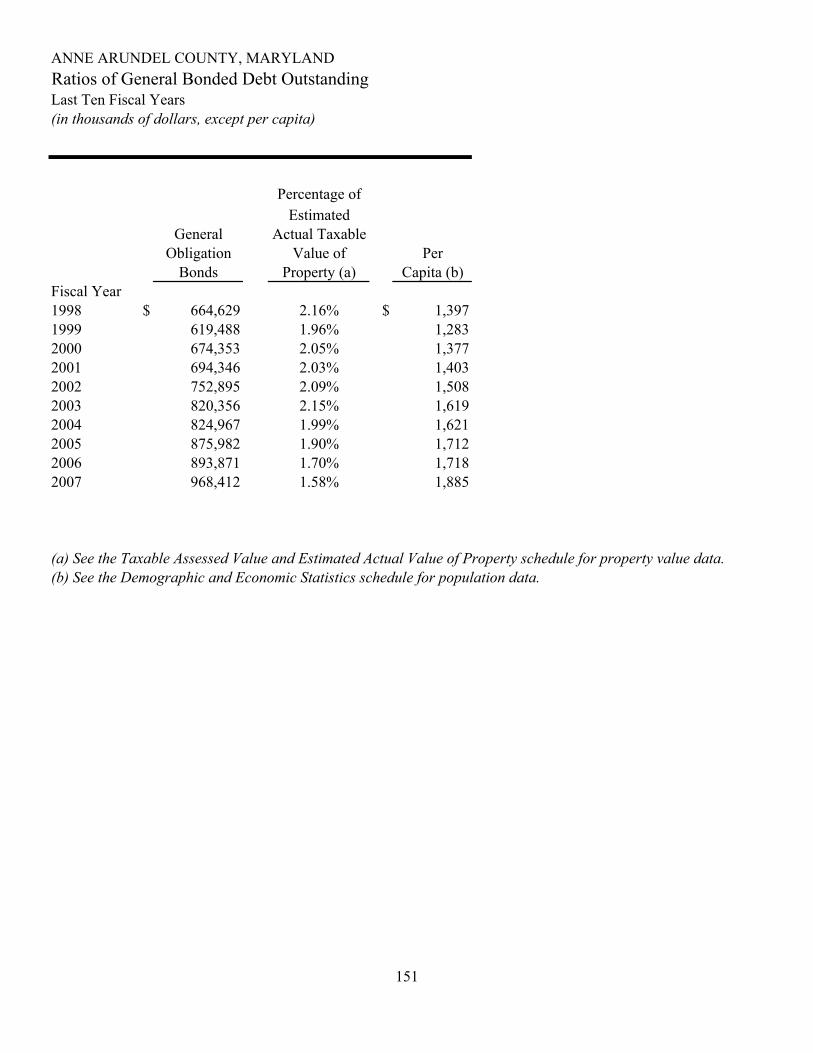
ANNE ARUNDEL COUNTY, MARYLANDRatios of General Bonded Debt OutstandingLast Ten Fiscal Years(in thousands of dollars, except per capita)
Percentage ofEstimated
General Actual TaxableObligation Value of Per
Bonds Property (a) Capita (b)Fiscal Year1998 $ 664,629 2.16% $ 1,3971999 619,488 1.96% 1,2832000 674,353 2.05% 1,3772001 694,346 2.03% 1,4032002 752,895 2.09% 1,5082003 820,356 2.15% 1,6192004 824,967 1.99% 1,6212005 875,982 1.90% 1,7122006 893,871 1.70% 1,7182007 968,412 1.58% 1,885
(a) See the Taxable Assessed Value and Estimated Actual Value of Property schedule for property value data.(b) See the Demographic and Economic Statistics schedule for population data.
151

ANNE ARUNDEL COUNTY, MARYLAND
Direct and Overlapping Governmental Activities DebtAs of June 30, 2007
EstimatedEstimated Share of
Debt Percentage OverlappingGovernmental Unit Outstanding Applicable Debt
Debt repaid with property taxesCity of Annapolis $ 45,231,035 100.00% $ 45,231,035 Subtotal, overlapping debt 45,231,035
Anne Arundel County direct debt 703,883,409
Total direct and overlapping debt $ 749,114,444
Note: Overlapping governments are those that coincide, at least in part, with the geographicboundaries of the county. This schedule estimates the portion of the outstanding debt of the overlapping government that is borne by the residents and businesses of Anne ArundelCounty. This process recognizes that, when considering the government's ability to issue andrepay long-term debt, the entire debt burden borne by the residents and businesses should betaken into account. However, this does not imply that every taxpayer is a resident, and therefore responsible for repaying the debt of each overlapping government.
152
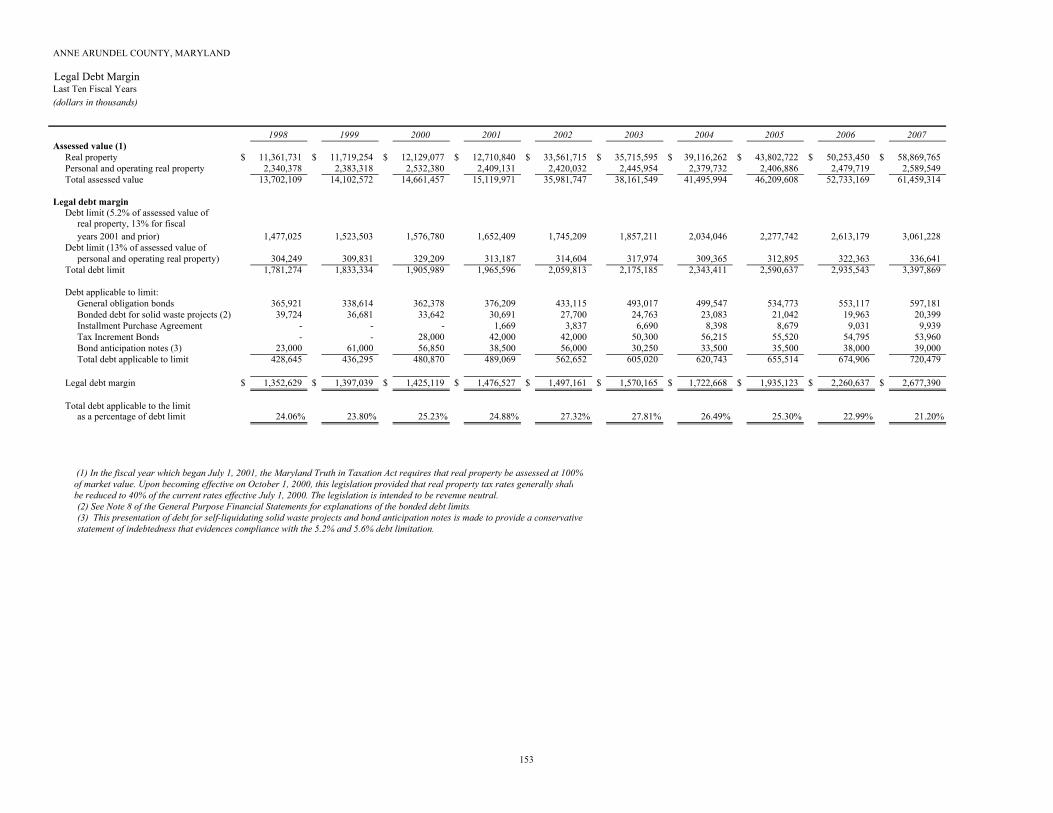
ANNE ARUNDEL COUNTY, MARYLAND
Legal Debt Margin Last Ten Fiscal Years (dollars in thousands)
1998 1999 2000 2001 2002 2003 2004 2005 2006 2007Assessed value (1)
Real property $ 11,361,731 $ 11,719,254 $ 12,129,077 $ 12,710,840 $ 33,561,715 $ 35,715,595 $ 39,116,262 $ 43,802,722 $ 50,253,450 $ 58,869,765Personal and operating real property 2,340,378 2,383,318 2,532,380 2,409,131 2,420,032 2,445,954 2,379,732 2,406,886 2,479,719 2,589,549 Total assessed value 13,702,109 14,102,572 14,661,457 15,119,971 35,981,747 38,161,549 41,495,994 46,209,608 52,733,169 61,459,314
Legal debt margin Debt limit (5.2% of assessed value of
real property, 13% for fiscal years 2001 and prior) 1,477,025 1,523,503 1,576,780 1,652,409 1,745,209 1,857,211 2,034,046 2,277,742 2,613,179 3,061,228
Debt limit (13% of assessed value of personal and operating real property) 304,249 309,831 329,209 313,187 314,604 317,974 309,365 312,895 322,363 336,641
Total debt limit 1,781,274 1,833,334 1,905,989 1,965,596 2,059,813 2,175,185 2,343,411 2,590,637 2,935,543 3,397,869
Debt applicable to limit: General obligation bonds 365,921 338,614 362,378 376,209 433,115 493,017 499,547 534,773 553,117 597,181 Bonded debt for solid waste projects (2) 39,724 36,681 33,642 30,691 27,700 24,763 23,083 21,042 19,963 20,399 Installment Purchase Agreement - - - 1,669 3,837 6,690 8,398 8,679 9,031 9,939 Tax Increment Bonds - - 28,000 42,000 42,000 50,300 56,215 55,520 54,795 53,960 Bond anticipation notes (3) 23,000 61,000 56,850 38,500 56,000 30,250 33,500 35,500 38,000 39,000 Total debt applicable to limit 428,645 436,295 480,870 489,069 562,652 605,020 620,743 655,514 674,906 720,479
Legal debt margin $ 1,352,629 $ 1,397,039 $ 1,425,119 $ 1,476,527 $ 1,497,161 $ 1,570,165 $ 1,722,668 $ 1,935,123 $ 2,260,637 $ 2,677,390
Total debt applicable to the limit as a percentage of debt limit 24.06% 23.80% 25.23% 24.88% 27.32% 27.81% 26.49% 25.30% 22.99% 21.20%
(1) In the fiscal year which began July 1, 2001, the Maryland Truth in Taxation Act requires that real property be assessed at 100%of market value. Upon becoming effective on October 1, 2000, this legislation provided that real property tax rates generally shallbe reduced to 40% of the current rates effective July 1, 2000. The legislation is intended to be revenue neutral.(2) See Note 8 of the General Purpose Financial Statements for explanations of the bonded debt limits.(3) This presentation of debt for self-liquidating solid waste projects and bond anticipation notes is made to provide a conservative statement of indebtedness that evidences compliance with the 5.2% and 5.6% debt limitation.
153

ANNE ARUNDEL COUNTY, MARYLANDPledged-Revenue Bond CoverageLast Ten Fiscal Years(dollars in thousands)
Utility Less: Net Service Less: NetFiscal Charges Operating Available Charges Operating AvailableYear and Other Expenses Revenue Principal Interest Coverage and Other Expenses Revenue Principal Interest Coverage
1998 $ 63,597 $ 43,121 $ 20,476 $ 17,278 $ 11,186 0.72 $ 36,107 $ 22,556 $ 13,551 $ 3,690 $ 1,866 2.441999 69,053 42,985 26,068 17,661 11,426 0.90 34,672 18,865 15,807 3,043 1,976 3.152000 63,454 44,494 18,960 18,860 11,452 0.63 36,207 25,250 10,957 3,189 2,015 2.112001 63,809 47,122 16,687 18,737 10,875 0.56 36,120 26,428 9,692 5,800 1,802 1.272002 65,809 44,884 20,925 18,567 10,229 0.73 35,900 30,744 5,156 6,992 1,442 0.612003 66,278 49,836 16,442 18,335 8,465 0.61 37,139 32,300 4,839 2,937 1,304 1.142004 66,381 49,369 17,012 17,988 9,167 0.63 39,524 39,387 137 2,930 1,175 0.032005 68,815 55,399 13,416 18,538 8,428 0.50 40,375 34,109 6,266 3,041 1,080 1.522006 77,909 57,243 20,666 19,180 7,987 0.76 46,613 41,847 4,766 3,078 1,038 1.162007 80,861 62,031 18,830 19,087 7,882 0.70 48,813 37,028 11,785 3,064 992 2.91
Revenues Less: Net Revenues Less: NetFiscal and Operating Available and Operating AvailableYear Transfers In Expenses Revenue Principal Interest Coverage Transfers In Expenses Revenue Principal Interest Coverage
1998 $ 1,416 $ 0 $ 1,416 $ 428 $ 91 2.73 $ 0 $ 0 $ 0 $ 0 $ 0 0.001999 1,472 0 1,472 449 74 2.81 0 0 0 0 0 0.002000 7,658 0 7,658 283 56 22.59 0 0 0 0 0 0.002001 6,016 16 6,000 285 2,621 2.07 2,825 69 2,756 0 57 0.002002 5,943 129 5,814 310 3,054 1.73 140 21 119 5 179 0.002003 7,559 74 7,485 323 2,891 2.33 1,554 71 1,483 9 296 4.862004 9,062 568 8,495 829 3,317 2.05 1,699 31 1,668 13 380 4.242005 10,813 40 10,773 881 2,020 3.71 1,217 3 1,214 14 481 2.452006 12,785 38 12,747 783 2,698 3.66 36 352 -316 17 502 -0.612007 15,526 32 15,494 908 2,657 4.35 2,219 9 2,210 18 540 3.96
Note: Details regarding the County's outstanding debt can be found in the notes to the financial statements."Utility Charges and Other" includes investment earnings but not capital contributions and grants."Operating Expenses" do not include interest or depreciation.
Water and Wastewater Revenue Backed Bonds
Debt Service
Solid Waste Revenue Backed Bonds
Debt Service
Tax Increment Bonds Installment Purchase Agreements Bonds
Debt Service Debt Service
154
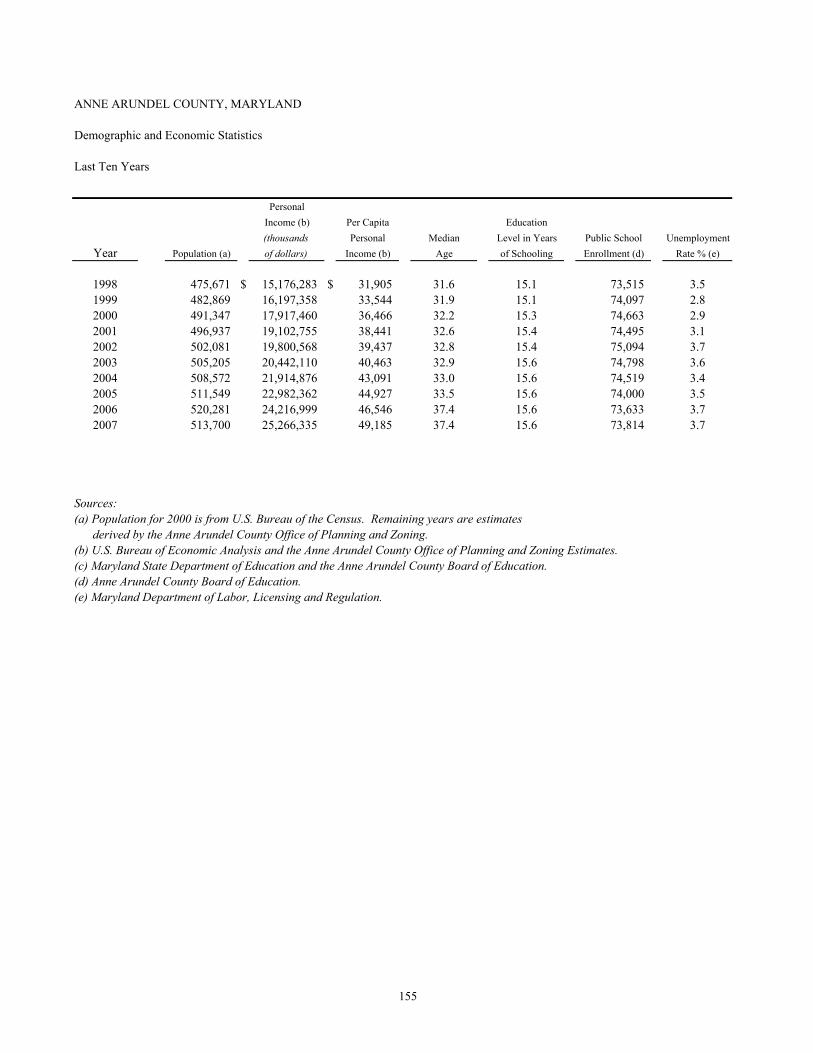
ANNE ARUNDEL COUNTY, MARYLAND
Demographic and Economic Statistics
Last Ten Years
PersonalIncome (b) Per Capita Education(thousands Personal Median Level in Years Public School Unemployment
Year Population (a) of dollars) Income (b) Age of Schooling Enrollment (d) Rate % (e)
1998 475,671 $ 15,176,283 $ 31,905 31.6 15.1 73,515 3.51999 482,869 16,197,358 33,544 31.9 15.1 74,097 2.82000 491,347 17,917,460 36,466 32.2 15.3 74,663 2.92001 496,937 19,102,755 38,441 32.6 15.4 74,495 3.12002 502,081 19,800,568 39,437 32.8 15.4 75,094 3.72003 505,205 20,442,110 40,463 32.9 15.6 74,798 3.62004 508,572 21,914,876 43,091 33.0 15.6 74,519 3.42005 511,549 22,982,362 44,927 33.5 15.6 74,000 3.52006 520,281 24,216,999 46,546 37.4 15.6 73,633 3.72007 513,700 25,266,335 49,185 37.4 15.6 73,814 3.7
Sources:(a) Population for 2000 is from U.S. Bureau of the Census. Remaining years are estimates derived by the Anne Arundel County Office of Planning and Zoning.(b) U.S. Bureau of Economic Analysis and the Anne Arundel County Office of Planning and Zoning Estimates.(c) Maryland State Department of Education and the Anne Arundel County Board of Education.(d) Anne Arundel County Board of Education.(e) Maryland Department of Labor, Licensing and Regulation.
155

ANNE ARUNDEL COUNTY, MARYLAND
Principal Employers
Current Year and Nine Years Ago
Percentage Percentageof Total County of Total County
Employer Employees Employment Employer Employees Employment
Ft. George G. Meade 42,000 12.22% National Security Agency 25,000 10.21%Anne Arundel Co. Public Schools 14,310 4.16% Ft. George G. Meade 11,500 4.70%BWI Thurgood Marshall Airport 10,199 2.97% State of Maryland 9,116 3.72%State of Maryland 8,616 2.51% Anne Arundel County Public Schools 8,000 3.27%Northrop Grumman Corp. 7,500 2.18% Northrop Grumman Corp. 6,679 2.73%Anne Arundel County Government 4,111 1.20% Anne Arundel County General Government 3,783 1.54%Baltimore Washington Medical Center 2,432 0.71% US Air Group, Inc. 2,350 0.96%Southwest Airlines 2,425 0.71% U.S. Naval Academy 2,250 0.92%U.S. Naval Academy 2,052 0.60% North Anne Arundel Health Systems, Inc. 1,900 0.78%Anne Arundel Health System 2,025 0.59% Anne Arundel Health Systems, Inc. 1,800 0.73%
95,670 27.83% 72,378 29.55%
Sources: Anne Arundel Economic Development Corporation and the Maryland State Data Center.
2007 1998
156

ANNE ARUNDEL COUNTY, MARYLAND
County Government Employees by Function
Last Ten Fiscal Years
1998 1999 2000 2001 2002 2003 2004 2005 2006 2007Function/program
General government 506 516 525 536 557 586 554 535 537 540 Public safety
Police 831 884 886 895 895 1,047 1,037 904 921 923 Fire 634 633 633 643 654 654 675 721 833 833 Detention center 360 404 404 434 434 434 409 408 409 415
Health and human services 85 105 104 133 141 173 175 161 163 175 Public works 388 341 344 341 340 347 339 295 299 304 Recreation and community services 71 100 102 106 107 109 99 99 102 110 Judicial 260 293 300 309 312 273 260 261 264 270 Code enforcement 163 165 166 171 175 173 158 156 168 172 Land use and development 96 99 92 96 98 94 104 101 101 105 Water and wastewater 382 374 367 368 362 353 353 348 348 348 Solid waste 68 68 68 76 83 83 83 83 84 85 Child care 5 6 6 6 6 7 7 7 7 8
Total 3,849 3,989 3,997 4,115 4,164 4,334 4,253 4,079 4,236 4,288
157
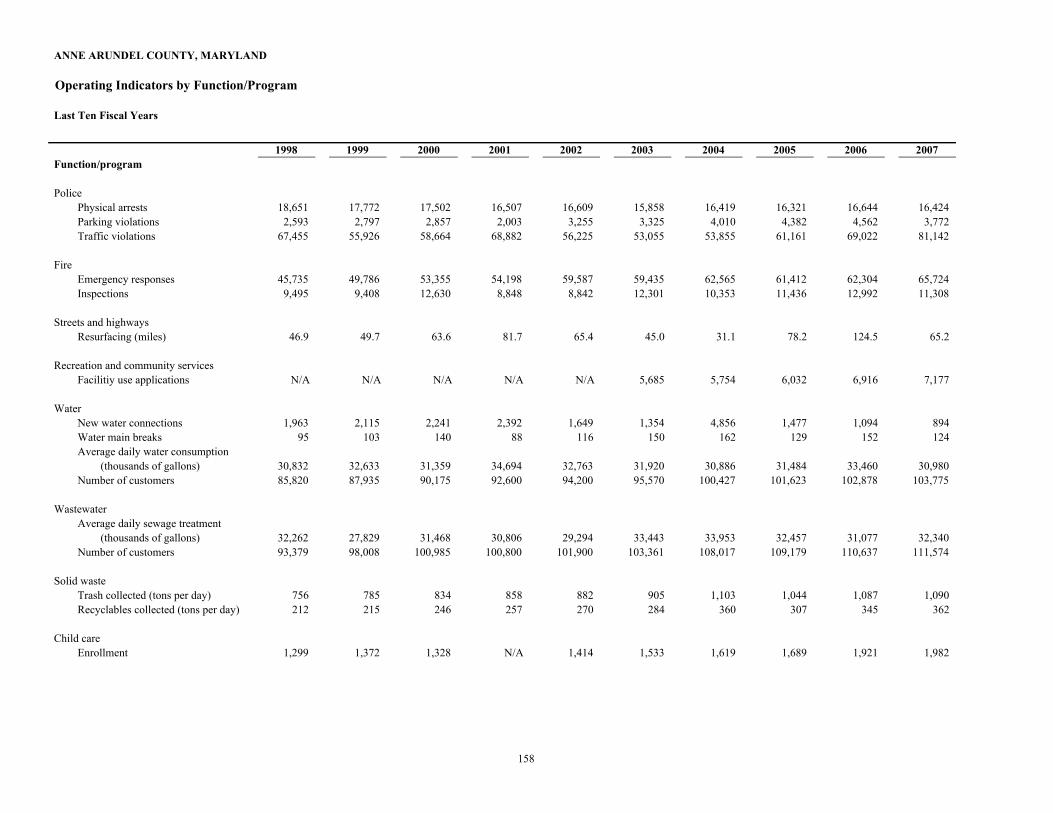
ANNE ARUNDEL COUNTY, MARYLAND
Operating Indicators by Function/Program
Last Ten Fiscal Years
1998 1999 2000 2001 2002 2003 2004 2005 2006 2007Function/program
PolicePhysical arrests 18,651 17,772 17,502 16,507 16,609 15,858 16,419 16,321 16,644 16,424 Parking violations 2,593 2,797 2,857 2,003 3,255 3,325 4,010 4,382 4,562 3,772 Traffic violations 67,455 55,926 58,664 68,882 56,225 53,055 53,855 61,161 69,022 81,142
FireEmergency responses 45,735 49,786 53,355 54,198 59,587 59,435 62,565 61,412 62,304 65,724 Inspections 9,495 9,408 12,630 8,848 8,842 12,301 10,353 11,436 12,992 11,308
Streets and highwaysResurfacing (miles) 46.9 49.7 63.6 81.7 65.4 45.0 31.1 78.2 124.5 65.2
Recreation and community servicesFacilitiy use applications N/A N/A N/A N/A N/A 5,685 5,754 6,032 6,916 7,177
WaterNew water connections 1,963 2,115 2,241 2,392 1,649 1,354 4,856 1,477 1,094 894 Water main breaks 95 103 140 88 116 150 162 129 152 124 Average daily water consumption
(thousands of gallons) 30,832 32,633 31,359 34,694 32,763 31,920 30,886 31,484 33,460 30,980 Number of customers 85,820 87,935 90,175 92,600 94,200 95,570 100,427 101,623 102,878 103,775
WastewaterAverage daily sewage treatment
(thousands of gallons) 32,262 27,829 31,468 30,806 29,294 33,443 33,953 32,457 31,077 32,340 Number of customers 93,379 98,008 100,985 100,800 101,900 103,361 108,017 109,179 110,637 111,574
Solid wasteTrash collected (tons per day) 756 785 834 858 882 905 1,103 1,044 1,087 1,090 Recyclables collected (tons per day) 212 215 246 257 270 284 360 307 345 362
Child careEnrollment 1,299 1,372 1,328 N/A 1,414 1,533 1,619 1,689 1,921 1,982
158
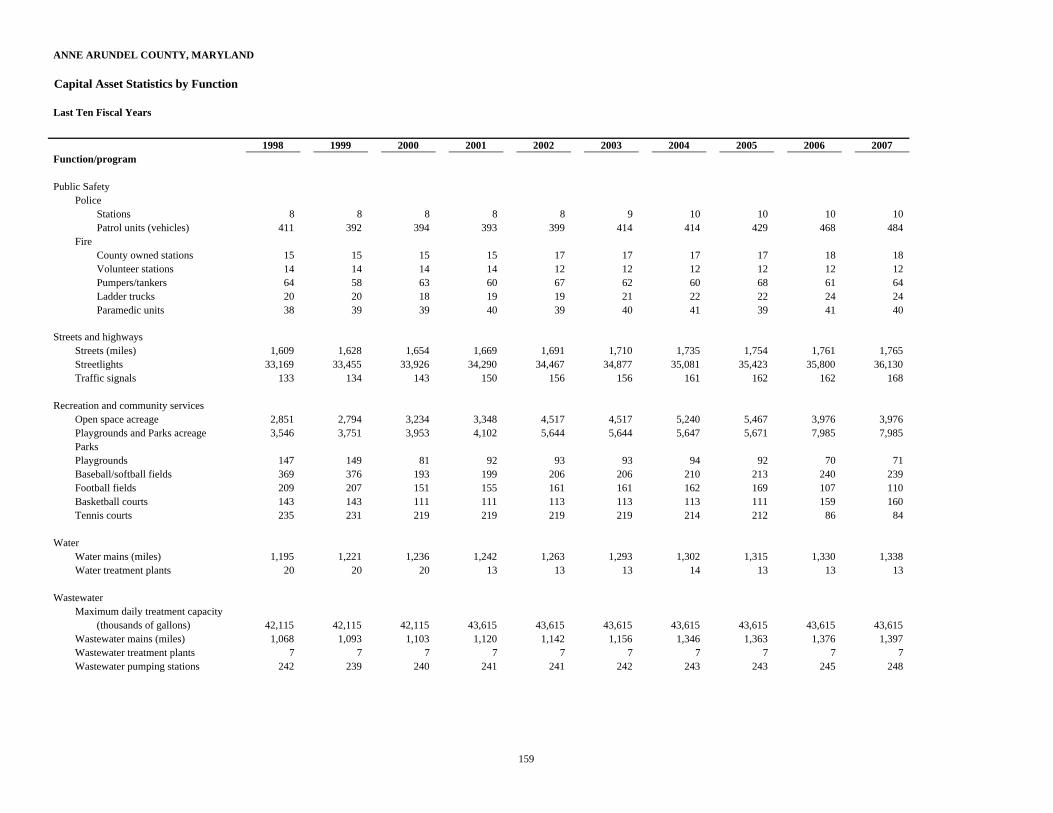
ANNE ARUNDEL COUNTY, MARYLAND
Capital Asset Statistics by Function
Last Ten Fiscal Years
1998 1999 2000 2001 2002 2003 2004 2005 2006 2007Function/program
Public SafetyPolice
Stations 8 8 8 8 8 9 10 10 10 10 Patrol units (vehicles) 411 392 394 393 399 414 414 429 468 484
Fire County owned stations 15 15 15 15 17 17 17 17 18 18 Volunteer stations 14 14 14 14 12 12 12 12 12 12 Pumpers/tankers 64 58 63 60 67 62 60 68 61 64 Ladder trucks 20 20 18 19 19 21 22 22 24 24 Paramedic units 38 39 39 40 39 40 41 39 41 40
Streets and highwaysStreets (miles) 1,609 1,628 1,654 1,669 1,691 1,710 1,735 1,754 1,761 1,765 Streetlights 33,169 33,455 33,926 34,290 34,467 34,877 35,081 35,423 35,800 36,130 Traffic signals 133 134 143 150 156 156 161 162 162 168
Recreation and community servicesOpen space acreage 2,851 2,794 3,234 3,348 4,517 4,517 5,240 5,467 3,976 3,976 Playgrounds and Parks acreage 3,546 3,751 3,953 4,102 5,644 5,644 5,647 5,671 7,985 7,985 ParksPlaygrounds 147 149 81 92 93 93 94 92 70 71 Baseball/softball fields 369 376 193 199 206 206 210 213 240 239 Football fields 209 207 151 155 161 161 162 169 107 110 Basketball courts 143 143 111 111 113 113 113 111 159 160 Tennis courts 235 231 219 219 219 219 214 212 86 84
WaterWater mains (miles) 1,195 1,221 1,236 1,242 1,263 1,293 1,302 1,315 1,330 1,338 Water treatment plants 20 20 20 13 13 13 14 13 13 13
WastewaterMaximum daily treatment capacity
(thousands of gallons) 42,115 42,115 42,115 43,615 43,615 43,615 43,615 43,615 43,615 43,615 Wastewater mains (miles) 1,068 1,093 1,103 1,120 1,142 1,156 1,346 1,363 1,376 1,397 Wastewater treatment plants 7 7 7 7 7 7 7 7 7 7 Wastewater pumping stations 242 239 240 241 241 242 243 243 245 248
159

160
(This page left blank intentionally)