2008_cdac_report.pdf - Maryland State Treasurer
84
R E P O R T O F T H E C A P I T A L D E B T A F F O R D A B I L I T Y C O M M I T T E E O N R E C O M M E N D E D D E B T A U T H O R I Z A T I O N S F O R F I S C A L Y E A R 2 0 1 0 S U B M I T T E D T O T H E G O V E R N O R A N D G E N E R A L A S S E M B L Y O F M A R Y L A N D September 2008
-
Upload
khangminh22 -
Category
Documents
-
view
1 -
download
0
Transcript of 2008_cdac_report.pdf - Maryland State Treasurer
R E P O R T O F T H E C A P I T A L D E B T A F F O R D A B I L I T Y C O M M I T T E E O N R E C O M M E N D E D D E B T A U T H O R I Z A T I O N S F O R F I S C A L Y E A R 2 0 1 0 S U B M I T T E D T O T H E G O V E R N O R A N D G E N E R A L A S S E M B L Y O F M A R Y L A N D
September 2008
September 8, 2008
The Honorable Martin J. O'MalleyGovernor of MarylandState HouseAnnapolis, Maryland 21401
The Honorable Thomas V. M. Miller, Jr. The Honorable Michael E. BuschPresident of the Senate Speaker of the HouseMaryland General Assembly Maryland General AssemblyState House State HouseAnnapolis, Maryland 21401 Annapolis, Maryland 21401
Gentlemen:
The Capital Debt Affordability Committee, created pursuant to Section 8-104, et seq., of the StateFinance and Procurement Article, is required to submit to the Governor and the General Assembly eachyear an estimate of the maximum amount of new general obligation debt that prudently may be authorizedfor the next fiscal year. The Committee is also charged with making a recommendation regardingadditional funding for school construction and is required to submit an estimate of the amount of newacademic facilities bonds that prudently may be authorized.
The 2007 Capital Debt Affordability Committee Report noted the Committee's review of itstraditional affordability criteria, initiated at the request of the General Assembly. The Committeeconcluded the 2007 Report with a recommendation for the continued study and evaluation of the criteriain 2008. That recommendation was followed and, after thorough analysis by the Committee and staff, andfollowing consultation with the rating agencies, investment houses and the State's financial advisor, theCommittee voted on September 8 to retain the 8.0% debt service to revenues criterion and to change thedebt outstanding to personal income criterion from 3.2% to 4.0%. The motion was adopted on a vote of 4-1, with Treasurer Kopp, Secretary Foster, Secretary Porcari, and Mr. Meritt voting in favor; ComptrollerFranchot voted in opposition. Further discussion of the history and issues regarding the debt affordabilitycriteria are found in section V of the report.
The Committee recommends a $1,110 million limit for new general obligation authorizations bythe 2009 General Assembly to support the 2010 capital program . The recommended level reflects a one-time increase of $150 million from the $960 million 2008 authorization level projected in the 2007CDAC report . Future projections assume $990 million in new authorizations to support the 2011 capitalprogram and increases of 3% annually in 2012 through 2018. The $1 , 110 million also includes $ 5 millionpreviously authorized for the Southern Maryland Regional Strategy -Action Plan for Agriculture.
2
The motion to adopt this level specifically recognized that authorization levels proposed in theGovernor's 2010 capital budget could be adjusted to a level below the recommended limit to reflect up-to-date economic and fiscal information. The motion was adopted by a vote of 3-2 with Secretary Foster,Secretary Porcari and Mr. Meritt in favor and Treasurer Kopp and Comptroller Franchot opposed.Treasurer Kopp and Comptroller Franchot indicated that they supported retention of the previouslyanticipated recommendation of $960 million.
The Committee has reviewed the additional school construction funding needs as identified in the2004 Task Force to Study Public School Facilities Report and recommends that of the $1,110 million ingeneral obligation debt authorization, $325 million be allocated for school construction for fiscal year2010 and anticipates continued funding for future fiscal years.
Based on its review of the condition of State debt in light of the debt affordability guidelines, theCommittee recommends a limit of $27 million for new academic facilities bonds for the UniversitySystem of Maryland for fiscal year 2010.
We are pleased to present to you the Committee's annual report, with the recommendationsrelating to the fiscal 2010 capital program.
Nancy K. KopWc1\<
, State TreasurerChair
Peter FranchotState Comptroller
T. Eloise Foster, Secretary Jo^ Porcari , SecretaryBudget and Management D ment of Transportation
Paul B. MerittPublic Member
3
TABLE OF CONTENTS Page
EXECUTIVE SUMMARY ....................................................................................... 6 I. INTRODUCTION
A. Membership of the Committee ........................................................................ 9 B. Duties of the Committee .................................................................................. 9 C. 2007 Recommendations and Subsequent Events............................................. 10
II. TAX-SUPPORTED DEBT - TRENDS AND OUTLOOK
A. General Obligation Bonds ............................................................................... 11 B. Transportation Debt ......................................................................................... 18 C. Grant Anticipation Revenue Vehicles “GARVEE” Bonds ............................. 21 D. Lease and Conditional Purchase Financings ................................................... 22 E. Maryland Stadium Authority ........................................................................... 25 F. Bay Restoration Fund Revenue Bonds ............................................................ 26
III. CAPITAL PROGRAMS A. State of Maryland Capital Program ................................................................. 27
B. Capital Improvement and School Construction Needs.................................... 29 IV. BOND RATING AGENCY REPORTS
A. Excerpts from Rating Agency Reports Issued in Conjunction with the Sale of $415 Million of General Obligation Bonds State and Local Facilities Loan of 2008, Second Series ......................................................................................... 31
B. Moody’s States Credit Scorecard 2008............................................................ 32 V. EVALUATION AND CHANGE TO AFFORDABILITY CRITERIA
A. Background...................................................................................................... 33 B. Status of the Criteria in May 2008................................................................... 33 C. History of Criteria ............................................................................................ 33 D. Survey of Other States’ Criteria....................................................................... 35 E. Rating Agency Guidance ................................................................................. 35 F. Analysis ........................................................................................................... 36 G. Consideration of Options ................................................................................. 37
H. Decision ........................................................................................................... 38 VI. AFFORDABILITY ANALYSIS
A. The Concept of Affordability........................................................................... 41 B. Affordability Criteria ....................................................................................... 41 C. 2008 Affordability Recommendation .............................................................. 41 D. Comparison of Recommendation and Criteria ................................................ 42 E. Comparison of Recommendation and Capital Program .................................. 51 F. Affordability Risk Analysis ............................................................................. 51
4
TABLE OF CONTENTS (CONTINUED)
Page
VII. HIGHER EDUCATION DEBT A. Background...................................................................................................... 58 B. CDAC Duties ................................................................................................... 58 C. Size and Condition of Debt of the University System of Maryland, Morgan State University, St. Mary’s College of Maryland, and Baltimore City Community College...................................... 59 D. Incorporating Higher Education Academic Debt into the Affordability Analysis ................................................................................... 60
E. University System of Maryland Debt Management Policy ............................. 61 F. 2008 Recommended Authorization for Higher Education Academic Debt ............................................................................. 62
APPENDICES A. History of the Capital Debt Affordability Committee ..................................... 65 B. History of Maryland Stadium Authority Financings ...................................... 69
SCHEDULES
A-1 Maryland Personal Income and Population Historical Data and Projections .................................................................... 73
A-2 Maryland State Revenue Historical Data and Projections .................................................................... 74 B-1 Proposed General Obligation Authorizations and
Estimated Issuances ...................................................................................... 75 B-2 Projected General Obligation Debt - Authorized
But Unissued................................................................................................. 76 B-3 Projected General Obligation Debt Outstanding ............................................ 77 B-4 Projected General Obligation Debt Service.................................................... 78 C-1 Historical Data - General Obligation Debt ..................................................... 79 C-2 Historical Data - School Debt ......................................................................... 80 C-2a Historical Data - Comparison of Total GO Authorizations to Total Authorized for School Construction .............................................................. 81 C-3 Historical Data – Affordability Ratios............................................................ 82 C-4 Historical Data - Consolidated Transportation Bonds ............................................................................................................ 83 C-5 Historical Data - County Transportation Bonds ............................................. 84
5

EXECUTIVE SUMMARY
The Capital Dept Affordability Committee (CDAC or the Committee), established by Chapter 43 of the Laws of Maryland 1978 and codified in Section 8-104 et seq. of the State Finance and Procurement Article, is charged with reviewing:
1. The size and condition of State tax-supported debt on a continuing basis, and
advising the Governor and General Assembly each year regarding the maximum amount of new general obligation debt that prudently may be authorized for the next fiscal year;
2. Higher education debt and annual estimates concerning the prudent maximum authorization of academic facilities bonds to be issued by the University System of Maryland, Morgan State University and St. Mary’s College of Maryland;
3. Additional school construction funding needs as identified in the 2004 Task Force to Study Public School Facilities report, and making a specific recommendation regarding funding for school construction when recommending the State’s annual debt limit.
To develop its recommendations, the CDAC met on May 15, June 27, August 6 and
September 8, 2008, and renewed the focus on the affordability criteria that began in the 2007 meetings. The 2007 projections indicated that the State would remain within the self-imposed affordability limits of debt outstanding at 3.2% of personal income and debt service at 8.0% of revenues. Since the 2007 CDAC Report, the 2007 1st Special Session increased the authorization of Consolidated Transportation Bonds from $2.0 billion to $2.6 billion and increased revenues. The growth of personal income since 2007 also declined. As a result and compared to 2007, the projected affordability ratio of debt outstanding to personal income had risen above 3.2% in 2010 through 2016 while the debt service to revenue ratio improved in the short-term (until 2012) as a result of the increased revenues.
Throughout the summer, CDAC analyzed the assumptions of the affordability criteria
and evaluated their sensitivity using different authorization scenarios and economic conditions. A “decision tree” that included the pros and cons of retaining or changing the 3.2% debt outstanding criteria was discussed. The Committee also considered the impact of a change in the affordability criteria to the AAA rating and reviewed recent rating agency reports for further guidance. Finally, staff from the Treasurer’s office, Comptroller’s office, Departments of Budget and Management, Transportation, and Legislative Services met with the rating agencies on August 19 to discuss various options that the Committee was considering and to gauge their reaction to these options.
As a result of this analysis and after consultation with the rating agencies and the
State’s financial advisor, the Committee has concluded that the affordability criterion for debt outstanding to personal income should change from 3.2% to 4.0%. The debt service to revenues affordability criterion should remain at 8.0%. The Committee considers the debt service criterion to be the more important of the two benchmarks since it is a better measure for and indicator of State financial management and ultimately reflects the ability
6
of the State to repay the debt. A complete discussion of the Committee’s consideration and analysis of the affordability criteria can be found in Section V.
In addition, at the May 15 meeting, the Committee reviewed the size, condition and
projected issuances of tax-supported debt including General Obligation Bonds, Consolidated Transportation Bonds, Grant Anticipation Revenue Vehicle (GARVEE) Bonds, Maryland Stadium Authority Bonds and Bay Restoration Fund Revenue Bonds (Bay Restoration Bonds). The Committee conducted a similar review of the debt of higher education institutions at the June 27 meeting. Also at the June 27 meeting, the Committee had a presentation from the Department of Assessments and Taxation which explained the assessment process in Maryland and the effect of the Homestead Credit. At the August meeting, the Committee reviewed the State of Maryland Capital Program and school construction needs during the next five fiscal years.
The Committee recommends a $1,110 million limit for new general obligation authorizations by the 2009 General Assembly to support the 2010 capital program. The recommended level reflects a one-time increase of $150 million from the $960 million 2008 authorization level projected in the 2007 CDAC report. Future projections assume $990 million in new authorizations to support the 2011 capital program and increases of 3% annually in 2012 through 2018. The $1,110 million also includes $5 million previously authorized for the Southern Maryland Regional Strategy-Action Plan for Agriculture.
The motion to adopt this level specifically recognized that authorization levels proposed
in the Governor’s 2010 capital budget could be adjusted to a level below the recommended limit to reflect up-to-date economic and fiscal information. The motion was adopted by a vote of 3-2 with Secretary Foster, Secretary Porcari and Mr. Meritt in favor and Treasurer Kopp and Comptroller Franchot opposed. Treasurer Kopp and Comptroller Franchot indicated that they supported retention of the previously anticipated recommendation of $960 million.
The analysis indicates that the Committee’s projection of General Obligation Bond authorizations is currently affordable. The personal income criterion peaks at 3.43% in 2012 and is at 3.08% in 2018. The debt service criterion increases annually to 7.51% in 2018, below the 8.0% benchmark through 2018.
The risks of exceeding the affordability criteria are limited. The Committee reviewed its interest rate, revenue, personal income, issuance and authorization assumptions and subjected its recommendation to sensitivity analysis. The personal income and revenue estimates reflect the most recent projections by the Bureau of Revenue Estimates. The Committee believes that all of these variables have been estimated conservatively and consequently, these variables do not pose a serious threat of exceeding the State’s affordability criteria.
As more fully discussed in Section III, Part B (Capital Improvement and School
Construction Needs), the Committee reviewed the documented need for increased school construction and renovation, the need to meet the goal set forth in the Public School Facilities Act of 2004, and the challenge of meeting these goals with the escalation in building costs.
7
The Committee recommends that of the $1,110 million authorized to support the
2010 capital program, at least $325 million should be allocated for public school construction for fiscal year 2010, exceeding by $75 million the annual funding goal set by the 2004 Public School Facilities Act in those years. The Committee anticipates continued funding for future fiscal years.
Based on its review of the condition of State debt in light of the debt affordability
guidelines, the Committee recommends a limit of $27 million for new academic facilities bonds for the University System of Maryland for fiscal year 2010.
8
I. INTRODUCTION
A. Membership
The members are the State Treasurer (Chair), the Comptroller, the Secretaries of Budget and Management and Transportation, one public member appointed by the Governor, and as non-voting members, the Chairs of the Capital Budget Subcommittees of the Senate Budget and Taxation Committee and the House Appropriations Committee. B. Duties
The Committee is required to review the size and condition of State debt on a continuing
basis and to submit to the Governor, by September 10 of each year, an estimate of the total amount of new State debt that prudently may be authorized for the next fiscal year. Although the Committee's estimates are advisory only, the Governor is required to give due consideration to the Committee's findings in determining the total authorizations of new State debt and in preparing a preliminary allocation for the next fiscal year. The Committee is required to consider:
• The amount of State tax-supported debt (see Appendix A for the Committee’s definition of tax-supported debt) that will be
o Outstanding, and o Authorized but unissued during the next fiscal year;
• The capital program prepared by the Department of Budget and Management and the capital improvement and school construction needs during the next five fiscal years, as projected by the Interagency Committee on School Construction;
• Projected debt service requirements for the next ten years; • Criteria used by recognized bond rating agencies to judge the quality of State
bond issues; • Other factors relevant to the ability of the State to meet its projected debt service
requirements for the next five years or relevant to the marketability of State bonds; and
• The effect of new authorizations on each of the factors enumerated above.
The Committee also reviews on a continuing basis the size and condition of any debt of the University System of Maryland, Morgan State University, St. Mary's College of Maryland and Baltimore City Community College; takes any debt issued for academic facilities into account as part of the Committee's affordability analysis with respect to the estimate of new authorizations of general obligation debt; and, finally, submits to the Governor and the General Assembly a recommendation of the amount of new bonds for academic facilities that prudently may be authorized in the aggregate for the next fiscal year by these institutions of higher education.
The Committee reviews school construction needs as identified in the report issued by
the 2004 Task Force to Study Public School Facilities. When recommending the State’s annual
9

debt limit, the Committee is required to make a recommendation regarding an allocation of funding for school construction and a multiyear funding recommendation that will provide annual funding stability.
A history of the Committee’s membership, duties, debt affordability criteria, definition of
tax-supported debt, and authorization increases can be found in Appendix A. C. 2007 Recommendations and Subsequent Events The following lists the recommendations of the Capital Debt Affordability Committee to the 2008 General Assembly for the fiscal year 2009 capital program and the subsequent events related to those recommendations.
2007 Recommendations of the Capital Debt Affordability Committee • New authorizations of general obligation debt should be limited to $935 million,
including $3 million for the Southern Maryland Regional Strategy-Action Plan for Agriculture Loan of 2007.
• New authorizations for academic facilities at the University System of Maryland
should be limited to an aggregate of $33 million.
2008 Authorizations • The net general obligation debt authorized for the fiscal year 2009 capital program
(effective June 1, 2008) totaled $935 million: (in millions)
$893.8 New general obligation debt authorized by the 2008 General Assembly
40.8 Authorized by separate legislation for fiscal year 2009 3.0 Authorized for Southern Maryland Regional Strategy-Action Plan for Agriculture Loan of 2008 (2.6) Reductions in previously authorized debt $935.0
• The 2008 General Assembly authorized the University System of Maryland to issue $33.0 million in new academic facility bonds - $16.0 million to finance various capital projects and $17.0 million to finance capital facility renewal projects.
10

II. TAX-SUPPORTED DEBT - TRENDS AND OUTLOOK
The State of Maryland has issued six types of tax-supported debt in recent years: • General obligation debt, which pledges the full faith and credit of the State; • Bonds, notes and other obligations issued by the Department of Transportation
and backed by the operating revenues and pledged taxes of the Department; • Bonds for transportation projects supported by anticipated federal highway capital
revenues (GARVEE Bonds) and issued by the Maryland Transportation Authority;
• Lease and Conditional Purchase Financings; • Revenue bonds issued by the Maryland Stadium Authority secured by leases with
the State; • Bonds for the purpose of Chesapeake Bay restoration secured by the revenue
from a Statewide fee and issued by the Maryland Water Quality Financing Administration.
Although the State has the authority to make short-term borrowings in anticipation of taxes and other receipts up to a maximum of $100 million, the State has not issued short-term tax anticipation notes or made any other similar short-term borrowings for cash flow purposes. A. General Obligation (G.O.) Bonds
Purpose General Obligation Bonds, which are limited to a maximum maturity of 15 years, are
authorized and issued to provide funds for: • General construction and capital improvements to State-owned facilities,
including institutions of higher education; • Grants to local educational authorities for construction and capital improvements
to public schools; and • Financial assistance in the form of loans or grants to local governments and the
private sector for individual capital projects such as water quality improvements, jails and detention facilities, community colleges, economic development, community health facilities, historic preservation, private higher education, and other community projects.
Security The State has pledged its full faith and credit as security for its G.O. Bonds. Current Status: Debt Outstanding as of June 30, 2008 $ 5,493,830,000 Amount Authorized but Unissued at June 30, 2008 $2,063,852,644
11

Ratings
Fitch Ratings, Moody’s Investors Service and Standard and Poor’s all rate Maryland’s General Obligation Bonds AAA. Maryland has continuously had this rating dating back to S&P’s first rating in 1961, Moody’s in 1973 and Fitch in 1993.
Use of Variable Rate Debt, Bond Insurance, Interest Rate Exchange Agreements and Guaranteed Investment Contracts The State is authorized to issue variable interest rate bonds in an amount no more than
15% of the outstanding general obligation indebtedness. The State has not issued any variable rate debt as of June 30, 2008 and has not executed any interest rate exchange agreements. Because the State is a “natural” AAA credit, there has been no need for bond insurance. To invest the sinking funds paid on certain Qualified Zone Academy Bonds, the State has entered into Guaranteed Investment Contracts. Trends in Outstanding General Obligation Debt
Authorizations and Issuances Graph 1 depicts the growth between 1975 and 2008 in the State's total general obligation
debt. Since 1991, the level of new authorizations and issuances has increased significantly, resulting in an increased level of outstanding general obligation debt. Appendix C-1 includes data on the authorizations, issuances and debt service of General Obligation Bonds since 1973. Appendix C-2 details the authorizations, issuances and debt service for bonds that have been issued for school construction also since 1973. Using the data from Appendices C-1 and C-2, Appendix C-2a compares the total authorized for school construction with the total authorized for General Obligation Bonds.
Annuity Bond Fund (ABF) Debt service for General Obligation Bonds is paid from the Annuity Bond Fund (ABF).
The State constitution requires the collection of an annual tax to pay debt service and State statute requires that, after considering the balance in the ABF and other revenue sources, the Board of Public Works set an annual property tax rate sufficient to pay debt service in the following fiscal year.
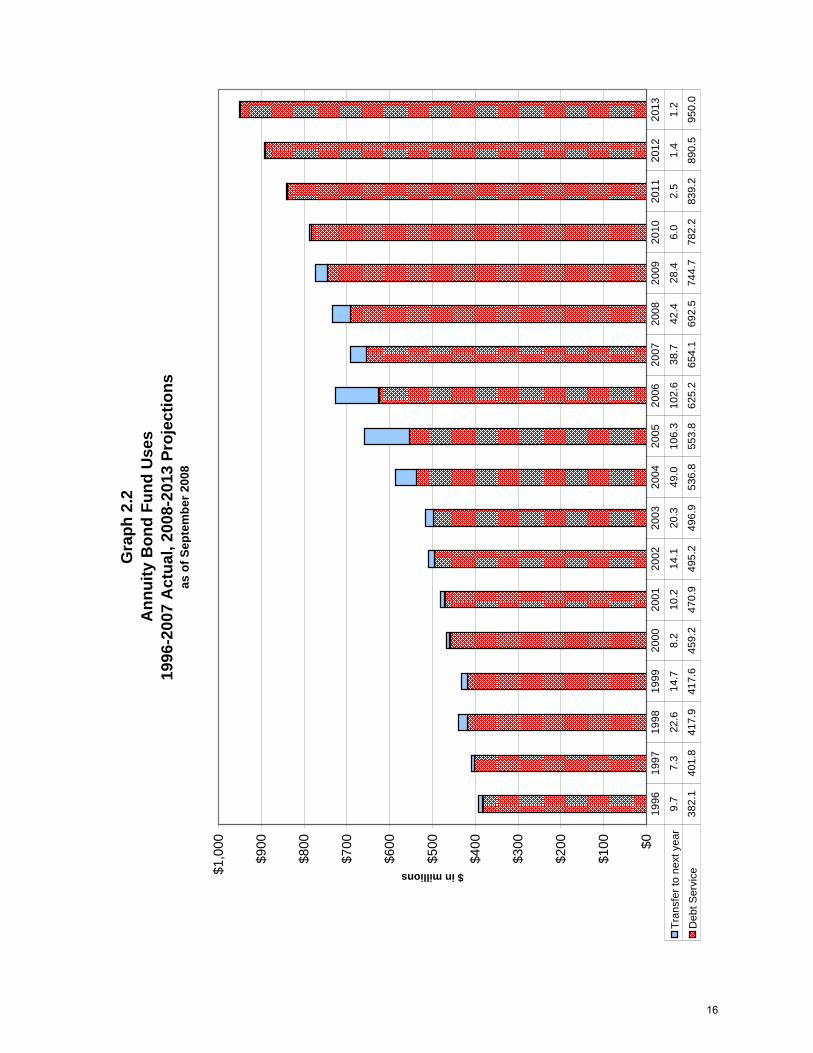
Graphs 2.1 and 2.2 depict the sources and uses, respectively, for the ABF for the actual
years 1996 through 2007 and the projections for fiscal years 2008 – 2013. As depicted in Graph 2.1, the payment of general obligation debt service (i.e., principal and interest) relies on the State property tax and general funds. Prior to fiscal year 2004, the State used general funds, appropriated either to the Annuity Bond Fund or to the Aid to Education program of the State Department of Education, to provide a substantial portion of the general obligation debt service. A general fund appropriation to the Annuity Bond Fund was required to meet debt service in 2008 and, if the fiscal year 2009 tax rate remains constant or is decreased in fiscal years 2010 through 2013, additional general fund appropriations will also be necessary. Projections indicate that general funds are not required to supplement the property tax revenues necessary to cover debt service in fiscal year 2009.
12

In the period between 2003 and 2008, the growth in debt service (Graph 2.2) reflects the
increase in debt outstanding (Graph 1) since this period has seen the lowest interest rates since 1988 as demonstrated in (Graph 3).
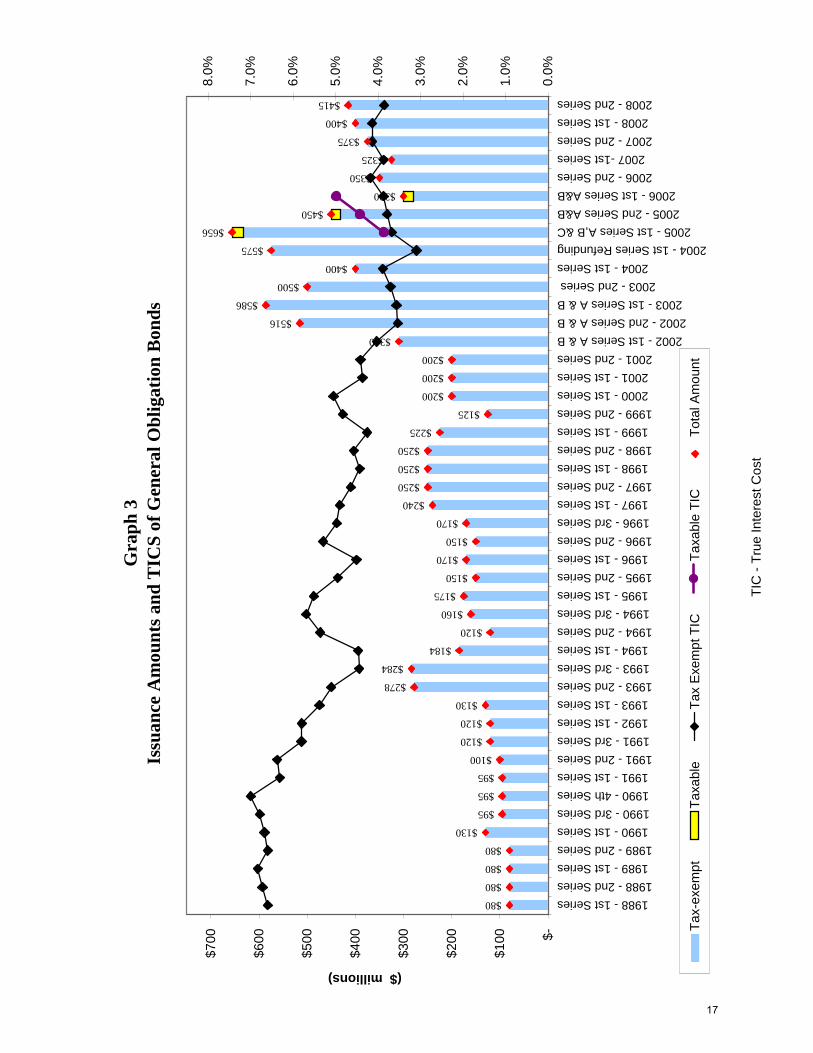
True Interest Costs Graph 3 depicts the true interest costs (TIC) on tax-exempt and taxable State general
obligation debt beginning in 1988 through the sale of the 2008 General Obligation Bonds Second Series that the State sold on July 16, 2008. During the time period analyzed in this chart, the TICs on tax-exempt general obligation debt ranged from a low of 3.098% in the 2004 First Series Refunding to a high of 6.996% in the 1990 Fourth Series. The tax-exempt TIC for the most recent issuance of General Obligation Bonds on July 16, 2008 was 3.857%. The TICs on the three taxable issues in 2005 and 2006 ranged from 3.86% to 4.98%.
13

Gra
ph 1
G
ener
al O
blig
atio
n D
ebt A
utho
rize
d an
d O
utst
andi
ng a
t Jun
e 30
$0.0
$0.5
$1.0
$1.5
$2.0
$2.5
$3.0
$3.5
$4.0
$4.5
$5.0
$5.5
$6.0
$6.5
$7.0
$7.5
$8.0
$ in Billions
Aut
horiz
ed b
ut U
niss
ued
1.4
1.2
0.9
0.9
0.9
0.9
0.8
0.8
0.5
0.6
0.8
0.8
0.9
0.8
1.0
0.9
1.0
1.0
1.1
1.1
1.1
1.1
1.1
1.0
1.0
1.3
1.4
1.7
1.7
1.9
1.8
1.7
1.9
2.0
Tota
l Out
stan
ding
1.40
1.71
2.06
2.17
2.15
2.10
2.20
2.20
2.41
2.31
2.23
2.11
2.03
2.09
2.00
1.98
2.03
2.17
2.27
2.50
2.61
2.86
3.02
3.27
3.50
3.34
3.45
3.54
3.93
4.1
4.51
4.86
5.14
5.49
Tota
l Aut
horiz
ed2.
882.
953.
033.
103.
063.
033.
023.
002.
992.
963.
062.
982.
962.
963.
002.
983.
063.
213.
413.
643.
813.
984.
154.
324.
524.
714.
925.
315.
726.
046.
346.
647.
057.
55
'75
'76
'77
'78
'79
'80
'81
'82
'83
'84
'85
'86
'87
'88
'89
'90
'91
'92
'93
'94
'95
'96
'97
'98
'99
'00
'01
'02
'03
'04
'05
'06
'07
'08
14

Gra
ph 2
.1 A
nnui
ty B
ond
Fund
Sou
rces
1996
-200
7 A
ctua
l, 20
08-2
013
Proj
ectio
nsas
of S
epte
mbe
r 200
8
$0
$100
$200
$300
$400
$500
$600
$700
$800
$900
$1,0
00
($ in millions)
Gen
eral
Fun
d 1
47.0
1
55.9
1
72.0
1
51.8
1
89.3
2
04.3
2
03.6
1
80.4
-
-
-
-
2
9.3
-
16.
0 6
6.0
87.
5 1
25.0
Mis
cella
neou
s R
ecei
pts
7.0
6
.1
4.8
5
.2
7.9
6
.0
7.2
6
.2
9.2
5
.5
4.6
5
.9
3.1
2
.9
2.3
2
.3
2.1
2
.1
Tran
sfer
from
prio
r yea
r 9
.4
9.7
7
.3
22.
6 1
4.7
8.2
1
0.2
14.
1 2
0.3
49.
0 1
06.3
1
02.6
3
8.7
42.
4 2
8.4
6.0
2
.5
1.4
Bon
d P
rem
ium
-net
of d
isc.
-
1.7
1
4.2
5.8
4
.7
5.4
1
8.4
30.
5 8
8.0
89.
0 4
1.8
31.
6 3
9.4
36.
7 -
-
-
-
Pro
perty
Tax
Rec
eipt
s 2
28.3
2
35.6
2
42.2
2
46.9
2
50.8
2
57.1
2
70.0
2
86.0
4
68.4
5
16.5
5
75.1
5
52.7
6
24.4
6
91.1
7
41.5
7
67.4
7
99.8
8
22.7
1996
1997
1998
1999
2000
2001
2002
2003
2004
2005
2006
2007
2008
2009
2010
2011
2012
2013
15
Gra
ph 2
.2A
nnui
ty B
ond
Fund
Use
s19
96-2
007
Act
ual,
2008
-201
3 Pr
ojec
tions
as o
f Sep
tem
ber 2
008
$0
$100
$200
$300
$400
$500
$600
$700
$800
$900
$1,0
00
$ in millions
Tran
sfer
to n
ext y
ear
9.7
7
.3
22.
6 1
4.7
8.2
1
0.2
14.
1 2
0.3
49.
0 1
06.3
1
02.6
3
8.7
42.
4 2
8.4
6.0
2
.5
1.4
1
.2
Deb
t Ser
vice
382
.1
401
.8
417
.9
417
.6
459
.2
470
.9
495
.2
496
.9
536
.8
553
.8
625
.2
654
.1
692
.5
744
.7
782
.2
839
.2
890
.5
950
.0
1996
1997
1998
1999
2000
2001
2002
2003
2004
2005
2006
2007
2008
2009
2010
2011
2012
2013
16
TIC
- Tr
ue In
tere
st C
ost
Gra
ph 3
Issu
ance
Am
ount
s and
TIC
S of
Gen
eral
Obl
igat
ion
Bon
ds$80
$80
$80
$80
$130
$95
$95
$95
$100
$120
$120
$130
$278
$284
$184
$120
$160
$175
$150
$170
$150
$170
$240
$250
$250
$250
$225
$125
$200
$200
$200
$516
$586
$500
$575
$656
$450
$350
$325
$375
$400
$415
$300
$400
$310
$-
$100
$200
$300
$400
$500
$600
$700
1988 - 1st Series 1988 - 2nd Series
1989 - 1st Series1989 - 2nd Series 1990 - 1st Series 1990 - 3rd Series1990 - 4th Series 1991 - 1st Series
1991 - 2nd Series 1991 - 3rd Series 1992 - 1st Series 1993 - 1st Series1993 - 2nd Series 1993 - 3rd Series1994 - 1st Series
1994 - 2nd Series1994 - 3rd Series1995 - 1st Series
1995 - 2nd Series 1996 - 1st Series
1996 - 2nd Series 1996 - 3rd Series 1997 - 1st Series1997 - 2nd Series 1998 - 1st Series1998 - 2nd Series 1999 - 1st Series
1999 - 2nd Series 2000 - 1st Series 2001 - 1st Series
2001 - 2nd Series 2002 - 1st Series A & B
2002 - 2nd Series A & B2003 - 1st Series A & B
2003 - 2nd Series 2004 - 1st Series
2004 - 1st Series Refunding 2005 - 1st Series A,B &C
2005 - 2nd Series A&B 2006 - 1st Series A&B
2006 - 2nd Series 2007 -1st Series
2007 - 2nd Series2008 - 1st Series
2008 - 2nd Series
($ millions)
0.0%
1.0%
2.0%
3.0%
4.0%
5.0%
6.0%
7.0%
8.0%
Tax-
exem
ptTa
xabl
eTa
x E
xem
pt T
ICTa
xabl
e TI
CTo
tal A
mou
nt
17

B. Transportation Debt
Consolidated Transportation Bonds. Purpose Consolidated Transportation Bonds (CTB), like State General Obligation Bonds are 15-
year obligations, issued by the Maryland Department of Transportation (MDOT) for highway and other transportation projects.
Limitations to Debt Outstanding The gross outstanding aggregate principal amount of Consolidated Transportation Bonds
is limited by statute to $2.6 billion. The General Assembly may set a lower limit each year, and for fiscal year 2009 the limit is $1.621 billion. In addition, the Department has covenanted with the holders of outstanding Consolidated Transportation Bonds not to issue additional bonds unless: (1) the excess of Transportation Trust Fund revenues over Department of Transportation operational expenses in the preceding fiscal year is equal to at least twice the maximum amount of debt service for any future fiscal year, including debt service on the additional bonds to be issued; and (2) total proceeds from taxes pledged to debt service for the past fiscal year equal at least twice such maximum debt service or, conversely, total debt service cannot exceed 50% of total proceeds from taxes pledged using the debt service divided by revenues convention.
Security Debt service on Consolidated Transportation Bonds is payable from the Department's
shares of the motor vehicle fuel tax, the motor vehicle titling tax, sales tax on rental vehicles, a portion of the corporate income tax, and a portion of the State sales and use tax. In addition, other receipts of the Department (including motor vehicle licensing and registration fees and operating revenue of the Department) are available to meet debt service if these tax proceeds should become insufficient. The holders of Consolidated Transportation Bonds are not entitled to look to other sources for payment including the federal highway capital grants that are pledged to GARVEE Bonds.
Current Status: Debt Outstanding as of June 30, 2008 $1,268,815,000 Ratings
S&P, AAA Moody’s, Aa2 Fitch, AA Use of Variable Rate Debt, Bond Insurance, Interest Rate Exchange Agreements and Guaranteed Investment Contracts
MDOT does not have variable rate debt or bond insurance on CTBs nor does MDOT use interest rate exchange agreements or Guaranteed Investment Contracts.
18
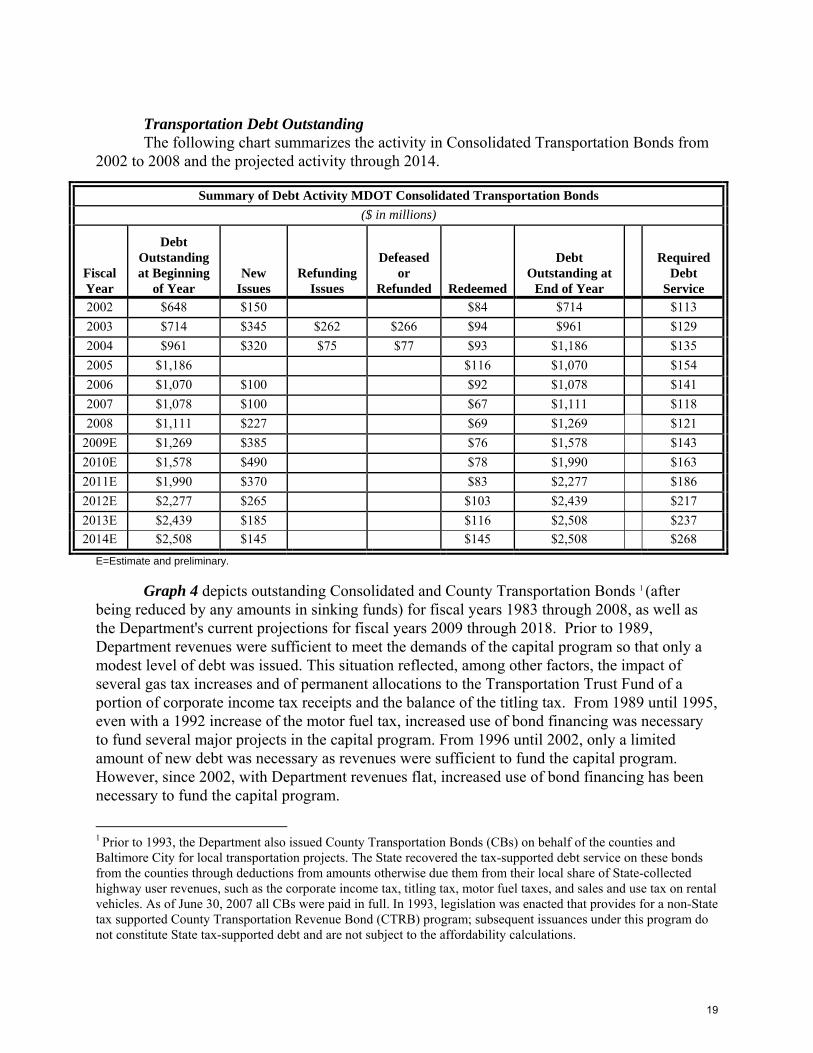
Transportation Debt Outstanding The following chart summarizes the activity in Consolidated Transportation Bonds from 2002 to 2008 and the projected activity through 2014.
Summary of Debt Activity MDOT Consolidated Transportation Bonds ($ in millions)
Fiscal Year
Debt Outstanding at Beginning
of Year New
Issues Refunding
Issues
Defeased or
Refunded Redeemed
Debt Outstanding at
End of Year
Required Debt
Service 2002 $648 $150 $84 $714 $113 2003 $714 $345 $262 $266 $94 $961 $129 2004 $961 $320 $75 $77 $93 $1,186 $135 2005 $1,186 $116 $1,070 $154 2006 $1,070 $100 $92 $1,078 $141 2007 $1,078 $100 $67 $1,111 $118 2008 $1,111 $227 $69 $1,269 $121
2009E $1,269 $385 $76 $1,578 $143 2010E $1,578 $490 $78 $1,990 $163 2011E $1,990 $370 $83 $2,277 $186 2012E $2,277 $265 $103 $2,439 $217 2013E $2,439 $185 $116 $2,508 $237 2014E $2,508 $145 $145 $2,508 $268
E=Estimate and preliminary.
Graph 4 depicts outstanding Consolidated and County Transportation Bonds 1 (after being reduced by any amounts in sinking funds) for fiscal years 1983 through 2008, as well as the Department's current projections for fiscal years 2009 through 2018. Prior to 1989, Department revenues were sufficient to meet the demands of the capital program so that only a modest level of debt was issued. This situation reflected, among other factors, the impact of several gas tax increases and of permanent allocations to the Transportation Trust Fund of a portion of corporate income tax receipts and the balance of the titling tax. From 1989 until 1995, even with a 1992 increase of the motor fuel tax, increased use of bond financing was necessary to fund several major projects in the capital program. From 1996 until 2002, only a limited amount of new debt was necessary as revenues were sufficient to fund the capital program. However, since 2002, with Department revenues flat, increased use of bond financing has been necessary to fund the capital program.
1 Prior to 1993, the Department also issued County Transportation Bonds (CBs) on behalf of the counties and Baltimore City for local transportation projects. The State recovered the tax-supported debt service on these bonds from the counties through deductions from amounts otherwise due them from their local share of State-collected highway user revenues, such as the corporate income tax, titling tax, motor fuel taxes, and sales and use tax on rental vehicles. As of June 30, 2007 all CBs were paid in full. In 1993, legislation was enacted that provides for a non-State tax supported County Transportation Revenue Bond (CTRB) program; subsequent issuances under this program do not constitute State tax-supported debt and are not subject to the affordability calculations.
19

Gra
ph 4
Tran
spor
tatio
n D
ebt O
utst
andi
ng -
Act
ual 1
983-
2008
: Est
imat
ed 2
009-
2018
($ in
mill
ions
)
$0
$500
$1,0
00
$1,5
00
$2,0
00
$2,5
00
$3,0
00
1983
1984
1985
1986
1987
1988
1989
1990
1991
1992
1993
1994
1995
1996
1997
1998
1999
2000
2001
2002
2003
2004
2005
2006
2007
2008
2009E
2010E
2011E
2012E
2013 E
2014E
2015 E
2016E
2017 E
2018E
Con
solid
ated
Tra
nspo
rtatio
n B
onds
Cou
nty
Tran
spor
tatio
n B
onds
Tota
l MD
OT
Deb
t Out
stan
ding
20

C. Grant Anticipation Revenue Vehicles “GARVEE” Bonds
Purpose Grant Anticipation Revenue Vehicle (GARVEE) Bonds are used as one of several
sources of a funding plan for the Intercounty Connector (ICC) project, in addition to Maryland Transportation Authority funds, Transportation Trust Fund (TTF), General Funds, and other sources. Use of GARVEEs on the ICC is intended to allow the project to be implemented sooner than otherwise would be possible and with less reliance on the State’s available funds in the short term.
Limitations
The authorizing Statute limits the total amount that can be issued for GARVEEs at $750 million, with a maximum maturity of 12 years. Under State law, the proceeds can only be used for the ICC. Legislation enacted by the 2005 General Assembly specified that GARVEE Bonds should be considered tax-supported debt in the Capital Debt Affordability analysis.
Security
GARVEEs are bonds for which debt service is paid using federal transportation funds received by the State. The annual debt service for these bonds will use approximately 15% of the current average annual federal highway funding received by Maryland. In addition, there is a subordinate pledge of certain Maryland State Transportation Trust Fund (TTF) tax sources.
Current Status: Debt Outstanding as of June 30, 2008 $300,655,000 Ratings
In May 2007, Standard & Poor’s rated these bonds AAA; Moody’s Investors Service and Fitch Ratings rated them AA.
Issuances In May 2007, the Maryland Transportation Authority sold $325 million of GARVEE Bonds. The remaining authorization of $425 million is scheduled for issuance in Fiscal Year 2009. The timing and amounts of this issuance may be modified, as the funding plan is refined.
Use of Variable Rate Debt, Bond Insurance, Interest Rate Exchange Agreements and Guaranteed Investment Contracts
The 2007 Series GARVEE Bonds are fixed rate bonds and were issued without bond insurance due to the TTF back-up pledge and a debt service reserve fund surety policy issued by FSA for the maximum semi-annual interest due on bonds. The Authority has not used interest rate exchange agreements or guaranteed investment contracts for any of the GARVEE trust funds.
21

D. Lease and Conditional Purchase Financings The State has financed assets using leases; specifically capital leases, energy leases and conditional purchase financings using Certificates of Participation (COPS).
Capital Leases Purpose The State's capital funding program has included the use of capital lease financings in
which the State builds an equity interest in the leased property over time and gains title to such property at the end of the leasing period. Capital leases are used for the acquisition of both real property and equipment.
Such capital leases are considered debt of the State by financial analysts, rating agencies
and under generally accepted accounting principles (GAAP). According to GAAP, leases that are in essence a vehicle for financing assets must be "capitalized" - i.e., reflected on the balance sheet as both an asset and debt.
Security Payments from the State are subject to appropriation. The State has represented to the
lessors that it will do all things lawfully within its power to obtain, maintain, and pursue funds to make the Lease Payments. In the event of non-appropriation, the State will surrender the secured property to the lessor.
The additional State liability and debt service resulting from capital leases is not large in
relation to the State's general obligation debt outstanding and debt service at this time. Only those capital leases which are tax supported are incorporated in the affordability analysis; revenue-backed leases, while capitalized, are not. Ratings Leases are not rated. Lease Terms Under current practice, capital leases for equipment, primarily computers and telecommunications equipment, are generally for periods of five years or less. Real property capital leases are longer term (in the range of 20 to 30 years) and have been used to acquire a wide variety of facilities, including courts, office buildings and, most recently, a new parking garage in Annapolis. In all leases, the term of the lease does not exceed the economic life of the property. Projections of Future Lease Activity The State Treasurer’s Office (STO) periodically surveys State agencies about their plans to finance equipment using capital leases. As a result of the survey done in the Spring of 2007 and recent lease activity, the STO is projecting the financing of $70 million of equipment in fiscal years 2009 through 2011.
22
Energy Leases In another instance of the use of the capital lease structure, the State began using lease-
purchase agreements to provide financing for energy conservation projects at State facilities in March 1994. Lease payments are made from the agencies' annual utility appropriations using savings achieved through the implementation of energy performance contracts. The State Treasurer’s Office has discussed future energy lease activity with the Department of General Services (DGS) and because of renewed interest in this program, the STO currently projects approximately $33 million of new energy leases in fiscal years 2009 through 2011. The term of the energy leases cannot exceed 15 years. Conditional Purchase Financings Purpose State Agencies have also made significant use of Certificates of Participation (COPs), another form of conditional purchase debt financing. Some COPS are not considered to be tax supported, such as: the Department of Transportation’s COPs to provide financing for capital improvements at Baltimore-Washington International Thurgood Marshall Airport; the expansion of parking at the Maryland Rail Commuter (MARC) BWI rail station; and the construction of a warehouse at the Maryland Port Administration’s South Locust Point Terminal. Revenues from these projects are pledged to the payment of principal and interest on the certificates. Therefore, these are not considered tax supported and are not included in the capital lease component in Tables 1 and Tables 2a and 2b of this report. Limitations to Non-Traditional Transportation Debt The 2007 General Assembly established a limit of $726.2 million at June 30, 2008 for total aggregate outstanding and unpaid principal balance of nontraditional debt issued by the Department of Transportation. Non-traditional debt is defined as any debt instrument that is not a Consolidated Transportation Bond or a GARVEE Bond. This includes Certificates of Participation and other forms of transportation capital leases both tax and non-tax supported. As of June 30, 2008, the Department had non-traditional debt outstanding in the total principal amount of $726.2 million.
23
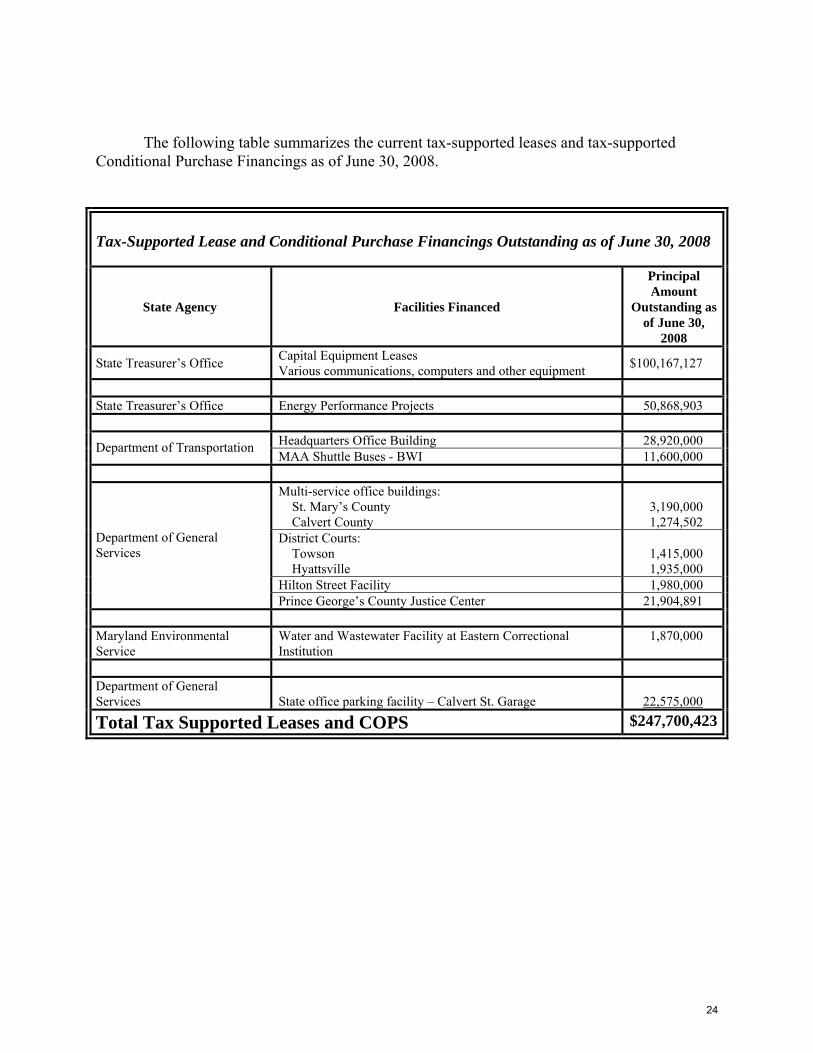
The following table summarizes the current tax-supported leases and tax-supported Conditional Purchase Financings as of June 30, 2008. Tax-Supported Lease and Conditional Purchase Financings Outstanding as of June 30, 2008
State Agency Facilities Financed
Principal Amount
Outstanding as of June 30,
2008
State Treasurer’s Office Capital Equipment Leases Various communications, computers and other equipment $100,167,127
State Treasurer’s Office Energy Performance Projects 50,868,903
Headquarters Office Building 28,920,000 Department of Transportation MAA Shuttle Buses - BWI 11,600,000
Multi-service office buildings: St. Mary’s County Calvert County
3,190,000 1,274,502
District Courts: Towson Hyattsville
1,415,000 1,935,000
Hilton Street Facility 1,980,000
Department of General Services
Prince George’s County Justice Center 21,904,891 Maryland Environmental Service
Water and Wastewater Facility at Eastern Correctional Institution
1,870,000
Department of General Services
State office parking facility – Calvert St. Garage
22,575,000
Total Tax Supported Leases and COPS $247,700,423
24

E. Maryland Stadium Authority Purpose The Maryland Stadium Authority was created in 1986 as an instrumentality of the State
responsible for financing and directing the acquisition and construction of professional sports facilities in Maryland. Since then, the Authority’s responsibility has been extended to include convention centers in Baltimore City, Ocean City and a conference center in Montgomery County, and the Hippodrome Theater in Baltimore, Maryland. A history of the Stadium Authority’s financing is in Appendix B.
Security Lease rental payments subject to annual appropriation by the State are pledged to pay
debt service on the bonds. Revenues from certain select lottery games are transferred to the Stadium Authority for operations and to cover the State’s capital leases payments to the Stadium Authority.
Ratings Long-Term Ratings are: S&P, AA+; Moody’s, Aa2; Fitch, AA Short-Term Ratings are: S&P, A1+; Moody’s, VMIG1; Fitch, F1+ Use of Variable Rate Debt, Bond Insurance, Interest Rate Exchange Agreements and Guaranteed Investment Contracts The Stadium Authority has issued variable rate debt that has been swapped to fixed rate.
The counterparties on the swaps are AIG-FP and Ambac. Current Debt at June 30, 2008
Debt Outstanding as of June 30, 2008 FY 2008 Debt
Service
Revenue Sources for FY 2008 Debt
Service Oriole Park at Camden Yards $113,645,000 $14,258,297 Lottery Baltimore City Convention Center 28,385,000 5,055,810 General Fund Ocean City Convention Center 9,655,000 1,482,419 General Fund Ravens Stadium 71,210,000 7,118,414 Lottery Montgomery County Conference Center
19,815,000
1,758,550
General Fund
Hippodrome Theater
17,000,000
1,788,373
General Fund and $2 ticket charge
Camden Station Renovation 8,360,000 645,813 Lottery Totals $268,070,000 $32,107,676
2008 Issuances/ Projections of Future Issuances There were no issuances in 2008. As of June 30, 2008, the Authority has no pending
finance plans in fiscal year 2009 other than an energy lease financing that has been included in the energy lease projections.
25
F. Bay Restoration Fund Revenue Bonds (Bay Restoration Bonds) Purpose
Proceeds of these bonds will fund grants to waste water treatment plants (WWTP) for upgrades to remove nutrients thereby reducing nitrogen loading to the Chesapeake Bay and its tributaries.
Security Legislation enacted by the 2004 General Assembly (Chapter 428, Laws of Maryland
2004) established a Bay restoration fee which will be deposited in the Bay Restoration Fund and administered by the Water Quality Financing Administration of the Maryland Department of the Environment. Fee revenue from WWTP users will support the debt service on these bonds.
Current Status: Debt Outstanding as of June 30, 2008 $50,000,000 Ratings
In May 2008, Moody’s Investors Service rated these bonds Aa2 Use of Variable Rate Debt, Bond Insurance, Interest Rate Exchange Agreements and Guaranteed Investment Contracts
None
Projections of Future Issuances The timing and amount of bonds issued will depend on the fee revenue attained and the
need for funding as upgrades of WWTP proceed. For purposes of the CDAC calculations, it is assumed that the bonds will be limited to 15-year maturities with a total issuance of $530 million. Future estimated issuance is projected (in millions) at $70, $80, $150 and $180 in fiscal years 2009-2012, respectively.
26

III. CAPITAL PROGRAMS A. State of Maryland Capital Program Capital Program Structure
The State's annual capital program includes projects funded from General Obligation Bonds, general tax revenues, dedicated tax or fee revenues, federal grants, and auxiliary revenue bonds issued by State agencies. The General Obligation Bond-financed portion of the capital program consists of an annual Maryland Consolidated Capital Bond Loan (MCCBL). The MCCBL is a consolidation of projects authorized as general construction projects and various Administration-sponsored capital programs for capital grants for non-State-owned projects and, in recent years, separate individual legislative initiatives. General Obligation Bond funds are often supplemented with State general fund capital appropriations (PAYGO) authorized in the annual operating budget. The amount of funds available to fund capital projects with operating funds varies from year to year. For example, FY 2002 general fund PAYGO appropriations totaled $643.9 million, the FY 2006 general fund PAYGO appropriation totaled $2.5 million, and the FY 2009 general fund PAYGO appropriation totaled $16.2 million. The operating budget also traditionally includes PAYGO capital programs funded with (i) a broad range of dedicated taxes, loan repayments, and federal grants such as the State’s Drinking Water Revolving Loan Program and the Water Quality Revolving Loan Program, (ii) individual dedicated revenue sources such as the property transfer tax which supports the State’s land preservation programs, and (iii) specific federal grants which provide funds for armory construction projects, veteran cemetery expansion projects, and housing programs. State-Owned Facilities
Requests for improvements to State-owned facilities are expected to reach over $4.3 billion during the next five years. Higher Education, prisons, State offices, and health facilities comprise the bulk of these requests. State Capital Grants and Loans State capital grants and loans are allocated to local governments and non-profit organizations. These grants and loans are primarily used to improve existing, and construct new public schools and community college buildings. Grants and loans are also used to restore the Chesapeake Bay, improve and expand access to quality health care, and revitalize existing communities. Authorizations for capital grants and loans have increased in recent years to accommodate the need to improve the State’s public elementary and secondary schools. Future requests for funding are expected to remain high for public schools, community colleges, and environmental programs. The need for funding environmental programs reflects the State’s
27
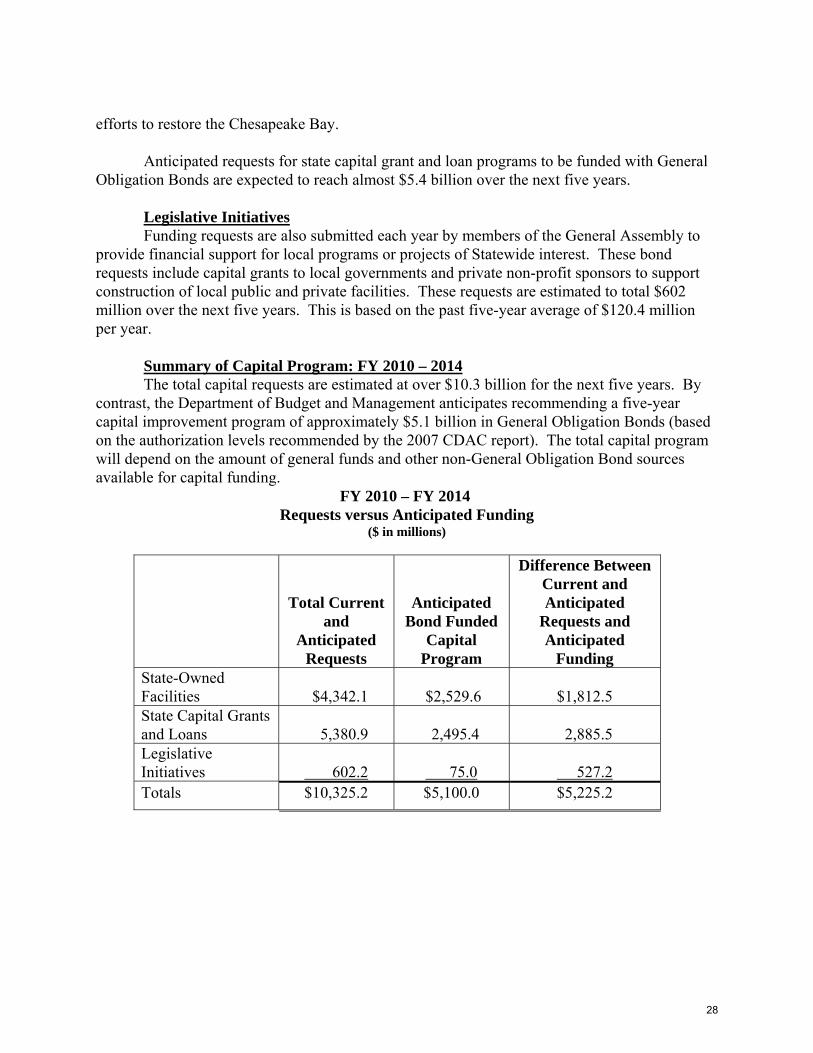
efforts to restore the Chesapeake Bay. Anticipated requests for state capital grant and loan programs to be funded with General Obligation Bonds are expected to reach almost $5.4 billion over the next five years. Legislative Initiatives Funding requests are also submitted each year by members of the General Assembly to provide financial support for local programs or projects of Statewide interest. These bond requests include capital grants to local governments and private non-profit sponsors to support construction of local public and private facilities. These requests are estimated to total $602 million over the next five years. This is based on the past five-year average of $120.4 million per year. Summary of Capital Program: FY 2010 – 2014 The total capital requests are estimated at over $10.3 billion for the next five years. By contrast, the Department of Budget and Management anticipates recommending a five-year capital improvement program of approximately $5.1 billion in General Obligation Bonds (based on the authorization levels recommended by the 2007 CDAC report). The total capital program will depend on the amount of general funds and other non-General Obligation Bond sources available for capital funding. FY 2010 – FY 2014
Requests versus Anticipated Funding ($ in millions)
Total Current and
Anticipated Requests
Anticipated Bond Funded
Capital Program
Difference Between Current and Anticipated
Requests and Anticipated
Funding State-Owned Facilities
$4,342.1
$2,529.6
$1,812.5
State Capital Grants and Loans
5,380.9
2,495.4
2,885.5
Legislative Initiatives
602.2
75.0
527.2
Totals $10,325.2 $5,100.0 $5,225.2
28

B. Capital Improvement and School Construction Needs During the Next 5 Fiscal Years, as Projected by the Interagency Committee on School Construction
The General Assembly passed the Public School Facilities Act of 2004 (Chapters 306 and 307, Laws of Maryland, 2004) which, among other provisions, declared the intent that the State pursue a goal of fully funding by fiscal year 2013 the school facility needs identified by the 2003 School Facility Assessment Survey. Achieving this goal would require a commitment by the State to provide approximately $2 billion for school construction projects over 8 years (Fiscal Year 2006 to Fiscal Year 2013) or approximately $250 million per year.
The Public School Facilities Act, in uncodified Section 11, directs the Capital Debt
Affordability Committee to review the additional school construction funding needs identified in the Task Force report and make a specific recommendation regarding additional funding for school construction when recommending the State’s annual debt limit.
In 2003, at the request of the Task Force to Study Public School Facilities, the Maryland
State Department of Education conducted a survey to determine the extent to which public school facilities Statewide meet current federal, State, and local facility standards and can support required programs and expected enrollment. The results, reported in November 2003, indicated that more than one-third of public schools were deficient in at least one facility standard and that the cost of the necessary improvements was $3.85 billion in 2003 dollars. The Public School Construction Program (PSCP) determined in February 2005 that this figure would be approximately $4.32 billion (or a 12% increase) in 2005 dollars due to increases in the cost of steel, cement, other material components, and labor. The PSCP estimated that costs increased by approximately 12% annually in fiscal 2007 and 2008. Increases in school construction costs appear to have stabilized recently with costs estimated to hold steady in fiscal 2009 and increase a modest 4% in fiscal 2010. For discussion purposes, this Report refers to the documented $3.85 billion, but the Committee acknowledges the impacts of inflation. The Task Force recommended that the State assume $2 billion of this cost with the remainder the responsibility of local government under the State-local cost share formula for school construction.
In fiscal 2009 public school construction received $340.1 million from G.O bonds, contingency funds and PAYGO following a record-setting $401.8 million in fiscal 2008, the highest amount for the program since its creation in 1971. Fiscal 2009 marks the fourth year in a row that the Governor and General Assembly have met or exceeded the $250 million annual funding goal set in the 2004 Public School Facilities Act. The Governor and the General Assembly have utilized several of the alternatives recommended by the Committee in 2004 to increase State school construction funding: use a combination of general obligation debt which involves both reducing and delaying funds for some other State capital projects; use unspent school construction funds from prior years available in the contingency fund; and to a very limited extent, use PAYGO. In fiscal 2009, about one-third ($327.4 million) of the $935 G.O. debt authorization was allocated to public school construction. In this report, the Committee has recommended $1,110 million in authorizations for fiscal year 2010, of which at least $325 million should be allocated for school construction.
29

The fiscal 2009 CIP projects $250 million annually in G.O. Bonds for public school construction in fiscal 2010 through 2013, which would achieve the State’s nominal funding goal. It is important to recognize, however, that escalation in building costs since 2004 has significantly raised the actual cost of the basic goal of the Public School Facilities Act: to bring all public schools up to minimum standards by 2013. The Committee’s recommendation of at least $325 million in fiscal 2010 helps to address the higher construction costs experienced several years ago and keep pace with the current costs.
30
IV. BOND RATING AGENCY REPORTS As part of the evaluation and consideration of options to change or retain the debt outstanding to personal income criterion, the Committee reviewed a report titled Moody’s State Debt Medians and the ongoing rating agency reports regarding debt affordability. Staff also visited the rating agencies to report on CDAC’s evaluation of the affordability criteria and to solicit the agencies’ opinions of options under consideration to change the criteria. A complete discussion of these reports and meetings is in Section V. This Section IV reviews the ongoing rating reports issued in conjunction with the issuance of bonds and the annual report from Moody’s titled “States Credit Scorecard 2008.” A. Excerpts from Rating Agency Reports Issued in Conjunction with the Sale of $415 Million of General Obligation Bonds State and Local Facilities Loan of 2008, Second Series In the affirmation of the State’s AAA General Obligation Bond rating in July 2008, the rating agencies reported on the status of Maryland’s financial condition and economy. Implicit in their analysis are the criteria that the rating agencies consider in evaluating a state’s credit. Included below are salient points from each of the rating agency reports. The State Treasurer’s Office sent the complete reports to the Committee members. Standard and Poor’s In their report dated July 11, 2008 S&P noted:
• Diverse, broad-based economy, which has historically outperformed the national economy;
• High wealth and income levels; • Long history of prudent fiscal management, including making difficult fiscal
decisions to restore structural budget balance when necessary. Moody’s Investors Service In the report dated July 14, 2008, Moody’s noted that the State has taken decisive action to address a significant fiscal 2009 budget gap stemming from previously enacted income tax reductions, increased funding for education, and a slowing economy. Credit strengths that were noted include: a strong economy with high personal income levels and a history of strong financial management and adequate reserve levels despite recent draws on available balances. Moody’s indicates the following credit challenges: continuing budget pressure, low retirement system funded levels and above average debt burden. Fitch Ratings Fitch’s report was issued on July 11, 2008. “The ‘AAA’ rating reflects the state’s sound financial operations, wealthy, diversified economy, and policies keeping debt within affordability guidelines. The state has taken prompt and repeated action to preserve operating balance, through enactment of an array of tax increases, a draw on the rainy day fund and several rounds of spending cuts.”
31
B. States Credit Scorecard 2008 Moody’s issued a report in July 2008 titled U.S. States Credit Scorecard 2008 which was reviewed by the Committee. Purpose of the Report Moody’s ranked the 50 states on four variables - Financial, Economic, Debt and Governance. Moody’s noted some limitations in this methodology; namely, it is backward-looking, it does not identify trends, and there may be insignificant differences in the ranking between the states. Nevertheless, the scorecard provides the reader with important information on the ratings process and the relative ranking of each state. Rankings Maryland’s overall ranking was in the top quintile for 2007 and 2008. Specifically, in the Financial Rankings, Maryland was in the first quintile in 2007 and the second quintile in 2008. The Debt ranking went from the second quintile in 2007 to the third quintile in 2008. In both years, the Economic ranking was in the second quintile and the Governance ranking was in the highest quintile.
32
V. EVALUATION OF AND CHANGE TO AFFORDABILITY CRITERIA
A. Background
In 2007, CDAC responded to a request from the General Assembly to evaluate and
review the self-imposed affordability criteria then in effect – debt outstanding should not exceed 3.2% of personal income and debt service should not exceed 8.0% of revenues. This evaluation was described in Section VII of the 2007 CDAC report. That section concluded with the Committee’s recommendation for continued study and evaluation of the criteria, including consultation with the rating agencies before any changes would be made. Throughout the summer of 2008, the Committee continued this study and considered options to change the debt outstanding to personal income criterion. On September 8, 2008 the Committee, by a vote of 4-1, approved the change of the debt outstanding to personal income criterion from 3.2% to 4.0%. The criterion of debt service to revenues did not change from 8.0%. The following documents CDAC’s evaluation and deliberations throughout this period.
B. Status of the Criteria in May 2008
In 2007, CDAC recommended an authorization level for the 2008 Legislative Session
and projected future authorizations that kept both the debt outstanding and the debt service within the affordability criterion. In these projections, the debt outstanding to personal income ratio was approaching the 3.2% benchmark and peaked at 3.15% in 2011 and 2012. The analysis indicated that there was limited additional capacity using the 3.2% criterion for debt outstanding to personal income compared to the capacity using the debt service to revenues benchmark. Clearly, the debt outstanding to personal income ratio had become the “controlling” criterion.
By May 2008, assumptions had changed. The 2007 1st Special Session increased general
fund and transportation revenues and authorizations for Consolidated Transportation Bonds grew from $2.0 billion to $2.6 billion. As the economy continued to decelerate, projections for the growth in personal income also declined. As a result, in years 2010 through 2016, the projections showed that the debt outstanding to personal income ratio would exceed 3.2%. However, because of the increased revenues, and even with the increased debt service on Transportation Bonds, the debt service to revenues ratio actually improved from the 2007 projections. For instance, the debt service to revenues ratio of 5.76% and 6.27% for 2008 and 2009 in the 2007 CDAC Report improved to 5.60% and 5.97% for the same years in the 2008 Report.
C. History of Criteria The CDAC continued its evaluation of the criteria by reviewing the actions and deliberations of prior committees. Specifically the committee was interesting in evaluating the circumstances that led to the establishment of the criteria, any changes since that time and whether any other criteria are appropriate. This section summarizes the information presented to the committee on these topics.
33
Between 1979 and 1986 the CDAC considered and evaluated three criteria before recommending General Obligation Bond authorizations. The criteria were:
1) Debt Outstanding should not exceed 3.2% of personal income; 2) Debt Service should not exceed 8.0% of revenues; and 3) “New authorizations should be kept in the range of redemptions over the near term.”
(This criterion was also known as the “get out of debt” criterion and it was the controlling criterion during these years. Because new authorizations matched redemptions or principal payments, the total debt outstanding was essentially frozen while revenues and personal income grew over these years. The third criterion satisfied the goal of the Committee to reduce what was considered to be a high debt level.)
The benchmarks for the criteria were based on the committee’s discussions and in consultation with municipal finance specialists.2 The benchmarks were also established with these standards in mind; “(1) Maryland’s high income and wealth base, (2) the relatively high level of current debt, and (3) the speed with which Maryland’s debt levels can decline due to the relatively short (15 year) repayment period.”3
In 1987, the CDAC determined that the third criterion was no longer appropriate4 and
also acknowledged that the remaining two criteria were originally established for General Obligation Bonds only.5 Also, the Committee’s analysis had expanded to encompass all tax-supported debt, which included Transportation Bonds, capital leases and Stadium Authority Bonds (later codified by Chapter 241, Laws of Maryland, 1989). The 1987 CDAC Report included all these components into tax supported debt because “the rating agencies and investment community make a more comprehensive measure of Maryland’s debt …”6
Nevertheless, the Committee continued to use the original criteria of 3.2% and 8.0% while recognizing that ultimately they would need to develop techniques to insure that major components of tax-supported debt are in appropriate balance. In the 1987 report the Committee also noted that, “At the present time, the Committee is not prepared to recommend a set of principles for allocating the comprehensive affordability limit.”7 Discussion continued in 1988 and after a survey of market participants, the Committee decided that the criteria need not be changed. The Committee felt that despite the inclusion of other tax supported debt, the continuity of the criteria was important, particularly since Maryland’s debt levels exceeded the national median.8 Equally important, the Committee’s decision was influenced by the fact that both ratios remained well within the guidelines. This is displayed in Appendix C-3 which provides a history of the actual ratios.
2 Page i, Report of the Capital Debt Affordability Committee, August 1, 1979 3 Page 21, Report of the Capital Debt Affordability Committee, August 1, 1979 4 1987 CDAC Report, page 33 5 1987 CDAC Report, page 31 6 1987 CDAC Report, page 31 7 1987 CDAC Report, pages 33 and 34 8 1988 CDAC Report, page 19
34

GARVEE Bonds and Bay Restoration Bonds were also identified as tax-supported debt beginning in 2007 and 2008, respectively. The inclusion of these components does not impact the debt service to revenues criterion to the same extent as the debt outstanding to personal income criterion because the additional debt service is offset by dedicated revenues. However, when comparing debt outstanding to personal income, even though not all tax-supported debt is supported by general fund revenue, there are no similar adjustments to personal income.
In summary, the themes that emerged from this review were that the scope of tax-supported debt has changed dramatically since the CDAC first established the affordability ratios in 1979. However as the scope of tax-supported debt increased the ratios remained unchanged. Additionally, the ratios were crafted within the necessity of decreasing the State’s debt burden, which was one of the highest in the country. Although current circumstances are different from what existed in the late seventies, the Committee was impressed by the longevity of the criteria and that any changes should be long-term. D. Survey of Other States’ Criteria Informal surveys of other states conducted in 2007 and 2008 produced two conclusions. First, it was clear that States differ widely on what is financed by their tax-supported debt. For example, some states may finance public school construction, while in other states, it is a local responsibility. Therefore a comparison of ratios among the states may be misleading as the overall debt burden on the citizens may be identical but the allocation between state and local debt may differ significantly. Second, of those surveyed, most states focus on the debt service to revenues criterion. While states may measure debt outstanding to personal income and debt per capita, many believe that the driver of debt affordability should be the debt service to revenues calculation since this is the measure that they can control and reflects their ability to repay. E. Rating Agency Guidance
The rating agencies frequently reference debt outstanding as a percent of personal income in their rating reports. This ratio is widely used because personal income is an independent, consistent measure that is readily available through the federal Bureau of Economic Analysis. Fitch Ratings notes that, “The burden of state debt is best measured by relating net tax-supported (or resource supported) debt to personal income as state revenue systems are based on consumption and income, unlike those of local government that depend primarily on real estate values translated into property tax revenues.”9 In addition, Moody’s issues an annual State Debt Medians Report ranking the states using this criterion. In the 2008 report, Maryland ranked 21st among the states with a ratio of 3.0% while the mean and median among all states were 3.2% and 2.6% respectively. Of the nine states that Moody’s rates AAA, Delaware’s ratio is 5.2%, four of the AAA states range between 3.3% and 2.8% and the remaining four range between 2.1% and 1.9%.
On August 19, 2008, CDAC staff representatives met with each of the rating agencies to
9 Fitch Ratings, December 5, 2006
35
discuss the Committee’s evaluation of the affordability critera. The following themes emerged from the discussion:
• Debt policy, total indebtedness and debt affordability criteria are just a part of the total evaluation of a state’s credit strength. Rating agencies view control of tax-supported debt as one of four key factors affecting credit quality. The other factors include economic vitality and diversity, fiscal performance; and administrative capabilities of government, especially long term financial and capital planning and financial flexibility.
• The process of developing, reviewing and monitoring a debt policy and affordability criteria is more important than the actual benchmarks.
• The rating agencies expect the State to consider infrastructure needs and the impact of delays to the capital program.
All of the rating agencies were impressed by Maryland’s thorough debt authorization
process. While none of the rating agencies would give specific guidelines for affordability criterion for a AAA state, they all indicated that the criterion could change. In fact, two of the rating agencies noted that, to the best of their knowledge, no other state has held to a 1970’s threshold. They suggested that the State document any motivation for changing the ratio and rationale for choosing a new ratio. One rating agency encouraged the continued reporting of the personal income ratio, even if only as a point of reference. Another cautioned that pension and OPEB liabilities may play a bigger role in their assessment of a state’s debt burden in the future. F. Analysis
The Committee reviewed the fundamentals of the revenue and personal income variables and as a result, standardized the calculation of revenues for all components of tax-supported debt. In prior years, revenues for GARVEE Bonds and Bay Restoration Bonds had been limited to the amount of debt service paid. Beginning in the 2008 analysis, all federal capital highway revenues and Bay Restoration fees are included. This adjustment matches the convention used by CDAC for all other tax-supported debt. For instance, General Obligation Bonds include all available revenues from the general fund and Annuity Bond Fund; revenues were not restricted solely to debt service on G.O. Bonds. Also, in a relatively insignificant change, all miscellaneous revenues that are projected for the Annuity Bond Fund will be included in revenues.
The Committee also examined the results of multiple scenarios and sensitivity analyses in
their quest to determine the most appropriate affordability criteria for the State. A discussion of these analyses follows:
• Reduce authorizations: The analysis indicated that authorizations would need to be reduced by a cumulative $945 million over three years in order to maintain the debt outstanding to personal income ratio at 3.2%. As the growth in personal income declined throughout the summer, this total reduction grew to over $1 billion by September. The analysis also indicated that the reductions could have been recovered with increased authorizations beginning in 2012.
36
• Determine personal income ratio if debt service to revenues was approximately 8.0%: The analysis indicated that if authorizations and issuances increased so that the debt service to revenues ratio was about 8.0%, the personal income ratio would be about 3.5%.
• Adjust personal income to growth levels experienced in early 1990’s: This analysis
indicated that if the growth in personal income declined to levels seen in the recession of the early 1990s, the ratio of debt outstanding to personal income would increase approximately .3%.
• Increase Bay Restoration Bonds an additional $250 million: As part of its due
diligence, the CDAC reviews the future financial plans of the issuers of tax-supported debt. However, the potential for unanticipated changes (e.g., new tax-supported issuances or timing changes to current issuance plans) exists. This sensitivity analysis assumed that an additional $125 million of Bay Restoration Bonds would be issued in both 2013 and 2014. The result was an increase in the debt outstanding to personal income ratio of approximately .07%.
• Include slots in general fund revenues: This analysis assumed that the referendum
passed in the fall of 2008. If slot revenues were achieved as projected by the Department of Legislative Services, the debt service to revenues ratio would decrease by about .2% beginning in 2014.
• Stress interest rates: In this pro-forma, rates were increased by .25% beginning in
2009 through 2018. The effect of this was a gradual increase in the debt service to revenues ratio of .01% in 2010 to .07% in 2018.
G. Consideration of Options
As the Committee deliberated on the options to retain or change the affordability ratios, they informally adopted the following principles/goals:
• The debt service to revenues benchmark of 8.0% would not change and it would become the controlling criterion.
• If the personal income ratio changed, it would be a long-term change and not a harbinger of frequent changes.
• To the extent that it is affordable, the Committee would remain committed to the Capital Program and support critical investment in Maryland’s infrastructure that enhances the State’s income and wealth.
The Committee reviewed a “decision tree” that mapped all possible options for the debt outstanding to personal income criterion. The decision tree also included the pros and cons of each option. A copy is on pages 39 and 40.
37

H. Decision The Committee voted on September 8, 2008 to retain the 8.0% debt service to revenues criterion and to change the debt outstanding to personal income criterion from 3.2% to 4.0%. The motion was adopted on a vote of 4-1, with Treasurer Kopp, Secretary Foster, Secretary Porcari, and Mr. Meritt voting in favor; Comptroller Franchot, who favored the retention of the 3.2% ratio, voted in opposition. In its consideration of the new criterion, the Committee considered the currently projected levels of debt outstanding to personal income as a baseline for future adjustment. In order to ensure the long-term viability of a new criterion the Committee carefully weighed the potential impact of additional authorizations and the impact of economic cycles on personal income. Based on the sensitivity analyses performed in these areas the Committee felt a change of the debt outstanding to personal income criterion to 4.0% would allow capacity that matches the 8.0% criterion plus some flexibility for unforeseen changes.
38
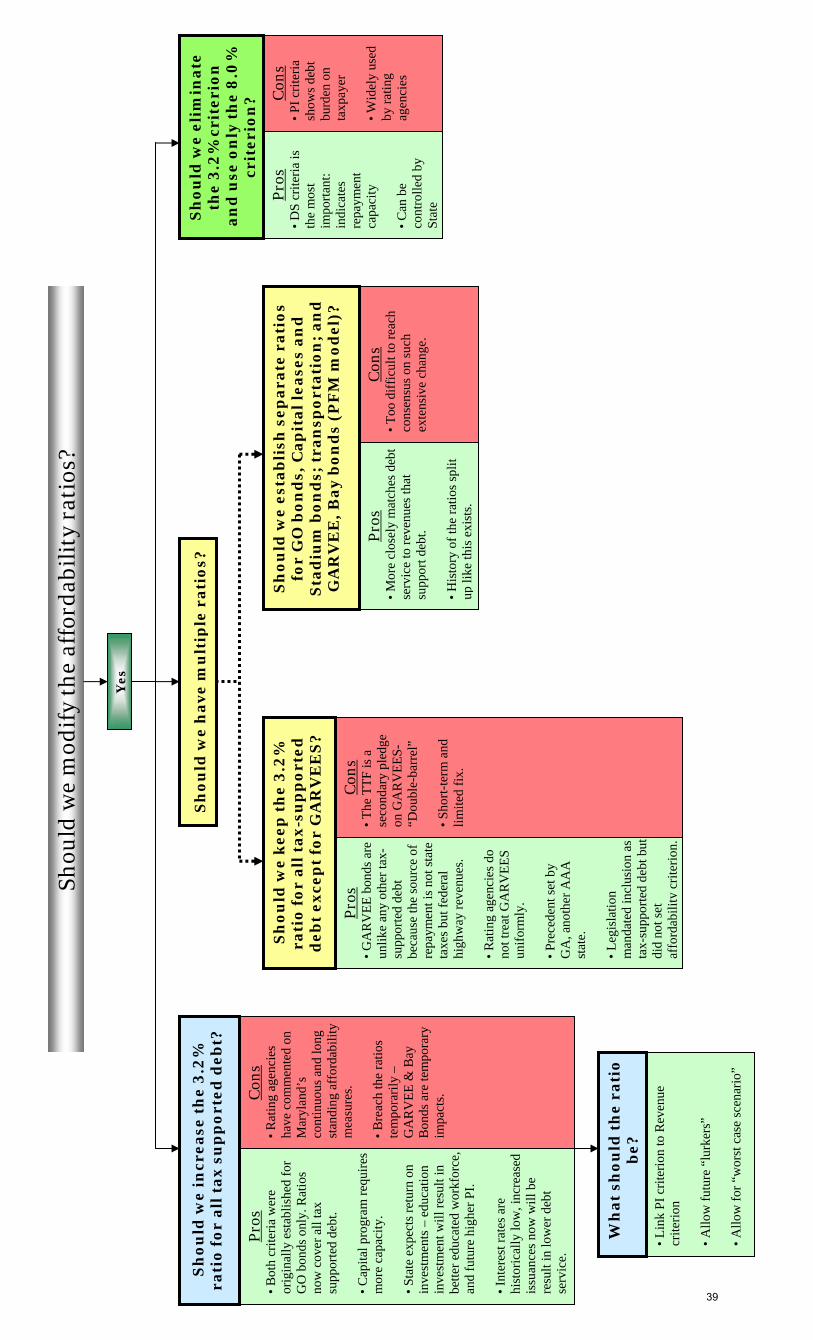
Pro
s • B
oth
crite
ria w
ere
orig
inal
ly e
stab
lishe
d fo
r G
O b
onds
onl
y. R
atio
s no
w c
over
all
tax
supp
orte
d de
bt.
• Cap
ital p
rogr
am re
quire
s m
ore
capa
city
. • S
tate
exp
ects
retu
rn o
n in
vest
men
ts –
edu
catio
n in
vest
men
t will
resu
lt in
be
tter e
duca
ted
wor
kfor
ce,
and
futu
re h
ighe
r PI.
• Int
eres
t rat
es a
re
hist
oric
ally
low
, inc
reas
ed
issu
ance
s now
will
be
resu
lt in
low
er d
ebt
serv
ice.
C
ons
• Rat
ing
agen
cies
ha
ve c
omm
ente
d on
M
aryl
and’
s co
ntin
uous
and
long
st
andi
ng a
ffor
dabi
lity
mea
sure
s. • B
reac
h th
e ra
tios
tem
pora
rily
– G
AR
VEE
& B
ay
Bon
ds a
re te
mpo
rary
im
pact
s.
P
ros
• DS
crite
ria is
th
e m
ost
impo
rtant
: in
dica
tes
repa
ymen
t ca
paci
ty
• Can
be
cont
rolle
d by
St
ate
Con
s • P
I crit
eria
sh
ows d
ebt
burd
en o
n ta
xpay
er
• Wid
ely
used
by
ratin
g ag
enci
es
Pro
s • G
AR
VEE
bon
ds a
re
unlik
e an
y ot
her t
ax-
supp
orte
d de
bt
beca
use
the
sour
ce o
f re
paym
ent i
s not
stat
e ta
xes b
ut fe
dera
l hi
ghw
ay re
venu
es.
• Rat
ing
agen
cies
do
not t
reat
GA
RV
EES
unifo
rmly
. • P
rece
dent
set b
y G
A, a
noth
er A
AA
st
ate.
• L
egis
latio
n m
anda
ted
incl
usio
n as
ta
x-su
ppor
ted
debt
but
di
d no
t set
af
ford
abili
ty c
riter
ion.
Con
s • T
he T
TF is
a
seco
ndar
y pl
edge
on
GA
RV
EES-
“Dou
ble-
barr
el”
• Sho
rt-te
rm a
nd
limite
d fix
.
Pro
s • M
ore
clos
ely
mat
ches
deb
t se
rvic
e to
reve
nues
that
su
ppor
t deb
t. • H
isto
ry o
f the
ratio
s spl
it up
like
this
exi
sts.
Con
s • T
oo d
iffic
ult t
o re
ach
cons
ensu
s on
such
ex
tens
ive
chan
ge.
• Lin
k PI
crit
erio
n to
Rev
enue
cr
iterio
n • A
llow
futu
re “
lurk
ers”
Ye
s
Sh
ou
ld w
e i
ncr
ea
se t
he
3.2
%
rati
o f
or
all
ta
x s
up
po
rte
d d
eb
t?
Sh
ou
ld w
e h
av
e m
ult
iple
ra
tio
s?
Sh
ou
ld w
e k
ee
p t
he
3.2
%
rati
o f
or
all
ta
x-s
up
po
rte
d
de
bt
ex
cep
t fo
r G
AR
VE
ES
?
Sh
ou
ld w
e e
sta
bli
sh s
ep
ara
te r
ati
os
for
GO
bo
nd
s, C
ap
ita
l le
ase
s a
nd
S
tad
ium
bo
nd
s; t
ran
spo
rta
tio
n;
an
d
GA
RV
EE
, B
ay
bo
nd
s (P
FM
mo
de
l)?
Sh
ou
ld w
e e
lim
ina
te
the
3.2
% c
rite
rio
n
an
d u
se o
nly
th
e 8
.0%
cr
ite
rio
n?
Wh
at
sho
uld
th
e r
ati
o
be
?
Shou
ld w
e m
odif
y th
e af
ford
abil
ity
rati
os?
• Allo
w fo
r “w
orst
cas
e sc
enar
io”
39

Pros
• W
e sh
ow th
at w
e co
me
back
to 3
.2%
by
2018
• G
AR
VEE
bon
ds
rapi
dly
mat
ure
in 1
2 yr
s. B
ay b
onds
– 1
5 yr
s • I
nter
est r
ates
are
hi
stor
ical
ly lo
w,
incr
ease
d is
suan
ces n
ow
will
be
resu
lt in
low
er
debt
serv
ice.
Con
s • F
utur
e fu
ndin
g ne
eds f
or B
ay
Res
tora
tion
Bon
ds
• Bac
k do
or w
ay to
in
crea
se ra
tios
• Rat
ios n
eed
to b
e ad
just
ed
• Oth
er lu
rker
s
Pros
• D
emon
stra
tes
com
plia
nce
with
3.
2% w
ithin
10
year
s • A
nd re
ason
for
brea
ch (G
AR
VEE
is
suan
ce)
Con
s • L
imits
flex
ibili
ty
Pros
• G
O b
onds
get
rem
aini
ng
auth
oriz
atio
ns a
fter o
ther
is
suer
s for
ecas
t the
ir is
suan
ces
Con
s • N
ot re
quire
d of
CD
AC
•R
espo
nsib
ility
of g
over
nor
and
legi
slat
ure
No
Shou
ld w
e te
mpo
rari
ly b
reac
h th
e ra
tio?
Shou
ld C
DA
C a
djus
t aut
hori
zatio
ns
amon
g is
suer
s of t
ax-s
uppo
rted
deb
t?
Shou
ld th
ere
be a
tim
e lim
it an
d pe
rmitt
ed
circ
umst
ance
s? Sh
ould
we
mod
ify th
e af
ford
abili
ty ra
tios?
40

VI. AFFORDABILITY ANALYSIS
The objective of an affordability analysis is to draw a proper balance between two basic interests: the State's capital needs and the State’s ability, as measured by self-imposed affordability criteria, to repay the debt issued to finance those capital needs. A. The Concept of Affordability
The ultimate test of debt affordability is the willingness and ability of the State to pay the debt service when due. Apart from revenue sources which are dedicated by law, the allocation of future resources between debt repayment and other program needs is a matter of judgment. A careful and comprehensive determination of affordability should take into consideration the demand for capital projects, the relationship between debt authorization and debt issuance, available and potential funding mechanisms, overall budgetary priorities, and revenues.
The Committee believes that the crux of the concept of affordability is not merely whether or not the State can pay the debt service; rather, affordability implies the ability to manage debt over time to achieve certain goals. Maryland has a long tradition of effectively managing its finances and debt. The challenge of debt management is to provide sufficient funds to meet growing capital needs within the framework of the State's debt capacity, thereby maintaining the AAA credit rating. B. Affordability Criteria
The current affordability criteria are: State tax-supported debt outstanding should be no more than 4.0% of State personal income; and debt service on that debt should require no more than 8.0% of revenues. C. 2008 Affordability Recommendation The Committee recommends a $1,110 million limit for new general obligation authorizations by the 2009 General Assembly to support the 2010 capital program. The recommended level reflects a one-time increase of $150 million from the $960 million 2008 authorization level projected in the 2007 CDAC report. Future projections assume $990 million in new authorizations to support the 2011 capital program and increases of 3% annually in 2012 through 2018. The $1,110 million also includes $5 million previously authorized for the Southern Maryland Regional Strategy-Action Plan for Agriculture.
The motion to adopt this level specifically recognized that authorization levels proposed in the Governor’s 2010 capital budget could be adjusted to a level below the recommended limit to reflect up-to-date economic and fiscal information. The motion was adopted by a vote of 3-2 with Secretary Foster, Secretary Porcari and Mr. Meritt in favor and Treasurer Kopp and Comptroller Franchot opposed. Treasurer Kopp and Comptroller Franchot indicated that they supported retention of the previously anticipated recommendation of $960 million.
41
Current personal income and revenue estimates both support the recommended authorizations while adhering to the affordability criteria. Schedules of Personal Income and Revenues are in Appendix A-1 and Appendix A-2, respectively. These schedules report historical data from 1998 through 2007 and projections for 2008 through 2018. They have been updated to reflect estimates made by the Board of Revenue Estimates in September 2008.
As indicated by Table 3, Tax-Supported Debt Outstanding and Debt Service Stress Test,
if the projections for debt outstanding and debt service are held constant, declines in personal income and revenues can still be absorbed and affordability ratios maintained. Similarly, there is still some capacity for increases in debt outstanding and debt service if the personal income and revenue projections are held constant with the affordability criteria at 4.0% and 8.0%. The Committee's recommendation is expected to result in a pattern of debt issuances, debt outstanding, and debt service payments that are within these affordability benchmarks.
The virtue of the annual CDAC process is the ability, if needed, to adjust authorizations
in future years should forecasts of personal income and revenues decline or if projections for debt service rise because of increases in interest rates. These reductions to authorizations could be severe; e.g., authorizations by the Legislature in 2009-2011 would have had to be reduced by $1.07 billion to achieve the prior criterion of 3.2% in 2010-2016. Appendix B-4 highlights the effect of the maturity limit of 15 years on the State’s General Obligation Bonds and the resulting rapid amortization of current outstanding debt which provides financial flexibility.
D. Comparison of Recommendation and Criteria
To analyze the relationship of the Committee's recommendation for general obligation debt to the affordability criteria, each component of tax-supported debt and debt service has been examined.
Debt Outstanding The rapid rise in total tax-supported debt in Table 1 reflects the inclusion of GARVEE
Bonds beginning in fiscal year 2007, Bay Restoration Bonds beginning in fiscal year 2008, the increased authorizations and issuances of General Obligation Bonds, and the increased authorization of Transportation Bonds from $2.0 billion to $2.6 billion as a result of the 2007 1st Special Session. Total general obligation debt rises steadily from $5.494 billion as of June 30, 2008 to $9.651 billion as of June 30, 2018. Department of Transportation debt is projected to rise from $1.269 billion to $2.595 billion during this same period. Stadium Authority debt will decline from $268.070 million to $85.915 million assuming there are no future additional Stadium Authority financings.
42
Debt Outstanding as a Percent of Personal Income This criterion of debt outstanding to personal income reflects the State’s reliance on
revenues (sales tax and income tax) that are primarily based on consumption and income. The debt outstanding is as of the end of a fiscal year and the personal income is as of the end of the calendar year. For example, the debt outstanding is as of June 30, 2008 and the personal income is as of December 31, 2008.
The ratio of State tax-supported debt outstanding to personal income (Table 1) rises from
2.83% in fiscal year 2008, peaks at 3.43% in fiscal year 2012 and is at 3.08% in fiscal year 2018. Due to the rapid amortization of most tax-supported debt in 15 years and the even faster amortization of GARVEE Bonds in 12 years, the ratio declines .35% from 2012 to 2018. At all times, the ratio remains below the affordability criterion of 4.0%.
Debt Service Projected general obligation debt service (Appendix B-4) assumes that future interest
rates are consistent with current forecasts and also assumes authorizations are $1,110 million for the 2009 session/2010 capital program; $990 million for the 2010 session/2011 capital program and 3% growth thereafter. Debt Service as a Percent of Revenues Compared to the prior criterion, debt service as a percent of revenues is a better measure for State financial management purposes, i.e., the legislature has control of both variables – revenues through the enactment of taxes and fees and debt service through the authorization of debt. It also reflects the State’s ability to repay its debt. The ratio of annual debt service to revenues (Table 2a) increases from 5.60% in fiscal year 2008 to 6.57% in fiscal year 2012 and 7.51% in fiscal year 2018. As in the past, the ratio remains below the affordability criterion of 8.0%, but nevertheless is increasing each year.
43

Tax
Supp
orte
d D
ebt O
utst
andi
ng to
Per
sona
l Inc
ome
Sept
embe
r 200
8
$0
$2,0
00
$4,0
00
$6,0
00
$8,0
00
$10,
000
$12,
000
$14,
000
$16,
000
$18,
000
$ in millions Gar
vee
$0
$0
$0
$0
$0
$325
$3
01
$678
$6
27
$575
$5
19
$461
$4
00
$336
$2
68
$198
$1
24
Bay
Res
tora
tion
$0
$0
$0
$0
$0
$0
$50
$117
$1
91
$332
$4
95
$469
$4
42
$414
$3
84
$353
$3
19
Sta
dium
Aut
horit
y$2
78
$323
$3
21
$309
$2
97
$283
$2
68
$253
$2
36
$219
$2
01
$181
$1
60
$139
$1
21
$104
$8
6
Cap
ital L
ease
s$1
86
$193
$1
99
$175
$2
27
$248
$2
48
$271
$2
68
$268
$2
73
$285
$2
95
$307
$3
16
$324
$3
32
Tota
l DO
T$7
17
$964
$1
,187
$1
,071
$1
,078
$1
,111
$1
,269
$1
,578
$1
,990
$2
,277
$2
,439
$2
,508
$2
,508
$2
,592
$2
,597
$2
,597
$2
,595
Gen
eral
Obl
igat
ion
$3,5
44
$3,9
32
$4,1
02
$4,5
12
$4,8
68
$5,1
42
$5,4
94
$5,8
45
$6,2
78
$6,7
33
$7,1
94
$7,6
53
$8,1
13
$8,5
56
$8,9
36
$9,3
13
$9,6
51
4.0%
Ben
chm
ark
$7,9
53
$8,2
29
$8,8
05
$9,2
86
$9,8
12
$10,
342
$10,
794
$11,
162
$11,
713
$12,
356
$12,
952
$13,
570
$14,
239
$14,
928
$15,
625
$16,
327
$17,
042
Tot
al T
ax S
uppo
rted
Deb
t$4
,726
$5
,413
$5
,809
$6
,067
$6
,471
$7
,109
$7
,629
$8
,741
$9
,591
$1
0,40
3 $1
1,12
1 $1
1,55
7 $1
1,91
8 $1
2,34
3 $1
2,62
2 $1
2,88
8 $1
3,10
7
2002
2003
2004
2005
2006
2007
2008
2009
2010
2011
2012
2013
2014
2015
2016
2017
2018
44

STA
TE T
AX
SUPP
OR
TED
DEB
T O
UTS
TAN
DIN
GTA
BLE
1
CO
MPO
NEN
TS A
ND
REL
ATI
ON
SHIP
TO
PER
SON
AL
INC
OM
E
($ in
thou
sand
s)Se
p-08
Dep
artm
ent o
f Tra
nspo
rtat
ion
Fisc
al
Year
Gen
eral
Obl
igat
ion
Bon
ds C
onso
lidat
ed
Tran
spor
tatio
n B
onds
Cou
nty
Tran
spor
tatio
n B
onds
(b)
Tota
l DO
TC
apita
l Lea
ses
Stad
ium
A
utho
rity
Bay
R
esto
ratio
n B
onds
Gar
vee
Bon
ds T
otal
Tax
Su
ppor
ted
Deb
tFi
scal
Ye
ar
(a)
(c) (
d)20
02$3
,544
,178
$714
,150
$3,1
55$7
17,3
05$1
86,2
38$2
77,9
95$4
,725
,716
2002
2003
$3,9
32,4
93$9
61,2
45$2
,440
$963
,685
$193
,136
$323
,240
$5,4
12,5
5420
0320
04$4
,102
,278
$1,1
85,6
50$1
,675
$1,1
87,3
25$1
98,5
85$3
20,9
55$5
,809
,143
2004
2005
$4,5
11,8
26$1
,069
,945
$865
$1,0
70,8
10$1
75,0
62$3
09,1
95$6
,066
,893
2005
2006
$4,8
68,4
71$1
,078
,475
$0$1
,078
,475
$226
,898
$296
,820
$6,4
70,6
6420
0620
07$5
,142
,154
$1,1
11,0
50$0
$1,1
11,0
50$2
47,9
39$2
83,0
90$3
25,0
00$7
,109
,233
2007
2008
$5,4
93,8
30$1
,268
,815
$0$1
,268
,815
$247
,700
$268
,070
$50,
000
$300
,655
$7,6
29,0
7020
0820
09$5
,844
,668
$1,5
78,0
00$0
$1,5
78,0
00$2
71,1
89$2
52,7
70$1
16,8
25$6
77,6
60$8
,741
,112
2009
2010
$6,2
77,9
41$1
,990
,000
$0$1
,990
,000
$268
,233
$236
,485
$191
,061
$627
,350
$9,5
91,0
7020
1020
11$6
,733
,271
$2,2
77,0
00$0
$2,2
77,0
00$2
67,8
51$2
19,1
45$3
31,5
70$5
74,5
40$1
0,40
3,37
720
1120
12$7
,194
,276
$2,4
39,0
00$0
$2,4
39,0
00$2
73,2
19$2
00,6
55$4
94,8
93$5
19,1
00$1
1,12
1,14
320
1220
13$7
,653
,223
$2,5
08,0
00$0
$2,5
08,0
00$2
84,8
80$1
80,9
30$4
69,3
31$4
60,9
10$1
1,55
7,27
420
1320
14$8
,112
,800
$2,5
08,0
00$0
$2,5
08,0
00$2
95,3
62$1
59,8
95$4
42,4
03$3
99,8
20$1
1,91
8,28
020
1420
15$8
,556
,076
$2,5
92,0
00$0
$2,5
92,0
00$3
06,7
34$1
38,8
20$4
14,0
21$3
35,7
00$1
2,34
3,35
120
1520
16$8
,935
,638
$2,5
97,0
00$0
$2,5
97,0
00$3
15,6
48$1
21,3
85$3
84,1
17$2
68,3
95$1
2,62
2,18
320
1620
17$9
,312
,584
$2,5
97,0
00$0
$2,5
97,0
00$3
23,7
05$1
04,2
55$3
52,6
35$1
97,7
35$1
2,88
7,91
320
1720
18$9
,651
,036
$2,5
95,0
00$0
$2,5
95,0
00$3
31,5
45$8
5,91
5$3
19,4
79$1
23,5
50$1
3,10
6,52
520
18
S
tate
Tax
Sup
port
ed D
ebt O
utst
andi
ng a
s a
Perc
ent o
f Per
sona
l Inc
ome
(Affo
rdab
ility
crit
eria
sta
ndar
d =
4.0%
)
2002
1.78
%0.
36%
0.00
%0.
36%
0.09
%0.
14%
2.38
%20
0220
031.
91%
0.47
%0.
00%
0.47
%0.
09%
0.16
%2.
63%
2003
2004
1.86
%0.
54%
0.00
%0.
54%
0.09
%0.
15%
2.64
%20
0420
051.
94%
0.46
%0.
00%
0.46
%0.
08%
0.13
%2.
61%
2005
2006
1.98
%0.
44%
0.00
%0.
44%
0.09
%0.
12%
2.64
%20
0620
071.
99%
0.43
%0.
00%
0.43
%0.
10%
0.11
%0.
13%
2.75
%20
0720
082.
04%
0.47
%0.
00%
0.47
%0.
09%
0.10
%0.
02%
0.11
%2.
83%
2008
2009
2.09
%0.
57%
0.00
%0.
57%
0.10
%0.
09%
0.04
%0.
24%
3.13
%20
0920
102.
14%
0.68
%0.
00%
0.68
%0.
09%
0.08
%0.
07%
0.21
%3.
28%
2010
2011
2.18
%0.
74%
0.00
%0.
74%
0.09
%0.
07%
0.11
%0.
19%
3.37
%20
1120
122.
22%
0.75
%0.
00%
0.75
%0.
08%
0.06
%0.
15%
0.16
%3.
43%
2012
2013
2.26
%0.
74%
0.00
%0.
74%
0.08
%0.
05%
0.14
%0.
14%
3.41
%20
1320
142.
28%
0.70
%0.
00%
0.70
%0.
08%
0.04
%0.
12%
0.11
%3.
35%
2014
2015
2.29
%0.
69%
0.00
%0.
69%
0.08
%0.
04%
0.11
%0.
09%
3.31
%20
1520
162.
29%
0.66
%0.
00%
0.66
%0.
08%
0.03
%0.
10%
0.07
%3.
23%
2016
2017
2.28
%0.
64%
0.00
%0.
64%
0.08
%0.
03%
0.09
%0.
05%
3.16
%20
1720
182.
27%
0.61
%0.
00%
0.61
%0.
08%
0.02
%0.
07%
0.03
%3.
08%
2018
(a) R
efle
cts
pres
umed
aut
horiz
atio
ns a
s fo
llow
s:G
ener
al A
ssem
bly
Ses
sion
:20
0820
0920
1020
1120
12Fo
r Cpa
ital P
rogr
am in
Fis
cal Y
ear:
2009
2010
2011
2012
2013
(mill
ions
)$9
35$1
,110
$990
$1,0
20$1
,050
Q
ualif
ied
Zone
Aca
dem
y B
onds
(QZA
B's
) $5
.6$5
.6(b
) Net
of s
inki
ng fu
nds
or d
ebt s
ervi
ce re
serv
e fu
nds.
(c) I
nclu
des
finan
cing
s fo
r mul
ti-ag
ency
offi
ce b
uild
ings
in S
t. M
ary'
s an
d C
alve
rt C
ount
ies,
dis
trict
cou
rt fa
cilit
ies
in B
altim
ore
and
Prin
ce G
eorg
e's
Cou
ntie
s,
head
quar
ters
bui
ldin
g fo
r MD
OT,
shu
ttle
buse
s at
BW
I, w
ater
and
was
te w
ater
faci
lity
at E
CI,
and
the
stat
e of
fice
park
ing
faci
lity.
(d
) In
clud
es e
quip
men
t and
ene
rgy
leas
es.
Ass
umpt
ions
: ($
in m
illio
ns)
2009
2010
2011
2012
2013
G
.O. i
ssue
s (In
clud
es T
obac
co b
uyou
t)$8
10.0
$910
.0$9
70.0
$1,0
00.0
$1,0
30.0
D
OT
issu
es$3
90.0
$510
.0$3
85.0
$285
.0$1
65.0
S
tadi
um A
utho
rity
issu
es$0
.0$0
.0$0
.0$0
.0$0
.0
New
Cap
ital L
ease
s - E
quip
. & E
PC
$71.
0$4
9.0
$49.
0$4
9.0
$49.
0
Gar
vee
Bon
d S
ales
$425
.0
Bay
Bon
ds Is
sued
$70.
0$8
0.0
$150
.0$1
80.0
$0.0
P
erso
nal I
ncom
e (b
illio
ns) (
App
endi
x A
-1)
$279
.1$2
92.8
$308
.9$3
23.8
$339
.2
45

Tax
Supp
orte
d D
ebt S
ervi
ce to
Rev
enue
s S
epte
mbe
r 200
8
$0
$200
$400
$600
$800
$1,0
00
$1,2
00
$1,4
00
$1,6
00
$1,8
00
$2,0
00
$2,2
00
$ in millions
Gar
vee
Bon
ds$3
6 $7
3 $8
4 $8
4 $8
4 $8
4 $8
4 $8
4 $8
4 $8
4 $8
4
Bay
Res
tora
tion
Bon
ds
$5
$12
$20
$35
$52
$52
$52
$52
$52
$52
Sta
dium
Aut
horit
y$2
7 $2
7 $2
7 $3
0 $3
2 $3
2 $3
2 $3
2 $3
2 $3
2 $3
2 $3
2 $3
2 $3
1 $2
6 $2
4 $2
4
Cap
ital
Leas
es$3
8 $4
6 $5
2 $5
2 $4
4 $4
2 $5
1 $5
8 $6
4 $6
2 $5
6 $5
1 $5
3 $5
3 $5
6 $5
7 $5
8
DO
T C
onso
lidat
ed B
onds
$113
$1
29
$135
$1
54
$141
$1
18
$121
$1
43
$163
$1
86
$217
$2
37
$268
$3
07
$335
$3
66
$378
Gen
eral
Obl
igat
ion
Bon
ds
$495
$4
97
$537
$5
54
$625
$6
54
$693
$7
45
$782
$8
39
$891
$9
50
$996
$1
,059
$1
,160
$1
,234
$1
,311
8.0%
Ben
chm
ark
$919
$9
09
$1,0
14
$1,1
41
$1,2
12
$1,2
52
$1,3
33
$1,4
15
$1,4
70
$1,5
35
$1,6
01
$1,6
64
$1,7
37
$1,8
05
$1,8
77
$1,9
54
$2,0
33
Tota
l Tax
Sup
porte
d D
ebt S
ervi
ce$6
74
$699
$7
51
$790
$8
42
$846
$9
33
$1,0
55
$1,1
36
$1,2
22
$1,3
14
$1,4
06
$1,4
85
$1,5
86
$1,7
13
$1,8
18
$1,9
08
2002
2003
2004
2005
2006
2007
2008
2009
2010
2011
2012
2013
2014
2015
2016
2017
2018
46
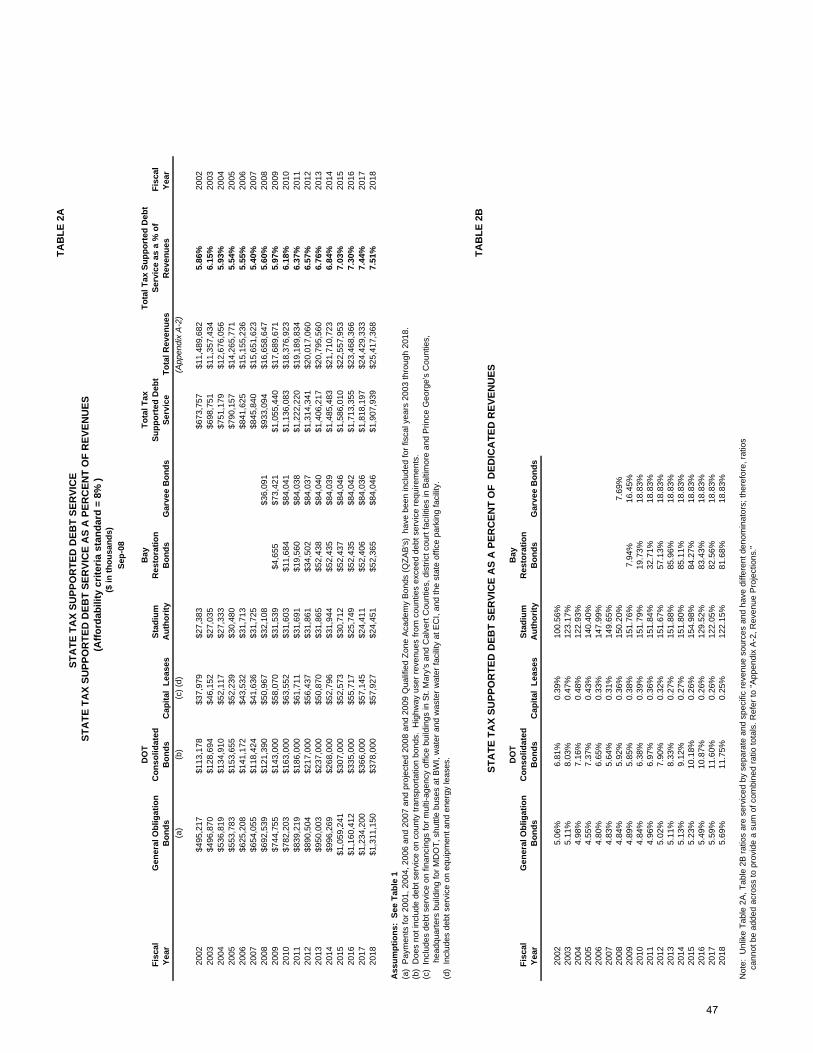
TAB
LE 2
AST
ATE
TA
X SU
PPO
RTE
D D
EBT
SER
VIC
E
STA
TE T
AX
SUPP
OR
TED
DEB
T SE
RVI
CE
AS
A P
ERC
ENT
OF
REV
ENU
ES
(A
fford
abili
ty c
riter
ia s
tand
ard
= 8%
)
($
in th
ousa
nds)
Sep-
08
Fis
cal
Year
Gen
eral
Obl
igat
ion
Bon
ds
DO
T C
onso
lidat
ed
Bon
dsC
apita
l Le
ases
Stad
ium
A
utho
rity
Bay
R
esto
ratio
n B
onds
G
arve
e B
onds
Tota
l Tax
Su
ppor
ted
Deb
t Se
rvic
eTo
tal R
even
ues
Tota
l Tax
Sup
port
ed D
ebt
Serv
ice
as a
% o
f R
even
ues
Fis
cal
Year
(a)
(b)
(c) (
d)(A
ppen
dix
A-2
)
20
02$4
95,2
17$1
13,1
78$3
7,97
9$2
7,38
3$6
73,7
57$1
1,48
9,68
25.
86%
2002
2003
$496
,870
$128
,694
$46,
152
$27,
035
$698
,751
$11,
357,
434
6.15
%20
0320
04$5
36,8
19$1
34,9
10$5
2,11
7$2
7,33
3$7
51,1
79$1
2,67
6,05
65.
93%
2004
2005
$553
,783
$153
,655
$52,
239
$30,
480
$790
,157
$14,
265,
771
5.54
%20
0520
06$6
25,2
08$1
41,1
72$4
3,53
2$3
1,71
3$8
41,6
25$1
5,15
5,23
65.
55%
2006
2007
$654
,055
$118
,424
$41,
636
$31,
725
$845
,840
$15,
651,
623
5.40
%20
0720
08$6
92,5
39$1
21,3
90$5
0,96
7$3
2,10
8$3
6,09
1$9
33,0
94$1
6,65
8,64
75.
60%
2008
2009
$744
,755
$143
,000
$58,
070
$31,
539
$4,6
55$7
3,42
1$1
,055
,440
$17,
689,
671
5.97
%20
0920
10$7
82,2
03$1
63,0
00$6
3,55
2$3
1,60
3$1
1,68
4$8
4,04
1$1
,136
,083
$18,
376,
923
6.18
%20
1020
11$8
39,2
19$1
86,0
00$6
1,71
1$3
1,69
1$1
9,56
0$8
4,03
8$1
,222
,220
$19,
189,
834
6.37
%20
1120
12$8
90,5
04$2
17,0
00$5
6,43
7$3
1,86
1$3
4,50
2$8
4,03
7$1
,314
,341
$20,
017,
060
6.57
%20
1220
13$9
50,0
03$2
37,0
00$5
0,87
0$3
1,86
5$5
2,43
8$8
4,04
0$1
,406
,217
$20,
795,
560
6.76
%20
1320
14$9
96,2
69$2
68,0
00$5
2,79
6$3
1,94
4$5
2,43
5$8
4,03
9$1
,485
,483
$21,
710,
723
6.84
%20
1420
15$1
,059
,241
$307
,000
$52,
573
$30,
712
$52,
437
$84,
046
$1,5
86,0
10$2
2,55
7,95
37.
03%
2015
2016
$1,1
60,4
12$3
35,0
00$5
5,71
7$2
5,74
9$5
2,43
5$8
4,04
2$1
,713
,355
$23,
468,
366
7.30
%20
1620
17$1
,234
,200
$366
,000
$57,
145
$24,
411
$52,
406
$84,
036
$1,8
18,1
97$2
4,42
9,33
37.
44%
2017
2018
$1,3
11,1
50$3
78,0
00$5
7,92
7$2
4,45
1$5
2,36
5$8
4,04
6$1
,907
,939
$25,
417,
368
7.51
%20
18
Ass
umpt
ions
: Se
e Ta
ble
1(a
) P
aym
ents
for 2
001,
200
4, 2
006
and
2007
and
pro
ject
ed 2
008
and
2009
Qua
lifie
d Zo
ne A
cade
my
Bon
ds (Q
ZAB
's)
have
bee
n in
clud
ed fo
r fis
cal y
ears
200
3 th
roug
h 20
18.
(b)
Doe
s no
t inc
lude
deb
t ser
vice
on
coun
ty tr
ansp
orta
tion
bond
s. H
ighw
ay u
ser r
even
ues
from
cou
ntie
s ex
ceed
deb
t ser
vice
requ
irem
ents
.(c
) In
clud
es d
ebt s
ervi
ce o
n fin
anci
ngs
for m
ulti-
agen
cy o
ffice
bui
ldin
gs in
St.
Mar
y's
and
Cal
vert
Cou
ntie
s, d
istri
ct c
ourt
faci
litie
s in
Bal
timor
e an
d P
rince
Geo
rge'
s C
ount
ies,
h
eadq
uarte
rs b
uild
ing
for M
DO
T, s
huttl
e bu
ses
at B
WI,
wat
er a
nd w
aste
r wat
er fa
cilit
y at
EC
I, an
d th
e st
ate
offic
e pa
rkin
g fa
cilit
y.
(d)
Incl
udes
deb
t ser
vice
on
equi
pmen
t and
ene
rgy
leas
es.
TAB
LE 2
BST
ATE
TA
X SU
PPO
RTE
D D
EBT
SER
VIC
E A
S A
PER
CEN
T O
F D
EDIC
ATE
D R
EVEN
UES
Fis
cal
Year
Gen
eral
Obl
igat
ion
Bon
ds
DO
T C
onso
lidat
ed
Bon
dsC
apita
l Le
ases
Stad
ium
A
utho
rity
Bay
R
esto
ratio
n B
onds
G
arve
e B
onds
2002
5.06
%6.
81%
0.39
%10
0.56
%20
035.
11%
8.03
%0.
47%
123.
17%
2004
4.98
%7.
16%
0.48
%12
2.93
%20
054.
55%
7.37
%0.
43%
140.
40%
2006
4.80
%6.
65%
0.33
%14
7.99
%20
074.
83%
5.64
%0.
31%
149.
65%
2008
4.84
%5.
92%
0.36
%15
0.20
%7.
69%
2009
4.89
%5.
85%
0.38
%15
1.76
%7.
94%
16.4
5%20
104.
84%
6.38
%0.
39%
151.
79%
19.7
3%18
.83%
2011
4.96
%6.
97%
0.36
%15
1.84
%32
.71%
18.8
3%20
125.
02%
7.90
%0.
32%
151.
67%
57.1
3%18
.83%
2013
5.11
%8.
33%
0.27
%15
1.88
%85
.96%
18.8
3%20
145.
13%
9.12
%0.
27%
151.
80%
85.1
1%18
.83%
2015
5.23
%10
.18%
0.26
%15
4.98
%84
.27%
18.8
3%20
165.
49%
10.8
7%0.
26%
129.
52%
83.4
3%18
.83%
2017
5.59
%11
.60%
0.26
%12
2.05
%82
.56%
18.8
3%20
185.
69%
11.7
5%0.
25%
122.
15%
81.6
8%18
.83%
Not
e: U
nlik
e Ta
ble
2A, T
able
2B
ratio
s ar
e se
rvic
ed b
y se
para
te a
nd s
peci
fic re
venu
e so
urce
s an
d ha
ve d
iffer
ent d
enom
inat
ors;
ther
efor
e, ra
tios
c
anno
t be
adde
d ac
ross
to p
rovi
de a
sum
of c
ombi
ned
ratio
tota
ls. R
efer
to "A
ppen
dix
A-2
, Rev
enue
Pro
ject
ions
."
47
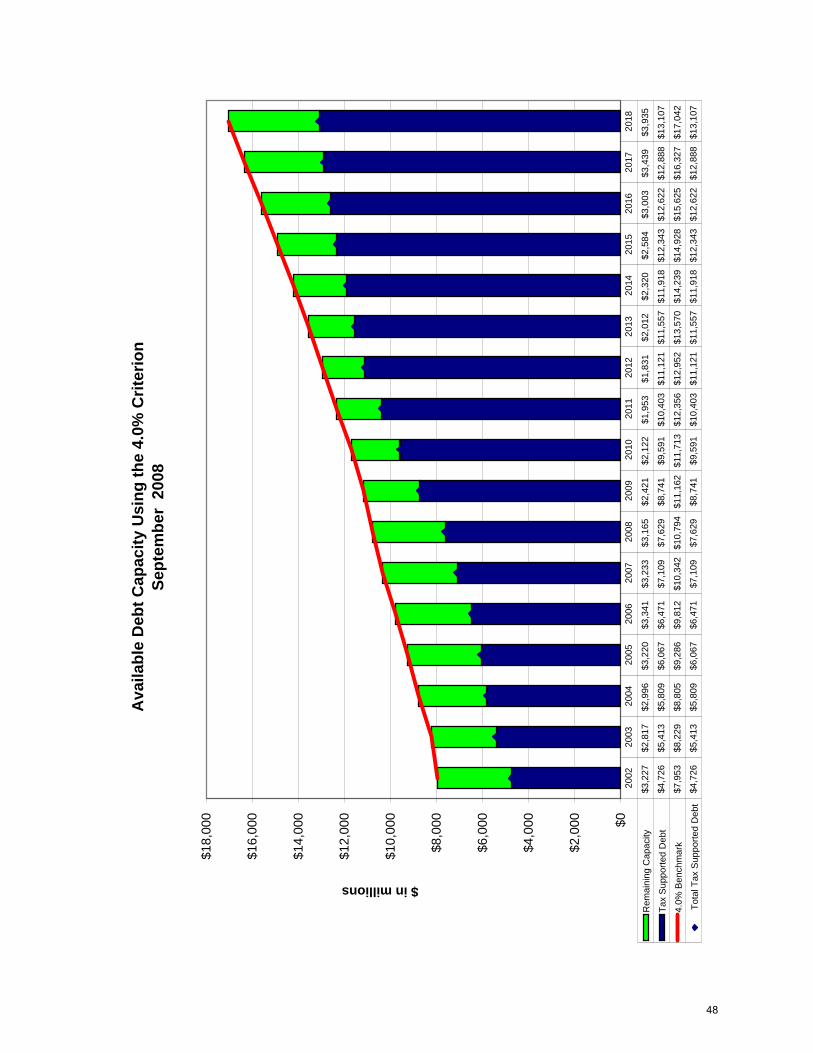
Ava
ilabl
e D
ebt C
apac
ity U
sing
the
4.0%
Crit
erio
n Se
ptem
ber
2008
$0
$2,0
00
$4,0
00
$6,0
00
$8,0
00
$10,
000
$12,
000
$14,
000
$16,
000
$18,
000
$ in millions
Rem
aini
ng C
apac
ity$3
,227
$2
,817
$2
,996
$3
,220
$3
,341
$3
,233
$3
,165
$2
,421
$2
,122
$1
,953
$1
,831
$2
,012
$2
,320
$2
,584
$3
,003
$3
,439
$3
,935
Tax
Sup
porte
d D
ebt
$4,7
26
$5,4
13
$5,8
09
$6,0
67
$6,4
71
$7,1
09
$7,6
29
$8,7
41
$9,5
91
$10,
403
$11,
121
$11,
557
$11,
918
$12,
343
$12,
622
$12,
888
$13,
107
4.0%
Ben
chm
ark
$7,9
53
$8,2
29
$8,8
05
$9,2
86
$9,8
12
$10,
342
$10,
794
$11,
162
$11,
713
$12,
356
$12,
952
$13,
570
$14,
239
$14,
928
$15,
625
$16,
327
$17,
042
Tot
al T
ax S
uppo
rted
Deb
t$4
,726
$5
,413
$5
,809
$6
,067
$6
,471
$7
,109
$7
,629
$8
,741
$9
,591
$1
0,40
3 $1
1,12
1 $1
1,55
7 $1
1,91
8 $1
2,34
3 $1
2,62
2 $1
2,88
8 $1
3,10
7
2002
2003
2004
2005
2006
2007
2008
2009
2010
2011
2012
2013
2014
2015
2016
2017
2018
48

Ava
ilabl
e D
ebt S
ervi
ce C
apac
ity U
sing
the
8.0%
Crit
erio
nSe
ptem
ber 2
008
$0
$200
$400
$600
$800
$1,0
00
$1,2
00
$1,4
00
$1,6
00
$1,8
00
$2,0
00
$2,2
00$ in millions
Rem
aini
ng D
ebt S
ervi
ce C
apac
ity$2
45
$210
$2
63
$351
$3
71
$406
$4
00
$360
$3
34
$313
$2
87
$257
$2
51
$219
$1
64
$136
$1
25
Tota
l Tax
Sup
porte
d D
ebt S
ervi
ce$6
74
$699
$7
51
$790
$8
42
$846
$9
33
$1,0
55 $
1,13
6 $1
,222
$1,
314
$1,4
06 $
1,48
5 $1
,586
$1,
713
$1,8
18 $
1,90
8
8.0%
Ben
chm
ark
$919
$9
09
$1,0
14 $
1,14
1 $1
,212
$1,
252
$1,3
33 $
1,41
5 $1
,470
$1,
535
$1,6
01 $
1,66
4 $1
,737
$1,
805
$1,8
77 $
1,95
4 $2
,033
2002
2003
2004
2005
2006
2007
2008
2009
2010
2011
2012
2013
2014
2015
2016
2017
2018
49
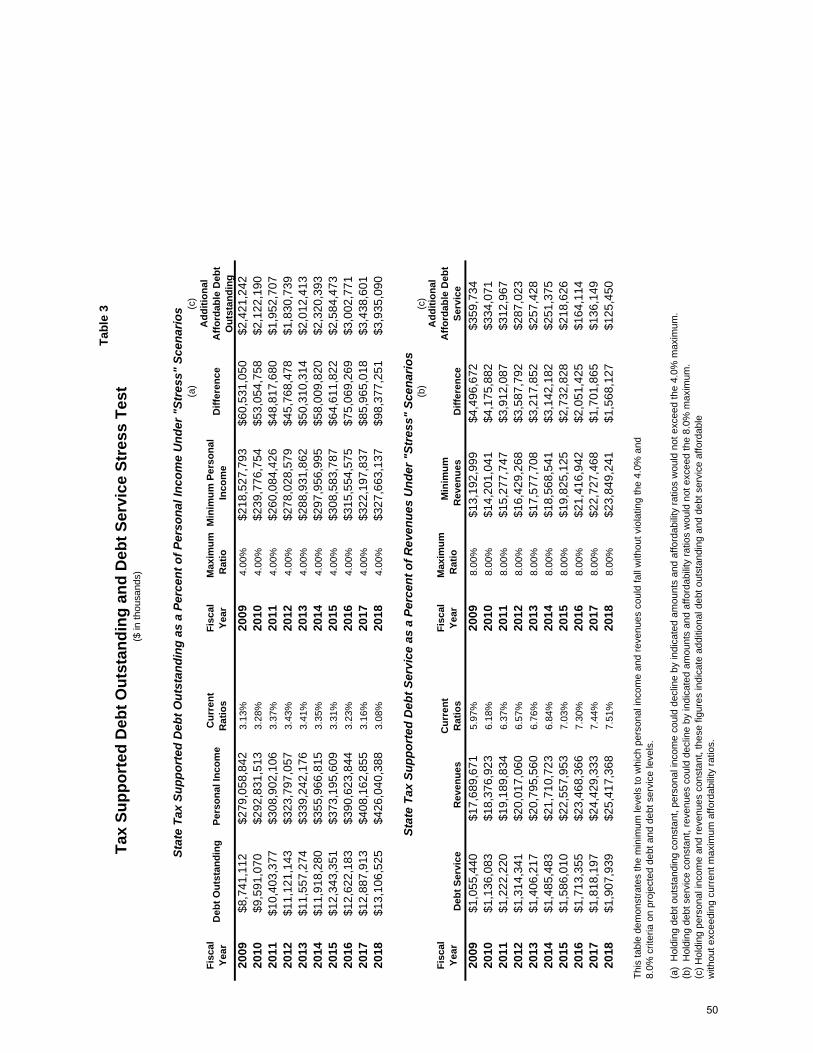
Tabl
e 3
Ta
x Su
ppor
ted
Deb
t Out
stan
ding
and
Deb
t Ser
vice
Str
ess
Test
($
in th
ousa
nds)
Stat
e Ta
x Su
ppor
ted
Deb
t Out
stan
ding
as
a Pe
rcen
t of P
erso
nal I
ncom
e U
nder
"St
ress
" Sc
enar
ios
(a)
(c)
Fisc
al
Year
Deb
t Out
stan
ding
Pers
onal
Inco
me
C
urre
nt
Rat
ios
Fisc
al
Year
M
axim
um
Rat
ioM
inim
um P
erso
nal
Inco
me
Diff
eren
ceA
dditi
onal
A
fford
able
Deb
t O
utst
andi
n g
2009
$8,7
41,1
12$2
79,0
58,8
423.
13%
2009
4.00
%$2
18,5
27,7
93$6
0,53
1,05
0$2
,421
,242
2010
$9,5
91,0
70$2
92,8
31,5
133.
28%
2010
4.00
%$2
39,7
76,7
54$5
3,05
4,75
8$2
,122
,190
2011
$10,
403,
377
$308
,902
,106
3.37
%20
114.
00%
$260
,084
,426
$48,
817,
680
$1,9
52,7
0720
12$1
1,12
1,14
3$3
23,7
97,0
573.
43%
2012
4.00
%$2
78,0
28,5
79$4
5,76
8,47
8$1
,830
,739
2013
$11,
557,
274
$339
,242
,176
3.41
%20
134.
00%
$288
,931
,862
$50,
310,
314
$2,0
12,4
1320
14$1
1,91
8,28
0$3
55,9
66,8
153.
35%
2014
4.00
%$2
97,9
56,9
95$5
8,00
9,82
0$2
,320
,393
2015
$12,
343,
351
$373
,195
,609
3.31
%20
154.
00%
$308
,583
,787
$64,
611,
822
$2,5
84,4
7320
16$1
2,62
2,18
3$3
90,6
23,8
443.
23%
2016
4.00
%$3
15,5
54,5
75$7
5,06
9,26
9$3
,002
,771
2017
$12,
887,
913
$408
,162
,855
3.16
%20
174.
00%
$322
,197
,837
$85,
965,
018
$3,4
38,6
0120
18$1
3,10
6,52
5$4
26,0
40,3
883.
08%
2018
4.00
%$3
27,6
63,1
37$9
8,37
7,25
1$3
,935
,090
S
tate
Tax
Sup
port
ed D
ebt S
ervi
ce a
s a
Perc
ent o
f Rev
enue
s U
nder
"St
ress
" Sc
enar
ios
(b)
(c)
Fisc
al
Year
Deb
t Ser
vice
Rev
enue
s
Cur
rent
R
atio
sFi
scal
Ye
ar
Max
imum
R
atio
M
inim
um
Rev
enue
sD
iffer
ence
Add
ition
al
Affo
rdab
le D
ebt
Serv
ice
2009
$1,0
55,4
40$1
7,68
9,67
15.
97%
2009
8.00
%$1
3,19
2,99
9$4
,496
,672
$359
,734
2010
$1,1
36,0
83$1
8,37
6,92
36.
18%
2010
8.00
%$1
4,20
1,04
1$4
,175
,882
$334
,071
2011
$1,2
22,2
20$1
9,18
9,83
46.
37%
2011
8.00
%$1
5,27
7,74
7$3
,912
,087
$312
,967
2012
$1,3
14,3
41$2
0,01
7,06
06.
57%
2012
8.00
%$1
6,42
9,26
8$3
,587
,792
$287
,023
2013
$1,4
06,2
17$2
0,79
5,56
06.
76%
2013
8.00
%$1
7,57
7,70
8$3
,217
,852
$257
,428
2014
$1,4
85,4
83$2
1,71
0,72
36.
84%
2014
8.00
%$1
8,56
8,54
1$3
,142
,182
$251
,375
2015
$1,5
86,0
10$2
2,55
7,95
37.
03%
2015
8.00
%$1
9,82
5,12
5$2
,732
,828
$218
,626
2016
$1,7
13,3
55$2
3,46
8,36
67.
30%
2016
8.00
%$2
1,41
6,94
2$2
,051
,425
$164
,114
2017
$1,8
18,1
97$2
4,42
9,33
37.
44%
2017
8.00
%$2
2,72
7,46
8$1
,701
,865
$136
,149
2018
$1,9
07,9
39$2
5,41
7,36
87.
51%
2018
8.00
%$2
3,84
9,24
1$1
,568
,127
$125
,450
This
tabl
e de
mon
stra
tes
the
min
imum
leve
ls to
whi
ch p
erso
nal i
ncom
e an
d re
venu
es c
ould
fall
with
out v
iola
ting
the
4.0%
and
8.0%
crit
eria
on
proj
ecte
d de
bt a
nd d
ebt s
ervi
ce le
vels
.
(a)
Hol
ding
deb
t out
stan
ding
con
stan
t, pe
rson
al in
com
e co
uld
decl
ine
by in
dica
ted
amou
nts
and
affo
rdab
ility
ratio
s w
ould
not
exc
eed
the
4.0%
max
imum
.(b
) H
oldi
ng d
ebt s
ervi
ce c
onst
ant,
reve
nues
cou
ld d
eclin
e by
indi
cate
d am
ount
s an
d af
ford
abili
ty ra
tios
wou
ld n
ot e
xcee
d th
e 8.
0% m
axim
um.
(c) H
oldi
ng p
erso
nal i
ncom
e an
d re
venu
es c
onst
ant,
thes
e fig
ures
indi
cate
add
ition
al d
ebt o
utst
andi
ng a
nd d
ebt s
ervi
ce a
fford
able
w
ithou
t exc
eedi
ng c
urre
nt m
axim
um a
fford
abili
ty ra
tios.
50

E. Comparison of Recommendation and Capital Program
The Committee's recommendation of $1,110 million in general obligation authorizations provides a commitment for the FY 2010 Capital Improvement Program. However, the program and the recommendations fall short of total funding needs and the Committee recognizes that allocation decisions will have to be made by the Governor and General Assembly.
The current recommendation of $1,110 million for the capital program in fiscal year 2010 should provide at least $325 million in G.O. Bond funds for public school construction, exceeding in nominal dollars the annual funding goal set by the law in 2004. The Committee recognized the documented need for increased school construction and renovation, the need to increase funding over time to meet the goal set forth in the Public School Facilities Act of 2004, and the challenge of meeting these goals with the escalation in building costs. F. Affordability Risk Analysis
Background Since 1989, the Committee has included in its Reports an affordability risk analysis: the
analysis of the risk that a particular five-year General Obligation Bond authorization plan, if followed over time, might lead to a violation of the Committee's affordability criteria, even though the plan was deemed affordable at the time it was proposed. Beginning in its 2007 review, the Committee examined this risk over a ten-year horizon.
Components of Risk The Committee identified and reviewed the following risks in making a judgment about the ultimate affordability of its 2008 recommended authorization and the projected future authorizations as described in paragraph C on page 41.
• Changes in personal income; • Changes in and sources of revenues; • Interest rate risk; • Changes in the definition of tax-supported debt; • Changes in the bond issuance plans of non-general obligation issuers of tax-supported
debt; • Changes within the General Obligation Bond program.
51
Changes in Personal Income
In the past, there have been significant adjustments to the estimates of personal income. These changes result from: (1) after-the-fact measurement changes by federal statisticians; and (2) revised projections by the State’s Bureau of Revenue Estimates, which are used by the Committee. The former risk is clearly beyond the Committee's control. Although the federal estimates of personal income for a year may change by material amounts in the first two years after the close of the year, subsequent adjustments generally have been small.
Clearly, there is always a risk of reductions in projected levels of personal income. Maryland’s economic growth over the next ten years will be affected by slower population growth and the aging of the population, potentially slowing job growth. The Committee reviewed a sensitivity analysis that assumed personal income growth similar to the recession of the early 1990s. In this scenario, the debt outstanding to personal income ratio increased by approximately .3%. Since the highest debt outstanding to personal income ratio in Table 1 is 3.43% in 2012, even with an additional .3%, it is unlikely that the affordability criterion of 4.0% would be breached as long as all other assumptions in Table 1 remain as projected. The personal income growth rate used to develop projections in Appendix A-1 for 2009 through 2018 are all below the 10-year average for 1998 through 2007, which was 5.76%.
Changes in and Sources of Revenues Appendix A-2 details the total revenues and its components from FY 1999 to FY 2018.
Total revenues are comprised of general fund revenues, property taxes, bond premiums, Transportation Trust Fund revenues plus revenues attributed to GARVEE Bonds, Bay Restoration Bonds and Stadium Authority Bonds.
These projections do not take into account any possible changes in future tax rates or
structures. However, the Committee did review a sensitivity analysis that assumed future slots revenues. If the referendum passes in November 2008, it is projected that these additional revenues could decrease the debt service to revenues ratio by approximately .2%.
General Funds were projected by the Bureau of Revenue Estimates. Growth in General
Funds ranged from 4.8% and 3.9% in FY 2008 and 2009 to the mid 4% range from 2010 through 2012 and 4.0% in 2013. Beginning in 2014, growth was assumed at 4.5%; (2.5% real growth and 2.0% inflation). Estimates were obtained for property tax revenue from the Department of Assessments and Taxation (DAT) for fiscal years 2009-2013. For fiscal years 2014 through 2018, after consultation with DAT, DBM and STO, the growth in property taxes was projected at a conservative 2.5%. Bond premiums and Annuity Bond Fund miscellaneous receipts are also included as revenues. Because bond premiums can be volatile, they are only projected through the current fiscal year and miscellaneous receipts are relatively insignificant.
Transportation Revenues in Appendix A-2 represent the Transportation Trust Fund
revenues. Lottery revenues that are transferred to the Stadium Authority are the source of Stadium revenues plus a ticket charge at the Hippodrome Theater.
52
In 2008, as part of the review of variables incorporated in the affordability criteria, the Committee standardized the calculation of revenues for all components of tax-supported debt. Revenues for GARVEE Bonds and Bay Restoration Bonds are no longer limited to their respective debt service as had been the prior practice. Beginning in the 2008 analysis, revenues for GARVEE Bonds and Bay Restoration Bonds now include all federal capital highway revenues and bay restoration fees respectively. This adjustment matches the convention that has been used by CDAC for all other tax-supported debt. For instance, debt service on General Obligation Bonds is measured using all available revenues from the general fund, bond premiums and real property taxes and revenues were not restricted solely to debt service on G.O. Bonds.
Interest Rate Risk Debt service is calculated for General Obligation Bonds assuming interest rates of 5% for
the February and July 2009 sales. A rate of 5.25% was assumed for the February 2010 sale and for the remaining issues through 2018, the rate is projected at 5.5%. These rates are within the State’s experience in the last 12 years and the State’s Financial Advisor has concurred with these estimates. The recent TIC for the 2008 Second Series that was sold on July 16, 2008 was 3.86% and there were 5% coupons for all maturities. See Graph 3 for the history of TICS from 1988 to the present.
For leases, the analysis estimates rates at between 2.3% and 3.0% for the shorter term
capital equipment leases and 5.5% for the longer term energy leases. Current rates on capital equipment leases are 2.12% and 2.45% for a three year and five year lease, respectively. The rate for the most recent energy lease financing in December 2007 was 3.35% for a 15 year lease.
The interest rate used by Maryland Water Quality Financing Administration for the Bay
Restoration Bonds was 5.5% for issuances in fiscal year 2009 and beyond. Maryland Department of Transportation used 4.2% and 4.8% for the 2009 and 2010 sales, respectively, and 5.0% for all sales after 2011.
Changes in the Definition of Tax-Supported debt Changes in the definition of tax-supported debt dictated by an outside authoritative group
are unlikely but there would be a major impact if, for example, the bond rating agencies were to include State housing agency debt as tax-supported debt or if the Governmental Accounting Standards Board required long-term operating leases to be included on the State's balance sheet. Although changes in standards used by outside authoritative groups might have a major impact on measured affordability, such changes are likely to be implemented with ample lead time and would either only affect the “out-years” of the program or provide the Committee with time to adjust its program.
53

Changes in the Bond Issuance Plans of Other Components of State Tax Supported Debt
Changes in the bond issuance plans for other issuers of tax-supported debt can take the form of expansion of existing programs, as was the case with the expanded Consolidated Transportation debt issuance associated with the 1992 gas tax increase, or a totally new program, such as the financings by the Maryland Stadium Authority or the Bay Restoration Bond program. Even if the Committee recognizes a potential new program, the exact timing of legal enactment and the amount of new debt are less certain, and so they are not included in these assumptions.
The assumptions regarding non-general obligation components of tax-supported debt and debt service are as described in Section II. The Department of Transportation’s debt is expected to rise consistently over the next several years, especially because their authorization limit was raised from $2.0 billion to $2.6 billion in the 2007 1st Special Session. The issuance of GARVEE Bonds, supported by federal revenue, is projected at the statutory limit and the issuance of Bay Restoration Bonds began in fiscal year 2008. The projections for future equipment and energy lease purchase financings are based on surveys of State agencies. The Maryland Agricultural and Resource-Based Industry Development Corporation (MARBIDCO), a recently created instrumentality of the State possessing revenue bond issuance authority, is not expected to issue any tax-supported debt at this time. The status of this issuer’s program should be reviewed annually by the Committee.
The Committee reviewed a sensitivity analysis that assumed the issuance of an additional
$250 million in Bay Restoration Bonds. In this scenario, the debt outstanding to personal income ratio increased less than .1%. Changes within the General Obligation Bond Program
Changes within the General Obligation Bond program may arise because of changes in: (1) the types and costs of facilities and other projects financed by General Obligation Bonds; or (2) changes in the speed at which authorized bonds are issued. Changes in the types and costs of facilities do not necessarily affect total authorizations but may lead to a re-allocation of resources. The Committee's recommendations are made in terms of a total dollar amount of bonds, not in specific capital projects. Changes in construction costs, the availability of PAYGO funding, the need for unanticipated new projects, changes in federal tax laws, and a host of other variables influence both the need for General Obligation Bonds and the share of the total allocation allotted to each use. Such changes affect which assets can be acquired within a specific dollar amount of the program. These changes by themselves, however, affect neither the dollar amount of the Committee's assumed authorizations nor the ratio of debt outstanding compared to personal income. Therefore, without Committee or General Assembly action to alter the total dollars to be authorized in the plan, there is no affordability risk resulting from such changes within the general obligation plan.
Changes in the timing of issuance of authorized bonds, however, may affect the affordability criteria. Bonds authorized at a General Assembly session are not immediately issued. In fact, only half of the bonds authorized each year are typically issued within the
54

ensuing two fiscal years and the remaining issuances occur over the next three years. The bonds are sold over an extended period of time as the projects are developed and cash is required to pay property owners, consultants, contractors, equipment manufacturers, etc. Consequently, the impact of a change in any year's debt authorizations translates slowly into issuances and affects the outstanding level of debt with a substantial lag. Appendix B-1, Proposed General Obligation Authorizations and Estimated Issuances converts the recommended levels of new General Obligation Bond authorizations into a projected level of annual issuances; it is assumed that all authorized debt will be issued. In addition to projecting issuances at prescribed levels, the State Treasurer’s Office monitors the disbursement pace of bond proceeds and adjusts issuance amounts as necessary.
While some projects currently authorized will be abandoned or completed for less than authorized, it is assumed that such unnecessary authorization will be de-authorized and re-appropriated into other approved projects. Although some authorizations may ultimately be cancelled rather than re-appropriated, the amount of such cancellations are expected to be immaterial to the analysis. Any systematic change that would accelerate or retard the speed with which bonds are issued would increase or decrease the amount of debt outstanding and debt service and consequently affect both of the affordability ratios. The Committee reviewed the issuance projections for the 2008 Report in light of the pattern of recent authorizations and issuances. The following chart compares projected to actual issuances. Timing can explain some of the differences between projections and issuances in a specific fiscal year.
Comparison of Projected to Actual Issuances* ($ in millions)
Projected Issuances in
CDAC Reports
FY 2005 FY 2006 FY2007 FY2008 FY2009
2001 $450 $550 $600 $650 $700 2002 $525 $550 $575 $600 $625 2003 $625 $600 $600 $625 $700 2004 $650 $650 $650 $675 $700 2005 XXXX $750 $675 $700 $725 2006 XXXX XXXX $675 $700 $760 2007 XXXX XXXX XXXX $725 $810 2008 XXXX XXXX XXXX XXXX $810
Actual
Issuances
$775 $750 $675
$775
$810
(as of September 2008)
* Issuances are for new money only, amounts do not include refundings.
55

However, the most important reason for accelerated issuances is the increase in authorizations which is depicted in the following chart.
Projected General Assembly Authorizations in Fiscal Years
($ in millions) 2001 2002 2003 2004 2005 2006 2007 2008 2009 2010
Projected Authorizations
in CDAC Reports
2008 x x x x x x x x $1,110 $990 2007 x x x x x x x $935 $960 $990 2006 x x x x x x $810 $835 $860 $890 2005 x x x x x $690 $710 $730 $745 $770 2004 x x x x $670 $685 $700 $715 $630 $645 2003 x x x $650 $665 $680 $695 $710 $630 $645 2002 x x $740 $555 $570 $585 $600 $615 $625 $640 2001 x $520 $535 $550 $565 $580 $595 $610 $625 $640 2000 $475 $490 $505 $520 $535 $550 $565 $580 $595 $610
Gray indicates those years where the increase in authorization from the prior year was approximately $100 million or more. Fiscal Years 2010 - 2018 Risks
In considering the affordability risk associated with the 2010-2018 projected authorizations in this year's report, the major risks appear to be:
• Uncertainty regarding the rate of growth in personal income and revenues when financial markets are extraordinarily volatile and the economy is near or already in recession;
• Authorizations of General Obligation Bonds greater than the 2008 recommendation and out year projections;
• Acceleration in the issuance of General Obligation Bonds; • Potential authorization of tax-supported debt to finance projects that are presently
unknown to the Committee; • Interest rate risk, especially noting the inflationary concerns in mid-2008.
There do not appear to be any federal regulatory changes that might lead to an acceleration of general obligation debt issuances. Regulatory actions are from time to time announced or proposed and litigation is threatened or commenced which, if implemented or concluded in a particular manner, could adversely affect the market value of the Bonds. It cannot be predicted whether any such regulatory action will be implemented, how any particular litigation or judicial action will be resolved, or whether the Bonds or the market value thereof would be impacted thereby. Therefore, we have not considered this to be a risk to our interest rate assumptions. The effect of any federal budget action is unclear and not apparent in the near
56

term. Indeed, the on-going process of military base adjustments is expected to bring a significant number of high-level jobs and net positive revenue to Maryland. Finally, there is no evidence that the rating agencies or the Governmental Accounting Standards Board are contemplating changes in standards that would expand the definition of tax-supported debt. A substantial acceleration of the issuances of General Obligation Bonds is unlikely. The amount of authorizations that are unissued appears reasonable as does the speed at which authorizations are converted to issuances. Current planned issuance levels are expected to be sufficient to provide adequate capital cash levels. The changes in the issuance plans of other components of tax-supported debt also appear to pose limited risk at this time. The assumed issuances by the Department of Transportation are consistent with current statutory limits, revenue forecasts and debt service coverage criteria. GARVEE Bonds and Bay Restoration Bonds are included as components of State tax-supported debt and are incorporated into the analysis.
Conclusion The analysis suggests that the Committee's projection of General Obligation Bond
authorizations is currently affordable and, due to conservative assumptions, the risks of exceeding the affordability criteria are limited.
None of the potential risks – limited growth of personal income and revenues, accelerated
sales of G.O. Bonds, increased authorizations of either G.O. Bonds or other components, or interest rate risk – pose a serious threat of breaching the affordability criteria. Projections used by the Committee for personal income growth are below the average actual income growth for the last ten years. Revenues are the most recent projections available from the Bureau of Revenue Estimates. The need for accelerated sales of G.O. Bonds appears remote. Finally, authorizations of tax-supported debt components (either G.O. or other) are wholly within the State’s control. The Committee believes that the $1,110 million authorization recommendation for the 2009 legislative session/2010 capital program, $990 million for the 2010 legislative session/2011 capital program, and 3% increases for the following years is prudent and within current projections of capacity. Within these levels, relying upon prudent timing of authorization and issuances, and including the use of available PAYGO general funds, the Committee believes that many of the current projected needs in school construction, transportation, higher education and other essential areas can be met; but the Committee also acknowledges that the recommendation falls far short of total funding requests.
57
VII. HIGHER EDUCATION DEBT A. Background
Chapter 93, Laws of Maryland, 1989, now codified in Title 19 of The Education Article (the “Statute”), altered the revenue bonding framework and authority of the University System of Maryland (USM), Morgan State University, and St. Mary's College of Maryland and also assigned certain duties relevant to those alterations to the Capital Debt Affordability Committee. Chapter 673, Laws of Maryland, 1994, required the Capital Debt Affordability Committee to also review the size and condition of any debt of the Baltimore City Community College.
The Statute provided a framework for the issuance of higher education debt. Specifically, the Statute distinguished between auxiliary facilities (which generate fees or income arising from the use of the facility) and academic facilities (which are primarily instructional, but can include any facilities not defined as auxiliary). The statute also authorized institutions to issue bonds to finance either auxiliary or academic facilities (maximum terms of 33 and 20 years, respectively) with the stipulation that any academic facilities so financed must first be expressly approved by an act of the General Assembly as to both project and amount.
Furthermore, the Statute specified fund sources that could be pledged as security as well as those that could be used for debt service payments. Specifically available to be pledged as security are auxiliary fees (fees and rents arising from the use of the auxiliary facility) and academic fees (tuition and student fees). The systems specifically cannot pledge: (1) a State appropriation; (2) contracts, grants, or gifts; or (3) any other source not expressly authorized by the General Assembly. Debt service on bonds is payable solely from auxiliary fees, academic fees, a State appropriation expressly authorized for that purpose, or revenues from contracts, gifts, or grants, as appropriate.
B. CDAC Duties
In addition to defining higher education bond authority and authorizing certain projects, the Statute directs the Capital Debt Affordability Committee to:
1. "...review on a continuing basis the size and condition of any debt of the University System of Maryland, Morgan State University, St. Mary's College of
Maryland, and Baltimore City Community College;"
2. "In preparing an estimate with respect to the authorization of any new State debt” [i.e., general obligation debt] to "take into account as part of the affordability analysis any debt for academic facilities to be issued by a System;" and
3. “...submit to the Governor and the General Assembly the Committee's estimate of
the amount of new bonds for academic facilities that prudently may be authorized in the aggregate for the next fiscal year by the University System of Maryland, Morgan State University, and St. Mary's College of Maryland."
58
Charge #1 was met during the meetings of CDAC when representatives from all four institutions presented debt information to the Committee. A summary of the data presented is in Section C below. Charges #2 and #3 are discussed in Sections D, E and F below. C. Size and Condition of Debt of the University System of Maryland, Morgan State
University, St. Mary's College of Maryland, and Baltimore City Community College
University System of Maryland Since 1989, the General Assembly has authorized bonds totaling $644.2 million for various academic facilities for the University System of Maryland (USM). Of this amount, $33.0 million was authorized by the 2008 General Assembly for academic facilities (Chapter 545, Laws of Maryland, 2008). In fiscal 2008, the total issuance for academic and auxiliary facilities was $90 million. USM estimates its debt outstanding (Bonds, Certificates of Participation, Capital Leases and Loans) at $963,000,000 at June 30, 2008. The bonds are rated as follows: Fitch Ratings, AA; S&P, AA+ (upgraded from AA in 2008); and Moody’s, Aa2. All ratings have a stable outlook. Credit strengths include strong student demand, sound financial operations and a large, diverse revenue base. Credit challenges noted by the rating agencies include potential increases in capital spending to meet enrollment growth and limited liquidity. According to a 2007 Moody’s report, the median rating for public universities is A2, with the average climbing to Aa3 when weighted by the amount of rated debt. Projected issuances through fiscal year 2014 for the University System of Maryland are in Table 4, page 64. USM has $50 million of variable rate bonds outstanding which are insured by FSA. They have not used interest rate exchange agreements or Guaranteed Investment Contracts.
St. Mary’s College of Maryland
Debt outstanding at June 30, 2008 includes: $41.4 million in revenue bonds, a $4.0 million Bond Anticipation Note, and a capital lease and loan for $2.8 million related to an energy performance contract. Moody’s has rated the bonds A2 with a stable outlook. Currently, there are no projections for future bond issuances. St. Mary’s College of Maryland does not have any interest rate exchange agreements, variable rate bonds or Guaranteed Investment Contracts. Except for the Bond Anticipation Note, substantially all of the bonds are insured by AMBAC.
59

Morgan State University Morgan State University is rated A1 by Moody’s Investors Service and A+ by Standard
and Poor’s. The University was placed on credit watch by Moody’s due to a downturn in freshman enrollment in the fall of 2005. While there has been a resurgence in enrollment and a campus tour by Moody’s in August 2007, they have not changed the rating status. Standard and Poor’s completed their routine review in December 2007 and affirmed the A+ rating with a stable outlook.
Of the authorized issue limit of $88 million, $62.2 million of bonds and $2.0 million of
capital leases are outstanding as of June 30, 2008. The University does not have immediate plans for the issuance of additional debt. Morgan State University does not have any interest rate exchange agreements, variable rate bonds or Guaranteed Investment Contracts nor are any of their bonds insured. Baltimore City Community College
BCCC has no bonds outstanding and has no plans to issue bonds in fiscal year 2009. BCCC’s current bond authorization of $15 million is for auxiliary bonds only. Therefore BCCC would not be included in the Committee’s estimate of new academic bonds.
BCCC is currently exploring the feasibility and desirability of various projects that might be funded by the issuance of auxiliary bonds, capital leases, public-private partnerships and/or the College.
During the 2009 legislative session, BCCC is planning to pursue legislation that provides
academic bonding authority of up to $50 million.
D. Incorporating Higher Education Academic Debt into the Affordability Analysis
The language in the statute expanding the Committee's charge states: "In preparing an estimate with respect to the authorization of any new State debt [i.e., general obligation debt], the Committee shall take into account as part of the affordability analysis any debt for academic facilities to be issued by a system." This language, however, is not explicit regarding the meaning of "take into account."
The statute does not direct, nor has the Committee elected to include higher education
debt as a component of State tax-supported debt for purposes of the capacity criteria or affordability analysis. Consequently, the Committee's recommendations relating to new authorizations of general obligation debt and higher education academic debt are made independently for the following reasons:
1. The rating agencies do not consider debt issued by institutions of higher education
as State tax-supported debt. The debt of the systems, either currently outstanding
60

or related to future issuances, is not included by the rating agencies in determining the rating of the State's General Obligation Bonds.
2. Both the statutory structure of higher education debt and the current budgetary
policies related to higher education debt underscore the separation of higher education debt and tax-supported debt. The Statute provides that higher education debt may not be secured by a pledge of the issuer's general fund appropriation. The Statute further provides that no general funds may be used to pay debt service unless specifically authorized in the budget.
3. The revenue sources that secure the bonds are under the direct control of the
systems and not directly subject to the approval of either the Governor or the General Assembly.
The Committee believes that its analysis, discussions, and deliberations of higher
education debt levels, capacity, and needs address the legislative intent to take into account higher education academic debt. E. University System of Maryland Debt Management Policy
Working with Public Financial Management (PFM), USM’s financial advisor, the Chancellor’s Office developed a new policy on debt management as a result of rating agency concerns regarding liquidity; financial reporting changes mandated by Government Accounting Standards Board Statement 35 – Basic Financial Statements and Management Discussion and Analysis for Public Colleges and Universities; and the complexities of “off-balance sheet” financing.
In February, 2008 the Board of Regents approved a policy on debt management that: • Provides criteria to protect the bond ratings; • Provides interest rate management strategies; • Provides definitions of all types of debt and its impact on debt capacity; • Establishes a process to assess a project’s impact on debt capacity.
As a result of this policy, USM is committed to maintaining: • Available resources that are not less than 55% of direct debt, and; • Debt service may not exceed 4.5% of operating revenues plus State Appropriations.
Available resources include net assets of USM and its affiliated foundations with adjustments
for certain long term liabilities. The debt service burden is presented in Table 4 (page 64).
61

The following table includes actual data for fiscal years 2004 through 2007 and
projections for fiscal years 2008 through 2009:
University System of Maryland Ratio of Available Resources to Debt Outstanding
($ in thousands)
FY Available Resources Debt Outstanding
Ratio of Available Resources to Debt
Outstanding 2004 $646,927 $998,073 64.82% 2005 $743,000 $1,000,000 74.30% 2006 $758,000 $935,000 81.07% 2007 $992,147 $954,846 103.91% 2008
Projected $1,023,435 $963,723 106.20%
2009 Projected $882,085 $1,006,469 87.64%
Source: University System of Maryland F. 2008 Recommended Authorization for Higher Education Academic Debt
The Committee's charge is to submit an "estimate of the amount of new bonds for academic facilities that prudently may be authorized in the aggregate for the next fiscal year by the University System of Maryland, Morgan State University, and St. Mary's College of Maryland." This charge, therefore, requires the Committee to distinguish between burdens imposed by academic debt and those imposed by auxiliary debt in arriving at a recommendation for academic debt alone. From a credit analyst's point of view, however, the aggregate level of a system's debt is critical, while the type of debt (academic versus auxiliary) has no relevance to the credit analysis.
One approach to determining a prudent amount of new academic debt to be authorized is to start with the aggregate level of debt that each system anticipates issuing. If it is estimated that the level of debt is prudent over time, then it is reasonable for the Committee to accept the aggregate total and also to accept the breakdown (between academic and auxiliary) proposed by a system.
The guidelines initially adopted by the Committee to judge debt manageability are those contained in the rating methodology used by one of the major rating agencies. Standard and Poor's uses five factors to rate a public institution's debt (over a time frame of several years): (1) the rating of the State; (2) the State's general financial support for higher education as a whole; (3) the State's financial support for the particular institution; (4) the institution's demand and financial factors; and (5) the security pledge. The first, second, and fifth factors are the same for all four systems. All systems benefit from the State's AAA rating; all are part of public higher education in Maryland; and all can offer the same types of security.
62
The third factor is only relevant to Morgan State University, St. Mary’s College of Maryland and Baltimore City Community College, since the University System of Maryland receives approximately 89% of the State general funds appropriated to the four systems. The fourth factor, the institution's demand and financial factors, encompasses a host of data dealing with the student body, financial performance, and components of debt.
Table 4 displays information on the debt of each of the four higher education systems,
compliance with statutory limitations, and financial performance.
1. Legislation limits the aggregate principal amount of revenue bonds outstanding and the present value of capital lease payments, less the amount of any reserves established therefore, for both academic and auxiliary facilities. The current statutory limits are $1,050.0 million for the University System of Maryland, $88.0 million for Morgan State University, $60.0 million for St. Mary's College of Maryland, and $15.0 million for Baltimore City Community College. All four higher education systems are within the statutory limits as of June 30, 2008.
2. A key measurement of financial performance frequently used by credit analysts is debt
burden; that is, debt service as a percent of operating revenues plus State appropriations. PFM recommended to the USM that this ratio shall not exceed 4.5%.
For purposes of this analysis and for the CDAC recommendation, the relevant measure is
debt burden. As can be seen from the final column in Table 4, the University System’s debt issuance plan would result in a debt burden level well below the 4.5% maximum recommended by PFM. There appears to be no need for the Committee's recommendation to differ from the System’s plans at this time. Therefore, the Committee recommends a limit of $27 million of new bonds for USM academic facilities to be authorized in the aggregate for the next fiscal year. Morgan State University and St. Mary’s College of Maryland do not propose to issue bonds for academic facilities in fiscal year 2010.
63
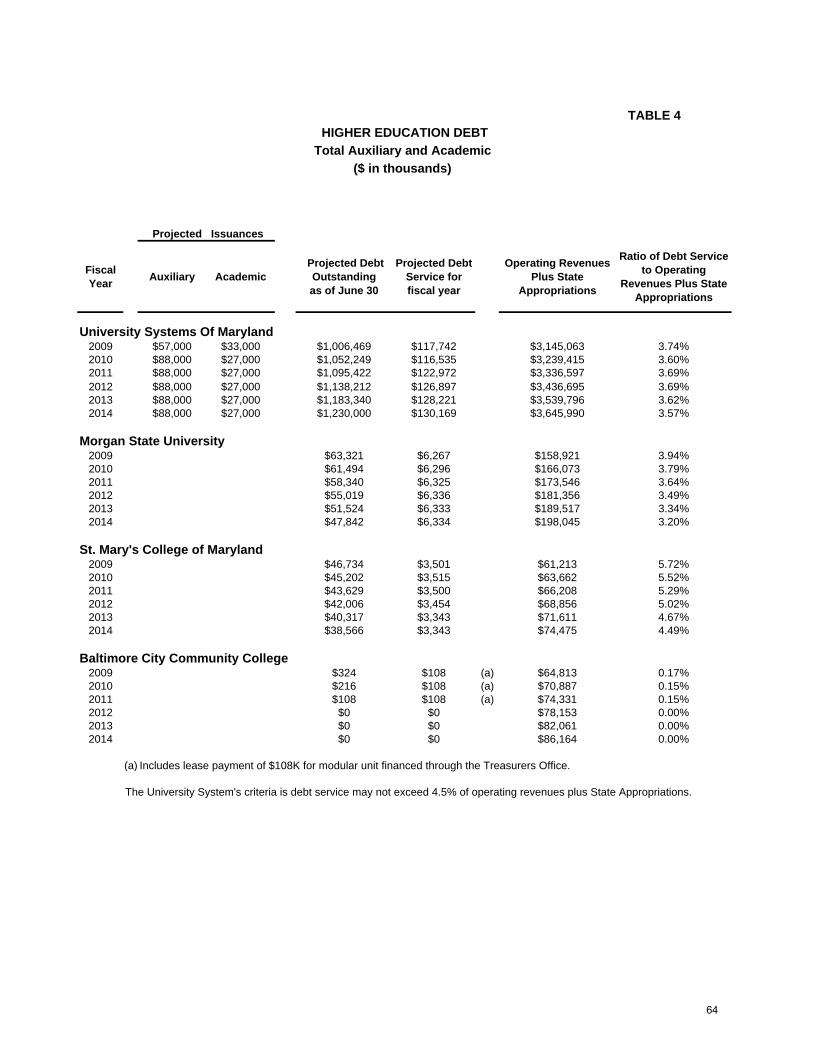
TABLE 4HIGHER EDUCATION DEBT
Total Auxiliary and Academic($ in thousands)
Projected Issuances
Fiscal Year Auxiliary Academic
Projected Debt Outstanding as of June 30
Projected Debt Service for fiscal year
Operating Revenues Plus State
Appropriations
Ratio of Debt Service to Operating
Revenues Plus State Appropriations
University Systems Of Maryland2009 $57,000 $33,000 $1,006,469 $117,742 $3,145,063 3.74%2010 $88,000 $27,000 $1,052,249 $116,535 $3,239,415 3.60%2011 $88,000 $27,000 $1,095,422 $122,972 $3,336,597 3.69%2012 $88,000 $27,000 $1,138,212 $126,897 $3,436,695 3.69%2013 $88,000 $27,000 $1,183,340 $128,221 $3,539,796 3.62%2014 $88,000 $27,000 $1,230,000 $130,169 $3,645,990 3.57%
Morgan State University2009 $63,321 $6,267 $158,921 3.94%2010 $61,494 $6,296 $166,073 3.79%2011 $58,340 $6,325 $173,546 3.64%2012 $55,019 $6,336 $181,356 3.49%2013 $51,524 $6,333 $189,517 3.34%2014 $47,842 $6,334 $198,045 3.20%
St. Mary's College of Maryland2009 $46,734 $3,501 $61,213 5.72%2010 $45,202 $3,515 $63,662 5.52%2011 $43,629 $3,500 $66,208 5.29%2012 $42,006 $3,454 $68,856 5.02%2013 $40,317 $3,343 $71,611 4.67%2014 $38,566 $3,343 $74,475 4.49%
Baltimore City Community College2009 $324 $108 (a) $64,813 0.17%2010 $216 $108 (a) $70,887 0.15%2011 $108 $108 (a) $74,331 0.15%2012 $0 $0 $78,153 0.00%2013 $0 $0 $82,061 0.00%2014 $0 $0 $86,164 0.00%
(a) Includes lease payment of $108K for modular unit financed through the Treasurers Office.
The University System's criteria is debt service may not exceed 4.5% of operating revenues plus State Appropriations.
64
Appendix A History of the Capital Debt Affordability Committee
Duties The creation of the Capital Debt Affordability Committee was an outgrowth of two
events: the dramatic increase in outstanding debt during the mid-1970's due to the creation of the State’s school construction program and the release in June 1974 of the Department of Legislative Services' two year study on the State's debt picture, titled "An Analysis and Evaluation of the State of Maryland's Long-Term Debt: 1958 - 1988." In response to this study and the rising level of State debt, the 1978 General Assembly enacted the current State Finance and Procurement Article, Section 8-104, et seq., which created the Committee and Capital Debt Affordability process.
The 1989 General Assembly further expanded the Committee's charge as part of
legislation relating to higher education debt (Chapter 93, Laws of Maryland, 1989). The statute requires the Committee to review on a continuing basis the size and condition of any debt of the University System of Maryland, Morgan State University, and St. Mary's College of Maryland; take any debt issued for academic facilities into account as part of the Committee's affordability analysis with respect to the estimate of new authorizations of general obligation debt; and, finally, to submit to the Governor and the General Assembly an estimate of the amount of new bonds for academic facilities that prudently may be authorized in the aggregate for the next fiscal year by the University System of Maryland, Morgan State University, and St. Mary's College of Maryland. The 1994 General Assembly added Baltimore City Community College to the list of higher education institutions that the Committee reviews.
The 2004 General Assembly added to the duties of the Committee in Public School
Facilities Act of 2004 (Chapters 306, 307, Laws of Maryland, 2004, uncodified Section 11), in which it directed the Committee to annually “review the additional school construction funding needs as identified in the 2004 Task Force to Study Public School Facilities report and … make a specific recommendation regarding additional funding for school construction when recommending the State’s annual debt limit.” The statute also directs that the Committee “include a multiyear funding recommendation that will provide stability in the annual funding for school construction.”
Membership Since 1979, the members have been the State Treasurer (Chair), the Comptroller, the
Secretaries of Budget and Management and Transportation, and one public member appointed by the Governor. The 2005 Session of the General Assembly expanded the membership of the Committee with the addition of the Chair of the Capital Budget Subcommittee of the Senate Budget and Taxation Committee and the Chair of the Capital Budget Subcommittee of the House Committee on Appropriations as non-voting ex officio members. Chapter 445, Laws of Maryland, 2005.
65

Definition of Tax-supported debt In addition to the duties previously noted, the Committee has generally reviewed other
types of public debt issued by State or State-created authorities or agencies. In keeping with a narrow interpretation of its statutory charge, the Committee's efforts through 1986 focused mainly on bringing the State's general obligation debt in line with certain parameters. In 1987, however, the Committee began to adopt a more comprehensive view of State debt that included all tax-supported debt in addition to general obligation debt.
This broader view was adopted in recognition of the fact that the rating agencies and
investment community take a more comprehensive view of a state's debt when analyzing that state's obligations. Discussions with rating analysts over several years indicated that analysts were interested in all tax-supported debt. Summaries of rating agency reports indicated that the measure of debt used was "net tax-supported debt” - the sum of general obligation debt, consolidated and county transportation debt (net of sinking funds), capital lease commitments, and tax or bond anticipation notes.
The more comprehensive view of debt also recognized that other forms of long-term commitments were becoming more common. Capital leases, particularly lease purchase obligations, were more visible, if not more widely used. The bonds issued by the Maryland Stadium Authority for the Baltimore stadium are supported by lease arrangements; the State had consolidated a significant amount of equipment lease obligations; and the Motor Vehicle Administration was using the capital lease method for expanding or relocating its service center network. Although these leases do not represent debt in the constitutional sense, any default on these leases would be viewed by the market as similar to a default on State bonds. This broader view was ultimately codified and included in the Committee's statutory charge by Chapter 241, Laws of Maryland, 1989.
The Committee considered in 2004 the question of whether Bay Restoration Bonds constitute a new component of State tax-supported debt for purposes of debt affordability calculations. The Bay restoration fee is applied broadly across the State and is not directly tied to the use of a specific WWTP. There is a consensus among counsel that the maturity of the bonds must be limited to 15 years, the maximum for “State debt.” As a result, the Committee concluded that the Bay Restoration Bonds are State tax-supported debt.
Most recently, the 2005 General Assembly expanded the scope of what the Committee
considers in Chapters 471, 472, Laws of Maryland, 2005, by explicitly recognizing debt issued by the Maryland Department of Transportation (MDOT) under Title 4, Subtitle 6 of the Transportation Article, or by the Maryland Transportation Authority (MdTA) under Title 4, Subtitle 3 of that Article, when “secured by a pledge of future federal aid from any source” (e.g., GARVEE Bonds) as “tax-supported debt.” Thus, this type of debt must be taken into account both in the annual authorization recommendation and in consideration of the amount of tax-supported debt outstanding. It is useful to note that the bond rating agencies are not uniform in their treatment of the federal-revenue backed debt when assessing the State’s situation. Two of the agencies do include
66
GARVEEs as tax-supported debt outstanding; the remaining agency considers it a “gray area” and would not include them as long as the bonds are “stand alone,” that is, not backed by the State’s full faith and credit. All three agencies also noted that to the extent the State includes GARVEEs as tax supported, it would be appropriate to include the supporting federal revenue stream that backs the bonds when considering the debt service affordability criterion of 8.0% of State revenues. Further, one of the two bond rating agencies that include GARVEEs as tax-supported debt stated that they did so for their own analytic purposes, but would accept and understand if a State did otherwise for affordability determination purposes. History of Debt Affordability Criteria
Based upon an analysis of available material and consultation with a number of financial experts, the following affordability criteria were developed by the Committee in 1979:
• Outstanding debt should be no more than 3.2% of State personal income; • Adjusted debt service should be no more than 8.0% of State revenues; and • New authorizations should be kept in the range of redemptions of existing debt
over the near term. These criteria were adopted by the Committee solely for the analysis of general obligation debt.
Criteria 1 and 2 represented traditional measures and criterion 3 reflected a discretionary policy position that the State should "get out of debt." The Committee at that time declared that, given the high debt level of the mid-late 1970’s, the first two criteria were goals to be achieved over time, and the final criterion became controlling over the short term.
In 1987, while retaining the first and second criteria for evaluating the expanded
definition of debt and debt service, the Committee concluded that the third criterion was no longer an applicable guideline. The basis for its conclusion was threefold. First, the high ratings of the State's General Obligation and Transportation Bonds indicated that the existing level of debt and the planned increases were acceptable to the rating agencies. Second, pressing legislative and executive commitments required an increase in the level of bonded debt to finance needed transportation and other projects. Third, adherence to the criterion tied yearly authorizations to events of 15 years before, thereby producing highly variable bond authorizations inconsistent with either good debt management or a stable capital program.
In 1988, a detailed survey of credit analysts was undertaken to obtain their views on the Committee's comprehensive approach to reviewing debt and to the criteria the Committee had been using for 10 years. The survey affirmed the Committee's decision to take an expanded view of debt. In addition, criteria 1 and 2 were almost universally approved. This position was reinforced in discussion with investment banks and bond rating agencies as recently as July 2005. Indeed, the rating agencies have repeatedly cited the Capital Debt Affordability process and criteria as major reasons for awarding Maryland AAA status.
The 2007 Capital Debt Affordability Committee Report (Section VII) documented the
Committee’s review of its affordability criteria, initiated at the request of the General Assembly.
67
The Committee concluded the 2007 Report with a recommendation for the continued study and evaluation of the criteria in 2008. That recommendation was followed and, after thorough analysis by the Committee and staff, and following consultation with the rating agencies and the State’s financial advisor, the Committee voted to retain the 8.0% debt service to revenues criterion and to change the debt outstanding to personal income criterion from 3.2% to 4.0%. A complete report of the process undertaken by the Committee to change the criterion is in Section V of the 2008 CDAC Report.
History of Authorization Increases and Rate of Increases In its 1992 report, while reaffirming its belief in the theories underlying its prior
recommendations, the Committee recommended that the six-year program originally recommended in 1988 be reduced, due principally to the severe national and state economic downturn. The 1992 recommendation acknowledged that the persistent recession had depressed the levels of personal income and that the structural changes in Maryland's economy would deter near term resumption of the State's rapid growth in personal income. The 1992 program also recognized that, while there had been no abatement in the population growth and need for services, cost inflation and, therefore, total need had been lower than originally projected in the years between 1988 and 1991. Considering all of these factors, the Committee recommended limiting authorization increases to 3% based at that time on the prevailing inflation rate plus 1%. In earlier years, the recommended out-year increases had varied between 3-5%, usually incorporating some estimate of inflation plus need. In the years between 1993 and 2002, the State’s economy and personal income recovered significantly but, due to the availability of general PAYGO funds, the guideline increase of 3% was generally observed and incorporated in future year projections. As debt authorizations grew at a slower rate than personal income, the level of “unused” debt capacity increased. Between 2002 and 2008, the inclusion of Bay Restoration Bonds and GARVEEs as State tax-supported debt and the increases in the authorizations of General Obligation Bonds absorbed virtually all of the previously unused debt capacity. The recommendations for General Obligation Bond authorizations in 2006, 2007 and 2008 were over the amount that would have been recommended had the 3.0% growth rate been maintained. In 2006 and 2007, the $100 million increases extended to future years. In 2008, the $150 million was projected as a one-time increase. See Section VI of the 2008 CDAC Report, “Changes within the General Obligation Bond Program” for further discussion.
68

Appendix B History of Stadium Authority Financings Oriole Park at Camden Yard
Currently the Authority operates Oriole Park at Camden Yards, which opened in 1992. In
connection with the construction of that facility, the Authority issued $155.0 million in notes and bonds. In October 1993, the Authority entered into an agreement with AIG-FP to implement a synthetic fixed rate refinancing of the sports facility bonds using a combination of variable rate refunding obligations and forward interest rate exchange agreements. As provided under the agreements, savings of $15.5 million was paid to the Authority on April 1, 1996. In accordance with this agreement and in consideration for the prior payment of the savings, the Authority issued its $17.9 million Sports Facilities Lease Revenue Refunding Bonds in December 1998, to refund its outstanding Sports Facility Lease Revenue Bonds Series 1989C, and issued its $121.0 million Sports Facilities Lease Revenue Refunding Bonds in December 1999, to refund its Sports Facilities Lease Revenue Bonds Series 1989D. The Authority’s notes and bonds are lease-backed revenue obligations, the payment of which is secured by, among other things, an assignment of revenues received under a lease of Oriole Park at Camden Yards from the Authority to the State. The rental payments due from the State under that lease are subject to annual appropriation by the General Assembly. Revenues to fund the lease payments are generated from a variety of sources, including in each year revenues from sports lotteries, the net operating revenues of the Authority, and $1.0 million from the City of Baltimore. In November 2001, the Authority issued $10.25 million in bond anticipation notes, which were refunded in July 2002 with $10.25 million in taxable lease-backed revenue bonds. The 2001 bond anticipation notes were used to fund a $10.0 million deposit to the “Supplemental Improvements Fund” under the Baltimore Orioles Lease in accordance with the order of the panel of Arbitrators in American Arbitration Association Case No. 16Y1150005500. In early 2007 the Baltimore Orioles filed for arbitration over the selection and installation of a new video board at Oriole Park at Camden Yards. In September 2007, the Authority and the Baltimore Orioles reached a settlement agreement, agreeing to purchase and install $9.0 million of new audio and video equipment funded by $5.5 million from the “Supplemental Improvements Fund” and $3.5 million from the Authority. The Authority’s share is financed under the State’s Master Equipment Lease-Purchase Program and amortized over 10 years.
Net debt service on the Authority’s bonds for Oriole Park at Camden Yards was $14.3 million in 2008.
69

Baltimore City Convention Center
The Authority also constructed an expansion of the Baltimore City Convention Center. The Convention Center expansion cost $167.0 million and was financed through a combination of funding from Baltimore City revenue bonds ($50.0 million), Authority revenue bonds ($55.0 million), State General Obligation Bonds ($58.0 million) and other State appropriations. As required, the City sold its revenue bonds before the Authority’s sale of lease-backed revenue bonds on August 25, 1994. The State sold $58.0 million in General Obligation Bonds designated for the Convention Center in sales from October 1993 to October 1996. The agreement between the City and the Authority provides that: (i) the City and the Authority each make equal annual contributions to a capital improvements reserve fund; (ii) after completion of construction through fiscal year 2008, the Authority and the City contribute toward operating deficits in the proportion Authority (⅔), City (⅓); and (iii) the City be solely responsible for operating deficits and capital improvements prior to completion of the expansion and after fiscal year 2008. During the 2008 General Assembly Session, a bill was passed that extends the State’s obligation of funding ⅔ of the operating deficit until December 15, 2014.
The State’s and Authority’s debt service for the Convention Center in fiscal year 2008 was approximately $5.0 and $5.1 million, respectively. The 2008 contribution to operating deficits and the project’s capital improvements fund was approximately $2.9 million. Through direct and indirect benefits, the project has covered its costs (debt service, operating deficit contributions, deposits to the capital improvements fund, and that portion of the Authority’s budget that is allocable to the Convention Center project) since 1999. In June 1998, the Authority entered into an agreement to implement a synthetic fixed rate refinancing of its revenue bonds for the Baltimore City Convention Center with Ambac using a combination of variable rate refunding obligations and forward interest rate exchange agreements. As provided under the agreements, a savings of $587,500 was paid to the Authority on June 10, 1998. The Authority called and reissued the Series 1994 bonds on December 15, 2006. The amount issued as the Baltimore Convention Center Lease Revenue Refunding Bonds, Series 2006 is $31.6 million which included $375,000 to be used for closing costs.
Ocean City Convention Center
The Authority also constructed an expansion of the Convention Center in Ocean City; the expansion cost $33.2 million and was financed through a matching grant from the State to Ocean City and a combination of funding from Ocean City and the Authority. In October 1995, the Authority issued $17.3 million in revenue bonds to provide State funding; as required, Ocean City sold $15.0 million of its special tax and general obligation bonds before the sale by the Authority. Authority debt service in connection with the revenue bonds for the Convention Center in Ocean City was $1.5 million in fiscal year 2008. The Authority will also continue to pay one-half of any annual operating deficits of the facility through December 15, 2015, after which time Ocean City will be solely responsible for operating deficits.
70

Ravens Stadium
The Authority currently operates Ravens Stadium, which opened in 1998. In connection with the construction of that facility, the Authority sold $87.6 million in lease-backed revenue bonds on May 1, 1996, for Ravens Stadium. The proceeds from the Authority’s bonds, along with cash available from State lottery proceeds, investment earnings, contributions from the Ravens and other sources were used to pay project design and construction expenses of approximately $229.0 million. The bonds are solely secured by an assignment of revenues received under a lease of the project from the Authority to the State. In June 1998, the Authority entered into an agreement to implement a synthetic fixed rate refinancing of the football lease-backed revenue bonds with Ambac using a combination of variable rate refunding obligations and forward interest rate exchange agreements. As provided under the agreements, savings of $2.6 million were paid to the Authority on June 10, 1998. The Authority called and reissued the Series 1996 bonds in March 1, 2007. The amount issued as the Sports Facilities Lease Revenue Refunding Bonds Football Stadium Issue, Series 2007 is $73.5 million which included $375,000 to be used for closing costs.
On December 15, 1997, the Authority issued $4.6 million in Sports Facilities Lease Revenue Bonds, Series 1997. The proceeds from these bonds were used toward the construction of Ravens Stadium. The Series 1997 bonds matured on December 15, 2007. The Authority’s combined debt service on the revenue bonds is $7.1 million annually.
Montgomery County Conference Center
In January 2003, the Authority issued $23.2 million in lease-backed revenue bonds in connection with the construction of a conference center in Montgomery County. The conference center is adjacent and physically connected to a Marriott Hotel, which has been privately financed. The center cost $33.5 million and is financed through a combination of funding from Montgomery County and the Authority. The Authority does not have any operating risk. The 2008 debt service for these bonds was $1.8 million. Hippodrome Theater In July 2002, the Authority issued $20.3 million in taxable lease-backed revenue bonds in connection with the renovation and construction of the Hippodrome Theater as part of Baltimore City’s West Side Development. The cost of renovating the theater is $ 63.0 million and is financed by various public and private sources. The Authority does not have any operating risk for the project which was completed in February, 2004. The 2008 debt service for these bonds was $1.8 million.
71

Camden Station Renovation In February 2004, the Authority issued $8.7 million in taxable lease-backed revenue bonds in connection with the renovation of the historic Camden Station located at the Camden Yards Complex in Baltimore, Maryland. The cost of the renovation is projected to be $8.0 million. The Authority has executed lease agreements for the entire building, with the Babe Ruth Museum leasing approximately 22,600 square feet and Geppi’s Entertainment Museum leasing the balance of the building. The Babe Ruth Museum opened on May 12, 2005 and the Geppi’s Entertainment Museum opened in fall 2006. The 2008 debt service for these bonds was $.6 million.
72

APPENDIX A - 1
MARYLAND PERSONAL INCOME AND POPULATION
Historical Data through 2007Projections 2008-2018
Updated September 2008
Calendar Year
Personal Income
% Change Population
% Change
($ in millions) (thousands)
1998 157,784$ 6.70% 5204 0.91%
1999 167,075$ 5.9% 5,255 0.98%
2000 181,958$ 8.9% 5,311 1.06%
2001 191,657$ 5.3% 5,375 1.21%
2002 198,824$ 3.7% 5,434 1.10%
2003 205,737$ 3.5% 5,494 1.11%
2004 220,127$ 7.0% 5,538 0.79%
2005 232,161$ 5.5% 5,573 0.64%
2006 245,303$ 5.7% 5,602 0.52%
2007 258,561$ 5.4% 5,618 0.29%
2008 269,860$ 4.4% 5,658 0.71%
2009 279,059$ 3.4% 5,700 0.74%
2010 292,832$ 4.9% 5,750 0.88%
2011 308,902$ 5.5% 5,797 0.81%
2012 323,797$ 4.8% 5,835 0.65%
2013 339,242$ 4.8% 5,869 0.59%
2014 355,967$ 4.9% 5,903 0.57%
2015 373,196$ 4.8% 5,937 0.57%
2016 390,624$ 4.7% 5,970 0.56%
2017 408,163$ 4.5% 6,001 0.53%
2018 426,040$ 4.4% 6,032 0.51%
5.65% Average rate of personal income growth for 10 year period 1998 through 20075.47% Median rate of personal income growth for 10 year period 1998 through 2007
Sources: Personal Income 1998-2007 Bureau of Economic Analysis, U.S. Dept. of Commerce 2008-2018 Economy .com June 2008 forecast
Population 1998-2007 Census Bureau, U.S. Dept. of Commerce 2008-2018 Forecast : Economy.com (May 2008 Forecast)
73
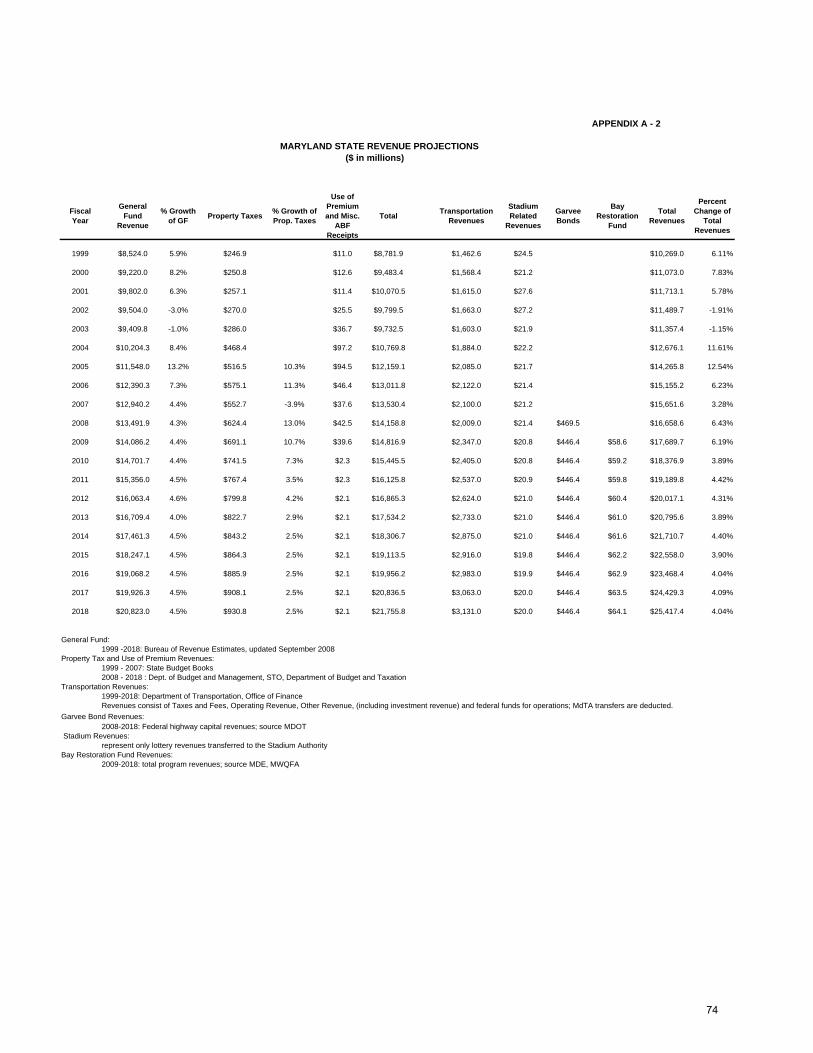
APPENDIX A - 2
MARYLAND STATE REVENUE PROJECTIONS($ in millions)
Fiscal Year
General Fund
Revenue
% Growth of GF Property Taxes % Growth of
Prop. Taxes
Use of Premium and Misc.
ABF Receipts
Total Transportation Revenues
Stadium Related
Revenues
Garvee Bonds
Bay Restoration
Fund
Total Revenues
Percent Change of
Total Revenues
1999 $8,524.0 5.9% $246.9 $11.0 $8,781.9 $1,462.6 $24.5 $10,269.0 6.11%
2000 $9,220.0 8.2% $250.8 $12.6 $9,483.4 $1,568.4 $21.2 $11,073.0 7.83%
2001 $9,802.0 6.3% $257.1 $11.4 $10,070.5 $1,615.0 $27.6 $11,713.1 5.78%
2002 $9,504.0 -3.0% $270.0 $25.5 $9,799.5 $1,663.0 $27.2 $11,489.7 -1.91%
2003 $9,409.8 -1.0% $286.0 $36.7 $9,732.5 $1,603.0 $21.9 $11,357.4 -1.15%
2004 $10,204.3 8.4% $468.4 $97.2 $10,769.8 $1,884.0 $22.2 $12,676.1 11.61%
2005 $11,548.0 13.2% $516.5 10.3% $94.5 $12,159.1 $2,085.0 $21.7 $14,265.8 12.54%
2006 $12,390.3 7.3% $575.1 11.3% $46.4 $13,011.8 $2,122.0 $21.4 $15,155.2 6.23%
2007 $12,940.2 4.4% $552.7 -3.9% $37.6 $13,530.4 $2,100.0 $21.2 $15,651.6 3.28%
2008 $13,491.9 4.3% $624.4 13.0% $42.5 $14,158.8 $2,009.0 $21.4 $469.5 $16,658.6 6.43%
2009 $14,086.2 4.4% $691.1 10.7% $39.6 $14,816.9 $2,347.0 $20.8 $446.4 $58.6 $17,689.7 6.19%
2010 $14,701.7 4.4% $741.5 7.3% $2.3 $15,445.5 $2,405.0 $20.8 $446.4 $59.2 $18,376.9 3.89%
2011 $15,356.0 4.5% $767.4 3.5% $2.3 $16,125.8 $2,537.0 $20.9 $446.4 $59.8 $19,189.8 4.42%
2012 $16,063.4 4.6% $799.8 4.2% $2.1 $16,865.3 $2,624.0 $21.0 $446.4 $60.4 $20,017.1 4.31%
2013 $16,709.4 4.0% $822.7 2.9% $2.1 $17,534.2 $2,733.0 $21.0 $446.4 $61.0 $20,795.6 3.89%
2014 $17,461.3 4.5% $843.2 2.5% $2.1 $18,306.7 $2,875.0 $21.0 $446.4 $61.6 $21,710.7 4.40%
2015 $18,247.1 4.5% $864.3 2.5% $2.1 $19,113.5 $2,916.0 $19.8 $446.4 $62.2 $22,558.0 3.90%
2016 $19,068.2 4.5% $885.9 2.5% $2.1 $19,956.2 $2,983.0 $19.9 $446.4 $62.9 $23,468.4 4.04%
2017 $19,926.3 4.5% $908.1 2.5% $2.1 $20,836.5 $3,063.0 $20.0 $446.4 $63.5 $24,429.3 4.09%
2018 $20,823.0 4.5% $930.8 2.5% $2.1 $21,755.8 $3,131.0 $20.0 $446.4 $64.1 $25,417.4 4.04%
General Fund:1999 -2018: Bureau of Revenue Estimates, updated September 2008
Property Tax and Use of Premium Revenues:1999 - 2007: State Budget Books2008 - 2018 : Dept. of Budget and Management, STO, Department of Budget and Taxation
Transportation Revenues: 1999-2018: Department of Transportation, Office of Finance Revenues consist of Taxes and Fees, Operating Revenue, Other Revenue, (including investment revenue) and federal funds for operations; MdTA transfers are deducted.
Garvee Bond Revenues: 2008-2018: Federal highway capital revenues; source MDOT
Stadium Revenues: represent only lottery revenues transferred to the Stadium Authority
Bay Restoration Fund Revenues:2009-2018: total program revenues; source MDE, MWQFA
74
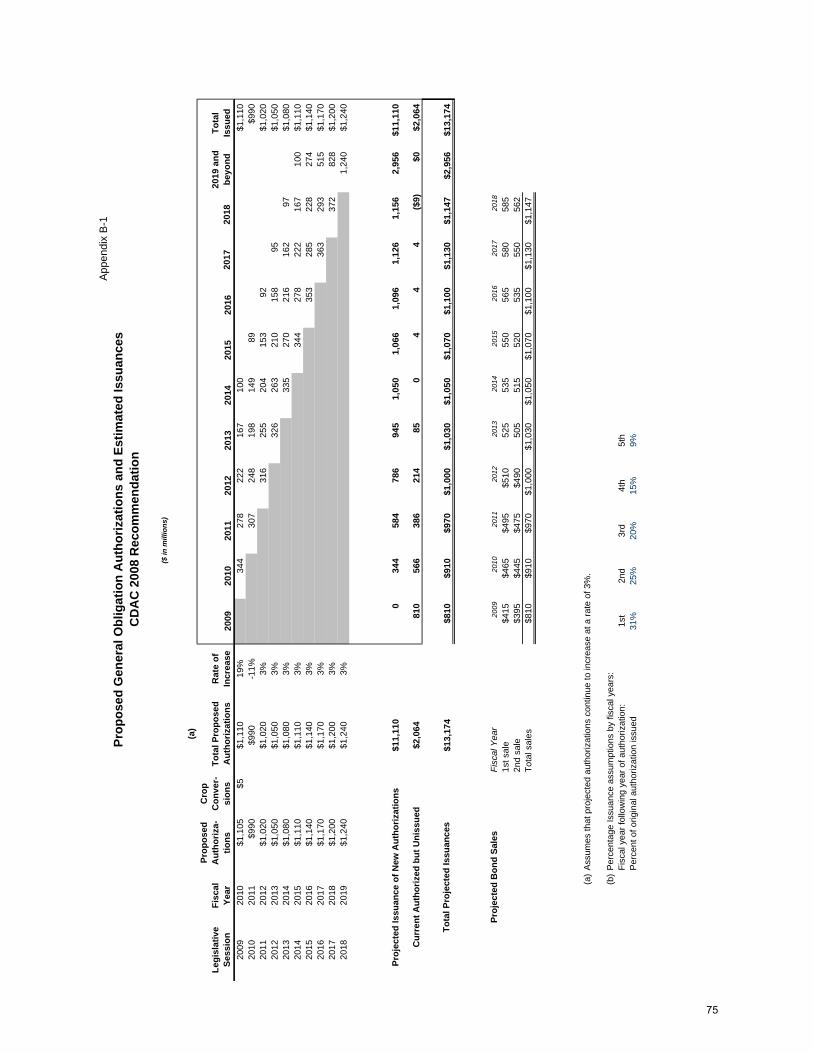
App
endi
x B
-1Pr
opos
ed G
ener
al O
blig
atio
n A
utho
rizat
ions
and
Est
imat
ed Is
suan
ces
CD
AC
200
8 R
ecom
men
datio
n
($ in
mill
ions
)
(a)
Legi
slat
ive
Sess
ion
Fisc
al
Year
Prop
osed
A
utho
riza-
tio
ns
Cro
p C
onve
r-si
ons
Tota
l Pro
pose
d A
utho
rizat
ions
Rat
e of
In
crea
se20
0920
1020
1120
1220
1320
1420
1520
1620
1720
1820
19 a
nd
beyo
ndTo
tal
Issu
ed20
0920
10$1
,105
$5$1
,110
19%
344
278
222
167
100
$1,1
1020
1020
11$9
90$9
90-1
1%30
724
819
814
989
$990
2011
2012
$1,0
20$1
,020
3%31
625
520
415
392
$1,0
2020
1220
13$1
,050
$1,0
503%
326
263
210
158
95$1
,050
2013
2014
$1,0
80$1
,080
3%33
527
021
616
297
$1,0
8020
1420
15$1
,110
$1,1
103%
344
278
222
167
100
$1,1
1020
1520
16$1
,140
$1,1
403%
353
285
228
274
$1,1
4020
1620
17$1
,170
$1,1
703%
363
293
515
$1,1
7020
1720
18$1
,200
$1,2
003%
372
828
$1,2
0020
1820
19$1
,240
$1,2
403%
1,24
0$1
,240
Proj
ecte
d Is
suan
ce o
f New
Aut
horiz
atio
ns$1
1,11
00
344
584
786
945
1,05
01,
066
1,09
61,
126
1,15
62,
956
$11,
110
Cur
rent
Aut
horiz
ed b
ut U
niss
ued
$2,0
6481
056
638
621
485
04
44
($9)
$0$2
,064
Tota
l Pro
ject
ed Is
suan
ces
$13,
174
$810
$910
$970
$1,0
00$1
,030
$1,0
50$1
,070
$1,1
00$1
,130
$1,1
47$2
,956
$13,
174
Proj
ecte
d B
ond
Sale
sFi
scal
Yea
r20
0920
1020
1120
1220
1320
1420
1520
1620
1720
181s
t sal
e$4
15$4
65$4
95$5
1052
553
555
056
558
058
52n
d sa
le$3
95$4
45$4
75$4
9050
551
552
053
555
056
2To
tal s
ales
$810
$910
$970
$1,0
00$1
,030
$1,0
50$1
,070
$1,1
00$1
,130
$1,1
47
(a)
Ass
umes
that
pro
ject
ed a
utho
rizat
ions
con
tinue
to in
crea
se a
t a ra
te o
f 3%
.
(b)
Per
cent
age
Issu
ance
ass
umpt
ions
by
fisca
l yea
rs:
Fisc
al y
ear f
ollo
win
g ye
ar o
f aut
horiz
atio
n:1s
t2n
d3r
d4t
h5t
hP
erce
nt o
f orig
inal
aut
horiz
atio
n is
sued
31%
25%
20%
15%
9%
75
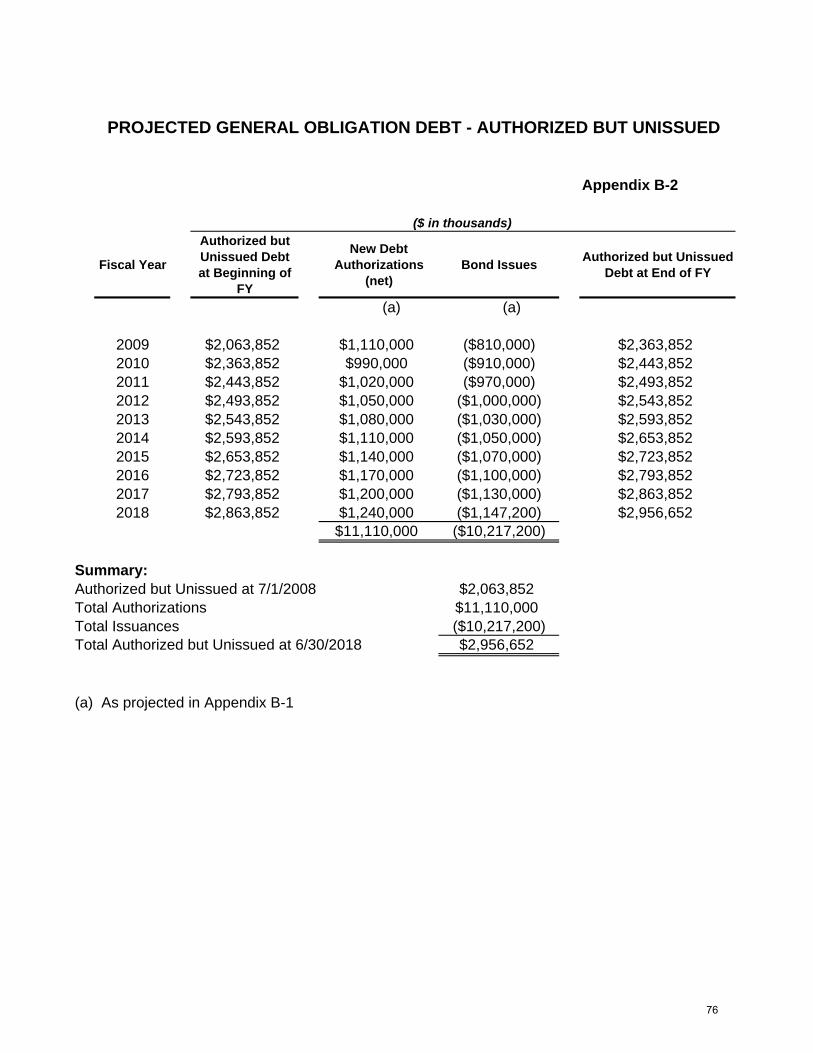
PROJECTED GENERAL OBLIGATION DEBT - AUTHORIZED BUT UNISSUED
Appendix B-2
($ in thousands)
Fiscal Year
Authorized but Unissued Debt at Beginning of
FY
New Debt Authorizations
(net)Bond Issues Authorized but Unissued
Debt at End of FY
(a) (a)
2009 $2,063,852 $1,110,000 ($810,000) $2,363,8522010 $2,363,852 $990,000 ($910,000) $2,443,8522011 $2,443,852 $1,020,000 ($970,000) $2,493,8522012 $2,493,852 $1,050,000 ($1,000,000) $2,543,8522013 $2,543,852 $1,080,000 ($1,030,000) $2,593,8522014 $2,593,852 $1,110,000 ($1,050,000) $2,653,8522015 $2,653,852 $1,140,000 ($1,070,000) $2,723,8522016 $2,723,852 $1,170,000 ($1,100,000) $2,793,8522017 $2,793,852 $1,200,000 ($1,130,000) $2,863,8522018 $2,863,852 $1,240,000 ($1,147,200) $2,956,652
$11,110,000 ($10,217,200)
Summary:Authorized but Unissued at 7/1/2008 $2,063,852Total Authorizations $11,110,000Total Issuances ($10,217,200)Total Authorized but Unissued at 6/30/2018 $2,956,652
(a) As projected in Appendix B-1
76
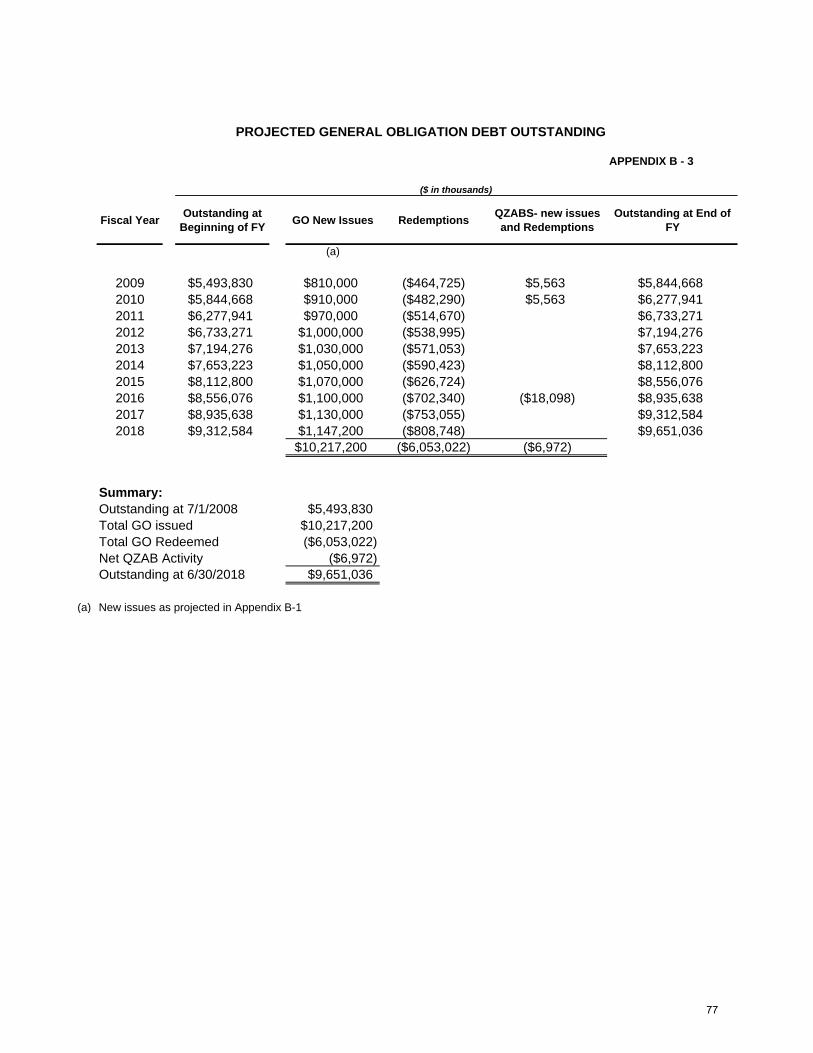
PROJECTED GENERAL OBLIGATION DEBT OUTSTANDING
APPENDIX B - 3
($ in thousands)
Fiscal Year Outstanding at Beginning of FY GO New Issues Redemptions QZABS- new issues
and RedemptionsOutstanding at End of
FY
(a)
2009 $5,493,830 $810,000 ($464,725) $5,563 $5,844,6682010 $5,844,668 $910,000 ($482,290) $5,563 $6,277,9412011 $6,277,941 $970,000 ($514,670) $6,733,2712012 $6,733,271 $1,000,000 ($538,995) $7,194,2762013 $7,194,276 $1,030,000 ($571,053) $7,653,2232014 $7,653,223 $1,050,000 ($590,423) $8,112,8002015 $8,112,800 $1,070,000 ($626,724) $8,556,0762016 $8,556,076 $1,100,000 ($702,340) ($18,098) $8,935,6382017 $8,935,638 $1,130,000 ($753,055) $9,312,5842018 $9,312,584 $1,147,200 ($808,748) $9,651,036
$10,217,200 ($6,053,022) ($6,972)
Summary:Outstanding at 7/1/2008 $5,493,830Total GO issued $10,217,200Total GO Redeemed ($6,053,022)Net QZAB Activity ($6,972)Outstanding at 6/30/2018 $9,651,036
(a) New issues as projected in Appendix B-1
77

App
endi
x B
-4 is
the
proj
ecte
d de
bt s
ervi
ce c
orre
spon
ding
to d
ebt o
utst
andi
ng o
n A
ppen
dix
B-3
App
endi
x B
-4
Proj
ecte
d G
ener
al O
blig
atio
n D
ebt S
ervi
ce
$0
$100
,000
$200
,000
$300
,000
$400
,000
$500
,000
$600
,000
$700
,000
$800
,000
$900
,000
$1,0
00,0
00
$1,1
00,0
00
$1,2
00,0
00
$1,3
00,0
00
$1,4
00,0
00
QZA
B S
inki
ng P
aym
ents
$1,
892
$2,
262
$2,
633
$2,
633
$2,
633
$2,
633
$2,
633
$2,
633
$2,
633
$1,
745
Deb
t Ser
vice
: Exp
ecte
d N
ew Is
sues
$-
$
31,3
75
$79
,975
$
156,
038
$26
1,77
2 $
370,
963
$48
2,96
8 $
597,
644
$71
4,99
9 $
834,
746
Deb
t Ser
vice
: Bon
ds C
urre
ntly
Out
stan
ding
$74
2,86
4 $
748,
565
$75
6,61
1 $
731,
833
$68
5,59
8 $
622,
673
$57
3,64
0 $
560,
134
$51
6,56
8 $
474,
659
Tota
l Deb
t Ser
vice
$74
4,75
5 $
782,
203
$83
9,21
9 $
890,
504
$95
0,00
3 $
996,
269
$1,
059,
241
$1,
160,
412
$1,
234,
200
$1,
311,
150
2009
2010
2011
2012
2013
2014
2015
2016
2017
2018
$ in thousands
78
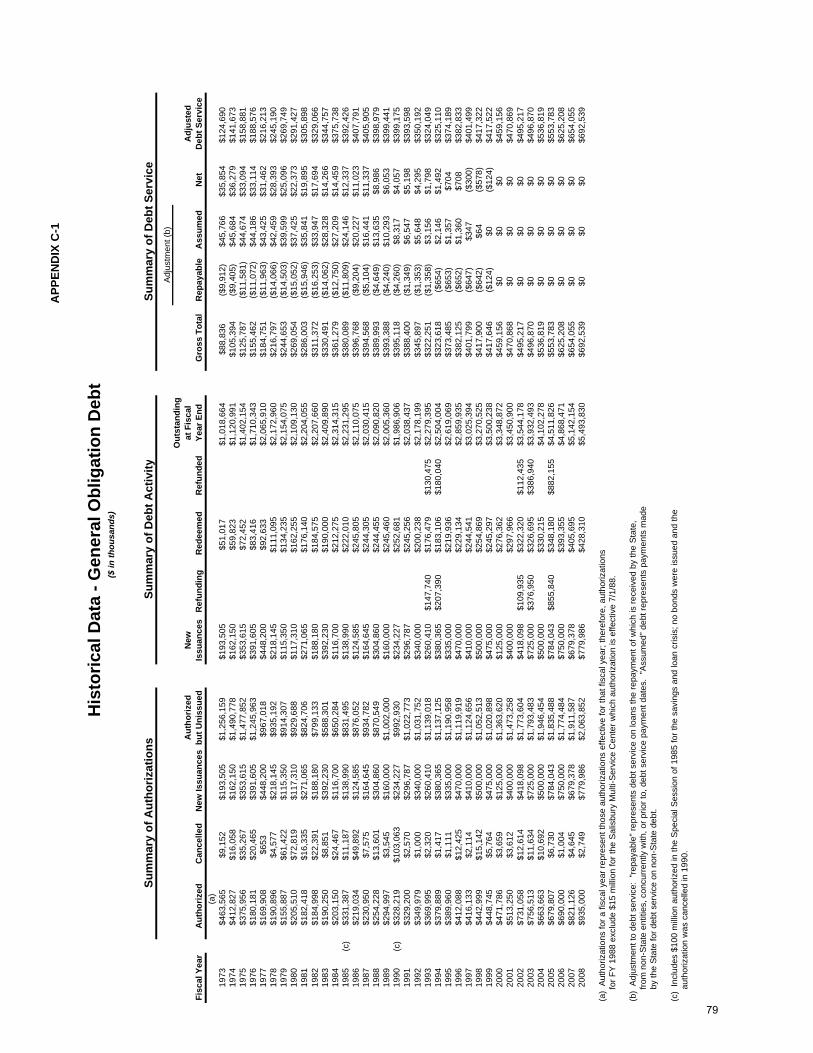
APP
END
IX C
-1
His
toric
al D
ata
- Gen
eral
Obl
igat
ion
Deb
t
($ in
thou
sand
s)
Sum
mar
y of
Aut
horiz
atio
nsSu
mm
ary
of D
ebt A
ctiv
itySu
mm
ary
of D
ebt S
ervi
ceA
djus
tmen
t (b)
Fisc
al Y
ear
Aut
horiz
edC
ance
lled
N
ew Is
suan
ces
Aut
horiz
ed
but U
niss
ued
New
Is
suan
ces
Ref
undi
ngR
edee
med
Ref
unde
d
Out
stan
ding
at
Fis
cal
Year
End
Gro
ss T
otal
Rep
ayab
leA
ssum
edN
etA
djus
ted
D
ebt S
ervi
ce
(a
)19
73$4
63,5
65$9
,152
$193
,505
$1,2
56,1
59$1
93,5
05$5
1,01
7$1
,018
,664
$88,
836
($9,
912)
$45,
766
$35,
854
$124
,690
1974
$412
,827
$16,
058
$162
,150
$1,4
90,7
78$1
62,1
50$5
9,82
3$1
,120
,991
$105
,394
($9,
405)
$45,
684
$36,
279
$141
,673
1975
$375
,956
$35,
267
$353
,615
$1,4
77,8
52$3
53,6
15$7
2,45
2$1
,402
,154
$125
,787
($11
,581
)$4
4,67
4$3
3,09
4$1
58,8
8119
76$1
80,1
81$2
0,46
5$3
91,6
05$1
,245
,963
$391
,605
$83,
416
$1,7
10,3
43$1
55,4
62($
11,0
72)
$44,
186
$33,
114
$188
,576
1977
$169
,908
$653
$448
,200
$967
,018
$448
,200
$92,
633
$2,0
65,9
10$1
84,7
51($
11,9
63)
$43,
425
$31,
462
$216
,213
1978
$190
,896
$4,5
77$2
18,1
45$9
35,1
92$2
18,1
45$1
11,0
95$2
,172
,960
$216
,797
($14
,066
)$4
2,45
9$2
8,39
3$2
45,1
9019
79$1
55,8
87$6
1,42
2$1
15,3
50$9
14,3
07$1
15,3
50$1
34,2
35$2
,154
,075
$244
,653
($14
,503
)$3
9,59
9$2
5,09
6$2
69,7
4919
80$2
05,5
10$7
2,81
9$1
17,3
10$9
29,6
88$1
17,3
10$1
62,2
55$2
,109
,130
$269
,054
($15
,052
)$3
7,42
5$2
2,37
3$2
91,4
2719
81$1
82,4
18$1
6,33
5$2
71,0
65$8
24,7
06$2
71,0
65$1
76,1
40$2
,204
,055
$286
,003
($15
,946
)$3
5,84
1$1
9,89
5$3
05,8
9819
82$1
84,9
98$2
2,39
1$1
88,1
80$7
99,1
33$1
88,1
80$1
84,5
75$2
,207
,660
$311
,372
($16
,253
)$3
3,94
7$1
7,69
4$3
29,0
6619
83$1
90,2
50$8
,851
$392
,230
$588
,301
$392
,230
$190
,000
$2,4
09,8
90$3
30,4
91($
14,0
62)
$28,
328
$14,
266
$344
,757
1984
$203
,150
$24,
467
$116
,700
$650
,284
$116
,700
$212
,275
$2,3
14,3
15$3
61,2
79($
12,7
50)
$27,
209
$14,
459
$375
,738
1985
(c)
$331
,387
$11,
187
$138
,990
$831
,495
$138
,990
$222
,010
$2,2
31,2
95$3
80,0
89($
11,8
09)
$24,
146
$12,
337
$392
,426
1986
$219
,034
$49,
892
$124
,585
$876
,052
$124
,585
$245
,805
$2,1
10,0
75$3
96,7
68($
9,20
4)$2
0,22
7$1
1,02
3$4
07,7
9119
87$2
30,9
50$7
,575
$164
,645
$934
,782
$164
,645
$244
,305
$2,0
30,4
15$3
94,5
68($
5,10
4)$1
6,44
1$1
1,33
7$4
05,9
0519
88$2
54,2
28$1
3,60
1$3
04,8
60$8
70,5
49$3
04,8
60$2
44,4
55$2
,090
,820
$389
,993
($4,
649)
$13,
635
$8,9
86$3
98,9
7919
89$2
94,9
97$3
,545
$160
,000
$1,0
02,0
00$1
60,0
00$2
45,4
60$2
,005
,360
$393
,388
($4,
240)
$10,
293
$6,0
53$3
99,4
4119
90(c
)$3
28,2
19$1
03,0
63$2
34,2
27$9
92,9
30$2
34,2
27$2
52,6
81$1
,986
,906
$395
,118
($4,
260)
$8,3
17$4
,057
$399
,175
1991
$329
,200
$2,5
70$2
96,7
87$1
,022
,773
$296
,787
$245
,256
$2,0
38,4
37$3
88,4
00($
1,34
9)$6
,547
$5,1
98$3
93,5
9819
92$3
49,9
79$1
,000
$340
,000
$1,0
31,7
52$3
40,0
00$2
00,2
38$2
,178
,199
$345
,897
($1,
353)
$5,6
48$4
,295
$350
,192
1993
$369
,995
$2,3
20$2
60,4
10$1
,139
,018
$260
,410
$147
,740
$176
,479
$130
,475
$2,2
79,3
95$3
22,2
51($
1,35
8)$3
,156
$1,7
98$3
24,0
4919
94$3
79,8
89$1
,417
$380
,365
$1,1
37,1
25$3
80,3
65$2
07,3
90$1
83,1
06$1
80,0
40$2
,504
,004
$323
,618
($65
4)$2
,146
$1,4
92$3
25,1
1019
95$3
89,9
60$1
,111
$335
,000
$1,1
90,9
58$3
35,0
00$2
19,9
36$2
,619
,069
$373
,485
($65
3)$1
,357
$704
$374
,189
1996
$412
,088
$12,
425
$470
,000
$1,1
19,9
19$4
70,0
00$2
29,1
34$2
,859
,935
$382
,125
($65
2)$1
,360
$708
$382
,833
1997
$416
,133
$2,1
14$4
10,0
00$1
,124
,656
$410
,000
$244
,541
$3,0
25,3
94$4
01,7
99($
647)
$347
($30
0)$4
01,4
9919
98$4
42,9
99$1
5,14
2$5
00,0
00$1
,052
,513
$500
,000
$254
,869
$3,2
70,5
25$4
17,9
00($
642)
$64
($57
8)$4
17,3
2219
99$4
48,7
45$5
,764
$475
,000
$1,0
20,8
98$4
75,0
00$2
45,2
97$3
,500
,238
$417
,646
($12
4)$0
($12
4)$4
17,5
2220
00$4
71,7
86$3
,659
$125
,000
$1,3
63,6
20$1
25,0
00$2
76,3
62$3
,348
,872
$459
,156
$0$0
$0$4
59,1
5620
01$5
13,2
50$3
,612
$400
,000
$1,4
73,2
58$4
00,0
00$2
97,9
66$3
,450
,900
$470
,868
$0$0
$0$4
70,8
6920
02$7
31,0
58$1
2,61
4$4
18,0
98$1
,773
,604
$418
,098
$109
,935
$322
,320
$112
,435
$3,5
44,1
78$4
95,2
17$0
$0$0
$495
,217
2003
$756
,513
$11,
634
$725
,000
$1,7
93,4
83$7
25,0
00$3
76,9
50$3
26,6
95$3
86,9
40$3
,932
,493
$496
,870
$0$0
$0$4
96,8
7020
04$6
63,6
63$1
0,69
2$5
00,0
00$1
,946
,454
$500
,000
$330
,215
$4,1
02,2
78$5
36,8
19$0
$0$0
$536
,819
2005
$679
,807
$6,7
30$7
84,0
43$1
,835
,488
$784
,043
$855
,840
$348
,180
$882
,155
$4,5
11,8
26$5
53,7
83$0
$0$0
$553
,783
2006
$690
,000
$1,0
04$7
50,0
00$1
,774
,484
$750
,000
$393
,355
$4,8
68,4
71$6
25,2
08$0
$0$0
$625
,208
2007
$821
,126
$4,6
45$6
79,3
78$1
,911
,587
$679
,378
$405
,695
$5,1
42,1
54$6
54,0
55$0
$0$0
$654
,055
2008
$935
,000
$2,7
49$7
79,9
86$2
,063
,852
$779
,986
$428
,310
$5,4
93,8
30$6
92,5
39$0
$0$0
$692
,539
(a)
Aut
horiz
atio
ns fo
r a fi
scal
yea
r rep
rese
nt th
ose
auth
oriz
atio
ns e
ffect
ive
for t
hat f
isca
l yea
r; th
eref
ore,
aut
horiz
atio
ns
for
FY
198
8 ex
clud
e $1
5 m
illio
n fo
r the
Sal
isbu
ry M
ulti-
Ser
vice
Cen
ter w
hich
aut
horiz
atio
n is
effe
ctiv
e 7/
1/88
.
(b)
Adj
ustm
ent t
o de
bt s
ervi
ce:
"rep
ayab
le" r
epre
sent
s de
bt s
ervi
ce o
n lo
ans
the
repa
ymen
t of w
hich
is re
ceiv
ed b
y th
e S
tate
,
fro
m n
on-S
tate
ent
ities
, con
curr
ently
with
, or p
rior t
o, d
ebt s
ervi
ce p
aym
ent d
ates
. "A
ssum
ed" d
ebt r
epre
sent
s pa
ymen
ts m
ade
b
y th
e S
tate
for d
ebt s
ervi
ce o
n no
n-S
tate
deb
t.
(c)
Incl
udes
$10
0 m
illio
n au
thor
ized
in th
e S
peci
al S
essi
on o
f 198
5 fo
r the
sav
ings
and
loan
cris
is; n
o bo
nds
wer
e is
sued
and
the
a
utho
rizat
ion
was
can
celle
d in
199
0.
79

STATE PUBLIC SCHOOL CONSTRUCTION AND CAPITAL IMPROVEMENT LOANS
($ in thousands)
APPENDIX C - 2
Fiscal Year Authorized Issued Redeemed OutstandingAuthorized
but Unissued
Debt Service
1973 $220,000 $73,000 $0 $163,340 $506,660 $5,2181974 $212,000 $114,400 $0 $277,740 $604,260 $9,1541975 $160,000 $186,000 $5,170 $458,570 $578,260 $20,6231976 $50,000 $162,700 $9,685 $611,585 $465,560 $34,2421977 $69,000 $230,900 $16,590 $825,895 $303,660 $52,1191978 $57,000 $121,650 $27,240 $920,305 $239,010 $70,9411979 $62,000 $70,750 $37,285 $953,770 $230,260 $85,3351980 $45,000 $48,210 $52,195 $949,785 $227,050 $99,9521981 $45,000 $111,200 $61,860 $999,125 $160,850 $111,6791982 $32,000 $65,500 $69,120 $995,505 $127,350 $124,9681983 $22,000 $86,350 $75,410 $1,006,445 $63,000 $134,2581984 $36,000 $36,500 $87,025 $955,920 $62,500 $146,0991985 $34,600 $24,000 $94,685 $885,235 $73,100 $153,3391986 $44,300 $38,000 $103,545 $819,690 $79,400 $149,4171987 $57,400 $34,040 $111,190 $742,540 $102,760 $163,9471988 $53,000 $55,750 $109,295 $688,995 $100,010 $157,6961989 $44,000 $52,000 $110,090 $630,905 $92,010 $155,9591990 $53,000 $35,300 $106,395 $559,810 $109,710 $148,4221991 $60,000 $57,000 $94,910 $521,900 $112,710 $133,6201992 $69,000 $76,510 $76,725 $521,685 $105,200 $113,8131993 $80,000 $95,000 $58,520 $558,165 $90,200 $93,8221994 $82,000 $52,856 $52,715 $558,306 $119,344 $84,1681995 $83,000 $76,700 $54,394 $580,613 $125,644 $83,9191996 $118,000 $77,131 $55,410 $602,334 $166,513 $84,5631997 $122,000 $129,438 $55,670 $676,102 $159,075 $85,4401998 $129,500 $158,819 $55,145 $779,776 $129,756 $86,3661999 $90,000 $150,906 $51,230 $879,454 $68,850 $89,8382000 $96,728 $60,000 $54,866 $795,015 $30,200 $96,5432001 $119,369 $75,397 $58,675 $812,296 $170,900 $98,9832002 $224,100 $64,098 $62,703 $813,691 $330,902 $104,3692003 $113,115 $230,816 $63,364 $981,144 $213,201 $103,2352004 $114,226 $82,912 $59,631 $1,004,425 $244,515 $109,0662005 $234,400 $106,965 $87,401 $1,023,989 $371,950 $143,7822006 $284,669 $210,593 $99,582 $1,135,000 $446,026 $157,9912007 $397,176 $258,628 $102,237 $1,291,391 $584,574 $163,1892008 $327,400 $332,042 $104,032 $1,519,401 $579,932 $172,885
80

Comparison of Total GO Bond Authorizations with Total Authorized for School Construction
($ in thousands)Appendix C-2a
Total Authorizations less
Cancellations
Authorized for School
Construction% for School Construction
(a) (b)1973 $454,413 $220,000 48%1974 $396,769 $212,000 53%1975 $340,689 $160,000 47%1976 $159,716 $50,000 31%1977 $169,255 $69,000 41%1978 $186,319 $57,000 31%1979 $94,465 $62,000 66%1980 $132,691 $45,000 34%1981 $166,083 $45,000 27%1982 $162,607 $32,000 20%1983 $181,399 $22,000 12%1984 $178,683 $36,000 20%1985 $320,200 $34,600 11%1986 $169,142 $44,300 26%1987 $223,375 $57,400 26%1988 $240,627 $53,000 22%1989 $291,452 $44,000 15%1990 $225,156 $53,000 24%1991 $326,630 $60,000 18%1992 $348,979 $69,000 20%1993 $367,675 $80,000 22%1994 $378,472 $82,000 22%1995 $388,849 $83,000 21%1996 $399,663 $118,000 30%1997 $414,019 $122,000 29%1998 $427,857 $129,500 30%1999 $442,981 $90,000 20%2000 $468,127 $96,728 21%2001 $509,638 $119,369 23%2002 $718,444 $224,100 31%2003 $744,879 $113,115 15%2004 $652,971 $114,226 17%2005 $673,077 $234,400 35%2006 $688,996 $284,669 41%2007 $816,481 $397,176 49%2008 $932,251 $327,400 35%
Totals $13,793,031 $4,040,983 29%
(a) Refer to Appendix C-1(b) Refer to Appendix C-2
81
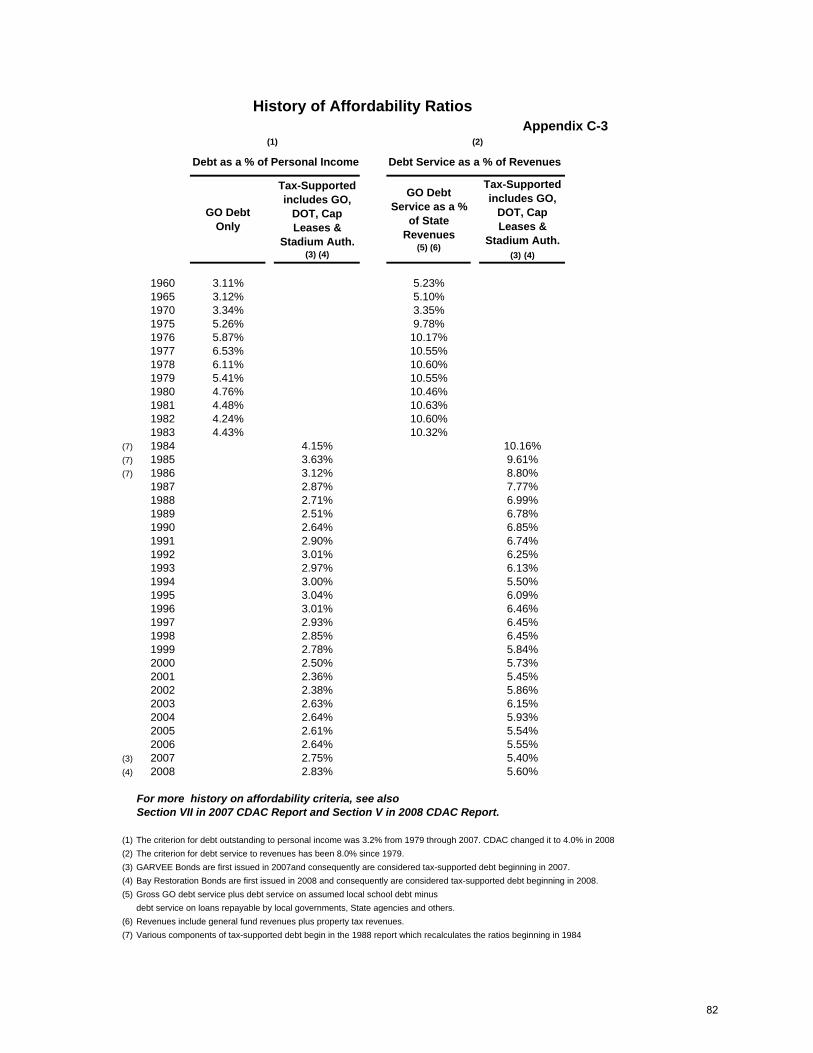
History of Affordability RatiosAppendix C-3
(1) (2)
Debt as a % of Personal Income Debt Service as a % of Revenues
GO Debt Only
Tax-Supported includes GO,
DOT, Cap Leases &
Stadium Auth. (3) (4)
GO Debt Service as a %
of State Revenues
(5) (6)
Tax-Supported includes GO,
DOT, Cap Leases &
Stadium Auth. (3) (4)
1960 3.11% 5.23%1965 3.12% 5.10%1970 3.34% 3.35%1975 5.26% 9.78%1976 5.87% 10.17%1977 6.53% 10.55%1978 6.11% 10.60%1979 5.41% 10.55%1980 4.76% 10.46%1981 4.48% 10.63%1982 4.24% 10.60%1983 4.43% 10.32%
(7) 1984 4.15% 10.16%(7) 1985 3.63% 9.61%(7) 1986 3.12% 8.80%
1987 2.87% 7.77%1988 2.71% 6.99%1989 2.51% 6.78%1990 2.64% 6.85%1991 2.90% 6.74%1992 3.01% 6.25%1993 2.97% 6.13%1994 3.00% 5.50%1995 3.04% 6.09%1996 3.01% 6.46%1997 2.93% 6.45%1998 2.85% 6.45%1999 2.78% 5.84%2000 2.50% 5.73%2001 2.36% 5.45%2002 2.38% 5.86%2003 2.63% 6.15%2004 2.64% 5.93%2005 2.61% 5.54%2006 2.64% 5.55%
(3) 2007 2.75% 5.40%(4) 2008 2.83% 5.60%
For more history on affordability criteria, see also Section VII in 2007 CDAC Report and Section V in 2008 CDAC Report.
(1) The criterion for debt outstanding to personal income was 3.2% from 1979 through 2007. CDAC changed it to 4.0% in 2008(2) The criterion for debt service to revenues has been 8.0% since 1979.(3) GARVEE Bonds are first issued in 2007and consequently are considered tax-supported debt beginning in 2007.(4) Bay Restoration Bonds are first issued in 2008 and consequently are considered tax-supported debt beginning in 2008. (5) Gross GO debt service plus debt service on assumed local school debt minus
debt service on loans repayable by local governments, State agencies and others.(6) Revenues include general fund revenues plus property tax revenues.(7) Various components of tax-supported debt begin in the 1988 report which recalculates the ratios beginning in 1984
82

APP
END
IX C
- 4
HIS
TOR
ICA
L D
ATA
- D
EPA
RTM
ENT
OF
TRA
NSP
OR
TATI
ON
DEB
T
Con
solid
ated
Tra
nspo
rtat
ion
Bon
ds
($ in
thou
sand
s)
Sum
mar
y of
Deb
t Act
ivity
Sum
mar
y of
Deb
t Ser
vice
(d)
Gro
ss D
ebt
Gro
ss D
ebt
Net
Deb
tO
utst
andi
ngO
utst
andi
ngSi
nkin
gO
utst
andi
ngD
epos
its to
Fis
cal
Beg
inni
ng
End
Fund
(s)
End
Ref
undi
ng
Prin
cipa
l Y
ear
of Y
ear
Issu
edD
efea
sed
Red
eem
edof
Yea
rB
alan
ce (c
)of
Yea
rSi
nkin
g Fu
nd
Red
eem
edIn
tere
stTo
tal
1981
399,
865
$
12
0,00
0$
(a)
-
-$
51
9,86
5$
1982
519,
865
$
60
,000
$
60,0
00$
519,
865
$
19
8351
9,86
5$
40,0
00$
-
60
,000
$
49
9,86
5$
240,
601
$
259,
264
$
20
,924
$
60
,000
$
32
,884
$
11
3,80
8$
19
8449
9,86
5$
-
-
-
49
9,86
5$
283,
617
$
216,
248
$
20
,924
$
-
29
,219
$
50
,143
$
19
8549
9,86
5$
-
-
-
49
9,86
5$
335,
241
$
164,
624
$
20
,924
$
-
29
,219
$
50
,143
$
19
8649
9,86
5$
-
35
4,86
5$
(b
)3,
000
$
14
2,00
0$
29,2
99$
112,
701
$
10
,462
$
3,
000
$
19
,547
$
33
,009
$
19
8714
2,00
0$
100,
000
$
-
7,
000
$
23
5,00
0$
48,3
17$
186,
683
$
-
7,
000
$
12
,919
$
19
,919
$
19
8823
5,00
0$
-
-
8,
000
$
22
7,00
0$
58,9
53$
168,
047
$
-
8,
000
$
15
,685
$
23
,685
$
19
8922
7,00
0$
100,
000
$
-
17
,000
$
31
0,00
0$
68,1
62$
241,
838
$
-
17
,000
$
18
,195
$
35
,195
$
19
9031
0,00
0$
260,
000
$
-
20
,000
$
55
0,00
0$
67,3
09$
482,
691
$
-
20
,000
$
28
,842
$
48
,842
$
19
9155
0,00
0$
310,
000
$
-
18
,000
$
84
2,00
0$
68,3
29$
773,
671
$
-
18
,000
$
46
,261
$
64
,261
$
19
9284
2,00
0$
120,
000
$
-
21
,000
$
94
1,00
0$
66,2
30$
874,
770
$
-
21
,000
$
59
,211
$
80
,211
$
19
9394
1,00
0$
75,0
00$
-
56
,200
$
95
9,80
0$
39,9
01$
919,
899
$
-
56
,200
$
(e
)61
,445
$
11
7,64
5$
19
9495
9,80
0$
543,
745
$
(f)
457,
800
$
25,4
55$
1,02
0,29
0$
27
,570
$
99
2,72
0$
-
25,4
55$
56,4
23$
81,8
78$
1995
1,02
0,29
0$
75
,000
$
-
47,7
85$
1,04
7,50
5$
32
,338
$
1,
015,
167
$
-
47,7
85$
52,8
41$
100,
626
$
1996
1,04
7,50
5$
-
-
69,8
80$
977,
625
$
30
,940
$
94
6,68
5$
-
69,8
80$
51,5
26$
121,
406
$
1997
977,
625
$
50
,000
$
-
88,2
45$
939,
380
$
15
,495
$
92
3,88
5$
-
88,2
45$
47,4
48$
135,
693
$
1998
939,
380
$
93
,645
$
(g)
91,2
00$
97,8
10$
844,
015
$
-
84
4,01
5$
-
97,8
10$
44,9
59$
142,
769
$
1999
844,
015
$
-
-
94,8
85$
749,
130
$
-
74
9,01
3$
-
94,8
85$
38,0
25$
132,
910
$
2000
749,
130
$
75
,000
$
-
99,3
60$
724,
770
$
-
72
4,77
0$
-
99,3
60$
35,8
73$
135,
233
$
2001
724,
770
$
-
-
76,7
20$
648,
050
$
-
64
8,05
0$
-
76,7
20$
32,9
54$
109,
674
$
2002
648,
050
$
15
0,00
0$
-
83,9
00$
714,
150
$
-
71
4,15
0$
-
83,9
00$
29,2
78$
113,
178
$
2003
714,
150
$
60
7,40
5$
(h)
46,5
00$
313,
810
$
961,
245
$
-
96
1,24
5$
-
313,
810
$
34,2
04$
348,
014
$
2004
961,
245
$
39
5,90
0$
(i)77
,500
$
93
,995
$
1,
185,
650
$
-
1,18
5,65
0$
-
93
,995
$
40
,915
$
13
4,91
0$
20
051,
185,
650
$
-
-
11
5,70
5$
1,
069,
945
$
-
1,06
9,94
5$
-
11
5,70
5$
53
,950
$
16
9,65
5$
20
061,
069,
945
$
100,
000
$
-
91
,470
$
1,
078,
475
$
-
1,07
8,47
5$
-
91
,470
$
49
,702
$
14
1,17
2$
20
071,
078,
475
$
100,
000
$
-
67
,425
$
1,
111,
050
$
-
1,11
1,05
0$
-
67
,425
$
50
,999
$
11
8,42
4$
20
081,
111,
050
$
226,
755
$
-
68
,990
$
1,
268,
815
$
-
1,26
8,81
5$
68
,990
$
52
,400
$
12
1,39
0$
(a) I
nclu
des
$60
mill
ion
Con
solid
ated
Tra
nspo
rtatio
n B
onds
(d) R
epre
sent
s pa
ymen
ts to
the
refu
ndin
g bo
nd s
inki
ng fu
nd p
lus
(g)
The
Dep
artm
ent i
ssue
d $9
3.64
5 m
illio
n re
fund
ing
bond
spl
us a
one
-yea
r Bon
d A
ntic
ipat
ion
Not
e fo
r $60
mill
ion.
The
paym
ents
of p
rinci
pal a
nd in
tere
st to
the
bond
hold
ers.
Am
ount
s to
refu
nd $
91.2
mill
ion
durin
g fis
cal y
ear 1
998.
one-
year
BA
N w
as re
-issu
ed th
e fo
llow
ing
year
.m
ay d
iffer
from
bud
geta
ry a
mou
nts
(bud
geta
ry a
mou
nts
repr
esen
t pa
ymen
t to
sink
ing
fund
s).
(h) T
he D
epar
tmen
t iss
ued
$262
.405
mill
ion
refu
ndin
g bo
nds
(b) R
epre
sent
s a
defe
asan
ce o
f the
bal
ance
rem
aini
ng o
fto
refu
nd $
265.
820
mill
ion
durin
g fis
cal y
ear 2
003.
the
serie
s 19
78 re
fund
ing
bond
s.(e
) Inc
lude
s ea
rly re
dem
ptio
ns o
f $30
mill
ion.
(i) T
he D
epar
tmen
t iss
ued
$75.
9 m
illio
n re
fund
ing
bond
s(c
) For
thos
e bo
nds
issu
ed p
rior t
o 7/
1/89
, sin
king
fund
bal
ance
s(f)
DO
T so
ld tw
o is
sues
of r
efun
ding
bon
ds in
FY
94:
to re
fund
$77
.5 m
illio
n du
ring
fisca
l yea
r 200
4.re
flect
the
net e
ffect
of:
dep
osits
into
the
fund
, one
cal
enda
r yea
r
$2
11.9
85 m
illio
n to
refu
nd $
204.
0 m
illio
nin
adv
ance
, of d
ebt s
ervi
ce; f
und
earn
ings
; and
pay
men
ts, f
rom
the
$291
.760
mill
ion
to re
fund
$25
3.8
mill
ion
sink
ing
fund
, to
bond
hold
ers.
Bon
ds is
sued
afte
r 7/1
/89
do n
otre
quire
suc
h a
sink
ing
fund
.
83

APP
END
IX C
- 5
HIS
TOR
ICA
L D
ATA
- D
EPA
RTM
ENT
OF
TRA
NSP
OR
TATI
ON
DEB
T
Cou
nty
Tran
spor
tatio
n B
onds
($
in th
ousa
nds)
Su
mm
ary
of D
ebt A
ctiv
itySu
mm
ary
of D
ebt S
ervi
ce (d
)G
ross
Deb
tG
ross
Deb
tN
et D
ebt
Out
stan
ding
Out
stan
ding
Sink
ing
Out
stan
ding
Dep
osits
toFi
scal
Beg
inni
ng
Def
ease
dEn
dFu
ndEn
d R
efun
ding
Pr
inci
pal
Year
of Y
ear
Issu
edor
Ref
unde
dR
edee
med
of Y
ear
Bal
ance
(c)
of Y
ear
Sink
ing
Fund
Red
eem
edIn
tere
stTo
tal
1983
225,
085
$
34,8
75$
-
2,62
5$
257,
335
$
104,
373
$
152,
962
$
9,21
6$
2,
625
$
15
,681
$
27
,522
$
19
8425
7,33
5$
22
,270
$
-
2,
985
$
27
6,62
0$
12
4,61
9$
15
2,00
1$
8,
749
$
2,98
5$
18,0
61$
29,7
95$
1985
276,
620
$
24,2
10$
-
4,43
5$
296,
395
$
144,
595
$
151,
800
$
7,21
4$
4,
435
$
19
,591
$
31
,240
$
19
8629
6,39
5$
8,
795
$
-
5,
720
$
29
9,47
0$
17
7,18
5$
12
2,28
5$
-
$
5,
720
$
12
,099
$
17
,819
$
19
8729
9,47
0$
40
,590
$
(a
)18
0,40
5$
(b
)7,
090
$
15
2,56
5$
21
,479
$
13
1,08
6$
-
$
7,
090
$
12
,336
$
19
,426
$
19
8815
2,56
5$
18
,255
$
-
8,
920
$
16
1,90
0$
21
,599
$
14
0,30
1$
-
$
8,
920
$
11
,766
$
20
,686
$
19
8916
1,90
0$
7,
285
$
-
9,
895
$
15
9,29
0$
26
,024
$
13
3,26
6$
-
$
9,
895
$
11
,931
$
21
,826
$
19
9015
9,29
0$
9,
950
$
-
11
,535
$
15
7,70
5$
23
,978
$
13
3,72
7$
-
$
11
,535
$
11
,695
$
23
,230
$
19
9115
7,70
5$
16
,550
$
-
12
,875
$
16
1,38
0$
25
,539
$
13
5,84
1$
-
$
12
,875
$
11
,619
$
24
,494
$
19
9216
1,38
0$
8,
300
$
-
14
,440
$
15
5,24
0$
27
,314
$
12
7,92
6$
-
$
14
,440
$
11
,383
$
25
,823
$
19
9315
5,24
0$
-
-
16
,405
$
13
8,83
5$
27
,294
$
11
1,54
1$
-
$
16
,405
$
10
,454
$
26
,859
$
19
9413
8,83
5$
-
94
,955
$
(e
)18
,035
$
25
,845
$
5,
954
$
19
,891
$
-
$
18
,035
$
5,
662
$
23
,697
$
19
9525
,845
$
-
-
4,
640
$
21
,205
$
6,
007
$
15
,198
$
-
$
4,
640
$
1,
314
$
5,
954
$
19
9621
,205
$
-
-
4,
950
$
16
,255
$
6,
055
$
10
,200
$
-
$
4,
950
$
1,
057
$
6,
007
$
19
9716
,255
$
-
-
5,
280
$
10
,975
$
5,
338
$
5,
637
$
-
$
5,
280
$
77
5$
6,
055
$
19
9810
,975
$
-
-
4,
845
$
6,
130
$
52
5$
5,
605
$
-
$
4,
845
$
49
3$
5,
338
$
19
996,
130
$
-
-
52
5$
5,
605
$
55
5$
5,
050
$
-
$
52
5$
34
4$
86
9$
20
005,
605
$
-
-
55
5$
5,
050
$
59
0$
4,
460
$
-
$
55
5$
31
4$
86
9$
20
015,
050
$
-
-
59
0$
4,
460
$
63
0$
3,
830
$
-
$
59
0$
28
3$
87
3$
20
024,
460
$
-
-
63
0$
3,
830
$
67
5$
3,
155
$
-
$
63
0$
24
8$
87
8$
20
033,
830
$
-
-
67
5$
3,
155
$
71
5$
2,
440
$
-
$
67
5$
21
1$
88
6$
20
043,
155
$
-
-
71
5$
2,
440
$
76
5$
1,
675
$
-
$
71
5$
17
0$
88
5$
20
052,
440
$
-
-
76
5$
1,
675
$
81
0$
86
5$
-
$
76
5$
12
6$
89
1$
20
061,
675
$
-
-
81
0$
86
5$
86
5$
-
$
-$
810
$
78$
888
$
2007
865
$
-
-
865
$
-$
-
$
-$
-
$
86
5$
27
$
89
2$
20
08-
$
-
-
-$
-
$
-$
-
$
-$
-$
-
$
-$
(a) R
epre
sent
s th
e N
inth
Ser
ies
issu
e of
$11
.415
mill
ion
plus
a(d
) R
epre
sent
s pa
ymen
ts to
the
refu
ndin
g bo
nd s
inki
ng fu
nd p
lus
refu
ndin
g se
ries
of $
29.1
75 m
illio
n is
sued
to re
fund
$24
.680
mill
ion.
pa
ymen
ts o
f prin
cipa
l and
inte
rest
to b
ondh
olde
rs.
Am
ount
s m
ayTh
e $2
9.17
5 m
illio
n w
as fu
lly re
tired
on
10/0
1/97
.di
ffer f
rom
bud
geta
ry a
mou
nts
(bud
geta
ry a
mou
nts
repr
esen
t pay
men
tsto
sin
king
fund
s).
(b)
Rep
rese
nts
the
defe
asan
ce o
f a 1
978
refu
ndin
g bo
nd is
sue
in th
e am
ount
of $
155.
725
mill
ion,
and
the
refu
nded
$24
.680
mill
ion
(e) I
n FY
94
DO
T re
fund
ed th
e 3r
d an
d 6t
h th
ru 1
3th
Ser
ies.
The
(see
(a) a
bove
).re
fund
ing
debt
is n
ot c
lass
ified
as
Sta
te ta
x su
ppor
ted
debt
.
(c)
Sin
king
fund
bal
ance
s re
flect
the
net e
ffect
of:
dep
osits
into
the
fund
, one
fisc
al y
ear i
n ad
vanc
e, o
f deb
t ser
vice
; fun
d ea
rnin
gs;
and
paym
ents
, fro
m th
e si
nkin
g fu
nd, t
o bo
ndho
lder
s.
84