J00B01 - MDOT State Highway Administration - Maryland
36
J00B01 State Highway Administration Maryland Department of Transportation For further information contact: Steven D. McCulloch Phone: (410) 946-5530 Analysis of the FY 2023 Maryland Executive Budget, 2022 1 Executive Summary The State Highway Administration (SHA) is responsible for building and maintaining Maryland’s numbered highways and bridges outside Baltimore City. This includes operation of traffic and roadway monitoring and management, incident management, traveler information, and snow removal. Operating Budget Summary Fiscal 2023 Budget Increases $22.0 Million, or 7.2%, to $327.2 Million ($ in Millions) Note: The fiscal 2022 working appropriation and fiscal 2023 allowance do not reflect funding for statewide personnel actions budgeted in the Department of Budget and Management, which include cost-of-living adjustments, increments, bonuses, and may include annual salary review adjustments. $0 $50 $100 $150 $200 $250 $300 $350 2021 2022 Working 2023 Allowance Special Federal
-
Upload
khangminh22 -
Category
Documents
-
view
1 -
download
0
Transcript of J00B01 - MDOT State Highway Administration - Maryland
J00B01
State Highway Administration Maryland Department of Transportation
For further information contact: Steven D. McCulloch Phone: (410) 946-5530
Analysis of the FY 2023 Maryland Executive Budget, 2022
1
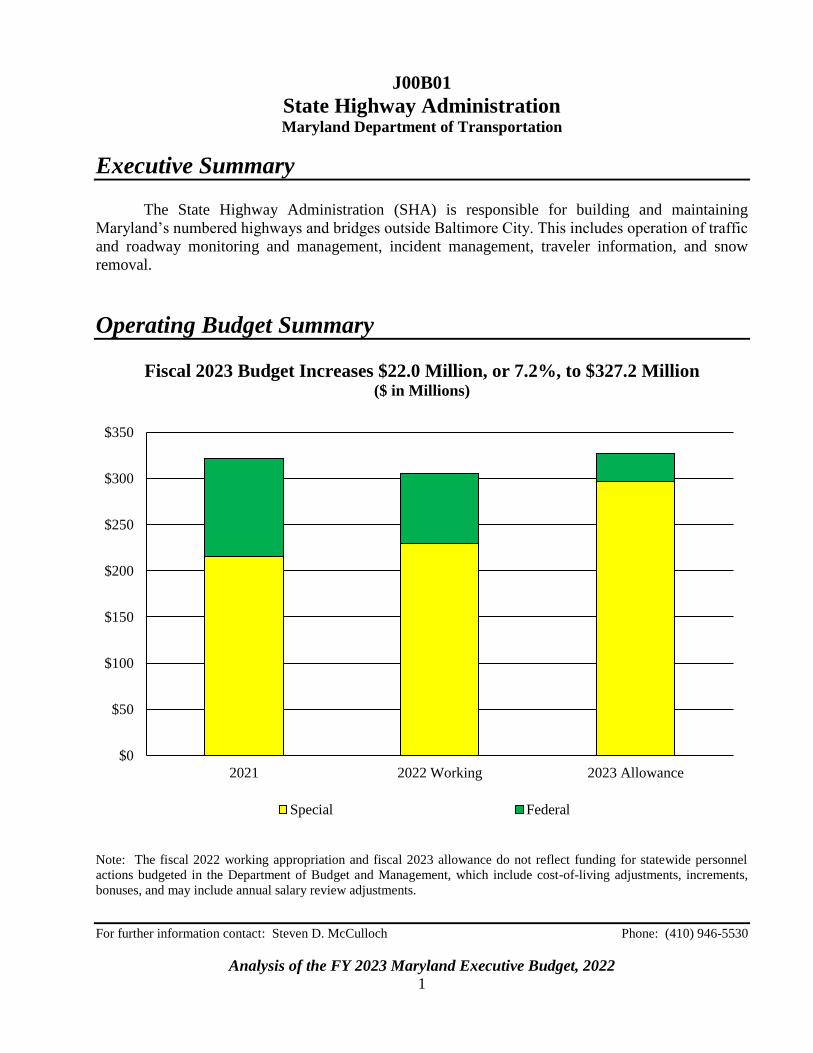
Executive Summary
The State Highway Administration (SHA) is responsible for building and maintaining
Maryland’s numbered highways and bridges outside Baltimore City. This includes operation of traffic
and roadway monitoring and management, incident management, traveler information, and snow
removal.
Operating Budget Summary
Fiscal 2023 Budget Increases $22.0 Million, or 7.2%, to $327.2 Million ($ in Millions)
Note: The fiscal 2022 working appropriation and fiscal 2023 allowance do not reflect funding for statewide personnel
actions budgeted in the Department of Budget and Management, which include cost-of-living adjustments, increments,
bonuses, and may include annual salary review adjustments.
$0
$50
$100
$150
$200
$250
$300
$350
2021 2022 Working 2023 Allowance
Special Federal
J00B01 – MDOT – State Highway Administration
Analysis of the FY 2023 Maryland Executive Budget, 2022
2
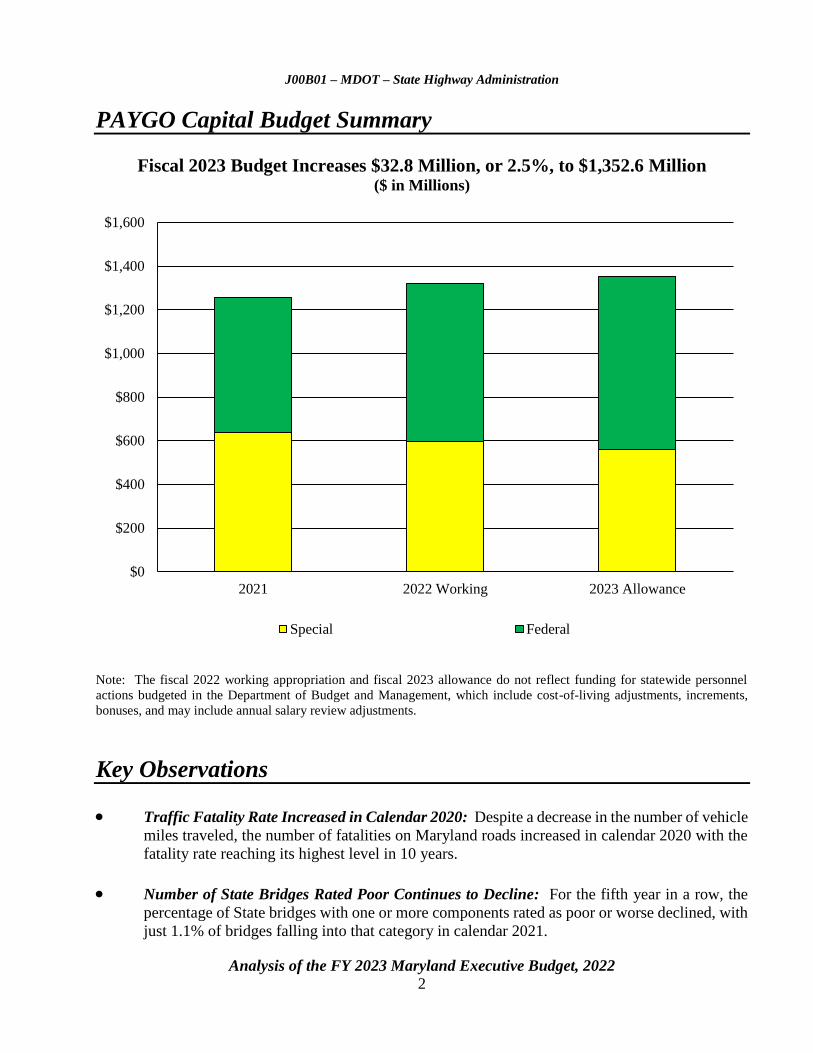
PAYGO Capital Budget Summary
Fiscal 2023 Budget Increases $32.8 Million, or 2.5%, to $1,352.6 Million ($ in Millions)
Note: The fiscal 2022 working appropriation and fiscal 2023 allowance do not reflect funding for statewide personnel
actions budgeted in the Department of Budget and Management, which include cost-of-living adjustments, increments,
bonuses, and may include annual salary review adjustments.
Key Observations
Traffic Fatality Rate Increased in Calendar 2020: Despite a decrease in the number of vehicle
miles traveled, the number of fatalities on Maryland roads increased in calendar 2020 with the
fatality rate reaching its highest level in 10 years.
Number of State Bridges Rated Poor Continues to Decline: For the fifth year in a row, the
percentage of State bridges with one or more components rated as poor or worse declined, with
just 1.1% of bridges falling into that category in calendar 2021.
$0
$200
$400
$600
$800
$1,000
$1,200
$1,400
$1,600
2021 2022 Working 2023 Allowance
Special Federal
J00B01 – MDOT – State Highway Administration
Analysis of the FY 2023 Maryland Executive Budget, 2022
3
Operating Budget Recommended Actions
1. Concur with Governor’s allowance.
PAYGO Budget Recommended Actions
1. Concur with Governor’s allowance.
J00B01
State Highway Administration Maryland Department of Transportation
Analysis of the FY 2023 Maryland Executive Budget, 2022
4
Budget Analysis
Program Description
SHA is responsible for nearly 5,200 miles of interstate, primary, and secondary roads and over
2,500 bridges. SHA employees plan, design, build, and maintain these roads and bridges to safety and
performance standards while paying attention to social, ecological, and economic concerns.
SHA employs personnel in seven engineering districts throughout the State and at its
Baltimore City headquarters. Each district encompasses a number of adjacent counties with a district
office serving as its headquarters. There is at least one maintenance facility in each county. The districts
are responsible for the management of highway and bridge construction contracts and maintenance
functions, such as pavement repairs, bridge repairs, snow removal, roadside management, equipment
maintenance, and traffic engineering operations.
SHA attempts to manage traffic and congestion through the Coordinated Highways Action
Response Team (CHART) program. CHART provides information about traffic conditions and clears
incidents on major roadways.
The highway safety program funds the Motor Carrier Division. The Motor Carrier Division
manages the State’s enforcement of truck weight and age limits by inspecting drivers, trucks, and cargo
as well as auditing carriers.
The administration shares the key goals identified by the Maryland Department of
Transportation (MDOT):
ensuring a safe, secure, and resilient transportation system;
maintaining a high standard and modernizing Maryland’s multimodal transportation system;
improving the quality and efficiency of the transportation system to enhance the customer
experience;
providing better transportation choices and connections;
facilitating economic opportunity and reducing congestion in Maryland through strategic
system expansion;
ensuring environmental protection and sensitivity; and
promoting fiscal responsibility.
J00B01 – MDOT – State Highway Administration
Analysis of the FY 2023 Maryland Executive Budget, 2022
5
Performance Analysis: Managing for Results
1. Safety and Security
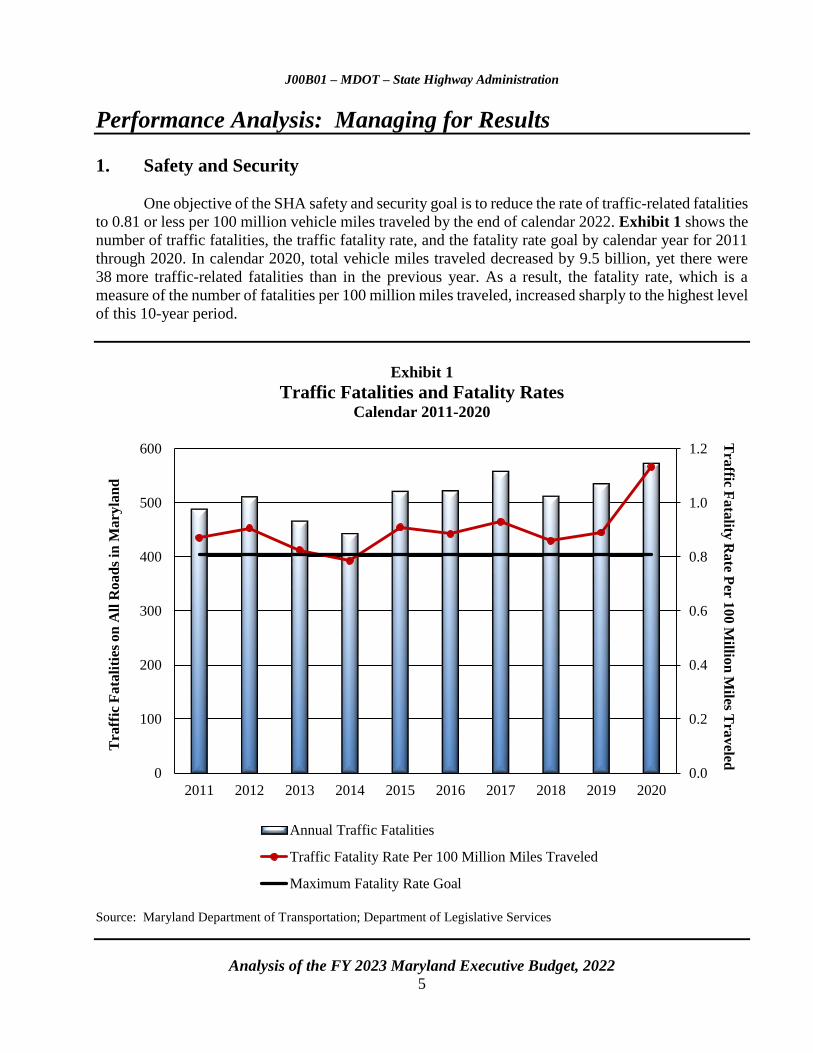
One objective of the SHA safety and security goal is to reduce the rate of traffic-related fatalities
to 0.81 or less per 100 million vehicle miles traveled by the end of calendar 2022. Exhibit 1 shows the
number of traffic fatalities, the traffic fatality rate, and the fatality rate goal by calendar year for 2011
through 2020. In calendar 2020, total vehicle miles traveled decreased by 9.5 billion, yet there were
38 more traffic-related fatalities than in the previous year. As a result, the fatality rate, which is a
measure of the number of fatalities per 100 million miles traveled, increased sharply to the highest level
of this 10-year period.
Exhibit 1
Traffic Fatalities and Fatality Rates Calendar 2011-2020
Source: Maryland Department of Transportation; Department of Legislative Services
0.0
0.2
0.4
0.6
0.8
1.0
1.2
0
100
200
300
400
500
600
2011 2012 2013 2014 2015 2016 2017 2018 2019 2020
Tra
ffic Fata
lity R
ate P
er 100 M
illion
Miles T
raveled
Tra
ffic
Fata
liti
es o
n A
ll R
oad
s in
Mary
lan
d
Annual Traffic Fatalities
Traffic Fatality Rate Per 100 Million Miles Traveled
Maximum Fatality Rate Goal
J00B01 – MDOT – State Highway Administration
Analysis of the FY 2023 Maryland Executive Budget, 2022
6
2. Congestion
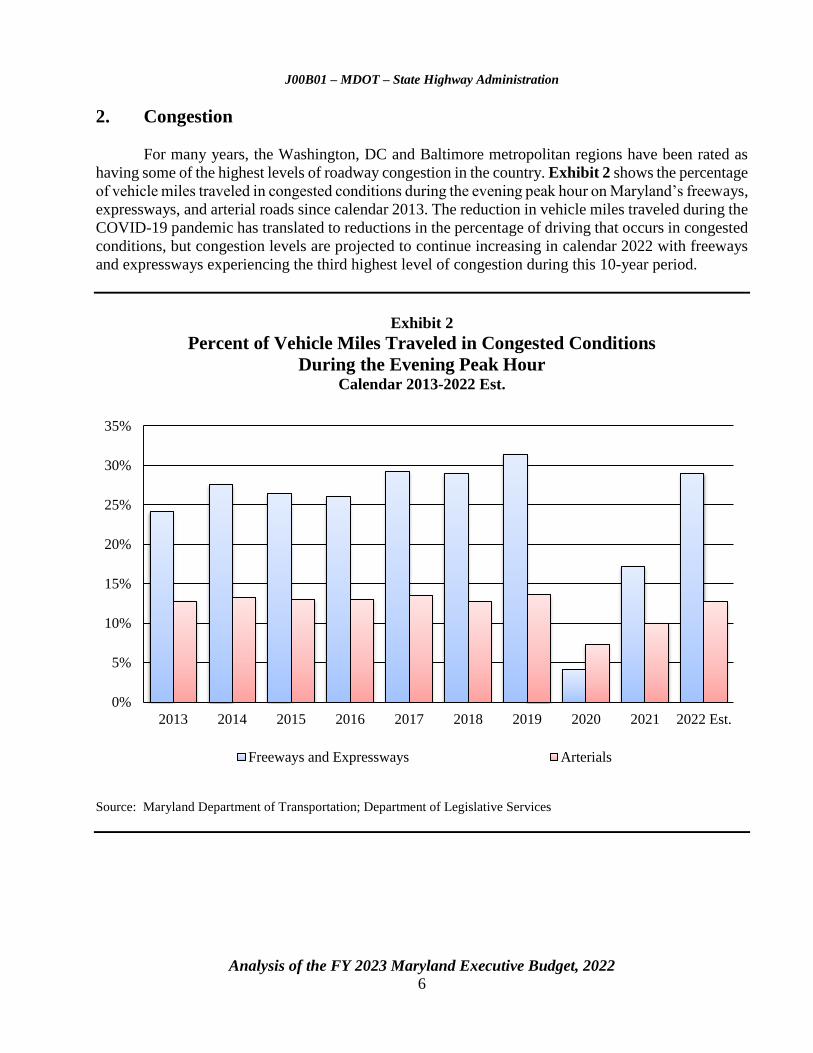
For many years, the Washington, DC and Baltimore metropolitan regions have been rated as
having some of the highest levels of roadway congestion in the country. Exhibit 2 shows the percentage
of vehicle miles traveled in congested conditions during the evening peak hour on Maryland’s freeways,
expressways, and arterial roads since calendar 2013. The reduction in vehicle miles traveled during the
COVID-19 pandemic has translated to reductions in the percentage of driving that occurs in congested
conditions, but congestion levels are projected to continue increasing in calendar 2022 with freeways
and expressways experiencing the third highest level of congestion during this 10-year period.
Exhibit 2
Percent of Vehicle Miles Traveled in Congested Conditions
During the Evening Peak Hour Calendar 2013-2022 Est.
Source: Maryland Department of Transportation; Department of Legislative Services
0%
5%
10%
15%
20%
25%
30%
35%
2013 2014 2015 2016 2017 2018 2019 2020 2021 2022 Est.
Freeways and Expressways Arterials
J00B01 – MDOT – State Highway Administration
Analysis of the FY 2023 Maryland Executive Budget, 2022
7
3. System Preservation and Maintenance – Bridges with Components Rated
Poor or Worse
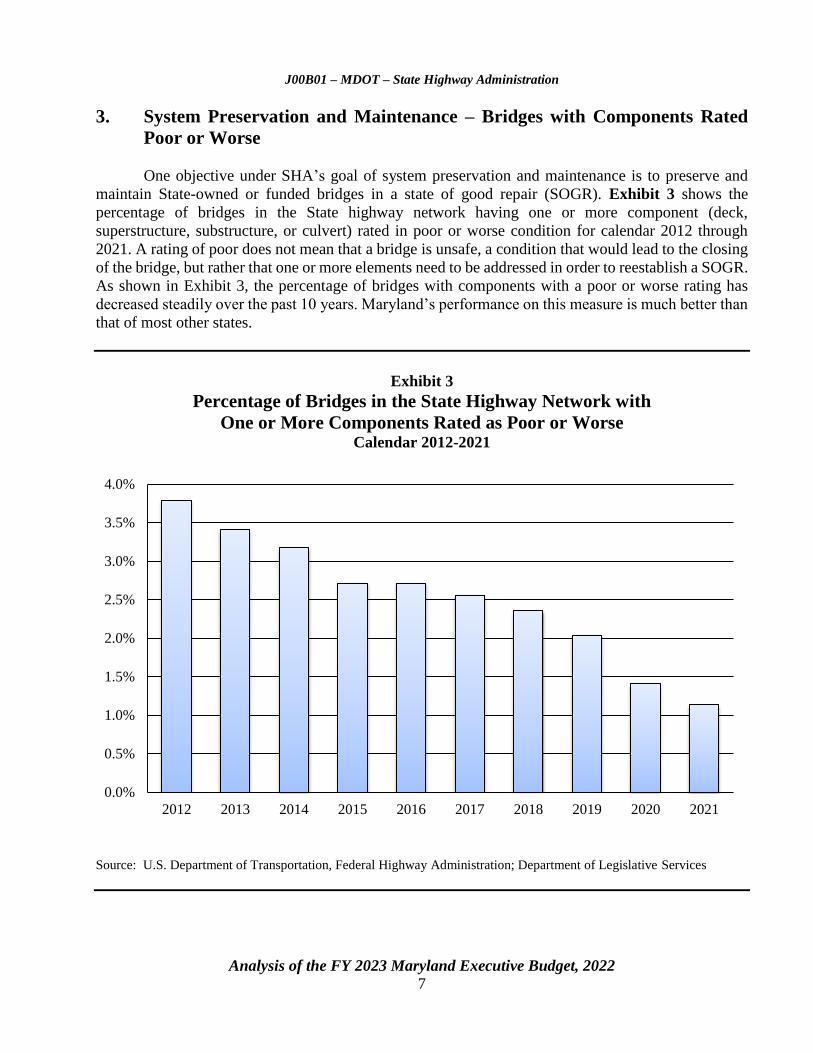
One objective under SHA’s goal of system preservation and maintenance is to preserve and
maintain State-owned or funded bridges in a state of good repair (SOGR). Exhibit 3 shows the
percentage of bridges in the State highway network having one or more component (deck,
superstructure, substructure, or culvert) rated in poor or worse condition for calendar 2012 through
2021. A rating of poor does not mean that a bridge is unsafe, a condition that would lead to the closing
of the bridge, but rather that one or more elements need to be addressed in order to reestablish a SOGR.
As shown in Exhibit 3, the percentage of bridges with components with a poor or worse rating has
decreased steadily over the past 10 years. Maryland’s performance on this measure is much better than
that of most other states.
Exhibit 3
Percentage of Bridges in the State Highway Network with
One or More Components Rated as Poor or Worse Calendar 2012-2021
Source: U.S. Department of Transportation, Federal Highway Administration; Department of Legislative Services
0.0%
0.5%
1.0%
1.5%
2.0%
2.5%
3.0%
3.5%
4.0%
2012 2013 2014 2015 2016 2017 2018 2019 2020 2021

J00B01 – MDOT – State Highway Administration
Analysis of the FY 2023 Maryland Executive Budget, 2022
8
4. System Preservation and Maintenance – Highway Maintenance Condition
Another objective of the system preservation and maintenance goal is to improve and maintain
at least 85% of the highway network in an overall preferred maintenance condition. As shown in
Exhibit 4, SHA met this goal 5 out of the past 10 years. Staggered shifts with half-staff working to
maintain social distancing due to the COVID-19 pandemic contributed to performance slightly below
the goal in fiscal 2021.
Exhibit 4
Percent of Highway Network in Overall Preferred Maintenance Condition Fiscal 2012-2021
Source: Maryland Department of Transportation; Department of Legislative Services
0%
10%
20%
30%
40%
50%
60%
70%
80%
90%
100%
2012 2013 2014 2015 2016 2017 2018 2019 2020 2021
Goal

J00B01 – MDOT – State Highway Administration
Analysis of the FY 2023 Maryland Executive Budget, 2022
9
Fiscal 2022
Federal Stimulus Funds
SHA’s fiscal 2022 budget includes $50 million from the Coronavirus Response and Relief
Supplemental Appropriations Act added through Supplemental Budget No. 4 during the 2021 session.
Fiscal 2023 Overview of Agency Spending
As shown in Exhibit 5, SHA operations rely almost equally on SHA personnel (including
contractual full-time equivalents (FTE)) and services provided through contracts.
Exhibit 5
Overview of Agency Spending
Fiscal 2023 Allowance ($ in Millions)
Source: Governor’s Fiscal 2023 Budget Books; Department of Legislative Services
Personnel
$138.8
42%
Contractual Services
$129.1
40%
Other
$59.3
18%
J00B01 – MDOT – State Highway Administration
Analysis of the FY 2023 Maryland Executive Budget, 2022
10
Proposed Budget Change
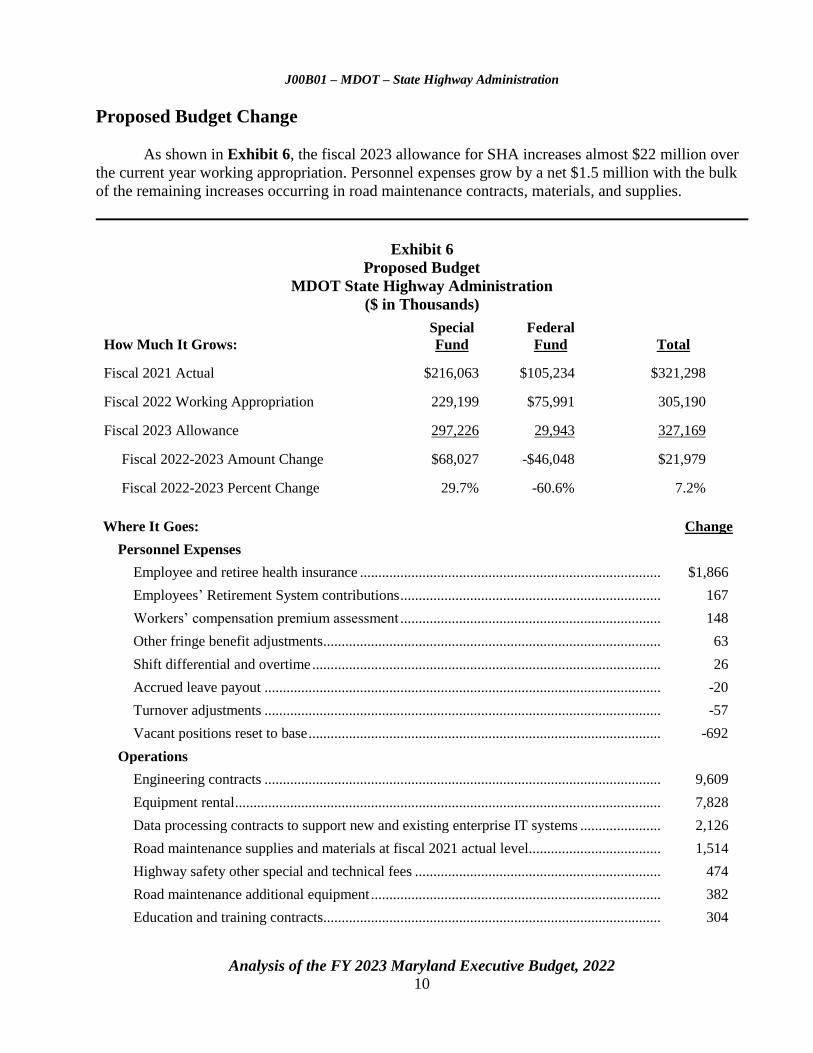
As shown in Exhibit 6, the fiscal 2023 allowance for SHA increases almost $22 million over
the current year working appropriation. Personnel expenses grow by a net $1.5 million with the bulk
of the remaining increases occurring in road maintenance contracts, materials, and supplies.
Exhibit 6
Proposed Budget
MDOT State Highway Administration
($ in Thousands)
How Much It Grows:
Special
Fund
Federal
Fund
Total
Fiscal 2021 Actual $216,063 $105,234 $321,298
Fiscal 2022 Working Appropriation 229,199 $75,991 305,190
Fiscal 2023 Allowance 297,226 29,943 327,169
Fiscal 2022-2023 Amount Change $68,027 -$46,048 $21,979
Fiscal 2022-2023 Percent Change 29.7% -60.6% 7.2%
Where It Goes: Change
Personnel Expenses
Employee and retiree health insurance .................................................................................. $1,866
Employees’ Retirement System contributions ....................................................................... 167
Workersʼ compensation premium assessment ....................................................................... 148
Other fringe benefit adjustments............................................................................................ 63
Shift differential and overtime ............................................................................................... 26
Accrued leave payout ............................................................................................................ -20
Turnover adjustments ............................................................................................................ -57
Vacant positions reset to base ................................................................................................ -692
Operations
Engineering contracts ............................................................................................................ 9,609
Equipment rental .................................................................................................................... 7,828
Data processing contracts to support new and existing enterprise IT systems ...................... 2,126
Road maintenance supplies and materials at fiscal 2021 actual level.................................... 1,514
Highway safety other special and technical fees ................................................................... 474
Road maintenance additional equipment ............................................................................... 382
Education and training contracts............................................................................................ 304
J00B01 – MDOT – State Highway Administration
Analysis of the FY 2023 Maryland Executive Budget, 2022
11
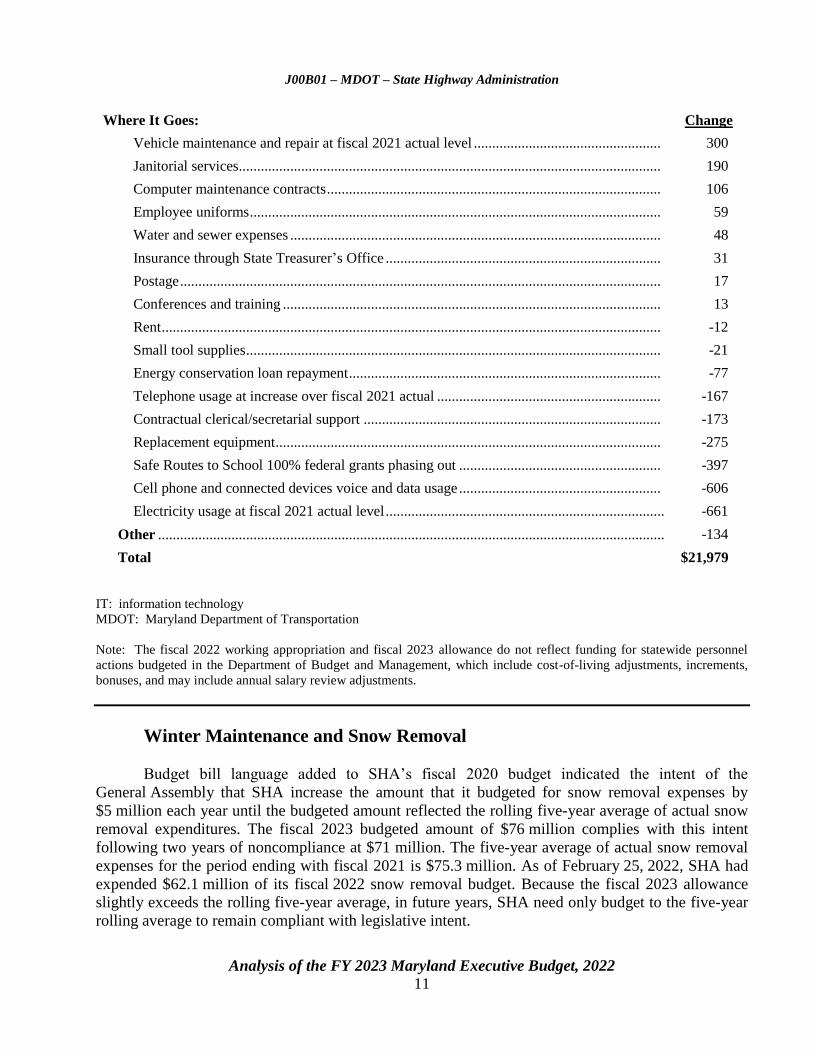
Where It Goes: Change
Vehicle maintenance and repair at fiscal 2021 actual level ................................................... 300
Janitorial services ................................................................................................................... 190
Computer maintenance contracts ........................................................................................... 106
Employee uniforms ................................................................................................................ 59
Water and sewer expenses ..................................................................................................... 48
Insurance through State Treasurer’s Office ........................................................................... 31
Postage ................................................................................................................................... 17
Conferences and training ....................................................................................................... 13
Rent ........................................................................................................................................ -12
Small tool supplies ................................................................................................................. -21
Energy conservation loan repayment ..................................................................................... -77
Telephone usage at increase over fiscal 2021 actual ............................................................. -167
Contractual clerical/secretarial support ................................................................................. -173
Replacement equipment ......................................................................................................... -275
Safe Routes to School 100% federal grants phasing out ....................................................... -397
Cell phone and connected devices voice and data usage ....................................................... -606
Electricity usage at fiscal 2021 actual level ............................................................................ -661
Other .......................................................................................................................................... -134
Total $21,979
IT: information technology
MDOT: Maryland Department of Transportation
Note: The fiscal 2022 working appropriation and fiscal 2023 allowance do not reflect funding for statewide personnel
actions budgeted in the Department of Budget and Management, which include cost-of-living adjustments, increments,
bonuses, and may include annual salary review adjustments.
Winter Maintenance and Snow Removal
Budget bill language added to SHA’s fiscal 2020 budget indicated the intent of the
General Assembly that SHA increase the amount that it budgeted for snow removal expenses by
$5 million each year until the budgeted amount reflected the rolling five-year average of actual snow
removal expenditures. The fiscal 2023 budgeted amount of $76 million complies with this intent
following two years of noncompliance at $71 million. The five-year average of actual snow removal
expenses for the period ending with fiscal 2021 is $75.3 million. As of February 25, 2022, SHA had
expended $62.1 million of its fiscal 2022 snow removal budget. Because the fiscal 2023 allowance
slightly exceeds the rolling five-year average, in future years, SHA need only budget to the five-year
rolling average to remain compliant with legislative intent.
J00B01 – MDOT – State Highway Administration
Analysis of the FY 2023 Maryland Executive Budget, 2022
12
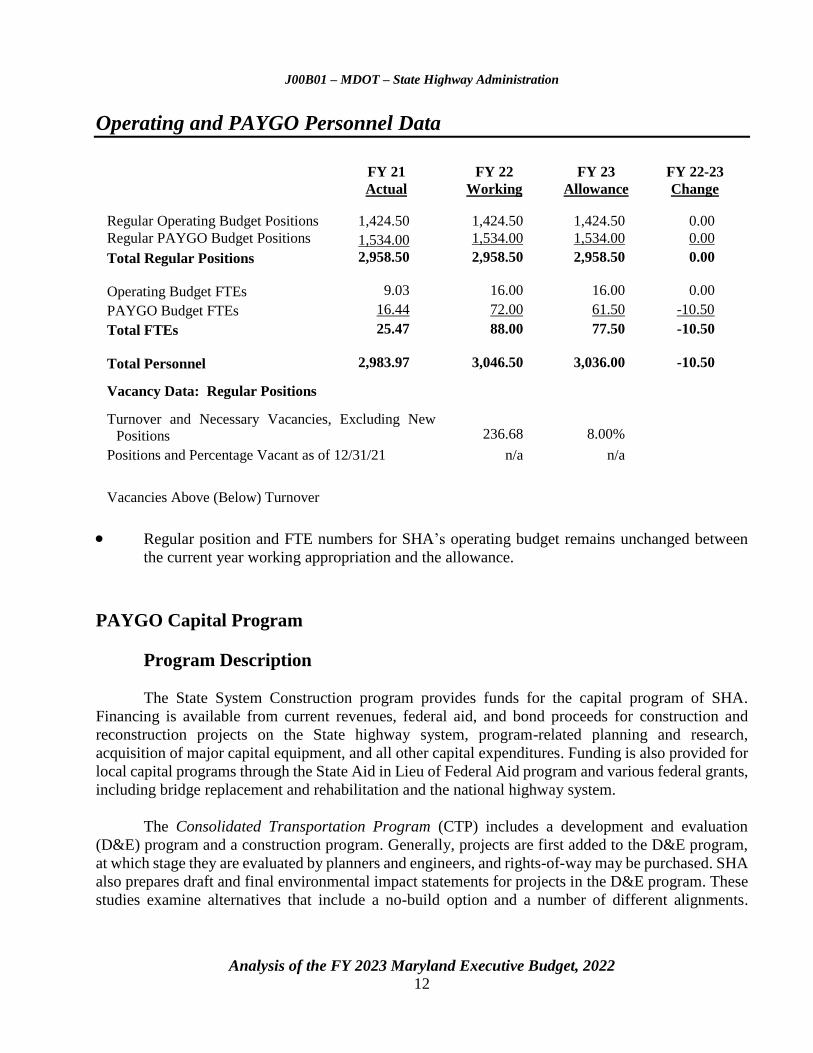
Operating and PAYGO Personnel Data
FY 21 FY 22 FY 23 FY 22-23
Actual Working Allowance Change
Regular Operating Budget Positions
1,424.50
1,424.50
1,424.50
0.00
Regular PAYGO Budget Positions
1,534.00 1,534.00 1,534.00 0.00
Total Regular Positions 2,958.50 2,958.50 2,958.50 0.00
Operating Budget FTEs 9.03 16.00 16.00 0.00
PAYGO Budget FTEs 16.44 72.00 61.50 -10.50
Total FTEs 25.47 88.00 77.50 -10.50
Total Personnel 2,983.97 3,046.50 3,036.00 -10.50
Vacancy Data: Regular Positions
Turnover and Necessary Vacancies, Excluding New
Positions 236.68 8.00%
Positions and Percentage Vacant as of 12/31/21 n/a n/a
Vacancies Above (Below) Turnover
Regular position and FTE numbers for SHA’s operating budget remains unchanged between
the current year working appropriation and the allowance.
PAYGO Capital Program
Program Description
The State System Construction program provides funds for the capital program of SHA.
Financing is available from current revenues, federal aid, and bond proceeds for construction and
reconstruction projects on the State highway system, program-related planning and research,
acquisition of major capital equipment, and all other capital expenditures. Funding is also provided for
local capital programs through the State Aid in Lieu of Federal Aid program and various federal grants,
including bridge replacement and rehabilitation and the national highway system.
The Consolidated Transportation Program (CTP) includes a development and evaluation
(D&E) program and a construction program. Generally, projects are first added to the D&E program,
at which stage they are evaluated by planners and engineers, and rights-of-way may be purchased. SHA
also prepares draft and final environmental impact statements for projects in the D&E program. These
studies examine alternatives that include a no-build option and a number of different alignments.
J00B01 – MDOT – State Highway Administration
Analysis of the FY 2023 Maryland Executive Budget, 2022
13
Spending on a project while in the D&E program is usually less than 15% of the total project cost.
When SHA wants to move a project forward, it is moved into the construction program.
Included in SHA’s section of the CTP is State aid to local governments. Beginning in
fiscal 2020, State aid is provided in the form of mandated capital grants. For fiscal 2020 to 2024, local
governments are receiving grants equivalent to 13.5% of the Gasoline and Motor Vehicle Revenue
Account (GMVRA) in the Transportation Trust Fund. Under current law, after fiscal 2024, local
governments will receive grants equivalent to 9.6% of the GMVRA. SB 400/HB 410 of 2022 are
Administration bills that would make the 13.5% rate permanent.
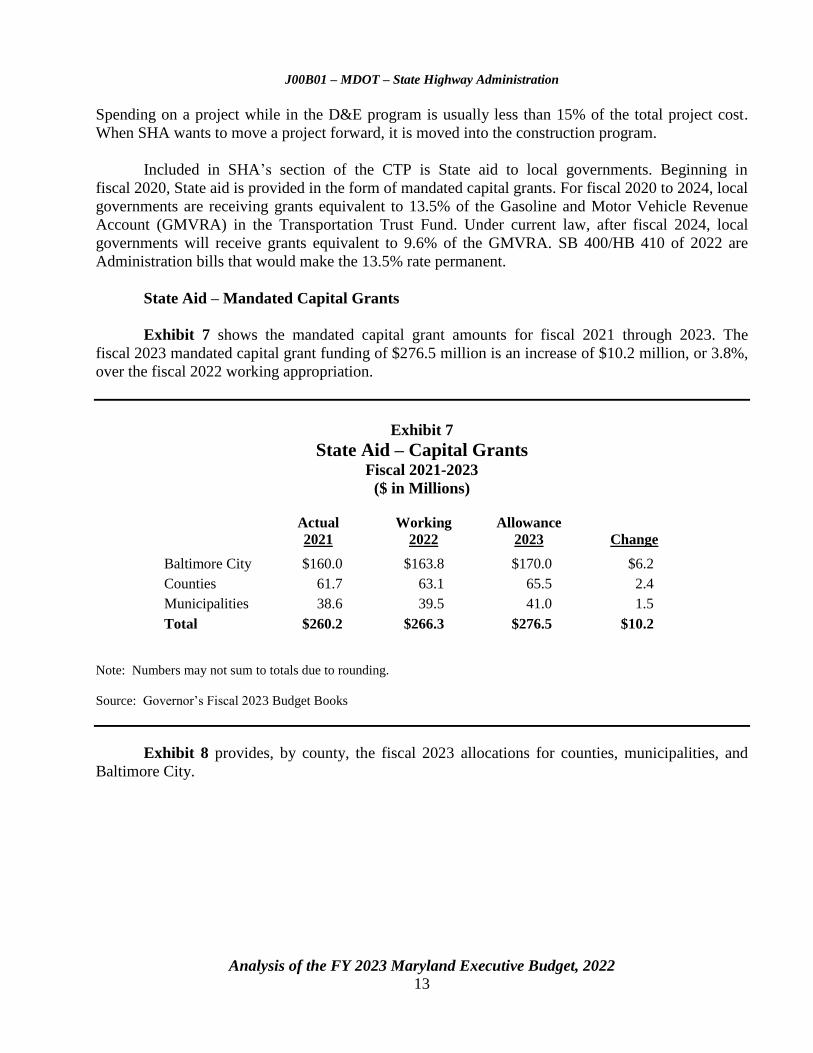
State Aid – Mandated Capital Grants
Exhibit 7 shows the mandated capital grant amounts for fiscal 2021 through 2023. The
fiscal 2023 mandated capital grant funding of $276.5 million is an increase of $10.2 million, or 3.8%,
over the fiscal 2022 working appropriation.
Exhibit 7
State Aid – Capital Grants Fiscal 2021-2023
($ in Millions)
Actual
2021
Working
2022
Allowance
2023 Change
Baltimore City $160.0 $163.8 $170.0 $6.2
Counties 61.7 63.1 65.5 2.4
Municipalities 38.6 39.5 41.0 1.5
Total $260.2 $266.3 $276.5 $10.2
Note: Numbers may not sum to totals due to rounding.
Source: Governor’s Fiscal 2023 Budget Books
Exhibit 8 provides, by county, the fiscal 2023 allocations for counties, municipalities, and
Baltimore City.

J00B01 – MDOT – State Highway Administration
Analysis of the FY 2023 Maryland Executive Budget, 2022
14
Exhibit 8
State Aid – Mandated Capital Grant Allocation Fiscal 2023
Counties Municipalities Total
Allegany $1,123,499 $1,883,956 $3,007,454
Anne Arundel 7,040,976 1,702,289 8,743,265
Baltimore 9,626,330 0 9,626,330
Calvert 1,523,359 513,380 2,036,738
Caroline 947,646 751,600 1,699,245
Carroll 2,651,483 2,375,788 5,027,270
Cecil 1,538,907 1,186,039 2,724,946
Charles 2,364,985 680,001 3,044,985
Dorchester 1,026,872 920,974 1,947,846
Frederick 3,299,989 4,803,286 8,103,276
Garrett 1,245,947 621,679 1,867,625
Harford 3,317,154 1,928,455 5,245,609
Howard 3,874,013 0 3,874,013
Kent 533,826 429,241 963,066
Montgomery 8,800,890 6,530,741 15,331,631
Prince George’s 7,189,535 8,482,159 15,671,694
Queen Anne’s 1,259,296 325,498 1,584,794
St. Mary’s 1,890,577 224,352 2,114,929
Somerset 664,387 304,516 968,903
Talbot 764,319 1,162,882 1,927,201
Washington 2,082,995 2,547,189 4,630,184
Wicomico 1,551,509 2,266,303 3,817,813
Worcester 1,222,488 1,322,783 2,545,271
Subtotal $65,540,978 $40,963,111 $106,504,089
Baltimore City $169,996,911 $169,996,911
Total $235,537,889 $40,963,111 $276,501,000
Note: Numbers may not sum to total due to rounding.
Source: Governor’s Fiscal 2023 Budget Books
J00B01 – MDOT – State Highway Administration
Analysis of the FY 2023 Maryland Executive Budget, 2022
15
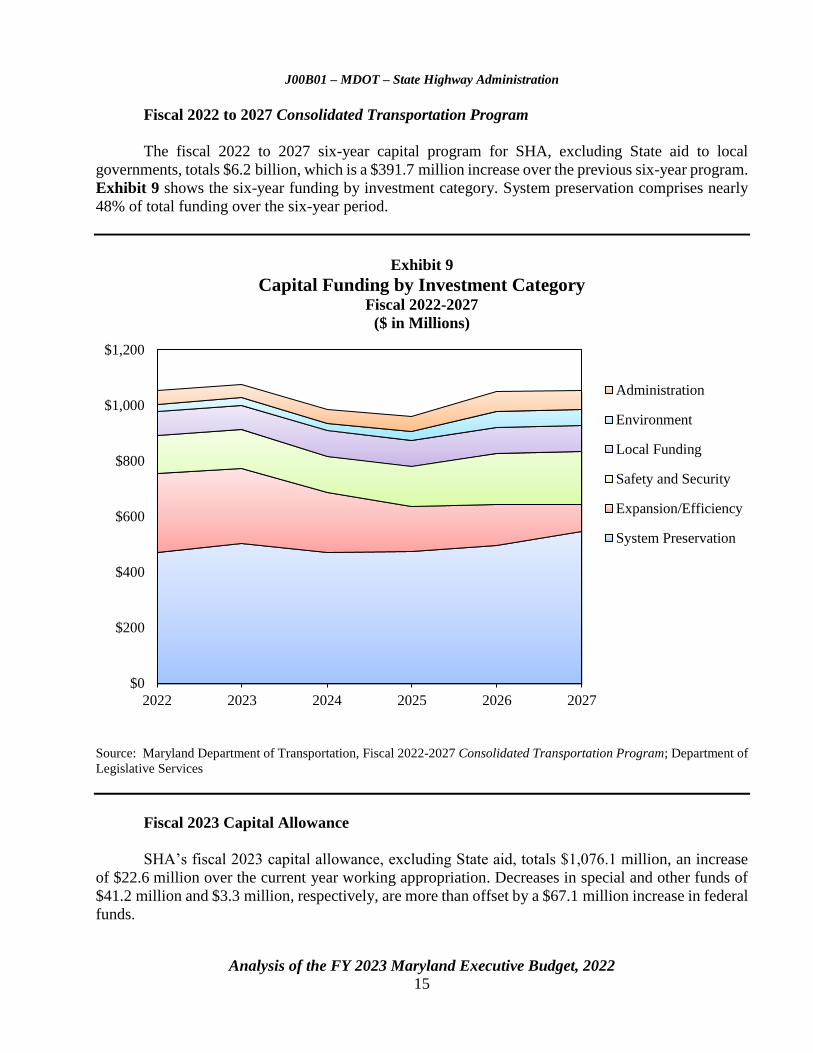
Fiscal 2022 to 2027 Consolidated Transportation Program
The fiscal 2022 to 2027 six-year capital program for SHA, excluding State aid to local
governments, totals $6.2 billion, which is a $391.7 million increase over the previous six-year program.
Exhibit 9 shows the six-year funding by investment category. System preservation comprises nearly
48% of total funding over the six-year period.
Exhibit 9
Capital Funding by Investment Category Fiscal 2022-2027
($ in Millions)
Source: Maryland Department of Transportation, Fiscal 2022-2027 Consolidated Transportation Program; Department of
Legislative Services
Fiscal 2023 Capital Allowance
SHA’s fiscal 2023 capital allowance, excluding State aid, totals $1,076.1 million, an increase
of $22.6 million over the current year working appropriation. Decreases in special and other funds of
$41.2 million and $3.3 million, respectively, are more than offset by a $67.1 million increase in federal
funds.
$0
$200
$400
$600
$800
$1,000
$1,200
2022 2023 2024 2025 2026 2027
Administration
Environment
Local Funding
Safety and Security
Expansion/Efficiency
System Preservation
J00B01 – MDOT – State Highway Administration
Analysis of the FY 2023 Maryland Executive Budget, 2022
16
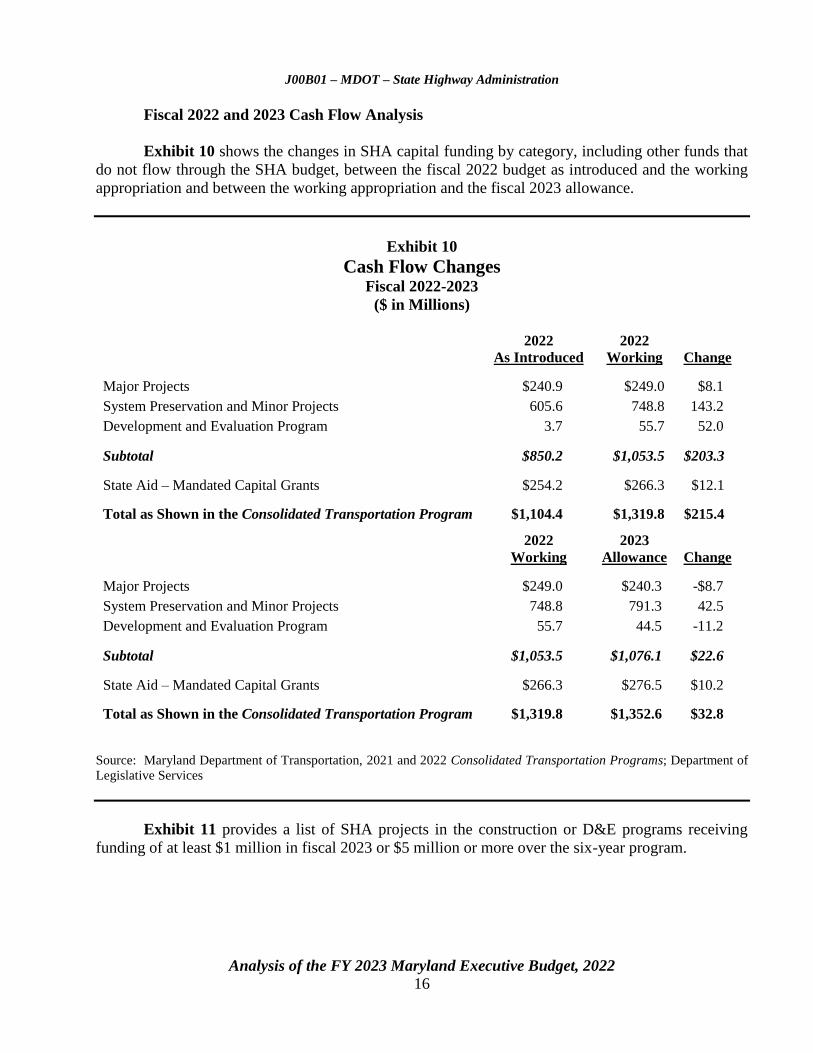
Fiscal 2022 and 2023 Cash Flow Analysis
Exhibit 10 shows the changes in SHA capital funding by category, including other funds that
do not flow through the SHA budget, between the fiscal 2022 budget as introduced and the working
appropriation and between the working appropriation and the fiscal 2023 allowance.
Exhibit 10
Cash Flow Changes Fiscal 2022-2023
($ in Millions)
2022 2022
As Introduced Working Change
Major Projects $240.9 $249.0 $8.1
System Preservation and Minor Projects 605.6 748.8 143.2
Development and Evaluation Program 3.7 55.7 52.0
Subtotal $850.2 $1,053.5 $203.3
State Aid – Mandated Capital Grants $254.2 $266.3 $12.1
Total as Shown in the Consolidated Transportation Program $1,104.4 $1,319.8 $215.4
2022 2023
Working Allowance Change
Major Projects $249.0 $240.3 -$8.7
System Preservation and Minor Projects 748.8 791.3 42.5
Development and Evaluation Program 55.7 44.5 -11.2
Subtotal $1,053.5 $1,076.1 $22.6
State Aid – Mandated Capital Grants $266.3 $276.5 $10.2
Total as Shown in the Consolidated Transportation Program $1,319.8 $1,352.6 $32.8
Source: Maryland Department of Transportation, 2021 and 2022 Consolidated Transportation Programs; Department of
Legislative Services
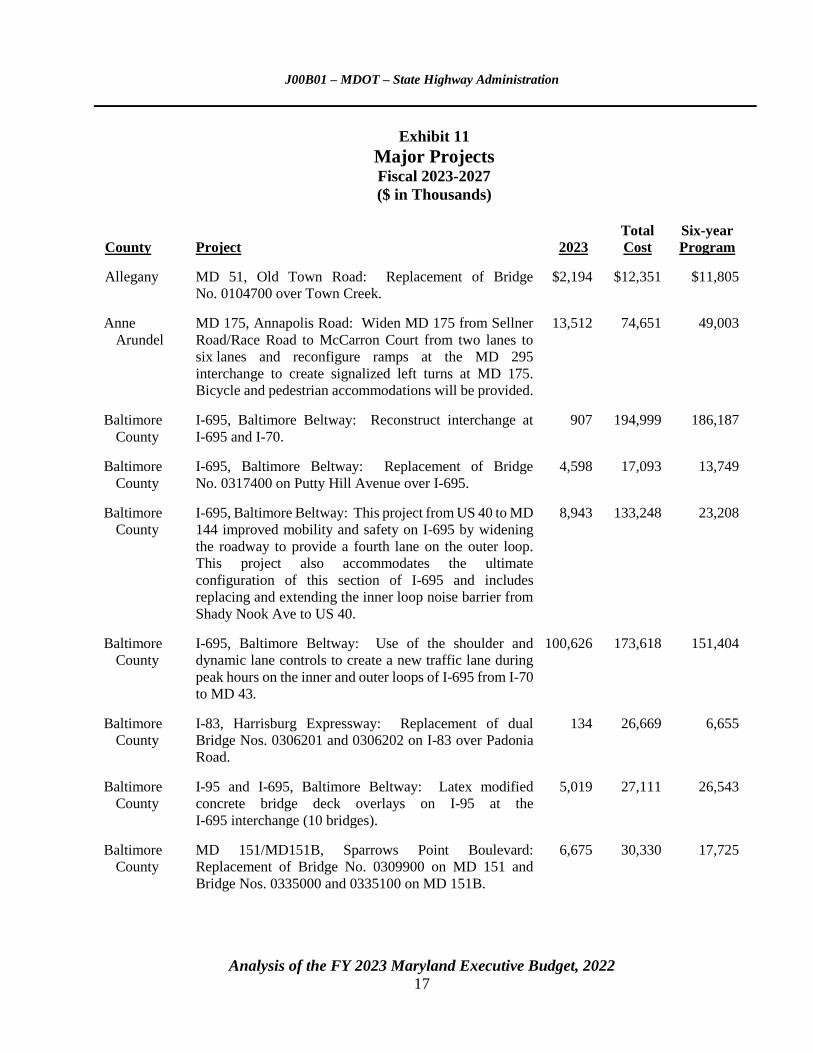
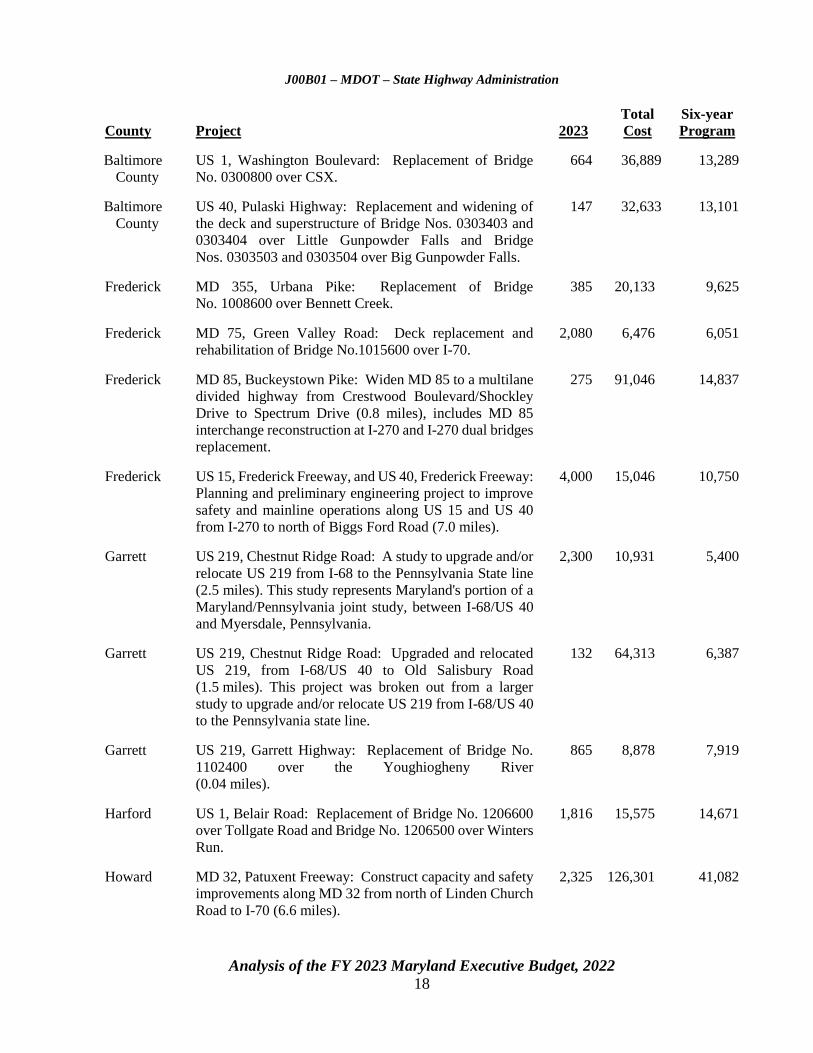
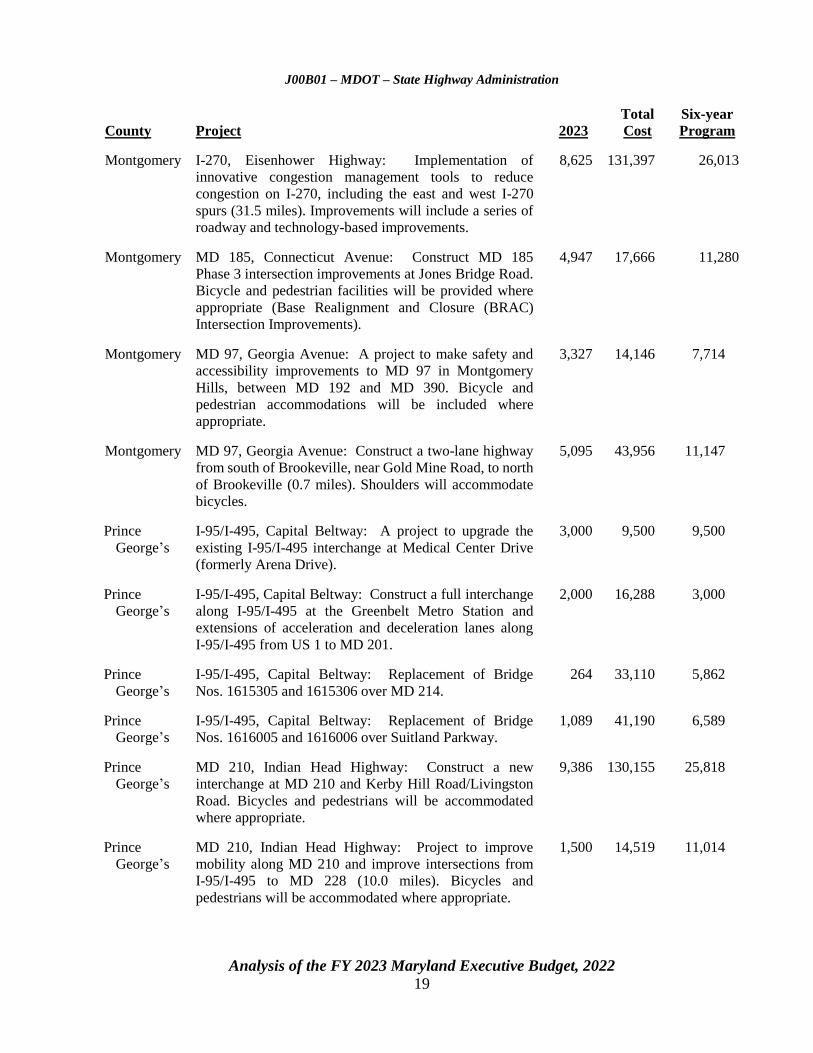
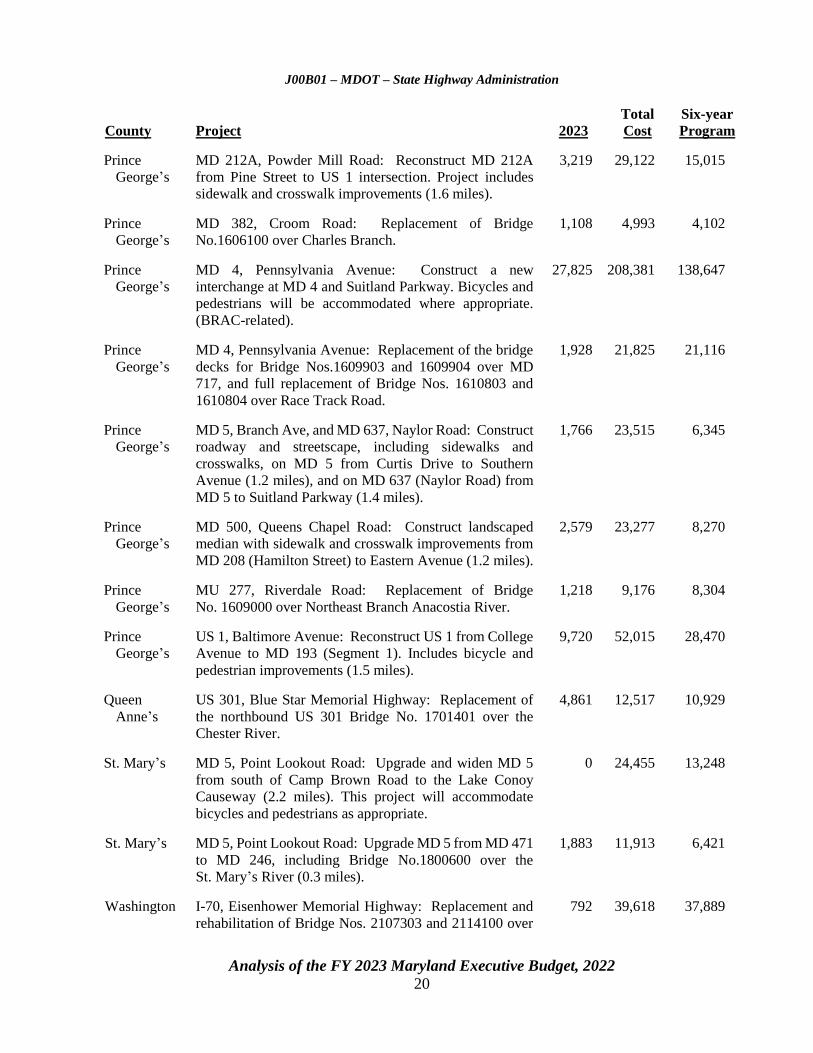
Exhibit 11 provides a list of SHA projects in the construction or D&E programs receiving
funding of at least $1 million in fiscal 2023 or $5 million or more over the six-year program.
J00B01 – MDOT – State Highway Administration
Analysis of the FY 2023 Maryland Executive Budget, 2022
17
Exhibit 11
Major Projects Fiscal 2023-2027
($ in Thousands)
County Project 2023
Total
Cost
Six-year
Program
Allegany MD 51, Old Town Road: Replacement of Bridge
No. 0104700 over Town Creek.
$2,194 $12,351 $11,805
Anne
Arundel
MD 175, Annapolis Road: Widen MD 175 from Sellner
Road/Race Road to McCarron Court from two lanes to
six lanes and reconfigure ramps at the MD 295
interchange to create signalized left turns at MD 175.
Bicycle and pedestrian accommodations will be provided.
13,512 74,651 49,003
Baltimore
County
I-695, Baltimore Beltway: Reconstruct interchange at
I-695 and I-70.
907 194,999 186,187
Baltimore
County
I-695, Baltimore Beltway: Replacement of Bridge
No. 0317400 on Putty Hill Avenue over I-695.
4,598 17,093 13,749
Baltimore
County
I-695, Baltimore Beltway: This project from US 40 to MD
144 improved mobility and safety on I-695 by widening
the roadway to provide a fourth lane on the outer loop.
This project also accommodates the ultimate
configuration of this section of I-695 and includes
replacing and extending the inner loop noise barrier from
Shady Nook Ave to US 40.
8,943 133,248 23,208
Baltimore
County
I-695, Baltimore Beltway: Use of the shoulder and
dynamic lane controls to create a new traffic lane during
peak hours on the inner and outer loops of I-695 from I-70
to MD 43.
100,626 173,618 151,404
Baltimore
County
I-83, Harrisburg Expressway: Replacement of dual
Bridge Nos. 0306201 and 0306202 on I-83 over Padonia
Road.
134 26,669 6,655
Baltimore
County
I-95 and I-695, Baltimore Beltway: Latex modified
concrete bridge deck overlays on I-95 at the
I-695 interchange (10 bridges).
5,019 27,111 26,543
Baltimore
County
MD 151/MD151B, Sparrows Point Boulevard:
Replacement of Bridge No. 0309900 on MD 151 and
Bridge Nos. 0335000 and 0335100 on MD 151B.
6,675 30,330 17,725
J00B01 – MDOT – State Highway Administration
Analysis of the FY 2023 Maryland Executive Budget, 2022
18
County Project 2023
Total
Cost
Six-year
Program
Baltimore
County
US 1, Washington Boulevard: Replacement of Bridge
No. 0300800 over CSX.
664 36,889 13,289
Baltimore
County
US 40, Pulaski Highway: Replacement and widening of
the deck and superstructure of Bridge Nos. 0303403 and
0303404 over Little Gunpowder Falls and Bridge
Nos. 0303503 and 0303504 over Big Gunpowder Falls.
147 32,633 13,101
Frederick MD 355, Urbana Pike: Replacement of Bridge
No. 1008600 over Bennett Creek.
385 20,133 9,625
Frederick MD 75, Green Valley Road: Deck replacement and
rehabilitation of Bridge No.1015600 over I-70.
2,080 6,476 6,051
Frederick MD 85, Buckeystown Pike: Widen MD 85 to a multilane
divided highway from Crestwood Boulevard/Shockley
Drive to Spectrum Drive (0.8 miles), includes MD 85
interchange reconstruction at I-270 and I-270 dual bridges
replacement.
275 91,046 14,837
Frederick US 15, Frederick Freeway, and US 40, Frederick Freeway:
Planning and preliminary engineering project to improve
safety and mainline operations along US 15 and US 40
from I-270 to north of Biggs Ford Road (7.0 miles).
4,000 15,046 10,750
Garrett US 219, Chestnut Ridge Road: A study to upgrade and/or
relocate US 219 from I-68 to the Pennsylvania State line
(2.5 miles). This study represents Maryland's portion of a
Maryland/Pennsylvania joint study, between I-68/US 40
and Myersdale, Pennsylvania.
2,300 10,931 5,400
Garrett US 219, Chestnut Ridge Road: Upgraded and relocated
US 219, from I-68/US 40 to Old Salisbury Road
(1.5 miles). This project was broken out from a larger
study to upgrade and/or relocate US 219 from I-68/US 40
to the Pennsylvania state line.
132 64,313 6,387
Garrett US 219, Garrett Highway: Replacement of Bridge No.
1102400 over the Youghiogheny River
(0.04 miles).
865 8,878 7,919
Harford US 1, Belair Road: Replacement of Bridge No. 1206600
over Tollgate Road and Bridge No. 1206500 over Winters
Run.
1,816 15,575 14,671
Howard MD 32, Patuxent Freeway: Construct capacity and safety
improvements along MD 32 from north of Linden Church
Road to I-70 (6.6 miles).
2,325 126,301 41,082
J00B01 – MDOT – State Highway Administration
Analysis of the FY 2023 Maryland Executive Budget, 2022
19
County Project 2023
Total
Cost
Six-year
Program
Montgomery I-270, Eisenhower Highway: Implementation of
innovative congestion management tools to reduce
congestion on I-270, including the east and west I-270
spurs (31.5 miles). Improvements will include a series of
roadway and technology-based improvements.
8,625 131,397 26,013
Montgomery MD 185, Connecticut Avenue: Construct MD 185
Phase 3 intersection improvements at Jones Bridge Road.
Bicycle and pedestrian facilities will be provided where
appropriate (Base Realignment and Closure (BRAC)
Intersection Improvements).
4,947 17,666 11,280
Montgomery MD 97, Georgia Avenue: A project to make safety and
accessibility improvements to MD 97 in Montgomery
Hills, between MD 192 and MD 390. Bicycle and
pedestrian accommodations will be included where
appropriate.
3,327 14,146 7,714
Montgomery MD 97, Georgia Avenue: Construct a two-lane highway
from south of Brookeville, near Gold Mine Road, to north
of Brookeville (0.7 miles). Shoulders will accommodate
bicycles.
5,095 43,956 11,147
Prince
George’s
I-95/I-495, Capital Beltway: A project to upgrade the
existing I-95/I-495 interchange at Medical Center Drive
(formerly Arena Drive).
3,000 9,500 9,500
Prince
George’s
I-95/I-495, Capital Beltway: Construct a full interchange
along I-95/I-495 at the Greenbelt Metro Station and
extensions of acceleration and deceleration lanes along
I-95/I-495 from US 1 to MD 201.
2,000 16,288 3,000
Prince
George’s
I-95/I-495, Capital Beltway: Replacement of Bridge
Nos. 1615305 and 1615306 over MD 214.
264 33,110 5,862
Prince
George’s
I-95/I-495, Capital Beltway: Replacement of Bridge
Nos. 1616005 and 1616006 over Suitland Parkway.
1,089 41,190 6,589
Prince
George’s
MD 210, Indian Head Highway: Construct a new
interchange at MD 210 and Kerby Hill Road/Livingston
Road. Bicycles and pedestrians will be accommodated
where appropriate.
9,386 130,155 25,818
Prince
George’s
MD 210, Indian Head Highway: Project to improve
mobility along MD 210 and improve intersections from
I-95/I-495 to MD 228 (10.0 miles). Bicycles and
pedestrians will be accommodated where appropriate.
1,500 14,519 11,014
J00B01 – MDOT – State Highway Administration
Analysis of the FY 2023 Maryland Executive Budget, 2022
20
County Project 2023
Total
Cost
Six-year
Program
Prince
George’s
MD 212A, Powder Mill Road: Reconstruct MD 212A
from Pine Street to US 1 intersection. Project includes
sidewalk and crosswalk improvements (1.6 miles).
3,219 29,122 15,015
Prince
George’s
MD 382, Croom Road: Replacement of Bridge
No.1606100 over Charles Branch.
1,108 4,993 4,102
Prince
George’s
MD 4, Pennsylvania Avenue: Construct a new
interchange at MD 4 and Suitland Parkway. Bicycles and
pedestrians will be accommodated where appropriate.
(BRAC-related).
27,825 208,381 138,647
Prince
George’s
MD 4, Pennsylvania Avenue: Replacement of the bridge
decks for Bridge Nos.1609903 and 1609904 over MD
717, and full replacement of Bridge Nos. 1610803 and
1610804 over Race Track Road.
1,928 21,825 21,116
Prince
George’s
MD 5, Branch Ave, and MD 637, Naylor Road: Construct
roadway and streetscape, including sidewalks and
crosswalks, on MD 5 from Curtis Drive to Southern
Avenue (1.2 miles), and on MD 637 (Naylor Road) from
MD 5 to Suitland Parkway (1.4 miles).
1,766 23,515 6,345
Prince
George’s
MD 500, Queens Chapel Road: Construct landscaped
median with sidewalk and crosswalk improvements from
MD 208 (Hamilton Street) to Eastern Avenue (1.2 miles).
2,579 23,277 8,270
Prince
George’s
MU 277, Riverdale Road: Replacement of Bridge
No. 1609000 over Northeast Branch Anacostia River.
1,218 9,176 8,304
Prince
George’s
US 1, Baltimore Avenue: Reconstruct US 1 from College
Avenue to MD 193 (Segment 1). Includes bicycle and
pedestrian improvements (1.5 miles).
9,720 52,015 28,470
Queen
Anne’s
US 301, Blue Star Memorial Highway: Replacement of
the northbound US 301 Bridge No. 1701401 over the
Chester River.
4,861 12,517 10,929
St. Mary’s MD 5, Point Lookout Road: Upgrade and widen MD 5
from south of Camp Brown Road to the Lake Conoy
Causeway (2.2 miles). This project will accommodate
bicycles and pedestrians as appropriate.
0 24,455 13,248
St. Mary’s MD 5, Point Lookout Road: Upgrade MD 5 from MD 471
to MD 246, including Bridge No.1800600 over the
St. Mary’s River (0.3 miles).
1,883 11,913 6,421
Washington I-70, Eisenhower Memorial Highway: Replacement and
rehabilitation of Bridge Nos. 2107303 and 2114100 over
792 39,618 37,889

J00B01 – MDOT – State Highway Administration
Analysis of the FY 2023 Maryland Executive Budget, 2022
21
County Project 2023
Total
Cost
Six-year
Program
I-81 and Bridge Nos. 2111303 and 2111304 over Norfolk
Southern Railroad. Replacement of Bridge Nos. 2111203
and 2111204 over US 11.
Washington I-70, Eisenhower Memorial Highway: Replacement and
widening of the bridge deck and superstructure of I-70
dual Bridge Nos. 2111803 and 2111804 over MD 65 and
I-70 dual Bridge Nos. 2111903 and 2111904 over CSX
Hagerstown Branch.
9,155 32,206 21,842
Washington I-70, Eisenhower Memorial Highway: Replacement of
Bridge Nos. 2113503 and 2113504 over Crystal Falls
Drive.
8,639 26,776 25,464
Washington I-81, Maryland Veterans Memorial Highway: Study to
upgrade and widen I-81 to a six-lane divided highway
between the Potomac River/West Virginia State line and
Pennsylvania State line (12.1 miles).
3,172 14,032 6,342
Wicomico US 13 Business, Salisbury Boulevard: Replacement of
Bridge No. 2200400 over East Branch Wicomico River.
1,023 11,374 8,099
Statewide Coordinated Highway Action Response Team: Install
advanced traffic management system and advanced traffic
information system technologies on Interstate highways
and arterials statewide.
8,832 n/a 95,321
Statewide I-270 and I-495, Capital Beltway – Full Delivery Stream
Restoration: Full-delivery stream and wetland mitigation
services in multiple watersheds.
1,900 12,066 7,530
Statewide I-270, Eisenhower Memorial Highway, and I-495, Capital
Beltway – Phase 1.
28,000 99,000 72,282
Statewide Sidewalk Program: This program provides matching
funds for the construction of sidewalks adjacent to State
highways.
5,997 n/a 45,095
Statewide Total Maximum Daily Load (TMDL): Plan, design, and
construct storm water controls and alternative water
quality improvement strategies in Maryland Phase 1 and
Phase II counties in order to meet the US Environmental
Protection Agency Chesapeake Bay TMDL requirements
by 2025.
11,761 n/a 134,451
Statewide Traffic Relief Plan (Phase 2) Smart Traffic Signals. 5,998 50,301 40,014
Source: Maryland Department of Transportation, 2022 Consolidated Transportation Program; Department of
Legislative Services
J00B01 – MDOT – State Highway Administration
Analysis of the FY 2023 Maryland Executive Budget, 2022
22
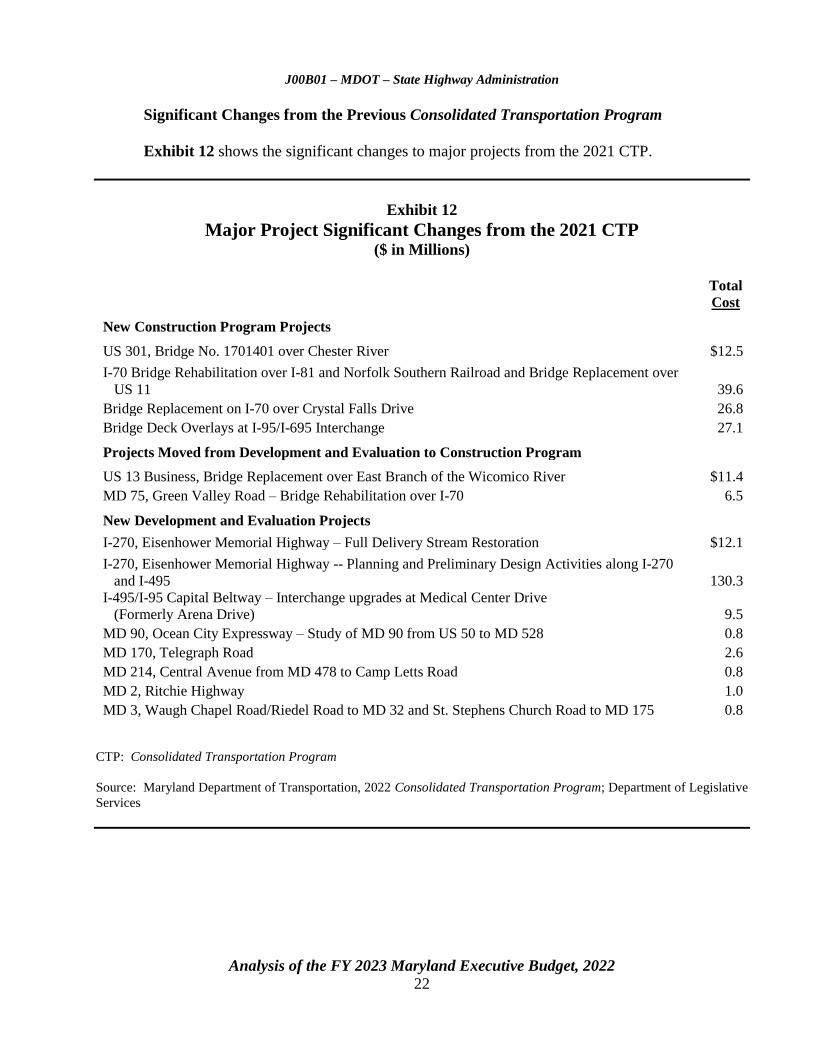
Significant Changes from the Previous Consolidated Transportation Program
Exhibit 12 shows the significant changes to major projects from the 2021 CTP.
Exhibit 12
Major Project Significant Changes from the 2021 CTP ($ in Millions)
Total
Cost
New Construction Program Projects
US 301, Bridge No. 1701401 over Chester River $12.5
I-70 Bridge Rehabilitation over I-81 and Norfolk Southern Railroad and Bridge Replacement over
US 11 39.6
Bridge Replacement on I-70 over Crystal Falls Drive 26.8
Bridge Deck Overlays at I-95/I-695 Interchange 27.1
Projects Moved from Development and Evaluation to Construction Program
US 13 Business, Bridge Replacement over East Branch of the Wicomico River $11.4
MD 75, Green Valley Road – Bridge Rehabilitation over I-70 6.5
New Development and Evaluation Projects
I-270, Eisenhower Memorial Highway – Full Delivery Stream Restoration $12.1
I-270, Eisenhower Memorial Highway -- Planning and Preliminary Design Activities along I-270
and I-495 130.3
I-495/I-95 Capital Beltway – Interchange upgrades at Medical Center Drive
(Formerly Arena Drive) 9.5
MD 90, Ocean City Expressway – Study of MD 90 from US 50 to MD 528 0.8
MD 170, Telegraph Road 2.6
MD 214, Central Avenue from MD 478 to Camp Letts Road 0.8
MD 2, Ritchie Highway 1.0
MD 3, Waugh Chapel Road/Riedel Road to MD 32 and St. Stephens Church Road to MD 175 0.8
CTP: Consolidated Transportation Program
Source: Maryland Department of Transportation, 2022 Consolidated Transportation Program; Department of Legislative
Services
J00B01 – MDOT – State Highway Administration
Analysis of the FY 2023 Maryland Executive Budget, 2022
23
Issues
1. Work Zone Safety Program Incorporates Multiple Elements to Protect Both
Workers and Road Users
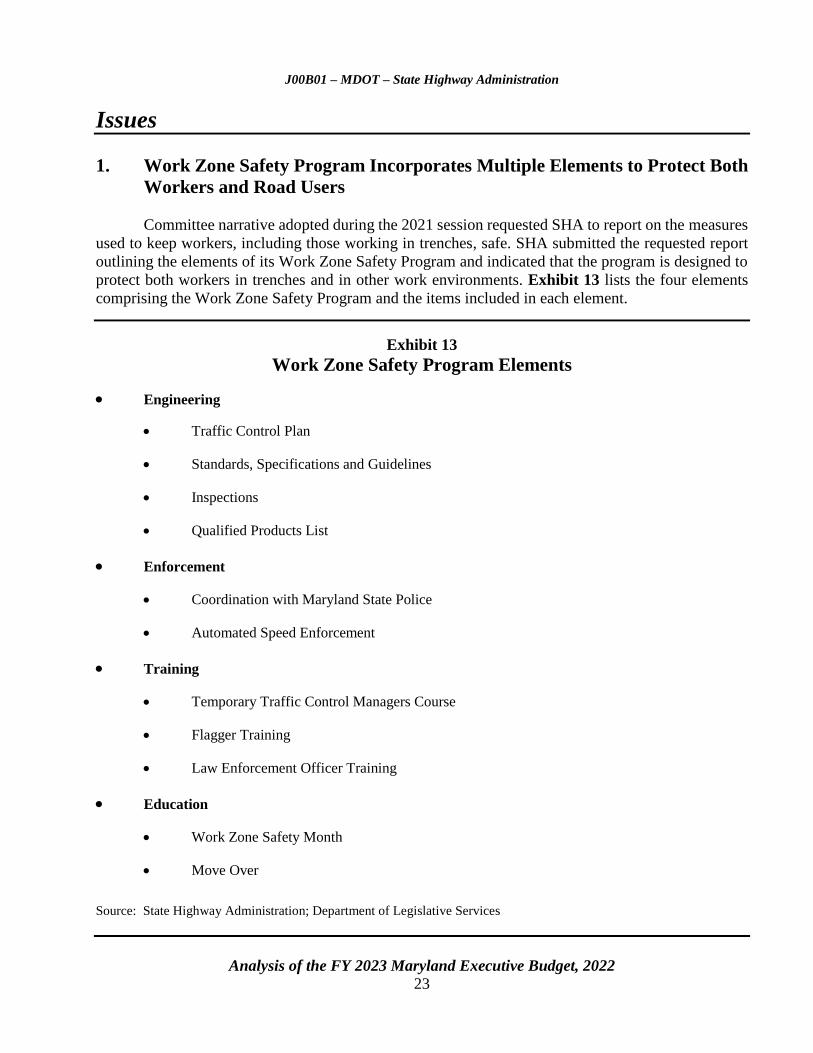
Committee narrative adopted during the 2021 session requested SHA to report on the measures
used to keep workers, including those working in trenches, safe. SHA submitted the requested report
outlining the elements of its Work Zone Safety Program and indicated that the program is designed to
protect both workers in trenches and in other work environments. Exhibit 13 lists the four elements
comprising the Work Zone Safety Program and the items included in each element.
Exhibit 13
Work Zone Safety Program Elements
Engineering
Traffic Control Plan
Standards, Specifications and Guidelines
Inspections
Qualified Products List
Enforcement
Coordination with Maryland State Police
Automated Speed Enforcement
Training
Temporary Traffic Control Managers Course
Flagger Training
Law Enforcement Officer Training
Education
Work Zone Safety Month
Move Over
Source: State Highway Administration; Department of Legislative Services
J00B01 – MDOT – State Highway Administration
Analysis of the FY 2023 Maryland Executive Budget, 2022
24
The report also notes that work on any SHA roadway requires the entity performing the work
to obtain a lane closure permit from SHA, have a traffic control manager on site whenever work requires
a lane or shoulder closure, hold a pre-traffic switch meeting on projects requiring realignment of traffic,
and follow removal of lane closure procedures designed for the safe removal of daily lane closures at
the end of the work shift.
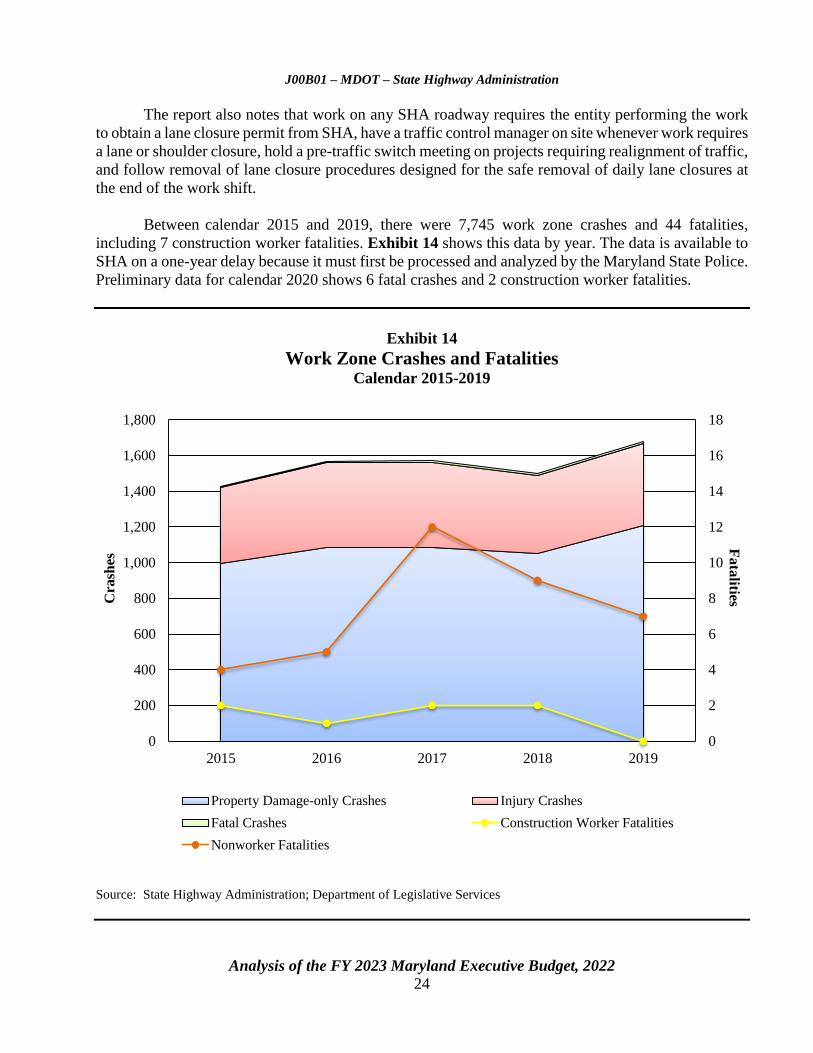
Between calendar 2015 and 2019, there were 7,745 work zone crashes and 44 fatalities,
including 7 construction worker fatalities. Exhibit 14 shows this data by year. The data is available to
SHA on a one-year delay because it must first be processed and analyzed by the Maryland State Police.
Preliminary data for calendar 2020 shows 6 fatal crashes and 2 construction worker fatalities.
Exhibit 14
Work Zone Crashes and Fatalities Calendar 2015-2019
Source: State Highway Administration; Department of Legislative Services
0
2
4
6
8
10
12
14
16
18
0
200
400
600
800
1,000
1,200
1,400
1,600
1,800
2015 2016 2017 2018 2019
Property Damage-only Crashes Injury Crashes
Fatal Crashes Construction Worker Fatalities
Nonworker Fatalities
Cra
shes
Fata
lities
J00B01 – MDOT – State Highway Administration
Analysis of the FY 2023 Maryland Executive Budget, 2022
25
2. Should Use of Congestion Pricing in Maryland Be Expanded?
A key component of the Op Lanes Maryland project is the use of congestion pricing, in the form
of dynamic tolling, to manage congestion and maintain minimum speed levels through the project
corridor. Dynamic tolling is a system where toll rates rise as congestion increases and fall when
congestion decreases (generally within defined minimum and maximum levels). According to the
Federal Highway Administration (FHWA), there are three main types of pricing strategies that have
been implemented or are being considered in the Unites States:
Variable Priced Lanes: variable tolls on separated lanes within a highway such as express toll
lanes or high-occupancy toll lanes;
Variable Pricing on Entire Facilities: implemented on toll roads and bridges; and
Cordon Charges: charges to drive within or into a congested area.
Congestion pricing could be used to eliminate or reduce the need to build some roads and
bridges around the State. For example, implementing dynamic tolling on the Bay Bridge could help
address the perennial backups that occur each summer, particularly around weekends, and delay the
need to build an additional Chesapeake Bay crossing. New York City is the first city in the United States
to propose cordon charges which, if successful, could serve as a model for other urban centers to
consider in addressing congestion.
While congestion pricing may be a good tool for addressing congestion, its use can have
negative impacts, especially for low-income commuters who cannot afford peak congestion pricing
rates but are unable to shift their travel times to non-peak hours. Negative impacts could be mitigated
through the use of income-based subsidies or improved public transit service as an alternative to driving
a private vehicle on a facility or into an area in which congestion pricing is in use.
Congestion pricing could also provide a revenue stream beyond that needed to maintain the toll
facility or cordon area that could be used to improve public transit options or used in other ways to
mitigate the impacts that emissions from the transportation sector have on the climate.
MDOT should:
comment on how congestion pricing could be used throughout the State to mitigate traffic
congestion;
provide a list of existing roads/facilities/areas to which congestion pricing could be added
under the State’s authority;
identify changes to State law that would be required to enable the use of congestion pricing
for existing roads and facilities;
J00B01 – MDOT – State Highway Administration
Analysis of the FY 2023 Maryland Executive Budget, 2022
26
indicate facilities for which congestion pricing is prohibited under federal laws and
regulations and whether the State could apply for a waiver of any federal law or
regulation; and
identify policy considerations that should be addressed in implementing congestion
pricing on a wide-scale basis.
3. Phase 1 of the Managed Toll Lanes Project Progressing
Predevelopment work for Phase 1 South of the I-495/I-270 managed toll lanes project, which
SHA and the Maryland Transportation Authority (MDTA) together as the reporting agencies have
rebranded as “Op Lanes Maryland,” is underway and focused on avoiding and minimizing impacts to
property, utilities, and environmental resources and the procurement of the design-builder. Procurement
of the design-builder is anticipated to be complete in spring 2022.
The environmental review under the federal National Environmental Policy Act is expected to
conclude in early summer 2022 with the issuance of a record of decision by FHWA identifying the
preferred alternative and the mitigation measures that must be adhered to by the project sponsors in
constructing the project. Public comment closed on the Supplemental Draft Environmental Impact
Statement (SDEIS) that was issued in October 2021. The SDEIS narrowed the limits of the
environmental review to the Phase 1 South corridor, which extends from near the George Washington
Memorial Parkway in Virginia, across the American Legion Bridge, and up I-270 to I-370. The full
Phase 1 corridor extends all the way north on I-270 to I-70 in Frederick.
SHA/MDTA expect to have a committed section proposal to construct Phase 1 South under a
Section Public-private Partnership (P3) Agreement by late spring 2022 with MDTA board and public
and legislative review occurring in summer 2022 and Board of Public Works (BPW) consideration of
approval by early fall 2022. If approved by BPW, the Section P3 Agreement for Phase 1 South would
be executed before the end of calendar 2022.
A protest against the award of the Phase 1 P3 contract to Accelerate Maryland Partners was
filed by Capital Express Mobility Partners (CEMP). The protest was denied by the contracting officer,
and an appeal of that decision was denied by the MDOT Secretary’s designee. CEMP filed a Petition
for Writ of Administrative Mandamus in the Circuit Court for Montgomery County in September 2021.
On February 17, 2022, the court ruled that three of the four arguments filed by the bid challenger had
been filed on time, which means that MDOT must now consider the protest on the merits of the
three arguments.
MDOT should update the committees on the status of the bid protest, the likely timing for
MDOT consideration of and determination on the elements of the protest ruled by the court to
be timely, if the court ruling has any immediate impact on the work being done under the phase
development agreement that is the subject of the protest, and whether the project schedule will
be modified to allow for the resolution of the protest before moving forward with procurement
of the construction for Phase 1 South.
J00B01 – MDOT – State Highway Administration
Analysis of the FY 2023 Maryland Executive Budget, 2022
27
4. Infrastructure Investment and Jobs Act Increases Funding for Existing
Transportation Programs and Creates Several New Programs
The Infrastructure Investment and Jobs Act (IIJA), which was signed into law on
November 15, 2021, provides $1.2 trillion for transportation and nontransportation infrastructure and
reauthorizes the surface transportation program previously authorized under the Fixing America’s
Surface Transportation (FAST) Act. Approximately $550 billion of the funds provided through the
IIJA represent new or increased funding with the remainder representing continuation of funding. For
transportation, the IIJA provides $567.1 billion over federal fiscal 2022 to 2026 with $284 billion
comprising new funding.
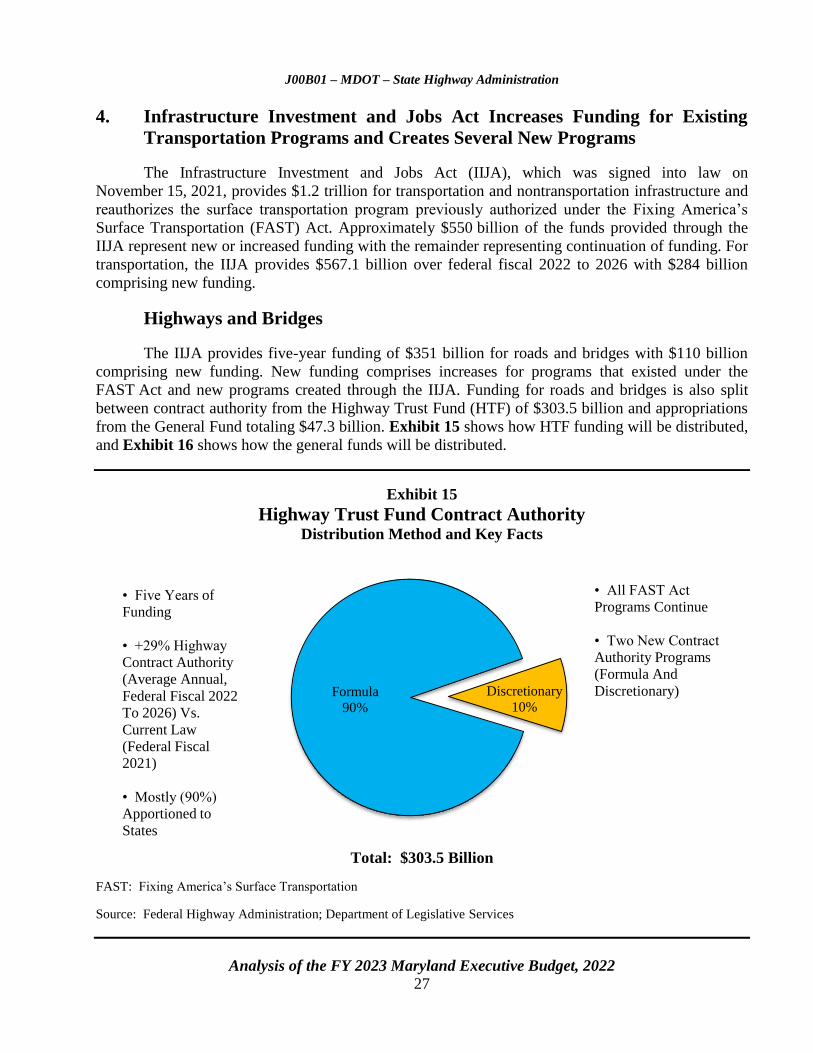
Highways and Bridges
The IIJA provides five-year funding of $351 billion for roads and bridges with $110 billion
comprising new funding. New funding comprises increases for programs that existed under the
FAST Act and new programs created through the IIJA. Funding for roads and bridges is also split
between contract authority from the Highway Trust Fund (HTF) of $303.5 billion and appropriations
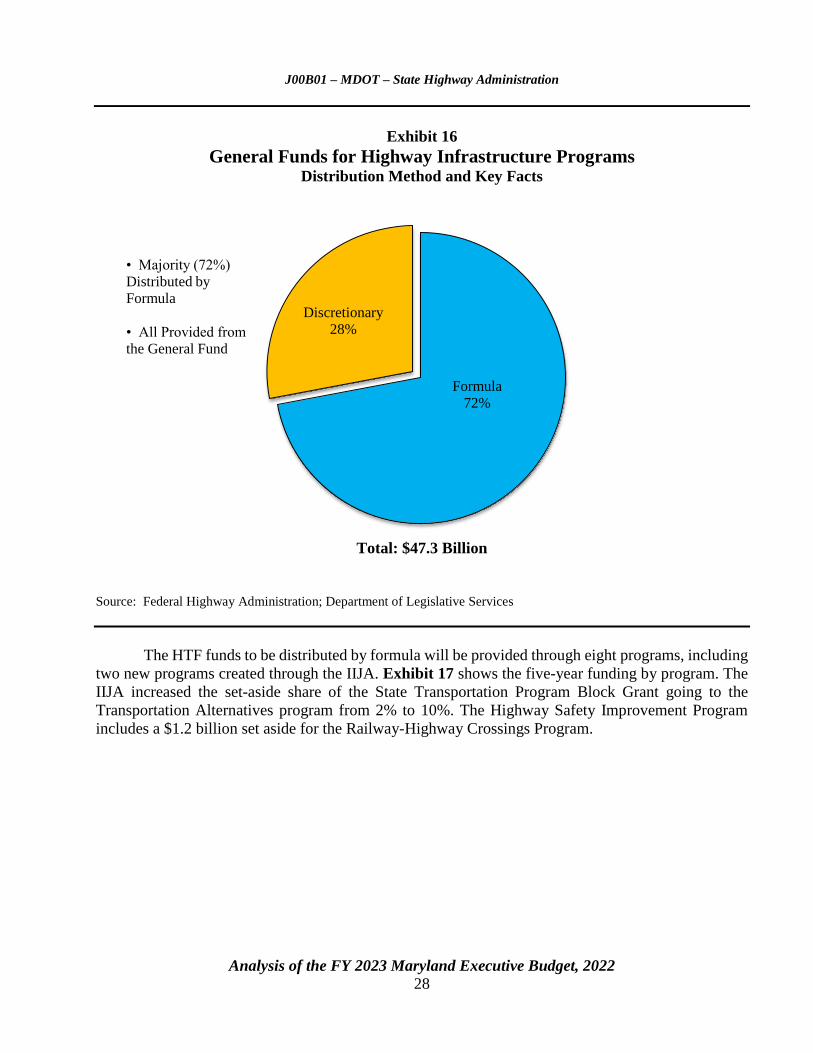
from the General Fund totaling $47.3 billion. Exhibit 15 shows how HTF funding will be distributed,
and Exhibit 16 shows how the general funds will be distributed.
Exhibit 15
Highway Trust Fund Contract Authority Distribution Method and Key Facts
Total: $303.5 Billion
FAST: Fixing America’s Surface Transportation
Source: Federal Highway Administration; Department of Legislative Services
Formula
90%
Discretionary
10%
• Five Years of
Funding
• +29% Highway
Contract Authority
(Average Annual,
Federal Fiscal 2022
To 2026) Vs.
Current Law
(Federal Fiscal
2021)
• Mostly (90%)
Apportioned to
States
• All FAST Act
Programs Continue
• Two New Contract
Authority Programs
(Formula And
Discretionary)
J00B01 – MDOT – State Highway Administration
Analysis of the FY 2023 Maryland Executive Budget, 2022
28
Exhibit 16
General Funds for Highway Infrastructure Programs Distribution Method and Key Facts
Total: $47.3 Billion
Source: Federal Highway Administration; Department of Legislative Services
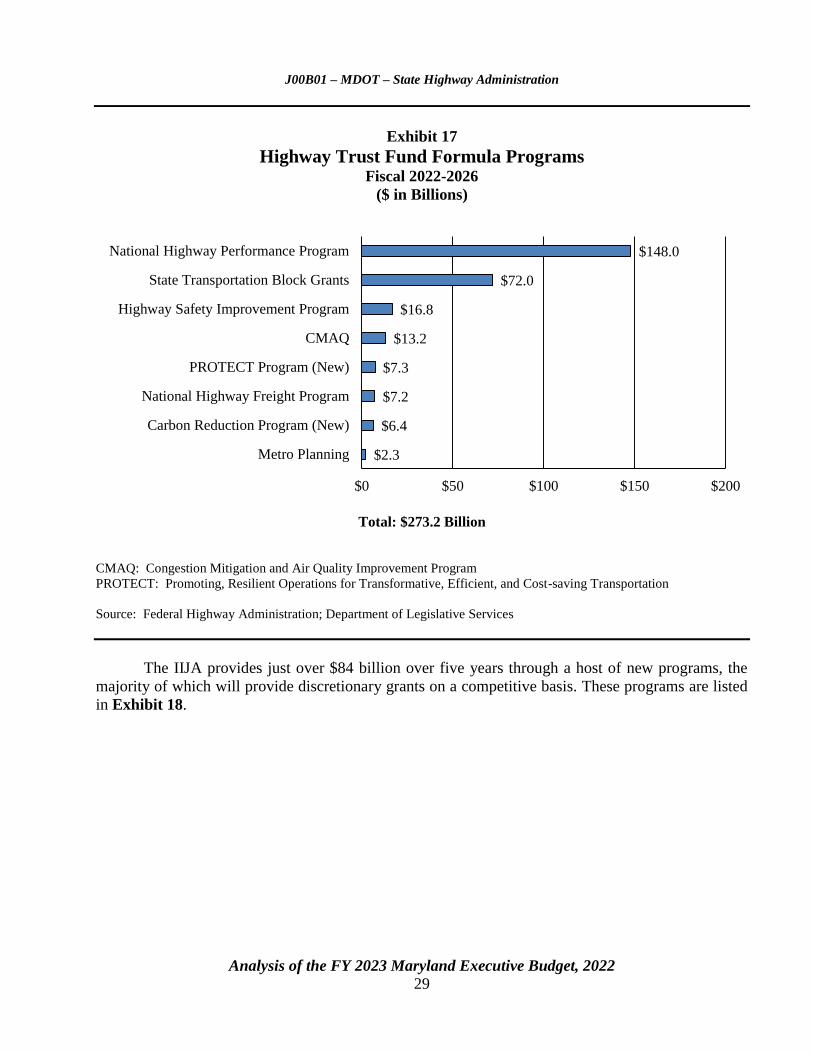
The HTF funds to be distributed by formula will be provided through eight programs, including
two new programs created through the IIJA. Exhibit 17 shows the five-year funding by program. The
IIJA increased the set-aside share of the State Transportation Program Block Grant going to the
Transportation Alternatives program from 2% to 10%. The Highway Safety Improvement Program
includes a $1.2 billion set aside for the Railway-Highway Crossings Program.
Formula
72%
Discretionary
28%
• Majority (72%)
Distributed by
Formula
• All Provided from
the General Fund
J00B01 – MDOT – State Highway Administration
Analysis of the FY 2023 Maryland Executive Budget, 2022
29
Exhibit 17
Highway Trust Fund Formula Programs Fiscal 2022-2026
($ in Billions)
Total: $273.2 Billion
CMAQ: Congestion Mitigation and Air Quality Improvement Program
PROTECT: Promoting, Resilient Operations for Transformative, Efficient, and Cost-saving Transportation
Source: Federal Highway Administration; Department of Legislative Services
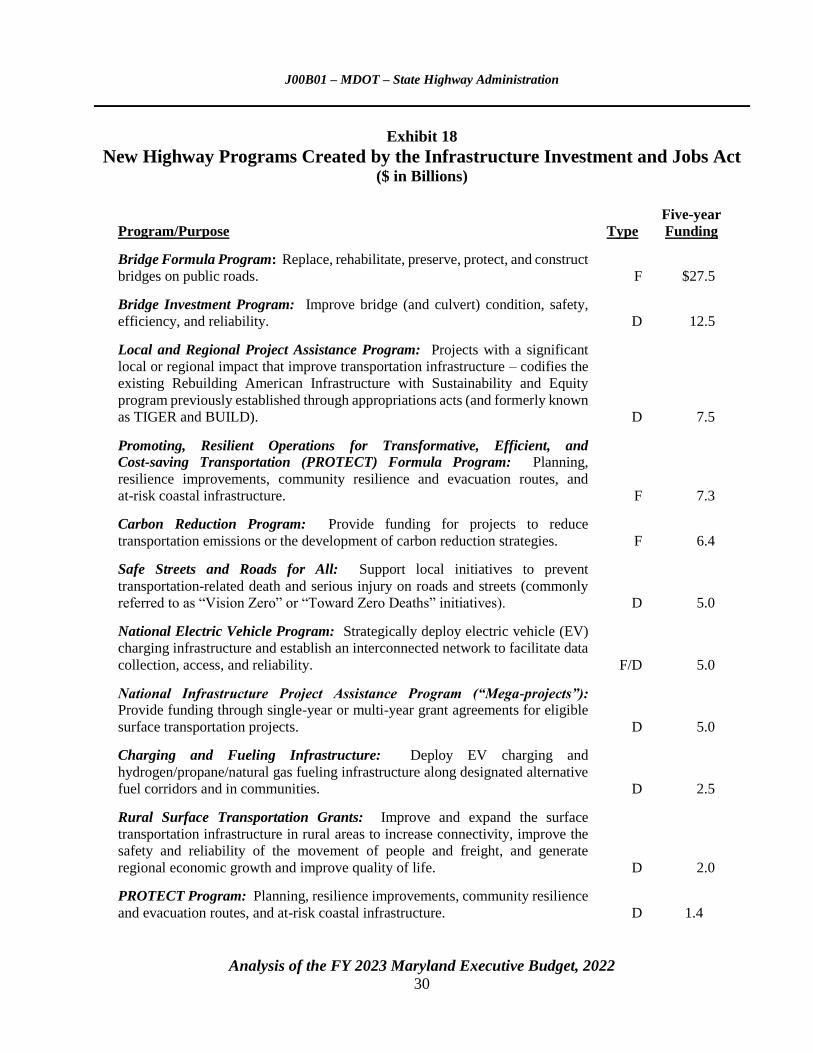
The IIJA provides just over $84 billion over five years through a host of new programs, the
majority of which will provide discretionary grants on a competitive basis. These programs are listed
in Exhibit 18.
$2.3
$6.4
$7.2
$7.3
$13.2
$16.8
$72.0
$148.0
$0 $50 $100 $150 $200
Metro Planning
Carbon Reduction Program (New)
National Highway Freight Program
PROTECT Program (New)
CMAQ
Highway Safety Improvement Program
State Transportation Block Grants
National Highway Performance Program
J00B01 – MDOT – State Highway Administration
Analysis of the FY 2023 Maryland Executive Budget, 2022
30
Exhibit 18
New Highway Programs Created by the Infrastructure Investment and Jobs Act ($ in Billions)
Program/Purpose Type
Five-year
Funding
Bridge Formula Program: Replace, rehabilitate, preserve, protect, and construct
bridges on public roads. F $27.5
Bridge Investment Program: Improve bridge (and culvert) condition, safety,
efficiency, and reliability. D 12.5
Local and Regional Project Assistance Program: Projects with a significant
local or regional impact that improve transportation infrastructure – codifies the
existing Rebuilding American Infrastructure with Sustainability and Equity
program previously established through appropriations acts (and formerly known
as TIGER and BUILD). D 7.5
Promoting, Resilient Operations for Transformative, Efficient, and
Cost-saving Transportation (PROTECT) Formula Program: Planning,
resilience improvements, community resilience and evacuation routes, and
at-risk coastal infrastructure. F 7.3
Carbon Reduction Program: Provide funding for projects to reduce
transportation emissions or the development of carbon reduction strategies. F 6.4
Safe Streets and Roads for All: Support local initiatives to prevent
transportation-related death and serious injury on roads and streets (commonly
referred to as “Vision Zero” or “Toward Zero Deaths” initiatives). D 5.0
National Electric Vehicle Program: Strategically deploy electric vehicle (EV)
charging infrastructure and establish an interconnected network to facilitate data
collection, access, and reliability. F/D 5.0
National Infrastructure Project Assistance Program (“Mega-projects”): Provide funding through single-year or multi-year grant agreements for eligible
surface transportation projects. D 5.0
Charging and Fueling Infrastructure: Deploy EV charging and
hydrogen/propane/natural gas fueling infrastructure along designated alternative
fuel corridors and in communities. D 2.5
Rural Surface Transportation Grants: Improve and expand the surface
transportation infrastructure in rural areas to increase connectivity, improve the
safety and reliability of the movement of people and freight, and generate
regional economic growth and improve quality of life. D 2.0
PROTECT Program: Planning, resilience improvements, community resilience
and evacuation routes, and at-risk coastal infrastructure. D 1.4
J00B01 – MDOT – State Highway Administration
Analysis of the FY 2023 Maryland Executive Budget, 2022
31
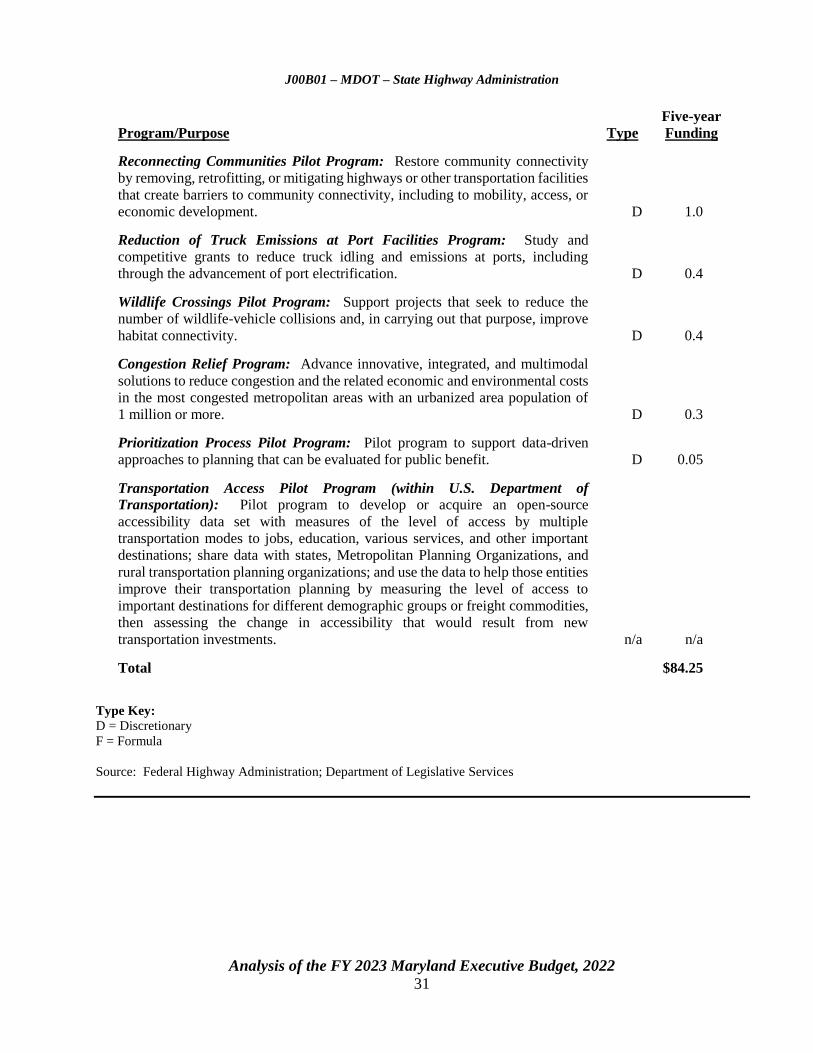
Program/Purpose Type
Five-year
Funding
Reconnecting Communities Pilot Program: Restore community connectivity
by removing, retrofitting, or mitigating highways or other transportation facilities
that create barriers to community connectivity, including to mobility, access, or
economic development. D 1.0
Reduction of Truck Emissions at Port Facilities Program: Study and
competitive grants to reduce truck idling and emissions at ports, including
through the advancement of port electrification. D 0.4
Wildlife Crossings Pilot Program: Support projects that seek to reduce the
number of wildlife-vehicle collisions and, in carrying out that purpose, improve
habitat connectivity. D 0.4
Congestion Relief Program: Advance innovative, integrated, and multimodal
solutions to reduce congestion and the related economic and environmental costs
in the most congested metropolitan areas with an urbanized area population of
1 million or more. D 0.3
Prioritization Process Pilot Program: Pilot program to support data-driven
approaches to planning that can be evaluated for public benefit. D 0.05
Transportation Access Pilot Program (within U.S. Department of
Transportation): Pilot program to develop or acquire an open-source
accessibility data set with measures of the level of access by multiple
transportation modes to jobs, education, various services, and other important
destinations; share data with states, Metropolitan Planning Organizations, and
rural transportation planning organizations; and use the data to help those entities
improve their transportation planning by measuring the level of access to
important destinations for different demographic groups or freight commodities,
then assessing the change in accessibility that would result from new
transportation investments. n/a n/a
Total $84.25
Type Key:
D = Discretionary
F = Formula
Source: Federal Highway Administration; Department of Legislative Services
J00B01 – MDOT – State Highway Administration
Analysis of the FY 2023 Maryland Executive Budget, 2022
32
Operating Budget Recommended Actions
1. Concur with Governor’s allowance.
PAYGO Budget Recommended Actions
1. Concur with Governor’s allowance.
J00B01 – MDOT – MDOT State Highway Administration
Analysis of the FY 2023 Maryland Executive Budget, 2022
33
Appendix 1
2021 Joint Chairmen’s Report Responses from Agency
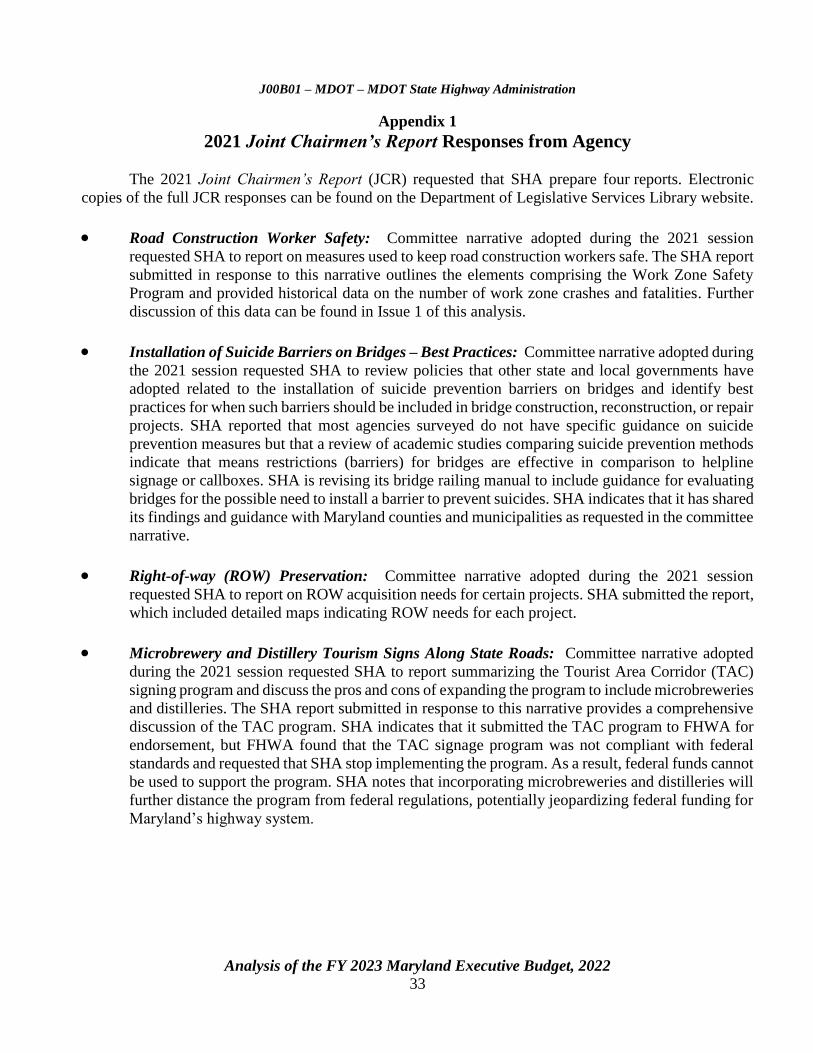
The 2021 Joint Chairmen’s Report (JCR) requested that SHA prepare four reports. Electronic
copies of the full JCR responses can be found on the Department of Legislative Services Library website.
Road Construction Worker Safety: Committee narrative adopted during the 2021 session
requested SHA to report on measures used to keep road construction workers safe. The SHA report
submitted in response to this narrative outlines the elements comprising the Work Zone Safety
Program and provided historical data on the number of work zone crashes and fatalities. Further
discussion of this data can be found in Issue 1 of this analysis.
Installation of Suicide Barriers on Bridges – Best Practices: Committee narrative adopted during
the 2021 session requested SHA to review policies that other state and local governments have
adopted related to the installation of suicide prevention barriers on bridges and identify best
practices for when such barriers should be included in bridge construction, reconstruction, or repair
projects. SHA reported that most agencies surveyed do not have specific guidance on suicide
prevention measures but that a review of academic studies comparing suicide prevention methods
indicate that means restrictions (barriers) for bridges are effective in comparison to helpline
signage or callboxes. SHA is revising its bridge railing manual to include guidance for evaluating
bridges for the possible need to install a barrier to prevent suicides. SHA indicates that it has shared
its findings and guidance with Maryland counties and municipalities as requested in the committee
narrative.
Right-of-way (ROW) Preservation: Committee narrative adopted during the 2021 session
requested SHA to report on ROW acquisition needs for certain projects. SHA submitted the report,
which included detailed maps indicating ROW needs for each project.
Microbrewery and Distillery Tourism Signs Along State Roads: Committee narrative adopted
during the 2021 session requested SHA to report summarizing the Tourist Area Corridor (TAC)
signing program and discuss the pros and cons of expanding the program to include microbreweries
and distilleries. The SHA report submitted in response to this narrative provides a comprehensive
discussion of the TAC program. SHA indicates that it submitted the TAC program to FHWA for
endorsement, but FHWA found that the TAC signage program was not compliant with federal
standards and requested that SHA stop implementing the program. As a result, federal funds cannot
be used to support the program. SHA notes that incorporating microbreweries and distilleries will
further distance the program from federal regulations, potentially jeopardizing federal funding for
Maryland’s highway system.
J00B01 – MDOT – MDOT State Highway Administration
Analysis of the FY 2023 Maryland Executive Budget, 2022
34
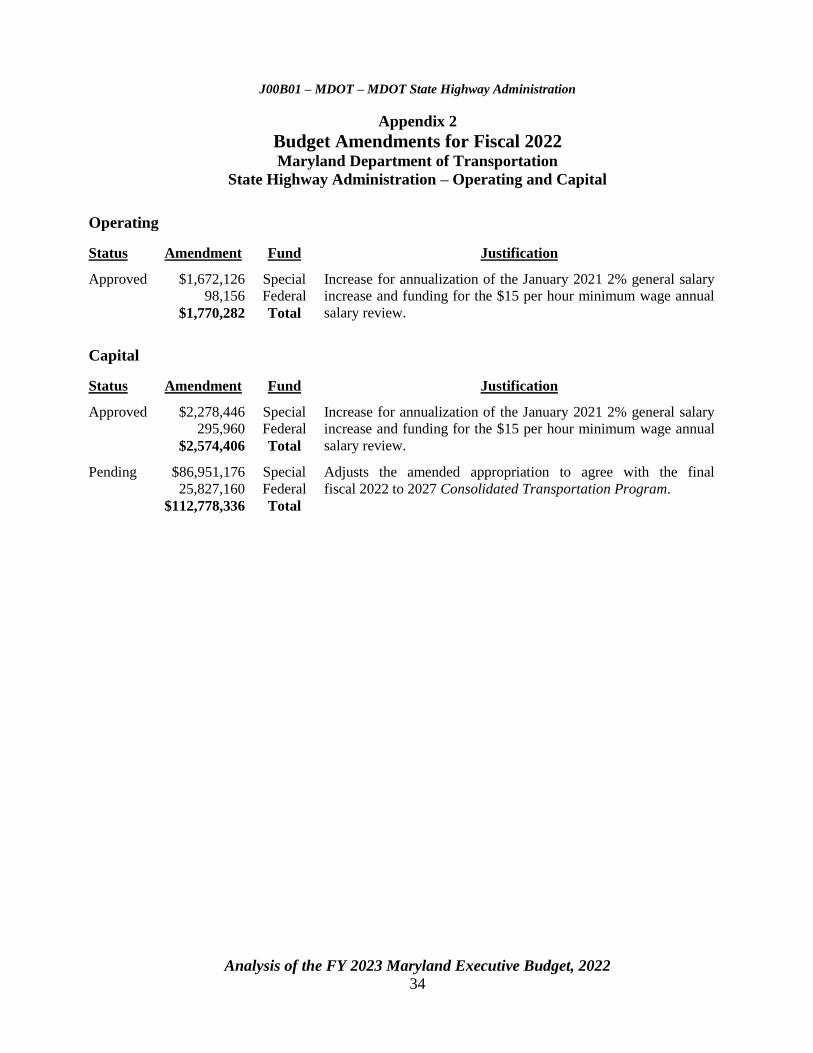
Appendix 2
Budget Amendments for Fiscal 2022 Maryland Department of Transportation
State Highway Administration – Operating and Capital
Operating
Status Amendment Fund Justification Approved $1,672,126
98,156
$1,770,282
Special
Federal
Total
Increase for annualization of the January 2021 2% general salary
increase and funding for the $15 per hour minimum wage annual
salary review.
Capital
Status Amendment Fund Justification Approved $2,278,446
295,960
$2,574,406
Special
Federal
Total
Increase for annualization of the January 2021 2% general salary
increase and funding for the $15 per hour minimum wage annual
salary review. Pending $86,951,176
25,827,160
$112,778,336
Special
Federal
Total
Adjusts the amended appropriation to agree with the final
fiscal 2022 to 2027 Consolidated Transportation Program.
An
alysis o
f the F
Y 2
023 M
aryla
nd E
xecu
tive Bu
dget, 2
02
2
35
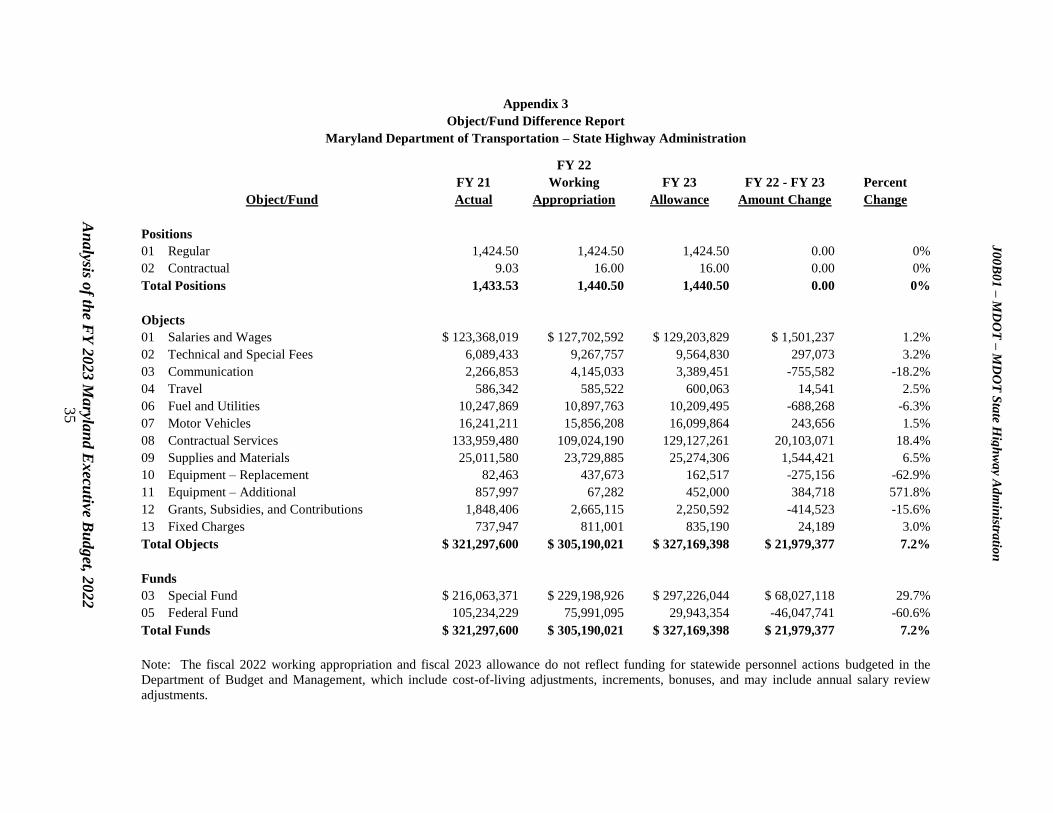
Appendix 3
Object/Fund Difference Report
Maryland Department of Transportation – State Highway Administration
FY 22
FY 21 Working FY 23 FY 22 - FY 23 Percent
Object/Fund Actual Appropriation Allowance Amount Change Change
Positions
01 Regular 1,424.50 1,424.50 1,424.50 0.00 0%
02 Contractual 9.03 16.00 16.00 0.00 0%
Total Positions 1,433.53 1,440.50 1,440.50 0.00 0%
Objects
01 Salaries and Wages $ 123,368,019 $ 127,702,592 $ 129,203,829 $ 1,501,237 1.2%
02 Technical and Special Fees 6,089,433 9,267,757 9,564,830 297,073 3.2%
03 Communication 2,266,853 4,145,033 3,389,451 -755,582 -18.2%
04 Travel 586,342 585,522 600,063 14,541 2.5%
06 Fuel and Utilities 10,247,869 10,897,763 10,209,495 -688,268 -6.3%
07 Motor Vehicles 16,241,211 15,856,208 16,099,864 243,656 1.5%
08 Contractual Services 133,959,480 109,024,190 129,127,261 20,103,071 18.4%
09 Supplies and Materials 25,011,580 23,729,885 25,274,306 1,544,421 6.5%
10 Equipment – Replacement 82,463 437,673 162,517 -275,156 -62.9%
11 Equipment – Additional 857,997 67,282 452,000 384,718 571.8%
12 Grants, Subsidies, and Contributions 1,848,406 2,665,115 2,250,592 -414,523 -15.6%
13 Fixed Charges 737,947 811,001 835,190 24,189 3.0%
Total Objects $ 321,297,600 $ 305,190,021 $ 327,169,398 $ 21,979,377 7.2%
Funds
03 Special Fund $ 216,063,371 $ 229,198,926 $ 297,226,044 $ 68,027,118 29.7%
05 Federal Fund 105,234,229 75,991,095 29,943,354 -46,047,741 -60.6%
Total Funds $ 321,297,600 $ 305,190,021 $ 327,169,398 $ 21,979,377 7.2%
Note: The fiscal 2022 working appropriation and fiscal 2023 allowance do not reflect funding for statewide personnel actions budgeted in the
Department of Budget and Management, which include cost-of-living adjustments, increments, bonuses, and may include annual salary review
adjustments.
J0
0B
01
– M
DO
T –
MD
OT
Sta
te Hig
hw
ay A
dm
inistra
tion
An
alysis o
f the F
Y 2
02
3 M
aryla
nd E
xecu
tive Bu
dget, 2
02
2
36
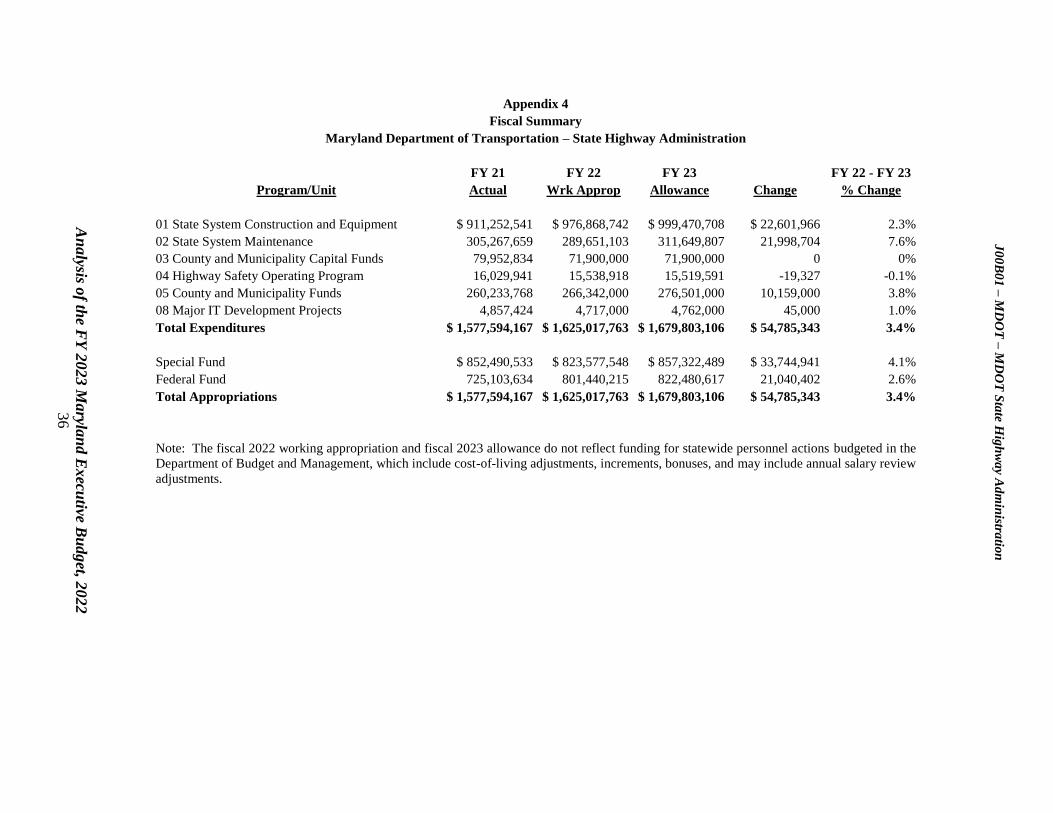
Appendix 4
Fiscal Summary
Maryland Department of Transportation – State Highway Administration
FY 21 FY 22 FY 23 FY 22 - FY 23
Program/Unit Actual Wrk Approp Allowance Change % Change
01 State System Construction and Equipment $ 911,252,541 $ 976,868,742 $ 999,470,708 $ 22,601,966 2.3%
02 State System Maintenance 305,267,659 289,651,103 311,649,807 21,998,704 7.6%
03 County and Municipality Capital Funds 79,952,834 71,900,000 71,900,000 0 0%
04 Highway Safety Operating Program 16,029,941 15,538,918 15,519,591 -19,327 -0.1%
05 County and Municipality Funds 260,233,768 266,342,000 276,501,000 10,159,000 3.8%
08 Major IT Development Projects 4,857,424 4,717,000 4,762,000 45,000 1.0%
Total Expenditures $ 1,577,594,167 $ 1,625,017,763 $ 1,679,803,106 $ 54,785,343 3.4%
Special Fund $ 852,490,533 $ 823,577,548 $ 857,322,489 $ 33,744,941 4.1%
Federal Fund 725,103,634 801,440,215 822,480,617 21,040,402 2.6%
Total Appropriations $ 1,577,594,167 $ 1,625,017,763 $ 1,679,803,106 $ 54,785,343 3.4%
Note: The fiscal 2022 working appropriation and fiscal 2023 allowance do not reflect funding for statewide personnel actions budgeted in the
Department of Budget and Management, which include cost-of-living adjustments, increments, bonuses, and may include annual salary review
adjustments.
J0
0B
01
– M
DO
T –
MD
OT
Sta
te Hig
hw
ay A
dm
inistra
tion