water quality of the presumpscot river: cummulative effects study
47
WATER QUALITY OF THE PRESUMPSCOT RIVER: CUMMULATIVE EFFECTS STUDY By Barry Mower, PhD Maine Department of Environmental Protection October 21, 2010
-
Upload
khangminh22 -
Category
Documents
-
view
4 -
download
0
Transcript of water quality of the presumpscot river: cummulative effects study

WATER QUALITY OF THE
PRESUMPSCOT RIVER:
CUMMULATIVE EFFECTS
STUDY
By Barry Mower, PhD
Maine Department of Environmental Protection
October 21, 2010

22
HISTORICAL USE OF MAINE RIVERS
NATIVE AMERICANS- FOOD & WATER, TRAVEL, TRADE, CULTURAL CEREMONIES
1500-1600s- EXPLORATION, TRAVEL, TRADE, SETTLEMENT
1700-1800s- MUNICIPAL DRINKING WATER, LOCAL COMMERCE, SHIPPING, WATER POWER, ICE CUTTING
1900s- HYDROELECTRIC POWER, INDUSTRIAL/MUNICIPAL WATER SUPPLY & WASTE DISPOSAL, LOG DRIVES
2000- HYDROPOWER, IRRIGATION, ECONOMIC DEVELOPMENT,
RECREATION & AESTHETIC/SPIRITUAL, WATER SUPPLY?


44
US CLEAN WATER ACTUS CLEAN WATER ACT
SENATOR EDMUND S MUSKIESENATOR EDMUND S MUSKIE
FATHER OF THE CWAFATHER OF THE CWA
GOAL: RESTORE & MAINTAIN PHYSICAL, GOAL: RESTORE & MAINTAIN PHYSICAL, CHEMICAL, BIOLOGICAL INTEGRITYCHEMICAL, BIOLOGICAL INTEGRITY
OBJECTIVES: OBJECTIVES:
TREATMENT OF ALL DISCHARGESTREATMENT OF ALL DISCHARGES
FISHABLE/SWIMMABLE FISHABLE/SWIMMABLE
ZERO DISCHARGE ZERO DISCHARGE

55
MAINE WATER CLASSIFICATION PROGRAM
GENERAL PROVISIONS –
NO DISCHARGE OF COLOR, TASTE, TURBIDITY, TOXICITY, RADIOACTIVITY, PH, UNTREATED WASTE, DA<10 MI2
CLASSIFICATIONS –RIVERS AA, A, B, C - LAKES GPA CLASSIFICATION STANDARDS-
DESIGNATED USES CRITERIA,
ANTIDEGRADATION

66
FISHABLEFISHABLE
DESIGNATED USES: CLASS C RIVERSDESIGNATED USES: CLASS C RIVERS
HABITAT FOR FISH & OTHER AQUATIC LIFEHABITAT FOR FISH & OTHER AQUATIC LIFE
SUPPORT INDIGENOUS SPECIES OF FISHSUPPORT INDIGENOUS SPECIES OF FISH
MAINTAIN THE STRUCTURE & FUNCTION OF MAINTAIN THE STRUCTURE & FUNCTION OF
THE RESIDENT BIOLOGICAL COMMUNITYTHE RESIDENT BIOLOGICAL COMMUNITY

77
SUPPORT SUPPORT
INDIGENOUS SPECIES OF FISHINDIGENOUS SPECIES OF FISH
SURVIVALSURVIVAL
GROWTHGROWTH
REPRODUCTIONREPRODUCTION
FISH HEALTHFISH HEALTH

88
DEP PROGRAMSDEP PROGRAMS
GOAL: FISHABLE/SWIMMABLEGOAL: FISHABLE/SWIMMABLE
CURRENT: AWQC, WET, BIOMONITORING, SWATCURRENT: AWQC, WET, BIOMONITORING, SWAT
LIMITATION: DETECT ONLY GROSS LIMITATION: DETECT ONLY GROSS DISTURBANCESDISTURBANCES
NEW: EFFECTS DRIVEN CUMMULATIVE NEW: EFFECTS DRIVEN CUMMULATIVE EFFECTS ASSESSMENT OF FISH EFFECTS ASSESSMENT OF FISH POPULATIONSPOPULATIONS-- CEACEA


• EDs Endocrine Disruptors
• EDCs Endocrine Disrupting Chemicals
• ECs Emerging Contaminants
• CECs Contaminant of Emerging Concern
• PBTs Persistent, Bioaccumulative, & Toxic
• POPs Persistent Organic Pollutants
• PPCPs Pharmaceuticals & Personal Care
Products
ACRONYMS

ENDOCRINE DISRUPTION
• NEW NAME FOR SOME WELL KNOWN
CHEMICAL EFFECTS
• DichloroDiphenylTrichloroethane

NEWLY DISCOVERED EDCs
• EE2 ethinylestradiol
• APE’s - alkyl phenyl ethoxylates, NPE
• BFRs - PBDEs
• BPA bisphenol A
• PESTICIDES
• PHTHALATEs

ENDOCRINE DISRUPTORS
• HPG -AXIS
– ESTROGENS AND ANTI-ESTROGENS
– ANDROGENS AND ANTI-ANDROGENS
• HPT AXIS
– THYROID MODULATORS
• OTHERS
– STRESS REACTION, OSMOTIC HOMEOSTASIS

SOURCES
• There are about 90 prescription pills,
creams and injections that contain
estrogen and its sister compounds
according to the University of Maryland
School of Medicine.

EPA’s 9 POTW STUDY
http://www.epa.gov/waterscience/ppcp/studies/9potwstudy.pdf

UMO EFFLUENT STUDIES
• Dr. Greg Mayer, UMO
• Studies of 3 effluents
• In vitro study of MVLN Cell Exposure and Luminescence Assay measuring vitellogenin expression
• In vivo study of transcription of hepatic vitellogenin mRNA in zebrafish

MVLN Luminescence 72hour exposure - Grab Sample Effluent
Media 10nM E2 Fish RoomOrono Old Town
Bangor
RL
U/m
g*m
l-1
pro
tein
0
200
400
600
800
1000
August 2006
October 2006
November 2006
December 2006
January 2007
February 2007
*
*
*
*
*
**
*
*
*
*
*
*
*
*
*

Adult male zebrafish7 day grab sample effluent exposure
vitellogenin -1
Treatment Plant
Orono WWTP Old Town WWTP Bangor WWTP
Re
lative
Fo
ld C
ha
ng
e in
He
pa
tic T
ran
scrip
t
100
200
10000
12000
October 2006
November 2006
December 2006
January 2007
February 2007
*
**
**
*
*** *
*
*
*

1919
CEA EFFECTSCEA EFFECTS--DRIVENDRIVEN
CUMMULATIVE EFFECTS ASSESSMENTCUMMULATIVE EFFECTS ASSESSMENT
FIELD STUDIES IN SCANDANAVIA, CANADA, UK, FIELD STUDIES IN SCANDANAVIA, CANADA, UK,
US, NEW ZEALAND, INDIA, S AMERICAUS, NEW ZEALAND, INDIA, S AMERICA
BIOMARKERS AND POPULATION INDICESBIOMARKERS AND POPULATION INDICES
DISCHARGES FROM STPs AND PULP AND PAPER DISCHARGES FROM STPs AND PULP AND PAPER
MILLS DISRUPTED REPRODUCTION IN FISHMILLS DISRUPTED REPRODUCTION IN FISH
LAB STUDIES HAVE SHOWN SIMILAR EFFECTSLAB STUDIES HAVE SHOWN SIMILAR EFFECTS

2020
METABOLIC DISRUPTION PATTERN METABOLIC DISRUPTION PATTERN (CHANGE IN CHEMICAL OR ENERGY RESOURCES)(CHANGE IN CHEMICAL OR ENERGY RESOURCES)
BIOMARKERS: MFO (P450, CYP1A) BIOMARKERS: MFO (P450, CYP1A)
VTG (VITELLOGENIN)VTG (VITELLOGENIN)
POPULATION INDICESPOPULATION INDICES
(ALTERED ENERGY STORAGE & UTILIZATION)(ALTERED ENERGY STORAGE & UTILIZATION)
DECREASED REPRODUCTIONDECREASED REPRODUCTION
GSI (GONAD SIZE) & CSS (SEX STEROIDS)GSI (GONAD SIZE) & CSS (SEX STEROIDS)
DELAYED MATURATION & INCREASED AGEDELAYED MATURATION & INCREASED AGE
INTERSEXINTERSEX
CHANGES IN GROWTH CHANGES IN GROWTH
INCREASED LSI (LIVER SIZE) & K (CONDITION)INCREASED LSI (LIVER SIZE) & K (CONDITION)


Figure 3.3.1a. Mean MFO levels in white sucker from the Presumpscot River above (PWD)
and below (PWB) Westbrook, 2007.
(letters = significant difference from upstream station, p<0.05)
0
200
400
600
800
1000
1200
1400
1600
F F F M M M
PWD PGO PWB PWD PGO PWB
STATION/SEX
MF
O (
pm
ol/m
g/m
in)
a
b

Figure 3.3.1b. Mean levels of MFO in white sucker from the Presumpscot River above (PWD,
PGO) and below (PWB) Westbrook, 2008.
(letters = siginificant differences from upstream station, p<0.05)
0
5
10
15
20
25
30
35
F F F M M M
PWD PGO PWB PWD PGO PWB
STATION/SEX
MF
O (
pm
ol/m
g/m
in)
a
b
a

Figure 3.3.2. Mean levels of circulating sex steroids (testosterone-T and estradiol-E2) in
female white sucker from the Presumpscot River above (PWD, PGO) and below (PWB)
Westbrook, 2007 & 2008). (different letters = significant differences at p<0.05)
0
100
200
300
400
500
600
700
800
T E2 T E2
2007 2007 2008 2008
YEAR/STEROID
VA
LU
E (
pg
/ml)
PWD PGO PWB aba
b
c c
d

Figure 3.3.3. Mean levels of circulating sex steroids (testosterone-T and 11-ketotestosterone-
KT) in male white sucker from the Presumpscot River above (PWD, PGO) and below (PWD)
Westbrook, 2007 & 2008 (letters = significant differences by steroid p<0.05)
0
500
1000
1500
2000
2500
3000
T KT T KT
2007 2007 2008 2008
YEAR, STEROID
VA
LU
E (
pg
/ml)
PWD PGO PWB
a
b
cd
d
e
e
f

Figure 3.3.4. Mean age of white sucker from the Presumpscot River above (PWD, PGO) and
below (PWB) Westbrook, 2007-2009
(letters show significant differences within sex & year, p<0.05)
0
2
4
6
8
10
12
14
F F F M M M
PWD PGO PWB PWD PGO PWB
STATION/SEX
AG
E (
yrs
)
2007 2008 2009a
b
ac
dd
e
ff
g
h
h

Figure 3.3.5. Mean length of white sucker from the Presumpscot River above (PWD, PGO) and
below (PWB) Westbrook, 2007-2009
(letters show significant differences within sex & year, p<0.05)
0
100
200
300
400
500
600
F F F M M M
PWD PGO PWB PWD PGO PWB
STATION/SEX
LE
NG
TH
(m
m)
2007 2008 2009
a
b
c
d
e e
f
g
h
j
k
l
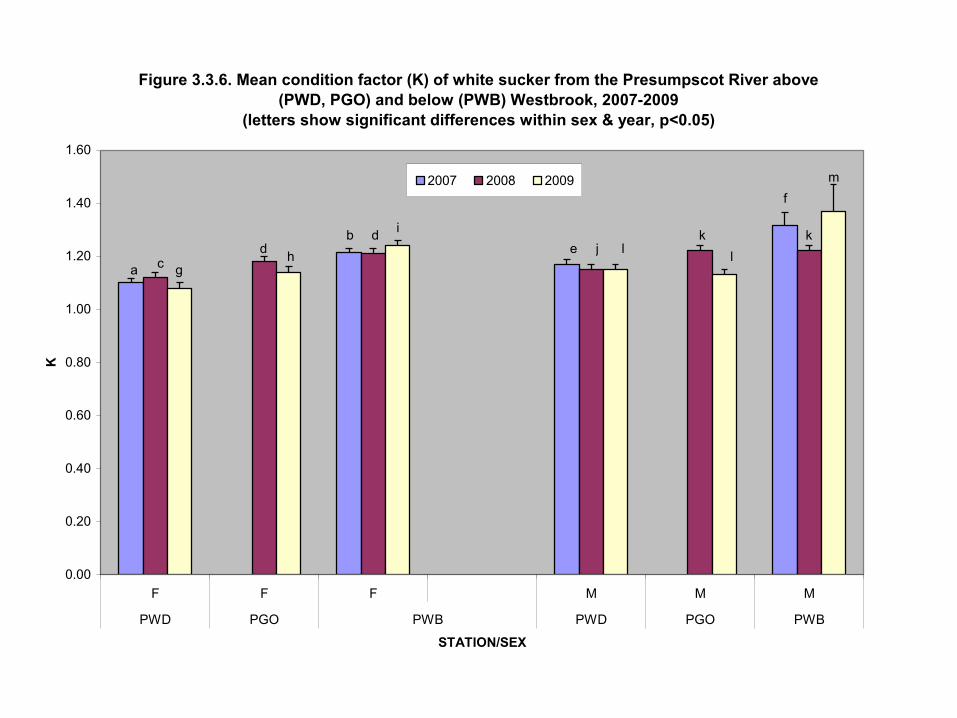
Figure 3.3.6. Mean condition factor (K) of white sucker from the Presumpscot River above
(PWD, PGO) and below (PWB) Westbrook, 2007-2009
(letters show significant differences within sex & year, p<0.05)
0.00
0.20
0.40
0.60
0.80
1.00
1.20
1.40
1.60
F F F M M M
PWD PGO PWB PWD PGO PWB
STATION/SEX
K
2007 2008 2009
a
b
cd
de
k
f
gh
i
jl
kl
m

Figure 3.3.7. Mean GSI in white sucker from the Presumpscot River above (PWD, PGO) and
below (PWB) Westbrook, 2007-2009
(letters show significant differences within sex & year, p<0.05)
0
2
4
6
8
10
12
F F F M M M
PWD PGO PWB PWD PGO PWB
STATION/SEX
GS
I (%
)
2007 2008 2009
a
b
c
d
ee
f
g
h
i
jk
l

Figure 3.3.8. Mean LSI in white sucker from the Presumpscot River above (PWD, PGO) and
below (PWB) Westbrook, 2007-2009.
(letters show significant differences within sex and year, p<0.05)
0.00
0.20
0.40
0.60
0.80
1.00
1.20
1.40
1.60
F F F M M M
PWD PGO PWB PWD PGO PWB
STATION/SEX
LS
I (%
)
2007 2008 2009
a
b
a
c
dd

Figure 3.3.9. Mean percentage of previtellogenic (P), endovitellogenic (E), & vitellogenic (V)
oocytes from female white sucker from the Presumpscot River above (PWD, PGO) and below
(PWB) Westbrook, 2007 & 2008
0%
20%
40%
60%
80%
100%
PWD PWB PWD PGO PWB
2007 2007 2008 2008 2008
YEAR/STATION
%
V
E
P

Figure 3.3.10. Mean size (μm2) of vitellogenic oocytes in female white sucker from the
Presumpscot River above (PWD, PGO) & below (PWB) Westbrook, 2007 & 2008
(different letters show significant differences within years)
0
200000
400000
600000
800000
1000000
1200000
1400000
2007 2008
YEAR
siz
e (
μm
2)
PWD PGO PWBa
b
c

Figure 3.3.11. Mean percentage of spermatocytes, spermatids, spermatozoa in male white
sucker testes from the Presumpscot River above (PWD, PGO) & below (PWB) Westbrook,
2007 & 2008
0%
10%
20%
30%
40%
50%
60%
70%
80%
90%
100%
PWD PWB PWD PGO PWB
2007 2007 2008 2008 2008
YEAR/STATION
%
SPERMATOZOA
SPERMATID
SPERMATOCYTE

Vitellogenin (VTG) in female white sucker plasma from the Presumpscot River, 2007-2008
0
1000
2000
3000
4000
5000
6000
7000
8000
2007 2008
YEAR
VT
G (
mg
/ml)
PWD
PGO
PWB
c
a
b
cd
d

Figure 3.3.13. Mean vitellogenin (VTG) concentrations in male white sucker from the
Presumpscot River above (PWD, PGO) and below (PWD) Westbrook, 2007 & 2008
(different letters show significant differences within years)
0
0.05
0.1
0.15
0.2
0.25
0.3
0.35
0.4
2007 2008
YEAR
VT
G (
ug
/ml)
PWD PGO PWB
a
bab

Table 3.3.2. Catch rates (CPUE) of white sucker from the Presumpscot River
above (PWD, PGO) and below (PWB) Westbrook, 2007-2009
STATION SEX 2007 2008 2009
CPUE CPUE CPUE
#/d/1000ft #/d/1000ft #/d/1000ft
PWD F 28 15 9
PGO F 28 14
PWB F 6 17 3
PWD M 19 16 6
PGO M 14 10
PWB M 1 14 1


Table 3.3.3. Responses of white sucker in the Presumpscot River above (PWD, PGO)
and below (PWB) Westbrook, 2007-2009.
STATION SPECIES sex AGE LENGTH GSI K LSI KSI SSI
Ha: + + - + + + +
2007
PWD WHS F
PWB WHS F 0 0 + + 0 0 0
PWD WHS M
PWB WHS M 0 0 + 0 0 0 0
2008
PWD WHS F
PGO WHS F - - 0 + 0 + 0
PWB WHS F 0 - - 0 0 0 -
PWD/PWB WHS F 0 - - + 0 0 0
PWD WHS M
PGO WHS M - - - + - 0 0
PWB WHS M 0 0 - 0 + 0 0
PWD/PWB WHS M - - - + 0 0 0
2009
PWD WHS F
PGO WHS F - - 0 + 0 0 -
PWB WHS F 0 - 0 - 0 + 0
PWD/PWB WHS F - - 0 + 0 + -
PWD WHS M
PGO WHS M - - - 0 - 0 -
PWB WHS M 0 - + + 0 0 -
PWD/PWB WHS M - - + + - 0 -
+ - 0 = significantly greater, lesser or no different from station above

Table 3.3.1. WATER QUALITY OF THE PENOBSCOT RIVER 2008
STATION FLOW1
BOD1
NITROGEN2
NITROGEN3
PHOSPHORUS2
PHOSPHORUS3
BOD
1000 m3/d kg/d ug/l kg/d ug/l kg/d mg/l
PWD 230 5
PGO
PR1 250 9
WESTBROOK STP 13.0 117 16967 220 3700 48
PR2 355 39
SAPPI 19.2 124 2503 48 437 8.4
PWB PR3 447 53
PWB PR4 350 43
Mill Stream 17.1 650 82 1.2
PWB PR5 350 48
PWB PR6 390 53
Piscataqua R 66 940 26 1.5
PR8 437 61
discharges or tributaries to the river1 mean monthly for 2007-2008
2 mean August 2,4,5, 2008
3 mean monthly flow 2007-2008 X August 2008 nitrogen/phosphorus concentrations X conversion factor.

CONCLUSIONS
• SOME INDIVIDUAL RESPONSES OF ED
• NO ED RESPONSES FOR ALL YEARS
• NO OVERALL PATTERN OF ED
• GROWTH (LENGTH) LOWER BELOW
• CATCH RATES LOWER BELOW
• WQ DATA SHOW EUTROPHICATION
• REDUCED FISH SPECIES RICHNESS, ABUNDANCE, BIOMASS BELOW
• IBI SHOWS REDUCED FITNESS FISH POPULATION
• POSSIBLY DUE TO DISCHARGES, URBAN RUNOFF, HYDROLOGIC CHANNALIZATION


4646
AS RIVERS FLOW FROM SOURCE TO SEA
THEY CHRONICLE THEIR HISTORY
GIVEN THEIR PAST USE & ABUSE
PERHAPS IT IS TIME FOR A CHANGE

Questions?
47