the study on water quality management plan for ganga river in ...
176
JAPAN INTERNATIONAL COOPERATION AGENCY (JICA) NATIONAL RIVER CONSERVATION DIRECTORATE (NRCD) MINISTRY OF ENVIRONMENT AND FORESTS THE STUDY ON WATER QUALITY MANAGEMENT PLAN FOR GANGA RIVER IN THE REPUBLIC OF INDIA FINAL REPORT VOLUME IV FEASIBILITY STUDY FOR PROJECT CITIES VOLUME IV-3 FEASIBILITY STUDY FOR ALLAHABAD CITY PART I SEWERAGE SCHEME JULY 2005 TOKYO ENGINEERING CONSULTANTS CO., LTD. CTI ENGINEERING INTERNATIONAL CO., LTD. No. GE JR 05-038
-
Upload
khangminh22 -
Category
Documents
-
view
1 -
download
0
Transcript of the study on water quality management plan for ganga river in ...
JAPAN INTERNATIONAL COOPERATION AGENCY (JICA) NATIONAL RIVER CONSERVATION DIRECTORATE (NRCD) MINISTRY OF ENVIRONMENT AND FORESTS
THE STUDY ON
WATER QUALITY MANAGEMENT PLAN FOR
GANGA RIVER IN
THE REPUBLIC OF INDIA
FINAL REPORT VOLUME IV FEASIBILITY STUDY FOR PROJECT CITIES VOLUME IV-3 FEASIBILITY STUDY FOR ALLAHABAD CITY
PART I SEWERAGE SCHEME
JULY 2005
TOKYO ENGINEERING CONSULTANTS CO., LTD. CTI ENGINEERING INTERNATIONAL CO., LTD.
No.
GE JR
05-038
JAPAN INTERNATIONAL COOPERATION AGENCY (JICA) NATIONAL RIVER CONSERVATION DIRECTORATE (NRCD) MINISTRY OF ENVIRONMENT AND FORESTS
THE STUDY ON
WATER QUALITY MANAGEMENT PLAN FOR
GANGA RIVER IN
THE REPUBLIC OF INDIA
FINAL REPORT VOLUME IV FEASIBILITY STUDY FOR PROJECT CITIES VOLUME IV-3 FEASIBILITY STUDY FOR ALLAHABAD CITY
PART I SEWERAGE SCHEME
JULY 2005
TOKYO ENGINEERING CONSULTANTS CO., LTD. CTI ENGINEERING INTERNATIONAL CO., LTD.
Foreign Exchange Rate:
Master Plan US$ 1 = JPY 109.09 US$ 1 = Rs 45.33 (As of March 2004)
Feasibility Study
US$ 1 = JPY 103.66 US$ 1 = Rs 43.70 (As of February 2005)
FINAL REPORT ON
WATER QUALITY MANAGEMENT PLAN FOR GANGA RIVER JULY 2005
GENERAL TABLE OF CONTENTS
VOLUME I SUMMARY
VOLUME II RIVER POLLUTION MANAGEMENT PLAN
VOLUME III MASTER PLAN FOR PROJECT CITIES
VOLUME III-1 SEWERAGE MASTER PLAN FOR LUCKNOW CITY
VOLUME III-2 SEWERAGE MASTER PLAN FOR KANPUR CITY
VOLUME III-3 SEWERAGE MASTER PLAN FOR ALLAHABAD CITY
VOLUME III-4 SEWERAGE MASTER PLAN FOR VARANASI CITY
VOLUME III-5 NON-SEWERAGE SCHEME
VOLUME III-6 SOCIAL CONSIDERATION AND HYGIENE EDUCATION PLAN
VOLUME III-7 RECOMMENDATIONS ON SOLID WASTE MANAGEMENT
VOLUME III-8 GIS DATA MANAGEMENT
VOLUME III-9 INSTITUTIONAL DEVELOPMENT PROGRAMME
VOLUME III-10 FINANCIAL AND ECONOMIC EVALUATION
VOLUME III-11 (SUPPORTING REPORT) CASE STUDY OF SEWAGE TREATMENT PLANTS
VOLUME IV FEASIBILITY STUDY FOR PROJECT CITIES
VOLUME IV-1 FEASIBILITY STUDY FOR LUCKNOW CITY PART I SEWERAGE SCHEME
PART II NON-SEWERAGE SCHEME PART III PUBLIC PARTICIPATION AND AWARENESS PROGRAMME PART IV INSTITUTIONAL DEVELOPMENT PROGRAMME PART V ECONOMIC AND FINANCIAL EVALUATION PART VI STAKEHOLDER MEETING PART VII DRAWINGS
VOLUME IV-2 FEASIBILITY STUDY FOR KANPUR CITY PART I SEWERAGE SCHEME
PART II NON-SEWERAGE SCHEME PART III PUBLIC PARTICIPATION AND AWARENESS PROGRAMME PART IV INSTITUTIONAL DEVELOPMENT PROGRAMME PART V ECONOMIC AND FINANCIAL EVALUATION PART VI STAKEHOLDER MEETING PART VII DRAWINGS
VOLUME IV-3 FEASIBILITY STUDY FOR ALLAHABAD CITY
PART I SEWERAGE SCHEME PART II NON-SEWERAGE SCHEME PART III PUBLIC PARTICIPATION AND AWARENESS PROGRAMME PART IV INSTITUTIONAL DEVELOPMENT PROGRAMME PART V ECONOMIC AND FINANCIAL EVALUATION PART VI STAKEHOLDER MEETING PART VII DRAWINGS
VOLUME IV-4 FEASIBILITY STUDY FOR VARANASI CITY PART I SEWERAGE SCHEME PART II NON-SEWERAGE SCHEME PART III PUBLIC PARTICIPATION AND AWARENESS PROGRAMME PART IV INSTITUTIONAL DEVELOPMENT PROGRAMME PART V ECONOMIC AND FINANCIAL EVALUATION PART VI STAKEHOLDER MEETING PART VII DRAWINGS
VOLUME V PILOT PROJECT FOR SANITARY IMPROVEMENT OF MANIKARNIKA GHAT
i
VOLUME IV-3
PART I SEWERAGE SCHEME Table of Contents List of Tables List of Figures Appendix Abbreviations Glossary of Terms
TABLE OF CONTENTS
CHAPTER 1 GENERAL ................................................................................................................. 1-1
1.1 INTRODUCTION .............................................................................................................. 1-1 1.1.1 Preamble ......................................................................................................................... 1-1 1.1.2 Objective of the Study .................................................................................................... 1-1 1.1.3 Project City ..................................................................................................................... 1-1 1.1.4 Priority Projects .............................................................................................................. 1-4
1.2 PLANNING BASIS............................................................................................................ 1-4 1.2.1 Design Horizon............................................................................................................... 1-4 1.2.2 Population....................................................................................................................... 1-4 1.2.3 Water Supply .................................................................................................................. 1-5 1.2.4 Wastewater Generation................................................................................................... 1-6 1.2.5 The Sewerage Districts ................................................................................................... 1-6 1.2.6 The Existing Sewerage System ...................................................................................... 1-7 1.2.7 Surface Drains ................................................................................................................ 1-8
1.3 DESIGN CRITERIA .......................................................................................................... 1-8 1.3.1 General ........................................................................................................................... 1-8 1.3.2 Design Criteria for Sewers ............................................................................................. 1-8 1.3.3 Design Criteria for Rising Mains.................................................................................. 1-16 1.3.4 Design Criteria for SPS ................................................................................................ 1-18 1.3.5 Design Criteria for Sewage Treatment Plants............................................................... 1-19 1.3.6 Existing Sewers Condition Survey ............................................................................... 1-23 1.3.7 Rehabilitation Techniques ............................................................................................ 1-23
1.4 COST ESTIMATE ............................................................................................................ 1-27
ii
1.4.1 Basis of Cost Estimate.................................................................................................. 1-27 1.5 PROJECT IMPLEMENTATION...................................................................................... 1-32
1.5.1 Contract Packages......................................................................................................... 1-32 1.5.2 Recommendations for O&M ........................................................................................ 1-34 1.5.3 Private Sector Participation .......................................................................................... 1-35
CHAPTER 2 PROVISIONS FOR DISTRICT A........................................................................... 2-1
2.1 INTRODUCTION .............................................................................................................. 2-1 2.1.1 General ........................................................................................................................... 2-1 2.1.2 Population....................................................................................................................... 2-1 2.1.3 Present and Future Wastewater Flows ............................................................................ 2-1 2.1.4 Existing and Proposed Sewerage Pattern ....................................................................... 2-3 2.1.5 Proposed System............................................................................................................. 2-3 2.1.6 Cost Summary ................................................................................................................ 2-3
2.2 EXISTING SYSTEM DESCRIPTION .............................................................................. 2-4 2.2.1 General ........................................................................................................................... 2-4 2.2.2 Existing Trunk Sewers.................................................................................................... 2-4 2.2.3 Existing Pumping Stations and STP ............................................................................. 2-14
2.3 PROPOSED SEWER- GRAVITY AND RISING MAINS .............................................. 2-31 2.3.1 Proposed System........................................................................................................... 2-31 2.3.2 Proposed Gravity Sewers.............................................................................................. 2-31
CHAPTER 3 PROVISIONS OF DISTRICT D.............................................................................. 3-1
3.1 INTRODUCTION .............................................................................................................. 3-1 3.1.1 General ........................................................................................................................... 3-1 3.1.2 Population....................................................................................................................... 3-1 3.1.3 Present and Future Wastewater Flows ............................................................................ 3-1 3.1.4 Existing and Proposed Sewerage Pattern ....................................................................... 3-3 3.1.5 Proposed System............................................................................................................. 3-3 3.1.6 Cost Summary ................................................................................................................ 3-3
3.2 EXISTING SYSTEM DESCRIPTION .............................................................................. 3-3 3.2.1 General ........................................................................................................................... 3-3 3.2.2 Existing Trunk Sewers.................................................................................................... 3-5 3.2.3 Existing Pumping Stations............................................................................................ 3-13
3.3 PROPOSED SEWAGE COLLECTION AND TREATMENT SYSTEM ........................ 3-34 3.3.1 Proposed System........................................................................................................... 3-34 3.3.2 Proposed Gravity Sewers.............................................................................................. 3-35 3.3.3 Rising Main(s) .............................................................................................................. 3-39 3.3.4 Proposed Rajapur STP (ref. drg. sheets number 177 – 183)......................................... 3-42
iii
CHAPTER 4 PROVISIONS FOR DISTRICT B AND DISTRICT E ......................................... 4-1
4.1 INTRODUCTION .............................................................................................................. 4-1 4.1.1 General ........................................................................................................................... 4-1 4.1.2 Population....................................................................................................................... 4-1 4.1.3 Present and Future Waste Water flows ........................................................................... 4-2 4.1.4 Existing and Proposed Sewerage Pattern ....................................................................... 4-3 4.1.5 Proposed System............................................................................................................. 4-3 4.1.6 Cost Summary ................................................................................................................ 4-3
4.2 EXISTING SYSTEM DESCRIPTION .............................................................................. 4-5 4.2.1 General ........................................................................................................................... 4-5 4.2.2 Existing Pumping Station ............................................................................................... 4-6
4.3 PROPOSED SEWAGE COLLECTION AND TREATMENT SYSTEM – DISTRICT B. 4-9 4.3.1 Proposed System............................................................................................................. 4-9 4.3.2 Proposed Gravity Sewers................................................................................................ 4-9 4.3.3 Proposed Numaya Dahi STP ........................................................................................ 4-20
4.4 PROPOSED SEWAGE COLLECTION AND TREATMENT SYSTEM - DISTRICT E 4-25 4.4.1 Proposed System........................................................................................................... 4-25 4.4.2 Proposed Ponghat STP ................................................................................................. 4-25 4.4.3 Proposed Kodara STP................................................................................................... 4-28
CHAPTER 5 ENVIRONMENTAL IMPACT ASSESSMENT ..................................................... 5-1
5.1 INTRODUCTION .............................................................................................................. 5-1 5.1.1 Preamble ......................................................................................................................... 5-1 5.1.2 Objectives of and Need for the EIA Study ..................................................................... 5-1 5.1.3 EIA Methodology ........................................................................................................... 5-1
5.2 POLICY, LEGAL AND ADMINISTRATIVE FRAMEWORK......................................... 5-5 5.2.1 Policies and Legislative Framework............................................................................... 5-5 5.2.2 Legal Instruments and Procedures (or, Laws / Regulations Applicable for the Project) ..... ..................................................................................................................................... 5-5 5.2.3 Environmental Standards................................................................................................ 5-7 5.2.4 Administrative Framework........................................................................................... 5-11 5.2.5 EIA Guidelines ............................................................................................................. 5-14 5.2.6 JBIC and JICA Guidelines............................................................................................ 5-14
5.3 DESCRIPTION OF THE PROPOSED PROJECT........................................................... 5-14 5.3.1 Introduction .................................................................................................................. 5-14 5.3.2 Shortfalls of the Existing Sewerage System................................................................. 5-21 5.3.3 Existing Naini Sewage Treatment Plant ....................................................................... 5-24
5.4 BASELINE ENVIRONMENTAL SCENARIO ............................................................... 5-24
iv
5.4.1 Study Area .................................................................................................................... 5-24 5.4.2 Physical Environment................................................................................................... 5-24 5.4.3 Biological Environment................................................................................................ 5-58 5.4.4 Socio-Cultural Environment......................................................................................... 5-60 5.4.5 Pollution ....................................................................................................................... 5-63
5.5 IMPACT IDENTIFICATION – CONSTRUCTION AND OPERATION PHASE .......... 5-64 5.5.1 General ......................................................................................................................... 5-64 5.5.2 Impacts during the Construction Phase ........................................................................ 5-67 5.5.3 Impacts during the Operation Phase ............................................................................. 5-80
5.6 ANALYSIS OF ALTERNATIVES ................................................................................... 5-84 5.6.1 With and Without Proposed Project.............................................................................. 5-84 5.6.2 Alternative Treatment Technologies............................................................................. 5-85 5.6.3 Alternatives for STP Sites ............................................................................................ 5-88
5.7 ENVIRONMENTAL MITIGATION PLAN..................................................................... 5-92 5.7.1 Introduction .................................................................................................................. 5-92 5.7.2 General Mitigation Measures ....................................................................................... 5-92 5.7.3 Mitigation Measures for Sewerage............................................................................... 5-93 5.7.4 Mitigation Measures for Sewage Treatment Plant........................................................ 5-93 5.7.5 Environmental Training................................................................................................ 5-94 5.7.6 Block Cost Estimate for EMP ...................................................................................... 5-94 5.7.7 Risk Analysis & Contingency Plan ............................................................................ 5-102
5.8 ENVIRONMENTAL MANAGEMENT TRAINING AND MONITORING PLAN ..... 5-106 5.8.1 General ....................................................................................................................... 5-106 5.8.2 Environmental Management Group ........................................................................... 5-106 5.8.3 Monitoring Plan.......................................................................................................... 5-107 5.8.4 Environmental Testing Laboratory ............................................................................. 5-108 5.8.5 Environmental Training.............................................................................................. 5-108 5.8.6 Conclusions ................................................................................................................ 5-110
CHAPTER 6 COST ESTIMATION AND IMPLEMENTATION PROGRAMME ................... 6-1
6.1 CAPITAL COST ESTIMATION OF THE PRIORITY PROJECTS .................................. 6-1 6.2 IMPLEMENTATION PROGRAMME............................................................................... 6-1 6.3 OPERATION & MAINTENANCE COST ESTIMATION................................................ 6-2
v
LIST OF TABLES Table 1.1 Priority Projects ................................................................................................................. 1-4 Table 1.2 Total Municipal Water Production..................................................................................... 1-5 Table 1.3 Estimated Per Capita Water Consumption......................................................................... 1-5 Table 1.4 Per Capita Wastewater Generation Rates .......................................................................... 1-6 Table 1.5 Existing and Proposed Sewer Connection Targets ............................................................ 1-6 Table 1.6 Major Surface Drains......................................................................................................... 1-8 Table 1.7 Comparison Between Various Types of Pipe................................................................... 1-10 Table 1.8 Peak Factors Considered for Sewerage Design ............................................................... 1-11 Table 1.9 Details of Manholes......................................................................................................... 1-12 Table 1.10 Guideline for Selection of Pipe Class for Sewers with B-class Bedding ...................... 1-15 Table 1.11 Type of Bedding ............................................................................................................ 1-16 Table 1.12 Design Capacity of Sewage Treatment Plant................................................................. 1-20 Table 1.13 Raw Sewage Characteristics (Average Values) ............................................................. 1-20 Table 1.14 Treated Wastewater Quality........................................................................................... 1-21 Table 1.15 Comparison of Treatment Technologies ........................................................................ 1-22 Table 1.16 Construction Works ....................................................................................................... 1-32 Table 1.17 Summary of Implementation Activities......................................................................... 1-33 Table 1.18 Cost Index Calculation .................................................................................................. 1-28 Table 1.19 Land Acquisition Cost ................................................................................................... 1-31 Table 2.1 Population of District A..................................................................................................... 2-1 Table 2.2 Present and Estimated Future Wastewater Flows by Sub-catchment in District A ........... 2-2 Table 2.3 Summary of Estimated Project Cost (District A) .............................................................. 2-3 Table 2.4 Summary of Trunk Sewer (Replacement / Desilting / Rehabilitation Cost)...................... 2-5 Table 2.5 Details of Existing Sewers in District A ............................................................................ 2-6 Table 2.6 Summary of Condition Survey for Existing Sewers, District A ........................................ 2-8 Table 2.7 Summary of Replacement / Desilting Requirements for District A ................................ 2-13 Table 2.8 Wet Sump of Gaughat Pumping Station .......................................................................... 2-16 Table 2.9 Pumps and Motors of Gaughat Pumping Station............................................................. 2-16 Table 2.10 Rehabilitation Cost of Gaughat Pumping Station.......................................................... 2-17 Table 2.11 Wet Sump of Chachar Nala Pumping Station................................................................ 2-20 Table 2.12 Pumps and Motors of Chachar Nala Pumping Station .................................................. 2-20 Table 2.13 Rehabilitation Cost of Chachar Nala Pumping Station ................................................. 2-22 Table 2.14 Raw Sewage Quality ..................................................................................................... 2-23 Table 2.15 Data Received for Existing Plant Unit of Naini STP..................................................... 2-24 Table 2.16 Performance of Naini Sewage Treatment Plant............................................................. 2-29
vi
Table 2.17 Augmentation Cost of Naini STP.................................................................................. 2-31 Table 2.18 Proposed Gravity Sewers for District A ........................................................................ 2-33 Table 2.19 Details of Road/Nala Crossing ...................................................................................... 2-35 Table 3.1 Population of District D..................................................................................................... 3-1 Table 3.2 Present and Estimated Future Wastewater Flows by Sub-catchment in District D ........... 3-2 Table 3.3 Summary of Estimated Project Costs (District D)............................................................. 3-4 Table 3.4 Summary of Trunk Sewer (Replacement / Desilting / Rehabilitation Cost)...................... 3-5 Table 3.5 Details of Existing Sewers in District D............................................................................ 3-6 Table 3.6 Summary of Condition Survey for Existing Sewers, District D........................................ 3-7 Table 3.7 Summary of Replacement / Desilting Requirements for District D ................................ 3-11 Table 3.8 Wet Sump of Alopibagh Pumping Station....................................................................... 3-14 Table 3.9 Pumps and Motors of Alopibagh Pumping Station ......................................................... 3-14 Table 3.10 Pump Design for the Year 2015 for Alopibagh SPS...................................................... 3-16 Table 3.11 Rehabilitation Cost of Alopibagh Pumping Station....................................................... 3-18 Table 3.12 Pumps and Motors of Morigate Pumping Station ......................................................... 3-20 Table 3.13 Pump Design for the Year 2015 (Additional PS)........................................................... 3-22 Table 3.14 Pump Design for the Year 2015 (Existing PS) .............................................................. 3-22 Table 3.15 Augmentation Cost of Morigate Pumping Station ........................................................ 3-23 Table 3.16 Wet Sump of Allahpur Pumping Station........................................................................ 3-24 Table 3.17 Pumps and Motors of Allahpur Pumping Station .......................................................... 3-25 Table 3.18 Pump Design for the Year 2015..................................................................................... 3-26 Table 3.19 Pump Design for the Year 2030..................................................................................... 3-26 Table 3.20 Rehabilitation Cost of Allahpur Pumping Station ......................................................... 3-27 Table 3.21 Wet Sump of Daraganj Pumping Station ....................................................................... 3-29 Table 3.22 Pumps and Motors of Daraganj Pumping Station ......................................................... 3-29 Table 3.23 Pump Design for the Year 2015..................................................................................... 3-30 Table 3.24 Design for the Year 2030 ............................................................................................... 3-31 Table 3.25 Rehabilitation Cost of Daraganj Pumping Station......................................................... 3-31 Table 3.26 Wet Sump of Mumfordganj Pumping Station ............................................................... 3-32 Table 3.27 Pumps and Motors Mumfordganj Pumping Station ...................................................... 3-32 Table 3.28 Pump Design for the Year 2015 and 2030 ..................................................................... 3-34 Table 3.29 Augmentation and Rehabilitation Cost of Mumfordganj Pumping Station................... 3-34 Table 3.30 Proposed Gravity Sewers for District D ........................................................................ 3-35 Table 3.31 Details of Road /Nala Crossings.................................................................................... 3-39 Table 3.32 Proposed Rising Main(s) for District D......................................................................... 3-39 Table 3.33 Details of Road /Nala Crossings.................................................................................... 3-42 Table 3.34 Details of Valves ............................................................................................................ 3-42 Table 3.35 Raw Sewage Characteristics for Rajapur STP............................................................... 3-44 Table 3.36 Treated Effluent Quality ................................................................................................ 3-44
vii
Table 3.37 Construction Cost of Rajapur STP ................................................................................ 3-45 Table 3.38 Comparison of Treatment Technologies for Rajapur STP............................................. 3-46 Table 4.1 Population of District B..................................................................................................... 4-1 Table 4.2 Population of District E ..................................................................................................... 4-1 Table 4.3 Present and Estimated Future Wastewater Flows by Sub-catchment in District B ........... 4-2 Table 4.4 Present and Estimated Future Wastewater Flows by Sub-catchment in District E............ 4-2 Table 4.5 Summary of Estimated Project Costs (District B) ............................................................. 4-4 Table 4.6 Summary of Estimated Project Costs (District E) ............................................................. 4-5 Table 4.7 Wet Sump of Lukerganj Pumping Station ......................................................................... 4-6 Table 4.8 Pumps and Motors of Lukerganj Pumping Station............................................................ 4-7 Table 4.9 Pump Design for the year 2030 for Lukerganj SPS........................................................... 4-9 Table 4.10 Rehabilitation Cost of Lukerganj Pumping Station ......................................................... 4-9 Table 4.11 Proposed Gravity Sewers for District B ........................................................................ 4-10 Table 4.12 Details of Road /Nala Crossings.................................................................................... 4-13 Table 4.13 Proposed Rising Mains for District B............................................................................ 4-14 Table 4.14 Details of Road /Nala Crossings.................................................................................... 4-16 Table 4.15 Details of Valves ............................................................................................................ 4-16 Table 4.16 Wet Sump of Ghaghar Nala Pumping Station ............................................................... 4-17 Table 4.17 Pump Design for the Year 2015 and 2030 ..................................................................... 4-18 Table 4.18 Rehabilitation Cost of Ghaghar Nala Pumping Station ................................................. 4-18 Table 4.19 Pump Design for the Year 2015..................................................................................... 4-20 Table 4.20 Construction Cost of Sasur Khaderi Pumping Station................................................... 4-20 Table 4.21 Raw Sewage Characteristics.......................................................................................... 4-22 Table 4.22 Treated Effluent Quality ................................................................................................ 4-22 Table 4.23 Comparison of Alternative Routes for Treated Effluent Channel from Numaya Dahi STP
to Yamuna River ............................................................................................................ 4-22 Table 4.24 Details of Effluent Channel ........................................................................................... 4-23 Table 4.25 Construction Cost of Numaya Dahi STP....................................................................... 4-23 Table 4.26 Raw Sewage Characteristics.......................................................................................... 4-25 Table 4.27 Treated Effluent Quality ................................................................................................ 4-25 Table 4.28 Construction Cost of Ponghat STP................................................................................ 4-26 Table 4.29 Raw Sewage Characteristics.......................................................................................... 4-28 Table 4.30 Treated Effluent Quality ................................................................................................ 4-28 Table 4.31 Construction Cost of Kodara STP ................................................................................. 4-29 Table 5.1 Scoping Matrix for Environmental Impacts of Project Components ................................ 5-4 Table 5.2 Key Indicators of Inland Surface Water Quality under the Revised Criteria Proposed by
CPCB................................................................................................................................ 5-8 Table 5.3 Discharge Standards .......................................................................................................... 5-9 Table 5.4 Treated Water Quality for Irrigation ................................................................................ 5-10
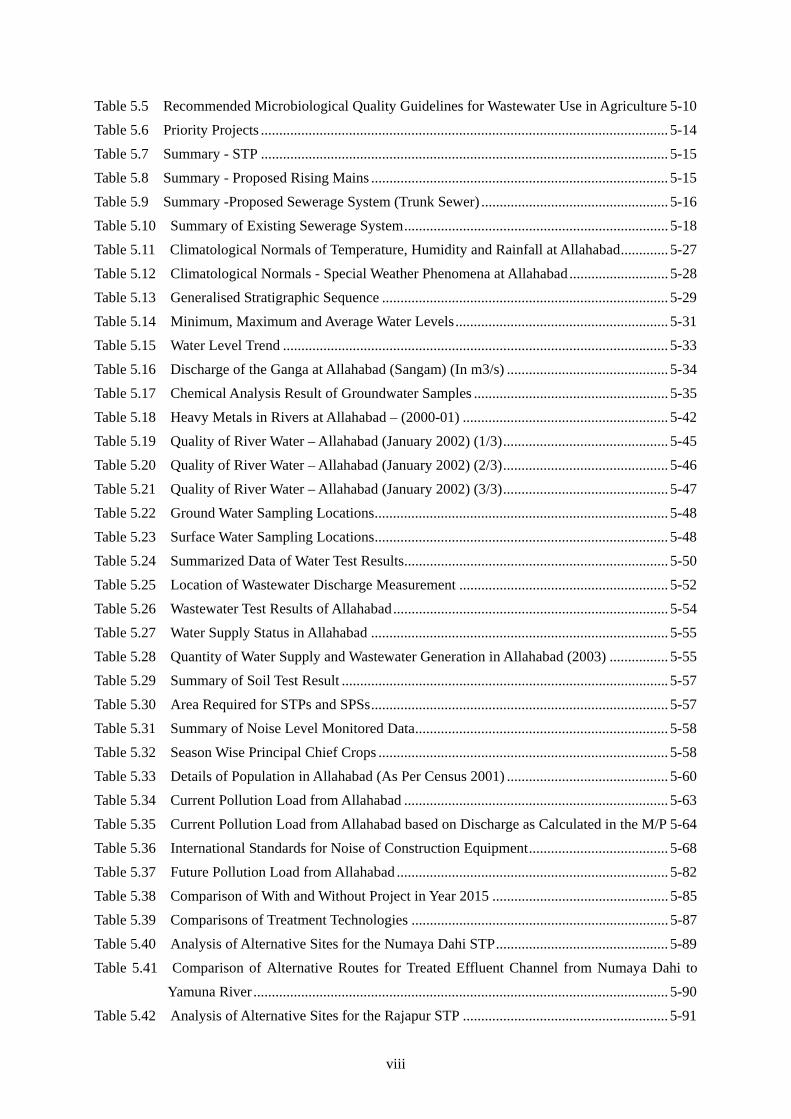
viii
Table 5.5 Recommended Microbiological Quality Guidelines for Wastewater Use in Agriculture 5-10 Table 5.6 Priority Projects ............................................................................................................... 5-14 Table 5.7 Summary - STP ............................................................................................................... 5-15 Table 5.8 Summary - Proposed Rising Mains ................................................................................. 5-15 Table 5.9 Summary -Proposed Sewerage System (Trunk Sewer) ................................................... 5-16 Table 5.10 Summary of Existing Sewerage System........................................................................ 5-18 Table 5.11 Climatological Normals of Temperature, Humidity and Rainfall at Allahabad............. 5-27 Table 5.12 Climatological Normals - Special Weather Phenomena at Allahabad........................... 5-28 Table 5.13 Generalised Stratigraphic Sequence .............................................................................. 5-29 Table 5.14 Minimum, Maximum and Average Water Levels.......................................................... 5-31 Table 5.15 Water Level Trend ......................................................................................................... 5-33 Table 5.16 Discharge of the Ganga at Allahabad (Sangam) (In m3/s) ............................................ 5-34 Table 5.17 Chemical Analysis Result of Groundwater Samples ..................................................... 5-35 Table 5.18 Heavy Metals in Rivers at Allahabad – (2000-01) ........................................................ 5-42 Table 5.19 Quality of River Water – Allahabad (January 2002) (1/3)............................................. 5-45 Table 5.20 Quality of River Water – Allahabad (January 2002) (2/3)............................................. 5-46 Table 5.21 Quality of River Water – Allahabad (January 2002) (3/3)............................................. 5-47 Table 5.22 Ground Water Sampling Locations................................................................................ 5-48 Table 5.23 Surface Water Sampling Locations................................................................................ 5-48 Table 5.24 Summarized Data of Water Test Results........................................................................ 5-50 Table 5.25 Location of Wastewater Discharge Measurement ......................................................... 5-52 Table 5.26 Wastewater Test Results of Allahabad........................................................................... 5-54 Table 5.27 Water Supply Status in Allahabad ................................................................................. 5-55 Table 5.28 Quantity of Water Supply and Wastewater Generation in Allahabad (2003) ................ 5-55 Table 5.29 Summary of Soil Test Result ......................................................................................... 5-57 Table 5.30 Area Required for STPs and SPSs................................................................................. 5-57 Table 5.31 Summary of Noise Level Monitored Data..................................................................... 5-58 Table 5.32 Season Wise Principal Chief Crops ............................................................................... 5-58 Table 5.33 Details of Population in Allahabad (As Per Census 2001) ............................................ 5-60 Table 5.34 Current Pollution Load from Allahabad ........................................................................ 5-63 Table 5.35 Current Pollution Load from Allahabad based on Discharge as Calculated in the M/P 5-64 Table 5.36 International Standards for Noise of Construction Equipment...................................... 5-68 Table 5.37 Future Pollution Load from Allahabad .......................................................................... 5-82 Table 5.38 Comparison of With and Without Project in Year 2015 ................................................ 5-85 Table 5.39 Comparisons of Treatment Technologies ...................................................................... 5-87 Table 5.40 Analysis of Alternative Sites for the Numaya Dahi STP............................................... 5-89 Table 5.41 Comparison of Alternative Routes for Treated Effluent Channel from Numaya Dahi to
Yamuna River ................................................................................................................. 5-90 Table 5.42 Analysis of Alternative Sites for the Rajapur STP ........................................................ 5-91
ix
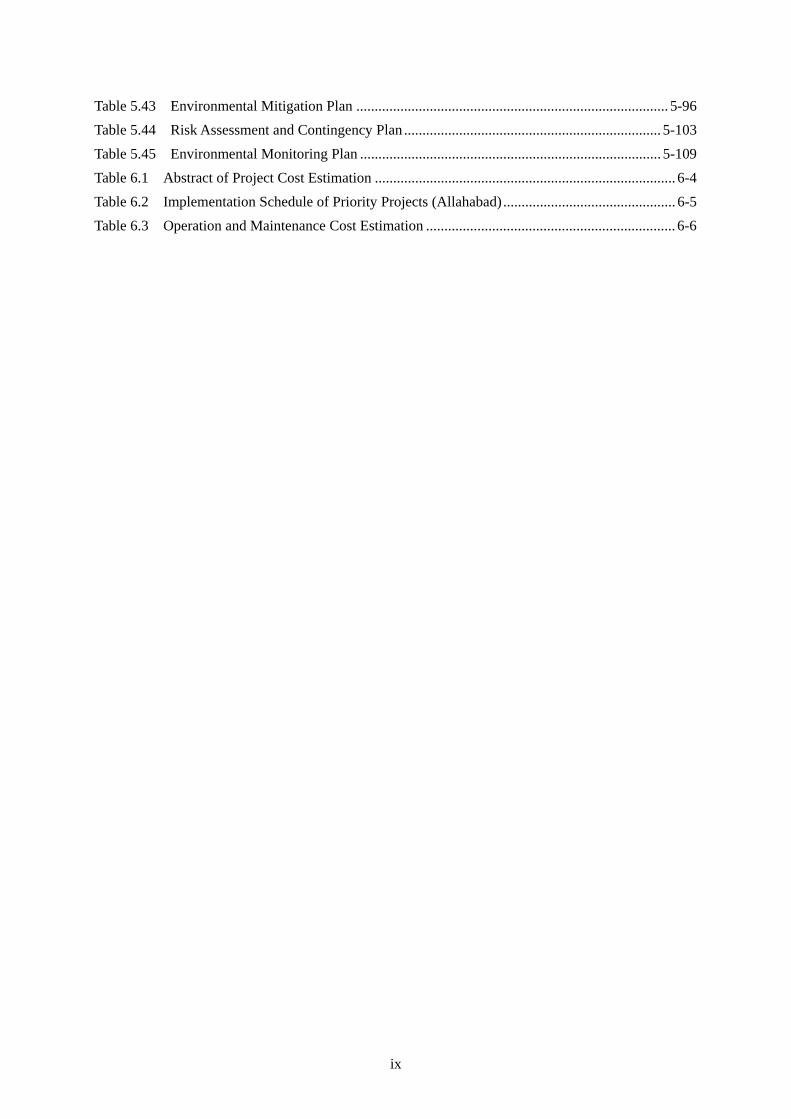
Table 5.43 Environmental Mitigation Plan ..................................................................................... 5-96 Table 5.44 Risk Assessment and Contingency Plan ...................................................................... 5-103 Table 5.45 Environmental Monitoring Plan .................................................................................. 5-109 Table 6.1 Abstract of Project Cost Estimation .................................................................................. 6-4 Table 6.2 Implementation Schedule of Priority Projects (Allahabad)............................................... 6-5 Table 6.3 Operation and Maintenance Cost Estimation .................................................................... 6-6
x
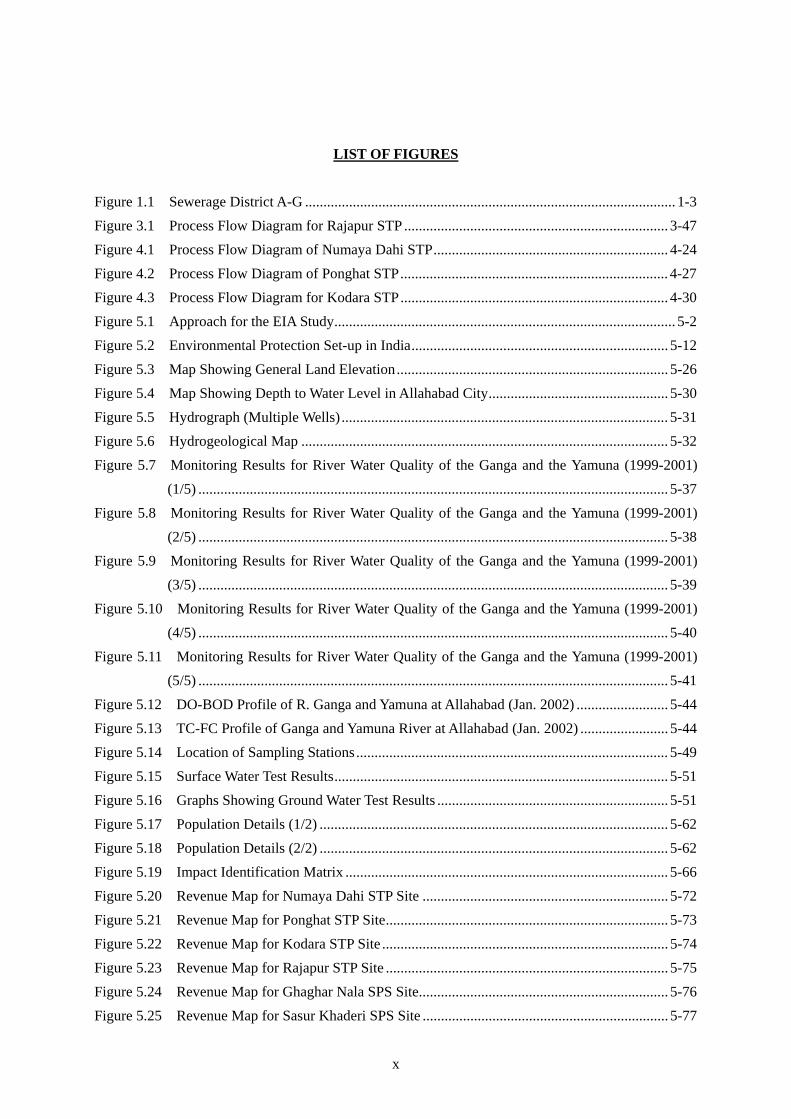
LIST OF FIGURES Figure 1.1 Sewerage District A-G ..................................................................................................... 1-3 Figure 3.1 Process Flow Diagram for Rajapur STP ........................................................................ 3-47 Figure 4.1 Process Flow Diagram of Numaya Dahi STP................................................................ 4-24 Figure 4.2 Process Flow Diagram of Ponghat STP......................................................................... 4-27 Figure 4.3 Process Flow Diagram for Kodara STP......................................................................... 4-30 Figure 5.1 Approach for the EIA Study............................................................................................. 5-2 Figure 5.2 Environmental Protection Set-up in India...................................................................... 5-12 Figure 5.3 Map Showing General Land Elevation.......................................................................... 5-26 Figure 5.4 Map Showing Depth to Water Level in Allahabad City................................................. 5-30 Figure 5.5 Hydrograph (Multiple Wells) ......................................................................................... 5-31 Figure 5.6 Hydrogeological Map .................................................................................................... 5-32 Figure 5.7 Monitoring Results for River Water Quality of the Ganga and the Yamuna (1999-2001)
(1/5) ................................................................................................................................ 5-37 Figure 5.8 Monitoring Results for River Water Quality of the Ganga and the Yamuna (1999-2001)
(2/5) ................................................................................................................................ 5-38 Figure 5.9 Monitoring Results for River Water Quality of the Ganga and the Yamuna (1999-2001)
(3/5) ................................................................................................................................ 5-39 Figure 5.10 Monitoring Results for River Water Quality of the Ganga and the Yamuna (1999-2001)
(4/5) ................................................................................................................................ 5-40 Figure 5.11 Monitoring Results for River Water Quality of the Ganga and the Yamuna (1999-2001)
(5/5) ................................................................................................................................ 5-41 Figure 5.12 DO-BOD Profile of R. Ganga and Yamuna at Allahabad (Jan. 2002) ......................... 5-44 Figure 5.13 TC-FC Profile of Ganga and Yamuna River at Allahabad (Jan. 2002) ........................ 5-44 Figure 5.14 Location of Sampling Stations..................................................................................... 5-49 Figure 5.15 Surface Water Test Results........................................................................................... 5-51 Figure 5.16 Graphs Showing Ground Water Test Results ............................................................... 5-51 Figure 5.17 Population Details (1/2) ............................................................................................... 5-62 Figure 5.18 Population Details (2/2) ............................................................................................... 5-62 Figure 5.19 Impact Identification Matrix ........................................................................................ 5-66 Figure 5.20 Revenue Map for Numaya Dahi STP Site ................................................................... 5-72 Figure 5.21 Revenue Map for Ponghat STP Site............................................................................. 5-73 Figure 5.22 Revenue Map for Kodara STP Site .............................................................................. 5-74 Figure 5.23 Revenue Map for Rajapur STP Site ............................................................................. 5-75 Figure 5.24 Revenue Map for Ghaghar Nala SPS Site.................................................................... 5-76 Figure 5.25 Revenue Map for Sasur Khaderi SPS Site ................................................................... 5-77
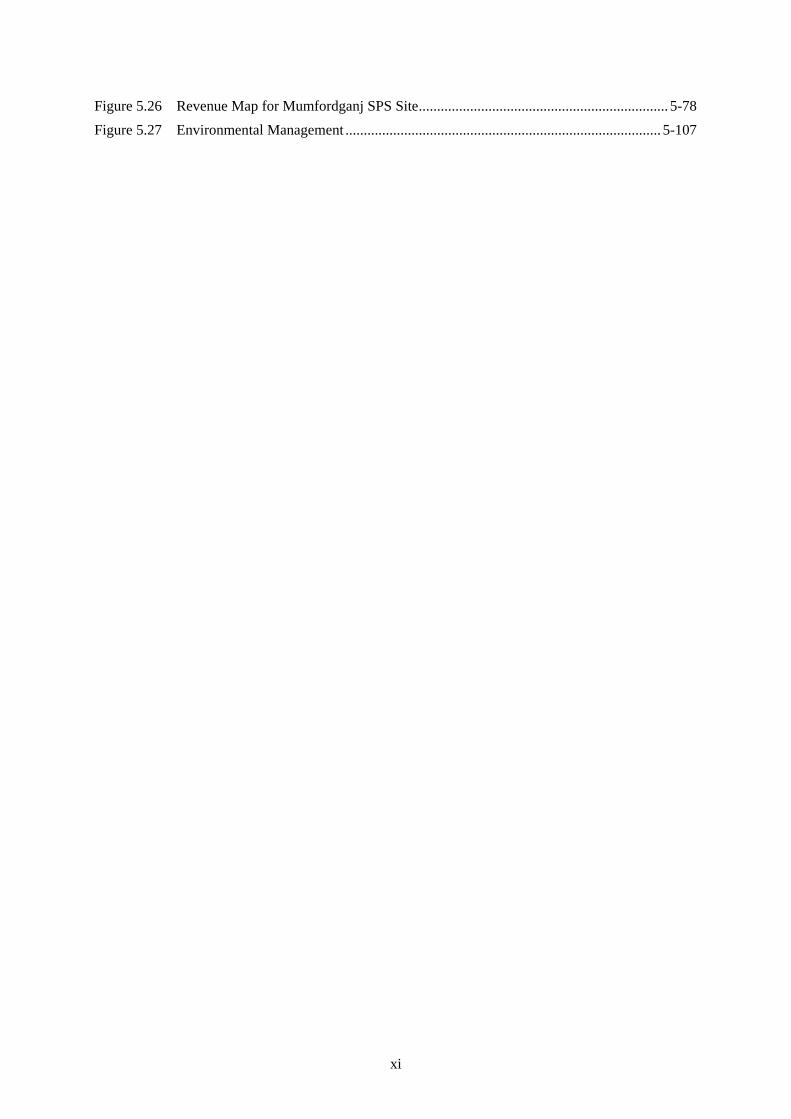
xi
Figure 5.26 Revenue Map for Mumfordganj SPS Site.................................................................... 5-78 Figure 5.27 Environmental Management ...................................................................................... 5-107
xii
APPENDIX Appendix A1.1 District Wise Population Appendix A1.2 District Wise Wastewater Generation Appendix A2.1 Sewer Data of GT Road (Dist-A)- Node 4-5-7 Appendix A2.2 Detailed Description of Sewer of GT Road (Dist-A)- Node 4-5-7 Appendix A2.3 Detailed Description of Manhole of GT Road (Dist-A)- Node 4-5-7 Appendix A2.4 Sewer Data of Salik Ganj (Dist-A)- Node 8 to Node 15 (Gaughat PS) Appendix A2.5 Detailed Description of Sewer of Salik Ganj (Dist-A)- Node 8 to Node15 (Gaughat
PS) Appendix A2.6 Detailed Description of Manhole of Salik Ganj (District-A) Appendix A2.7 Sewer Data of S K Dey (Dist-A)- Node 11 to Node 12 (Saukat Ali Marg) Appendix A2.8 Detailed Description of Sewer Data of S K Dey (Dist-A)- Node 11 to Node 12
(Saukat Ali Marg) Appendix A2.9 Detailed Description of Manholes S K Dey (District-A) Appendix A3.1 Sewer Data of Thorn Hill Road (Dist-D)- Node 1-2-4-18 (Mumford Ganj PS) Appendix A3.2 Detailed Description of Sewer of Thorn Hill Road (Dist-D)- Node 1-2-4-18
(Mumford Ganj PS) Appendix A3.3 Detailed Description of Manhole of Thornhill Road (District-D) Appendix A3.4 Sewer Data of Muir Road (Dist-D)- Node 3-4 Appendix A3.5 Detailed Description of Sewer of Muir Road (Dist-D)- Node 3-4 Appendix A3.6 Detailed Description of Manhole of Muir Road To Stanley Road (District-D) Appendix A3.7 Sewer Data of Sewer Line From Alopi Bagh- Mumford Ganj (District-D) Start Ch.
3100m- Node 18-18 (Mumford Ganj Ps) Appendix A3.8 Detailed Description of Sewer Line From Alopi Bagh- Mumford Ganj (District-D)-
Start Ch. 3100m- Node 18-18 (Mumford Ganj Ps) Appendix A3.9 Detailed Description of Manhole of Alopi Bagh to Mumford Ganj (District-D) Appendix A3.10 Sewer Data of Intercepting Sewer at Rajapur (District-D) Appendix A3.11 Detailed Description of Sewer of Intercepting Sewer at Rajapur (District-D) Appendix A3.12 Detailed Description of Manhole of Intercepting Sewer at Rajapur (District-D) Appendix A4.1 Sewer Data of Lukerganj PS to Ghaghar Nala PS (Dist-B)- Node 1-Ghaghar PS Appendix A4.2 Detailed Description of Lukerganj PS to Ghaghar Nala PS (District-B)- Node
1-Ghaghar PS Appendix A4.3 Detailed Description of Manhole of Lukerganj to Ghaghar Nala (District-B) Appendix A4.4 Sewer Data of Sewer Line from Sasur Khaderi PS- Luker Sewer towards Ghaghar
PS (District-B) Appendix A4.5 Detailed Description of Sewer Line from Sasur Khaderi PS – Luker Sewer towards

xiii
Ghaghar PS (District-B) Appendix A4.6 Detailed Description of Sewer Line from Sasur Khaderi PS – Luker Sewer towards
Ghaghar PS (District-B) Appendix A4.7 Sewer Data of Interceptor at Ghaghar Nala from Nala 1C –1B – 1A –Ghaghar Nala
PS (District-B) Appendix A4.8 Detailed Description of Interceptor at Ghaghar nala from Nala 1C - 1B - 1A –
Ghaghar nala PS (District-B) Appendix A4.9 Detailed Description of Intercept at Ghaghar nala from Nala 1C – 1B – 1A –
Ghaghar nala PS (District-B) Appendix A5.1 Schedule-I List of Projects Requiring Environmental Clearance from the Central
Government Appendix A5.2 Procedure for Environmental Clearance in India Appendix A5.3 Process of Land Acquisition Appendix A5.4 Tolerance Limits for Inland Surface Waters (As Per Is: 2296) Appendix A 5.5 Test Characteristics for Drinking Water Appendix A 5.6 National Ambient Air Quality Standard (NAAQS) Appendix A 5.7 The Noise Pollution (Regulation and Control) Rules, 2000 Appendix A 5.8 Guidelines for EIA Report Preparation Appendix A 5.9 List of Existing Nala/ Drains in Allahabad Appendix A 5.10 Average Meteorological Data Recorded at IMD Station Allahabad from 1951 to
1980 Appendix A 5.11 Climatological Nrmals of Wind Direction and Speed at Allahabad Appendix A 5.12 Lithological Logs of Exploratory Boreholes Drilled by Central Ground Water
Board in Alluvial Area of Allahabad District Appendix A 5.13 Well Wise Water Level Appendix A 5.14 Appendix A 5.15 Surface Water Test Results Appendix A 5.16 Soil Analysis Report Appendix A 5.17 Noise Levels within the Study Area Appendix A 5.18 Consolidated List of Flora Present in and Around Allahabad City Area Appendix A 5.19 List of Fauna Present in and Around Allahabad City Appendix A 5.20 Aquatic Flora in Allahabad Appendix A 5.21 List of Fishes Available in Ganga and Yamuna, Allahabad Appendix A 5.22 Literacy Appendix A 5.23 Land Owner List for Numaya Dahi STP Site Appendix A 5.24 Land Owner List for Ponghat STP Site Appendix A 5.25 Land Owner List for Kodara STP Site Appendix A 5.26 Land Owner List for Rajapur STP Site Appendix A 5.27 Land Owner List for Ghaghar Nala SPS Site

xiv
Appendix A 5.28 Land Owner List for Sasur Khaderi SPS Site Appendix A 5.29 Land Owner List for Mumforganj SPS Site Appendix A 5.30 Land Owner List for Numaya Dahi Channel
xv
ABBREVIATIONS
AD/MM Average Day / Max Month ML Million Litres ADF Average Daily Flow mld Million Litres per Day ADWF Average Dry Weather Flow MLSS Mixed Liquid Suspended Solids
AIWSP Advanced Integrated Wastewater Stabilization Ponds M/P Master Plan
AL Aerated Lagoon MPN Most Probable Number per 100ml AS Activated Sludge MPS Main Sewage Pumping Station ASR Aquifer Storage and Recovery System MPS Meter per Second
Avg Average MUD MoEF
Ministry of Urban Development Ministry of Environment and Forests
AWT Advanced Wastewater Treatment N/A Not Available BOD Biochemical Oxygen Demand NBC National Building Code CI Cast Iron NH3-N Ammonia-Nitrogen CMS Cubic Meter per Second NRCD National River Conservation Directorate CO2 Carbon Dioxide NSA Non Sewerage Area CPCB Central Pollution Control Board O&M Operations and Maintenance CWR Clear Water Reservoir PDWF Peak Dry Weather Flow DLW Diesel Locomotive Work PFR Project Feasibility Report DO Dissolved Oxygen PS Pumping Station DPR Detailed Project Report PSC Pre-Stressed Concrete ES Equalization/Storage RAS Return Activated Sludge FAB Fluidised Aerated Bioreactor SMF Sankat Mochan Foundation F/S Feasibility Study SPS Sewage Pumping Station FSA Future Service Area SS Suspended Solids GAP GoAP
Ganga/Gomti Action Plan Gomti Action Plan SSO Sanitary Sewer Overflow
GIS Geographical Information System STP Sewage Treatment Plant gpd Grams per day TDS Total Dissolved Solids GOI Government of India TKN Total Kjeldahl Nitrogen GOJ Government of Japan TMDL Total Maximum Daily Load GWI Ground Water Infiltration TN Total Nitrogen HDR High-Density Residential TP Total Phosphorus HP Horse Power TSS Total Suspended Solids I/I Infiltration/Inflow UASB Up flow Anaerobic Sludge Blanket ISC Indian Standard Code UFW Unaccounted for Water JICA Japan International Cooperation Agency UPJN Uttar Pradesh Jal Nigam JS Jal Sansthan UPPCB Uttar Pradesh Pollution Control Board
KVA Kilo Volt Ampere USAID United States Agency for International Development
LDR Low-Density Residential UV Ultra Violet lpcd Litres per capita per day VCP Vitrified Clay Pipe lpm Litres per minute WAS Waste Activated Sludge lps Litres per second WRF Water Reclamation Facility MC Municipal Corporation WSP Waste Stabilization Pond MDR Medium-Density Residential WTP Water Treatment Plant mg/l Milligrams per Litre YAP Yamuna Action Plan
xvi
GLOSSARY OF TERMS
Aerated Lagoons: Like WSPs but with mechanical aeration. Oxygen requirement mostly from aeration and hence more complicated and higher O&M costs requires less land than WSP. Activated-Sludge Process: A biological wastewater treatment process in which a mixture of wastewater and biologically enriched sludge is aerated to facilitate aerobic decomposition by microbes. Advance Wastewater Treatment: Treatment process designed to remove pollutants that are not adequately removed by conventional secondary treatment processes. Aeration: The addition of air or oxygen to water or wastewater, usually by mechanical means, to increase dissolved oxygen levels and maintain aerobic conditions. Anaerobic Digestion: Sludge stabilization process in which the organic material in biological sludge is converted to methane and carbon dioxide in an airtight reactor. Assimilative Capacity: The ability of a water body to receive wastewater and toxic materials without deleterious effects on aquatic life or the humans who consume the water. Average Daily Flow: The total flow past a physical point over a period of time divided by the number of days in that period. Biochemical Oxygen Demand (BOD): A standard measure of wastewater strength that quantifies the oxygen consumed in a stated period of time, usually 5 days and at 20oC. Biological Process: The process by which the metabolic activities of bacteria and other microorganisms break down complex organic materials to simple, more stable substances. Bio solids: Solid organic matter recovered from municipal wastewater treatment that can be beneficially used, especially as a fertilizer. Bio solids are solids that have been stabilized within the treatment process, whereas sludge has not. Chlorination: The addition of chlorine to water or wastewater, usually for the purpose of disinfection. Coliform Bacteria: Rod shaped bacteria from intestinal track of man used as an indication that pathogenic organisms may also be present. Collection System: In wastewater, a system of conduits, generally underground pipes, that receive and convey sanitary wastewater and/or storm water. In water supply, a system of conduits or canals used to capture a water supply and convey it to a common point. Composting: Stabilization process relying on the aerobic decomposition of organic matter in sludge by bacteria and fungi. Dechlorination: The partial or complete reduction of residual chlorine by any chemical or physical process. Design Storm: The magnitude of a storm on which the design of a system and/or facility is based; usually expressed in terms of the probability of an occurrence over a period of years. Diffused-Air Aeration: The introduction of compressed air to water by means of submerged diffusers or nozzles. Digester: A tank or vessel used for sludge digestion. Disinfection: The selective destruction of disease-causing microbes through the application of chemicals or energy. Diurnal: A daily fluctuation in flow or composition that is of similar pattern from one 24-hour period to another.
xvii
Effluent: Partially or completely treated water or wastewater flowing out of a basin or treatment plant. Fine-Bubble Aeration: Method of diffused aeration using fine bubbles to take advantage of their high surface areas to increase oxygen-transfer rate. Fixed Film Process: Biological wastewater treatment process whereby the microbes responsible for conversion of the organic matter in wastewater are attached to an inert medium such as rock or plastic material. Also called attached-growth process. Force Main: The pipeline through which flow is transported from a point of higher pressure to a point of lower pressure. Friction Factor: A measure of the resistance to liquid flow that results from the wall roughness of a pipe or channel. Gravity Thickening: A process that uses a sedimentation basin designed to operate at high solid loading rate, usually with vertical pickets mounted to revolving sludge scrapers to assist in releasing entrained water. Grit Chamber: A settling chamber used to remove grit from organic solids through sedimentation or an air-induced spiral agitation. Head Loss: The difference in water level between the upstream and downstream sides of a conduit or a treatment process attributed to friction losses. Headworks: The initial structure and devices located at the receiving end of a water or wastewater treatment plant. Infiltration: Water entering a sewer system through broken or defective sewer pipes, service connections, or manhole walls. Influent: Water or wastewater flowing to a basin or treatment plant. Invert: The lowest point of the internal surface of a drain, sewer, or channel at any cross section. Land Application: The disposal of wastewater or municipal solids onto land under controlled conditions. Lift Station: A chamber that contains pumps, valves, and electrical equipment necessary to pump water or wastewater. Methane: A colourless, odourless combustible gas that is the principal by-product of anaerobic decomposition or organic matter in wastewater. Chemical formula is CH4. Mixed Liquid Suspended Solids (MLSS): Suspended solids in the mixture of wastewater and activated sludge undergoing aeration in the aeration basin. Nitrification: Biological process in which ammonia is converted first to nitrite and then to nitrate. Nutrient: Any substance that is assimilated by organisms to promote or facilitate their growth. Pathogen: Highly infectious, disease-producing microbes commonly found in sanitary wastewater. Peak Flow: Excessive flows experienced during hours of high demand; usually determined to be the highest 2-hour flow expected under any operational conditions. Preliminary Treatment: Treatment steps including screening, grit removal, preparation, and/or flow equalization that prepare wastewater influent for further treatment. Pump Station: (see lift station)
xviii
Primary Clarifier: Sedimentation basin that precedes secondary wastewater treatment. Primary Treatment: Treatment steps including sedimentation and/or fine screening to produce an effluent suitable for biological treatment. Rising Main: (see force main) Reclaimed Wastewater: Wastewater treated to a level that allows its reuse for a beneficial purpose. Return Activated Sludge (RAS): Settled activated sludge that is returned to mix with raw or primary settled wastewater. Sanitary Sewer Overflow (SSO): Overloaded operating condition of a sanitary sewer that results from inflow/infiltration. Screening: (1) A treatment process using a device with uniform openings to retain coarse solids. (2) A preliminary test method used to separate according to common characteristics. Scum: Floatable materials found on the surface of primary and secondary clarifiers consisting of food wastes, grease, fats, paper, foam, and similar matter. Secondary Clarifier: A clarifier following a secondary treatment process and designed for gravity removal of suspended matter. Secondary Treatment: The treatment of wastewater through biological oxidation after primary treatment. Sludge: Accumulated and concentrated solids generated within the wastewater treatment process that have not undergone a stabilization process. Sludge Dewatering: The removal of a portion of the water contained in sludge by means of a filter press, centrifuge, or other mechanism. Sludge Stabilization: A treatment process used to convert sludge to a stable product for ultimate disposal or use and to reduce pathogens to produce a less odorous product. Suspended-Growth Process: Biological wastewater treatment process in which the microbes and substrate are maintained in suspension within the liquid. Thickening: A procedure used to increase the solids content of sludge by removing a portion of the liquid. Trickling Filters: Sewage passes down through a loose bed of stones, and the bacteria on the surface of the stones treats the sewage. An aerobic process in which bacteria take oxygen from the atmosphere (no external mechanical aeration). Has moving parts, which often break down. Total Suspended Solids (TSS): The measure of particulate matter suspended in a sample of water or wastewater. After filtering a sample of a known volume, the filter is dried and weighed to determine the residue retained. Waste Activated Sludge (WAS): Excess activated sludge that is discharged from an activated-sludge treatment process. Wetlands Treatment: A wastewater treatment system using the aquatic root system of cattails, reeds, and similar plants to treat wastewater applied either above or below the soil surface. Waste Stabilization Pond: Large surface area ponds that provide treatment essentially by action of sunlight, encouraging algal growth which provides the oxygen requirement for bacteria to oxidize the organic waste. Requires significant land area, but one of the few processes, which is effective at treating pathogenic material. Natural process with no power/oxygen requirement. Often used to provide water of sufficient quality for irrigation, and very suited to hot, sunny climates. UASB: Anaerobic process using blanket of bacteria to absorb polluting load. Suited to hot climates. Produces
xix
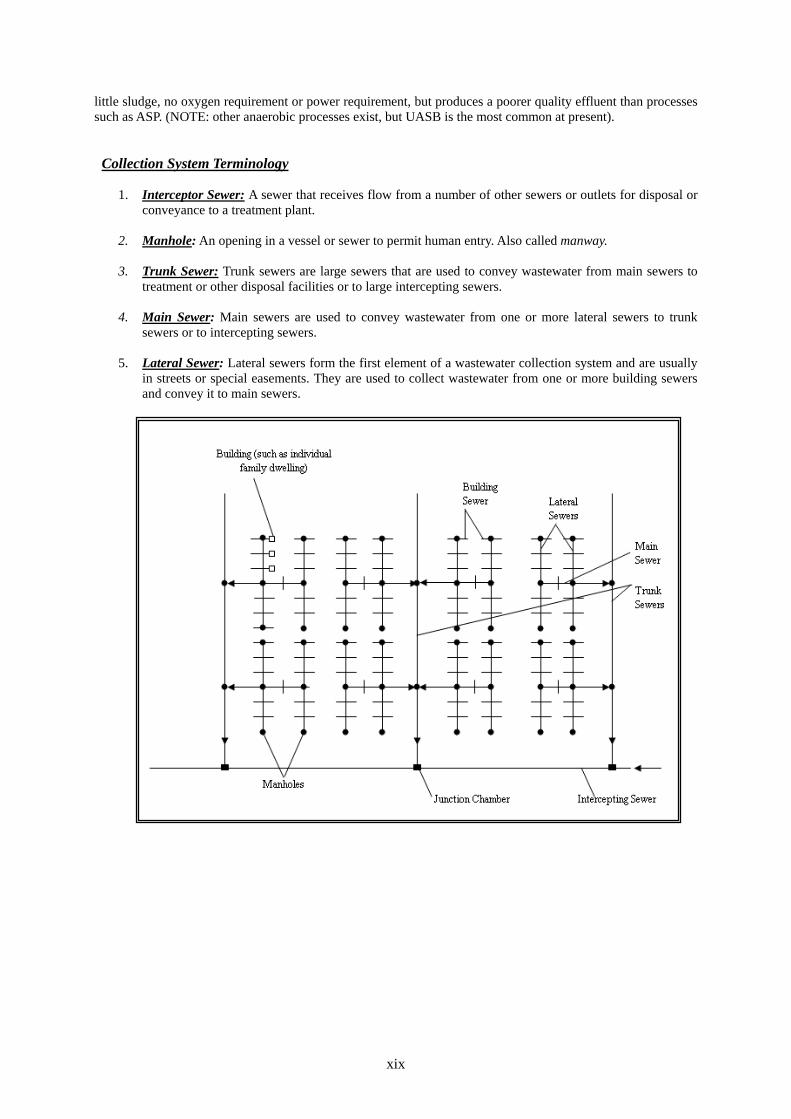
little sludge, no oxygen requirement or power requirement, but produces a poorer quality effluent than processes such as ASP. (NOTE: other anaerobic processes exist, but UASB is the most common at present). Collection System Terminology
1. Interceptor Sewer: A sewer that receives flow from a number of other sewers or outlets for disposal or
conveyance to a treatment plant. 2. Manhole: An opening in a vessel or sewer to permit human entry. Also called manway.
3. Trunk Sewer: Trunk sewers are large sewers that are used to convey wastewater from main sewers to
treatment or other disposal facilities or to large intercepting sewers. 4. Main Sewer: Main sewers are used to convey wastewater from one or more lateral sewers to trunk
sewers or to intercepting sewers. 5. Lateral Sewer: Lateral sewers form the first element of a wastewater collection system and are usually
in streets or special easements. They are used to collect wastewater from one or more building sewers and convey it to main sewers.
T
P
P
T
P
T
T
P
T
P
PP
PP
T
T
P
T
P
P
T
P
T
T
P
T
P
PP
PP
T
T
P
(6)(
7)(20)(10)
(23)
(9)
(26)
(17)
(16)
(18)
(8)
(11)
(12)
(21)
(19)
(1)(
2)
(15)
(13)
(4)
(5)
(3)
(24)
(25)
(22)
Dis
tric
t E
Dis
tric
t B
Dis
tric
t A
Dis
tric
t D
Dis
tric
t F
Dis
tric
t G
Dis
tric
t C
Dis
tric
t C
TH
E S
TU
DY
ON
WA
TE
R Q
UA
LIT
Y M
AN
AG
EM
EN
T P
LA
NFO
R G
AN
GA
RIV
ER
IN T
HE
RE
PUB
LIC
OF
IND
IAA
llaha
bad
City
Prop
osed
Sew
erag
e Fa
cilit
ies f
or F
easi
bilit
y St
udy
(Alla
haba
d)
Figu
re 4
.9
(14)
Bla
ck
:E
xist
ing
Faci
lity
Blu
e :
Sanc
tione
d Fa
cilit
y
Gre
en:
Prop
osed
Fac
ility
Pum
p St
atio
n
Trea
tmen
t Pla
nt
Lege
nd Mun
icip
al B
ound
ary
Sew
er
Risi
ng M
ain
P T
Sew
er /
Ris
ing
Mai
nD
istri
ctSt
atus
2N
ew tr
unk
sew
er in
Dis
trict
AA
P3
New
trun
k se
wer
in D
istri
ct B
BP
4R
isin
g m
ain
of S
asur
Kad
eri S
PSB
P5
Ris
ing
mai
n of
Gha
ghar
Nal
a SP
SB
PD
E/R
DE/
Rp
7N
ew tr
unk
sew
er in
Dis
trict
DD
P8
Ris
ing
mai
n of
Mor
igat
e SP
SD
P9
Ris
ing
mai
n of
Alo
piba
gh S
PSD
P10
Ris
ing
mai
n of
Mum
ford
ganj
SPS
DP
Pum
ping
Sta
tion
Dis
trict
Stat
usC
apac
ity(m
ld)
Rem
arks
11C
hach
ar n
ala
SPS
AE/
R30
12G
augh
at S
PSA
E/R
8013
Luke
rgan
j SPS
BE/
R9.
214
Sasu
r Kad
eri S
PSB
P13
15G
hagh
ar n
ala
SPS
BP
5016
Dar
agan
j SPS
DE/
R2.
617
Alla
hpur
SPS
DE/
R/A
2.8
18M
orig
ate
SPS
(Add
ition
al)
DE/
A6
19A
lopi
bagh
SPS
DE/
R/A
44.5
20M
umfo
rdga
nj S
PSD
E/R
/A50
Trea
tmen
t Pla
ntD
istri
ctSt
atus
Cap
acity
(mld
)R
emar
ks
21N
aini
STP
(ASP
)A
E/A
8022
Num
aya
Dah
i STP
(WSP
)B
P50
23R
ajap
ur S
TP (U
ASB
)D
P65
24K
odar
a ST
P (U
ASB
)E
P15
25Po
ngha
t STP
(WSP
)E
P10 22
0
Exi
stin
g / S
anct
ione
d Fa
cilit
y Faci
lity
Dis
trict
Stat
us
26Sa
lori
STP
(FA
B)
CS
E: E
xist
ing
R: R
ehab
ilita
tion
S: S
anct
ione
dA
: Aug
men
tatio
nP:
Pro
pose
dR
p: R
epla
cem
ent
300-
1000
mm
, 4.9
km
600
mm
, 0.2
km
1000
mm
, 7.7
km
500-
700
mm
, 4.0
km
Dia
met
er /
Leng
th
1
Rem
arks
1000
mm
, 2.7
km
Ave
rage
flow
in 2
015
Ave
rage
flow
in 2
015
Tota
l
Des
iltin
g: 5
00-1
300
mm
, 5.
5 km
450-
1200
mm
, 6.7
km
800
mm
, 1.8
km
1000
mm
, 3.1
km
6Ex
istin
g tru
nk se
wer
in D
istri
ct D
Rep
lace
.: 50
0-13
00 m
m,
3.8
km
Exis
ting
trunk
sew
er in
Dis
trict
AA
E/R
/Rp
Des
iltin
g: 6
00-1
150
mm
, 4.
1 km
Rep
lace
.: 70
0-14
00 m
m,
5.2
kmR
ehb.
: 700
-140
0 m
m,
1.7
km

CHAPTER 1
GENERAL
Final Report on Water Quality Management Plan for Ganga RiverVolume IV-3, Feasibility Study for Allahabad City, Part I, Sewerage Scheme
1-1
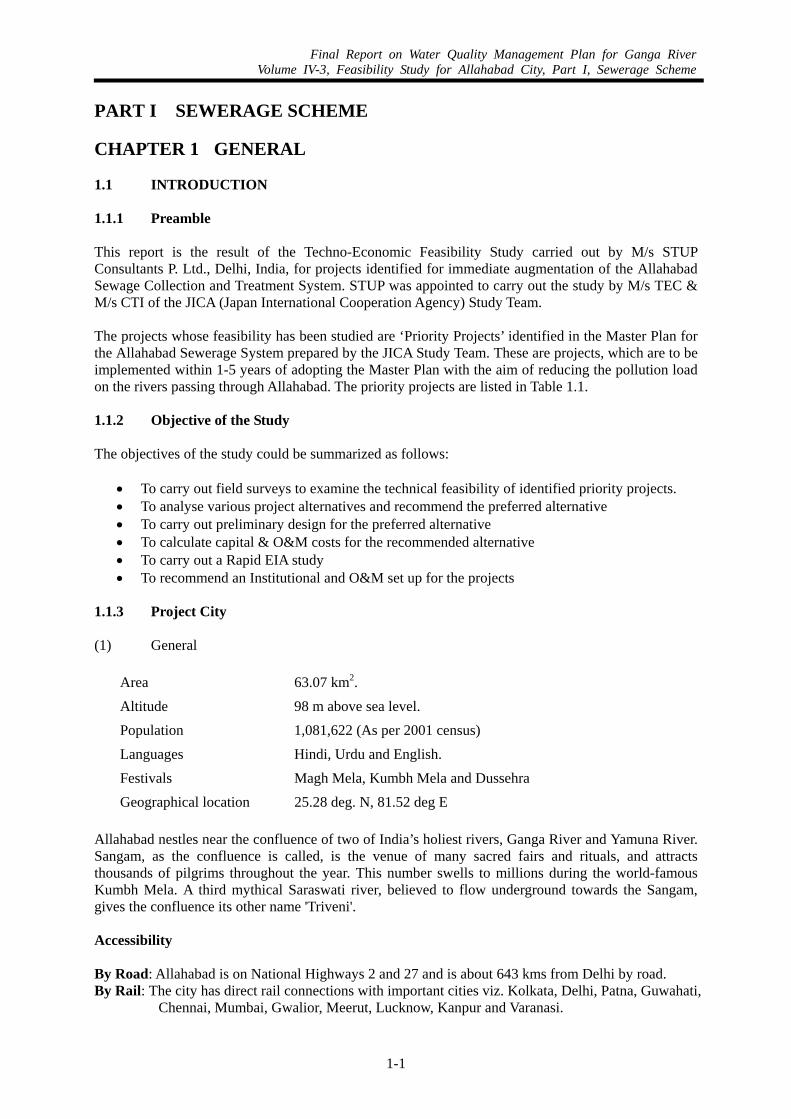
PART I SEWERAGE SCHEME CHAPTER 1 GENERAL 1.1 INTRODUCTION 1.1.1 Preamble This report is the result of the Techno-Economic Feasibility Study carried out by M/s STUP Consultants P. Ltd., Delhi, India, for projects identified for immediate augmentation of the Allahabad Sewage Collection and Treatment System. STUP was appointed to carry out the study by M/s TEC & M/s CTI of the JICA (Japan International Cooperation Agency) Study Team. The projects whose feasibility has been studied are ‘Priority Projects’ identified in the Master Plan for the Allahabad Sewerage System prepared by the JICA Study Team. These are projects, which are to be implemented within 1-5 years of adopting the Master Plan with the aim of reducing the pollution load on the rivers passing through Allahabad. The priority projects are listed in Table 1.1.
1.1.2 Objective of the Study
The objectives of the study could be summarized as follows:
• To carry out field surveys to examine the technical feasibility of identified priority projects. • To analyse various project alternatives and recommend the preferred alternative • To carry out preliminary design for the preferred alternative • To calculate capital & O&M costs for the recommended alternative • To carry out a Rapid EIA study • To recommend an Institutional and O&M set up for the projects
1.1.3 Project City
(1) General
Area 63.07 km2. Altitude 98 m above sea level. Population 1,081,622 (As per 2001 census) Languages Hindi, Urdu and English. Festivals Magh Mela, Kumbh Mela and Dussehra Geographical location 25.28 deg. N, 81.52 deg E
Allahabad nestles near the confluence of two of India’s holiest rivers, Ganga River and Yamuna River. Sangam, as the confluence is called, is the venue of many sacred fairs and rituals, and attracts thousands of pilgrims throughout the year. This number swells to millions during the world-famous Kumbh Mela. A third mythical Saraswati river, believed to flow underground towards the Sangam, gives the confluence its other name 'Triveni'.
Accessibility
By Road: Allahabad is on National Highways 2 and 27 and is about 643 kms from Delhi by road. By Rail: The city has direct rail connections with important cities viz. Kolkata, Delhi, Patna, Guwahati,
Chennai, Mumbai, Gwalior, Meerut, Lucknow, Kanpur and Varanasi.
Final Report on Water Quality Management Plan for Ganga RiverVolume IV-3, Feasibility Study for Allahabad City, Part I, Sewerage Scheme
1-2
(2) Climate and Rainfall
The mean of monthly maximum temperature varies from 23.6°C (January) to 42.3°C (May), and the mean of monthly minimum temperature in the range between 8.7°C (January) and 28.5°C (June). The normal annual total rainfall is 1,017.7 mm. August is the month with maximum precipitation (307.6 mm), followed closely by July (300.1 mm). The period from June to September (southwestern monsoon) accounts for about 87% of total rainfall. Winter rains occur mostly during the months of January and February, and account for about 1.6% of total rainfall.
(3) General Geology
The city of Allahabad occupies the interfluvial sediment of the Ganga River and Yamuna River. These sediments are essentially a sequence of clays, sands, silts with interspread bands of Kankar having limited extent. Broadly these fluvial sediments are grouped as younger and older alluvium. The younger alluvium is generally confined to a depth of 60 m below the ground and it occupies the present day flood plain area. The older alluvial sediments marginally differ in lithology from that of younger alluvium sediments, with presence of sandy clay and lenses of gravel/pebbles and Kankar. The older alluvium overlies the Siwalik group of formations, which in turn overlies the pre-Cambrian formation.
(4) Area under the Present Study
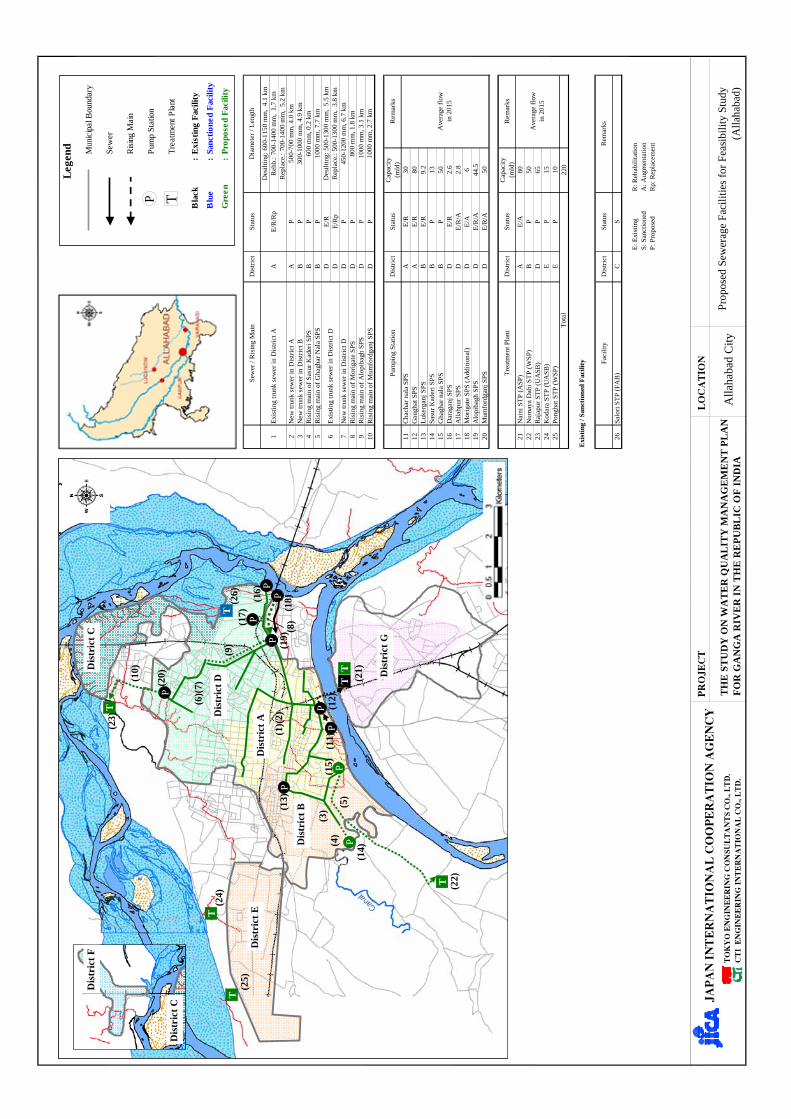
The Master Plan has divided Allahabad into seven sewerage Districts A-G, as shown in Figure 1.1. All the projects identified for the present feasibility study fall into four sewerage Districts viz. A, B, D and E except the existing Naini STP, which is located in the sewerage District G.
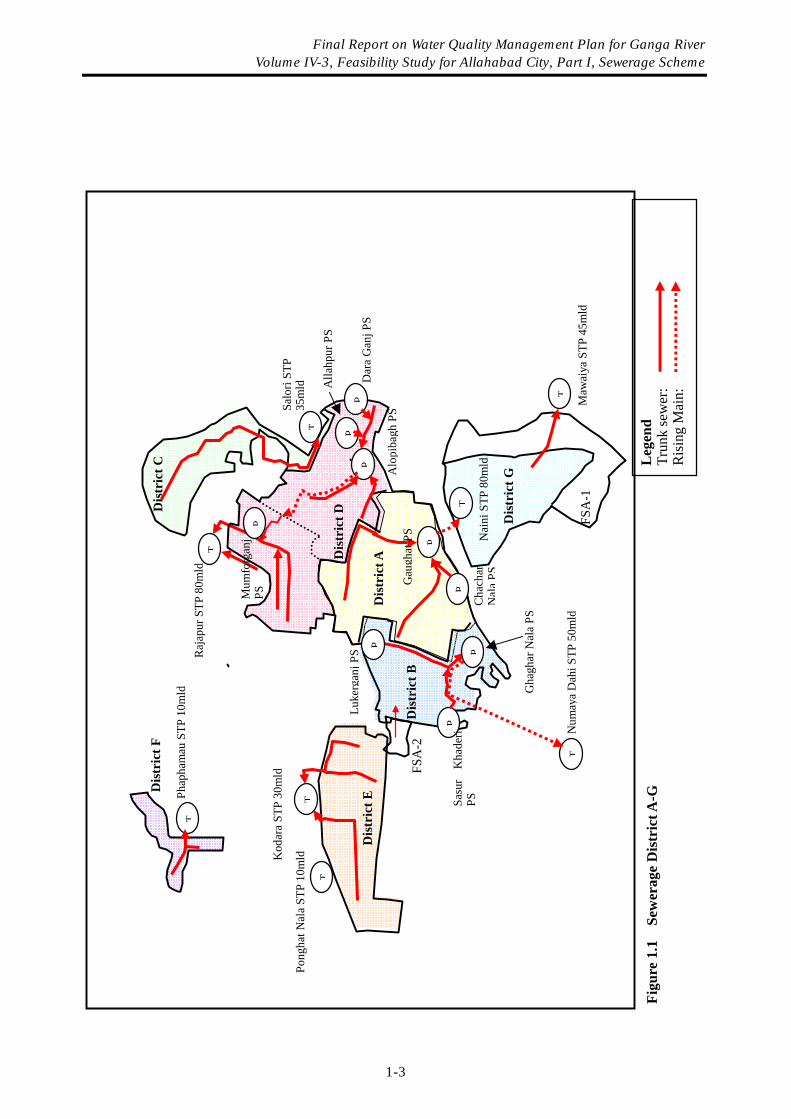
Figu
re 1
.1
Sew
erag
e D
istr
ict A
-G
L
egen
d Tr
unk
sew
er:
Ris
ing
Mai
n:
T
T
T
P
P
Dis
tric
t F
Dis
tric
t E
Dis
tric
t B
Phap
ham
au S
TP 1
0mld
Kod
ara
STP
30m
ld
Nai
ni S
TP 8
0mld
Alo
piba
gh P
S
Gau
ghat
PS
T
TN
umay
a D
ahi S
TP 5
0mld
Alla
hpur
PS
T
Dis
tric
t A
Dis
tric
t G
Dis
tric
t D
Raj
apur
STP
80m
ld
FSA
-1
T
Maw
aiya
STP
45m
ld
FSA
-2
Dis
tric
t C
P
Gha
ghar
Nal
a PS
P
Luke
rgan
j PS
T
Pong
hat N
ala
STP
10m
ld
PM
umfo
rgan
j PS
PSa
sur
Kha
deri
PSP
Cha
char
N
ala
PS
PPSalo
ri ST
P 35
mld
Dar
a G
anj P
S
Final Report on Water Quality Management Plan for Ganga River Volume IV-3, Feasibility Study for Allahabad City, Part I, Sewerage Scheme
1-3
Final Report on Water Quality Management Plan for Ganga RiverVolume IV-3, Feasibility Study for Allahabad City, Part I, Sewerage Scheme
1-4
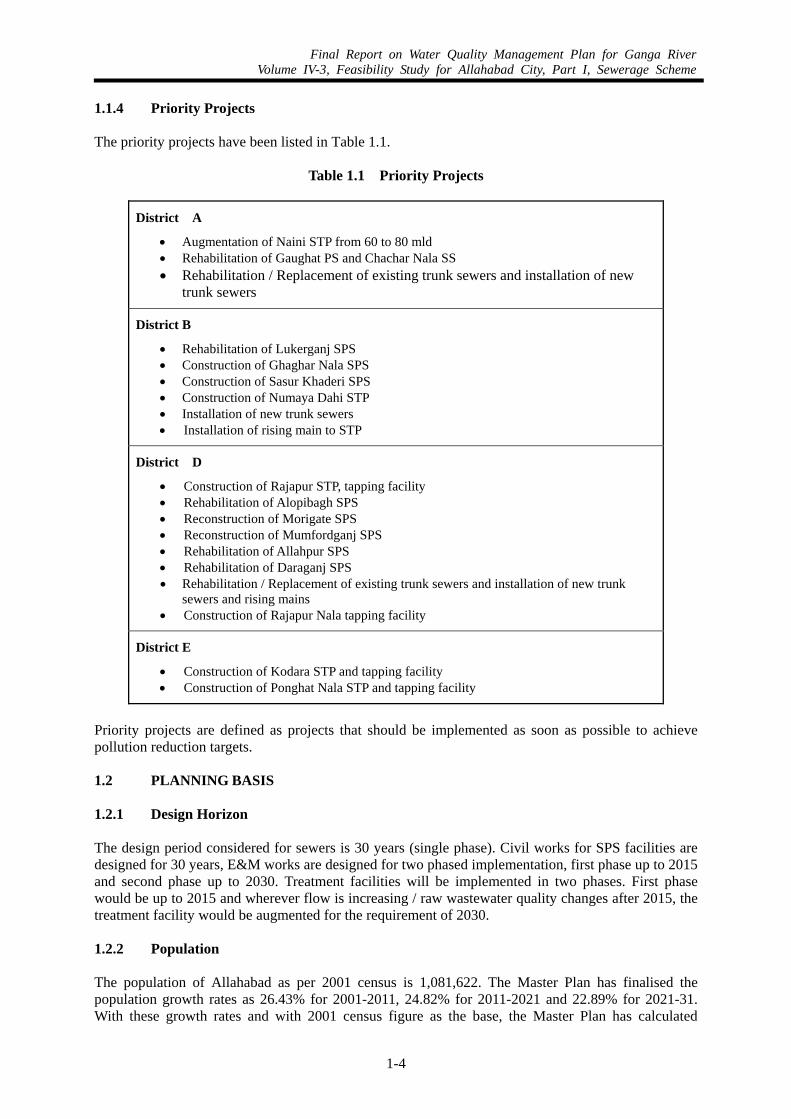
1.1.4 Priority Projects The priority projects have been listed in Table 1.1.
Table 1.1 Priority Projects
District A
• Augmentation of Naini STP from 60 to 80 mld • Rehabilitation of Gaughat PS and Chachar Nala SS • Rehabilitation / Replacement of existing trunk sewers and installation of new
trunk sewers
District B
• Rehabilitation of Lukerganj SPS • Construction of Ghaghar Nala SPS • Construction of Sasur Khaderi SPS • Construction of Numaya Dahi STP • Installation of new trunk sewers • Installation of rising main to STP
District D
• Construction of Rajapur STP, tapping facility • Rehabilitation of Alopibagh SPS • Reconstruction of Morigate SPS • Reconstruction of Mumfordganj SPS • Rehabilitation of Allahpur SPS • Rehabilitation of Daraganj SPS • Rehabilitation / Replacement of existing trunk sewers and installation of new trunk
sewers and rising mains • Construction of Rajapur Nala tapping facility
District E
• Construction of Kodara STP and tapping facility • Construction of Ponghat Nala STP and tapping facility
Priority projects are defined as projects that should be implemented as soon as possible to achieve pollution reduction targets. 1.2 PLANNING BASIS 1.2.1 Design Horizon The design period considered for sewers is 30 years (single phase). Civil works for SPS facilities are designed for 30 years, E&M works are designed for two phased implementation, first phase up to 2015 and second phase up to 2030. Treatment facilities will be implemented in two phases. First phase would be up to 2015 and wherever flow is increasing / raw wastewater quality changes after 2015, the treatment facility would be augmented for the requirement of 2030.
1.2.2 Population The population of Allahabad as per 2001 census is 1,081,622. The Master Plan has finalised the population growth rates as 26.43% for 2001-2011, 24.82% for 2011-2021 and 22.89% for 2021-31. With these growth rates and with 2001 census figure as the base, the Master Plan has calculated
Final Report on Water Quality Management Plan for Ganga RiverVolume IV-3, Feasibility Study for Allahabad City, Part I, Sewerage Scheme
1-5
district wise population figure and these are reproduced in Appendix A1.1. 1.2.3 Water Supply (1) Municipal Water Supply The main source of raw water for the municipal piped water supply system is Yamuna river. Intake of water from the river in 2003 was about 80 mld (approximately 35% of the total water supplied). Water is taken from a number of intake wells along the banks of Yamuna River at Karelibagh Raw Water Pumping Station. Raw water is pumped to Khusrobagh Water Works where it is treated using chemical and physical clarification followed by rapid sand filtration. Present treatment capacity is 130 mld. In 2003, approximately 137 mld was extracted from 134 deep tube wells operated by Jal Sansthan. In addition to tube wells operated by Jal Sansthan, there are many privately owned and institutional tube wells that provide an unknown amount of water. A total of 2,438 hand pumps provide water in places of water scarcity.
Table 1.2 Total Municipal Water Production
Production capacity (mld)
Yamuna River 80**
Tube Well 137**
Total 217 ** Production figures reported by Jal Sansthan Estimated by JICA Study Team
Estimated water production from municipal supplies is 217 mld (2) Estimated Per Capita Water Consumption
Table 1.3 Estimated Per Capita Water Consumption
Municipal Supply 217 mld
Population served 1,049,831 (in 2003)
Production capacity per capita* 207 lpcd
Les leakage losses estimated at 15% 180 lpcd *Including institutional/commercial components but excluding private supplies.
Hence, the present per capita water consumption of Municipal Water is 180 lpcd. This has been modified as follows in the Master Plan, to arrive at the final per capita water consumption.
• Add 20% to account for private supplies • Add 30% (UFW allowance) • Add 22 lpcd for commercial / institutional (C/I) demand.
The final figure thus works out to 295 lpcd for 2003. The corresponding calculations for 2015 & 2030 are as follows :
2015 – 170 lpcd + 20% UFW allowance + 42 lpcd (C/I) = 254 lpcd
Final Report on Water Quality Management Plan for Ganga RiverVolume IV-3, Feasibility Study for Allahabad City, Part I, Sewerage Scheme
1-6
2030 – 150 lpcd + 15% UFW allowance + 42 lpcd (C/I) = 221 lpcd
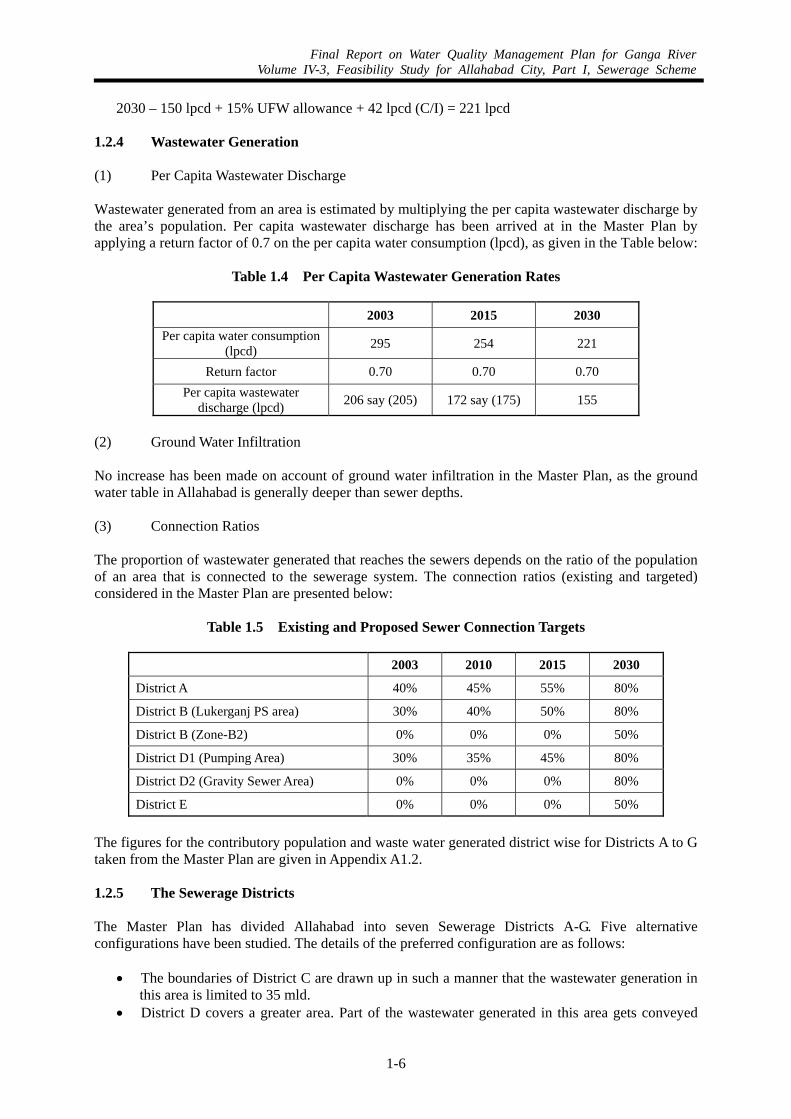
1.2.4 Wastewater Generation (1) Per Capita Wastewater Discharge Wastewater generated from an area is estimated by multiplying the per capita wastewater discharge by the area’s population. Per capita wastewater discharge has been arrived at in the Master Plan by applying a return factor of 0.7 on the per capita water consumption (lpcd), as given in the Table below:
Table 1.4 Per Capita Wastewater Generation Rates
2003 2015 2030 Per capita water consumption
(lpcd) 295 254 221
Return factor 0.70 0.70 0.70 Per capita wastewater
discharge (lpcd) 206 say (205) 172 say (175) 155
(2) Ground Water Infiltration No increase has been made on account of ground water infiltration in the Master Plan, as the ground water table in Allahabad is generally deeper than sewer depths.
(3) Connection Ratios The proportion of wastewater generated that reaches the sewers depends on the ratio of the population of an area that is connected to the sewerage system. The connection ratios (existing and targeted) considered in the Master Plan are presented below:
Table 1.5 Existing and Proposed Sewer Connection Targets
2003 2010 2015 2030
District A 40% 45% 55% 80%
District B (Lukerganj PS area) 30% 40% 50% 80%
District B (Zone-B2) 0% 0% 0% 50%
District D1 (Pumping Area) 30% 35% 45% 80%
District D2 (Gravity Sewer Area) 0% 0% 0% 80%
District E 0% 0% 0% 50%
The figures for the contributory population and waste water generated district wise for Districts A to G taken from the Master Plan are given in Appendix A1.2. 1.2.5 The Sewerage Districts The Master Plan has divided Allahabad into seven Sewerage Districts A-G. Five alternative configurations have been studied. The details of the preferred configuration are as follows:
• The boundaries of District C are drawn up in such a manner that the wastewater generation in
this area is limited to 35 mld. • District D covers a greater area. Part of the wastewater generated in this area gets conveyed
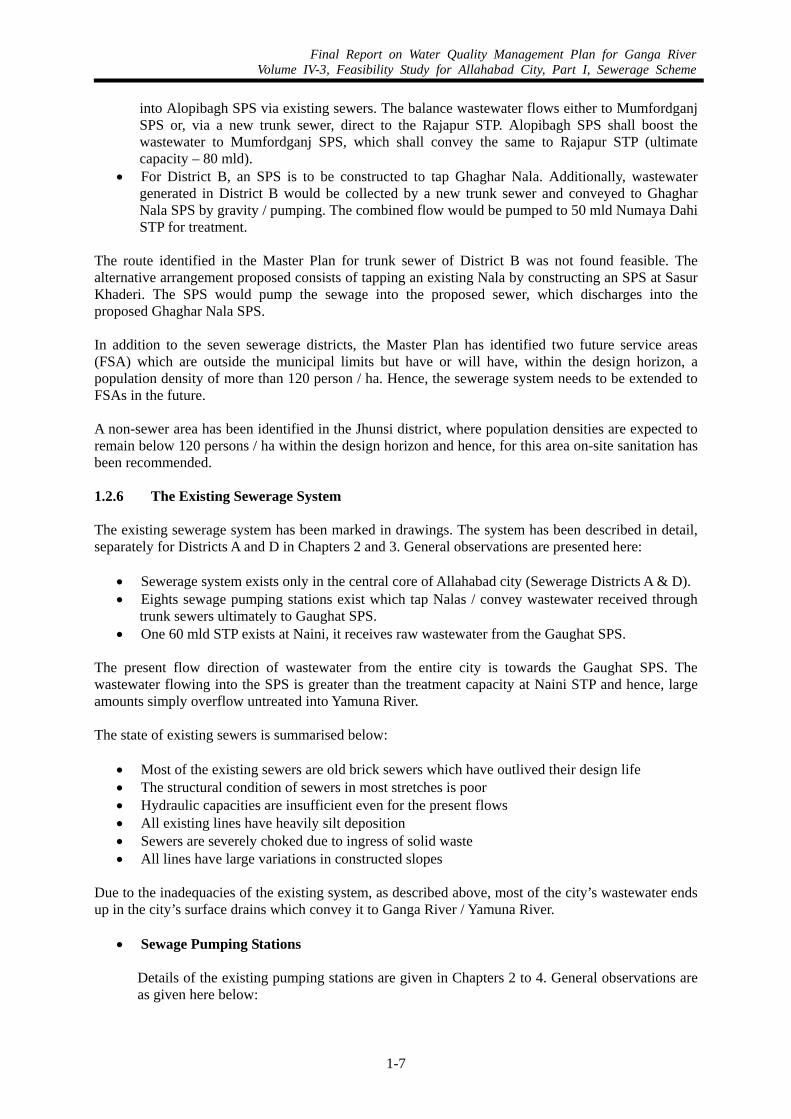
Final Report on Water Quality Management Plan for Ganga RiverVolume IV-3, Feasibility Study for Allahabad City, Part I, Sewerage Scheme
1-7
into Alopibagh SPS via existing sewers. The balance wastewater flows either to Mumfordganj SPS or, via a new trunk sewer, direct to the Rajapur STP. Alopibagh SPS shall boost the wastewater to Mumfordganj SPS, which shall convey the same to Rajapur STP (ultimate capacity – 80 mld).
• For District B, an SPS is to be constructed to tap Ghaghar Nala. Additionally, wastewater generated in District B would be collected by a new trunk sewer and conveyed to Ghaghar Nala SPS by gravity / pumping. The combined flow would be pumped to 50 mld Numaya Dahi STP for treatment.
The route identified in the Master Plan for trunk sewer of District B was not found feasible. The alternative arrangement proposed consists of tapping an existing Nala by constructing an SPS at Sasur Khaderi. The SPS would pump the sewage into the proposed sewer, which discharges into the proposed Ghaghar Nala SPS. In addition to the seven sewerage districts, the Master Plan has identified two future service areas (FSA) which are outside the municipal limits but have or will have, within the design horizon, a population density of more than 120 person / ha. Hence, the sewerage system needs to be extended to FSAs in the future.
A non-sewer area has been identified in the Jhunsi district, where population densities are expected to remain below 120 persons / ha within the design horizon and hence, for this area on-site sanitation has been recommended.
1.2.6 The Existing Sewerage System The existing sewerage system has been marked in drawings. The system has been described in detail, separately for Districts A and D in Chapters 2 and 3. General observations are presented here:
• Sewerage system exists only in the central core of Allahabad city (Sewerage Districts A & D). • Eights sewage pumping stations exist which tap Nalas / convey wastewater received through
trunk sewers ultimately to Gaughat SPS. • One 60 mld STP exists at Naini, it receives raw wastewater from the Gaughat SPS.
The present flow direction of wastewater from the entire city is towards the Gaughat SPS. The wastewater flowing into the SPS is greater than the treatment capacity at Naini STP and hence, large amounts simply overflow untreated into Yamuna River. The state of existing sewers is summarised below:
• Most of the existing sewers are old brick sewers which have outlived their design life • The structural condition of sewers in most stretches is poor • Hydraulic capacities are insufficient even for the present flows • All existing lines have heavily silt deposition • Sewers are severely choked due to ingress of solid waste • All lines have large variations in constructed slopes
Due to the inadequacies of the existing system, as described above, most of the city’s wastewater ends up in the city’s surface drains which convey it to Ganga River / Yamuna River.
• Sewage Pumping Stations
Details of the existing pumping stations are given in Chapters 2 to 4. General observations are as given here below:
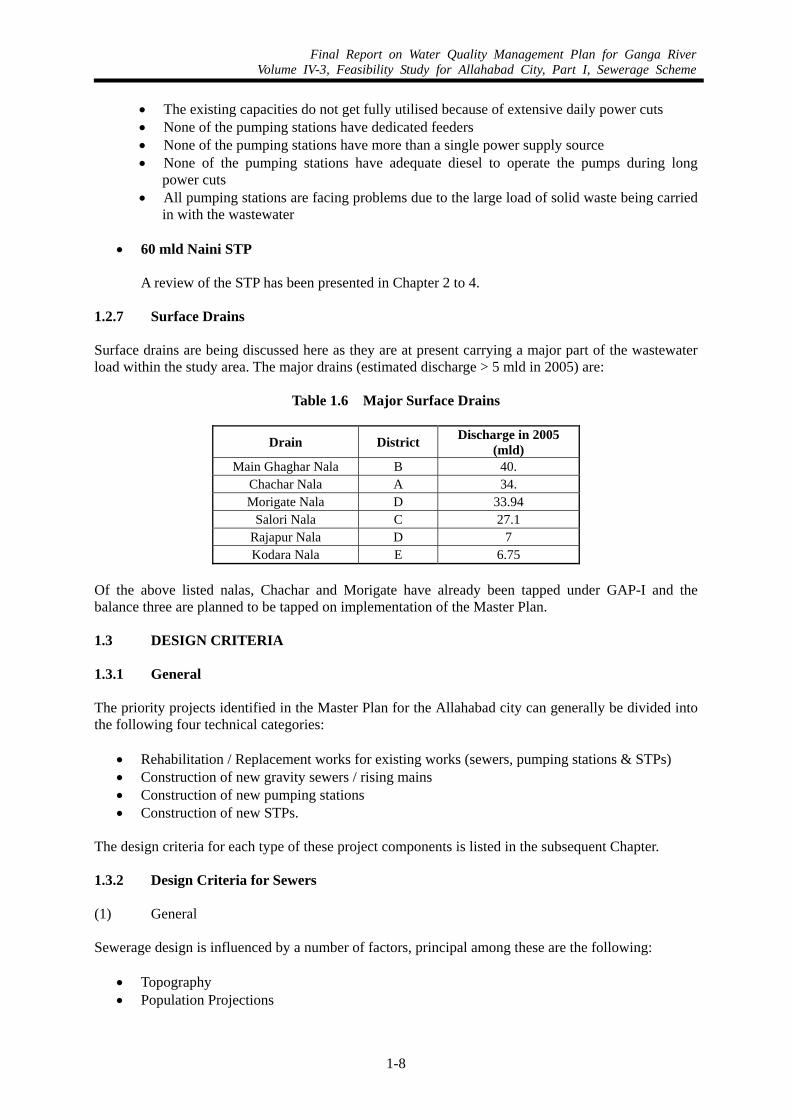
Final Report on Water Quality Management Plan for Ganga RiverVolume IV-3, Feasibility Study for Allahabad City, Part I, Sewerage Scheme
1-8
• The existing capacities do not get fully utilised because of extensive daily power cuts • None of the pumping stations have dedicated feeders • None of the pumping stations have more than a single power supply source • None of the pumping stations have adequate diesel to operate the pumps during long
power cuts • All pumping stations are facing problems due to the large load of solid waste being carried
in with the wastewater
• 60 mld Naini STP
A review of the STP has been presented in Chapter 2 to 4.
1.2.7 Surface Drains Surface drains are being discussed here as they are at present carrying a major part of the wastewater load within the study area. The major drains (estimated discharge > 5 mld in 2005) are:
Table 1.6 Major Surface Drains
Drain District Discharge in 2005 (mld)
Main Ghaghar Nala B 40. Chachar Nala A 34. Morigate Nala D 33.94
Salori Nala C 27.1 Rajapur Nala D 7 Kodara Nala E 6.75
Of the above listed nalas, Chachar and Morigate have already been tapped under GAP-I and the balance three are planned to be tapped on implementation of the Master Plan. 1.3 DESIGN CRITERIA 1.3.1 General The priority projects identified in the Master Plan for the Allahabad city can generally be divided into the following four technical categories:
• Rehabilitation / Replacement works for existing works (sewers, pumping stations & STPs) • Construction of new gravity sewers / rising mains • Construction of new pumping stations • Construction of new STPs.
The design criteria for each type of these project components is listed in the subsequent Chapter. 1.3.2 Design Criteria for Sewers (1) General Sewerage design is influenced by a number of factors, principal among these are the following:
• Topography • Population Projections
Final Report on Water Quality Management Plan for Ganga RiverVolume IV-3, Feasibility Study for Allahabad City, Part I, Sewerage Scheme
1-9
o Spatial population distribution o Water supply in the region
The above listed factors have been discussed in the previous section. The other technical design criteria are discussed hereafter. All designs generally conform to the Manual on Sewerage and Sewage Treatment, 1993 of Central Public Health and Environmental Engineering Organisation (CPHEEO), Ministry of Urban Development, Government of India. (2) Design Horizon Design horizon for sewers and rising mains is 2030. (3) Design Flow Design flows in terms of average flow and peak flow, for all trunk sewers and rising mains have been adopted as per Master Plan recommendations for all design horizons. (4) Selection of Material The various available materials for sewers are RCC (pre-cast or cast-in-situ), stoneware, cast iron, ductile iron and plastic pipes. A comparison statement, giving the advantages and disadvantages of each type is given below in Table 1.7. External Traffic / Earth Load Considering all the above factors, RCC pipes are found to be technically suitable and the least cost solution for gravity lines. More over, the materials used extensively for sewerage in most Indian cities are glazed stoneware / vitrified clay and reinforced concrete pipes for gravity sewers whereas PSC /cast iron / ductile iron pipes are employed for rising / force mains of pumping stations. Concrete pipes conforming to IS: 458 of appropriate strength with proper anti-corrosive lining may even last for about 50-60 years. Considering the capital cost, durability and availability of the pipes, RCC pipes, preferably NP3/NP4 class as per IS: 458-1988, has been proposed for gravity sewers. Concrete pipes are usually laid and jointed by collar joints. For rising mains, Ductile Iron (DI)/PSC pipes have been found suitable, but DI pipes are costlier than PSC; hence PSC pipes have been considered here.
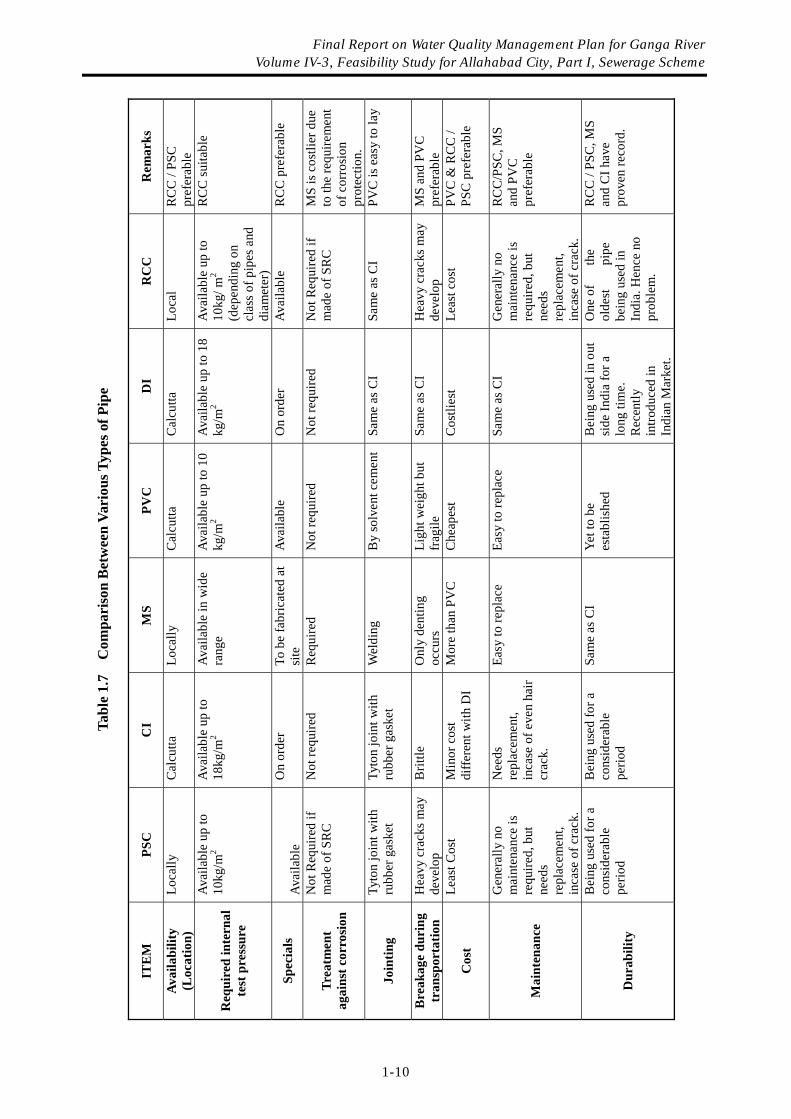
Tabl
e 1.
7 C
ompa
riso
n B
etw
een
Vari
ous T
ypes
of P
ipe
ITE
M
PSC
C
I M
S PV
C
DI
RC
C
Rem
arks
Avai
labi
lity
(Loc
atio
n)
Loca
lly
Cal
cutta
Lo
cally
Cal
cutta
C
alcu
tta
Loca
l R
CC
/ PS
C
pref
erab
le
Req
uire
d in
tern
al
test
pre
ssur
e
Avai
labl
e up
to
10kg
/m2
Avai
labl
e up
to
18kg
/m2
Avai
labl
e in
wid
e ra
nge
Av
aila
ble
up to
10
kg/m
2 Av
aila
ble
up to
18
kg/m
2
Avai
labl
e up
to
10kg
/ m2
(dep
endi
ng o
n cl
ass o
f pip
es a
nd
diam
eter
)
RC
C su
itabl
e
Spec
ials
Av
aila
ble
On
orde
r To
be
fabr
icat
ed a
t si
te
Avai
labl
e O
n or
der
Avai
labl
e R
CC
pre
fera
ble
Trea
tmen
t ag
ains
t cor
rosi
on
Not
Req
uire
d if
mad
e of
SR
C
Not
requ
ired
Req
uire
d N
ot re
quire
d N
ot re
quire
d N
ot R
equi
red
if m
ade
of S
RC
M
S is
cos
tlier
due
to
the
requ
irem
ent
of c
orro
sion
pr
otec
tion.
Join
ting
Tyto
n jo
int w
ith
rubb
er g
aske
t Ty
ton
join
t with
ru
bber
gas
ket
Wel
ding
B
y so
lven
t cem
ent
Sam
e as
CI
Sam
e as
CI
PVC
is e
asy
to la
y
Bre
akag
e du
ring
tr
ansp
orta
tion
Hea
vy c
rack
s may
de
velo
p B
rittle
Onl
y de
ntin
g oc
curs
Li
ght w
eigh
t but
fr
agile
Sa
me
as C
I H
eavy
cra
cks m
ay
deve
lop
MS
and
PVC
pr
efer
able
Cos
t Le
ast C
ost
Min
or c
ost
diffe
rent
with
DI
Mor
e th
an P
VC
C
heap
est
Cos
tlies
t Le
ast c
ost
PV
C &
RC
C /
PSC
pre
fera
ble
Mai
nten
ance
Gen
eral
ly n
o m
aint
enan
ce is
re
quire
d, b
ut
need
s re
plac
emen
t, in
case
of c
rack
.
Nee
ds
repl
acem
ent,
inca
se o
f eve
n ha
ir cr
ack.
Easy
to re
plac
e Ea
sy to
repl
ace
Sam
e as
CI
Gen
eral
ly n
o m
aint
enan
ce is
re
quire
d, b
ut
need
s re
plac
emen
t, in
case
of c
rack
.
RC
C/P
SC, M
S an
d PV
C
pref
erab
le
Dur
abili
ty
Bei
ng u
sed
for a
co
nsid
erab
le
perio
d
Bei
ng u
sed
for a
co
nsid
erab
le
perio
d
Sam
e as
CI
Yet t
o be
es
tabl
ishe
d B
eing
use
d in
out
si
de In
dia
for a
lo
ng ti
me.
R
ecen
tly
intro
duce
d in
In
dian
Mar
ket.
One
of
the
olde
st
pipe
be
ing
used
in
Indi
a. H
ence
no
prob
lem
.
RC
C /
PSC
, MS
and
CI h
ave
prov
en re
cord
.
Final Report on Water Quality Management Plan for Ganga River Volume IV-3, Feasibility Study for Allahabad City, Part I, Sewerage Scheme
1-10
Final Report on Water Quality Management Plan for Ganga RiverVolume IV-3, Feasibility Study for Allahabad City, Part I, Sewerage Scheme
1-11
(5) Peak Factors Depending on the contributory population, the peak factor changes - it being higher for less population and low for high population.
Table 1.8 Peak Factors Considered for Sewerage Design
(6) Hydraulics of Sewers For design purposes, the flow of sewage in pipes is presumed to be steady and uniform flow. The most popular equation for calculating the velocity and head loss for flow conditions in gravity sewers is Manning’s formula, which has been used in this feasibility study for designs of gravity sewers. Roughness factor n= 0.015 (RCC Pipes) n= 0.017 old brick sewer (7) Depth of Flow The sewerage system for the ultimate design year has been designed to utilise 80% of the full bore of the pipe at peak flows. (8) Velocities The sewerage system has been designed for a minimum velocity of 0.8 m/sec. for design flow i.e. peak flow at design horizon. Minimum velocity 0.60 m/s initial flow 0.80 m/s ultimate flow Maximum velocity 3.00 m/s The maximum velocity is restricted to just below the scouring velocity, which is 3 m/sec as recommended in the CPHEEO manual. (9) Sizing of Pipes and Slopes The pipe diameter is selected by selecting the corresponding flattest slope while achieving the minimum required self-cleaning velocity; with an aim to minimize sewer depth thus ensuring reduced cost. In cases where (i) the topography does not permit to have the calculated gradient and/or (ii) the proposed sewer is to be connected to an existing line, which is at a shallow depth, a higher size pipe is selected to match the crown of connecting sewers. Wherever the proposed sewers are to be discharged in existing sewers, invert level constraints and available slope has been considered for sizing the pipe in addition to the other criteria.
Contributory Population Peak Factor as per CPHEEO Manual
Up to 20,000 3.00
20,000 - 50,000 2.50
50,000 - 7,50,000 2.25
Above 7,50,000 2.00
For tapping nalas 2.50
Final Report on Water Quality Management Plan for Ganga RiverVolume IV-3, Feasibility Study for Allahabad City, Part I, Sewerage Scheme
1-12
(10) Minimum Pipe Size The interceptor sewers have been designed considering the minimum size of sewer as 500 mm and secondary sewers as 300 mm. (11) Minimum Depth of Cover The starting manhole depth of the proposed sewers ranges from 2 m to 3 m depending upon the topography and considering the depth of secondary sewer and laterals. The minimum depth of cover thus depends on the depth of starting manhole and the subsequent ground level of the road along the sewer. (12) Maximum Depth of Sewer In many areas construction of sewers below 10 meters becomes very difficult. This increases the cost of construction and maintenance. As per the prevailing practice sewage has to be lifted up by pumping once the sewer depth reaches 10 meters. The sewerage system has been designed such that the maximum cover of sewer will be less than 10 meters below ground level. Hence it does not require any intermediate pumping station. Wherever it is not possible to convey the sewage by gravity, existing intermediate pumping facilities have been used by augmenting them. (13) Sewer Appurtenances Manholes Standard circular manholes have been recommended for pipe diameter up to 1200 mm. However, rectangular manholes should be provided for shallow depths. Spacing of manholes has been kept between 30-60 m considering factors such as cleaning of sewers, ventilation requirements for men working in sewers and conveying material for repairs. Diameter of the manhole shall be per Table 1.9.
Table 1.9 Details of Manholes
Sr. Depth Diameter
Up to 1000 mm dia Sewers A For depths above 0.90 m and up to 1.65m 900 mm B For depths above 1.65m and up to 2.50 m 1200 mm C For depths above 2.5m and up to 5.0m 1500 mm D For depths above 5.0m and up to 9.5 m 1500 mm
Since the cost of RCC manhole is very high and stone is not available in Allahabad, brick masonry manholes have been provided in design. Scraper Manholes For sewers of diameter 600 mm and above, scraper manholes shall be provided at major junctions and at an interval of every 150 m. Scraper manhole openings will be of minimum 900 to 1200 mm size to permit lowering of sewer cleaning equipment. It is very important to construct scraper manholes as the sewers have been designed to serve for long term, and shall run with less flow during the initial years, resulting into silting. Drop Arrangement
Final Report on Water Quality Management Plan for Ganga RiverVolume IV-3, Feasibility Study for Allahabad City, Part I, Sewerage Scheme
1-13
The drop arrangement consists of a pipe that drops the invert of the incoming sewer to that of the main sewer in the manhole. The diameter of the drop pipe should be at least as large as the incoming pipe. Theoretically drop arrangements are provided where the drop of an incoming sewer in manhole exceeds 600 mm. Drop arrangements are provided in manhole for the following reasons:
• To convey the sewage to bottom of the manhole without splashing • To minimize the scouring action of the sewage falling from a height on the cement concrete
floor of the manhole • For the safety of the personnel who enter the manhole
Receiving Manhole at Pressure Line Discharge A 2 m x 2 m receiving sump with the provision of PVC splash pad has been proposed for chamber-type manhole into which pressure line is discharged prior to joining the gravity sewer. Vent Shafts Ventilation shafts must be provided at the head end of every sewer and along the sewers at about 150-m interval as well as at junctions. Encasement of Sewer It is not advisable to have sewer pipeline above any water supply pipeline. It is also not desirable to have sewer at close proximity of water supply pipelines. However, in the event of any unavoidable situation the sewer will be encased with M15 grade concrete. (14) Selection of Pipe Class The class of concrete pipes is decided on the basis of analysis of design loads likely to be imposed upon the sewer depending upon its depth. Structural Design of Buried Sewers Any sewer line buried into the ground should have adequate strength to withstand the stresses imposed not only by the internal pressure but also more importantly, by the stresses induced by external loads. There are two types of external loads, one is due to the backfill material known as backfill load and other is due to superimposed loads. Besides these external loads, the sewer line is also subjected to the load of water in the pipeline, especially during surcharge conditions.
(a) Load on Conduit due to Backfill The load on a buried conduit is equal to the weight of the prism of earth directly over the conduit plus the frictional shearing forces transferred to the prism by the adjacent prism of earth. The most widely used method for determining the vertical load due to backfill on buried conduit is Martson’s Formula, the general form of which is
W = C.w.B2 where, W = Vertical load in kg per meter length acting on the conduit due to gravity loads w = Unit weight of earth, kg/m3 B = Width of trench or conduit depending upon type of installation condition, m
Final Report on Water Quality Management Plan for Ganga RiverVolume IV-3, Feasibility Study for Allahabad City, Part I, Sewerage Scheme
1-14
C = Dimensionless coefficient that measures the effect of ratio of height of fill to width of trench or conduit
The value of C for various types of installation and depending on the height / width ratio is given in the Manual of Sewerage and Sewage Treatment (CPHEEO) published by the Ministry of Housing and Urban Affairs, New Delhi. The C-value for 'Ordinary maximum for clay' has been considered for design purposes. The unit weight of earth varies from 1,600 kg / m3 for dry sand to 2,100 kg/ m3 for saturated clay.
(b) Load on Conduit due to Superimposed Load Superimposed loads may be either concentrated or distributed loads. The formula for load due to concentrated load such as truck wheel is given by Boussinesq’s formula
Wsc = Cs(PF/L) where, Wsc = load on the conduit, kg/m P = concentrated load acting on the surface, kg F = impact factor (1.0 for air field runways, 1.5 for highway traffic and air
taxi ways, 1.75 for railway traffic) and Cs = load coefficient which is a function of Bc/2H and L/2H, where H = the height of the top of conduit to ground surface, m Bc = the outside width of conduit, m and L = effective length of the conduit to which the load is transmitted, m.
(c) Distributed Superimposed Loads
For distributed superimposed loads, the formula for the conduit is given by
Wsd = Cs.p.F.Bc where, Wsd = load on conduit, kg/m p = intensity of distributed load, kg/m2 F = impact factor Bc = width of conduit, m Cs = load coefficient, a function of D/2H and L/2H H = height of the top of conduit to the ground surface, m and D and L are
width and length respectively of the area over which the distributed load acts, in meters.
For class AA IRC loading in the critical case of 6.25 tones wheel load, the intensity of distributed load with wheel area 300mm x 150mm is given by P = 6.25/(0.3x0.15) T/m2.
(d) Supporting Strength of Rigid Conduit The ability of a conduit to resist safely the earth load depends on its inherent strength as well as the distribution of vertical load and bedding reaction and on the lateral pressure acting against the sides of the conduit. The inherent strength of a rigid conduit is usually expressed in terms of the three edge bearing test results, the condition of which are however different from the field load conditions. For strength calculations of NP class precast RCC pipes, IS: 458 (1988) is used.
(e) Field Supporting Strength
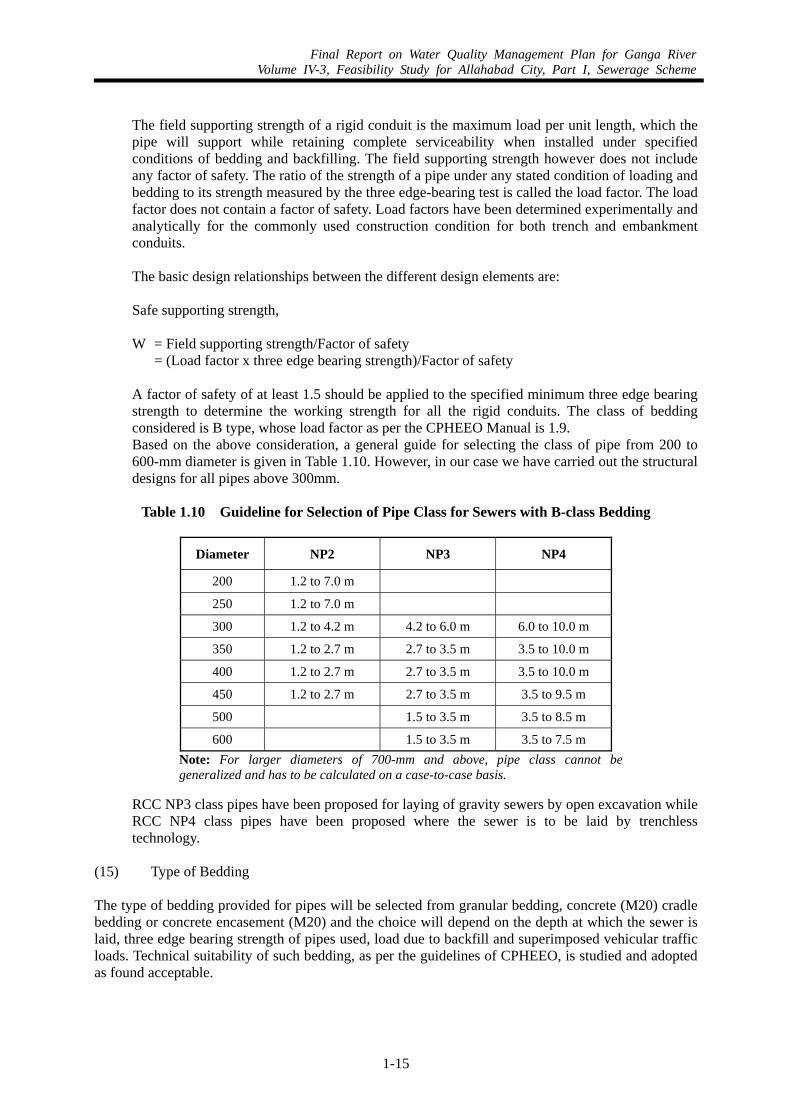
Final Report on Water Quality Management Plan for Ganga RiverVolume IV-3, Feasibility Study for Allahabad City, Part I, Sewerage Scheme
1-15
The field supporting strength of a rigid conduit is the maximum load per unit length, which the pipe will support while retaining complete serviceability when installed under specified conditions of bedding and backfilling. The field supporting strength however does not include any factor of safety. The ratio of the strength of a pipe under any stated condition of loading and bedding to its strength measured by the three edge-bearing test is called the load factor. The load factor does not contain a factor of safety. Load factors have been determined experimentally and analytically for the commonly used construction condition for both trench and embankment conduits. The basic design relationships between the different design elements are: Safe supporting strength, W = Field supporting strength/Factor of safety = (Load factor x three edge bearing strength)/Factor of safety A factor of safety of at least 1.5 should be applied to the specified minimum three edge bearing strength to determine the working strength for all the rigid conduits. The class of bedding considered is B type, whose load factor as per the CPHEEO Manual is 1.9. Based on the above consideration, a general guide for selecting the class of pipe from 200 to 600-mm diameter is given in Table 1.10. However, in our case we have carried out the structural designs for all pipes above 300mm.
Table 1.10 Guideline for Selection of Pipe Class for Sewers with B-class Bedding
Diameter NP2 NP3 NP4
200 1.2 to 7.0 m
250 1.2 to 7.0 m
300 1.2 to 4.2 m 4.2 to 6.0 m 6.0 to 10.0 m
350 1.2 to 2.7 m 2.7 to 3.5 m 3.5 to 10.0 m
400 1.2 to 2.7 m 2.7 to 3.5 m 3.5 to 10.0 m
450 1.2 to 2.7 m 2.7 to 3.5 m 3.5 to 9.5 m
500 1.5 to 3.5 m 3.5 to 8.5 m
600 1.5 to 3.5 m 3.5 to 7.5 m Note: For larger diameters of 700-mm and above, pipe class cannot be generalized and has to be calculated on a case-to-case basis.
RCC NP3 class pipes have been proposed for laying of gravity sewers by open excavation while RCC NP4 class pipes have been proposed where the sewer is to be laid by trenchless technology.
(15) Type of Bedding The type of bedding provided for pipes will be selected from granular bedding, concrete (M20) cradle bedding or concrete encasement (M20) and the choice will depend on the depth at which the sewer is laid, three edge bearing strength of pipes used, load due to backfill and superimposed vehicular traffic loads. Technical suitability of such bedding, as per the guidelines of CPHEEO, is studied and adopted as found acceptable.
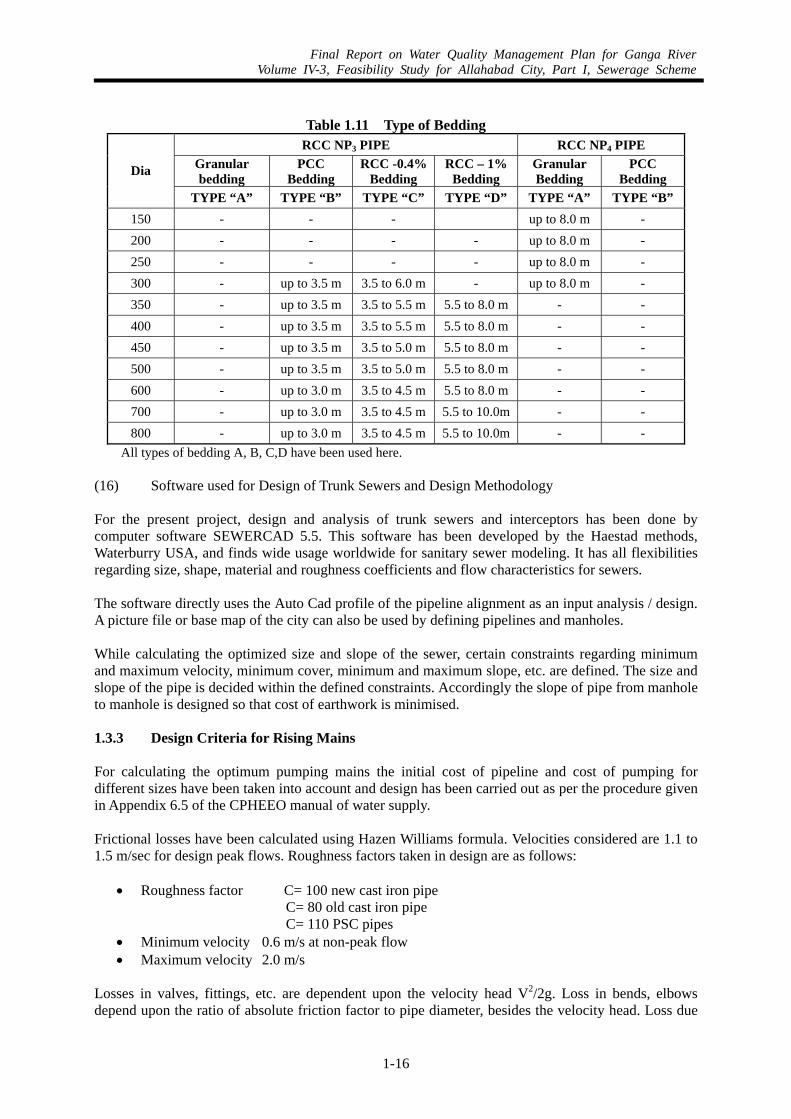
Final Report on Water Quality Management Plan for Ganga RiverVolume IV-3, Feasibility Study for Allahabad City, Part I, Sewerage Scheme
1-16
Table 1.11 Type of Bedding
RCC NP3 PIPE RCC NP4 PIPE Granular bedding
PCC Bedding
RCC -0.4% Bedding
RCC – 1% Bedding
Granular Bedding
PCC Bedding Dia
TYPE “A” TYPE “B” TYPE “C” TYPE “D” TYPE “A” TYPE “B”150 - - - up to 8.0 m - 200 - - - - up to 8.0 m - 250 - - - - up to 8.0 m - 300 - up to 3.5 m 3.5 to 6.0 m - up to 8.0 m - 350 - up to 3.5 m 3.5 to 5.5 m 5.5 to 8.0 m - - 400 - up to 3.5 m 3.5 to 5.5 m 5.5 to 8.0 m - - 450 - up to 3.5 m 3.5 to 5.0 m 5.5 to 8.0 m - - 500 - up to 3.5 m 3.5 to 5.0 m 5.5 to 8.0 m - - 600 - up to 3.0 m 3.5 to 4.5 m 5.5 to 8.0 m - - 700 - up to 3.0 m 3.5 to 4.5 m 5.5 to 10.0m - - 800 - up to 3.0 m 3.5 to 4.5 m 5.5 to 10.0m - -
All types of bedding A, B, C,D have been used here.
(16) Software used for Design of Trunk Sewers and Design Methodology For the present project, design and analysis of trunk sewers and interceptors has been done by computer software SEWERCAD 5.5. This software has been developed by the Haestad methods, Waterburry USA, and finds wide usage worldwide for sanitary sewer modeling. It has all flexibilities regarding size, shape, material and roughness coefficients and flow characteristics for sewers. The software directly uses the Auto Cad profile of the pipeline alignment as an input analysis / design. A picture file or base map of the city can also be used by defining pipelines and manholes. While calculating the optimized size and slope of the sewer, certain constraints regarding minimum and maximum velocity, minimum cover, minimum and maximum slope, etc. are defined. The size and slope of the pipe is decided within the defined constraints. Accordingly the slope of pipe from manhole to manhole is designed so that cost of earthwork is minimised. 1.3.3 Design Criteria for Rising Mains For calculating the optimum pumping mains the initial cost of pipeline and cost of pumping for different sizes have been taken into account and design has been carried out as per the procedure given in Appendix 6.5 of the CPHEEO manual of water supply. Frictional losses have been calculated using Hazen Williams formula. Velocities considered are 1.1 to 1.5 m/sec for design peak flows. Roughness factors taken in design are as follows:
• Roughness factor C= 100 new cast iron pipe C= 80 old cast iron pipe C= 110 PSC pipes
• Minimum velocity 0.6 m/s at non-peak flow • Maximum velocity 2.0 m/s
Losses in valves, fittings, etc. are dependent upon the velocity head V2/2g. Loss in bends, elbows depend upon the ratio of absolute friction factor to pipe diameter, besides the velocity head. Loss due
Final Report on Water Quality Management Plan for Ganga RiverVolume IV-3, Feasibility Study for Allahabad City, Part I, Sewerage Scheme
1-17
to sudden enlargement depends upon the ratio of diameters. The pump capacity together with rising main diameter have been calculated considering pump cost, rising main cost and annual operation & maintenance cost. Lesser diameter rising main may be cheaper in initial cost but the operation cost may be more due to increased pump head. The most economical size of the pumping main have been selected as per CPHEEO manual and following factors have been analysed:
• The different diameter of pipes for different head losses, which can be considered for the quantity of sewage, intended to be transported.
• The design period and the quantum of flow to be carried out for design period. • The pipe and its relative cost including cost of laying and jointing. • The cost of pump and its installation against the various diameters of pipes. • The annual and capitalised cost of electric charges. • Minimum required velocity (scouring) in pipeline (should be 0.6 m/sec) during non-peak
condition. • Maximum allowable velocity in pipe line (should not be more than 2.0 m/sec)
Following parameters have been taken for designing of most economical size of rising main:
Electric charges Rs. 3.25 per unit Capitalised energy charges CC = CR *{ [ 1 – (1+r) ^ (-n)]/ r } Where CR = annual energy charges n = period in years = 15 r = rate of interest = 10% For n=15 & r=10%; CC=7.61 CR
(1) Appurtenances Air Relief Valves Air relief valves are designed specifically to vent, automatically and when necessary, air accumulations from lines in which water is flowing. Such accumulations of air tend to collect at high points in the pipe line. Air that accumulates at such peaks reduces the useful cross sectional area of the pipe and therefore has the effect of increasing the friction head factor, lowering the pumping capacity of the entire line. The use of air release valves eliminates the possibility of this air binding and permits the flow of water without damage to pipe line. Kinetic Double air relief valves would be installed at peaks in the pipe line, both with respect to horizontal and maximum hydraulic gradient. They should also be installed at the ends and intermediate points along a length of pipe line which is parallel to the hydraulic gradient. Double air valves would also be fitted every 1/2 to 1 km along descending sections, especially at points where the pipe dips steeply. The sizes of the air valves have been decided considering the ratios of air valves to pipe diameter as 1:8. Material of valves will be Cast Iron. Scour Valves CI Sluice valves should be installed at intermediate locations of the pipe line in order to provide scouring facilities for maintenance purposes. Locations of such valves have been decided depending upon the availability of a nala/drain nearby for disposal of the drained wastewater. Diameter of sluice
Final Report on Water Quality Management Plan for Ganga RiverVolume IV-3, Feasibility Study for Allahabad City, Part I, Sewerage Scheme
1-18
valve will be 1/2 of pipe line diameter. Generally scour valves have been provided at a distance of approx. 1 to 1.5 km. Isolation Valves CI Sluice valves of the same size as the pipe line size have been provided at suitable locations in order to facilitate the isolation of the part of the pipe line for maintenance purposes. Valve Chambers The valve chamber shall be provided to house the different valves. The walls of chambers shall be constructed in brick or grade specified in IS 456 and 150 mm thick CC (M-20) shall be provided in the chamber at the bottom. The roof of valve chamber shall be of RCC two way slab with two clear opening of size and covered with Ferro Cement cover sheet with cast iron frame and having lock & key arrangement to facilitate removal of appurtenance by crane/chain pulley blocks for maintenance through larger opening and valve operation through a smaller opening. The walls shall be designed to withstand lateral earth pressures. The roof and slabs shall be designed to withstand load as per IS: 875. Pre-cast removable Ferro cement covers shall be provided in the center portion of the chamber roof and a manhole size 900 mm x 900 mm having locking arrangement is to be provided to provide access within the chamber. The roof of valve chamber shall have manhole of size 900 x 900 mm for entry and maintenance purpose. 1.3.4 Design Criteria for SPS (1) Design Horizon
• For the design of civil structures 2030 • For the design of mechanical and electrical items 2015 and 2030 • For the design of rising main 2030
(2) Wet Well Capacity
• Design year 2030 • Detention time of wet well at peak flow
5 minutes for horizontal centrifugal pumps 3.75 minutes for submersible pumps
• Maximum detention time at average flow 30 minutes
(3) Dry Well/ Valve Chamber Size Based on number of pumps and clear spacing requirement for pumps, pumps dimension, valves, fittings and working space requirement.
(4) Pumps Design year 2015 Number of pumps For small capacity plant
i) When rising main is long a) 3 nos. pumps of Half Peak Flow b) 2 nos. pumps of Non Peak Flow
Final Report on Water Quality Management Plan for Ganga RiverVolume IV-3, Feasibility Study for Allahabad City, Part I, Sewerage Scheme
1-19
ii) When rising main is short a) 5 nos. pumps of One fourth Peak flow For large capacity plant (or critical facilities) equal capacity pumps (6 to 8)
+ 50% standby on peak flow, +100% standby for non-peak flow
Submersible pumps are proposed up to 150 HP capacity Horizontal Centrifugal Pumps are selected for higher (>150 HP) capacities.
Pump capacity in kW 9.81 * H * Q/ (Ep * Em) Where H =Required pumping head m
Q = pump discharge, m3/sec Ep = Pump efficiency
Em = Motor efficiency
(5) Screens & Screen Channel Screening of incoming wastewater is required for the removal of large floating materials, which can damage the pumps. This will be carried out in two stages, viz. 40 mm opening manually cleaned bar screen followed by a 20 mm opening mechanically cleaned bar screen.
Design year 2030 Standby Units 50 % (normally)
Stage - I Clear spacing between screen bar 40 mm Thickness of screen bar 10 mm Type of working screens Manual screen
Stage - II Clear spacing between screen bar 20 mm Thickness of screen bar 10 mm Type of working screens Mechanical screen Type of standby screen Manual screen Minimum Approach velocity @ avg. flow 0.3 m/sec Minimum velocity through screens 0.6 m/sec Maximum velocity through screens 1.2 m/sec
1.3.5 Design Criteria for Sewage Treatment Plants (1) Design Capacities The Master Plan has been consulted for deciding the STP capacities. As per the final sewerage system configuration, 4 new STPs are to be constructed, details are as follows:
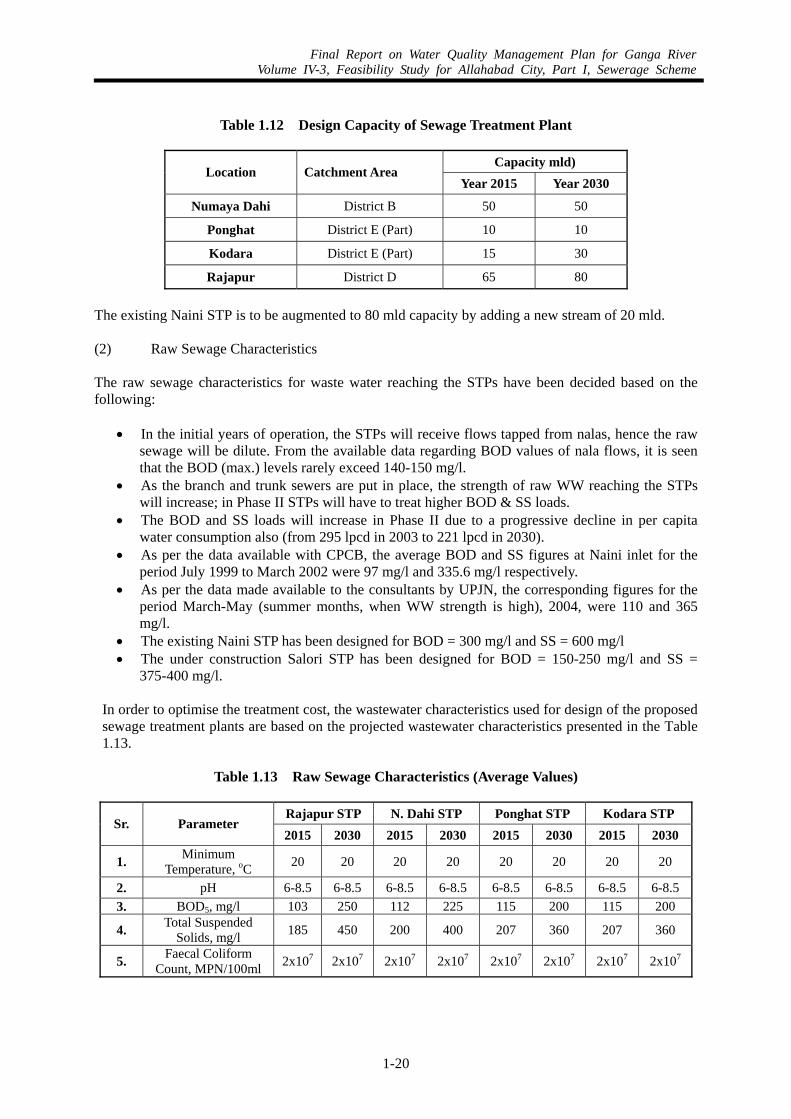
Final Report on Water Quality Management Plan for Ganga RiverVolume IV-3, Feasibility Study for Allahabad City, Part I, Sewerage Scheme
1-20
Table 1.12 Design Capacity of Sewage Treatment Plant
Capacity mld)
Location Catchment Area Year 2015 Year 2030
Numaya Dahi District B 50 50
Ponghat District E (Part) 10 10
Kodara District E (Part) 15 30
Rajapur District D 65 80
The existing Naini STP is to be augmented to 80 mld capacity by adding a new stream of 20 mld. (2) Raw Sewage Characteristics The raw sewage characteristics for waste water reaching the STPs have been decided based on the following:
• In the initial years of operation, the STPs will receive flows tapped from nalas, hence the raw sewage will be dilute. From the available data regarding BOD values of nala flows, it is seen that the BOD (max.) levels rarely exceed 140-150 mg/l.
• As the branch and trunk sewers are put in place, the strength of raw WW reaching the STPs will increase; in Phase II STPs will have to treat higher BOD & SS loads.
• The BOD and SS loads will increase in Phase II due to a progressive decline in per capita water consumption also (from 295 lpcd in 2003 to 221 lpcd in 2030).
• As per the data available with CPCB, the average BOD and SS figures at Naini inlet for the period July 1999 to March 2002 were 97 mg/l and 335.6 mg/l respectively.
• As per the data made available to the consultants by UPJN, the corresponding figures for the period March-May (summer months, when WW strength is high), 2004, were 110 and 365 mg/l.
• The existing Naini STP has been designed for BOD = 300 mg/l and SS = 600 mg/l • The under construction Salori STP has been designed for BOD = 150-250 mg/l and SS =
375-400 mg/l.
In order to optimise the treatment cost, the wastewater characteristics used for design of the proposed sewage treatment plants are based on the projected wastewater characteristics presented in the Table 1.13.
Table 1.13 Raw Sewage Characteristics (Average Values)
Rajapur STP N. Dahi STP Ponghat STP Kodara STP
Sr. Parameter 2015 2030 2015 2030 2015 2030 2015 2030
1. Minimum Temperature, oC 20 20 20 20 20 20 20 20
2. pH 6-8.5 6-8.5 6-8.5 6-8.5 6-8.5 6-8.5 6-8.5 6-8.5 3. BOD5, mg/l 103 250 112 225 115 200 115 200
4. Total Suspended Solids, mg/l 185 450 200 400 207 360 207 360
5. Faecal Coliform Count, MPN/100ml 2x10⁷ 2x10⁷ 2x10⁷ 2x10⁷ 2x10⁷ 2x10⁷ 2x10⁷ 2x10⁷
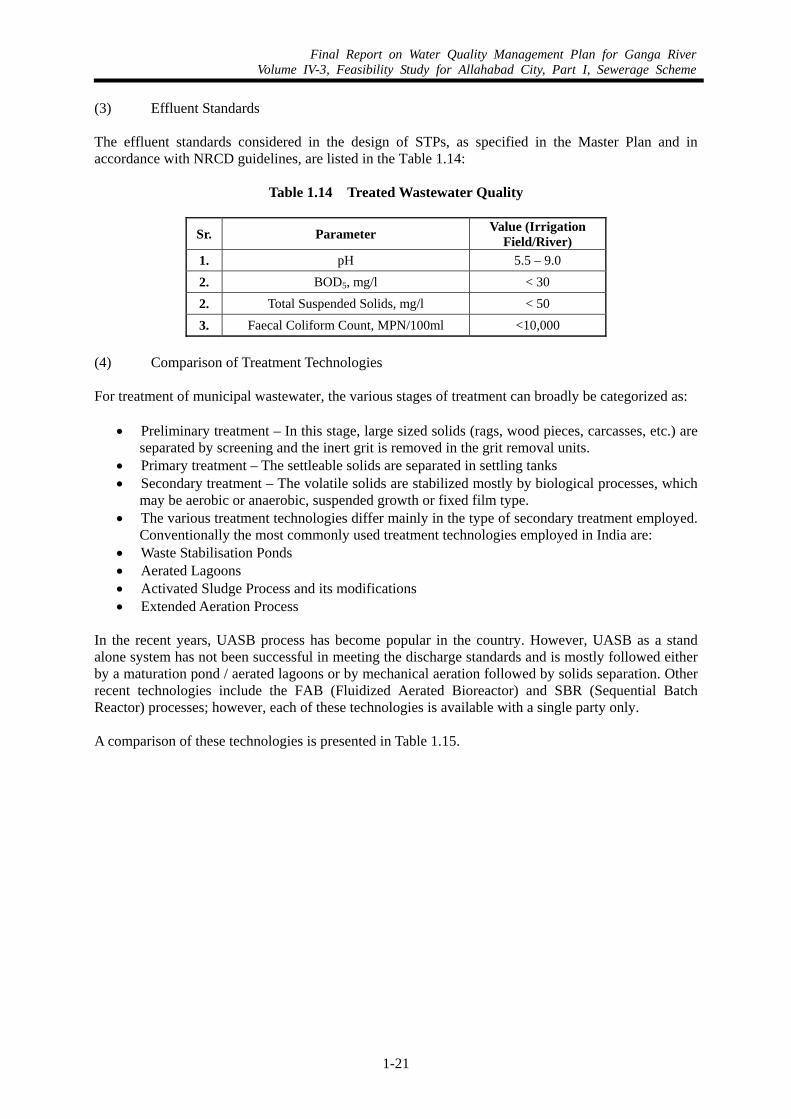
Final Report on Water Quality Management Plan for Ganga RiverVolume IV-3, Feasibility Study for Allahabad City, Part I, Sewerage Scheme
1-21
(3) Effluent Standards The effluent standards considered in the design of STPs, as specified in the Master Plan and in accordance with NRCD guidelines, are listed in the Table 1.14:
Table 1.14 Treated Wastewater Quality
Sr. Parameter Value (Irrigation Field/River)
1. pH 5.5 – 9.0 2. BOD5, mg/l < 30 2. Total Suspended Solids, mg/l < 50 3. Faecal Coliform Count, MPN/100ml <10,000
(4) Comparison of Treatment Technologies For treatment of municipal wastewater, the various stages of treatment can broadly be categorized as:
• Preliminary treatment – In this stage, large sized solids (rags, wood pieces, carcasses, etc.) are separated by screening and the inert grit is removed in the grit removal units.
• Primary treatment – The settleable solids are separated in settling tanks • Secondary treatment – The volatile solids are stabilized mostly by biological processes, which
may be aerobic or anaerobic, suspended growth or fixed film type. • The various treatment technologies differ mainly in the type of secondary treatment employed.
Conventionally the most commonly used treatment technologies employed in India are: • Waste Stabilisation Ponds • Aerated Lagoons • Activated Sludge Process and its modifications • Extended Aeration Process
In the recent years, UASB process has become popular in the country. However, UASB as a stand alone system has not been successful in meeting the discharge standards and is mostly followed either by a maturation pond / aerated lagoons or by mechanical aeration followed by solids separation. Other recent technologies include the FAB (Fluidized Aerated Bioreactor) and SBR (Sequential Batch Reactor) processes; however, each of these technologies is available with a single party only. A comparison of these technologies is presented in Table 1.15.
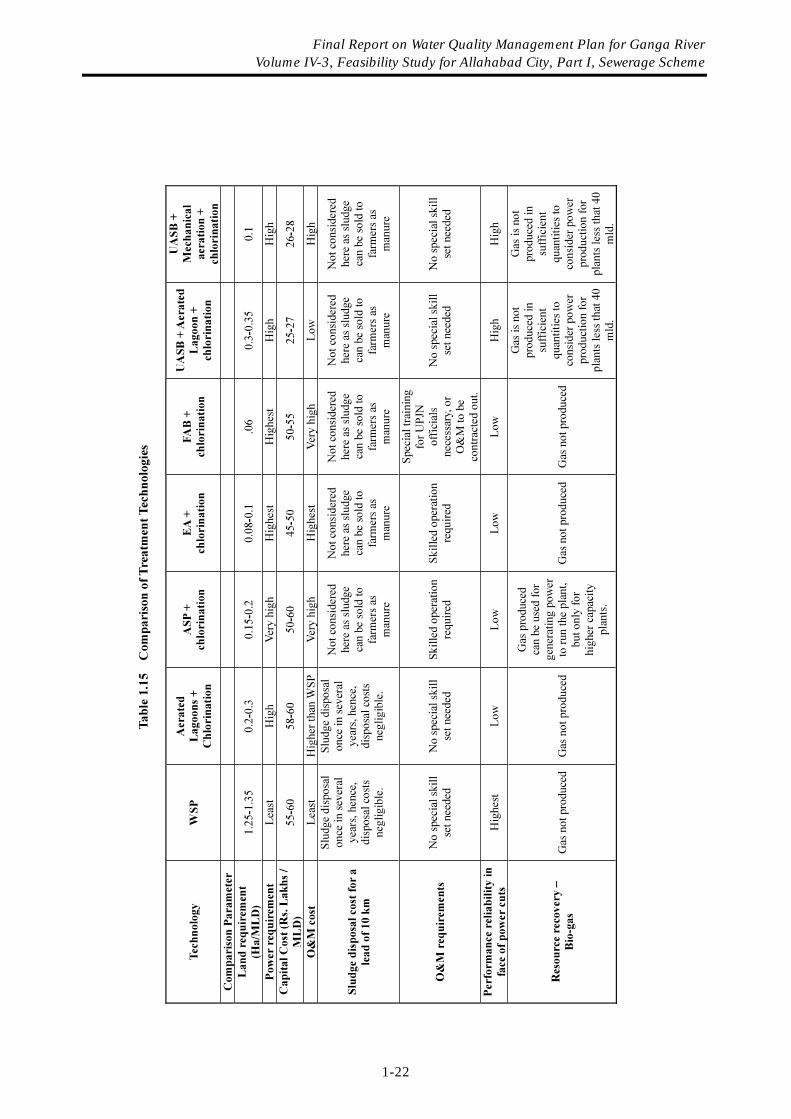
Final Report on Water Quality Management Plan for Ganga River Volume IV-3, Feasibility Study for Allahabad City, Part I, Sewerage Scheme
1-22
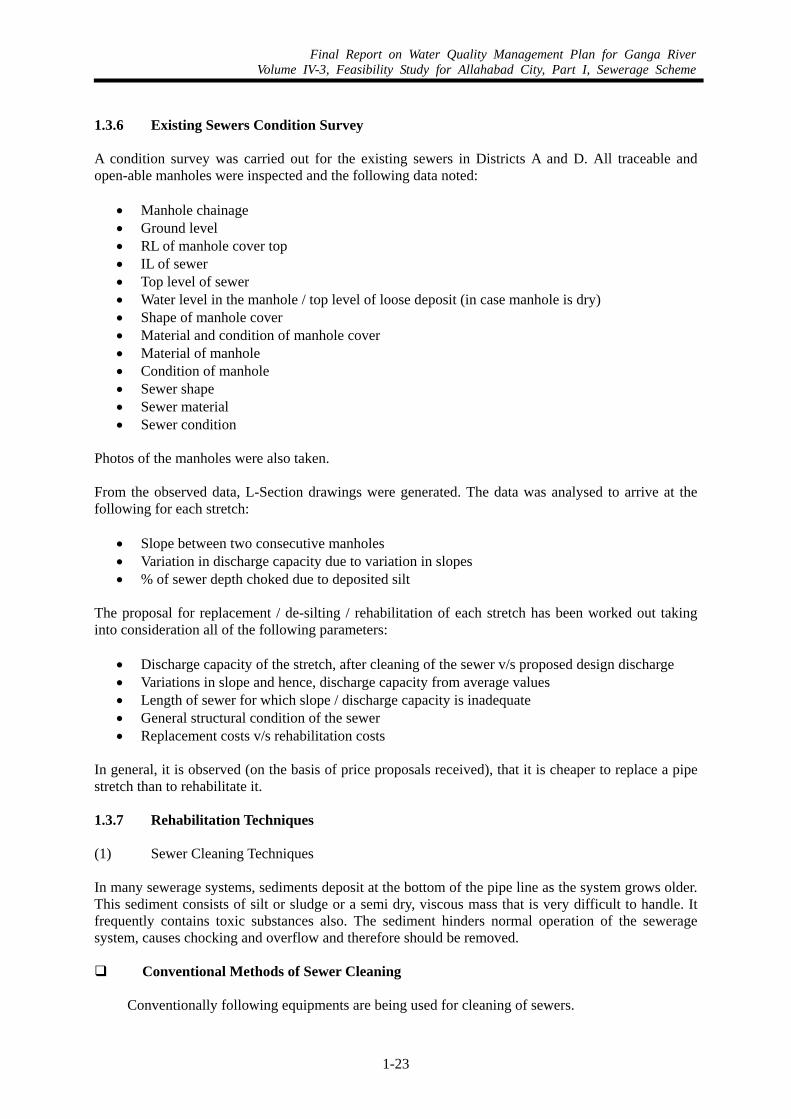
Final Report on Water Quality Management Plan for Ganga RiverVolume IV-3, Feasibility Study for Allahabad City, Part I, Sewerage Scheme
1-23
1.3.6 Existing Sewers Condition Survey A condition survey was carried out for the existing sewers in Districts A and D. All traceable and open-able manholes were inspected and the following data noted:
• Manhole chainage • Ground level • RL of manhole cover top • IL of sewer • Top level of sewer • Water level in the manhole / top level of loose deposit (in case manhole is dry) • Shape of manhole cover • Material and condition of manhole cover • Material of manhole • Condition of manhole • Sewer shape • Sewer material • Sewer condition
Photos of the manholes were also taken. From the observed data, L-Section drawings were generated. The data was analysed to arrive at the following for each stretch:
• Slope between two consecutive manholes • Variation in discharge capacity due to variation in slopes • % of sewer depth choked due to deposited silt
The proposal for replacement / de-silting / rehabilitation of each stretch has been worked out taking into consideration all of the following parameters:
• Discharge capacity of the stretch, after cleaning of the sewer v/s proposed design discharge • Variations in slope and hence, discharge capacity from average values • Length of sewer for which slope / discharge capacity is inadequate • General structural condition of the sewer • Replacement costs v/s rehabilitation costs
In general, it is observed (on the basis of price proposals received), that it is cheaper to replace a pipe stretch than to rehabilitate it. 1.3.7 Rehabilitation Techniques (1) Sewer Cleaning Techniques In many sewerage systems, sediments deposit at the bottom of the pipe line as the system grows older. This sediment consists of silt or sludge or a semi dry, viscous mass that is very difficult to handle. It frequently contains toxic substances also. The sediment hinders normal operation of the sewerage system, causes chocking and overflow and therefore should be removed. Conventional Methods of Sewer Cleaning
Conventionally following equipments are being used for cleaning of sewers.
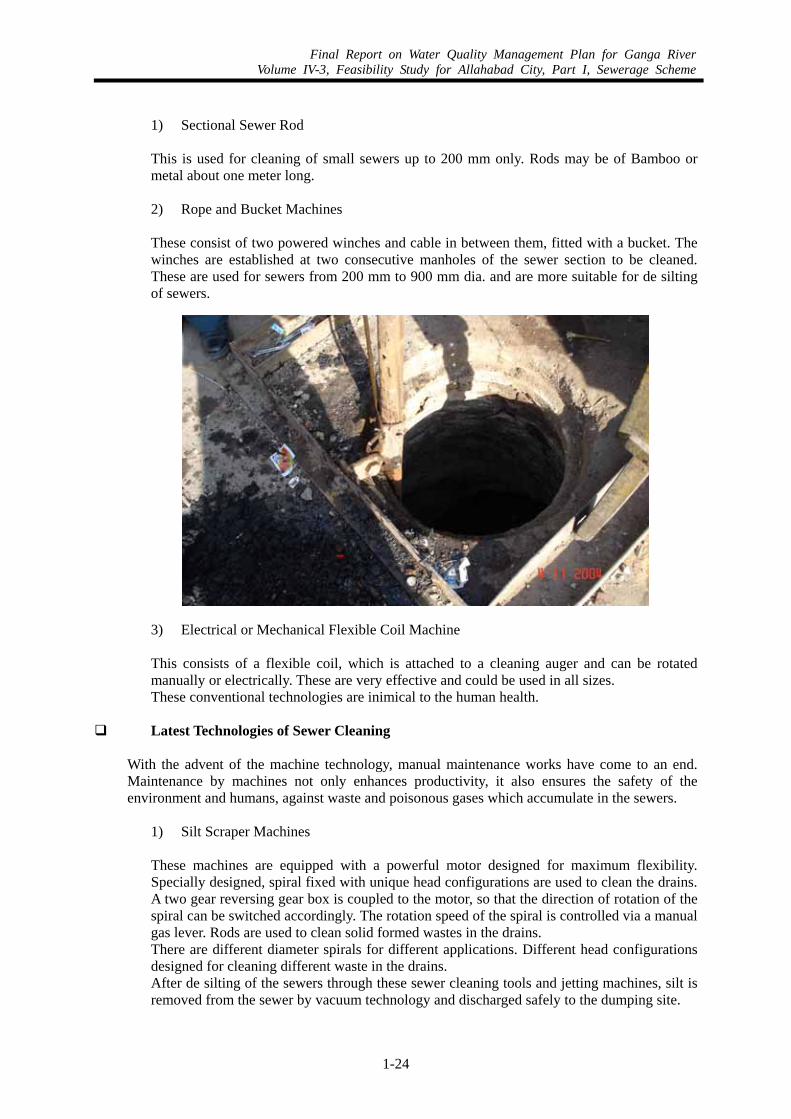
Final Report on Water Quality Management Plan for Ganga RiverVolume IV-3, Feasibility Study for Allahabad City, Part I, Sewerage Scheme
1-24
1) Sectional Sewer Rod
This is used for cleaning of small sewers up to 200 mm only. Rods may be of Bamboo or metal about one meter long.
2) Rope and Bucket Machines
These consist of two powered winches and cable in between them, fitted with a bucket. The winches are established at two consecutive manholes of the sewer section to be cleaned. These are used for sewers from 200 mm to 900 mm dia. and are more suitable for de silting of sewers.
3) Electrical or Mechanical Flexible Coil Machine
This consists of a flexible coil, which is attached to a cleaning auger and can be rotated manually or electrically. These are very effective and could be used in all sizes. These conventional technologies are inimical to the human health.
Latest Technologies of Sewer Cleaning
With the advent of the machine technology, manual maintenance works have come to an end. Maintenance by machines not only enhances productivity, it also ensures the safety of the environment and humans, against waste and poisonous gases which accumulate in the sewers.
1) Silt Scraper Machines
These machines are equipped with a powerful motor designed for maximum flexibility. Specially designed, spiral fixed with unique head configurations are used to clean the drains. A two gear reversing gear box is coupled to the motor, so that the direction of rotation of the spiral can be switched accordingly. The rotation speed of the spiral is controlled via a manual gas lever. Rods are used to clean solid formed wastes in the drains. There are different diameter spirals for different applications. Different head configurations designed for cleaning different waste in the drains. After de silting of the sewers through these sewer cleaning tools and jetting machines, silt is removed from the sewer by vacuum technology and discharged safely to the dumping site.
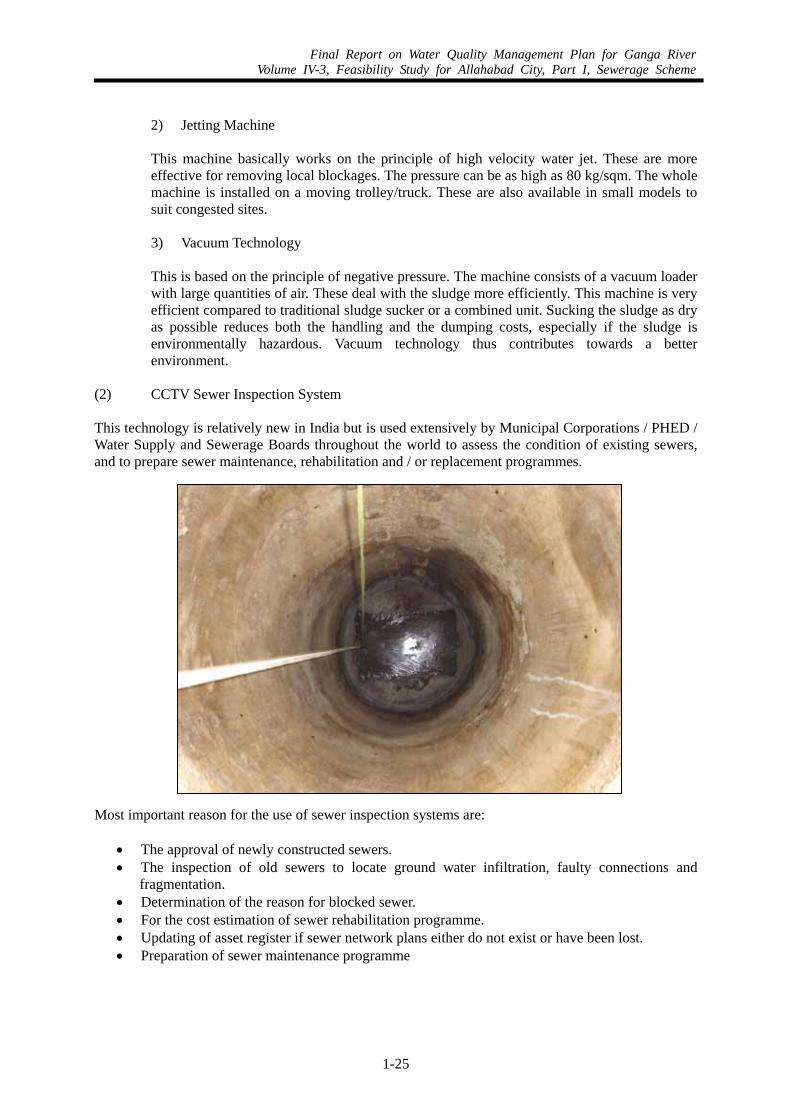
Final Report on Water Quality Management Plan for Ganga RiverVolume IV-3, Feasibility Study for Allahabad City, Part I, Sewerage Scheme
1-25
2) Jetting Machine
This machine basically works on the principle of high velocity water jet. These are more effective for removing local blockages. The pressure can be as high as 80 kg/sqm. The whole machine is installed on a moving trolley/truck. These are also available in small models to suit congested sites.
3) Vacuum Technology
This is based on the principle of negative pressure. The machine consists of a vacuum loader with large quantities of air. These deal with the sludge more efficiently. This machine is very efficient compared to traditional sludge sucker or a combined unit. Sucking the sludge as dry as possible reduces both the handling and the dumping costs, especially if the sludge is environmentally hazardous. Vacuum technology thus contributes towards a better environment.
(2) CCTV Sewer Inspection System This technology is relatively new in India but is used extensively by Municipal Corporations / PHED / Water Supply and Sewerage Boards throughout the world to assess the condition of existing sewers, and to prepare sewer maintenance, rehabilitation and / or replacement programmes.
Most important reason for the use of sewer inspection systems are:
• The approval of newly constructed sewers. • The inspection of old sewers to locate ground water infiltration, faulty connections and
fragmentation. • Determination of the reason for blocked sewer. • For the cost estimation of sewer rehabilitation programme. • Updating of asset register if sewer network plans either do not exist or have been lost. • Preparation of sewer maintenance programme
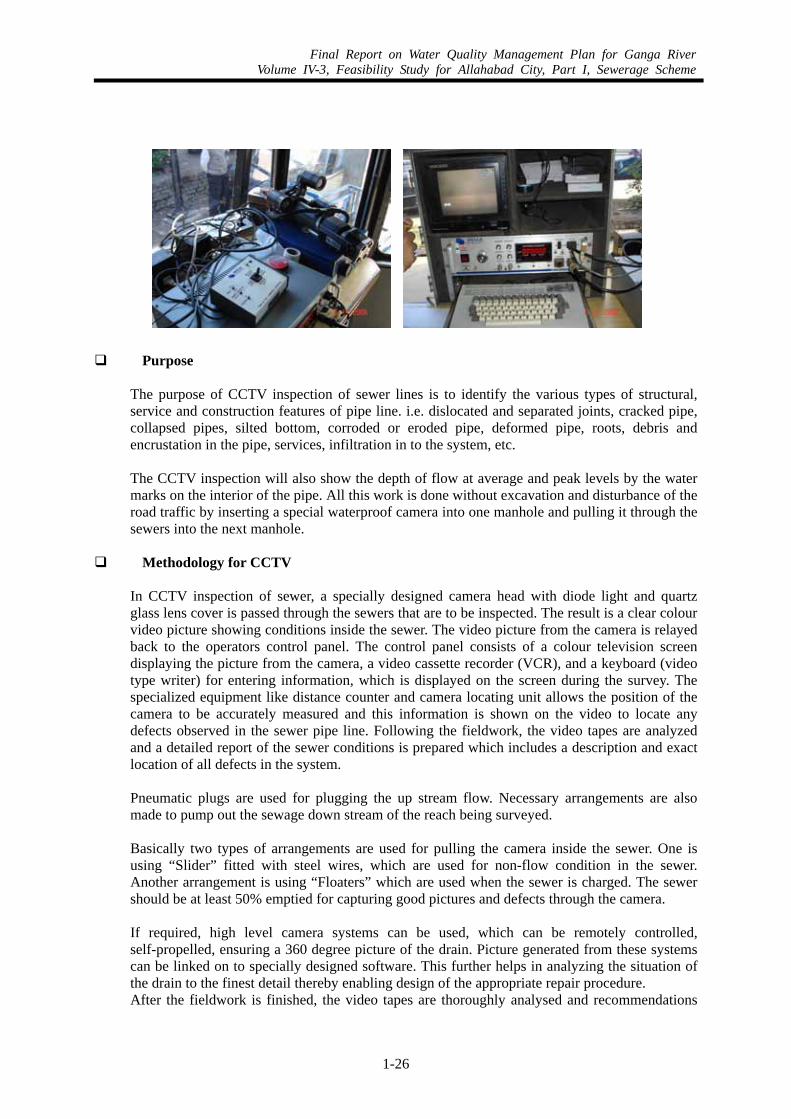
Final Report on Water Quality Management Plan for Ganga RiverVolume IV-3, Feasibility Study for Allahabad City, Part I, Sewerage Scheme
1-26
Purpose
The purpose of CCTV inspection of sewer lines is to identify the various types of structural, service and construction features of pipe line. i.e. dislocated and separated joints, cracked pipe, collapsed pipes, silted bottom, corroded or eroded pipe, deformed pipe, roots, debris and encrustation in the pipe, services, infiltration in to the system, etc. The CCTV inspection will also show the depth of flow at average and peak levels by the water marks on the interior of the pipe. All this work is done without excavation and disturbance of the road traffic by inserting a special waterproof camera into one manhole and pulling it through the sewers into the next manhole.
Methodology for CCTV
In CCTV inspection of sewer, a specially designed camera head with diode light and quartz glass lens cover is passed through the sewers that are to be inspected. The result is a clear colour video picture showing conditions inside the sewer. The video picture from the camera is relayed back to the operators control panel. The control panel consists of a colour television screen displaying the picture from the camera, a video cassette recorder (VCR), and a keyboard (video type writer) for entering information, which is displayed on the screen during the survey. The specialized equipment like distance counter and camera locating unit allows the position of the camera to be accurately measured and this information is shown on the video to locate any defects observed in the sewer pipe line. Following the fieldwork, the video tapes are analyzed and a detailed report of the sewer conditions is prepared which includes a description and exact location of all defects in the system. Pneumatic plugs are used for plugging the up stream flow. Necessary arrangements are also made to pump out the sewage down stream of the reach being surveyed. Basically two types of arrangements are used for pulling the camera inside the sewer. One is using “Slider” fitted with steel wires, which are used for non-flow condition in the sewer. Another arrangement is using “Floaters” which are used when the sewer is charged. The sewer should be at least 50% emptied for capturing good pictures and defects through the camera. If required, high level camera systems can be used, which can be remotely controlled, self-propelled, ensuring a 360 degree picture of the drain. Picture generated from these systems can be linked on to specially designed software. This further helps in analyzing the situation of the drain to the finest detail thereby enabling design of the appropriate repair procedure. After the fieldwork is finished, the video tapes are thoroughly analysed and recommendations
Final Report on Water Quality Management Plan for Ganga RiverVolume IV-3, Feasibility Study for Allahabad City, Part I, Sewerage Scheme
1-27
are made for onward rehabilitation. Constraints
The minimum size that can be surveyed using this technology is 200 mm. The maximum length of sewers that can be surveyed in a day is 150 m to 200 m but depends upon the site condition mainly. The minimum space and access requirement for the inspection equipment is 4 m. However it can be managed up to 3 m also.
(3) Rehabilitation Methodology Maximum size of sewer considering all districts is 1.2m x 1.4 m, the sewer is approx. 20% silted; hence, manual inspection is not recommended in any of the existing Trunk Sewers in the city. The sewers where de-silting has been recommended (refer Chapters 2 and 3), should be diverted and de-silted. A CCTV survey is recommended to assess the structural condition of sewers and to assess the efficiency of the de-silting operations. 1.4 COST ESTIMATE 1.4.1 Basis of Cost Estimate Cost estimates for various works are worked out on the basis of prevailing Schedule of Rates and market rates. Rates for land acquisition are obtained from Finance and Revenue Department, Govt. of Uttar Pradesh. All the figures are in INR. Unit prices for the estimate of capital costs are, in principle, derived from the list of prices provided by UPJN. However, prices not provided by UPJN are calculated as Lucknow rates on the basis of Delhi schedule of rates (DSR) taking localities and deflator into account. Furthermore, prices of items such as sewer pipe, reinforcing steel bars, manhole covers and so on that are not found in DSR are obtained by quotation.
(a) To apply schedule of rates provided by UPJN in principle. (b) For rates of items not provided by UPJN, to use modified rates based on Delhi schedule of
rates. (c) To use market prices for items not available in (a) and (b).
Cost estimates of Civil & Electro-Mechanical Work are primarily based on the following: (1) Sewage Treatment Plants UASB STP at Rajapur and Kodara Nala
• On mld basis for the main STP, based on recent works awarded. • Flood protection measures have been provided with side slope (1 vertical : 2 horizontal). The
width of the embankment at top is kept 6 m & 3 m and the height 10 m and 5 m respectively depending on the ground level and highest flood level of the area.
The items considered in the Bund construction are:
i) Earthwork in excavation ii) Supply of good earth and filling of sand in foundation and super structure iii) Supply of good earth and forming embankment iv) Stone pitching
Final Report on Water Quality Management Plan for Ganga RiverVolume IV-3, Feasibility Study for Allahabad City, Part I, Sewerage Scheme
1-28
v) Suitable ground treatment with geo-synthetics to enhance the safe bearing capacity, and micro reinforced geo-grid and non-woven geo-textile for slope protection has been provided. The costing of these items is based on price obtained from specialised agencies.
WSP STP at Numaya Dahi and Ponghat Nala The cost of the ponds in each of these STPs has been worked out on the basis of excavation & the embankment on the basis of actual filling. Care has been taken to see that total cutting & filling gets compensated, so that neither extra earth is to be brought in nor disposed off. The general ground level at Numaya Dahi & Ponghat are normally above the HFL at Allahabad, hence no flood protection measures have been adopted. The items considered are:
i) Earthwork in excavation for the ponds. ii) Earth filling in embankments iii) Pond impermeable lining work iv) Filling to attain finished ground level v) Road work
LDPE reinforced geo-membrane and non woven geo-textile have been provided for impermeable lining of the stabilization ponds. Costs of these are based on prices received from Specialized Agencies. Costs for service buildings, roads and chain link fencing are based on actual quantities and rates taken from UPSR when available, otherwise from DSR, with necessary cost index for Allahabad for 06/2005, as shown in Table 1.16.
Table 1.16 Cost Index Calculation
As per 07/1999, Cost Index = 171 As per 01/1997, Cost Index = 155 As per 09/1995 Cost Index = 136 Comparing 09/1995 and 07/1999, Rate of increase of Cost Index in one year = (171-136) x 12/46 = 9.13 ---------(1) Comparing 01/1997and 07/1999, Rate of increase of Cost Index in one year = (155-136 )x 12/30= 6.4 -----------(2) Comparing The above (1) & (2), Average Rate of increase of Cost Index in one year = (9.13 + 6.4)/2 = 7.765 As per 07/1999, Cost Index = 171 Therefore Cost Index for 06/2002 = 171+(7.765x35/12) = 193.65 Cost Index for 20/12/2004 = 193.65 + (7.765x30.67/12) = 213.50 Cost Index Over 06/2002 = (213.50 – 193.65)/193.65
= 10.25 %
Final Report on Water Quality Management Plan for Ganga RiverVolume IV-3, Feasibility Study for Allahabad City, Part I, Sewerage Scheme
1-29
Modification of Naini STP
The cost for construction of 20 mld additional stream is based on mld basis, considering the cost of recent works awarded. A certain escalation has been considered to take into account the recent sharp increase in steel prices. The price of Gas Engines is based on quotation received. As it would be an imported item, the cost is given in Euros. However local taxes and erection commissioning are considered in Indian Rupees. Power transmission cost for individual STP’s and Pumping Stations have been taken as per estimated rates. Above-ground transmission lines have been considered for supplying power to Sasur Kahderi SPS and Numaya Dahi STP as they are located in sparsely populated areas and above-ground transmission costs are 80% of the underground transmission costs. However, for all the other facilities, which are within the urbanized area, underground transmission lines are considered. (2) Sewage Pumping Stations Sewage Pumping Stations mainly consist of dry well, wet well, pump houses and other service buildings, roads, platforms and chain link fencing. Loading and design are based on relevant BIS codes. M25 has been considered as minimum grade of concrete for RCC design. Walls and bases of wells have been designed as uncracked section. Monorail Block / HOT Crane has been provided in the pump houses. Wherever necessary, platforms along with handrails have been provided. Costing of the pump houses is based on actual quantities worked out from preliminary design with special emphasis on protection against flooding, considering HFL recorded in Allahabad. For the new pumping stations at Ghaghar nala and Sasur Khaderi, tension bored piles have been provided below the wet and dry well to protect against possible uplift during floods. While calculating the uplift, the weight of the structure has been considered to avoid uplift during construction stage, holes will be left at the base slab, which ultimately will be filled by pressure grouting. In case of these two pump houses the intake channels, screens, bifurcation chambers, service buildings, roads, platforms etc. have been provided on stilts to avoid flooding. Items considered in the pumping stations are as follows:
i) Excavation ii) Refilling iii) P.C.C. below foundation iv) R.C.C work in foundations, walls, slab, columns, beams etc. v) Shuttering vi) Brickwork vii) All finishing items viii) Rolling shutters, Doors windows etc. ix) RCC flooring x) Fencing xi) Hard standing xii) Tension Piles wherever necessary
The rates assumed for major civil work items are based on UPSR when available, otherwise from DSR 2002 (civil work) updated to June 2005 for Allahabad.
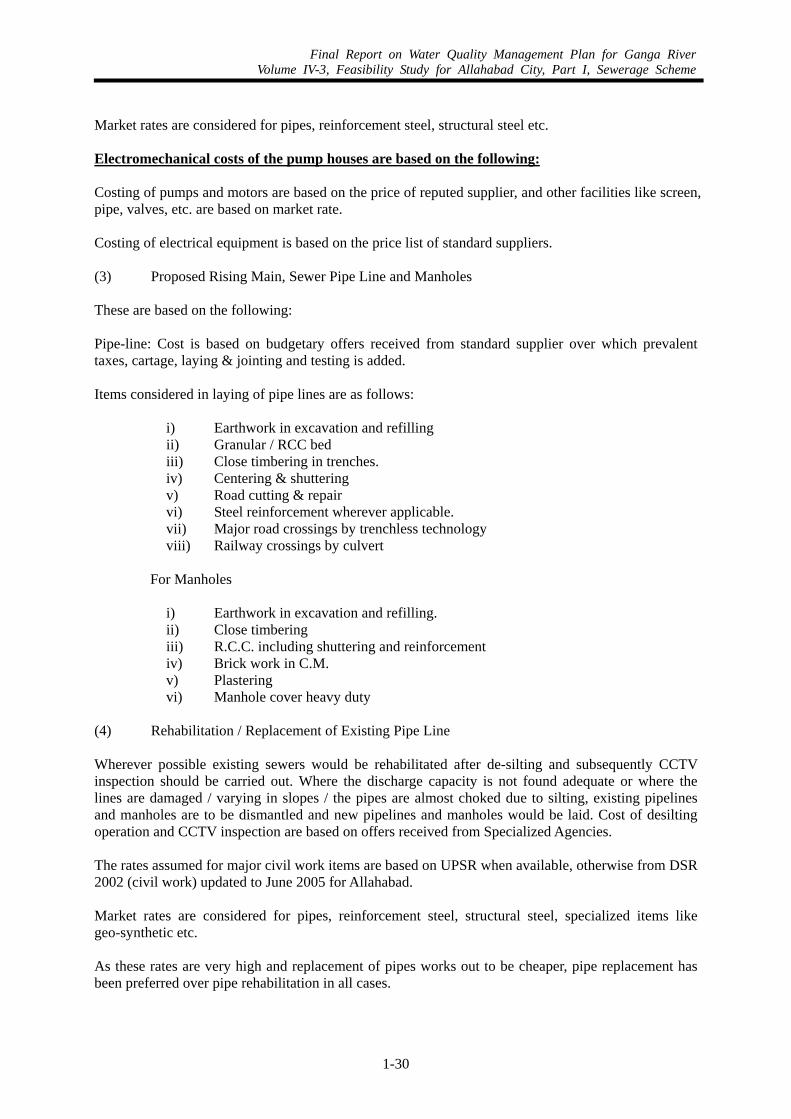
Final Report on Water Quality Management Plan for Ganga RiverVolume IV-3, Feasibility Study for Allahabad City, Part I, Sewerage Scheme
1-30
Market rates are considered for pipes, reinforcement steel, structural steel etc. Electromechanical costs of the pump houses are based on the following: Costing of pumps and motors are based on the price of reputed supplier, and other facilities like screen, pipe, valves, etc. are based on market rate. Costing of electrical equipment is based on the price list of standard suppliers. (3) Proposed Rising Main, Sewer Pipe Line and Manholes These are based on the following: Pipe-line: Cost is based on budgetary offers received from standard supplier over which prevalent taxes, cartage, laying & jointing and testing is added. Items considered in laying of pipe lines are as follows:
i) Earthwork in excavation and refilling ii) Granular / RCC bed iii) Close timbering in trenches. iv) Centering & shuttering v) Road cutting & repair vi) Steel reinforcement wherever applicable. vii) Major road crossings by trenchless technology viii) Railway crossings by culvert
For Manholes
i) Earthwork in excavation and refilling. ii) Close timbering iii) R.C.C. including shuttering and reinforcement iv) Brick work in C.M. v) Plastering vi) Manhole cover heavy duty
(4) Rehabilitation / Replacement of Existing Pipe Line Wherever possible existing sewers would be rehabilitated after de-silting and subsequently CCTV inspection should be carried out. Where the discharge capacity is not found adequate or where the lines are damaged / varying in slopes / the pipes are almost choked due to silting, existing pipelines and manholes are to be dismantled and new pipelines and manholes would be laid. Cost of desilting operation and CCTV inspection are based on offers received from Specialized Agencies. The rates assumed for major civil work items are based on UPSR when available, otherwise from DSR 2002 (civil work) updated to June 2005 for Allahabad. Market rates are considered for pipes, reinforcement steel, structural steel, specialized items like geo-synthetic etc. As these rates are very high and replacement of pipes works out to be cheaper, pipe replacement has been preferred over pipe rehabilitation in all cases.
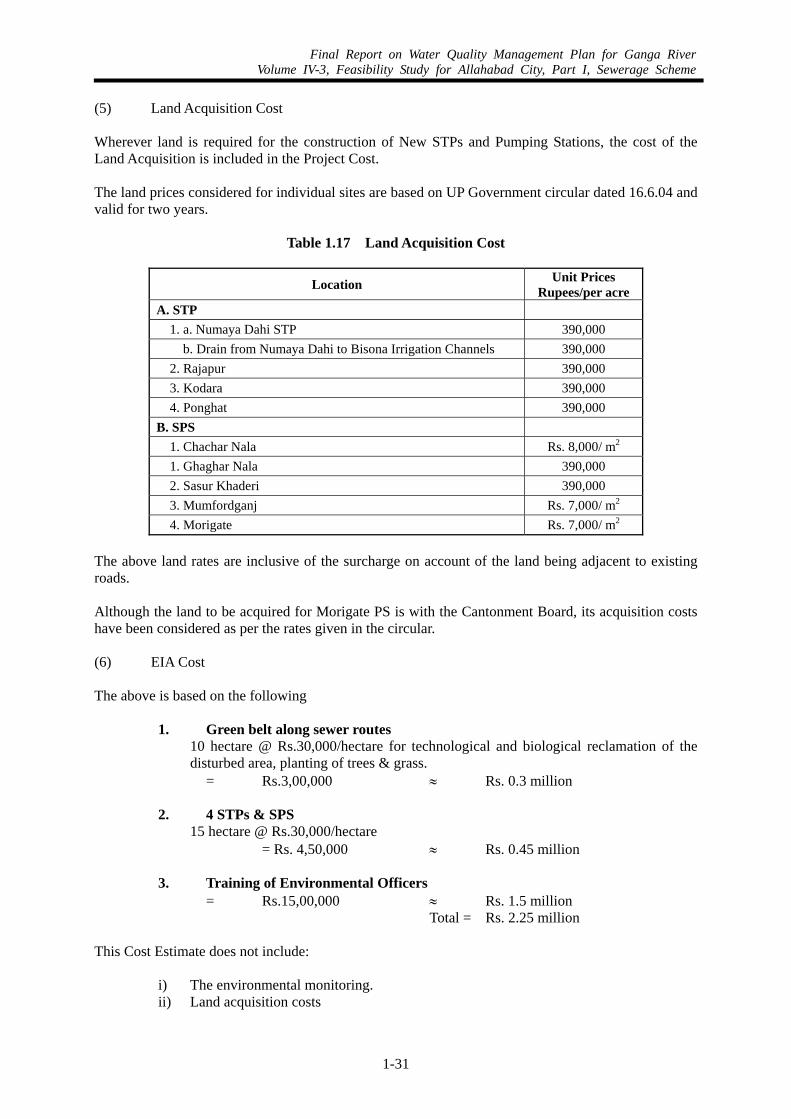
Final Report on Water Quality Management Plan for Ganga RiverVolume IV-3, Feasibility Study for Allahabad City, Part I, Sewerage Scheme
1-31
(5) Land Acquisition Cost Wherever land is required for the construction of New STPs and Pumping Stations, the cost of the Land Acquisition is included in the Project Cost. The land prices considered for individual sites are based on UP Government circular dated 16.6.04 and valid for two years.
Table 1.17 Land Acquisition Cost
Location Unit Prices Rupees/per acre
A. STP 1. a. Numaya Dahi STP 390,000
b. Drain from Numaya Dahi to Bisona Irrigation Channels 390,000 2. Rajapur 390,000 3. Kodara 390,000 4. Ponghat 390,000
B. SPS 1. Chachar Nala Rs. 8,000/ m2 1. Ghaghar Nala 390,000 2. Sasur Khaderi 390,000 3. Mumfordganj Rs. 7,000/ m2 4. Morigate Rs. 7,000/ m2
The above land rates are inclusive of the surcharge on account of the land being adjacent to existing roads. Although the land to be acquired for Morigate PS is with the Cantonment Board, its acquisition costs have been considered as per the rates given in the circular. (6) EIA Cost The above is based on the following
1. Green belt along sewer routes 10 hectare @ Rs.30,000/hectare for technological and biological reclamation of the disturbed area, planting of trees & grass. = Rs.3,00,000 ≈ Rs. 0.3 million
2. 4 STPs & SPS 15 hectare @ Rs.30,000/hectare
= Rs. 4,50,000 ≈ Rs. 0.45 million 3. Training of Environmental Officers
= Rs.15,00,000 ≈ Rs. 1.5 million Total = Rs. 2.25 million
This Cost Estimate does not include:
i) The environmental monitoring. ii) Land acquisition costs
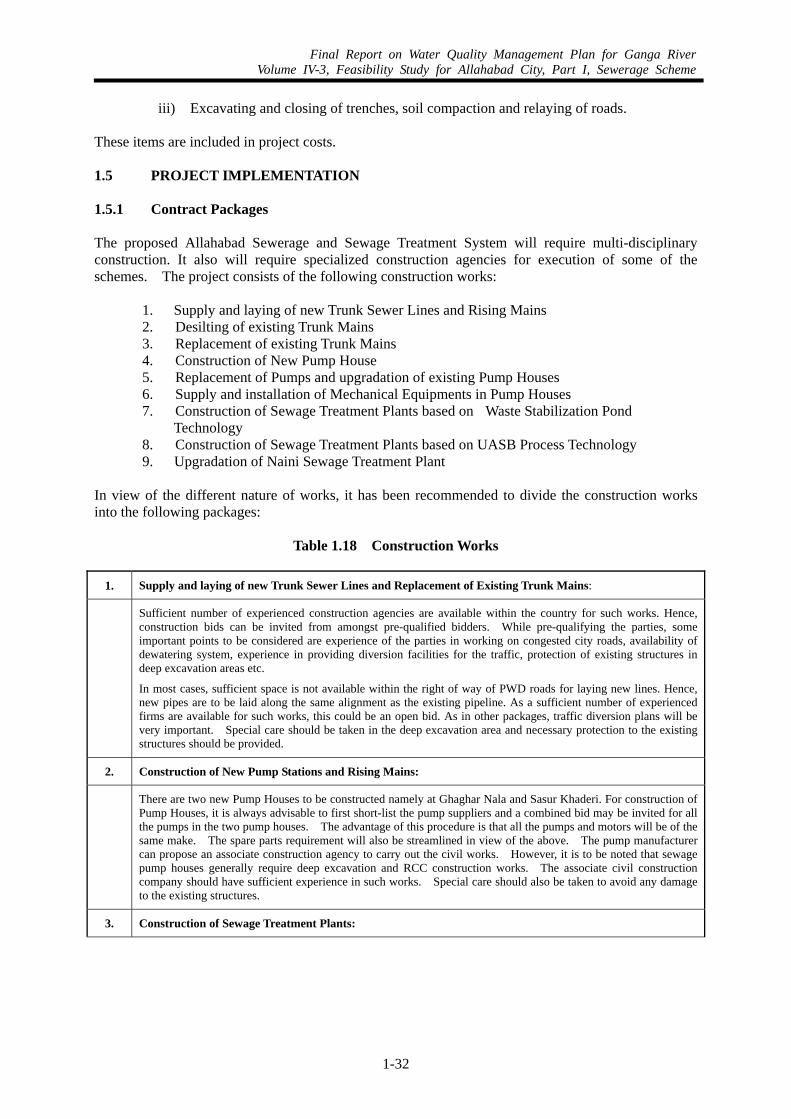
Final Report on Water Quality Management Plan for Ganga RiverVolume IV-3, Feasibility Study for Allahabad City, Part I, Sewerage Scheme
1-32
iii) Excavating and closing of trenches, soil compaction and relaying of roads.
These items are included in project costs. 1.5 PROJECT IMPLEMENTATION 1.5.1 Contract Packages The proposed Allahabad Sewerage and Sewage Treatment System will require multi-disciplinary construction. It also will require specialized construction agencies for execution of some of the schemes. The project consists of the following construction works:
1. Supply and laying of new Trunk Sewer Lines and Rising Mains 2. Desilting of existing Trunk Mains 3. Replacement of existing Trunk Mains 4. Construction of New Pump House 5. Replacement of Pumps and upgradation of existing Pump Houses 6. Supply and installation of Mechanical Equipments in Pump Houses 7. Construction of Sewage Treatment Plants based on Waste Stabilization Pond
Technology 8. Construction of Sewage Treatment Plants based on UASB Process Technology 9. Upgradation of Naini Sewage Treatment Plant
In view of the different nature of works, it has been recommended to divide the construction works into the following packages:
Table 1.18 Construction Works
1. Supply and laying of new Trunk Sewer Lines and Replacement of Existing Trunk Mains:
Sufficient number of experienced construction agencies are available within the country for such works. Hence, construction bids can be invited from amongst pre-qualified bidders. While pre-qualifying the parties, some important points to be considered are experience of the parties in working on congested city roads, availability of dewatering system, experience in providing diversion facilities for the traffic, protection of existing structures in deep excavation areas etc.
In most cases, sufficient space is not available within the right of way of PWD roads for laying new lines. Hence, new pipes are to be laid along the same alignment as the existing pipeline. As a sufficient number of experienced firms are available for such works, this could be an open bid. As in other packages, traffic diversion plans will be very important. Special care should be taken in the deep excavation area and necessary protection to the existing structures should be provided.
2. Construction of New Pump Stations and Rising Mains:
There are two new Pump Houses to be constructed namely at Ghaghar Nala and Sasur Khaderi. For construction of Pump Houses, it is always advisable to first short-list the pump suppliers and a combined bid may be invited for all the pumps in the two pump houses. The advantage of this procedure is that all the pumps and motors will be of the same make. The spare parts requirement will also be streamlined in view of the above. The pump manufacturer can propose an associate construction agency to carry out the civil works. However, it is to be noted that sewage pump houses generally require deep excavation and RCC construction works. The associate civil construction company should have sufficient experience in such works. Special care should also be taken to avoid any damage to the existing structures.
3. Construction of Sewage Treatment Plants:
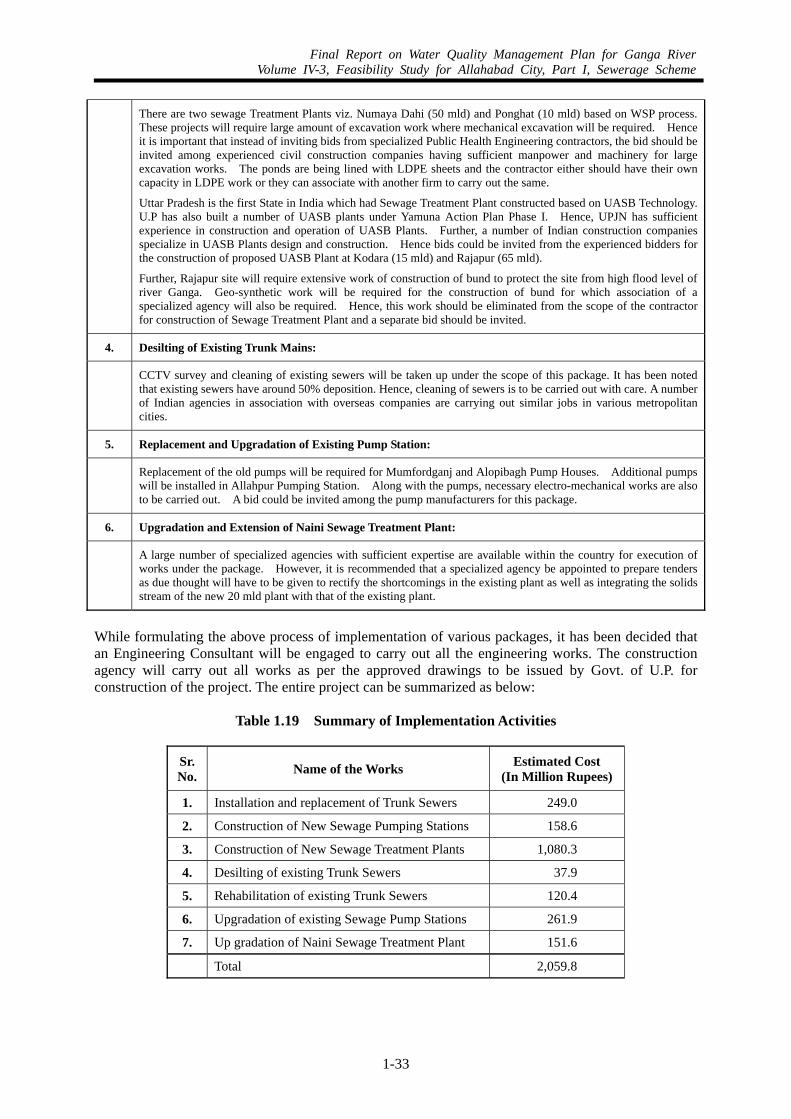
Final Report on Water Quality Management Plan for Ganga RiverVolume IV-3, Feasibility Study for Allahabad City, Part I, Sewerage Scheme
1-33
There are two sewage Treatment Plants viz. Numaya Dahi (50 mld) and Ponghat (10 mld) based on WSP process. These projects will require large amount of excavation work where mechanical excavation will be required. Hence it is important that instead of inviting bids from specialized Public Health Engineering contractors, the bid should be invited among experienced civil construction companies having sufficient manpower and machinery for large excavation works. The ponds are being lined with LDPE sheets and the contractor either should have their own capacity in LDPE work or they can associate with another firm to carry out the same.
Uttar Pradesh is the first State in India which had Sewage Treatment Plant constructed based on UASB Technology. U.P has also built a number of UASB plants under Yamuna Action Plan Phase I. Hence, UPJN has sufficient experience in construction and operation of UASB Plants. Further, a number of Indian construction companies specialize in UASB Plants design and construction. Hence bids could be invited from the experienced bidders for the construction of proposed UASB Plant at Kodara (15 mld) and Rajapur (65 mld).
Further, Rajapur site will require extensive work of construction of bund to protect the site from high flood level of river Ganga. Geo-synthetic work will be required for the construction of bund for which association of a specialized agency will also be required. Hence, this work should be eliminated from the scope of the contractor for construction of Sewage Treatment Plant and a separate bid should be invited.
4. Desilting of Existing Trunk Mains:
CCTV survey and cleaning of existing sewers will be taken up under the scope of this package. It has been noted that existing sewers have around 50% deposition. Hence, cleaning of sewers is to be carried out with care. A number of Indian agencies in association with overseas companies are carrying out similar jobs in various metropolitan cities.
5. Replacement and Upgradation of Existing Pump Station:
Replacement of the old pumps will be required for Mumfordganj and Alopibagh Pump Houses. Additional pumps will be installed in Allahpur Pumping Station. Along with the pumps, necessary electro-mechanical works are also to be carried out. A bid could be invited among the pump manufacturers for this package.
6. Upgradation and Extension of Naini Sewage Treatment Plant:
A large number of specialized agencies with sufficient expertise are available within the country for execution of works under the package. However, it is recommended that a specialized agency be appointed to prepare tenders as due thought will have to be given to rectify the shortcomings in the existing plant as well as integrating the solids stream of the new 20 mld plant with that of the existing plant.
While formulating the above process of implementation of various packages, it has been decided that an Engineering Consultant will be engaged to carry out all the engineering works. The construction agency will carry out all works as per the approved drawings to be issued by Govt. of U.P. for construction of the project. The entire project can be summarized as below:
Table 1.19 Summary of Implementation Activities
Sr. No. Name of the Works Estimated Cost
(In Million Rupees)
1. Installation and replacement of Trunk Sewers 249.0
2. Construction of New Sewage Pumping Stations 158.6
3. Construction of New Sewage Treatment Plants 1,080.3
4. Desilting of existing Trunk Sewers 37.9
5. Rehabilitation of existing Trunk Sewers 120.4
6. Upgradation of existing Sewage Pump Stations 261.9
7. Up gradation of Naini Sewage Treatment Plant 151.6
Total 2,059.8
Final Report on Water Quality Management Plan for Ganga RiverVolume IV-3, Feasibility Study for Allahabad City, Part I, Sewerage Scheme
1-34
(1) Implementing Agency For effective and timely implementation of the project, it is recommended that an independent and autonomous Project Management Unit (PMU) be created under the Department of Urban Development. This should be headed by a Project Director not below the rank of Joint Secretary or in the rank of a Chief Engineer. The PMU should have independent project officers (preferably in the rank of Superintending Engineers) to manage and monitor the progress of the Project in the four sewerage districts. This PMU would have an administrative, financial and support service unit. The unit would administer and maintain project activities, develop project database, release funds etc. The PMU would be further responsible for liaison with other State Government departments and would be supported by an officer in this regard. This official would also assist in developing the institutional linkages and in carrying out combined HRD activities. The PMU would be guided by a high level Steering Committee, which would be represented by Chief (Secretary/Additional Secretary) of Department of Urban Development and include representatives of Department of Housing, Department of Urban Environment and Poverty Alleviation, Department of Environment (UP Pollution Control Board), Department of Industries etc. The Steering Committee would oversee the project progress and would make necessary policy recommendations for the timely implementation of the project. However, for review, appraisal and approval of various projects (which would be mostly technical in nature) there would be a strong need for technical and management expertise. It is suggested to have additional support in form of consultants: The consultants could play a part at two different levels: One consultant/ group of consultants would look after the detailed engineering designs (Design Consultants) and the second group would look after the project management (PMC Consultant). The design consultants would be responsible for preparing detailed engineering reports (including cost estimates) and tender contracts of various projects to be undertaken. Whereas, the role of PM Consultant would be two fold: First, it would develop a project management plan in consultation with PMU and would manage and monitor its implementation. Secondly, it would support institutional development and HRD activities. This is necessary because, when both design and project management consultants leave the Project after a specified period, they would have supported in creating an institutional set-up (organisations, linkages, policies etc.) supporting the project operation. Further, the officials of concerned organisations (Jal Sansthan etc.) would have developed sufficient competencies in managing the Project not only in day to day operations but in design, financial analysis, contract supervisions etc. so that project could be made sustainable in the long run. The project implementation framework as outlined above has been used successfully in the implementation of Urban Development Projects carried out under multilateral funding, in the states of Karnataka, Rajasthan etc.
1.5.2 Recommendations for O&M Detailed recommendations for setting up of O&M organizational report and O&M practices are set out in the O&M report. The salient points are reproduced here:
• Reorganisation of the Institutions involved at the State level in order to provide single point responsibility, preferably with the Jal Sansthan, under the local municipality.
• To earmark funds for maintenance out of the tax revenues. • To increase / levy cess to generate funds, in order to achieve long term financial sustainability • Improvement of O&M practices – regular, planned and pro-active maintenance of all facilities. • Acquisition of modern sewer cleaning tools and machines
Final Report on Water Quality Management Plan for Ganga RiverVolume IV-3, Feasibility Study for Allahabad City, Part I, Sewerage Scheme
1-35
• Training of personnel at worker and managerial level • Creation of a computerized GIS based database of all existing and planned facilities • Regular monitoring of performance of all SPS and STPs by creation of an Environmental
Monitoring Group • Creation of sinking funds for replacement of mechanical equipment • Contracting out of STP operation
1.5.3 Private Sector Participation Private Sector’s participation would be necessary in the project implementation stage, in the transition phase while the GoUP and its agencies build managerial and worker capacity. It can also make good sense economically during the operation phase, particularly in respect to some specialized jobs as listed later in this section. Even if it is decided to let some tasks out to another public agency or to private sector contractors, the Sewerage Authority should always retain overall responsibility for and should closely control and supervise the work carried out by others, and so it will still require competent managers and supervisors. In view of the above discussion, it is recommended that at least the following activities be contracted out to specialized agencies:
• CCTV inspection of sewers • De-silting of sewers • Creation of a computerized, GIS based, asset inventory • Design and Project Management of works under the project • Construction of works under the project • O&M of STPs • Rehabilitation of sewers
The design and construction of new facilities would of course be carried out by specialized agencies, under UPJN/UPJS’s supervision. However, it is recommended that the project implementation be carried out as recommended in item 1.4.2 (2) with the aid of consultants. O&M of the Numaya Dahi and Ponghat STPs, based on WSP technology, could be carried out by GoUP. For Kodara and Rajapur STPs, O&M could possibly be contracted out, by implementing these STPs under a Design-Build-Operate scheme, with a 5-10 year O&M period built into the construction contract itself.
CHAPTER 2
PROVISIONS FOR DISTRICT A
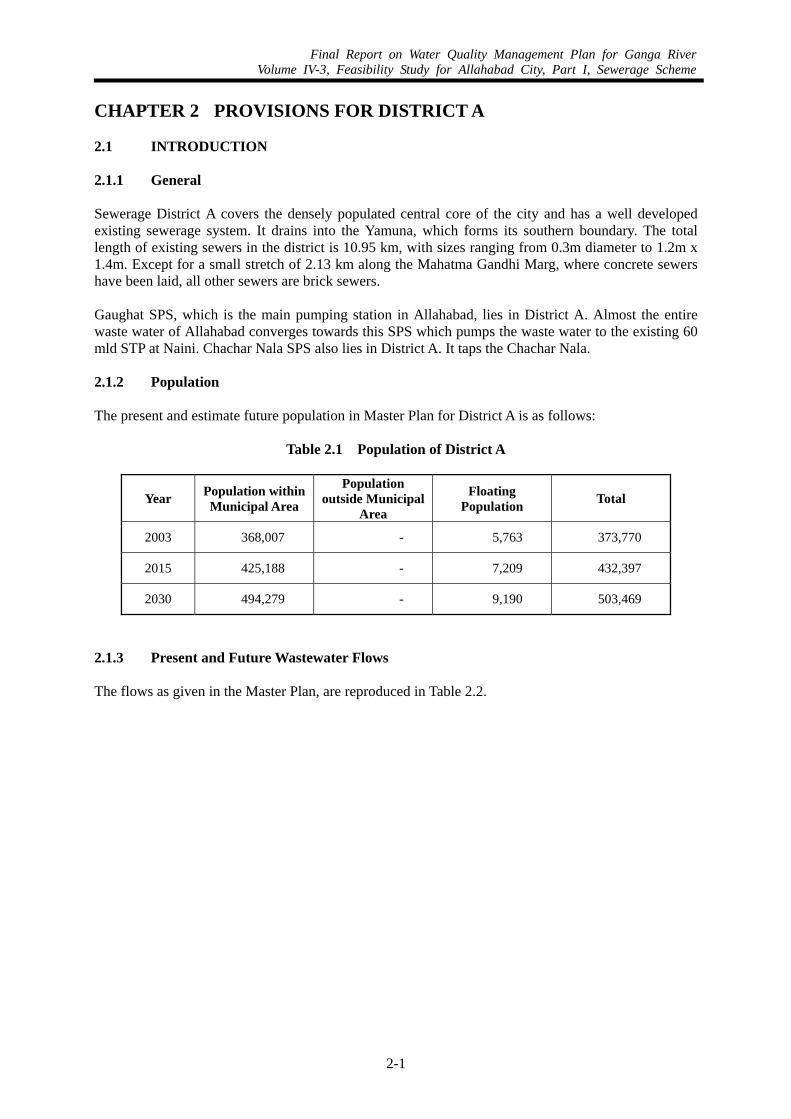
Final Report on Water Quality Management Plan for Ganga RiverVolume IV-3, Feasibility Study for Allahabad City, Part I, Sewerage Scheme
2-1
CHAPTER 2 PROVISIONS FOR DISTRICT A 2.1 INTRODUCTION 2.1.1 General Sewerage District A covers the densely populated central core of the city and has a well developed existing sewerage system. It drains into the Yamuna, which forms its southern boundary. The total length of existing sewers in the district is 10.95 km, with sizes ranging from 0.3m diameter to 1.2m x 1.4m. Except for a small stretch of 2.13 km along the Mahatma Gandhi Marg, where concrete sewers have been laid, all other sewers are brick sewers. Gaughat SPS, which is the main pumping station in Allahabad, lies in District A. Almost the entire waste water of Allahabad converges towards this SPS which pumps the waste water to the existing 60 mld STP at Naini. Chachar Nala SPS also lies in District A. It taps the Chachar Nala. 2.1.2 Population The present and estimate future population in Master Plan for District A is as follows:
Table 2.1 Population of District A
Year Population within Municipal Area
Population outside Municipal
Area
Floating Population Total
2003 368,007 - 5,763 373,770
2015 425,188 - 7,209 432,397
2030 494,279 - 9,190 503,469
2.1.3 Present and Future Wastewater Flows The flows as given in the Master Plan, are reproduced in Table 2.2.
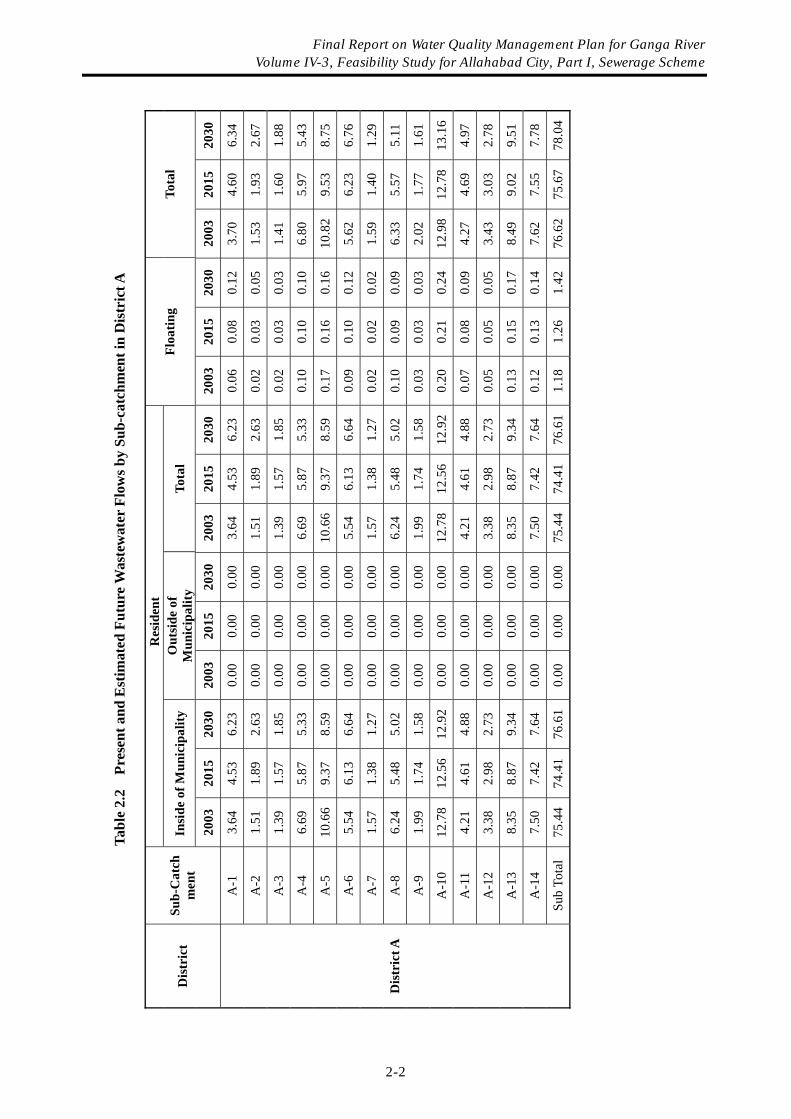
Ta
ble
2.2
Pre
sent
and
Est
imat
ed F
utur
e W
aste
wat
er F
low
s by
Sub-
catc
hmen
t in
Dis
tric
t A
R
esid
ent
Insi
de o
f Mun
icip
ality
O
utsi
de o
f M
unic
ipal
ity
Tota
l Fl
oatin
g To
tal
Dis
tric
t Su
b-C
atch
men
t 20
03
2015
20
30
2003
20
15
2030
20
03
2015
20
30
2003
20
15
2030
20
03
2015
20
30
A-1
3.
64
4.53
6.
23
0.00
0.
00
0.00
3.
64
4.53
6.
23
0.06
0.
08
0.12
3.
70
4.60
6.
34
A-2
1.
51
1.89
2.
63
0.00
0.
00
0.00
1.
51
1.89
2.
63
0.02
0.
03
0.05
1.
53
1.93
2.
67
A-3
1.
39
1.57
1.
85
0.00
0.
00
0.00
1.
39
1.57
1.
85
0.02
0.
03
0.03
1.
41
1.60
1.
88
A-4
6.
69
5.87
5.
33
0.00
0.
00
0.00
6.
69
5.87
5.
33
0.10
0.
10
0.10
6.
80
5.97
5.
43
A-5
10
.66
9.37
8.
59
0.00
0.
00
0.00
10
.66
9.37
8.
59
0.17
0.
16
0.16
10
.82
9.53
8.
75
A-6
5.
54
6.13
6.
64
0.00
0.
00
0.00
5.
54
6.13
6.
64
0.09
0.
10
0.12
5.
62
6.23
6.
76
A-7
1.
57
1.38
1.
27
0.00
0.
00
0.00
1.
57
1.38
1.
27
0.02
0.
02
0.02
1.
59
1.40
1.
29
A-8
6.
24
5.48
5.
02
0.00
0.
00
0.00
6.
24
5.48
5.
02
0.10
0.
09
0.09
6.
33
5.57
5.
11
A-9
1.
99
1.74
1.
58
0.00
0.
00
0.00
1.
99
1.74
1.
58
0.03
0.
03
0.03
2.
02
1.77
1.
61
A-1
0 12
.78
12.5
6 12
.92
0.00
0.
00
0.00
12
.78
12.5
6 12
.92
0.20
0.
21
0.24
12
.98
12.7
8 13
.16
A-1
1 4.
21
4.61
4.
88
0.00
0.
00
0.00
4.
21
4.61
4.
88
0.07
0.
08
0.09
4.
27
4.69
4.
97
A-1
2 3.
38
2.98
2.
73
0.00
0.
00
0.00
3.
38
2.98
2.
73
0.05
0.
05
0.05
3.
43
3.03
2.
78
A-1
3 8.
35
8.87
9.
34
0.00
0.
00
0.00
8.
35
8.87
9.
34
0.13
0.
15
0.17
8.
49
9.02
9.
51
A-1
4 7.
50
7.42
7.
64
0.00
0.
00
0.00
7.
50
7.42
7.
64
0.12
0.
13
0.14
7.
62
7.55
7.
78
Dis
tric
t A
Sub
Tota
l 75
.44
74.4
1 76
.61
0.00
0.
00
0.00
75
.44
74.4
1 76
.61
1.18
1.
26
1.42
76
.62
75.6
7 78
.04
Final Report on Water Quality Management Plan for Ganga River Volume IV-3, Feasibility Study for Allahabad City, Part I, Sewerage Scheme
2-2
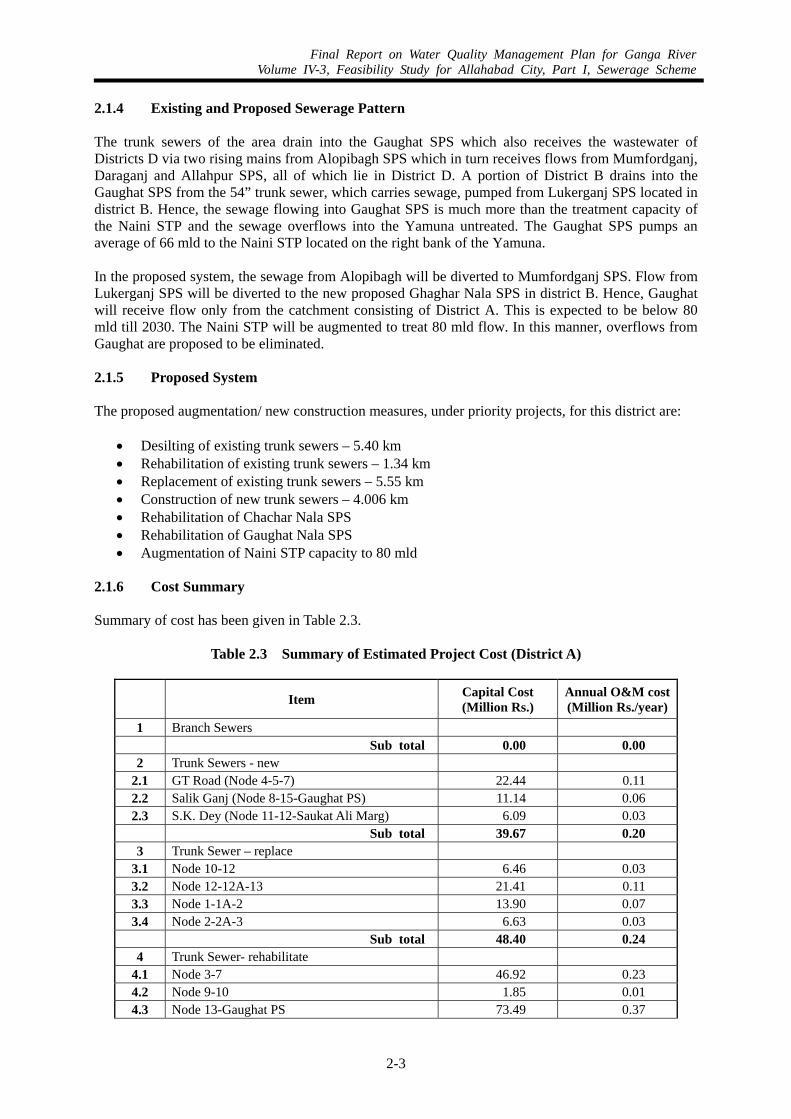
Final Report on Water Quality Management Plan for Ganga RiverVolume IV-3, Feasibility Study for Allahabad City, Part I, Sewerage Scheme
2-3
2.1.4 Existing and Proposed Sewerage Pattern The trunk sewers of the area drain into the Gaughat SPS which also receives the wastewater of Districts D via two rising mains from Alopibagh SPS which in turn receives flows from Mumfordganj, Daraganj and Allahpur SPS, all of which lie in District D. A portion of District B drains into the Gaughat SPS from the 54” trunk sewer, which carries sewage, pumped from Lukerganj SPS located in district B. Hence, the sewage flowing into Gaughat SPS is much more than the treatment capacity of the Naini STP and the sewage overflows into the Yamuna untreated. The Gaughat SPS pumps an average of 66 mld to the Naini STP located on the right bank of the Yamuna. In the proposed system, the sewage from Alopibagh will be diverted to Mumfordganj SPS. Flow from Lukerganj SPS will be diverted to the new proposed Ghaghar Nala SPS in district B. Hence, Gaughat will receive flow only from the catchment consisting of District A. This is expected to be below 80 mld till 2030. The Naini STP will be augmented to treat 80 mld flow. In this manner, overflows from Gaughat are proposed to be eliminated.
2.1.5 Proposed System The proposed augmentation/ new construction measures, under priority projects, for this district are:
• Desilting of existing trunk sewers – 5.40 km • Rehabilitation of existing trunk sewers – 1.34 km • Replacement of existing trunk sewers – 5.55 km • Construction of new trunk sewers – 4.006 km • Rehabilitation of Chachar Nala SPS • Rehabilitation of Gaughat Nala SPS • Augmentation of Naini STP capacity to 80 mld
2.1.6 Cost Summary Summary of cost has been given in Table 2.3.
Table 2.3 Summary of Estimated Project Cost (District A)
Item Capital Cost (Million Rs.)
Annual O&M cost(Million Rs./year)
1 Branch Sewers Sub total 0.00 0.00
2 Trunk Sewers - new 2.1 GT Road (Node 4-5-7) 22.44 0.11 2.2 Salik Ganj (Node 8-15-Gaughat PS) 11.14 0.06 2.3 S.K. Dey (Node 11-12-Saukat Ali Marg) 6.09 0.03
Sub total 39.67 0.20 3 Trunk Sewer – replace
3.1 Node 10-12 6.46 0.03 3.2 Node 12-12A-13 21.41 0.11 3.3 Node 1-1A-2 13.90 0.07 3.4 Node 2-2A-3 6.63 0.03
Sub total 48.40 0.24 4 Trunk Sewer- rehabilitate
4.1 Node 3-7 46.92 0.23 4.2 Node 9-10 1.85 0.01 4.3 Node 13-Gaughat PS 73.49 0.37
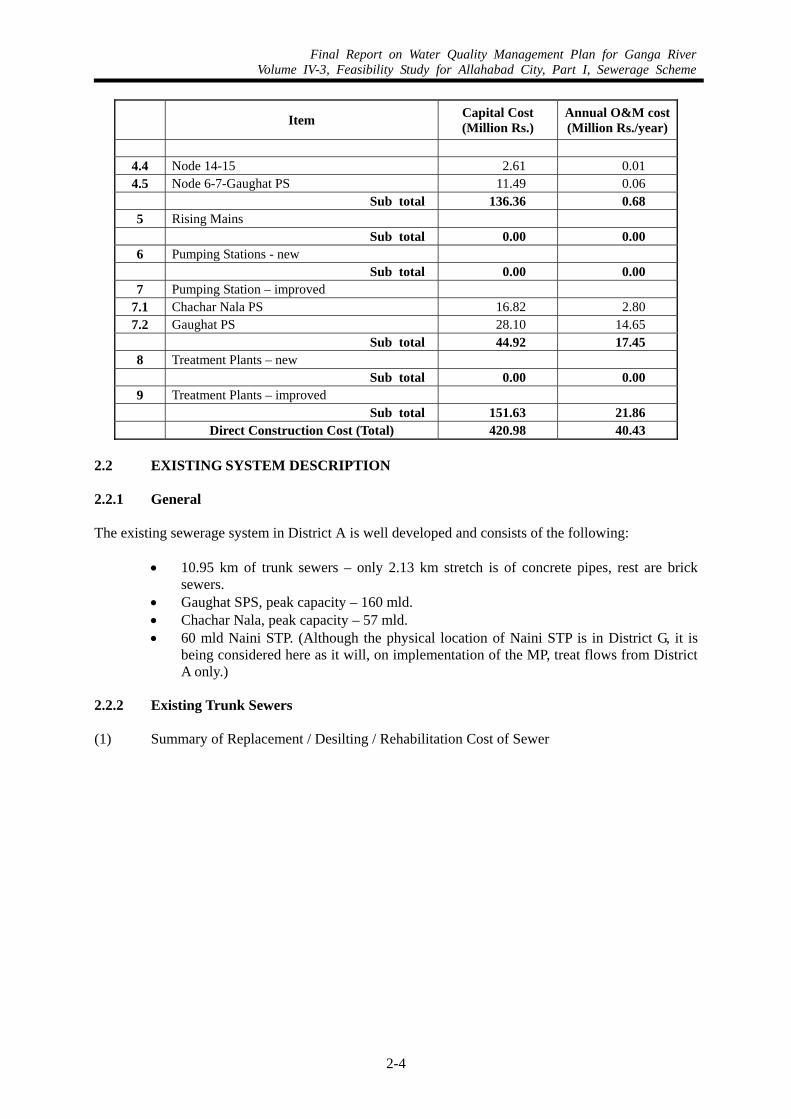
Final Report on Water Quality Management Plan for Ganga RiverVolume IV-3, Feasibility Study for Allahabad City, Part I, Sewerage Scheme
2-4
Item Capital Cost (Million Rs.)
Annual O&M cost(Million Rs./year)
4.4 Node 14-15 2.61 0.01 4.5 Node 6-7-Gaughat PS 11.49 0.06
Sub total 136.36 0.68 5 Rising Mains Sub total 0.00 0.00
6 Pumping Stations - new Sub total 0.00 0.00
7 Pumping Station – improved 7.1 Chachar Nala PS 16.82 2.80 7.2 Gaughat PS 28.10 14.65
Sub total 44.92 17.45 8 Treatment Plants – new Sub total 0.00 0.00
9 Treatment Plants – improved Sub total 151.63 21.86 Direct Construction Cost (Total) 420.98 40.43
2.2 EXISTING SYSTEM DESCRIPTION 2.2.1 General The existing sewerage system in District A is well developed and consists of the following:
• 10.95 km of trunk sewers – only 2.13 km stretch is of concrete pipes, rest are brick sewers.
• Gaughat SPS, peak capacity – 160 mld. • Chachar Nala, peak capacity – 57 mld. • 60 mld Naini STP. (Although the physical location of Naini STP is in District G, it is
being considered here as it will, on implementation of the MP, treat flows from District A only.)
2.2.2 Existing Trunk Sewers (1) Summary of Replacement / Desilting / Rehabilitation Cost of Sewer
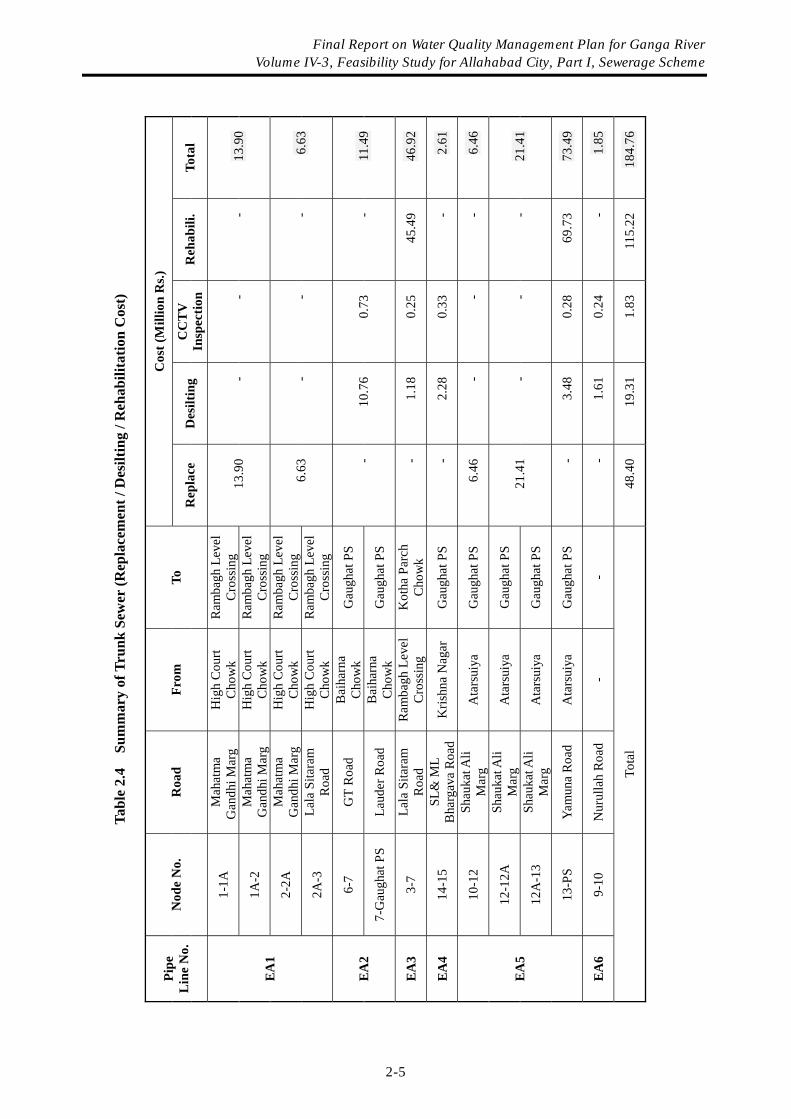
Ta
ble
2.4
Sum
mar
y of
Tru
nk S
ewer
(Rep
lace
men
t / D
esilt
ing
/ Reh
abili
tatio
n C
ost)
Cos
t (M
illio
n R
s.)
Pipe
L
ine
No.
N
ode
No.
R
oad
From
To
R
epla
ce
Des
iltin
g C
CT
V
Insp
ectio
n R
ehab
ili.
Tota
l
1-1A
M
ahat
ma
Gan
dhi M
arg
Hig
h C
ourt
Cho
wk
Ram
bagh
Lev
el
Cro
ssin
g
1A-2
M
ahat
ma
Gan
dhi M
arg
Hig
h C
ourt
Cho
wk
Ram
bagh
Lev
el
Cro
ssin
g
13.9
0 -
- -
13.9
0
2-2A
M
ahat
ma
Gan
dhi M
arg
Hig
h C
ourt
Cho
wk
Ram
bagh
Lev
el
Cro
ssin
g
EA
1
2A-3
La
la S
itara
m
Roa
d H
igh
Cou
rt C
how
k R
amba
gh L
evel
C
ross
ing
6.63
-
- -
6.63
6-7
GT
Roa
d B
aiha
rna
Cho
wk
Gau
ghat
PS
EA
2 7-
Gau
ghat
PS
Laud
er R
oad
Bai
harn
a C
how
k G
augh
at P
S -
10.7
6 0.
73
- 11
.49
EA
3 3-
7 La
la S
itara
m
Roa
d R
amba
gh L
evel
C
ross
ing
Kot
ha P
arch
C
how
k -
1.18
0.
25
45.4
9 46
.92
EA
4 14
-15
SL&
ML
Bha
rgav
a R
oad
Kris
hna
Nag
ar
Gau
ghat
PS
- 2.
28
0.33
-
2.61
10-1
2 Sh
auka
t Ali
Mar
g A
tars
uiya
G
augh
at P
S 6.
46
- -
- 6.
46
12-1
2A
Shau
kat A
li M
arg
Ata
rsui
ya
Gau
ghat
PS
12A
-13
Shau
kat A
li M
arg
Ata
rsui
ya
Gau
ghat
PS
21.4
1 -
- -
21.4
1 E
A5
13-P
S Ya
mun
a R
oad
Ata
rsui
ya
Gau
ghat
PS
- 3.
48
0.28
69
.73
73.4
9
EA
6 9-
10
Nur
ulla
h R
oad
- -
- 1.
61
0.24
-
1.85
Tota
l 48
.40
19.3
1 1.
83
115.
22
184.
76
Final Report on Water Quality Management Plan for Ganga River Volume IV-3, Feasibility Study for Allahabad City, Part I, Sewerage Scheme
2-5
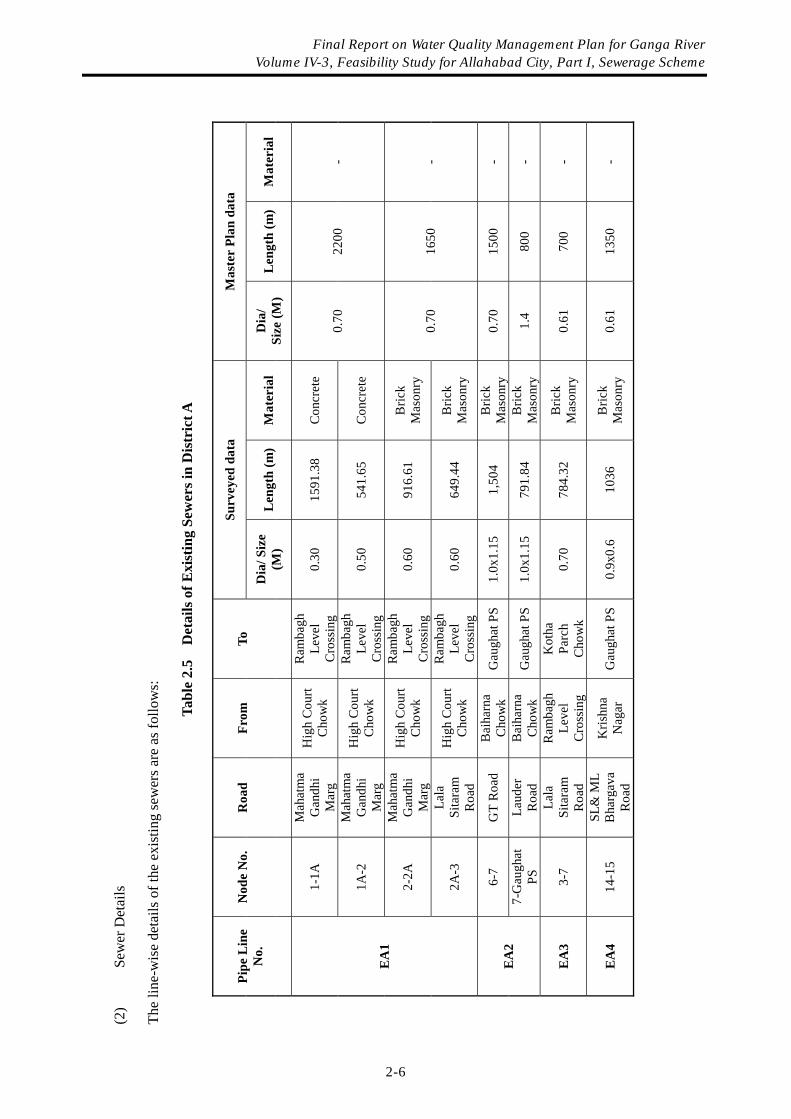
(2
) Se
wer
Det
ails
Th
e lin
e-w
ise
deta
ils o
f the
exi
stin
g se
wer
s are
as f
ollo
ws:
Tabl
e 2.
5 D
etai
ls o
f Exi
stin
g Se
wer
s in
Dis
tric
t A
Surv
eyed
dat
a M
aste
r Pl
an d
ata
Pipe
Lin
e N
o.
Nod
e N
o.
Roa
d Fr
om
To
Dia
/ Siz
e (M
) L
engt
h (m
) M
ater
ial
Dia
/ Si
ze (M
) L
engt
h (m
) M
ater
ial
1-1A
M
ahat
ma
Gan
dhi
Mar
g
Hig
h C
ourt
Cho
wk
Ram
bagh
Le
vel
Cro
ssin
g 0.
30
1591
.38
Con
cret
e
1A-2
M
ahat
ma
Gan
dhi
Mar
g
Hig
h C
ourt
Cho
wk
Ram
bagh
Le
vel
Cro
ssin
g 0.
50
541.
65
Con
cret
e
0.70
22
00
-
2-2A
M
ahat
ma
Gan
dhi
Mar
g
Hig
h C
ourt
Cho
wk
Ram
bagh
Le
vel
Cro
ssin
g 0.
60
916.
61
Bric
k M
ason
ry
EA
1
2A-3
La
la
Sita
ram
R
oad
Hig
h C
ourt
Cho
wk
Ram
bagh
Le
vel
Cro
ssin
g 0.
60
649.
44
Bric
k M
ason
ry
0.70
16
50
-
6-7
GT
Roa
d B
aiha
rna
Cho
wk
Gau
ghat
PS
1.0x
1.15
1,
504
Bric
k M
ason
ry
0.70
15
00
- E
A2
7-G
augh
at
PS
Laud
er
Roa
d B
aiha
rna
Cho
wk
Gau
ghat
PS
1.0x
1.15
79
1.84
B
rick
Mas
onry
1.
4 80
0 -
EA
3 3-
7 La
la
Sita
ram
R
oad
Ram
bagh
Le
vel
Cro
ssin
g
Kot
ha
Parc
h C
how
k 0.
70
784.
32
Bric
k M
ason
ry
0.61
70
0 -
EA
4 14
-15
SL&
ML
Bha
rgav
a R
oad
Kris
hna
Nag
ar
Gau
ghat
PS
0.9x
0.6
1036
B
rick
Mas
onry
0.
61
1350
-
Final Report on Water Quality Management Plan for Ganga River Volume IV-3, Feasibility Study for Allahabad City, Part I, Sewerage Scheme
2-6
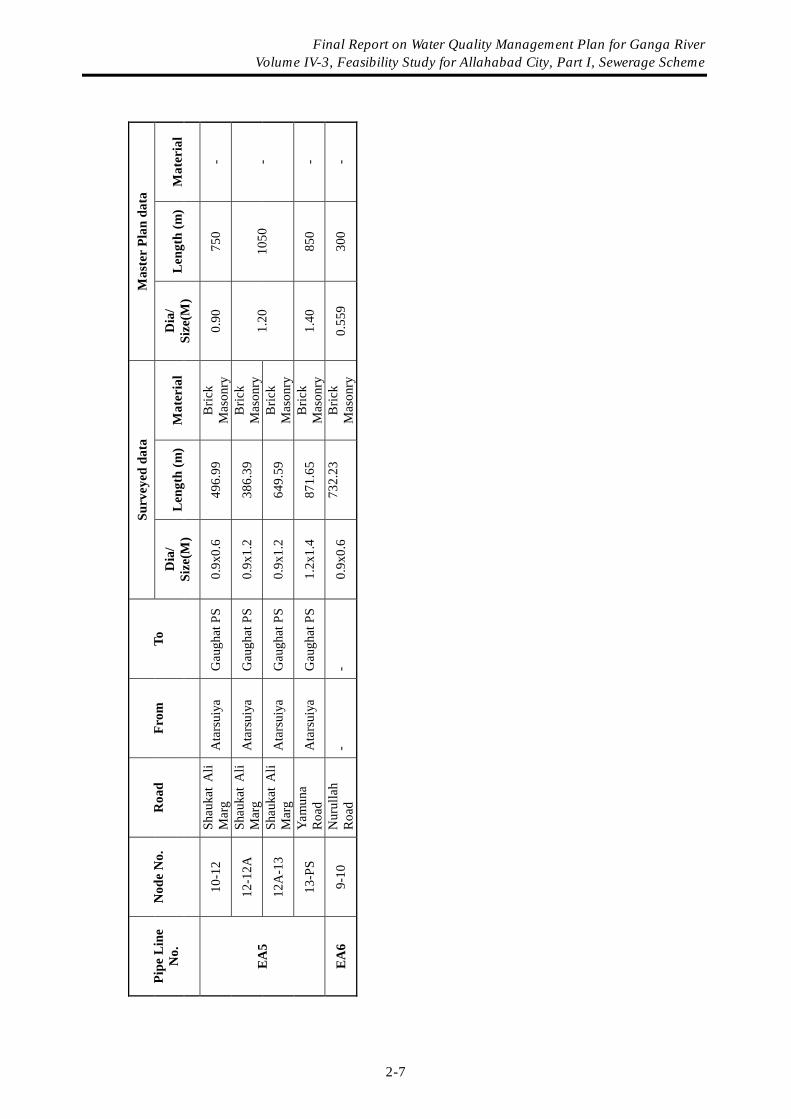
Su
rvey
ed d
ata
Mas
ter
Plan
dat
a Pi
pe L
ine
No.
N
ode
No.
R
oad
From
To
D
ia/
Size
(M)
Len
gth
(m)
Mat
eria
l D
ia/
Size
(M)
Len
gth
(m)
Mat
eria
l
10-1
2 Sh
auka
t A
li M
arg
Ata
rsui
ya
Gau
ghat
PS
0.9x
0.6
496.
99
Bric
k M
ason
ry
0.90
75
0 -
12-1
2A
Shau
kat
Ali
Mar
g A
tars
uiya
G
augh
at P
S 0.
9x1.
2 38
6.39
B
rick
Mas
onry
12A
-13
Shau
kat
Ali
Mar
g A
tars
uiya
G
augh
at P
S 0.
9x1.
2 64
9.59
B
rick
Mas
onry
1.20
10
50
- E
A5
13-P
S Ya
mun
a R
oad
Ata
rsui
ya
Gau
ghat
PS
1.2x
1.4
871.
65
Bric
k M
ason
ry
1.40
85
0 -
EA
6 9-
10
Nur
ulla
h R
oad
- -
0.9x
0.6
732.
23
B
rick
Mas
onry
0.
559
300
-
Final Report on Water Quality Management Plan for Ganga River Volume IV-3, Feasibility Study for Allahabad City, Part I, Sewerage Scheme
2-7
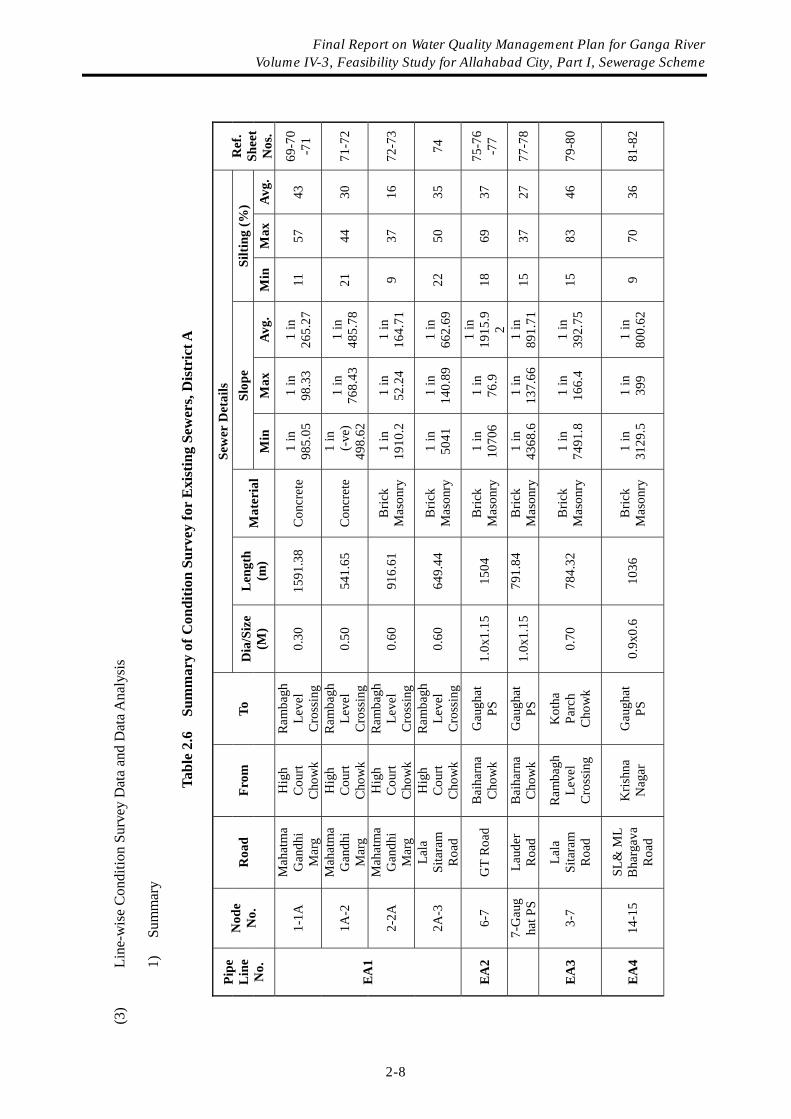
(3)
Line
-wis
e C
ondi
tion
Surv
ey D
ata
and
Dat
a Ana
lysi
s
1)
Sum
mar
y
Tabl
e 2.
6 S
umm
ary
of C
ondi
tion
Surv
ey fo
r E
xist
ing
Sew
ers,
Dis
tric
t A
Se
wer
Det
ails
Sl
ope
Silti
ng (%
) Pi
pe
Lin
e N
o.
Nod
e N
o.
Roa
d Fr
om
To
Dia
/Siz
e (M
) L
engt
h (m
) M
ater
ial
Min
M
ax
Avg.
M
in
Max
Av
g.
R
ef.
Shee
t N
os.
1-1A
M
ahat
ma
Gan
dhi
Mar
g
Hig
h C
ourt
Cho
wk
Ram
bagh
Le
vel
Cro
ssin
g 0.
30
1591
.38
Con
cret
e 1
in
985.
05
1 in
98
.33
1 in
26
5.27
11
57
43
69
-70
-71
1A-2
M
ahat
ma
Gan
dhi
Mar
g
Hig
h C
ourt
Cho
wk
Ram
bagh
Le
vel
Cro
ssin
g 0.
50
541.
65
Con
cret
e 1
in
(
-ve)
49
8.62
1 in
76
8.43
1
in
485.
78
21
44
30
71-7
2
2-2A
M
ahat
ma
Gan
dhi
Mar
g
Hig
h C
ourt
Cho
wk
Ram
bagh
Le
vel
Cro
ssin
g 0.
60
916.
61
Bric
k M
ason
ry
1 in
19
10.2
1
in
52.2
4 1
in
164.
71
9 37
16
72
-73
EA
1
2A-3
La
la
Sita
ram
R
oad
Hig
h C
ourt
Cho
wk
Ram
bagh
Le
vel
Cro
ssin
g 0.
60
649.
44
Bric
k M
ason
ry
1 in
50
41
1 in
14
0.89
1
in
662.
69
22
50
35
74
EA
2 6-
7 G
T R
oad
Bai
harn
a C
how
k G
augh
at
PS
1.0x
1.15
15
04
Bric
k M
ason
ry
1 in
10
706
1 in
76
.9
1 in
19
15.9
2 18
69
37
75
-76
-77
7-
Gau
gha
t PS
Laud
er
Roa
d B
aiha
rna
Cho
wk
Gau
ghat
PS
1.
0x1.
15
791.
84
B
rick
Mas
onry
1
in
4368
.6
1 in
13
7.66
1
in
891.
71
15
37
27
77-7
8
EA
3 3-
7 La
la
Sita
ram
R
oad
Ram
bagh
Le
vel
Cro
ssin
g
Kot
ha
Parc
h C
how
k 0.
70
784.
32
Bric
k M
ason
ry
1 in
74
91.8
1
in
166.
4 1
in
392.
75
15
83
46
79-8
0
EA
4 14
-15
SL&
ML
Bha
rgav
a R
oad
Kris
hna
Nag
ar
Gau
ghat
PS
0.
9x0.
6 10
36
Bric
k M
ason
ry
1 in
31
29.5
1
in
399
1 in
80
0.62
9
70
36
81-8
2
Final Report on Water Quality Management Plan for Ganga River Volume IV-3, Feasibility Study for Allahabad City, Part I, Sewerage Scheme
2-8
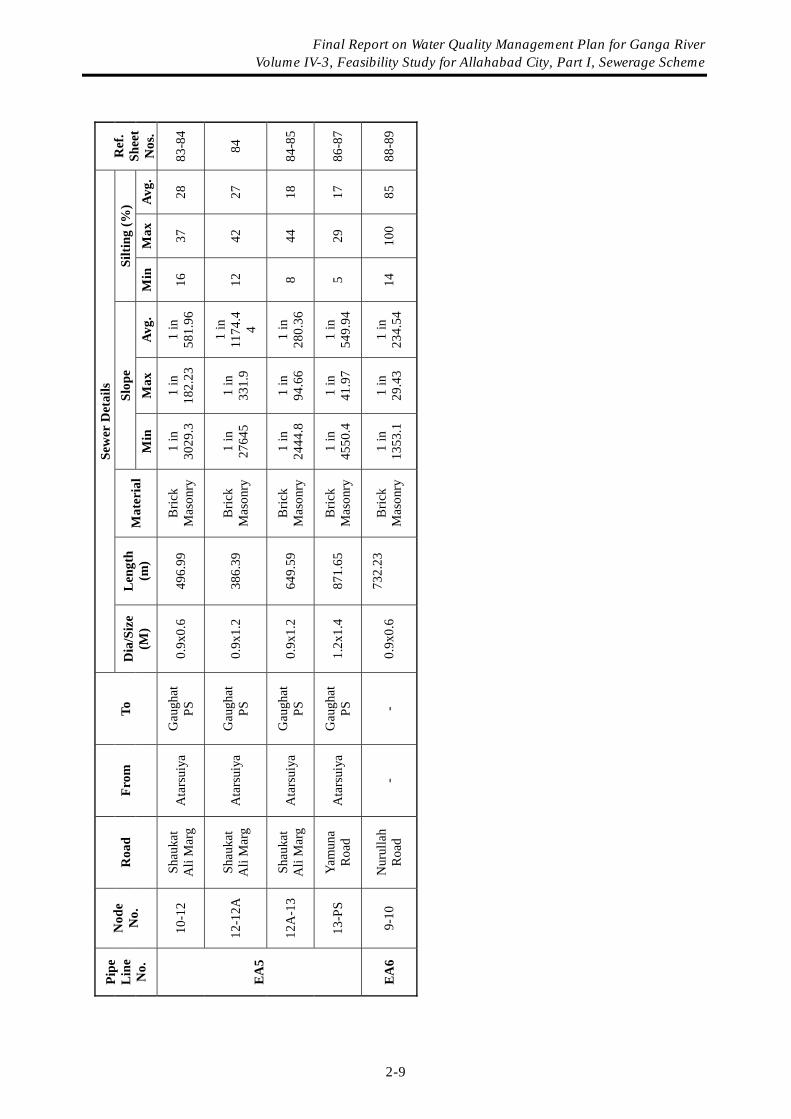
Sew
er D
etai
ls
Slop
e Si
lting
(%)
Pipe
L
ine
No.
Nod
e N
o.
Roa
d Fr
om
To
Dia
/Siz
e (M
) L
engt
h (m
) M
ater
ial
Min
M
ax
Avg.
M
in
Max
Av
g.
R
ef.
Shee
t N
os.
10-1
2 Sh
auka
t A
li M
arg
Ata
rsui
ya
Gau
ghat
PS
0.
9x0.
6 49
6.99
B
rick
Mas
onry
1
in
3029
.3
1 in
18
2.23
1
in
581.
96
16
37
28
83-8
4
12-1
2A
Shau
kat
Ali
Mar
g A
tars
uiya
G
augh
at
PS
0.9x
1.2
386.
39
Bric
k M
ason
ry
1 in
27
645
1 in
33
1.9
1 in
11
74.4
4 12
42
27
84
12A
-13
Shau
kat
Ali
Mar
g A
tars
uiya
G
augh
at
PS
0.9x
1.2
649.
59
Bric
k M
ason
ry
1 in
24
44.8
1
in
94.6
6 1
in
280.
36
8 44
18
84
-85
EA
5
13-P
S Ya
mun
a R
oad
Ata
rsui
ya
Gau
ghat
PS
1.
2x1.
4 87
1.65
B
rick
Mas
onry
1
in
4550
.4
1 in
41
.97
1 in
54
9.94
5
29
17
86-8
7
EA
6 9-
10
Nur
ulla
h R
oad
- -
0.9x
0.6
732.
23
B
rick
Mas
onry
1
in
1353
.1
1 in
29
.43
1 in
23
4.54
14
10
0 85
88
-89
Final Report on Water Quality Management Plan for Ganga River Volume IV-3, Feasibility Study for Allahabad City, Part I, Sewerage Scheme
2-9
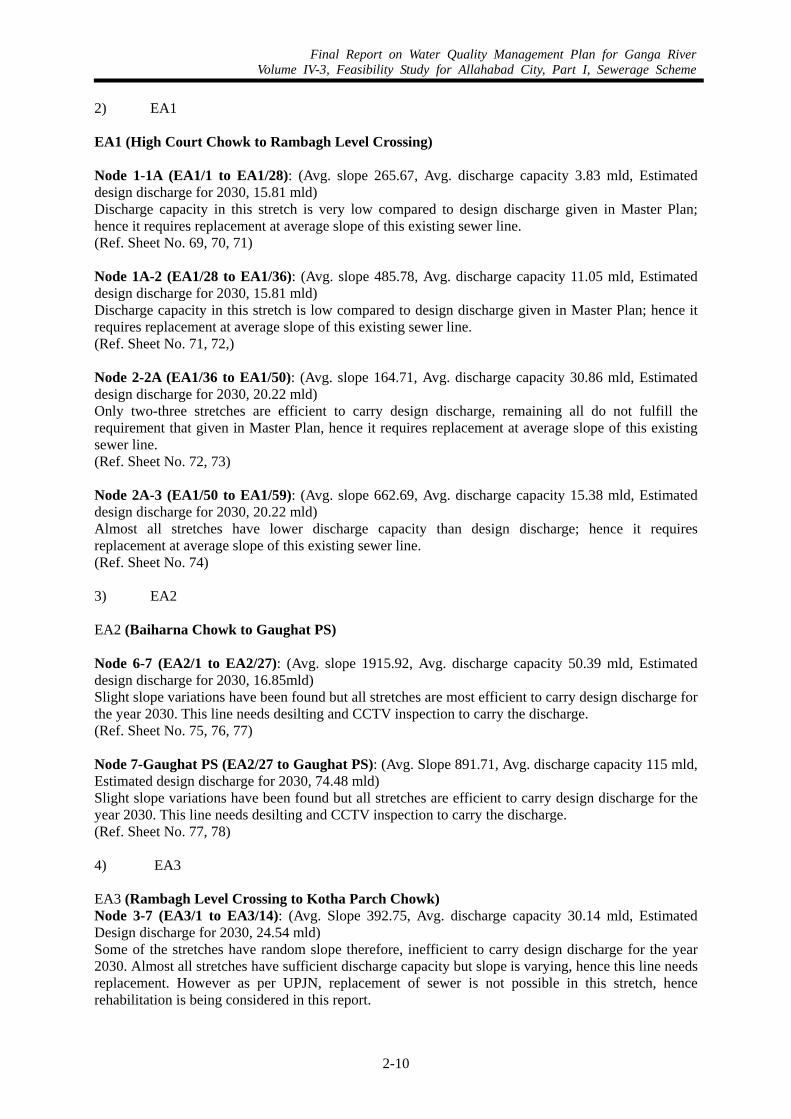
Final Report on Water Quality Management Plan for Ganga RiverVolume IV-3, Feasibility Study for Allahabad City, Part I, Sewerage Scheme
2-10
2) EA1
EA1 (High Court Chowk to Rambagh Level Crossing)
Node 1-1A (EA1/1 to EA1/28): (Avg. slope 265.67, Avg. discharge capacity 3.83 mld, Estimated design discharge for 2030, 15.81 mld) Discharge capacity in this stretch is very low compared to design discharge given in Master Plan; hence it requires replacement at average slope of this existing sewer line. (Ref. Sheet No. 69, 70, 71)
Node 1A-2 (EA1/28 to EA1/36): (Avg. slope 485.78, Avg. discharge capacity 11.05 mld, Estimated design discharge for 2030, 15.81 mld) Discharge capacity in this stretch is low compared to design discharge given in Master Plan; hence it requires replacement at average slope of this existing sewer line. (Ref. Sheet No. 71, 72,) Node 2-2A (EA1/36 to EA1/50): (Avg. slope 164.71, Avg. discharge capacity 30.86 mld, Estimated design discharge for 2030, 20.22 mld) Only two-three stretches are efficient to carry design discharge, remaining all do not fulfill the requirement that given in Master Plan, hence it requires replacement at average slope of this existing sewer line. (Ref. Sheet No. 72, 73) Node 2A-3 (EA1/50 to EA1/59): (Avg. slope 662.69, Avg. discharge capacity 15.38 mld, Estimated design discharge for 2030, 20.22 mld) Almost all stretches have lower discharge capacity than design discharge; hence it requires replacement at average slope of this existing sewer line. (Ref. Sheet No. 74)
3) EA2
EA2 (Baiharna Chowk to Gaughat PS) Node 6-7 (EA2/1 to EA2/27): (Avg. slope 1915.92, Avg. discharge capacity 50.39 mld, Estimated design discharge for 2030, 16.85mld) Slight slope variations have been found but all stretches are most efficient to carry design discharge for the year 2030. This line needs desilting and CCTV inspection to carry the discharge. (Ref. Sheet No. 75, 76, 77) Node 7-Gaughat PS (EA2/27 to Gaughat PS): (Avg. Slope 891.71, Avg. discharge capacity 115 mld, Estimated design discharge for 2030, 74.48 mld) Slight slope variations have been found but all stretches are efficient to carry design discharge for the year 2030. This line needs desilting and CCTV inspection to carry the discharge. (Ref. Sheet No. 77, 78)
4) EA3
EA3 (Rambagh Level Crossing to Kotha Parch Chowk) Node 3-7 (EA3/1 to EA3/14): (Avg. Slope 392.75, Avg. discharge capacity 30.14 mld, Estimated Design discharge for 2030, 24.54 mld) Some of the stretches have random slope therefore, inefficient to carry design discharge for the year 2030. Almost all stretches have sufficient discharge capacity but slope is varying, hence this line needs replacement. However as per UPJN, replacement of sewer is not possible in this stretch, hence rehabilitation is being considered in this report.
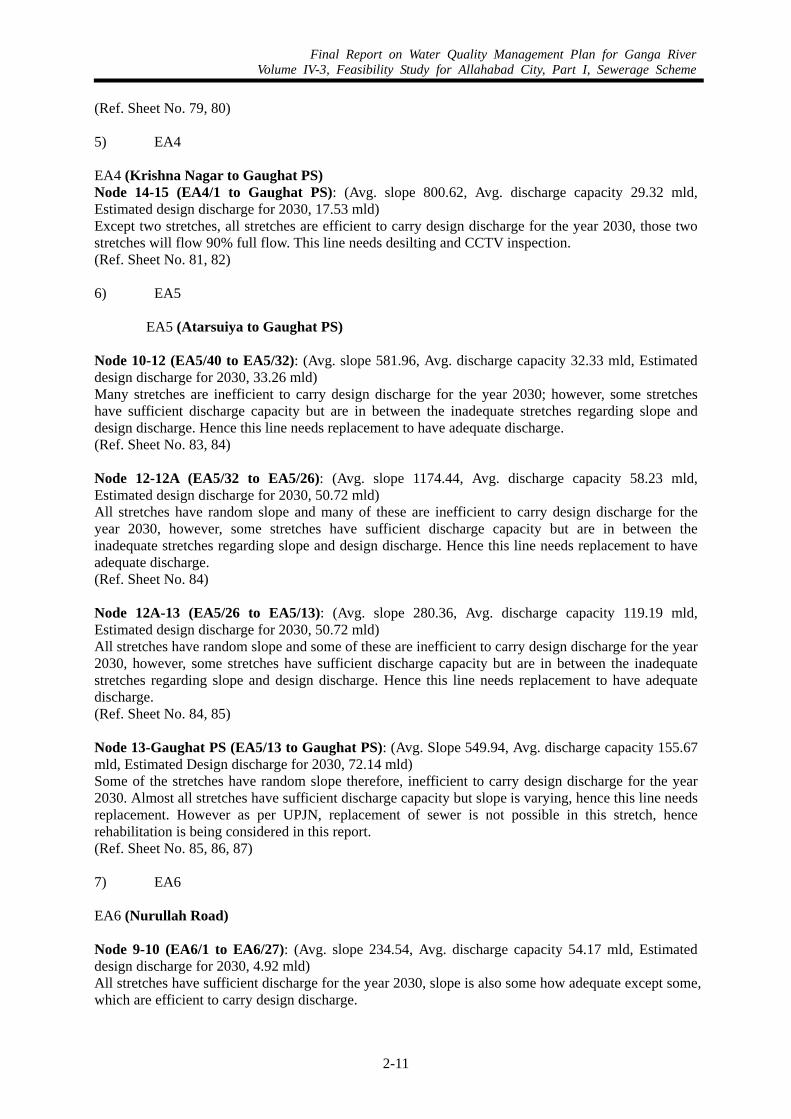
Final Report on Water Quality Management Plan for Ganga RiverVolume IV-3, Feasibility Study for Allahabad City, Part I, Sewerage Scheme
2-11
(Ref. Sheet No. 79, 80)
5) EA4
EA4 (Krishna Nagar to Gaughat PS) Node 14-15 (EA4/1 to Gaughat PS): (Avg. slope 800.62, Avg. discharge capacity 29.32 mld, Estimated design discharge for 2030, 17.53 mld) Except two stretches, all stretches are efficient to carry design discharge for the year 2030, those two stretches will flow 90% full flow. This line needs desilting and CCTV inspection. (Ref. Sheet No. 81, 82) 6) EA5
EA5 (Atarsuiya to Gaughat PS)
Node 10-12 (EA5/40 to EA5/32): (Avg. slope 581.96, Avg. discharge capacity 32.33 mld, Estimated design discharge for 2030, 33.26 mld) Many stretches are inefficient to carry design discharge for the year 2030; however, some stretches have sufficient discharge capacity but are in between the inadequate stretches regarding slope and design discharge. Hence this line needs replacement to have adequate discharge. (Ref. Sheet No. 83, 84) Node 12-12A (EA5/32 to EA5/26): (Avg. slope 1174.44, Avg. discharge capacity 58.23 mld, Estimated design discharge for 2030, 50.72 mld) All stretches have random slope and many of these are inefficient to carry design discharge for the year 2030, however, some stretches have sufficient discharge capacity but are in between the inadequate stretches regarding slope and design discharge. Hence this line needs replacement to have adequate discharge. (Ref. Sheet No. 84) Node 12A-13 (EA5/26 to EA5/13): (Avg. slope 280.36, Avg. discharge capacity 119.19 mld, Estimated design discharge for 2030, 50.72 mld) All stretches have random slope and some of these are inefficient to carry design discharge for the year 2030, however, some stretches have sufficient discharge capacity but are in between the inadequate stretches regarding slope and design discharge. Hence this line needs replacement to have adequate discharge. (Ref. Sheet No. 84, 85) Node 13-Gaughat PS (EA5/13 to Gaughat PS): (Avg. Slope 549.94, Avg. discharge capacity 155.67 mld, Estimated Design discharge for 2030, 72.14 mld) Some of the stretches have random slope therefore, inefficient to carry design discharge for the year 2030. Almost all stretches have sufficient discharge capacity but slope is varying, hence this line needs replacement. However as per UPJN, replacement of sewer is not possible in this stretch, hence rehabilitation is being considered in this report. (Ref. Sheet No. 85, 86, 87)
7) EA6
EA6 (Nurullah Road)
Node 9-10 (EA6/1 to EA6/27): (Avg. slope 234.54, Avg. discharge capacity 54.17 mld, Estimated design discharge for 2030, 4.92 mld) All stretches have sufficient discharge for the year 2030, slope is also some how adequate except some, which are efficient to carry design discharge.

Final Report on Water Quality Management Plan for Ganga RiverVolume IV-3, Feasibility Study for Allahabad City, Part I, Sewerage Scheme
2-12
(Ref. Sheet No. 88, 89)
(4) Recommendations
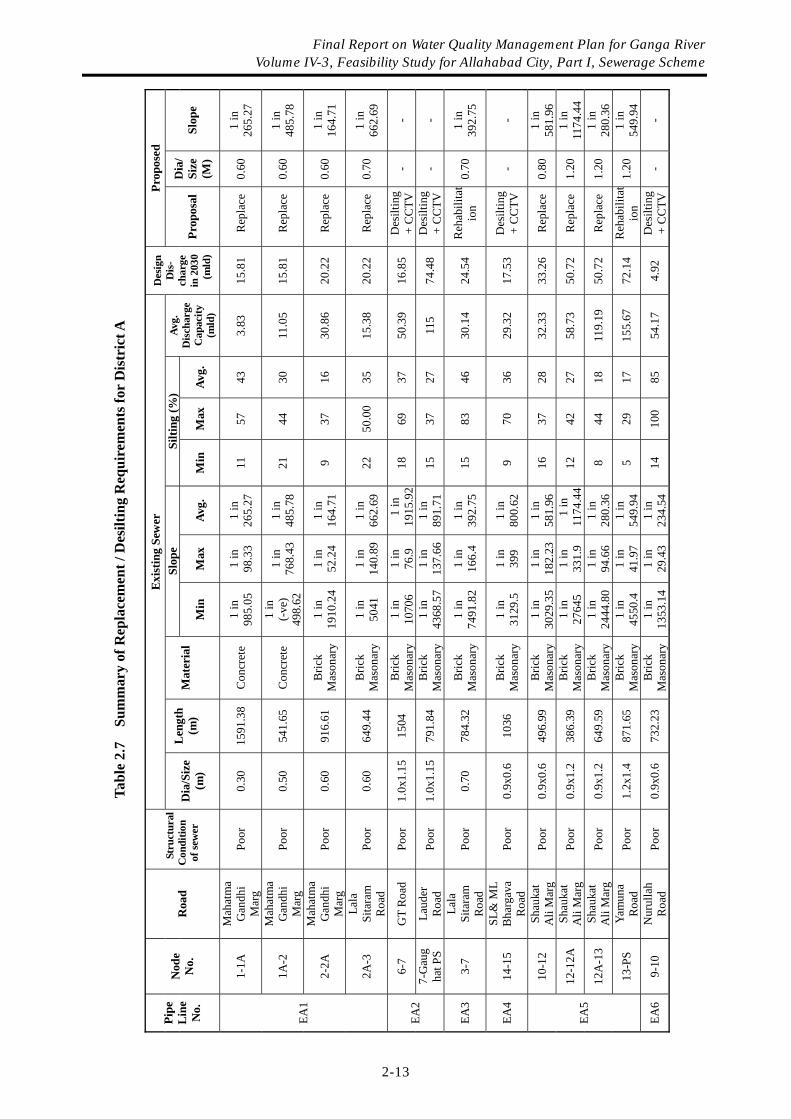
Ta
ble
2.7
Sum
mar
y of
Rep
lace
men
t / D
esilt
ing
Req
uire
men
ts fo
r D
istr
ict A
Exi
stin
g Se
wer
Pr
opos
ed
Slop
e Si
lting
(%)
Pipe
L
ine
No.
Nod
e N
o.
Roa
d St
ruct
ural
C
ondi
tion
of se
wer
D
ia/S
ize
(m)
Len
gth
(m)
Mat
eria
l
Min
M
ax
Avg.
M
in
Max
Av
g.
Avg.
D
isch
arge
C
apac
ity
(mld
)
Des
ign
Dis
- ch
arge
in
203
0 (m
ld)
Prop
osal
D
ia/
Size
(M
) Sl
ope
1-1A
M
ahat
ma
Gan
dhi
Mar
g Po
or
0.30
15
91.3
8 C
oncr
ete
1 in
98
5.05
1
in
98.3
3 1
in
265.
27
11
57
43
3.83
15
.81
Rep
lace
0.
60
1 in
26
5.27
1A-2
M
ahat
ma
Gan
dhi
Mar
g Po
or
0.50
54
1.65
C
oncr
ete
1 in
(-ve
) 49
8.62
1 in
76
8.43
1
in
485.
78
21
44
30
11.0
5 15
.81
Rep
lace
0.
60
1 in
48
5.78
2-2A
M
ahat
ma
Gan
dhi
Mar
g Po
or
0.60
91
6.61
B
rick
Mas
onar
y 1
in
1910
.24
1 in
52
.24
1 in
16
4.71
9
37
16
30.8
6 20
.22
Rep
lace
0.
60
1 in
16
4.71
EA1
2A-3
La
la
Sita
ram
R
oad
Poor
0.
60
649.
44
Bric
k M
ason
ary
1 in
50
41
1 in
14
0.89
1
in
662.
69
22
50.0
0 35
15
.38
20.2
2 R
epla
ce
0.70
1
in
662.
69
6-7
GT
Roa
d Po
or
1.0x
1.15
15
04
Bric
k M
ason
ary
1 in
10
706
1 in
76
.9
1 in
19
15.9
2 18
69
37
50
.39
16.8
5 D
esilt
ing
+ C
CTV
-
- EA
2 7-
Gau
gha
t PS
Laud
er
Roa
d Po
or
1.0x
1.15
79
1.84
B
rick
Mas
onar
y 1
in
4368
.57
1 in
13
7.66
1
in
891.
71
15
37
27
115
74.4
8 D
esilt
ing
+ C
CTV
-
-
EA3
3-7
Lala
Si
tara
m
Roa
d Po
or
0.70
78
4.32
B
rick
Mas
onar
y 1
in
7491
.82
1 in
16
6.4
1 in
39
2.75
15
83
46
30
.14
24.5
4 R
ehab
ilita
tio
n 0.
70
1 in
39
2.75
EA4
14-1
5 SL
& M
L B
harg
ava
Roa
d Po
or
0.9x
0.6
1036
B
rick
Mas
onar
y 1
in
3129
.5
1 in
39
9 1
in
800.
62
9 70
36
29
.32
17.5
3 D
esilt
ing
+ C
CTV
-
-
10-1
2 Sh
auka
t A
li M
arg
Poor
0.
9x0.
6 49
6.99
B
rick
Mas
onar
y 1
in
3029
.35
1 in
18
2.23
1
in
581.
96
16
37
28
32.3
3 33
.26
Rep
lace
0.
80
1 in
58
1.96
12-1
2A
Shau
kat
Ali
Mar
g Po
or
0.9x
1.2
386.
39
Bric
k M
ason
ary
1 in
27
645
1 in
33
1.9
1 in
11
74.4
4 12
42
27
58
.73
50.7
2 R
epla
ce
1.20
1
in
1174
.44
12A
-13
Shau
kat
Ali
Mar
g Po
or
0.9x
1.2
649.
59
Bric
k M
ason
ary
1 in
24
44.8
0 1
in
94.6
6 1
in
280.
36
8 44
18
11
9.19
50
.72
Rep
lace
1.
20
1 in
28
0.36
EA5
13-P
S Ya
mun
a R
oad
Poor
1.
2x1.
4 87
1.65
B
rick
Mas
onar
y 1
in
4550
.4
1 in
41
.97
1 in
54
9.94
5
29
17
155.
67
72.1
4 R
ehab
ilita
tio
n 1.
20
1 in
54
9.94
EA6
9-10
N
urul
lah
Roa
d Po
or
0.9x
0.6
732.
23
Bric
k M
ason
ary
1 in
13
53.1
4 1
in
29.4
3 1
in
234.
54
14
100
85
54.1
7 4.
92
Des
iltin
g +
CC
TV
- -
Final Report on Water Quality Management Plan for Ganga River Volume IV-3, Feasibility Study for Allahabad City, Part I, Sewerage Scheme
2-13
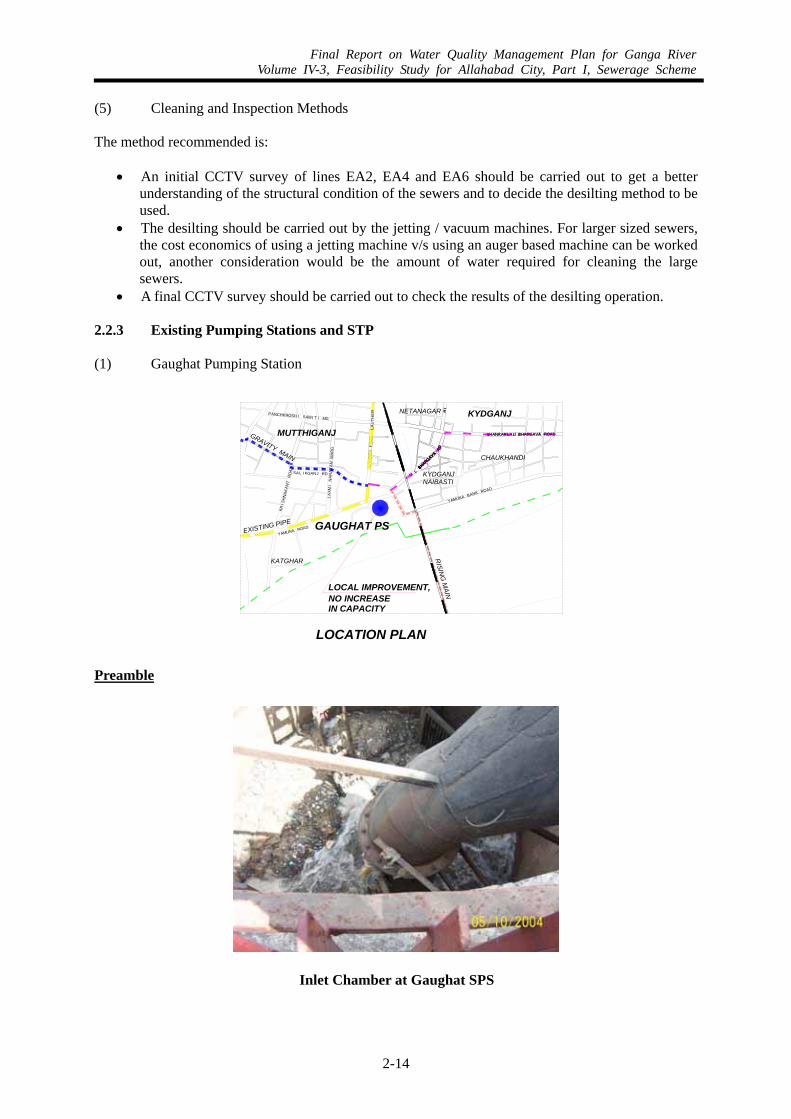
Final Report on Water Quality Management Plan for Ganga RiverVolume IV-3, Feasibility Study for Allahabad City, Part I, Sewerage Scheme
2-14
(5) Cleaning and Inspection Methods The method recommended is:
• An initial CCTV survey of lines EA2, EA4 and EA6 should be carried out to get a better understanding of the structural condition of the sewers and to decide the desilting method to be used.
• The desilting should be carried out by the jetting / vacuum machines. For larger sized sewers, the cost economics of using a jetting machine v/s using an auger based machine can be worked out, another consideration would be the amount of water required for cleaning the large sewers.
• A final CCTV survey should be carried out to check the results of the desilting operation.
2.2.3 Existing Pumping Stations and STP (1) Gaughat Pumping Station
GAVAR
DH
I
KYDGANJNAIBASTI
SHANKARLAL BHARGAVA ROAD
ML
BHARGAVAR
D
YAMUNA BANK ROAD
KATGHAR
L AXM
IN
AR
AY
AN
MA
RG
SAL I KGANJ RD
KRI S
HN
AK
AN
TRO
AD
YAMUNA ROAD
LAU
DE
RR
OA
D
ML
BHARGAVAR
D
GAUGHAT PSEXISTING PIPE
LOCAL IMPROVEMENT, NO INCREASEIN CAPACITY
GRAVITY MAIN
RISIN
G M
AIN
LOCATION PLAN
MUTTHIGANJ
PANCHKROSH I SAM I T I MG
BHARGAVAR
DH
I
LAU
THE
R KYDGANJNETANAGAR
CHAUKHANDI
SHANKARLAL BHARGAVA ROAD
BHAR
Preamble
Inlet Chamber at Gaughat SPS
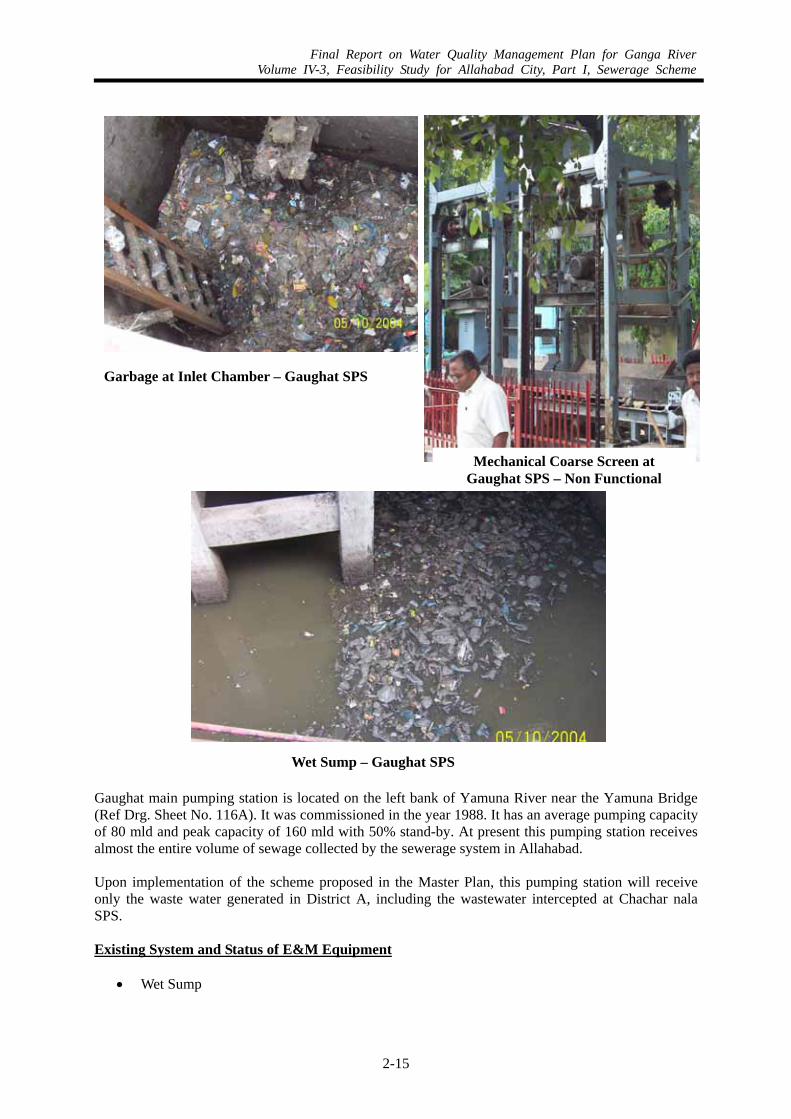
Final Report on Water Quality Management Plan for Ganga RiverVolume IV-3, Feasibility Study for Allahabad City, Part I, Sewerage Scheme
2-15
Gaughat main pumping station is located on the left bank of Yamuna River near the Yamuna Bridge (Ref Drg. Sheet No. 116A). It was commissioned in the year 1988. It has an average pumping capacity of 80 mld and peak capacity of 160 mld with 50% stand-by. At present this pumping station receives almost the entire volume of sewage collected by the sewerage system in Allahabad. Upon implementation of the scheme proposed in the Master Plan, this pumping station will receive only the waste water generated in District A, including the wastewater intercepted at Chachar nala SPS. Existing System and Status of E&M Equipment
• Wet Sump
Wet Sump – Gaughat SPS
Garbage at Inlet Chamber – Gaughat SPS
Mechanical Coarse Screen at Gaughat SPS – Non Functional
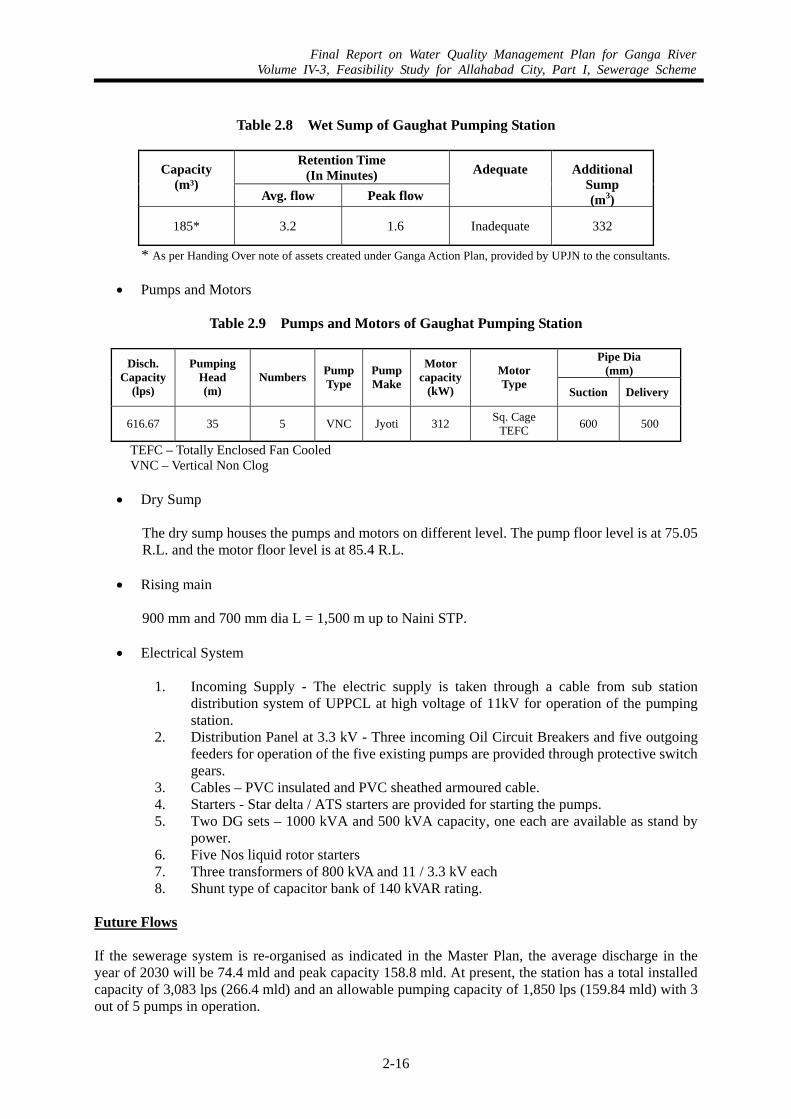
Final Report on Water Quality Management Plan for Ganga RiverVolume IV-3, Feasibility Study for Allahabad City, Part I, Sewerage Scheme
2-16
Table 2.8 Wet Sump of Gaughat Pumping Station
Retention Time
(In Minutes) Capacity (m³)
Avg. flow Peak flow
Adequate Additional Sump (m3)
185* 3.2 1.6 Inadequate 332
* As per Handing Over note of assets created under Ganga Action Plan, provided by UPJN to the consultants. • Pumps and Motors
Table 2.9 Pumps and Motors of Gaughat Pumping Station
Pipe Dia (mm) Disch.
Capacity (lps)
Pumping Head (m)
Numbers PumpType
Pump Make
Motor capacity
(kW)
Motor Type
Suction Delivery
616.67 35 5 VNC Jyoti 312 Sq. Cage TEFC 600 500
TEFC – Totally Enclosed Fan Cooled VNC – Vertical Non Clog
• Dry Sump
The dry sump houses the pumps and motors on different level. The pump floor level is at 75.05 R.L. and the motor floor level is at 85.4 R.L.
• Rising main
900 mm and 700 mm dia L = 1,500 m up to Naini STP.
• Electrical System
1. Incoming Supply - The electric supply is taken through a cable from sub station
distribution system of UPPCL at high voltage of 11kV for operation of the pumping station.
2. Distribution Panel at 3.3 kV - Three incoming Oil Circuit Breakers and five outgoing feeders for operation of the five existing pumps are provided through protective switch gears.
3. Cables – PVC insulated and PVC sheathed armoured cable. 4. Starters - Star delta / ATS starters are provided for starting the pumps. 5. Two DG sets – 1000 kVA and 500 kVA capacity, one each are available as stand by
power. 6. Five Nos liquid rotor starters 7. Three transformers of 800 kVA and 11 / 3.3 kV each 8. Shunt type of capacitor bank of 140 kVAR rating.
Future Flows If the sewerage system is re-organised as indicated in the Master Plan, the average discharge in the year of 2030 will be 74.4 mld and peak capacity 158.8 mld. At present, the station has a total installed capacity of 3,083 lps (266.4 mld) and an allowable pumping capacity of 1,850 lps (159.84 mld) with 3 out of 5 pumps in operation.
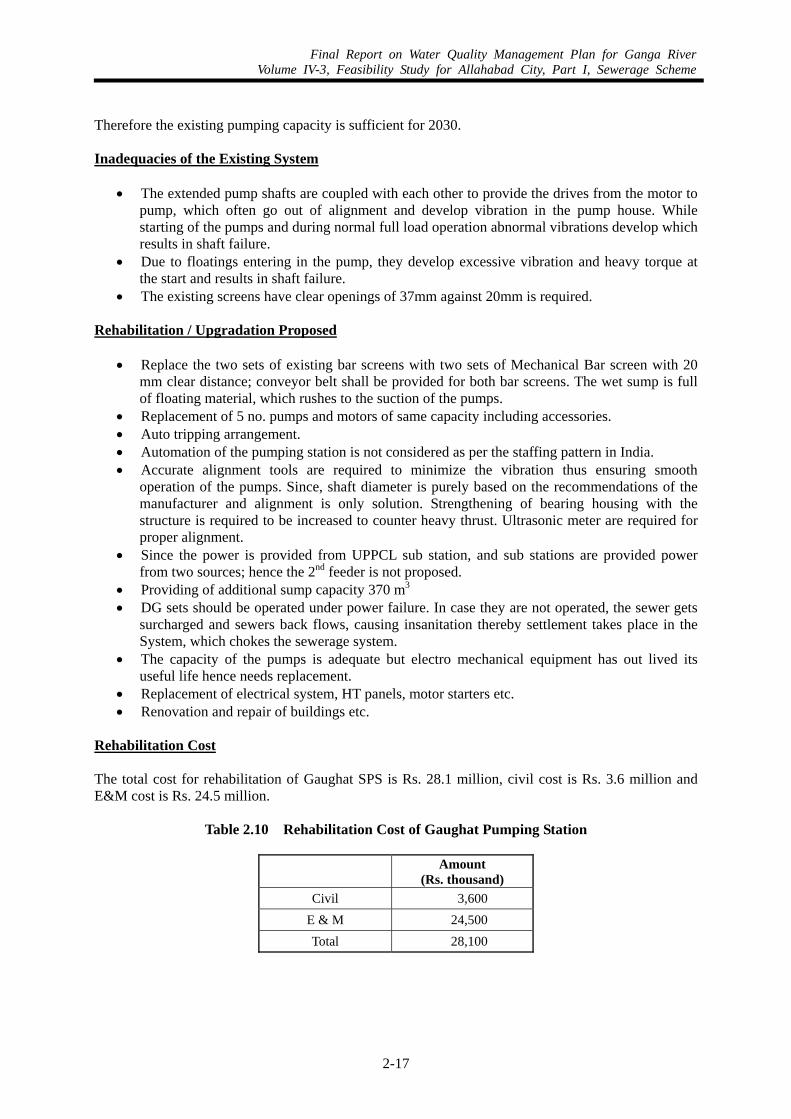
Final Report on Water Quality Management Plan for Ganga RiverVolume IV-3, Feasibility Study for Allahabad City, Part I, Sewerage Scheme
2-17
Therefore the existing pumping capacity is sufficient for 2030. Inadequacies of the Existing System
• The extended pump shafts are coupled with each other to provide the drives from the motor to pump, which often go out of alignment and develop vibration in the pump house. While starting of the pumps and during normal full load operation abnormal vibrations develop which results in shaft failure.
• Due to floatings entering in the pump, they develop excessive vibration and heavy torque at the start and results in shaft failure.
• The existing screens have clear openings of 37mm against 20mm is required. Rehabilitation / Upgradation Proposed
• Replace the two sets of existing bar screens with two sets of Mechanical Bar screen with 20 mm clear distance; conveyor belt shall be provided for both bar screens. The wet sump is full of floating material, which rushes to the suction of the pumps.
• Replacement of 5 no. pumps and motors of same capacity including accessories. • Auto tripping arrangement. • Automation of the pumping station is not considered as per the staffing pattern in India. • Accurate alignment tools are required to minimize the vibration thus ensuring smooth
operation of the pumps. Since, shaft diameter is purely based on the recommendations of the manufacturer and alignment is only solution. Strengthening of bearing housing with the structure is required to be increased to counter heavy thrust. Ultrasonic meter are required for proper alignment.
• Since the power is provided from UPPCL sub station, and sub stations are provided power from two sources; hence the 2nd feeder is not proposed.
• Providing of additional sump capacity 370 m3 • DG sets should be operated under power failure. In case they are not operated, the sewer gets
surcharged and sewers back flows, causing insanitation thereby settlement takes place in the System, which chokes the sewerage system.
• The capacity of the pumps is adequate but electro mechanical equipment has out lived its useful life hence needs replacement.
• Replacement of electrical system, HT panels, motor starters etc. • Renovation and repair of buildings etc.
Rehabilitation Cost The total cost for rehabilitation of Gaughat SPS is Rs. 28.1 million, civil cost is Rs. 3.6 million and E&M cost is Rs. 24.5 million.
Table 2.10 Rehabilitation Cost of Gaughat Pumping Station
Amount (Rs. thousand)
Civil 3,600 E & M 24,500 Total 28,100
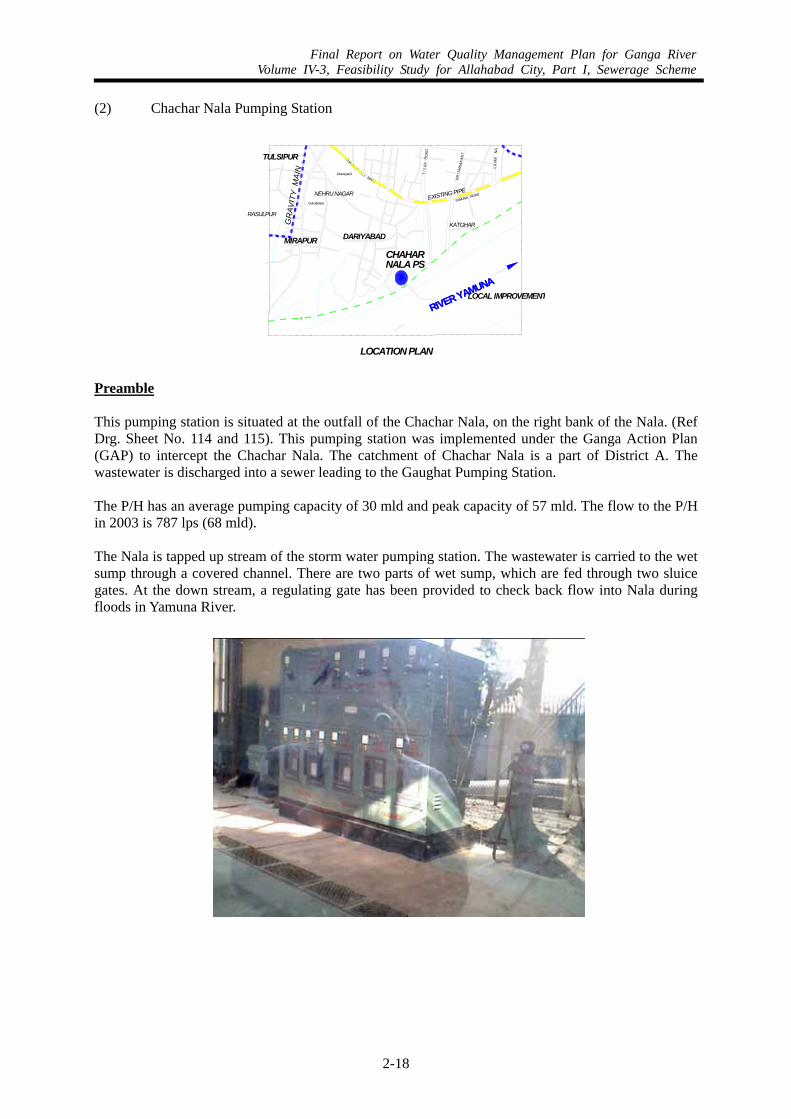
Final Report on Water Quality Management Plan for Ganga RiverVolume IV-3, Feasibility Study for Allahabad City, Part I, Sewerage Scheme
2-18
(2) Chachar Nala Pumping Station
SHAUKATAL I MARG
YAMUNA ROAD
TI L
AK
RO
AD
Gurudwara
RIVER YAMUNA
RIVER YAMUNA
Graveyard
EXISTING PIPE
CHAHAR NALA PS
LOCAL IMPROVEMENTG
RAV
ITY
MAI
N
LOCATION PLAN
DARIYABADMIRAPUR
RASULPUR
KATGHAR
NEHRU NAGAR
TULSIPUR
LAXM
IN
A
KRIS
HN
AK
ANT
Preamble
This pumping station is situated at the outfall of the Chachar Nala, on the right bank of the Nala. (Ref Drg. Sheet No. 114 and 115). This pumping station was implemented under the Ganga Action Plan (GAP) to intercept the Chachar Nala. The catchment of Chachar Nala is a part of District A. The wastewater is discharged into a sewer leading to the Gaughat Pumping Station. The P/H has an average pumping capacity of 30 mld and peak capacity of 57 mld. The flow to the P/H in 2003 is 787 lps (68 mld). The Nala is tapped up stream of the storm water pumping station. The wastewater is carried to the wet sump through a covered channel. There are two parts of wet sump, which are fed through two sluice gates. At the down stream, a regulating gate has been provided to check back flow into Nala during floods in Yamuna River.
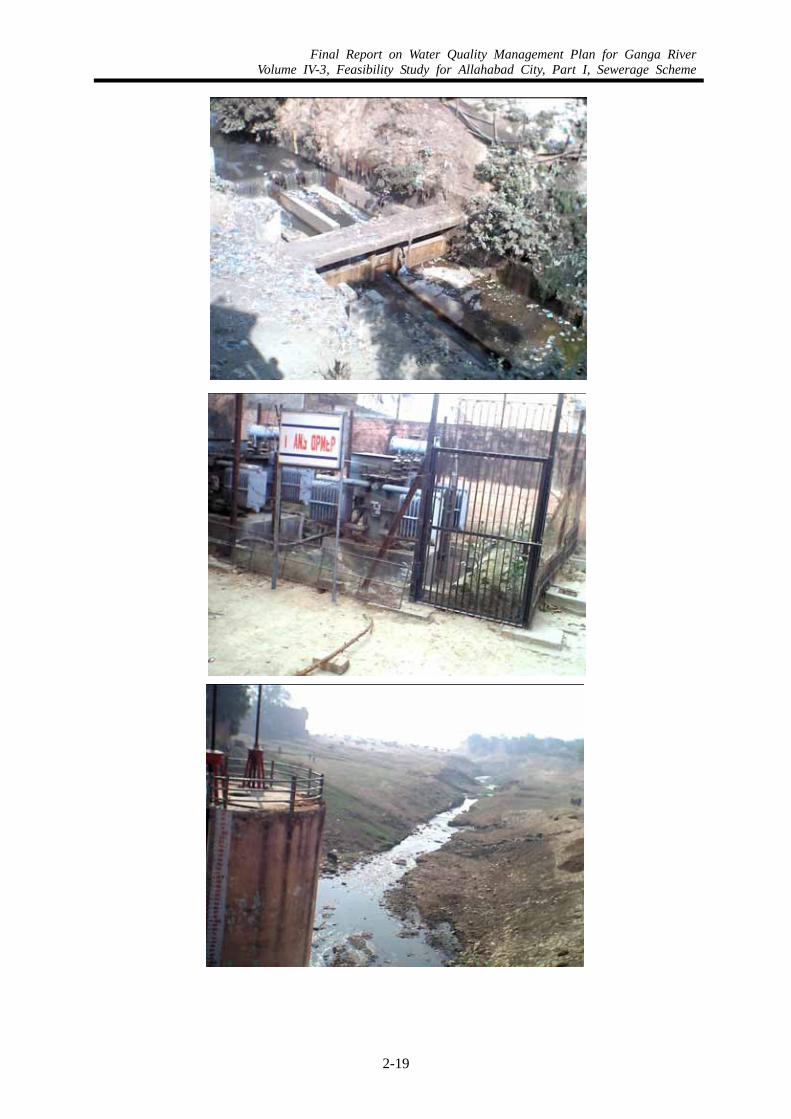
Final Report on Water Quality Management Plan for Ganga RiverVolume IV-3, Feasibility Study for Allahabad City, Part I, Sewerage Scheme
2-19
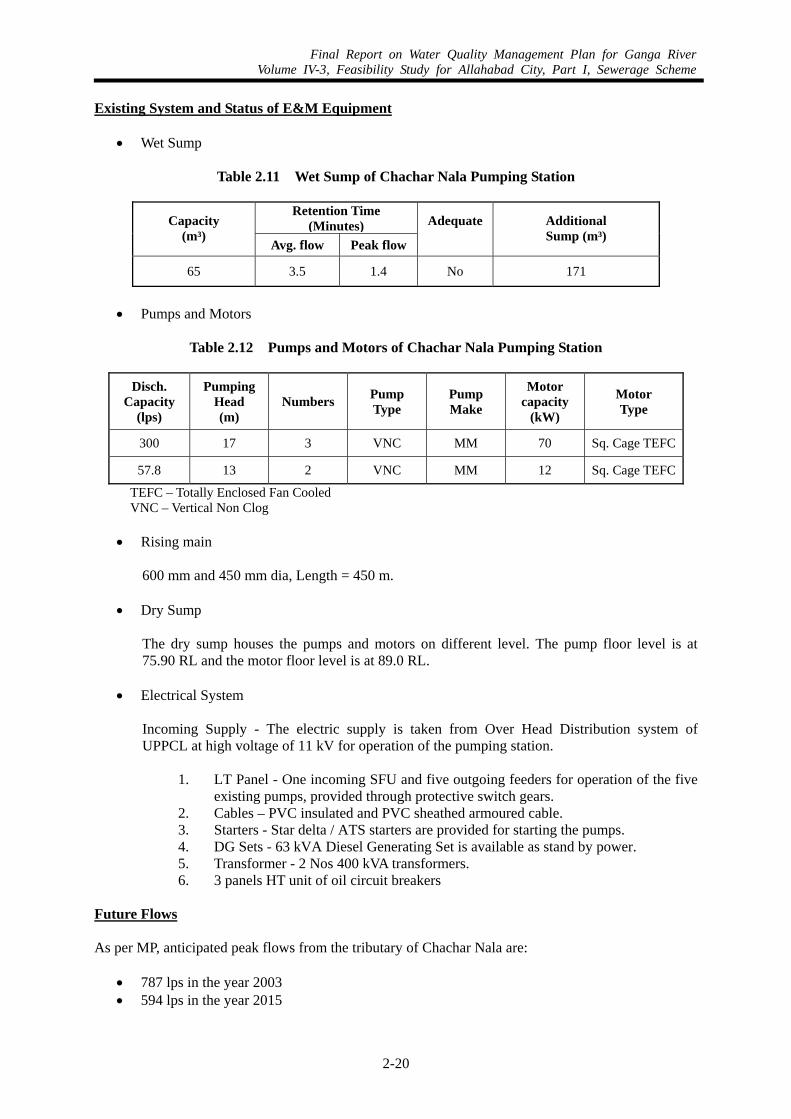
Final Report on Water Quality Management Plan for Ganga RiverVolume IV-3, Feasibility Study for Allahabad City, Part I, Sewerage Scheme
2-20
Existing System and Status of E&M Equipment
• Wet Sump
Table 2.11 Wet Sump of Chachar Nala Pumping Station
Retention Time (Minutes)Capacity
(m³) Avg. flow Peak flow
Adequate Additional Sump (m³)
65 3.5 1.4 No 171
• Pumps and Motors
Table 2.12 Pumps and Motors of Chachar Nala Pumping Station
Disch. Capacity
(lps)
Pumping Head (m)
Numbers Pump Type
Pump Make
Motor capacity
(kW)
Motor Type
300 17 3 VNC MM 70 Sq. Cage TEFC
57.8 13 2 VNC MM 12 Sq. Cage TEFC
TEFC – Totally Enclosed Fan Cooled VNC – Vertical Non Clog
• Rising main
600 mm and 450 mm dia, Length = 450 m.
• Dry Sump
The dry sump houses the pumps and motors on different level. The pump floor level is at 75.90 RL and the motor floor level is at 89.0 RL.
• Electrical System
Incoming Supply - The electric supply is taken from Over Head Distribution system of UPPCL at high voltage of 11 kV for operation of the pumping station.
1. LT Panel - One incoming SFU and five outgoing feeders for operation of the five
existing pumps, provided through protective switch gears. 2. Cables – PVC insulated and PVC sheathed armoured cable. 3. Starters - Star delta / ATS starters are provided for starting the pumps. 4. DG Sets - 63 kVA Diesel Generating Set is available as stand by power. 5. Transformer - 2 Nos 400 kVA transformers. 6. 3 panels HT unit of oil circuit breakers
Future Flows As per MP, anticipated peak flows from the tributary of Chachar Nala are:
• 787 lps in the year 2003 • 594 lps in the year 2015
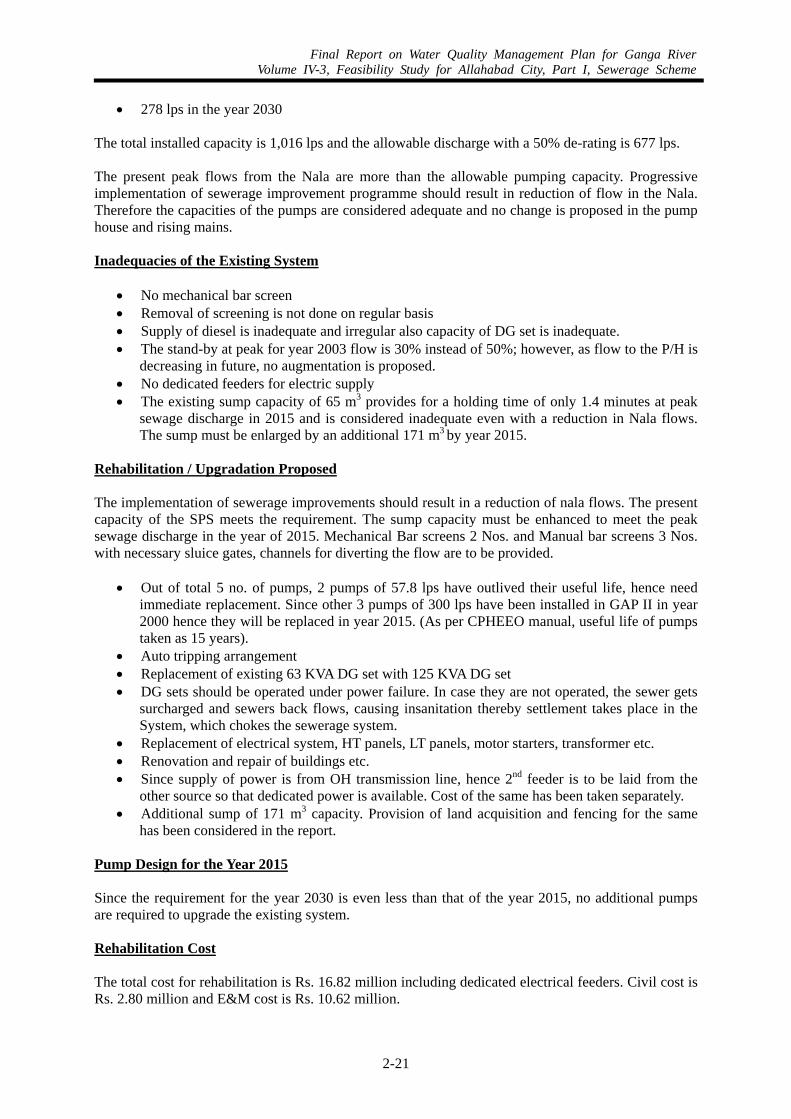
Final Report on Water Quality Management Plan for Ganga RiverVolume IV-3, Feasibility Study for Allahabad City, Part I, Sewerage Scheme
2-21
• 278 lps in the year 2030 The total installed capacity is 1,016 lps and the allowable discharge with a 50% de-rating is 677 lps. The present peak flows from the Nala are more than the allowable pumping capacity. Progressive implementation of sewerage improvement programme should result in reduction of flow in the Nala. Therefore the capacities of the pumps are considered adequate and no change is proposed in the pump house and rising mains. Inadequacies of the Existing System
• No mechanical bar screen • Removal of screening is not done on regular basis • Supply of diesel is inadequate and irregular also capacity of DG set is inadequate. • The stand-by at peak for year 2003 flow is 30% instead of 50%; however, as flow to the P/H is
decreasing in future, no augmentation is proposed. • No dedicated feeders for electric supply • The existing sump capacity of 65 m3 provides for a holding time of only 1.4 minutes at peak
sewage discharge in 2015 and is considered inadequate even with a reduction in Nala flows. The sump must be enlarged by an additional 171 m3 by year 2015.
Rehabilitation / Upgradation Proposed The implementation of sewerage improvements should result in a reduction of nala flows. The present capacity of the SPS meets the requirement. The sump capacity must be enhanced to meet the peak sewage discharge in the year of 2015. Mechanical Bar screens 2 Nos. and Manual bar screens 3 Nos. with necessary sluice gates, channels for diverting the flow are to be provided.
• Out of total 5 no. of pumps, 2 pumps of 57.8 lps have outlived their useful life, hence need immediate replacement. Since other 3 pumps of 300 lps have been installed in GAP II in year 2000 hence they will be replaced in year 2015. (As per CPHEEO manual, useful life of pumps taken as 15 years).
• Auto tripping arrangement • Replacement of existing 63 KVA DG set with 125 KVA DG set • DG sets should be operated under power failure. In case they are not operated, the sewer gets
surcharged and sewers back flows, causing insanitation thereby settlement takes place in the System, which chokes the sewerage system.
• Replacement of electrical system, HT panels, LT panels, motor starters, transformer etc. • Renovation and repair of buildings etc. • Since supply of power is from OH transmission line, hence 2nd feeder is to be laid from the
other source so that dedicated power is available. Cost of the same has been taken separately. • Additional sump of 171 m3 capacity. Provision of land acquisition and fencing for the same
has been considered in the report. Pump Design for the Year 2015 Since the requirement for the year 2030 is even less than that of the year 2015, no additional pumps are required to upgrade the existing system. Rehabilitation Cost The total cost for rehabilitation is Rs. 16.82 million including dedicated electrical feeders. Civil cost is Rs. 2.80 million and E&M cost is Rs. 10.62 million.
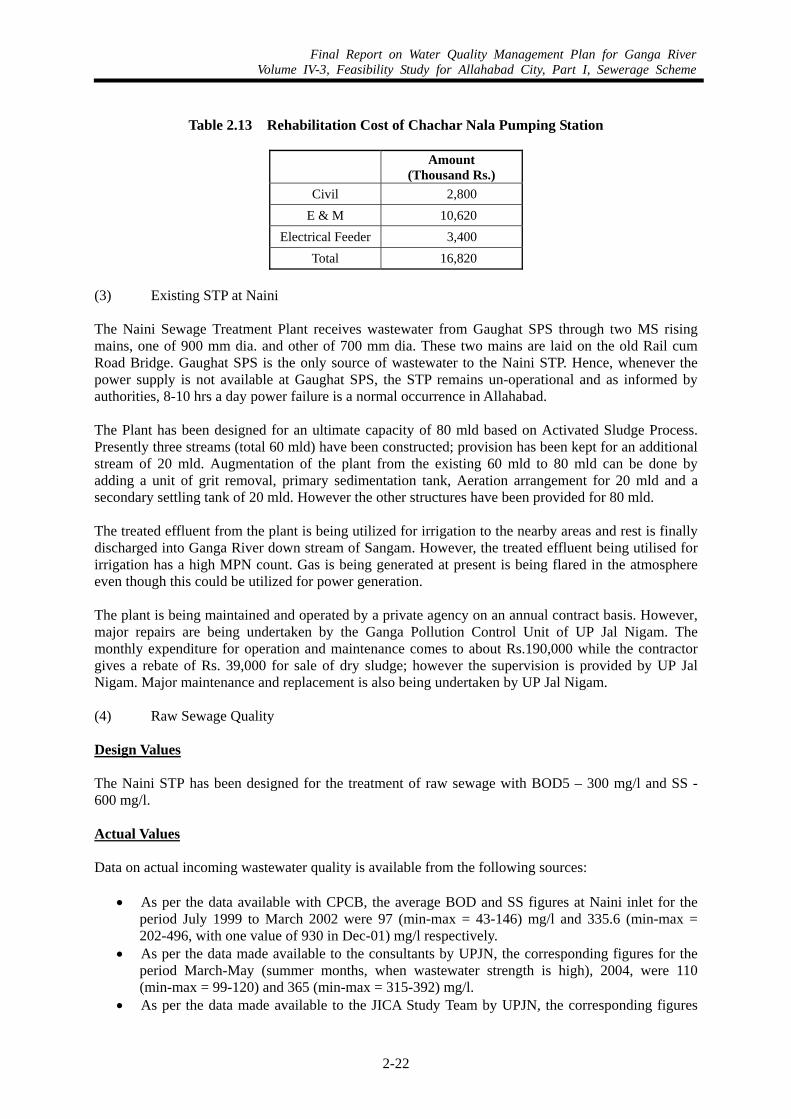
Final Report on Water Quality Management Plan for Ganga RiverVolume IV-3, Feasibility Study for Allahabad City, Part I, Sewerage Scheme
2-22
Table 2.13 Rehabilitation Cost of Chachar Nala Pumping Station
Amount (Thousand Rs.)
Civil 2,800 E & M 10,620
Electrical Feeder 3,400 Total 16,820
(3) Existing STP at Naini The Naini Sewage Treatment Plant receives wastewater from Gaughat SPS through two MS rising mains, one of 900 mm dia. and other of 700 mm dia. These two mains are laid on the old Rail cum Road Bridge. Gaughat SPS is the only source of wastewater to the Naini STP. Hence, whenever the power supply is not available at Gaughat SPS, the STP remains un-operational and as informed by authorities, 8-10 hrs a day power failure is a normal occurrence in Allahabad. The Plant has been designed for an ultimate capacity of 80 mld based on Activated Sludge Process. Presently three streams (total 60 mld) have been constructed; provision has been kept for an additional stream of 20 mld. Augmentation of the plant from the existing 60 mld to 80 mld can be done by adding a unit of grit removal, primary sedimentation tank, Aeration arrangement for 20 mld and a secondary settling tank of 20 mld. However the other structures have been provided for 80 mld. The treated effluent from the plant is being utilized for irrigation to the nearby areas and rest is finally discharged into Ganga River down stream of Sangam. However, the treated effluent being utilised for irrigation has a high MPN count. Gas is being generated at present is being flared in the atmosphere even though this could be utilized for power generation. The plant is being maintained and operated by a private agency on an annual contract basis. However, major repairs are being undertaken by the Ganga Pollution Control Unit of UP Jal Nigam. The monthly expenditure for operation and maintenance comes to about Rs.190,000 while the contractor gives a rebate of Rs. 39,000 for sale of dry sludge; however the supervision is provided by UP Jal Nigam. Major maintenance and replacement is also being undertaken by UP Jal Nigam. (4) Raw Sewage Quality Design Values The Naini STP has been designed for the treatment of raw sewage with BOD5 – 300 mg/l and SS - 600 mg/l. Actual Values Data on actual incoming wastewater quality is available from the following sources:
• As per the data available with CPCB, the average BOD and SS figures at Naini inlet for the period July 1999 to March 2002 were 97 (min-max = 43-146) mg/l and 335.6 (min-max = 202-496, with one value of 930 in Dec-01) mg/l respectively.
• As per the data made available to the consultants by UPJN, the corresponding figures for the period March-May (summer months, when wastewater strength is high), 2004, were 110 (min-max = 99-120) and 365 (min-max = 315-392) mg/l.
• As per the data made available to the JICA Study Team by UPJN, the corresponding figures
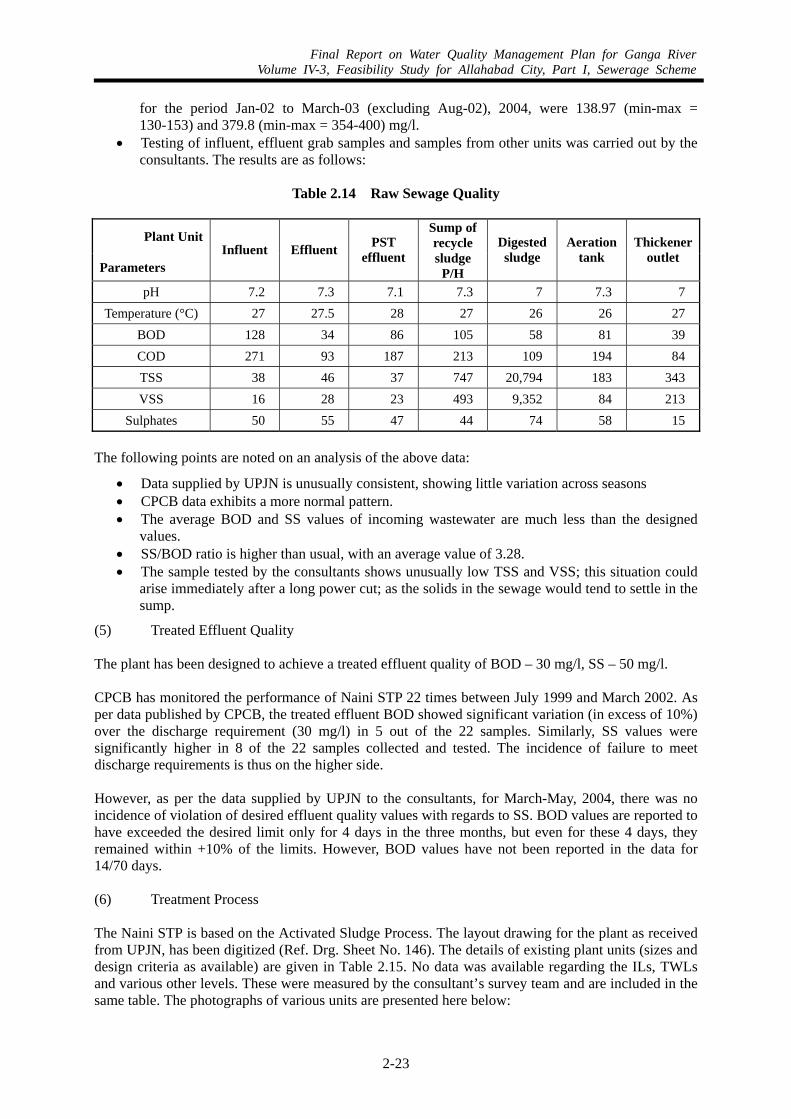
Final Report on Water Quality Management Plan for Ganga RiverVolume IV-3, Feasibility Study for Allahabad City, Part I, Sewerage Scheme
2-23
for the period Jan-02 to March-03 (excluding Aug-02), 2004, were 138.97 (min-max = 130-153) and 379.8 (min-max = 354-400) mg/l.
• Testing of influent, effluent grab samples and samples from other units was carried out by the consultants. The results are as follows:
Table 2.14 Raw Sewage Quality
Plant Unit
Parameters Influent Effluent PST
effluent
Sump of recycle sludge
P/H
Digested sludge
Aeration tank
Thickener outlet
pH 7.2 7.3 7.1 7.3 7 7.3 7 Temperature (°C) 27 27.5 28 27 26 26 27
BOD 128 34 86 105 58 81 39 COD 271 93 187 213 109 194 84 TSS 38 46 37 747 20,794 183 343 VSS 16 28 23 493 9,352 84 213
Sulphates 50 55 47 44 74 58 15 The following points are noted on an analysis of the above data:
• Data supplied by UPJN is unusually consistent, showing little variation across seasons • CPCB data exhibits a more normal pattern. • The average BOD and SS values of incoming wastewater are much less than the designed
values. • SS/BOD ratio is higher than usual, with an average value of 3.28. • The sample tested by the consultants shows unusually low TSS and VSS; this situation could
arise immediately after a long power cut; as the solids in the sewage would tend to settle in the sump.
(5) Treated Effluent Quality
The plant has been designed to achieve a treated effluent quality of BOD – 30 mg/l, SS – 50 mg/l. CPCB has monitored the performance of Naini STP 22 times between July 1999 and March 2002. As per data published by CPCB, the treated effluent BOD showed significant variation (in excess of 10%) over the discharge requirement (30 mg/l) in 5 out of the 22 samples. Similarly, SS values were significantly higher in 8 of the 22 samples collected and tested. The incidence of failure to meet discharge requirements is thus on the higher side. However, as per the data supplied by UPJN to the consultants, for March-May, 2004, there was no incidence of violation of desired effluent quality values with regards to SS. BOD values are reported to have exceeded the desired limit only for 4 days in the three months, but even for these 4 days, they remained within +10% of the limits. However, BOD values have not been reported in the data for 14/70 days. (6) Treatment Process The Naini STP is based on the Activated Sludge Process. The layout drawing for the plant as received from UPJN, has been digitized (Ref. Drg. Sheet No. 146). The details of existing plant units (sizes and design criteria as available) are given in Table 2.15. No data was available regarding the ILs, TWLs and various other levels. These were measured by the consultant’s survey team and are included in the same table. The photographs of various units are presented here below:
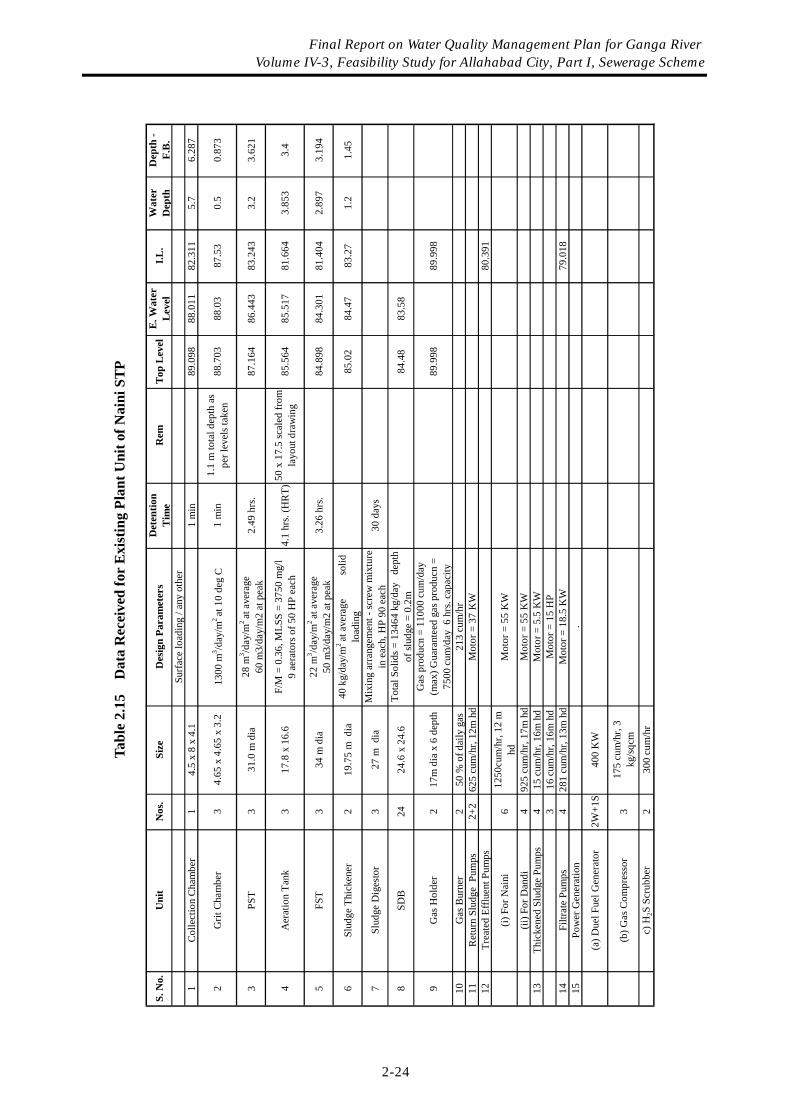
Ta
ble
2.15
D
ata
Rec
eive
d fo
r E
xist
ing
Plan
t Uni
t of N
aini
STP
S. N
o.U
nit
Nos
.Si
zeD
esig
n Pa
ram
eter
sD
eten
tion
Tim
eR
emT
op L
evel
E. W
ater
Lev
elI.L
.W
ater
Dep
thD
epth
-F.
B.
Surf
ace
load
ing
/ any
oth
er1
Col
lect
ion
Cha
mbe
r1
4.5
x 8
x 4.
11
min
89.0
9888
.011
82.3
115.
76.
287
2G
rit C
ham
ber
34.
65 x
4.6
5 x
3.2
1300
m3 /d
ay/m
2 at
10
deg
C1
min
1.1
m to
tal d
epth
as
per l
evel
s tak
en88
.703
88.0
387
.53
0.5
0.87
3
3PS
T3
31.0
m d
ia28
m3 /d
ay/m
2 at
ave
rage
60 m
3/da
y/m
2 at
pea
k2.
49 h
rs.
87.1
6486
.443
83.2
433.
23.
621
4A
erat
ion
Tank
317
.8 x
16.
6F/
M =
0.3
6, M
LSS
= 37
50 m
g/l
9 ae
rato
rs o
f 50
HP
each
4.1
hrs.
(HR
T)50
x 1
7.5
scal
ed fr
omla
yout
dra
win
g85
.564
85.5
1781
.664
3.85
33.
4
5FS
T3
34 m
dia
22 m
3 /day
/m2
at a
vera
ge50
m3/
day/
m2
at p
eak
3.26
hrs
.84
.898
84.3
0181
.404
2.89
73.
194
6Sl
udge
Thi
cken
er2
19.7
5 m
dia
40 k
g/da
y/m
2 at
ave
rage
so
lidlo
adin
g85
.02
84.4
783
.27
1.2
1.45
7Sl
udge
Dig
esto
r3
27 m
dia
Mix
ing
arra
ngem
ent -
scre
w m
ixtu
rein
eac
h, H
P 90
eac
h30
day
s
8SD
B24
24.6
x 2
4.6
Tota
l Sol
ids =
134
64 k
g/da
y d
epth
of sl
udge
= 0
.2m
84.4
883
.58
9G
as H
olde
r2
17m
dia
x 6
dep
thG
as p
rodu
cn =
110
00 c
um/d
ay(m
ax) G
uara
ntee
d ga
s pro
ducn
=75
00 c
um/d
ay 6
hrs
. cap
acity
89.9
9889
.998
10G
as B
urne
r2
50 %
of d
aily
gas
213
cum
/hr
11R
etur
n Sl
udge
Pum
ps2+
262
5 cu
m/h
r, 12
m h
dM
otor
= 3
7 K
W12
Trea
ted
Efflu
ent P
umps
80.3
91
(i) F
or N
aini
612
50cu
m/h
r, 12
mhd
Mot
or =
55
KW
(ii) F
or D
andi
492
5 cu
m/h
r, 17
m h
dM
otor
= 5
5 K
W13
Thic
kene
d Sl
udge
Pum
ps4
15 c
um/h
r, 16
m h
dM
otor
= 5
.5 K
W3
16 c
um/h
r, 16
m h
dM
otor
= 1
5 H
P14
Filtr
ate
Pum
ps4
281
cum
/hr,
13m
hd
Mot
or =
18.
5 K
W79
.018
15Po
wer
Gen
erat
ion
.
(a) D
uel F
uel G
ener
ator
2W+1
S40
0 K
W
(b) G
as C
ompr
esso
r3
175
cum
/hr,
3kg
/sqc
mc)
H2S
Scr
ubbe
r2
300
cum
/hr
Final Report on Water Quality Management Plan for Ganga River Volume IV-3, Feasibility Study for Allahabad City, Part I, Sewerage Scheme
2-24
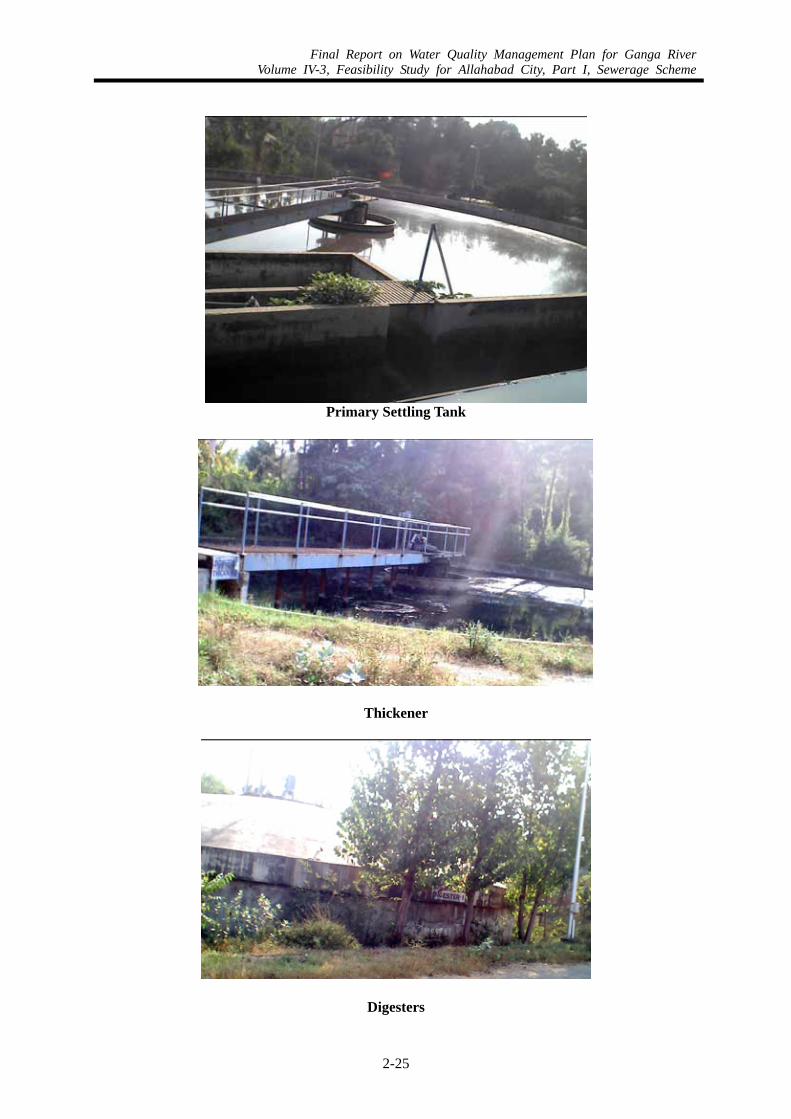
Final Report on Water Quality Management Plan for Ganga RiverVolume IV-3, Feasibility Study for Allahabad City, Part I, Sewerage Scheme
2-25
Primary Settling Tank
Thickener
Digesters
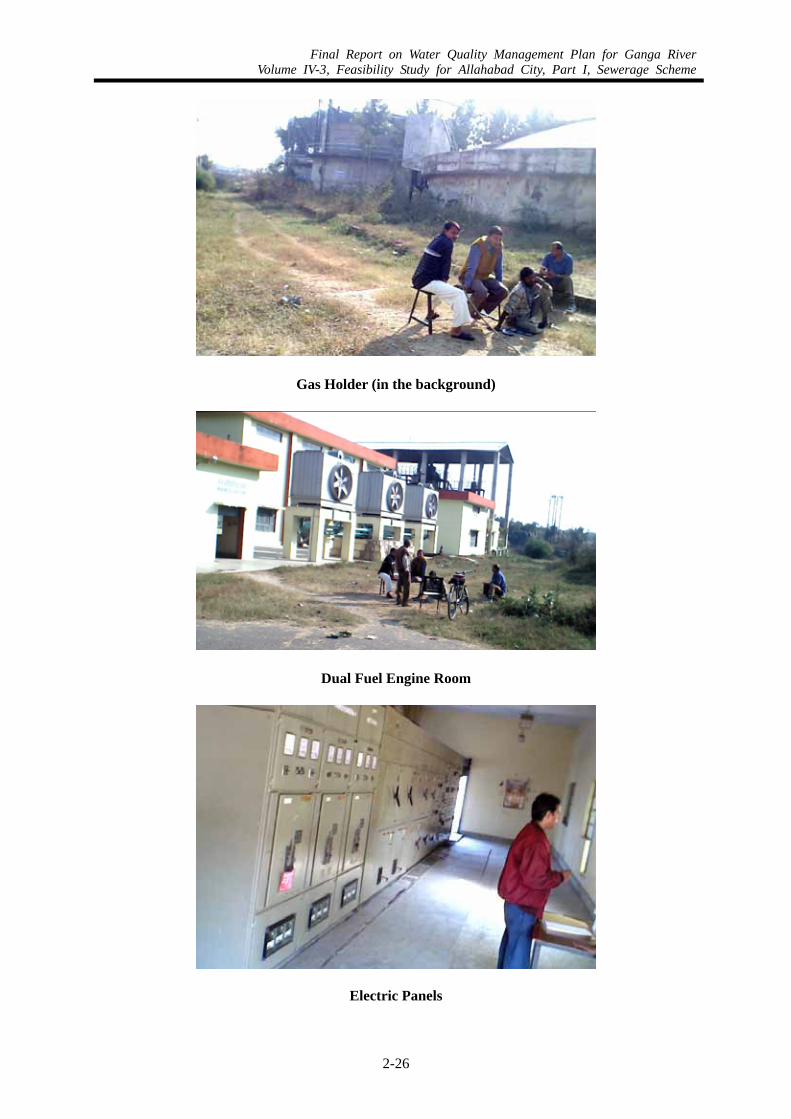
Final Report on Water Quality Management Plan for Ganga RiverVolume IV-3, Feasibility Study for Allahabad City, Part I, Sewerage Scheme
2-26
Gas Holder (in the background)
Dual Fuel Engine Room
Electric Panels
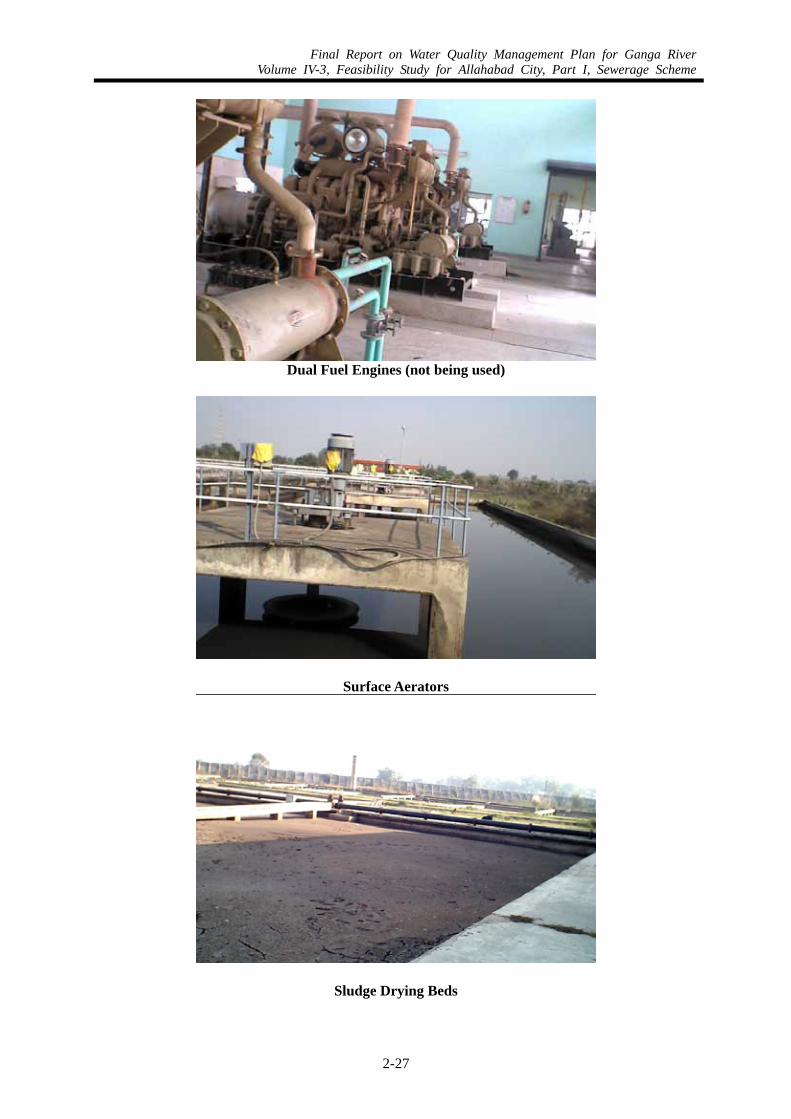
Final Report on Water Quality Management Plan for Ganga RiverVolume IV-3, Feasibility Study for Allahabad City, Part I, Sewerage Scheme
2-27
Dual Fuel Engines (not being used)
Surface Aerators
Sludge Drying Beds
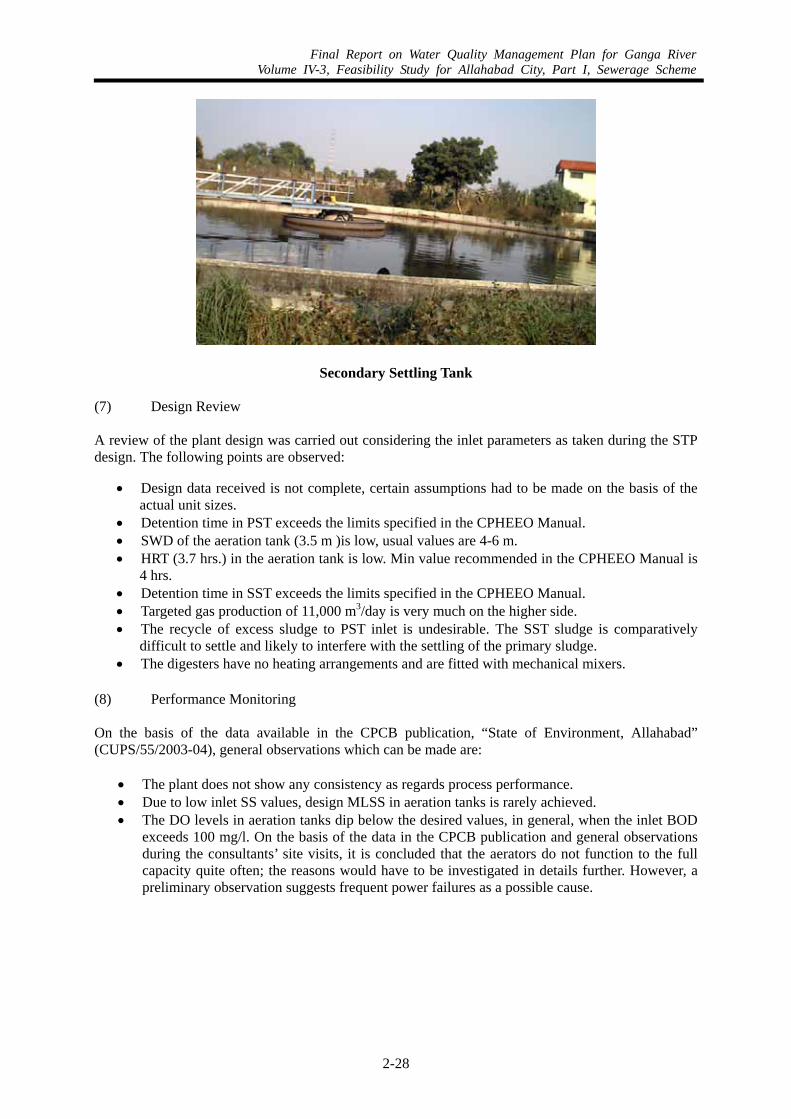
Final Report on Water Quality Management Plan for Ganga RiverVolume IV-3, Feasibility Study for Allahabad City, Part I, Sewerage Scheme
2-28
Secondary Settling Tank
(7) Design Review A review of the plant design was carried out considering the inlet parameters as taken during the STP design. The following points are observed:
• Design data received is not complete, certain assumptions had to be made on the basis of the actual unit sizes.
• Detention time in PST exceeds the limits specified in the CPHEEO Manual. • SWD of the aeration tank (3.5 m )is low, usual values are 4-6 m. • HRT (3.7 hrs.) in the aeration tank is low. Min value recommended in the CPHEEO Manual is
4 hrs. • Detention time in SST exceeds the limits specified in the CPHEEO Manual. • Targeted gas production of 11,000 m3/day is very much on the higher side. • The recycle of excess sludge to PST inlet is undesirable. The SST sludge is comparatively
difficult to settle and likely to interfere with the settling of the primary sludge. • The digesters have no heating arrangements and are fitted with mechanical mixers.
(8) Performance Monitoring On the basis of the data available in the CPCB publication, “State of Environment, Allahabad” (CUPS/55/2003-04), general observations which can be made are:
• The plant does not show any consistency as regards process performance. • Due to low inlet SS values, design MLSS in aeration tanks is rarely achieved. • The DO levels in aeration tanks dip below the desired values, in general, when the inlet BOD
exceeds 100 mg/l. On the basis of the data in the CPCB publication and general observations during the consultants’ site visits, it is concluded that the aerators do not function to the full capacity quite often; the reasons would have to be investigated in details further. However, a preliminary observation suggests frequent power failures as a possible cause.
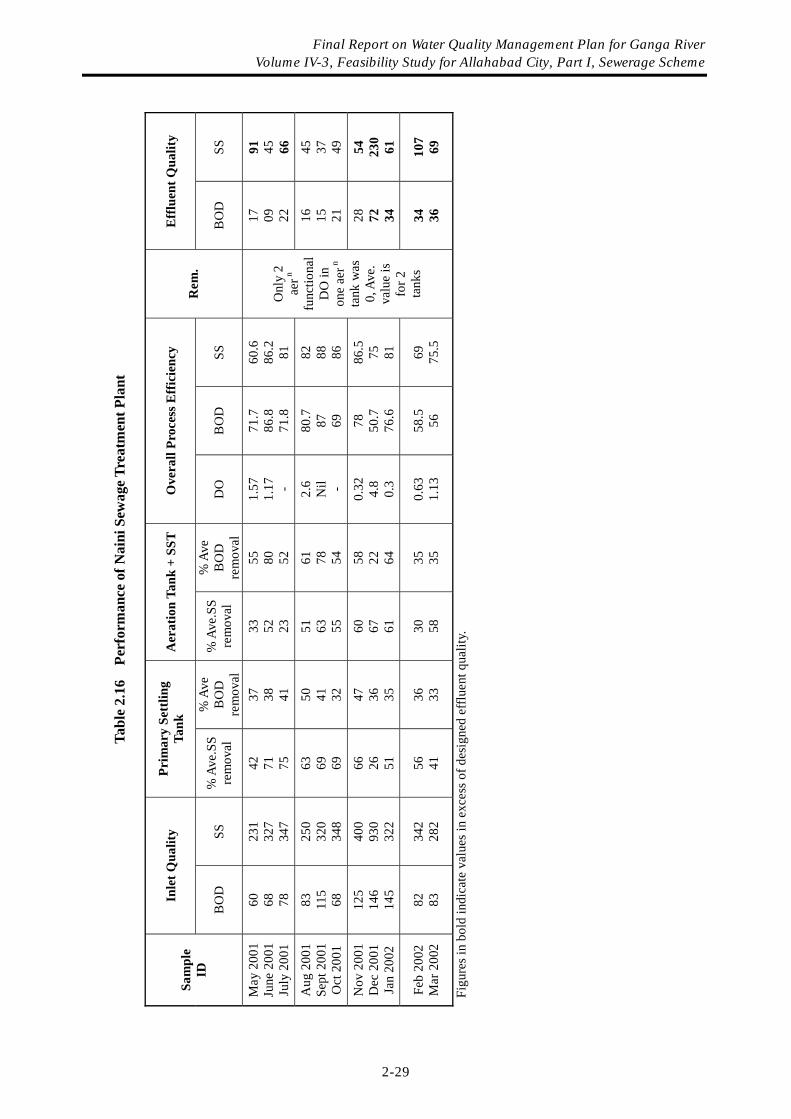
Ta
ble
2.16
Pe
rfor
man
ce o
f Nai
ni S
ewag
e Tr
eatm
ent P
lant
Inle
t Qua
lity
Prim
ary
Sett
ling
Tank
A
erat
ion
Tank
+ S
ST
Ove
rall
Proc
ess E
ffic
ienc
y E
fflu
ent Q
ualit
y
Sam
ple
ID
BO
D
SS
% A
ve.S
S re
mov
al
% A
ve
BO
D
rem
oval
% A
ve.S
S re
mov
al
% A
ve
BO
D
rem
oval
D
O
BO
D
SS
Rem
.
BO
D
SS
May
200
1 Ju
ne 2
001
July
200
1
60
68
78
231
327
347
42
71
75
37
38
41
33
52
23
55
80
52
1.57
1.
17
-
71.7
86
.8
71.8
60.6
86
.2
81
17
09
22
91
45
66
Aug
200
1 Se
pt 2
001
Oct
200
1
83
115
68
250
320
348
63
69
69
50
41
32
51
63
55
61
78
54
2.6
Nil -
80.7
87
69
82
88
86
16
15
21
45
37
49
Nov
200
1 D
ec 2
001
Jan
2002
125
146
145
400
930
322
66
26
51
47
36
35
60
67
61
58
22
64
0.32
4.
8 0.
3
78
50.7
76
.6
86.5
75
81
28
72
34
54
230
61
Feb
2002
M
ar 2
002
82
83
342
282
56
41
36
33
30
58
35
35
0.63
1.
13
58.5
56
69
75
.5
Onl
y 2
aer n
func
tiona
l D
O in
on
e ae
r n
tank
was
0,
Ave
. va
lue
is
for 2
ta
nks
34
36
107
69
Figu
res i
n bo
ld in
dica
te v
alue
s in
exce
ss o
f des
igne
d ef
fluen
t qua
lity.
Final Report on Water Quality Management Plan for Ganga River Volume IV-3, Feasibility Study for Allahabad City, Part I, Sewerage Scheme
2-29
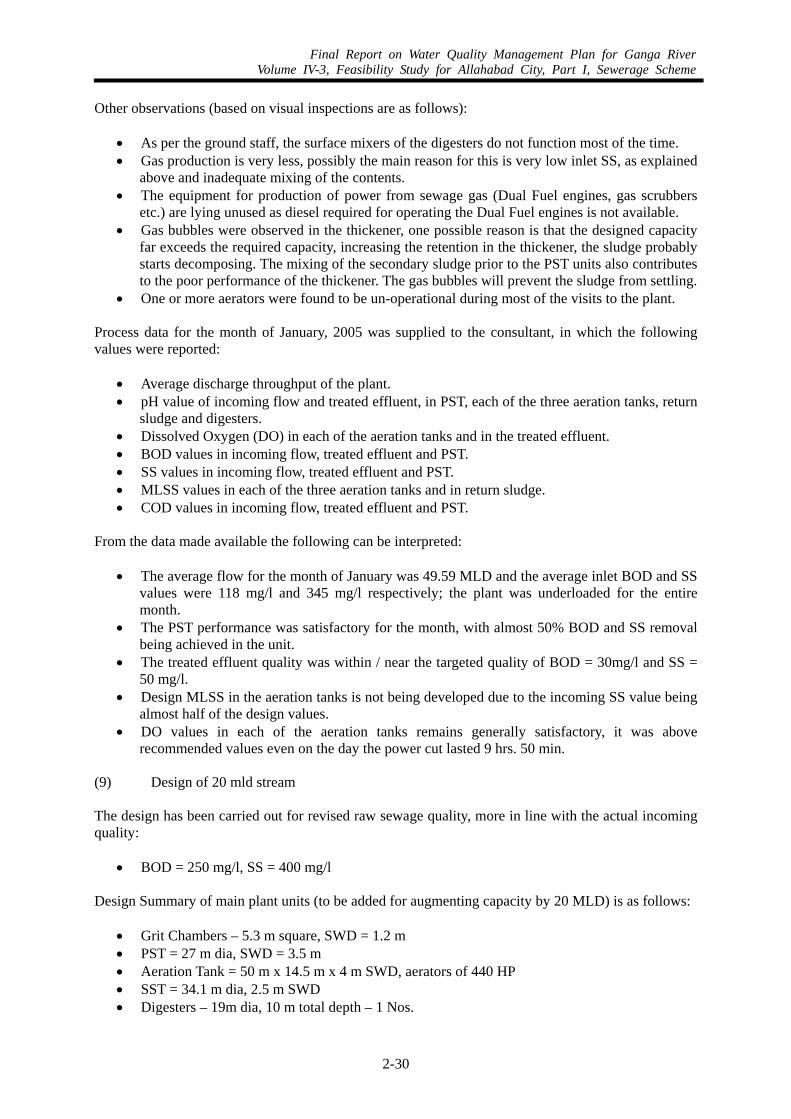
Final Report on Water Quality Management Plan for Ganga RiverVolume IV-3, Feasibility Study for Allahabad City, Part I, Sewerage Scheme
2-30
Other observations (based on visual inspections are as follows):
• As per the ground staff, the surface mixers of the digesters do not function most of the time. • Gas production is very less, possibly the main reason for this is very low inlet SS, as explained
above and inadequate mixing of the contents. • The equipment for production of power from sewage gas (Dual Fuel engines, gas scrubbers
etc.) are lying unused as diesel required for operating the Dual Fuel engines is not available. • Gas bubbles were observed in the thickener, one possible reason is that the designed capacity
far exceeds the required capacity, increasing the retention in the thickener, the sludge probably starts decomposing. The mixing of the secondary sludge prior to the PST units also contributes to the poor performance of the thickener. The gas bubbles will prevent the sludge from settling.
• One or more aerators were found to be un-operational during most of the visits to the plant.
Process data for the month of January, 2005 was supplied to the consultant, in which the following values were reported:
• Average discharge throughput of the plant. • pH value of incoming flow and treated effluent, in PST, each of the three aeration tanks, return
sludge and digesters. • Dissolved Oxygen (DO) in each of the aeration tanks and in the treated effluent. • BOD values in incoming flow, treated effluent and PST. • SS values in incoming flow, treated effluent and PST. • MLSS values in each of the three aeration tanks and in return sludge. • COD values in incoming flow, treated effluent and PST.
From the data made available the following can be interpreted:
• The average flow for the month of January was 49.59 MLD and the average inlet BOD and SS values were 118 mg/l and 345 mg/l respectively; the plant was underloaded for the entire month.
• The PST performance was satisfactory for the month, with almost 50% BOD and SS removal being achieved in the unit.
• The treated effluent quality was within / near the targeted quality of BOD = 30mg/l and SS = 50 mg/l.
• Design MLSS in the aeration tanks is not being developed due to the incoming SS value being almost half of the design values.
• DO values in each of the aeration tanks remains generally satisfactory, it was above recommended values even on the day the power cut lasted 9 hrs. 50 min.
(9) Design of 20 mld stream
The design has been carried out for revised raw sewage quality, more in line with the actual incoming quality:
• BOD = 250 mg/l, SS = 400 mg/l
Design Summary of main plant units (to be added for augmenting capacity by 20 MLD) is as follows:
• Grit Chambers – 5.3 m square, SWD = 1.2 m • PST = 27 m dia, SWD = 3.5 m • Aeration Tank = 50 m x 14.5 m x 4 m SWD, aerators of 440 HP • SST = 34.1 m dia, 2.5 m SWD • Digesters – 19m dia, 10 m total depth – 1 Nos.
Final Report on Water Quality Management Plan for Ganga RiverVolume IV-3, Feasibility Study for Allahabad City, Part I, Sewerage Scheme
2-31
• Sludge Drying Beds – 24.6m x 24.6m, 6 nos.
(10) Augmentation / Rehabilitation Measures
Apart from the construction of units as listed in the preceding section, the following measures are recommended:
• Disposal of excess sludge directly to the digesters • Providing Gas Engines for power production (cost considered in the report) • Providing heating arrangements and gas mixing in the digesters (cost not considered in the
report) • Providing Chlorination facilities for 80 mld capacity.
(11) Augmentation Cost
Table 2.17 Augmentation Cost of Naini STP
Amount (Thousand Rs.)
Total 151,630
2.3 Proposed Sewer- Gravity and Rising Mains 2.3.1 Proposed System The new facilities proposed for this district are:
• Construction of new trunk sewers – 4.01 km. • No new SPS is proposed • 20 mld stream is to be added to existing Naini STP
2.3.2 Proposed Gravity Sewers As part of Master Plan recommendations, certain routes and flows for proposed trunk sewers (gravity and rising mains) have been defined for each district. Summary of these is presented in Table 2.18 and in the key plan of proposed sewers for District A. Details of these gravity sewers are given below in brief: (1) Alignment Details Pipe line 1A & 2A (node 4-5-7) (Ref. Sheet No. 6-9) General The gravity trunk sewer starts from Roshan Bagh area (node 4) and is to be laid along GT road. The pipe line routes through Nakhas Kohna, Sarai Mir Khan, Jauhritola, Bahadur ganj areas and finally ends at the intersection of Lauder road (node 7), where it discharges into an existing sewer, ultimately flowing towards Gaughat Raw Sewage Pumping Station. Constraints There are existing sewers on both sides of the road. GT road is of RCC construction and it would be
Final Report on Water Quality Management Plan for Ganga RiverVolume IV-3, Feasibility Study for Allahabad City, Part I, Sewerage Scheme
2-32
very difficult to cut the road and lay the sewer through the middle of the road. Hence alignment of sewer has been proposed along the road parallel to the existing sewer. Moreover, the proposed sewer has to discharge to the existing sewer at Lauder road flowing towards Gaughat Raw Sewage Pumping Station. Invert level of the existing sewer at connection point is 81.335 m; hence sewer has been designed accordingly. Hydraulic Design The sewer has been designed for a maximum peak flow of 158 lps from Roshan Bagh area (node 4) up to node 5 near Banerjee road at MH 24. Designed diameter of the pipe is 500 mm and designed slope is 1 in 300. For node 5 to node 7, maximum peak flow in the sewer is 370 lps. Diameter of the pipe is 700 mm and slope is 1 in 300. Detailed SEWERCAD data output and analysis has been given in Appendix A2.1. Depth of Sewer Detailed description of sewer and manholes has been given in Appendix A 2.2 and 2.3.
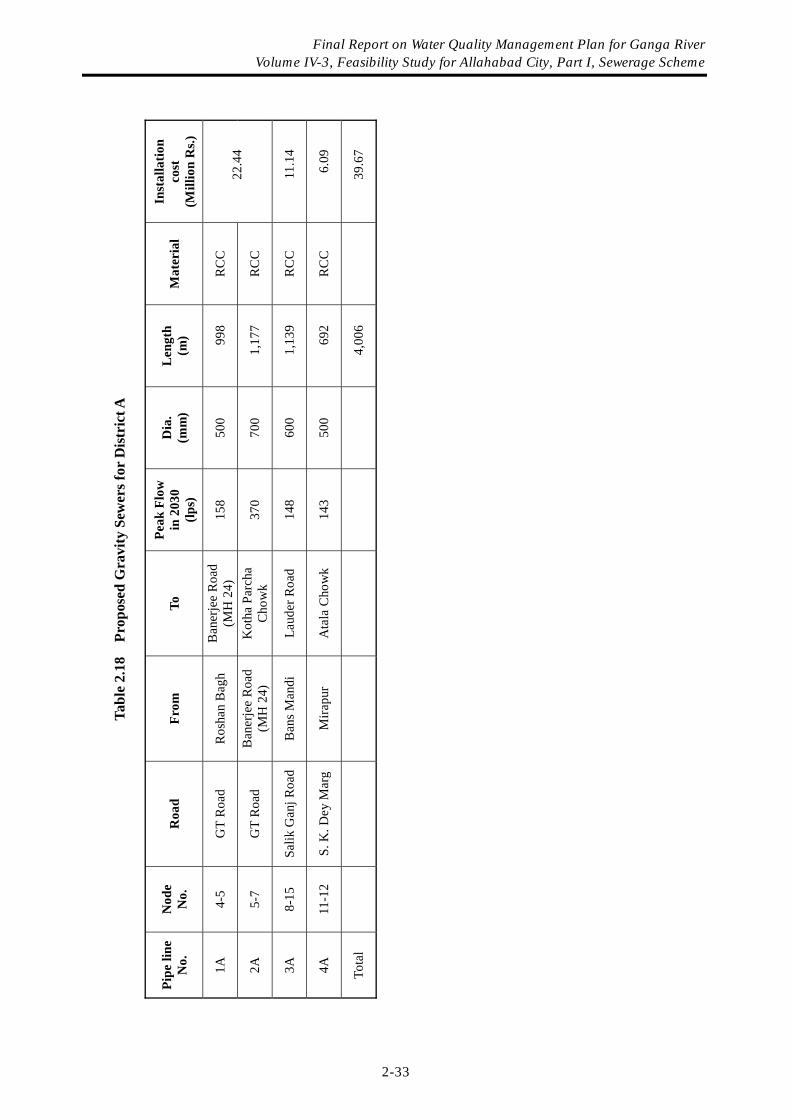
Ta
ble
2.18
Pr
opos
ed G
ravi
ty S
ewer
s for
Dis
tric
t A
Pipe
line
N
o.
Nod
e N
o.
Roa
d Fr
om
To
Peak
Flo
w
in 2
030
(lps)
Dia
. (m
m)
Len
gth
(m
) M
ater
ial
Inst
alla
tion
cost
(M
illio
n R
s.)
1A
4-5
GT
Roa
d R
osha
n B
agh
Ban
erje
e R
oad
(MH
24)
15
8 50
0 99
8 R
CC
2A
5-7
GT
Roa
d B
aner
jee
Roa
d (M
H 2
4)
Kot
ha P
arch
a C
how
k 37
0 70
0 1,
177
RC
C
22.4
4
3A
8-15
Sa
lik G
anj R
oad
Ban
s Man
di
Laud
er R
oad
148
600
1,13
9 R
CC
11
.14
4A
11-1
2 S.
K. D
ey M
arg
Mira
pur
Ata
la C
how
k 14
3 50
0 69
2 R
CC
6
.09
Tota
l
4,
006
39
.67
Final Report on Water Quality Management Plan for Ganga River Volume IV-3, Feasibility Study for Allahabad City, Part I, Sewerage Scheme
2-33
Final Report on Water Quality Management Plan for Ganga RiverVolume IV-3, Feasibility Study for Allahabad City, Part I, Sewerage Scheme
2-34
Pipe line 3A (node 8-15) (Ref. Sheet No.10-11) General The gravity trunk sewer starts from Malviya Nagar area (node 8) and is to be laid along Salik Ganj road. The pipe line routes through Timber Market, intersection of Krishna Kant road, Mutthi ganj areas and finally ends at the intersection of Lauder road (node 15) near Gaughat sewage pumping station. Constraints There is existing sewer on one side of the road up to Tilak road and hence, the new pipe cannot be laid on this side. Hence, sewer has been proposed on other side of the road in this reach. Total length of this portion is approx. 350 m. After Tilak road there is an existing sewer on one side of the road and there is no space on other side hence sewer alignment has been proposed through the middle of the road for a length of approx. 250 m. (ch. 600 m). After that alignment has been proposed on one side of the road as there is an existing sewer on other side. Moreover, the proposed sewer has to discharge to existing sewer at Lauder road towards Gaughat Raw Sewage Pumping Station. Invert level of the sump is 79.2 m, hence sewer has been designed accordingly. Hydraulic Design The sewer has been designed for a peak flow of 148 lps. Designed diameter of the pipe is 600 mm and designed slope is 1 in 600. Detailed SEWERCAD data output and analysis has been given in Appendix A 2.4. Depth of Sewer Detailed description of sewer and manholes has been given in Appendix A 2.5 and 2.6. Pipe line 4A (node 11-12) (Ref. Sheet No. 12-13) General As per MP recommendations, the gravity trunk sewer has to start from Fish Market near Mirapur area (node 11) and is to be laid along S K Dey Marg. After alignment survey of this pipe line, it was found that from chainage 122 m up to 600 m, ground level goes down steeply by about 2.5 m. This sewer is to finally discharge into an existing sewer at node 12 at Shaukat Ali Marg; invert level of this existing sewer is high at the connection point. As a consequence, gravity sewer would not be possible and an additional Pumping Station would be required. Therefore, it has been proposed that the trunk sewer will start from chainage 600 m onwards from Mirapur chowk and up to Shaukat Ali Marg. The pipe line routes through Nehru Nagar and Tulsipur areas along S K Dey Marg and finally ends at the intersection of Saukat Ali Marg (node 12). Constraints There are two existing drains on both sides of the road. Hence, the sewer has been routed between the drain and the road.

Final Report on Water Quality Management Plan for Ganga RiverVolume IV-3, Feasibility Study for Allahabad City, Part I, Sewerage Scheme
2-35
The proposed sewer has to discharge into the existing sewer laid along Nurullah road and flowing towards Gaughat Raw Sewage Pumping Station, near Gol Park Atala. Invert level of the existing manhole is 84.631 m, hence sewer has been designed accordingly. Hydraulic Design The sewer has been designed for a peak flow of 143 lps. Designed diameter of the pipe is 500 mm and designed slope is 1 in 400. Detailed SEWERCAD data output and analysis has been given in Appendix A 2.7. Depth of Sewer Detailed description of sewer and manholes has been given in Appendix A 2.8 and 2.9. (2) Crossings Details of road /nala crossings and railway crossing culverts are given in Table 2.19.
Table 2.19 Details of Road/Nala Crossing
Nala Crossing Road Crossing (Ordinary)
Road Crossing by Trench less
Railway Crossing/ Culvert
No. of
Man-holes No.
Total length
(m) No.
Total length
(m)No. Total
length No. Total length
(m) GT Road (1A & 2A) 52 - - 12 91 8 112 1 8
Salik Ganj Road (3A) 34 1 3.5 1 6 3 46 - -
S K Dey Marg (4A) 18 - - 5 45 2 25 - -
(3) Material The trunk sewers shall be RCC pipes of NP3 class made with Sulphate Resisting Cement. Since most of the pipe stretches are along the main road, NP3 pipe has been proposed. For the stretches where the pipe crosses the road and trench less construction is proposed, RCC NP4 pipe has been chosen. (4) Bedding Two types of bedding have been mainly used for all proposed trunk sewers in District A. Trunk sewers up to depth 5 m have been proposed with type “C” bedding i.e. Reinforced Cement Concrete bedding with 0.4% steel (RCCB), and trunk sewers up to 9 m depth have been provided with type “D” bedding i.e. Reinforced Concrete Arch (RCA) with 1% steel at top and granular material at bottom.
CHAPTER 3
PROVISIONS OF DISTRICT D
Final Report on Water Quality Management Plan for Ganga RiverVolume IV-3, Feasibility Study for Allahabad City, Part I, Sewerage Scheme
3-1
CHAPTER 3 PROVISIONS OF DISTRICT D 3.1 INTRODUCTION 3.1.1 General Sewerage District D is the rapidly growing zone of the city; the existing sewerage system in this area is relatively new. It is bound on the northern side by Ganga River and on the eastern side by Yamuna River. The total length of existing trunk sewers in the district is 9.27 km, with sizes ranging from 0.3 m diameter to 1.1 m x 1.3 m. Except for some small stretches of total length 2.62 km, where concrete sewers have been laid, all other sewers are brick sewers. The district includes five existing pumping stations. Four of these have been configured to pump the collected wastewater and tapped Nala flows, to the fifth SPS i.e. Alopibagh SPS. The Alopibagh SPS in turn discharges into the Gaughat SPS, which lies in the sewerage District A. 3.1.2 Population The present and estimated future population in Master Plan for District D is as follows:
Table 3.1 Population of District D
Year Population
within Municipal Area
Population outside
Municipal Area
Floating Population Total
2003 271,311 - 3,501 274,812
2015 359,533 - 4,916 364,449
2030 495,161 - 7,253 502,414
3.1.3 Present and Future Wastewater Flows The flows as given in the Master Plan, are reproduced in Table 3.2.
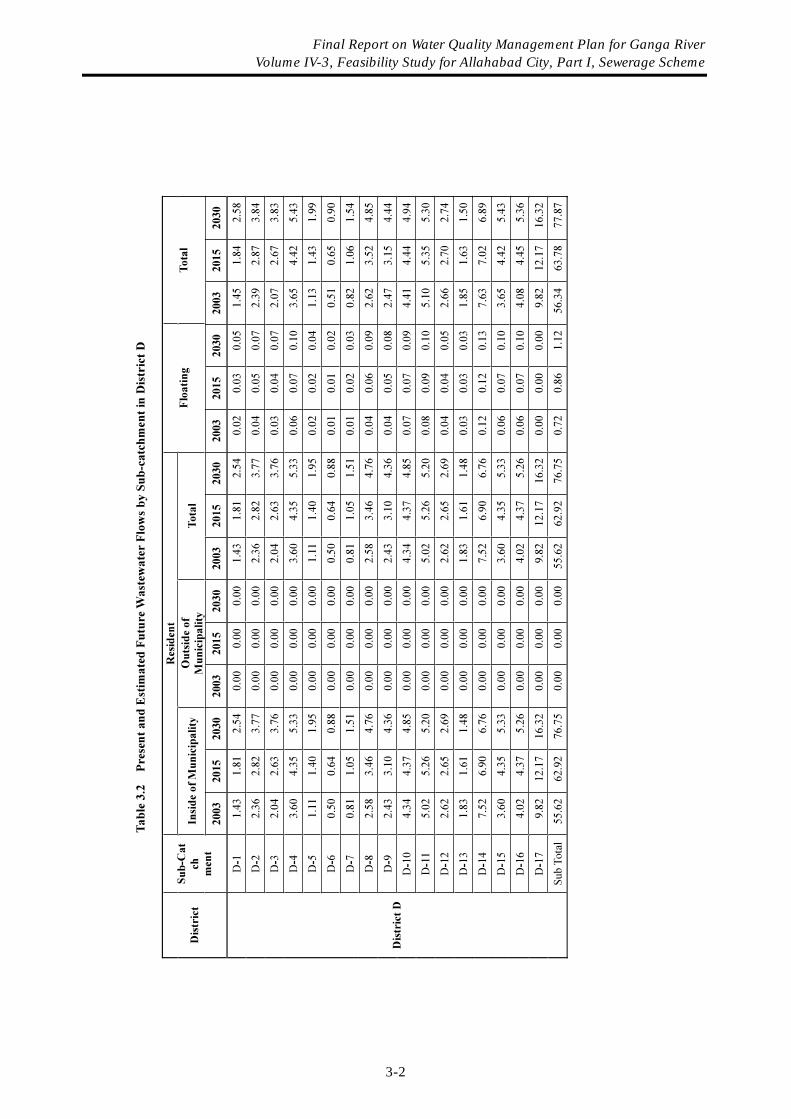
Final Report on Water Quality Management Plan for Ganga River Volume IV-3, Feasibility Study for Allahabad City, Part I, Sewerage Scheme
3-2
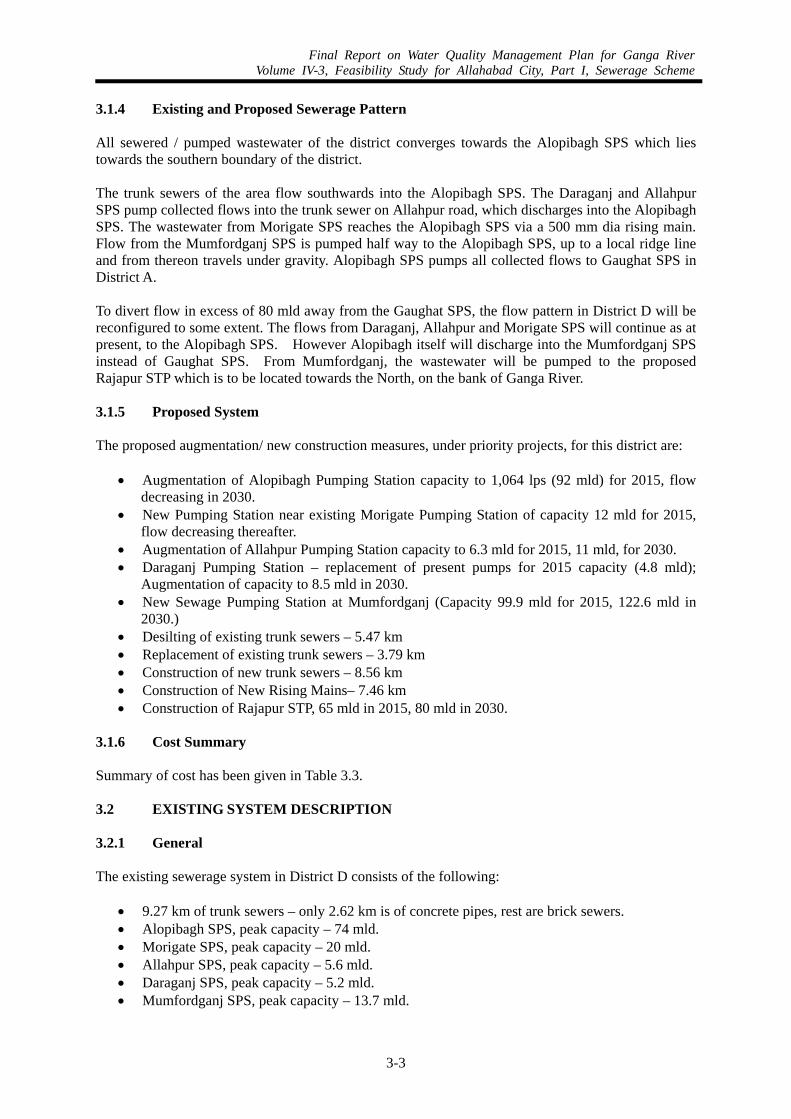
Final Report on Water Quality Management Plan for Ganga RiverVolume IV-3, Feasibility Study for Allahabad City, Part I, Sewerage Scheme
3-3
3.1.4 Existing and Proposed Sewerage Pattern All sewered / pumped wastewater of the district converges towards the Alopibagh SPS which lies towards the southern boundary of the district. The trunk sewers of the area flow southwards into the Alopibagh SPS. The Daraganj and Allahpur SPS pump collected flows into the trunk sewer on Allahpur road, which discharges into the Alopibagh SPS. The wastewater from Morigate SPS reaches the Alopibagh SPS via a 500 mm dia rising main. Flow from the Mumfordganj SPS is pumped half way to the Alopibagh SPS, up to a local ridge line and from thereon travels under gravity. Alopibagh SPS pumps all collected flows to Gaughat SPS in District A. To divert flow in excess of 80 mld away from the Gaughat SPS, the flow pattern in District D will be reconfigured to some extent. The flows from Daraganj, Allahpur and Morigate SPS will continue as at present, to the Alopibagh SPS. However Alopibagh itself will discharge into the Mumfordganj SPS instead of Gaughat SPS. From Mumfordganj, the wastewater will be pumped to the proposed Rajapur STP which is to be located towards the North, on the bank of Ganga River.
3.1.5 Proposed System The proposed augmentation/ new construction measures, under priority projects, for this district are:
• Augmentation of Alopibagh Pumping Station capacity to 1,064 lps (92 mld) for 2015, flow decreasing in 2030.
• New Pumping Station near existing Morigate Pumping Station of capacity 12 mld for 2015, flow decreasing thereafter.
• Augmentation of Allahpur Pumping Station capacity to 6.3 mld for 2015, 11 mld, for 2030. • Daraganj Pumping Station – replacement of present pumps for 2015 capacity (4.8 mld);
Augmentation of capacity to 8.5 mld in 2030. • New Sewage Pumping Station at Mumfordganj (Capacity 99.9 mld for 2015, 122.6 mld in
2030.) • Desilting of existing trunk sewers – 5.47 km • Replacement of existing trunk sewers – 3.79 km • Construction of new trunk sewers – 8.56 km • Construction of New Rising Mains– 7.46 km • Construction of Rajapur STP, 65 mld in 2015, 80 mld in 2030.
3.1.6 Cost Summary Summary of cost has been given in Table 3.3. 3.2 EXISTING SYSTEM DESCRIPTION 3.2.1 General The existing sewerage system in District D consists of the following:
• 9.27 km of trunk sewers – only 2.62 km is of concrete pipes, rest are brick sewers. • Alopibagh SPS, peak capacity – 74 mld. • Morigate SPS, peak capacity – 20 mld. • Allahpur SPS, peak capacity – 5.6 mld. • Daraganj SPS, peak capacity – 5.2 mld. • Mumfordganj SPS, peak capacity – 13.7 mld.
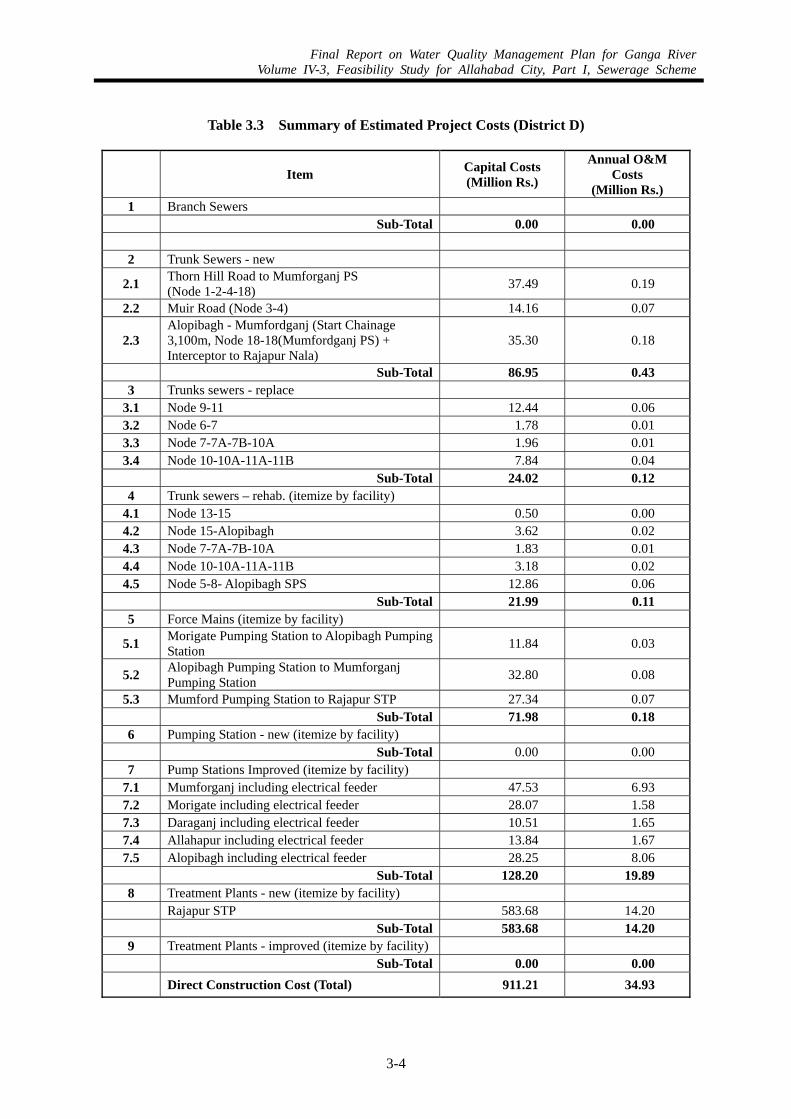
Final Report on Water Quality Management Plan for Ganga RiverVolume IV-3, Feasibility Study for Allahabad City, Part I, Sewerage Scheme
3-4
Table 3.3 Summary of Estimated Project Costs (District D)
Item Capital Costs (Million Rs.)
Annual O&M Costs
(Million Rs.) 1 Branch Sewers Sub-Total 0.00 0.00
2 Trunk Sewers - new
2.1 Thorn Hill Road to Mumforganj PS (Node 1-2-4-18) 37.49 0.19
2.2 Muir Road (Node 3-4) 14.16 0.07
2.3 Alopibagh - Mumfordganj (Start Chainage 3,100m, Node 18-18(Mumfordganj PS) + Interceptor to Rajapur Nala)
35.30 0.18
Sub-Total 86.95 0.43 3 Trunks sewers - replace
3.1 Node 9-11 12.44 0.06 3.2 Node 6-7 1.78 0.01 3.3 Node 7-7A-7B-10A 1.96 0.01 3.4 Node 10-10A-11A-11B 7.84 0.04
Sub-Total 24.02 0.12 4 Trunk sewers – rehab. (itemize by facility)
4.1 Node 13-15 0.50 0.00 4.2 Node 15-Alopibagh 3.62 0.02 4.3 Node 7-7A-7B-10A 1.83 0.01 4.4 Node 10-10A-11A-11B 3.18 0.02 4.5 Node 5-8- Alopibagh SPS 12.86 0.06
Sub-Total 21.99 0.11 5 Force Mains (itemize by facility)
5.1 Morigate Pumping Station to Alopibagh Pumping Station 11.84 0.03
5.2 Alopibagh Pumping Station to Mumforganj Pumping Station 32.80 0.08
5.3 Mumford Pumping Station to Rajapur STP 27.34 0.07 Sub-Total 71.98 0.18
6 Pumping Station - new (itemize by facility) Sub-Total 0.00 0.00
7 Pump Stations Improved (itemize by facility) 7.1 Mumforganj including electrical feeder 47.53 6.93 7.2 Morigate including electrical feeder 28.07 1.58 7.3 Daraganj including electrical feeder 10.51 1.65 7.4 Allahapur including electrical feeder 13.84 1.67 7.5 Alopibagh including electrical feeder 28.25 8.06
Sub-Total 128.20 19.89 8 Treatment Plants - new (itemize by facility) Rajapur STP 583.68 14.20 Sub-Total 583.68 14.20
9 Treatment Plants - improved (itemize by facility) Sub-Total 0.00 0.00 Direct Construction Cost (Total) 911.21 34.93
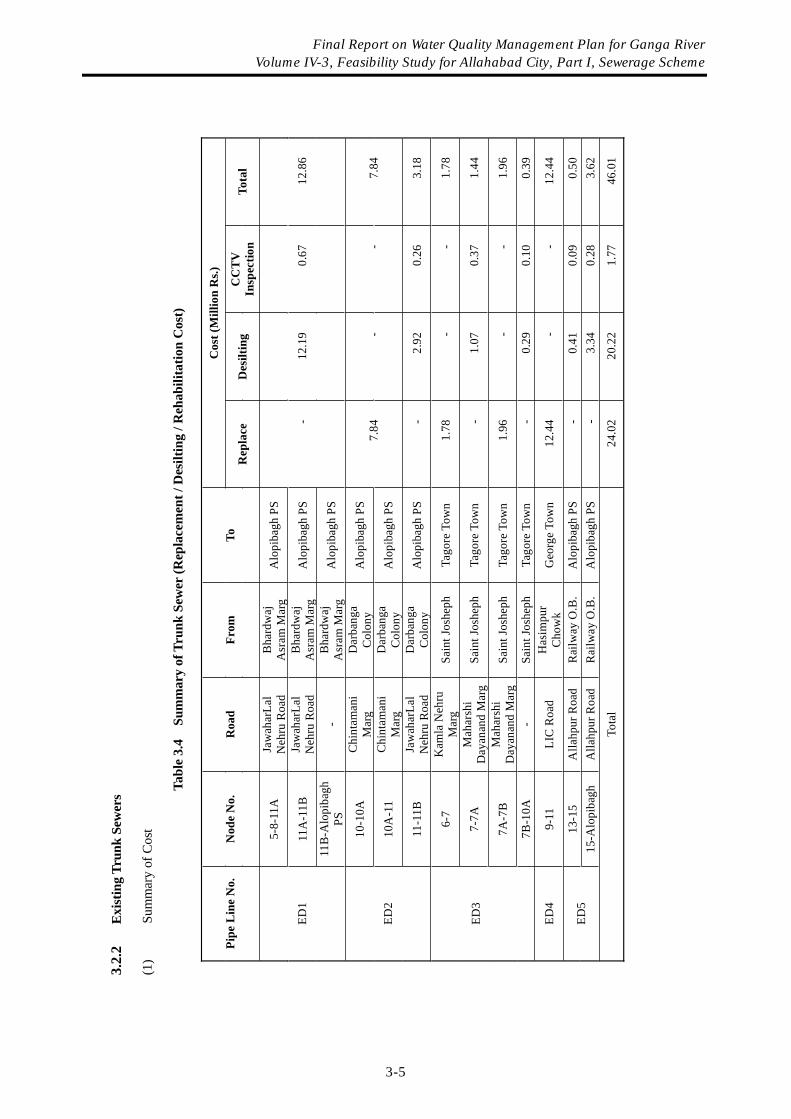
3.2.
2E
xist
ing
Trun
k Se
wer
s
(1)
Sum
mar
y of
Cos
t
Tabl
e 3.
4 S
umm
ary
of T
runk
Sew
er (R
epla
cem
ent /
Des
iltin
g / R
ehab
ilita
tion
Cos
t)
Cos
t (M
illio
n R
s.)
Pipe
Lin
e N
o.
Nod
e N
o.
Roa
d Fr
om
To
Rep
lace
D
esilt
ing
CC
TV
In
spec
tion
Tota
l
5-8-
11A
Ja
wah
arLa
l N
ehru
Roa
d B
hard
waj
A
sram
Mar
g A
lopi
bagh
PS
11A
-11B
Ja
wah
arLa
l N
ehru
Roa
d B
hard
waj
A
sram
Mar
g A
lopi
bagh
PS
ED1
11B
-Alo
piba
gh
PS-
Bha
rdw
aj
Asr
am M
arg
Alo
piba
gh P
S
- 12
.19
0.67
12
.86
10-1
0A
Chi
ntam
ani
Mar
g D
arba
nga
Col
ony
Alo
piba
gh P
S
10A
-11
Chi
ntam
ani
Mar
g D
arba
nga
Col
ony
Alo
piba
gh P
S 7.
84
- -
7.84
ED
2
11-1
1B
Jaw
ahar
Lal
Neh
ru R
oad
Dar
bang
a C
olon
y A
lopi
bagh
PS
- 2.
92
0.26
3.
18
6-7
Kam
la N
ehru
M
arg
Sain
t Jos
heph
Ta
gore
Tow
n 1.
78
- -
1.78
7-7A
M
ahar
shi
Day
anan
d M
arg
Sain
t Jos
heph
Ta
gore
Tow
n -
1.07
0.
37
1.44
7A-7
B
Mah
arsh
i D
ayan
and
Mar
gSa
int J
oshe
ph
Tago
re T
own
1.96
-
- 1.
96
ED3
7B-1
0A
- Sa
int J
oshe
ph
Tago
re T
own
- 0.
29
0.10
0.
39
ED4
9-11
LI
C R
oad
Has
impu
r C
how
k G
eorg
e To
wn
12.4
4 -
- 12
.44
13-1
5 A
llahp
ur R
oad
Rai
lway
O.B
. A
lopi
bagh
PS
- 0.
41
0.09
0.
50
ED5
15-A
lopi
bagh
A
llahp
ur R
oad
Rai
lway
O.B
. A
lopi
bagh
PS
- 3.
34
0.28
3.
62
Tota
l 24
.02
20.2
2 1.
77
46.0
1
Final Report on Water Quality Management Plan for Ganga River Volume IV-3, Feasibility Study for Allahabad City, Part I, Sewerage Scheme
3-5
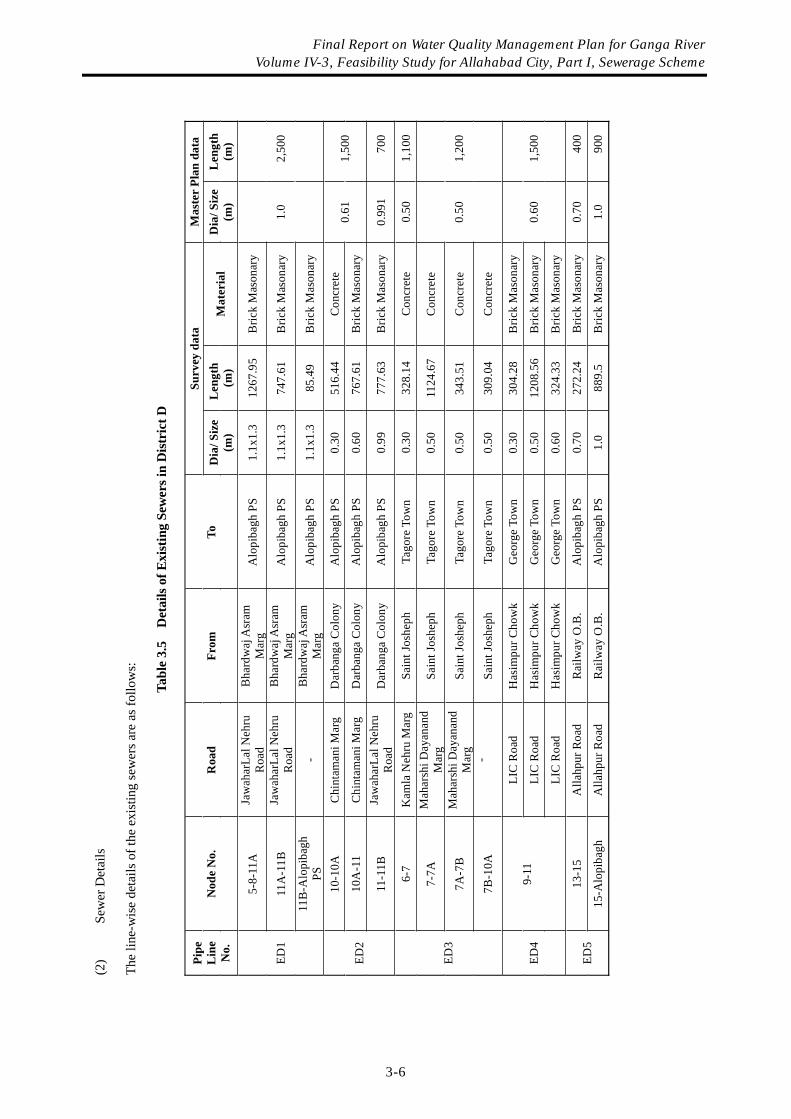
(2)
Sew
er D
etai
ls
The
line-
wis
e de
tails
of t
he e
xist
ing
sew
ers a
re a
s fol
low
s:
Tabl
e 3.
5 D
etai
ls o
f Exi
stin
g Se
wer
s in
Dis
tric
t D
Surv
ey d
ata
Mas
ter
Plan
dat
a Pi
peL
ine
No.
N
ode
No.
R
oad
From
To
D
ia/ S
ize
(m)
Len
gth
(m)
Mat
eria
l D
ia/ S
ize
(m)
Len
gth
(m)
5-8-
11A
Ja
wah
arLa
l Neh
ru
Roa
d B
hard
waj
Asr
am
Mar
g A
lopi
bagh
PS
1.1x
1.3
1267
.95
Bric
k M
ason
ary
11A
-11B
Ja
wah
arLa
l Neh
ru
Roa
d B
hard
waj
Asr
am
Mar
g A
lopi
bagh
PS
1.1x
1.3
747.
61
Bric
k M
ason
ary
ED1
11B
-Alo
piba
gh
PS-
Bha
rdw
aj A
sram
M
arg
Alo
piba
gh P
S 1.
1x1.
3 85
.49
Bric
k M
ason
ary
1.0
2,50
0
10-1
0A
Chi
ntam
ani M
arg
Dar
bang
a C
olon
y A
lopi
bagh
PS
0.30
51
6.44
C
oncr
ete
10A
-11
Chi
ntam
ani M
arg
Dar
bang
a C
olon
y A
lopi
bagh
PS
0.60
76
7.61
B
rick
Mas
onar
y 0.
61
1,50
0 ED
2
11-1
1B
Jaw
ahar
Lal N
ehru
R
oad
Dar
bang
a C
olon
y A
lopi
bagh
PS
0.99
77
7.63
B
rick
Mas
onar
y 0.
991
700
6-7
Kam
la N
ehru
Mar
gSa
int J
oshe
ph
Tago
re T
own
0.30
32
8.14
C
oncr
ete
0.50
1,
100
7-7A
M
ahar
shi D
ayan
and
Mar
g Sa
int J
oshe
ph
Tago
re T
own
0.50
11
24.6
7 C
oncr
ete
7A-7
B
Mah
arsh
i Day
anan
d M
arg
Sain
t Jos
heph
Ta
gore
Tow
n 0.
50
343.
51
Con
cret
e ED
3
7B-1
0A
-Sa
int J
oshe
ph
Tago
re T
own
0.50
30
9.04
C
oncr
ete
0.50
1,
200
LIC
Roa
d H
asim
pur C
how
k G
eorg
e To
wn
0.30
30
4.28
B
rick
Mas
onar
y
LIC
Roa
d H
asim
pur C
how
k G
eorg
e To
wn
0.50
12
08.5
6 B
rick
Mas
onar
y ED
49-
11
LIC
Roa
d H
asim
pur C
how
k G
eorg
e To
wn
0.60
32
4.33
B
rick
Mas
onar
y
0.60
1,
500
13-1
5 A
llahp
ur R
oad
Rai
lway
O.B
. A
lopi
bagh
PS
0.70
27
2.24
B
rick
Mas
onar
y 0.
70
400
ED5
15-A
lopi
bagh
A
llahp
ur R
oad
Rai
lway
O.B
. A
lopi
bagh
PS
1.0
889.
5 B
rick
Mas
onar
y 1.
0 90
0
Final Report on Water Quality Management Plan for Ganga River Volume IV-3, Feasibility Study for Allahabad City, Part I, Sewerage Scheme
3-6
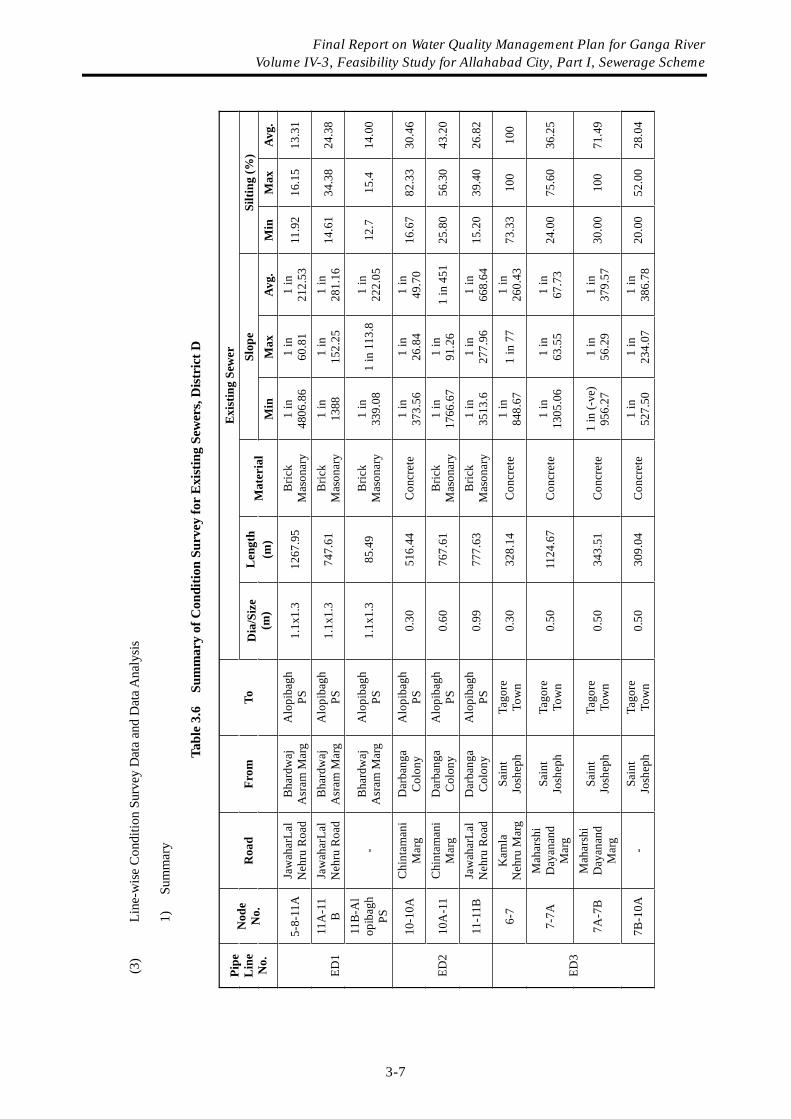
(3)
Line
-wis
e C
ondi
tion
Surv
ey D
ata
and
Dat
a Ana
lysi
s
1)
Sum
mar
y
Tabl
e 3.
6 S
umm
ary
of C
ondi
tion
Surv
ey fo
r E
xist
ing
Sew
ers,
Dis
tric
t D
Exi
stin
g Se
wer
Sl
ope
Silti
ng (%
) Pi
peL
ine
No.
Nod
e N
o.
Roa
d Fr
om
To
Dia
/Siz
e (m
)L
engt
h (m
)M
ater
ial
Min
M
ax
Avg
. M
in
Max
A
vg.
5-8-
11A
Jaw
ahar
Lal
Neh
ru R
oad
Bha
rdw
aj
Asr
am M
arg
Alo
piba
gh
PS1.
1x1.
3 12
67.9
5 B
rick
Mas
onar
y 1
in
4806
.86
1 in
60
.81
1 in
21
2.53
11
.92
16.1
513
.31
11A
-11
BJa
wah
arLa
l N
ehru
Roa
d B
hard
waj
A
sram
Mar
gA
lopi
bagh
PS
1.1x
1.3
747.
61
Bric
k M
ason
ary
1 in
1388
1
in
152.
25
1 in
28
1.16
14
.61
34.3
824
.38
ED1
11B
-Al
opib
agh
PS
-B
hard
waj
A
sram
Mar
gA
lopi
bagh
PS
1.1x
1.3
85.4
9 B
rick
Mas
onar
y 1
in
339.
08
1 in
113
.81
in
222.
05
12.7
15
.4
14.0
0
10-1
0AC
hint
aman
i M
arg
Dar
bang
a C
olon
y A
lopi
bagh
PS
0.30
51
6.44
C
oncr
ete
1 in
37
3.56
1
in
26.8
4 1
in
49.7
0 16
.67
82.3
330
.46
10A
-11
Chi
ntam
ani
Mar
g D
arba
nga
Col
ony
Alo
piba
gh
PS0.
60
767.
61
Bric
k M
ason
ary
1 in
17
66.6
7 1
in
91.2
6 1
in 4
5125
.80
56.3
043
.20
ED2
11-1
1BJa
wah
arLa
l N
ehru
Roa
d D
arba
nga
Col
ony
Alo
piba
gh
PS0.
99
777.
63
Bric
k M
ason
ary
1 in
35
13.6
1
in
277.
96
1 in
66
8.64
15
.20
39.4
026
.82
6-7
Kam
la
Neh
ru M
arg
Sain
t Jo
shep
h Ta
gore
To
wn
0.30
32
8.14
C
oncr
ete
1 in
84
8.67
1
in 7
7 1
in
260.
43
73.3
310
0 10
0
7-7A
M
ahar
shi
Day
anan
d M
arg
Sain
t Jo
shep
h Ta
gore
To
wn
0.50
11
24.6
7 C
oncr
ete
1 in
13
05.0
6 1
in
63.5
5 1
in
67.7
3 24
.00
75.6
036
.25
7A-7
BM
ahar
shi
Day
anan
d M
arg
Sain
t Jo
shep
h Ta
gore
To
wn
0.50
34
3.51
C
oncr
ete
1 in
(-ve
) 95
6.27
1
in
56.2
9 1
in
379.
57
30.0
010
0 71
.49
ED3
7B-1
0A-
Sain
t Jo
shep
h Ta
gore
To
wn
0.50
30
9.04
C
oncr
ete
1 in
52
7.50
1
in
234.
07
1 in
38
6.78
20
.00
52.0
028
.04
Final Report on Water Quality Management Plan for Ganga River Volume IV-3, Feasibility Study for Allahabad City, Part I, Sewerage Scheme
3-7
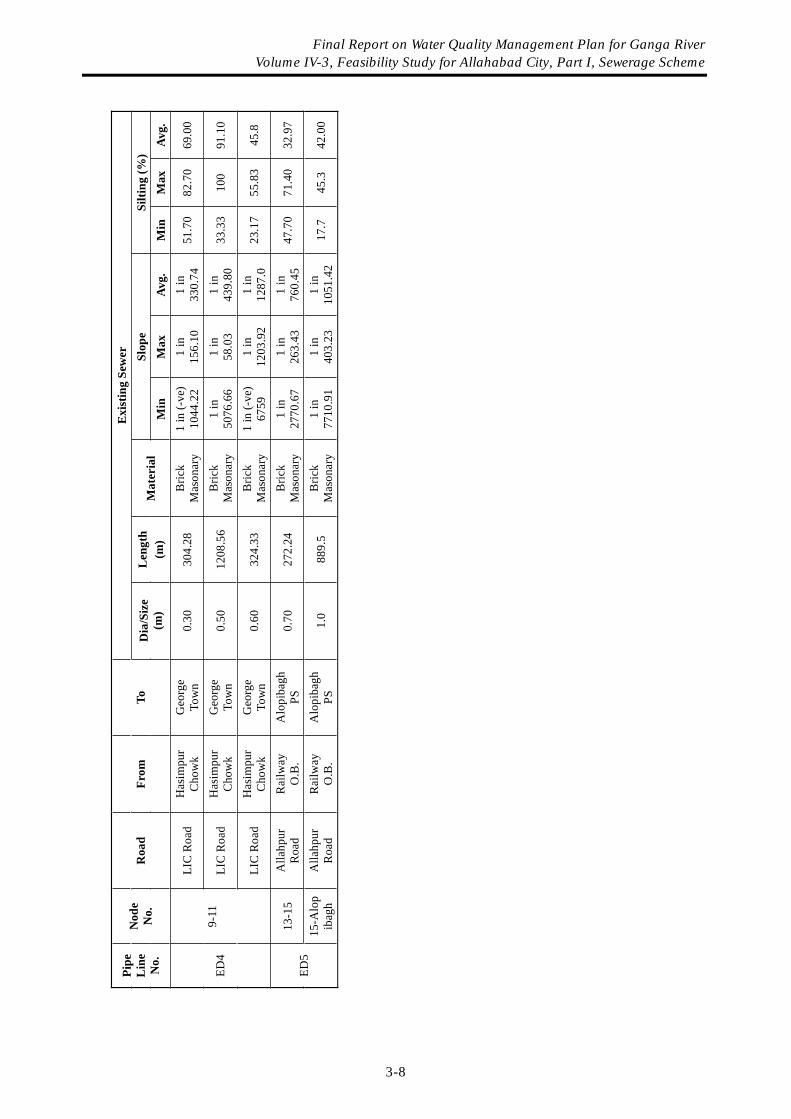
Exi
stin
g Se
wer
Sl
ope
Silti
ng (%
) Pi
peL
ine
No.
Nod
e N
o.
Roa
d Fr
om
To
Dia
/Siz
e (m
)L
engt
h (m
)M
ater
ial
Min
M
ax
Avg
. M
in
Max
A
vg.
LIC
Roa
d H
asim
pur
Cho
wk
Geo
rge
Tow
n 0.
30
304.
28
Bric
k M
ason
ary
1 in
(-ve
) 10
44.2
2 1
in
156.
10
1 in
33
0.74
51
.70
82.7
069
.00
LIC
Roa
d H
asim
pur
Cho
wk
Geo
rge
Tow
n 0.
50
1208
.56
Bric
k M
ason
ary
1 in
50
76.6
6 1
in
58.0
3 1
in
439.
80
33.3
310
0 91
.10
ED4
9-11
LIC
Roa
d H
asim
pur
Cho
wk
Geo
rge
Tow
n 0.
60
324.
33
Bric
k M
ason
ary
1 in
(-ve
) 67
59
1 in
12
03.9
2 1
in
1287
.0
23.1
755
.83
45.8
13-1
5 A
llahp
ur
Roa
d R
ailw
ayO
.B.
Alo
piba
gh
PS0.
70
272.
24
Bric
k M
ason
ary
1 in
27
70.6
7 1
in
263.
43
1 in
76
0.45
47
.70
71.4
032
.97
ED5
15-A
lop
ibag
h A
llahp
ur
Roa
d R
ailw
ayO
.B.
Alo
piba
gh
PS1.
0 88
9.5
Bric
k M
ason
ary
1 in
77
10.9
1 1
in
403.
23
1 in
10
51.4
2 17
.7
45.3
42
.00
Final Report on Water Quality Management Plan for Ganga River Volume IV-3, Feasibility Study for Allahabad City, Part I, Sewerage Scheme
3-8
Final Report on Water Quality Management Plan for Ganga RiverVolume IV-3, Feasibility Study for Allahabad City, Part I, Sewerage Scheme
3-9
2) ED1 (Bhardwaj Ashram Marg to Alopibagh SPS)
Node 5-8-11A (Manholes ED1/1 to ED1/16): (Avg. Slope 212.53, Avg. discharge capacity 201.73 mld, Estimated Design discharge for 2030, 13.65 mld) (Ref. Sheet No. 91, 92, 93)
Node 11A-11B (Manholes ED1/16 to ED1/26): (Avg. Slope 281.16, Avg. discharge capacity 175.39 mld, Estimated Design discharge for 2030, 22.55 mld) (Ref. Sheet No. 93, 94)
Node 11B- Alopibagh SPS (Manholes ED1/26 to Alopibagh PS): (Avg. Slope 222.05, Avg. discharge capacity 197.36 mld, Estimated Design discharge for 2030, 54.26 mld). (Ref. Sheet No. 94) Discharge capacity for this entire stretch is high because of the large sewer size, so it can easily carry the design discharge given in MP. However, it should be desilted to remove the existing deposits. 3) ED2 (Darbanga Colony to Alopibagh SPS)
Node 10-10A (Manholes ED2/1 to ED2/8): (Avg. Slope 49.70, Avg. discharge capacity 8.85 mld, Estimated Design discharge for 2030, 11.06 mld) (Ref. Sheet No. 95, 96)
Node 10A-11 (Manholes ED2/8 to ED2/22): (Avg. Slope 451, Avg. discharge capacity 18.65 mld, Estimated Design discharge for 2030, 19.61 mld) (Ref. Sheet No. 96, 97)
The calculated average discharge capacity of these parts of the sewer is close to the design discharge for 2030 as given in the MP, however, large stretches have inadequate slopes and will prove critical bottlenecks. Moreover as the structural condition is poor, it is advisable to replace the entire stretch. Node 11-11B (Manholes ED2/22 to ED2/37): (Avg. Slope 668.64, Avg. discharge capacity 58.22 mld, Estimated Design discharge for 2030, 31.71 mld) Existing sewer in this part of the line is sufficiently large and to carry the design discharge for 2030. after desilting. (Ref. Sheet No. 97, 98) 4) ED3 (Saint Joseph to Tagore Town) Node 6-7 (Manholes ED3/1 to ED3/9): (Avg. Slope 260.43, Avg. discharge capacity 3.86 mld, Estimated Design discharge for 2030, 5.96 mld) Pipeline in this stretch is almost fully choked. Even after de-silting the pipe would not have adequate discharge capacity to carry the design discharge for the year 2030. Hence replacement of the existing line at the average slope is recommended. (Ref. Sheet No. 99) Node 7-7A (Manholes ED3/9 to ED3/21): (Avg. Slope 67.73, Avg. discharge capacity 30.30 mld, Estimated Design discharge for 2030, 8.55 mld) Almost all stretches would have the capacity to carry design discharge for the year 2030 after desilting. A few stretches could carry 2030 discharge flowing 90% full. Hence
Final Report on Water Quality Management Plan for Ganga RiverVolume IV-3, Feasibility Study for Allahabad City, Part I, Sewerage Scheme
3-10
pending the results of a detailed CCTV inspection, desilting rather than replacement is recommended for this stretch. (Ref. Sheet No. 99, 100, 101) Node 7A-7B (Manholes ED3/21 to ED3/27): (Avg. Slope 379.57, Avg. discharge capacity 12.80 mld, Estimated Design discharge for 2030, 8.55 mld) In general, the pipe does not have sufficient capacity to carry the design discharge for 2030, plus the line shows tremendous slope variations. There is even negative slope in some parts. Hence this line needs to be replaced at the average slope to carry the discharge. (Ref. Sheet No. 101) Node 7B-10A (Manholes ED3/27 to ED3/31): (Avg. Slope 386.78, Avg. discharge capacity 12.68 mld, Estimated Design discharge for 2030, 8.55 mld) This line is efficient to carry design discharge for the year 2030 after desilting. (Ref. Sheet No. 101, 102) 5) ED4 (Hasimpur Chowk to George Town) Node 9-11 (Manholes ED4/1 to Alopibagh SPS): This reach is can be split in three parts based on different diameters and the whole reach does not have sufficient capacity to carry the design discharge for the year 2030; hence it needs to be replaced at average slope.
(i) (Manholes ED4/1 to ED4/9): (Avg. Slope 330.74, Avg. discharge capacity 3.43 mld, Estimated Design discharge for 2030, 12.10 mld) (Ref. Sheet No. 103) (ii) (Manholes ED4/9 to ED4/32): (Avg. Slope 439.80, Avg. discharge capacity 11.61 mld, Estimated Design discharge for 2030, 12.10 mld) (Ref. Sheet No. 103, 104, 105) (ii) (Manholes ED4/32 to ED4/38) (Avg. Slope 1287.02, Avg. discharge capacity 11.04 mld, Estimated Design discharge for 2030, 12.10 mld) (Ref. Sheet No. 105) 6) ED5 (Alopibagh PS to Railway O.B. near Daraganj Boosting PS) Node 13-15 (Manholes ED5/20 to ED5/14): (Avg. Slope 760.45, Avg. discharge capacity 21.66 mld, Estimated Design discharge for 2030, 18.06 mld) One stretch of length will flow 90% full flow for discharge of 2030, other stretches have sufficient capacity to carry the discharge; hence desilting after CCTV inspection is recommended. (Ref. Sheet No. 108) Node 15- Alopibagh PS (Manholes ED5/14 to ED5/1): (Avg. Slope 1051.42, Avg. discharge capacity 47.69 mld, Estimated Design discharge for 2030, 36.98 mld) Discussion same as above. (Ref. Sheet No. 108, 107, 106)
(4) Recommendations
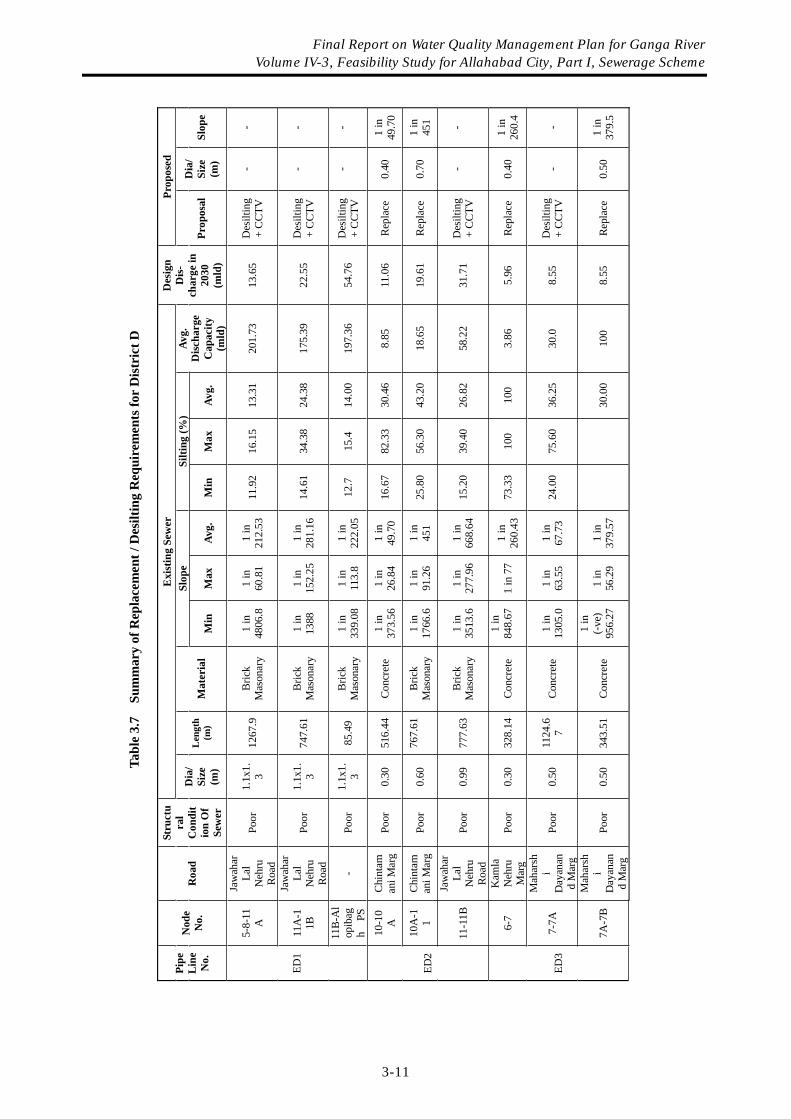
Tabl
e 3.
7 S
umm
ary
of R
epla
cem
ent /
Des
iltin
g R
equi
rem
ents
for
Dis
tric
t D
Exi
stin
g Se
wer
Pr
opos
ed
Slop
e Si
lting
(%)
Pipe
L
ine
No.
Nod
eN
o.
Roa
d
Stru
ctu
ral
Con
dit
ion
Of
Sew
er
Dia
/Si
ze
(m)
Len
gth
(m)
Mat
eria
lM
in
Max
Av
g.
Min
M
ax
Avg.
Avg.
D
ischa
rge
Cap
acity
(mld
)
Des
ign
Dis-
char
ge in
20
30(m
ld)
Prop
osal
Dia
/Si
ze
(m)
Slop
e
5-8-
11A
Jaw
ahar
Lal
Neh
ruR
oad
Poor
1.1x
1.3
1267
.9B
rick
Mas
onar
y1
in
4806
.81
in
60.8
11
in
212.
5311
.92
16.1
513
.31
201.
73
13.6
5 D
esilt
ing
+ C
CTV
--
11A
-11B
Jaw
ahar
Lal
Neh
ruR
oad
Poor
1.1x
1.3
747.
61B
rick
Mas
onar
y1
in
13
881
in
152.
251
in
281.
1614
.61
34.3
824
.38
175.
39
22.5
5 D
esilt
ing
+ C
CTV
--
ED1
11B
-Al
opib
agh
PS
- Po
or
1.1x
1.3
85.4
9B
rick
Mas
onar
y1
in
339.
081
in
113.
81
in
222.
0512
.7
15.4
14
.00
197.
36
54.7
6 D
esilt
ing
+ C
CTV
--
10-1
0A
Chi
ntam
ani M
arg
Poor
0.
30
516.
44Co
ncre
te
1 in
37
3.56
1 in
26
.84
1 in
49
.70
16.6
7 82
.33
30.4
68.
85
11.0
6 R
epla
ce0.
40
1 in
49
.70
10A
-11
Chi
ntam
ani M
arg
Poor
0.
60
767.
61B
rick
Mas
onar
y1
in
1766
.61
in
91.2
61
in
451
25.8
0 56
.30
43.2
018
.65
19.6
1 R
epla
ce0.
70
1 in
45
1ED
2
11-1
1B
Jaw
ahar
Lal
Neh
ruR
oad
Poor
0.
99
777.
63B
rick
Mas
onar
y1
in
3513
.61
in
277.
961
in
668.
6415
.20
39.4
026
.82
58.2
2 31
.71
Des
iltin
g +
CC
TV-
-
6-7
Kam
laN
ehru
Mar
g Po
or
0.30
32
8.14
Conc
rete
1
in
848.
671
in 7
71
in
260.
4373
.33
100
100
3.86
5.
96
Rep
lace
0.40
1
in
260.
4
7-7A
Mah
arsh
iD
ayan
and
Mar
g
Poor
0.
50
1124
.67
Con
cret
e1
in
1305
.01
in
63.5
51
in
67.7
324
.00
75.6
036
.25
30.0
8.
55
Des
iltin
g +
CC
TV-
- ED
3
7A-7
B
Mah
arsh
iD
ayan
and
Mar
g
Poor
0.
50
343.
51Co
ncre
te
1 in
(-
ve)
956.
271
in
56.2
91
in
379.
57
30
.00
100
8.55
Re
plac
e0.
50
1 in
37
9.5
Final Report on Water Quality Management Plan for Ganga River Volume IV-3, Feasibility Study for Allahabad City, Part I, Sewerage Scheme
3-11
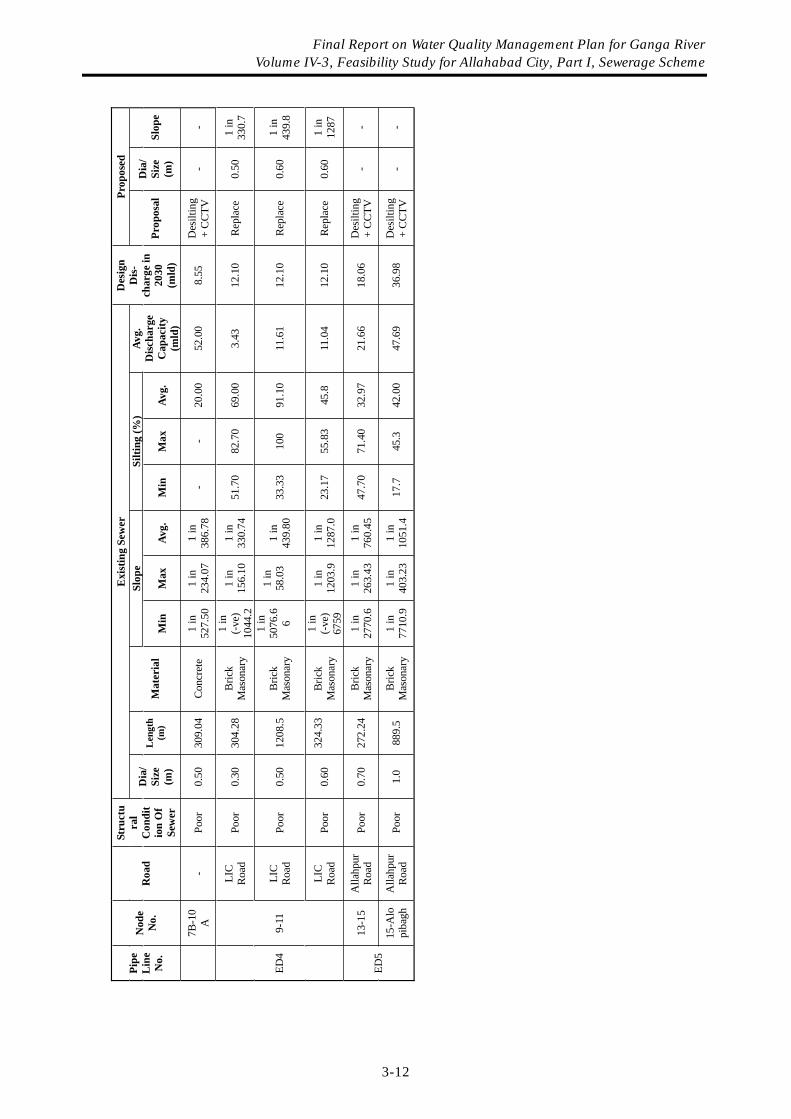
Exi
stin
g Se
wer
Pr
opos
ed
Slop
e Si
lting
(%)
Pipe
L
ine
No.
Nod
eN
o.
Roa
d
Stru
ctu
ral
Con
dit
ion
Of
Sew
er
Dia
/Si
ze
(m)
Len
gth
(m)
Mat
eria
lM
in
Max
Av
g.
Min
M
ax
Avg.
Avg.
D
ischa
rge
Cap
acity
(mld
)
Des
ign
Dis-
char
ge in
20
30(m
ld)
Prop
osal
Dia
/Si
ze
(m)
Slop
e
7B-1
0A
- Po
or
0.50
30
9.04
Con
cret
e 1
in
527.
501
in
234.
071
in
386.
78-
- 20
.00
52.0
0 8.
55
Des
iltin
g +
CC
TV-
-
LIC
Roa
dPo
or
0.30
30
4.28
Bric
kM
ason
ary
1 in
(-
ve)
1044
.2
1 in
15
6.10
1 in
33
0.74
51.7
0 82
.70
69.0
03.
43
12.1
0 R
epla
ce0.
50
1 in
33
0.7
LIC
Roa
dPo
or
0.50
12
08.5
Bric
kM
ason
ary
1 in
50
76.6
6
1 in
58
.03
1 in
43
9.80
33.3
3 10
0 91
.10
11.6
1 12
.10
Rep
lace
0.60
1
in
439.
8ED
4 9-
11
LIC
Roa
dPo
or
0.60
32
4.33
Bric
kM
ason
ary
1 in
(-
ve)
6759
1 in
12
03.9
1 in
12
87.0
23.1
7 55
.83
45.8
11
.04
12.1
0 R
epla
ce0.
60
1 in
12
87
13-1
5A
llahp
urR
oad
Poor
0.
70
272.
24B
rick
Mas
onar
y1
in
2770
.61
in
263.
431
in
760.
4547
.70
71.4
032
.97
21.6
6 18
.06
Des
iltin
g +
CC
TV-
- ED
515
-Alo
piba
ghA
llahp
urR
oad
Poor
1.
0 88
9.5
Bric
kM
ason
ary
1 in
77
10.9
1 in
40
3.23
1 in
10
51.4
17.7
45
.3
42.0
047
.69
36.9
8 D
esilt
ing
+ C
CTV
- -
Final Report on Water Quality Management Plan for Ganga River Volume IV-3, Feasibility Study for Allahabad City, Part I, Sewerage Scheme
3-12
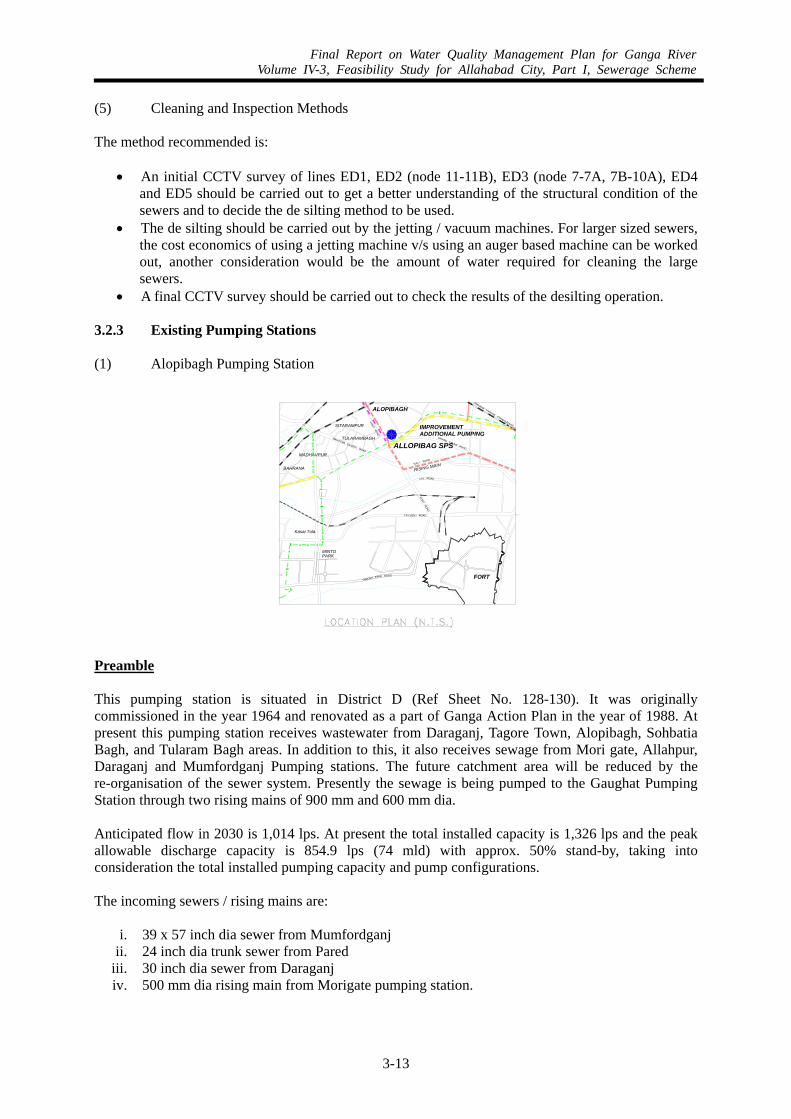
Final Report on Water Quality Management Plan for Ganga RiverVolume IV-3, Feasibility Study for Allahabad City, Part I, Sewerage Scheme
3-13
(5) Cleaning and Inspection Methods The method recommended is:
• An initial CCTV survey of lines ED1, ED2 (node 11-11B), ED3 (node 7-7A, 7B-10A), ED4
and ED5 should be carried out to get a better understanding of the structural condition of the sewers and to decide the de silting method to be used.
• The de silting should be carried out by the jetting / vacuum machines. For larger sized sewers, the cost economics of using a jetting machine v/s using an auger based machine can be worked out, another consideration would be the amount of water required for cleaning the large sewers.
• A final CCTV survey should be carried out to check the results of the desilting operation. 3.2.3 Existing Pumping Stations (1) Alopibagh Pumping Station
ALOPIBAGH
Kasai Tola
MINTOPARK
BAHRANA
SITARAMPUR
TULARAMBAGH
MADHAVPUR
GRAND TRUNK ROAD
LAL ROAD
KAL I ROAD
TR I VEN I ROAD
FORTRO
AD
MAHATMA GANDH I ROAD
FORT
ROAD
Allahabad - Varanasi - Chhapra Branch
FORTYAMUNA BANK ROAD
ALLOPIBAG SPS
RISING MAIN
IMPROVEMENT ADDITIONAL PUMPING
Preamble This pumping station is situated in District D (Ref Sheet No. 128-130). It was originally commissioned in the year 1964 and renovated as a part of Ganga Action Plan in the year of 1988. At present this pumping station receives wastewater from Daraganj, Tagore Town, Alopibagh, Sohbatia Bagh, and Tularam Bagh areas. In addition to this, it also receives sewage from Mori gate, Allahpur, Daraganj and Mumfordganj Pumping stations. The future catchment area will be reduced by the re-organisation of the sewer system. Presently the sewage is being pumped to the Gaughat Pumping Station through two rising mains of 900 mm and 600 mm dia. Anticipated flow in 2030 is 1,014 lps. At present the total installed capacity is 1,326 lps and the peak allowable discharge capacity is 854.9 lps (74 mld) with approx. 50% stand-by, taking into consideration the total installed pumping capacity and pump configurations. The incoming sewers / rising mains are:
i. 39 x 57 inch dia sewer from Mumfordganj ii. 24 inch dia trunk sewer from Pared
iii. 30 inch dia sewer from Daraganj iv. 500 mm dia rising main from Morigate pumping station.
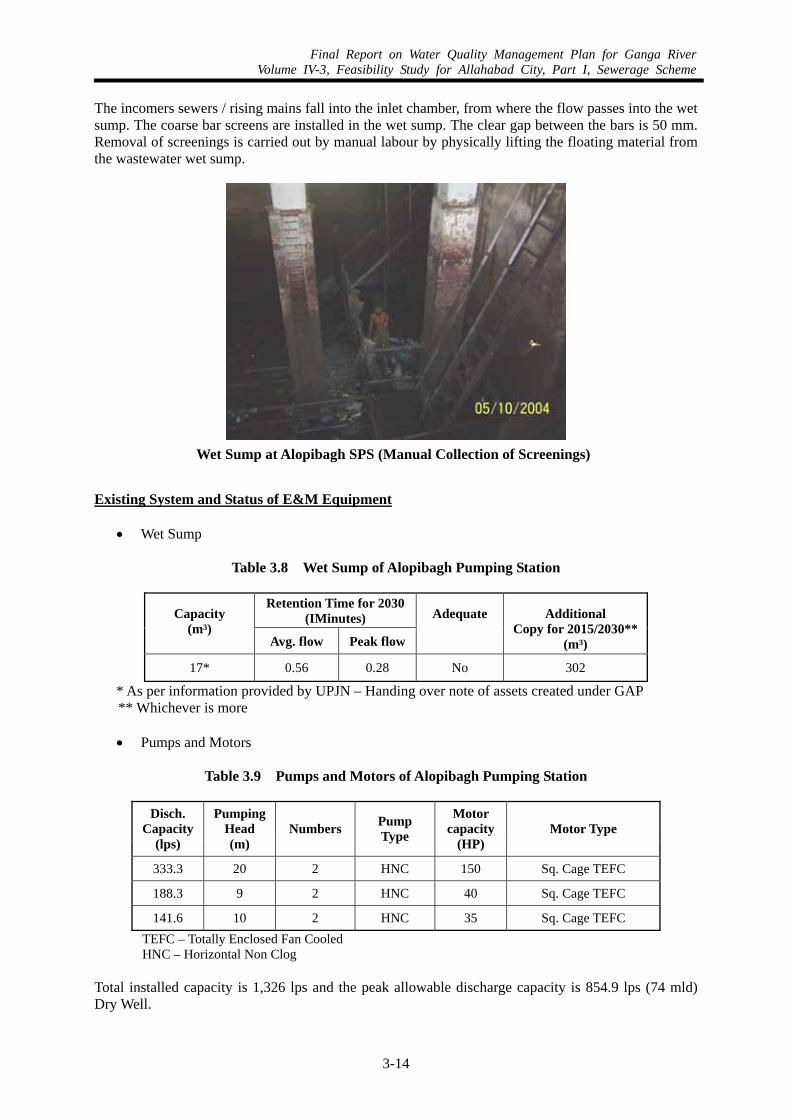
Final Report on Water Quality Management Plan for Ganga RiverVolume IV-3, Feasibility Study for Allahabad City, Part I, Sewerage Scheme
3-14
The incomers sewers / rising mains fall into the inlet chamber, from where the flow passes into the wet sump. The coarse bar screens are installed in the wet sump. The clear gap between the bars is 50 mm. Removal of screenings is carried out by manual labour by physically lifting the floating material from the wastewater wet sump.
Existing System and Status of E&M Equipment
• Wet Sump
Table 3.8 Wet Sump of Alopibagh Pumping Station
Retention Time for 2030(IMinutes) Capacity
(m³) Avg. flow Peak flow
Adequate Additional Copy for 2015/2030**
(m³)
17* 0.56 0.28 No 302
* As per information provided by UPJN – Handing over note of assets created under GAP ** Whichever is more • Pumps and Motors
Table 3.9 Pumps and Motors of Alopibagh Pumping Station
Disch. Capacity
(lps)
Pumping Head (m)
Numbers Pump Type
Motor capacity
(HP) Motor Type
333.3 20 2 HNC 150 Sq. Cage TEFC
188.3 9 2 HNC 40 Sq. Cage TEFC
141.6 10 2 HNC 35 Sq. Cage TEFC TEFC – Totally Enclosed Fan Cooled HNC – Horizontal Non Clog
Total installed capacity is 1,326 lps and the peak allowable discharge capacity is 854.9 lps (74 mld) Dry Well.
Wet Sump at Alopibagh SPS (Manual Collection of Screenings)
Final Report on Water Quality Management Plan for Ganga RiverVolume IV-3, Feasibility Study for Allahabad City, Part I, Sewerage Scheme
3-15
The dry well houses the pumps and motors on same level. The pump floor level and the motor floor level is at 77 meter RL. An typical feature of the P/H is that the by-pass arrangement falling into the Morigate nala is via the rising main.
• Electrical System
i) Incoming Supply - The electric supply is taken through an underground cable from Over Head Distribution system of UPPCL at High voltage of 11 kV for operation of the Pumping Station.
ii) LT Panel - Two incoming SFU and six outgoing feeders for operation of the existing pumps are provided through protective switch gears.
iii) Cables – PVC insulated and PVC sheathed armoured cable. iv) Starters - Star delta / ATS starters are provided for starting the pumps. v) DG Sets - 160 kVA Diesel Generating Set is available as stand by power. vi) Transformer – 11 / 0.415 kV , 400 kVA ,ONAN (Oil Natural Air Natural) type (2
4Nos.) vii) Three unit HT panel of Oil Circuit Breaker
The details of the available equipment differ from those given in the Master Plan.
Future Flows Projected peak flows are:
• 1,064 lps in 2015 • 1,031 lps in 2030
The discharge for 2015 is more than present flow and the discharge capacity and head of the pumps is not sufficient to cater for pumping sewage to Mumfordganj; Hence for 2015 replacement is required. Wet sump capacity is to be increased. Inadequacies of the Existing System
• The installed pumping capacity and head is insufficient for projected flows. • The present sump capacity is insufficient for present and ultimate peak flows. • There is no Mechanical Bar Screen. • Cleaning of the screens done manually. • Electrical System is to be improved • DG set available but inadequate. • Supply of Diesel is inadequate and irregular.
Rehabilitation / Upgradation Proposed
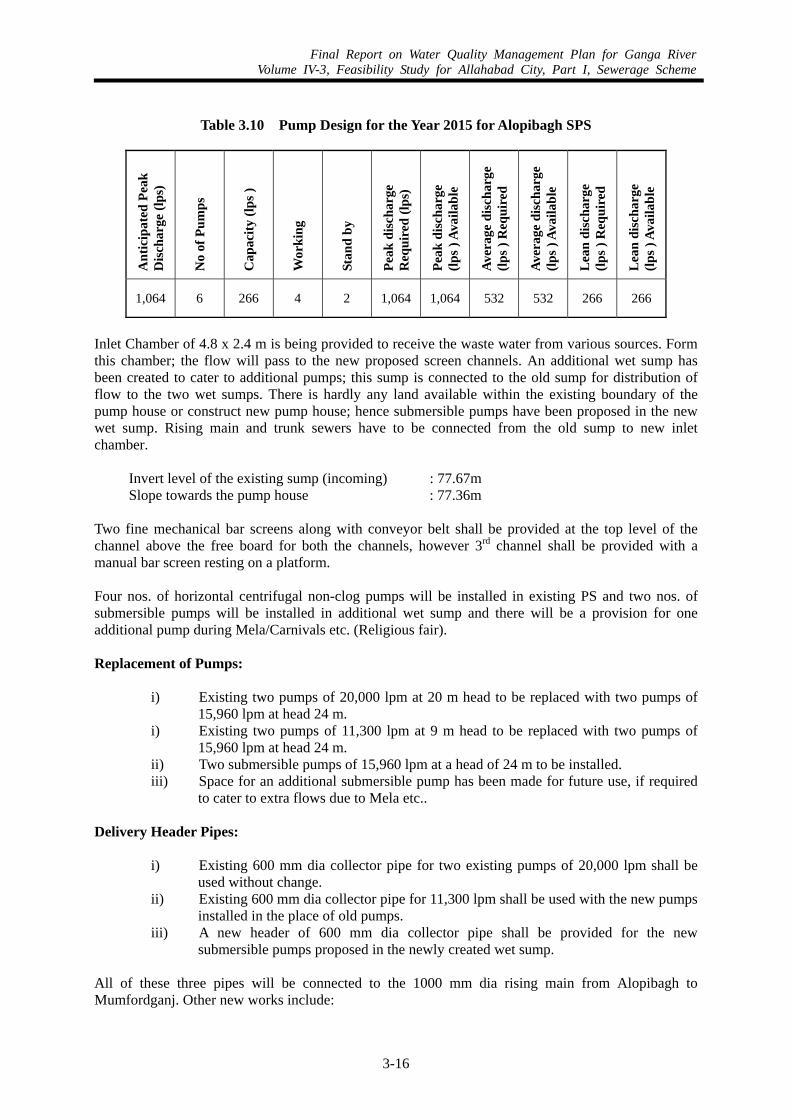
Final Report on Water Quality Management Plan for Ganga RiverVolume IV-3, Feasibility Study for Allahabad City, Part I, Sewerage Scheme
3-16
Table 3.10 Pump Design for the Year 2015 for Alopibagh SPS
A
ntic
ipat
ed P
eak
Dis
char
ge (l
ps)
No
of P
umps
Cap
acity
(lps
)
Wor
king
Stan
d by
Peak
dis
char
ge
Req
uire
d (lp
s)
Peak
dis
char
ge
(lps )
Ava
ilabl
e
Aver
age
disc
harg
e (lp
s ) R
equi
red
Aver
age
disc
harg
e (lp
s ) A
vaila
ble
Lea
n di
scha
rge
(lps )
Req
uire
d
Lea
n di
scha
rge
(lps )
Ava
ilabl
e
1,064 6 266 4 2 1,064 1,064 532 532 266 266
Inlet Chamber of 4.8 x 2.4 m is being provided to receive the waste water from various sources. Form this chamber; the flow will pass to the new proposed screen channels. An additional wet sump has been created to cater to additional pumps; this sump is connected to the old sump for distribution of flow to the two wet sumps. There is hardly any land available within the existing boundary of the pump house or construct new pump house; hence submersible pumps have been proposed in the new wet sump. Rising main and trunk sewers have to be connected from the old sump to new inlet chamber.
Invert level of the existing sump (incoming) : 77.67m Slope towards the pump house : 77.36m
Two fine mechanical bar screens along with conveyor belt shall be provided at the top level of the channel above the free board for both the channels, however 3rd channel shall be provided with a manual bar screen resting on a platform. Four nos. of horizontal centrifugal non-clog pumps will be installed in existing PS and two nos. of submersible pumps will be installed in additional wet sump and there will be a provision for one additional pump during Mela/Carnivals etc. (Religious fair). Replacement of Pumps:
i) Existing two pumps of 20,000 lpm at 20 m head to be replaced with two pumps of 15,960 lpm at head 24 m.
i) Existing two pumps of 11,300 lpm at 9 m head to be replaced with two pumps of 15,960 lpm at head 24 m.
ii) Two submersible pumps of 15,960 lpm at a head of 24 m to be installed. iii) Space for an additional submersible pump has been made for future use, if required
to cater to extra flows due to Mela etc.. Delivery Header Pipes:
i) Existing 600 mm dia collector pipe for two existing pumps of 20,000 lpm shall be used without change.
ii) Existing 600 mm dia collector pipe for 11,300 lpm shall be used with the new pumps installed in the place of old pumps.
iii) A new header of 600 mm dia collector pipe shall be provided for the new submersible pumps proposed in the newly created wet sump.
All of these three pipes will be connected to the 1000 mm dia rising main from Alopibagh to Mumfordganj. Other new works include:
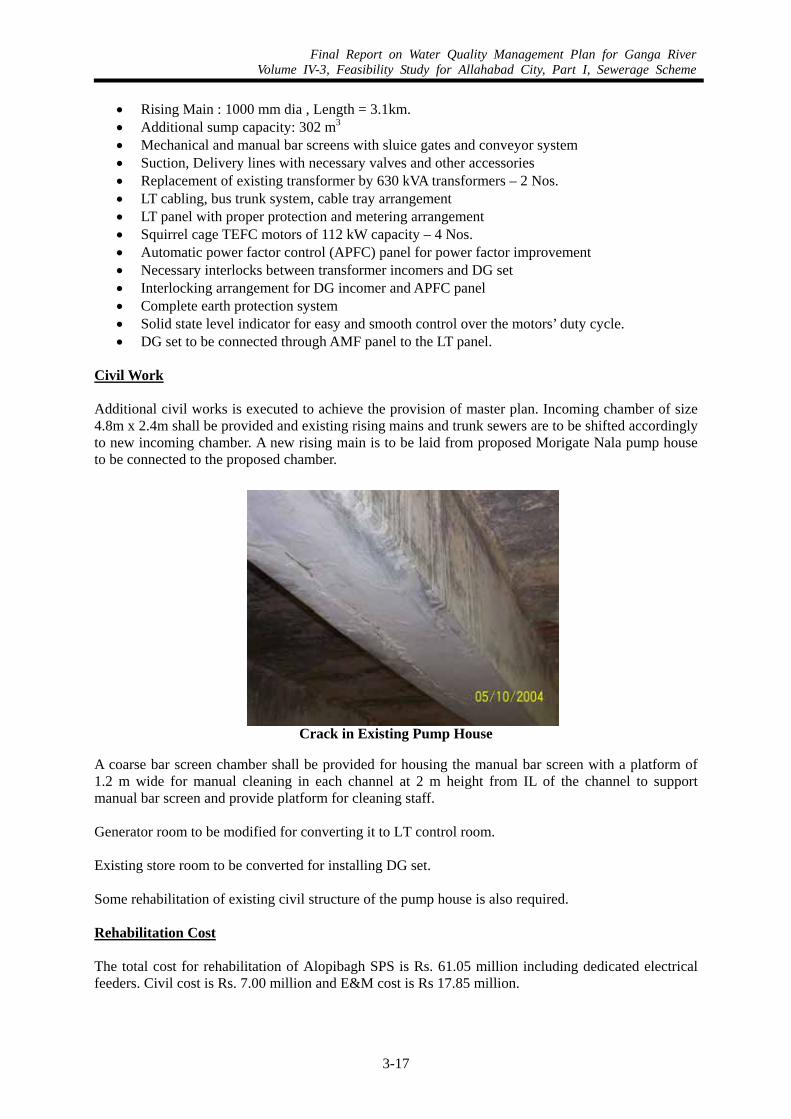
Final Report on Water Quality Management Plan for Ganga RiverVolume IV-3, Feasibility Study for Allahabad City, Part I, Sewerage Scheme
3-17
• Rising Main : 1000 mm dia , Length = 3.1km. • Additional sump capacity: 302 m3 • Mechanical and manual bar screens with sluice gates and conveyor system • Suction, Delivery lines with necessary valves and other accessories • Replacement of existing transformer by 630 kVA transformers – 2 Nos. • LT cabling, bus trunk system, cable tray arrangement • LT panel with proper protection and metering arrangement • Squirrel cage TEFC motors of 112 kW capacity – 4 Nos. • Automatic power factor control (APFC) panel for power factor improvement • Necessary interlocks between transformer incomers and DG set • Interlocking arrangement for DG incomer and APFC panel • Complete earth protection system • Solid state level indicator for easy and smooth control over the motors’ duty cycle. • DG set to be connected through AMF panel to the LT panel.
Civil Work Additional civil works is executed to achieve the provision of master plan. Incoming chamber of size 4.8m x 2.4m shall be provided and existing rising mains and trunk sewers are to be shifted accordingly to new incoming chamber. A new rising main is to be laid from proposed Morigate Nala pump house to be connected to the proposed chamber.
A coarse bar screen chamber shall be provided for housing the manual bar screen with a platform of 1.2 m wide for manual cleaning in each channel at 2 m height from IL of the channel to support manual bar screen and provide platform for cleaning staff. Generator room to be modified for converting it to LT control room. Existing store room to be converted for installing DG set. Some rehabilitation of existing civil structure of the pump house is also required.
Rehabilitation Cost The total cost for rehabilitation of Alopibagh SPS is Rs. 61.05 million including dedicated electrical feeders. Civil cost is Rs. 7.00 million and E&M cost is Rs 17.85 million.
Crack in Existing Pump House
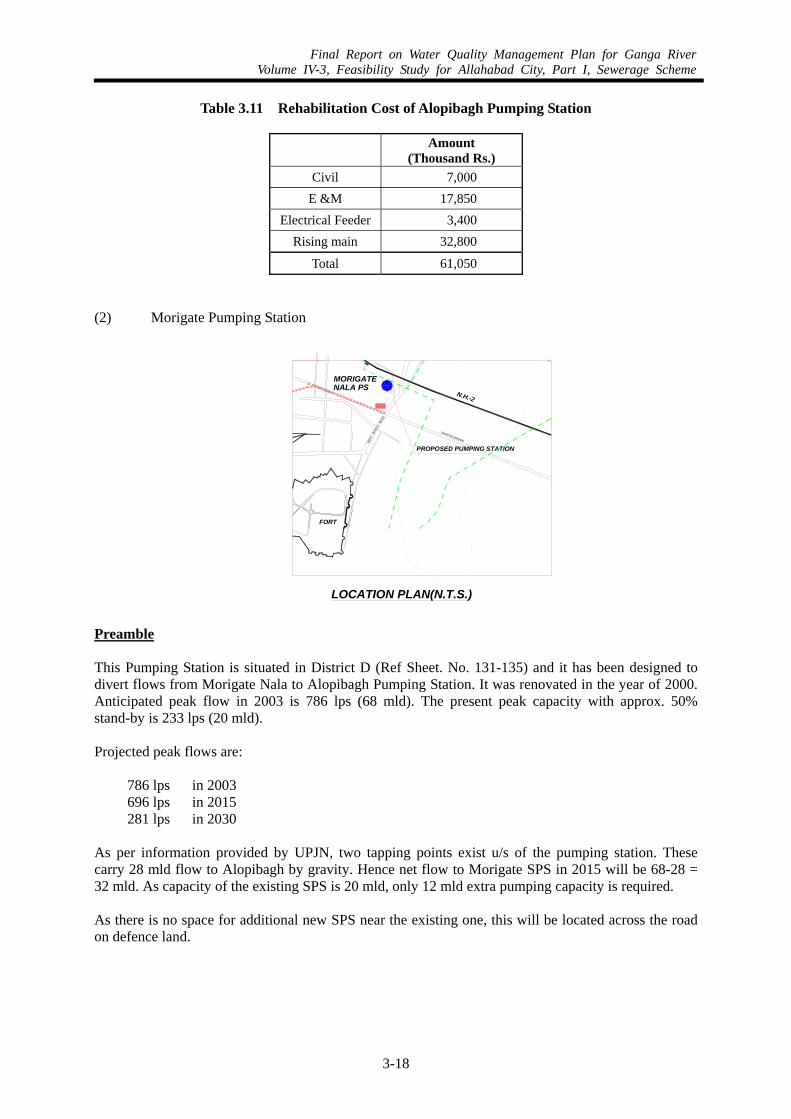
Final Report on Water Quality Management Plan for Ganga RiverVolume IV-3, Feasibility Study for Allahabad City, Part I, Sewerage Scheme
3-18
Table 3.11 Rehabilitation Cost of Alopibagh Pumping Station
Amount (Thousand Rs.)
Civil 7,000 E &M 17,850
Electrical Feeder 3,400 Rising main 32,800
Total 61,050 (2) Morigate Pumping Station
D TRUNK ROAD
BEN
IBA
NDH
ROAD
SHASTRI BRIDGE
FORT
MORIGATE NALA PS
PROPOSED PUMPING STATION
N.H.-2
LOCATION PLAN(N.T.S.)
Preamble This Pumping Station is situated in District D (Ref Sheet. No. 131-135) and it has been designed to divert flows from Morigate Nala to Alopibagh Pumping Station. It was renovated in the year of 2000. Anticipated peak flow in 2003 is 786 lps (68 mld). The present peak capacity with approx. 50% stand-by is 233 lps (20 mld). Projected peak flows are:
786 lps in 2003 696 lps in 2015 281 lps in 2030
As per information provided by UPJN, two tapping points exist u/s of the pumping station. These carry 28 mld flow to Alopibagh by gravity. Hence net flow to Morigate SPS in 2015 will be 68-28 = 32 mld. As capacity of the existing SPS is 20 mld, only 12 mld extra pumping capacity is required. As there is no space for additional new SPS near the existing one, this will be located across the road on defence land.
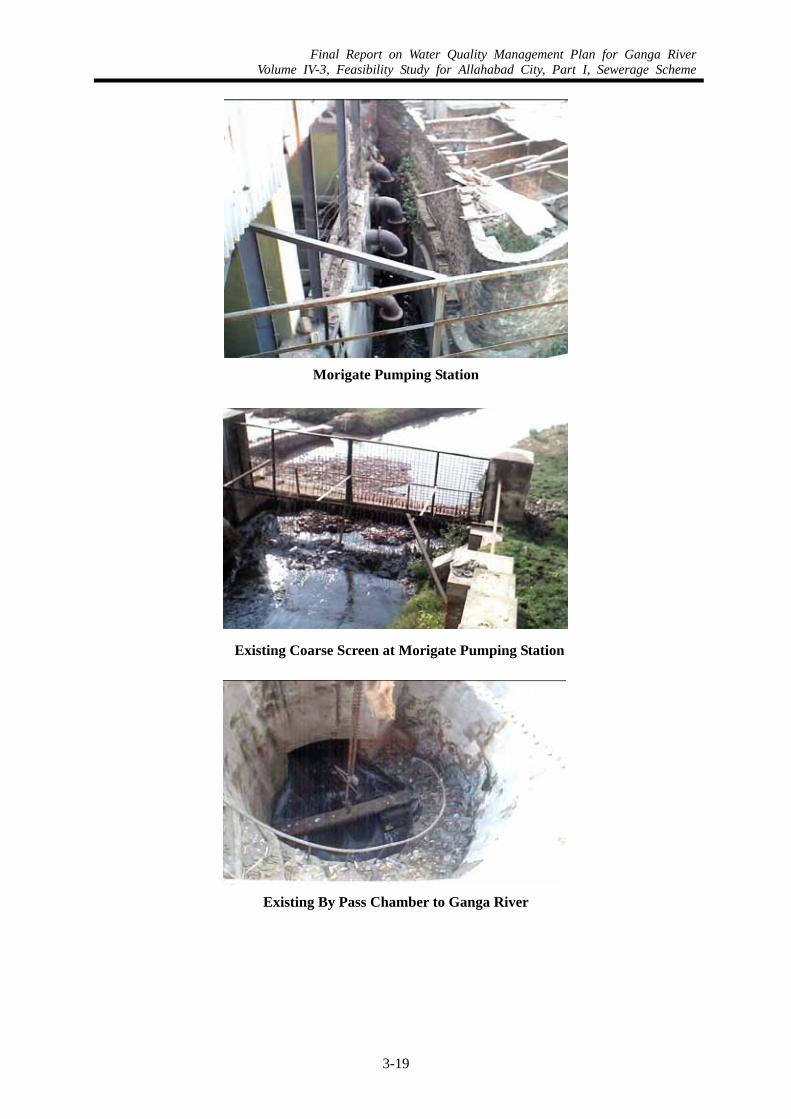
Final Report on Water Quality Management Plan for Ganga RiverVolume IV-3, Feasibility Study for Allahabad City, Part I, Sewerage Scheme
3-19
Morigate Pumping Station
Existing Coarse Screen at Morigate Pumping Station
Existing By Pass Chamber to Ganga River
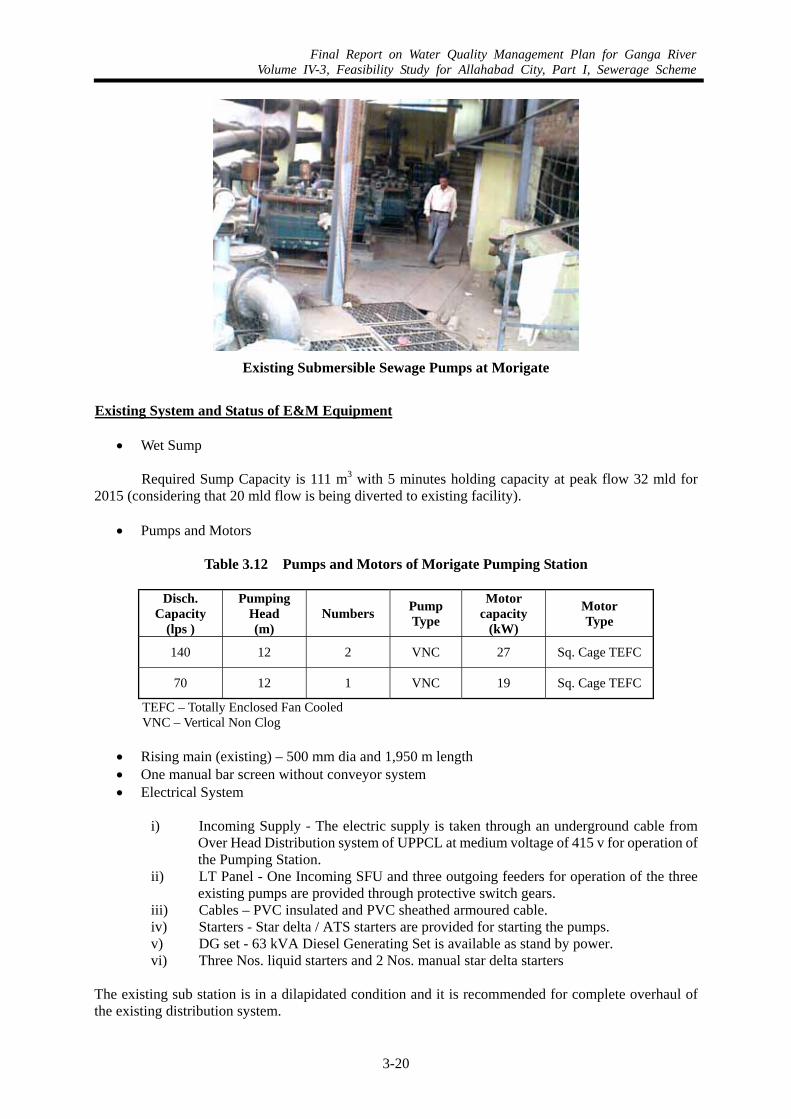
Final Report on Water Quality Management Plan for Ganga RiverVolume IV-3, Feasibility Study for Allahabad City, Part I, Sewerage Scheme
3-20
Existing System and Status of E&M Equipment
• Wet Sump
Required Sump Capacity is 111 m3 with 5 minutes holding capacity at peak flow 32 mld for 2015 (considering that 20 mld flow is being diverted to existing facility).
• Pumps and Motors
Table 3.12 Pumps and Motors of Morigate Pumping Station
Disch.
Capacity (lps )
Pumping Head (m)
Numbers Pump Type
Motor capacity
(kW)
Motor Type
140 12 2 VNC 27 Sq. Cage TEFC
70 12 1 VNC 19 Sq. Cage TEFC
TEFC – Totally Enclosed Fan Cooled VNC – Vertical Non Clog
• Rising main (existing) – 500 mm dia and 1,950 m length • One manual bar screen without conveyor system • Electrical System
i) Incoming Supply - The electric supply is taken through an underground cable from
Over Head Distribution system of UPPCL at medium voltage of 415 v for operation of the Pumping Station.
ii) LT Panel - One Incoming SFU and three outgoing feeders for operation of the three existing pumps are provided through protective switch gears.
iii) Cables – PVC insulated and PVC sheathed armoured cable. iv) Starters - Star delta / ATS starters are provided for starting the pumps. v) DG set - 63 kVA Diesel Generating Set is available as stand by power. vi) Three Nos. liquid starters and 2 Nos. manual star delta starters
The existing sub station is in a dilapidated condition and it is recommended for complete overhaul of the existing distribution system.
Existing Submersible Sewage Pumps at Morigate
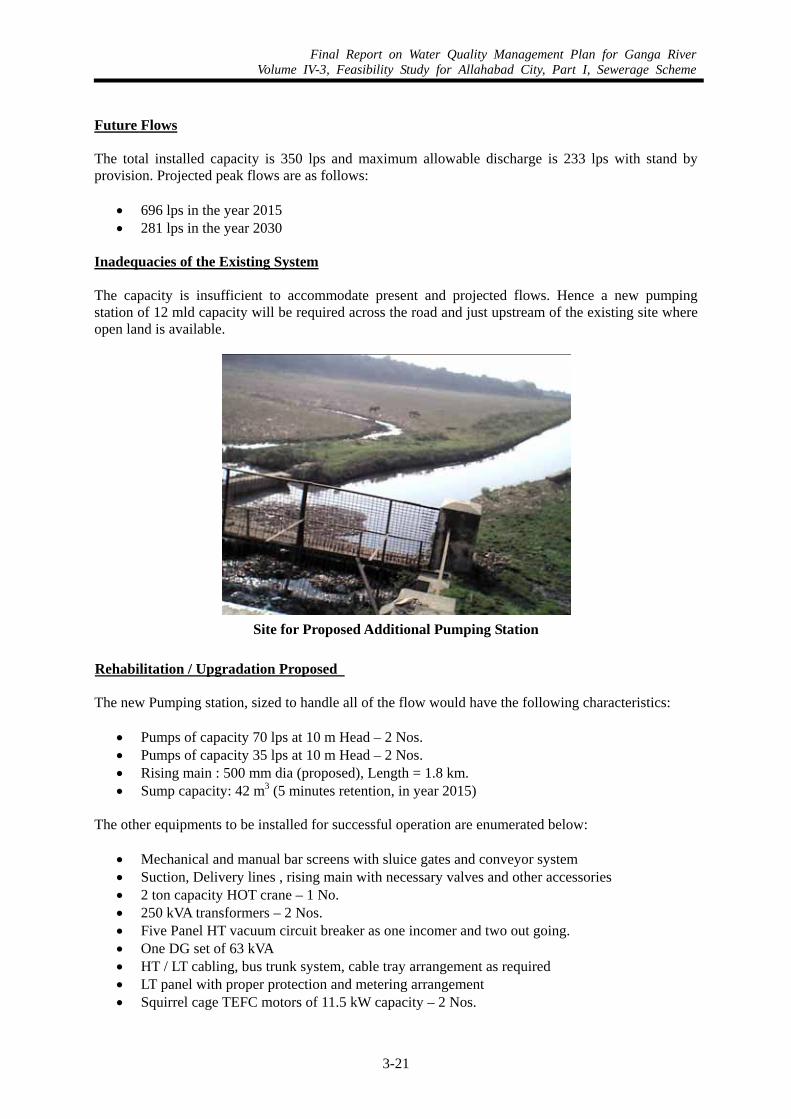
Final Report on Water Quality Management Plan for Ganga RiverVolume IV-3, Feasibility Study for Allahabad City, Part I, Sewerage Scheme
3-21
Future Flows The total installed capacity is 350 lps and maximum allowable discharge is 233 lps with stand by provision. Projected peak flows are as follows:
• 696 lps in the year 2015 • 281 lps in the year 2030
Inadequacies of the Existing System The capacity is insufficient to accommodate present and projected flows. Hence a new pumping station of 12 mld capacity will be required across the road and just upstream of the existing site where open land is available.
Rehabilitation / Upgradation Proposed The new Pumping station, sized to handle all of the flow would have the following characteristics:
• Pumps of capacity 70 lps at 10 m Head – 2 Nos. • Pumps of capacity 35 lps at 10 m Head – 2 Nos. • Rising main : 500 mm dia (proposed), Length = 1.8 km. • Sump capacity: 42 m3 (5 minutes retention, in year 2015)
The other equipments to be installed for successful operation are enumerated below:
• Mechanical and manual bar screens with sluice gates and conveyor system • Suction, Delivery lines , rising main with necessary valves and other accessories • 2 ton capacity HOT crane – 1 No. • 250 kVA transformers – 2 Nos. • Five Panel HT vacuum circuit breaker as one incomer and two out going. • One DG set of 63 kVA • HT / LT cabling, bus trunk system, cable tray arrangement as required • LT panel with proper protection and metering arrangement • Squirrel cage TEFC motors of 11.5 kW capacity – 2 Nos.
Site for Proposed Additional Pumping Station
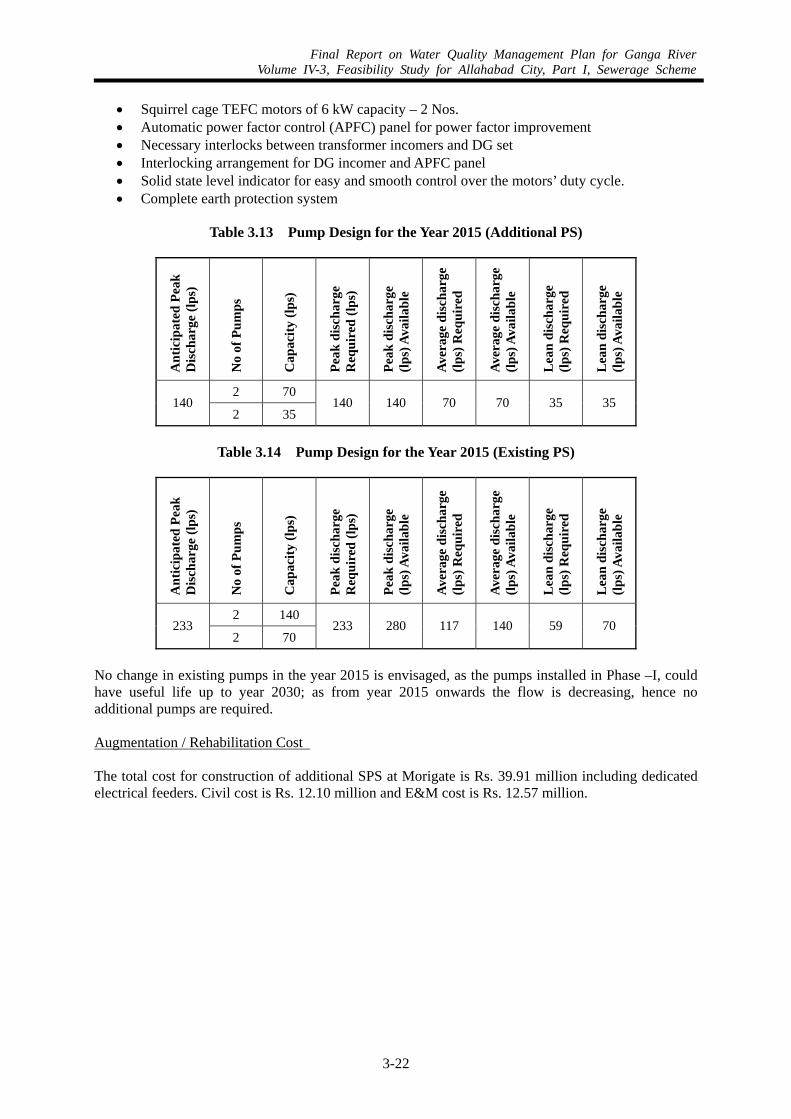
Final Report on Water Quality Management Plan for Ganga RiverVolume IV-3, Feasibility Study for Allahabad City, Part I, Sewerage Scheme
3-22
• Squirrel cage TEFC motors of 6 kW capacity – 2 Nos. • Automatic power factor control (APFC) panel for power factor improvement • Necessary interlocks between transformer incomers and DG set • Interlocking arrangement for DG incomer and APFC panel • Solid state level indicator for easy and smooth control over the motors’ duty cycle. • Complete earth protection system
Table 3.13 Pump Design for the Year 2015 (Additional PS)
Ant
icip
ated
Pea
k D
isch
arge
(lps
)
No
of P
umps
Cap
acity
(lps
)
Peak
dis
char
ge
Req
uire
d (lp
s)
Peak
dis
char
ge
(lps)
Ava
ilabl
e
Aver
age
disc
harg
e (lp
s) R
equi
red
Aver
age
disc
harg
e (lp
s) A
vaila
ble
Lea
n di
scha
rge
(lps)
Req
uire
d
Lea
n di
scha
rge
(lps)
Ava
ilabl
e
2 70 140
2 35 140 140 70 70 35 35
Table 3.14 Pump Design for the Year 2015 (Existing PS)
Ant
icip
ated
Pea
k D
isch
arge
(lps
)
No
of P
umps
Cap
acity
(lps
)
Peak
dis
char
ge
Req
uire
d (lp
s)
Peak
dis
char
ge
(lps)
Ava
ilabl
e
Aver
age
disc
harg
e (lp
s) R
equi
red
Aver
age
disc
harg
e (lp
s) A
vaila
ble
Lea
n di
scha
rge
(lps)
Req
uire
d
Lea
n di
scha
rge
(lps)
Ava
ilabl
e 2 140
233 2 70
233 280 117 140 59 70
No change in existing pumps in the year 2015 is envisaged, as the pumps installed in Phase –I, could have useful life up to year 2030; as from year 2015 onwards the flow is decreasing, hence no additional pumps are required. Augmentation / Rehabilitation Cost The total cost for construction of additional SPS at Morigate is Rs. 39.91 million including dedicated electrical feeders. Civil cost is Rs. 12.10 million and E&M cost is Rs. 12.57 million.
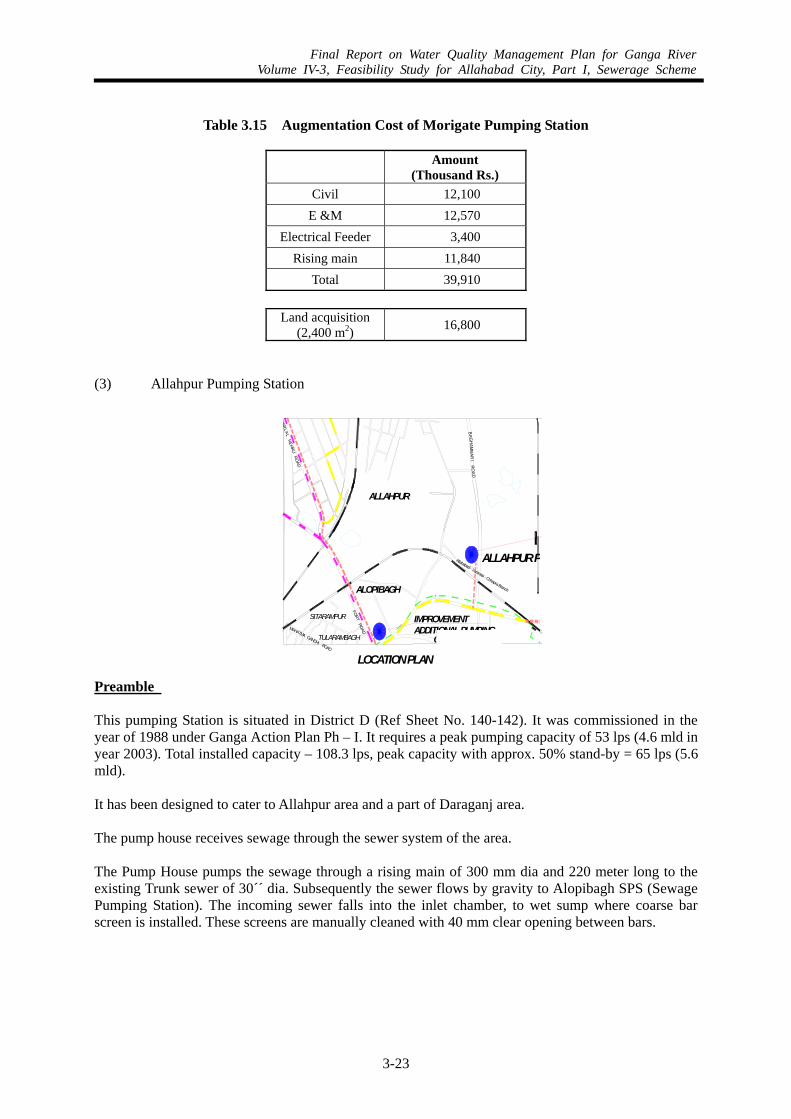
Final Report on Water Quality Management Plan for Ganga RiverVolume IV-3, Feasibility Study for Allahabad City, Part I, Sewerage Scheme
3-23
Table 3.15 Augmentation Cost of Morigate Pumping Station
Amount (Thousand Rs.)
Civil 12,100 E &M 12,570
Electrical Feeder 3,400 Rising main 11,840
Total 39,910
Land acquisition (2,400 m2) 16,800
(3) Allahpur Pumping Station
Preamble This pumping Station is situated in District D (Ref Sheet No. 140-142). It was commissioned in the year of 1988 under Ganga Action Plan Ph – I. It requires a peak pumping capacity of 53 lps (4.6 mld in year 2003). Total installed capacity – 108.3 lps, peak capacity with approx. 50% stand-by = 65 lps (5.6 mld). It has been designed to cater to Allahpur area and a part of Daraganj area. The pump house receives sewage through the sewer system of the area. The Pump House pumps the sewage through a rising main of 300 mm dia and 220 meter long to the existing Trunk sewer of 30´´ dia. Subsequently the sewer flows by gravity to Alopibagh SPS (Sewage Pumping Station). The incoming sewer falls into the inlet chamber, to wet sump where coarse bar screen is installed. These screens are manually cleaned with 40 mm clear opening between bars.
AHAR
LAL
NEHRU
ROAD
BAG
HAM
BA
RI
RO
AD
ALLAHPUR
ALOPIBAGH
SITARAMPUR
TULARAMBAGH
FORT
ROADMAHATMA GANDHI ROAD
Allahabad - Varanasi - Chhapra Branch
ALLAHPUR P
IMPROVEMENT ADDITIONAL PUMPING
OF 10 MLD
LOCATION PLAN
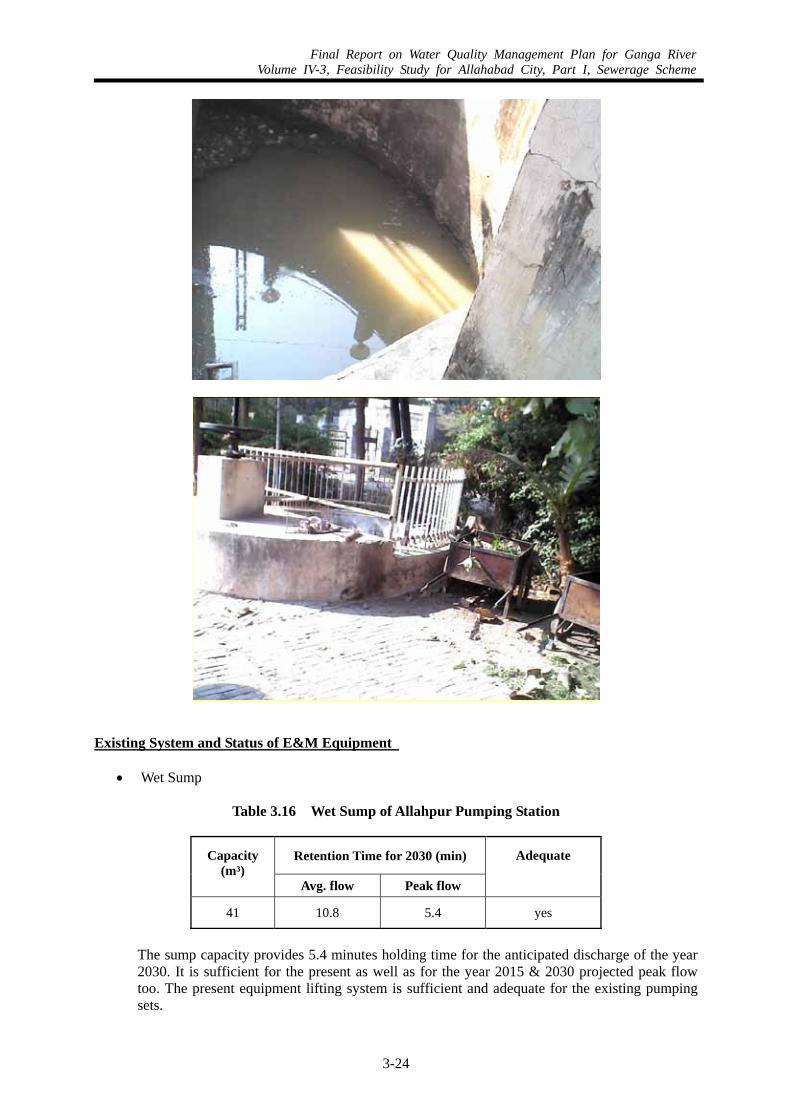
Final Report on Water Quality Management Plan for Ganga RiverVolume IV-3, Feasibility Study for Allahabad City, Part I, Sewerage Scheme
3-24
Existing System and Status of E&M Equipment
• Wet Sump
Table 3.16 Wet Sump of Allahpur Pumping Station
Retention Time for 2030 (min) Capacity (m³)
Avg. flow Peak flow
Adequate
41 10.8 5.4 yes
The sump capacity provides 5.4 minutes holding time for the anticipated discharge of the year 2030. It is sufficient for the present as well as for the year 2015 & 2030 projected peak flow too. The present equipment lifting system is sufficient and adequate for the existing pumping sets.
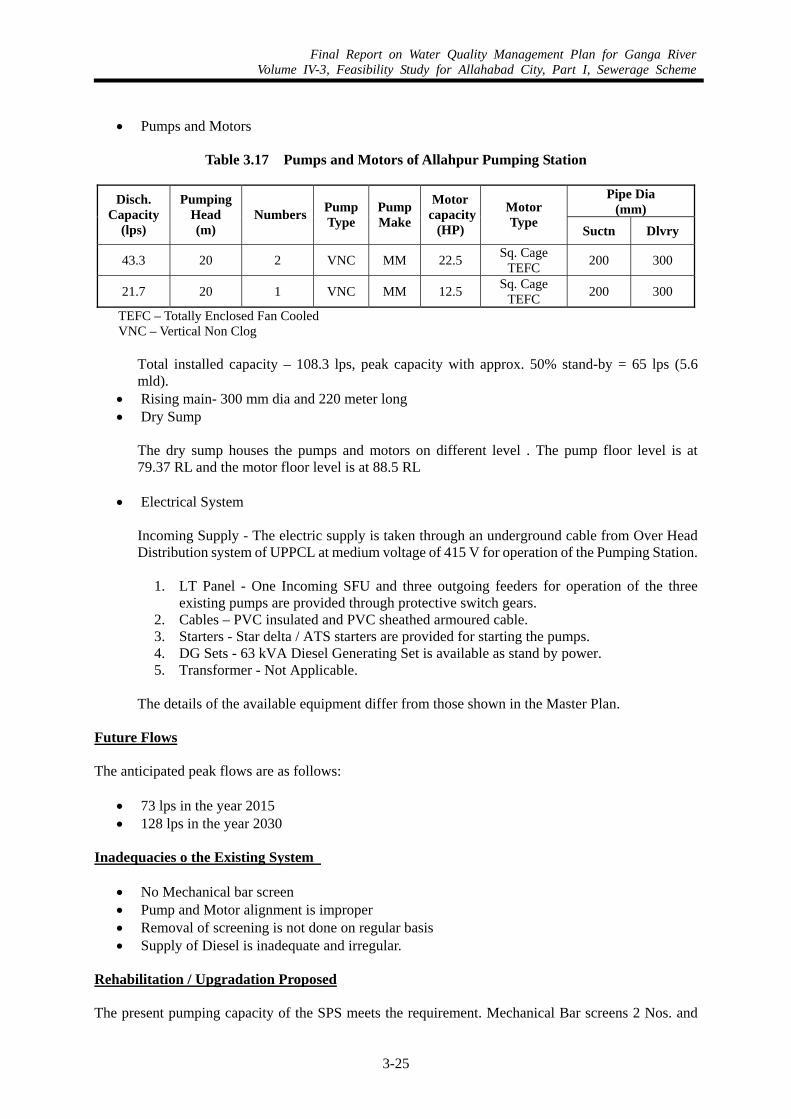
Final Report on Water Quality Management Plan for Ganga RiverVolume IV-3, Feasibility Study for Allahabad City, Part I, Sewerage Scheme
3-25
• Pumps and Motors
Table 3.17 Pumps and Motors of Allahpur Pumping Station
Pipe Dia
(mm) Disch.
Capacity (lps)
Pumping Head (m)
Numbers PumpType
Pump Make
Motor capacity
(HP)
Motor Type Suctn Dlvry
43.3 20 2 VNC MM 22.5 Sq. Cage TEFC 200 300
21.7 20 1 VNC MM 12.5 Sq. Cage TEFC 200 300
TEFC – Totally Enclosed Fan Cooled VNC – Vertical Non Clog
Total installed capacity – 108.3 lps, peak capacity with approx. 50% stand-by = 65 lps (5.6 mld).
• Rising main- 300 mm dia and 220 meter long • Dry Sump
The dry sump houses the pumps and motors on different level . The pump floor level is at 79.37 RL and the motor floor level is at 88.5 RL
• Electrical System
Incoming Supply - The electric supply is taken through an underground cable from Over Head Distribution system of UPPCL at medium voltage of 415 V for operation of the Pumping Station.
1. LT Panel - One Incoming SFU and three outgoing feeders for operation of the three
existing pumps are provided through protective switch gears. 2. Cables – PVC insulated and PVC sheathed armoured cable. 3. Starters - Star delta / ATS starters are provided for starting the pumps. 4. DG Sets - 63 kVA Diesel Generating Set is available as stand by power. 5. Transformer - Not Applicable.
The details of the available equipment differ from those shown in the Master Plan.
Future Flows The anticipated peak flows are as follows:
• 73 lps in the year 2015 • 128 lps in the year 2030
Inadequacies o the Existing System
• No Mechanical bar screen • Pump and Motor alignment is improper • Removal of screening is not done on regular basis • Supply of Diesel is inadequate and irregular.
Rehabilitation / Upgradation Proposed The present pumping capacity of the SPS meets the requirement. Mechanical Bar screens 2 Nos. and
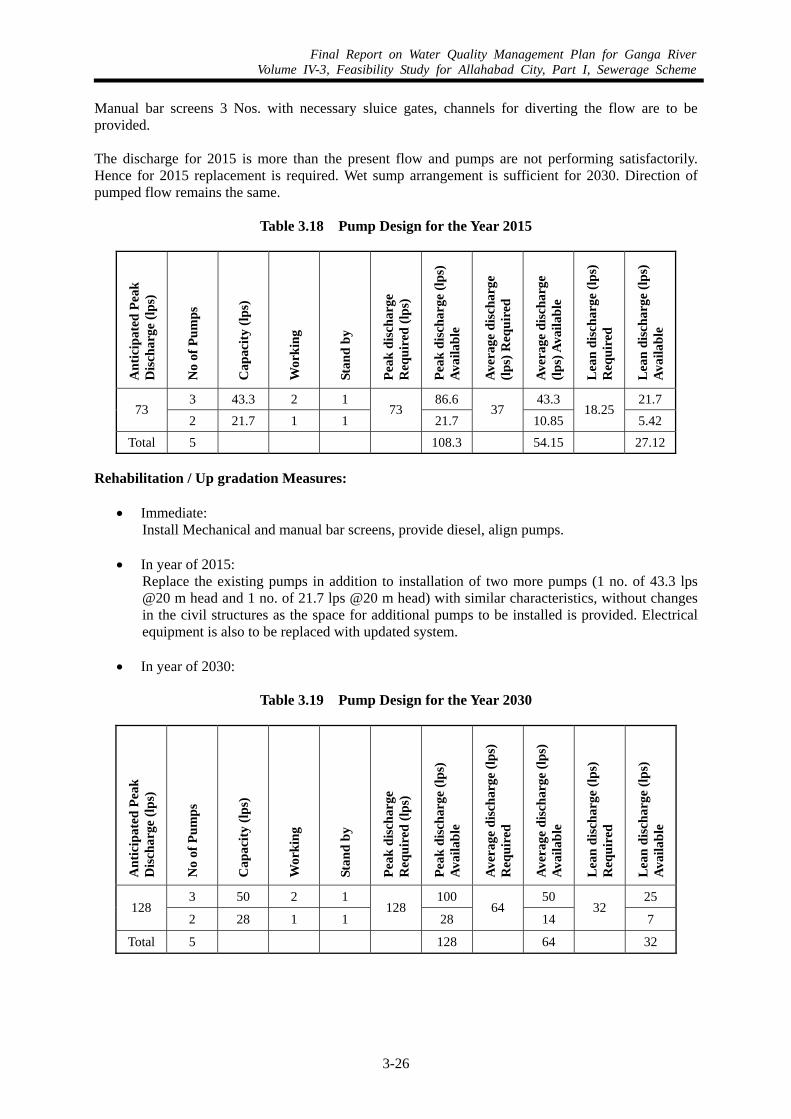
Final Report on Water Quality Management Plan for Ganga RiverVolume IV-3, Feasibility Study for Allahabad City, Part I, Sewerage Scheme
3-26
Manual bar screens 3 Nos. with necessary sluice gates, channels for diverting the flow are to be provided. The discharge for 2015 is more than the present flow and pumps are not performing satisfactorily. Hence for 2015 replacement is required. Wet sump arrangement is sufficient for 2030. Direction of pumped flow remains the same.
Table 3.18 Pump Design for the Year 2015
Ant
icip
ated
Pea
k D
isch
arge
(lps
)
No
of P
umps
Cap
acity
(lps
)
Wor
king
Stan
d by
Peak
dis
char
ge
Req
uire
d (lp
s)
Peak
dis
char
ge (l
ps)
Avai
labl
e
Aver
age
disc
harg
e (lp
s) R
equi
red
Aver
age
disc
harg
e (lp
s) A
vaila
ble
Lea
n di
scha
rge
(lps)
R
equi
red
Lea
n di
scha
rge
(lps)
Av
aila
ble
3 43.3 2 1 86.6 43.3 21.7 73
2 21.7 1 1 73
21.7 37
10.85 18.25
5.42 Total 5 108.3 54.15 27.12
Rehabilitation / Up gradation Measures:
• Immediate: Install Mechanical and manual bar screens, provide diesel, align pumps.
• In year of 2015:
Replace the existing pumps in addition to installation of two more pumps (1 no. of 43.3 lps @20 m head and 1 no. of 21.7 lps @20 m head) with similar characteristics, without changes in the civil structures as the space for additional pumps to be installed is provided. Electrical equipment is also to be replaced with updated system.
• In year of 2030:
Table 3.19 Pump Design for the Year 2030
Ant
icip
ated
Pea
k D
isch
arge
(lps
)
No
of P
umps
Cap
acity
(lps
)
Wor
king
Stan
d by
Peak
dis
char
ge
Req
uire
d (lp
s)
Peak
dis
char
ge (l
ps)
Avai
labl
e
Aver
age
disc
harg
e (lp
s)
Req
uire
d
Aver
age
disc
harg
e (lp
s)
Avai
labl
e
Lea
n di
scha
rge
(lps)
R
equi
red
Lea
n di
scha
rge
(lps)
Av
aila
ble
3 50 2 1 100 50 25 128
2 28 1 1 128
28 64
14 32
7
Total 5 128 64 32
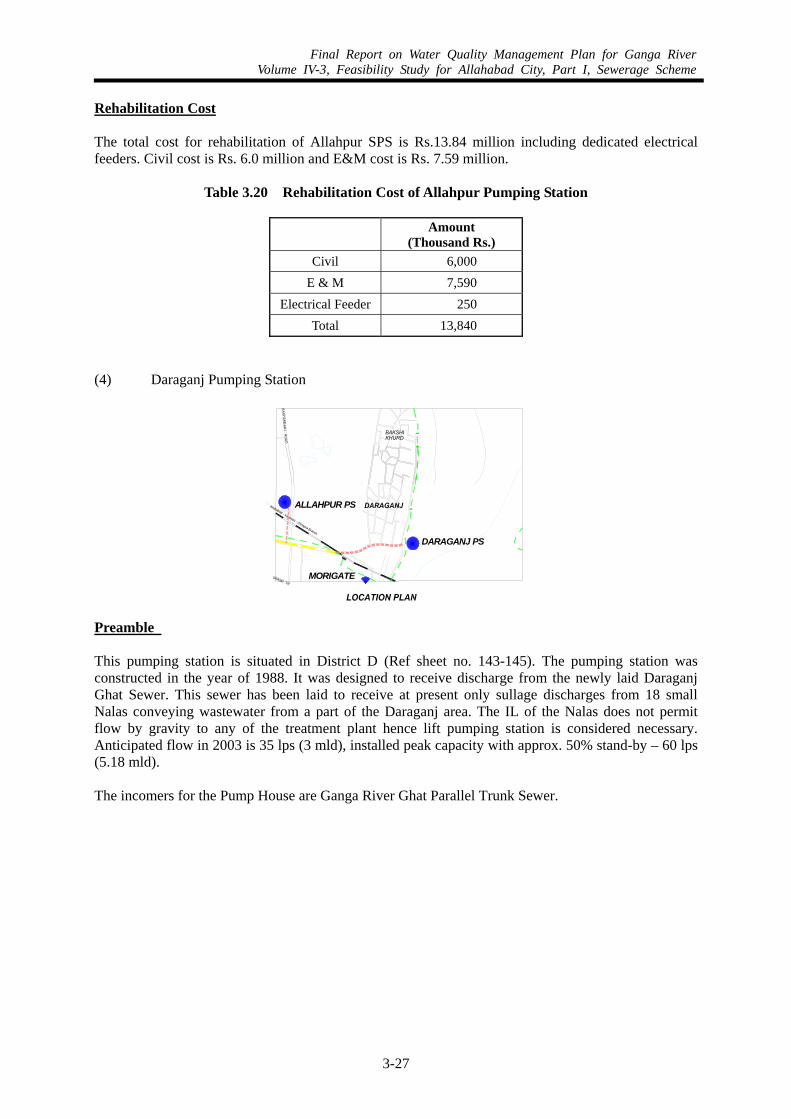
Final Report on Water Quality Management Plan for Ganga RiverVolume IV-3, Feasibility Study for Allahabad City, Part I, Sewerage Scheme
3-27
Rehabilitation Cost The total cost for rehabilitation of Allahpur SPS is Rs.13.84 million including dedicated electrical feeders. Civil cost is Rs. 6.0 million and E&M cost is Rs. 7.59 million.
Table 3.20 Rehabilitation Cost of Allahpur Pumping Station
Amount (Thousand Rs.)
Civil 6,000 E & M 7,590
Electrical Feeder 250 Total 13,840
(4) Daraganj Pumping Station
BAG
HAM
BA
RI
RO
AD
GRAND TR
Allahabad - Varanasi - Chhapra Branch
MORIGATE
ALLAHPUR PS
DARAGANJ PS
Preamble This pumping station is situated in District D (Ref sheet no. 143-145). The pumping station was constructed in the year of 1988. It was designed to receive discharge from the newly laid Daraganj Ghat Sewer. This sewer has been laid to receive at present only sullage discharges from 18 small Nalas conveying wastewater from a part of the Daraganj area. The IL of the Nalas does not permit flow by gravity to any of the treatment plant hence lift pumping station is considered necessary. Anticipated flow in 2003 is 35 lps (3 mld), installed peak capacity with approx. 50% stand-by – 60 lps (5.18 mld). The incomers for the Pump House are Ganga River Ghat Parallel Trunk Sewer.
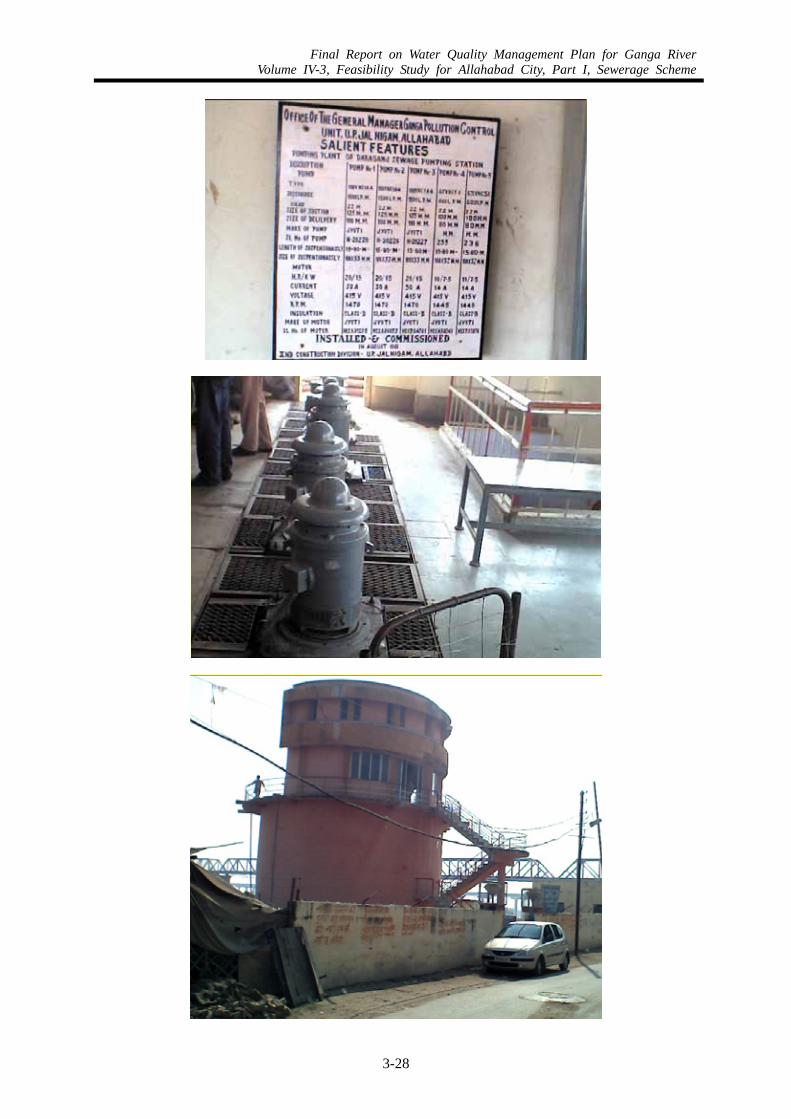
Final Report on Water Quality Management Plan for Ganga RiverVolume IV-3, Feasibility Study for Allahabad City, Part I, Sewerage Scheme
3-28
Final Report on Water Quality Management Plan for Ganga RiverVolume IV-3, Feasibility Study for Allahabad City, Part I, Sewerage Scheme
3-29
Existing System and Status of E&M Equipment The motors are installed above the H.F.L level of 88.5 m through extended shafts.
• Wet Sump
Table 3.21 Wet Sump of Daraganj Pumping Station
Retention Time for 2030 (Minutes) Capacity
(m³) Avg. flow Peak flow Adequate
25.83 8.8 4.4 Almost OK
The sump capacity and hydraulic retention time is almost sufficient for the present as well as for the year 2015 & 2030 projected peak flow. The present equipment lifting system is sufficient and adequate for the existing pumping sets.
• Pumps and Motors
Table 3.22 Pumps and Motors of Daraganj Pumping Station
Numbers Pipe Dia (mm)
Disch. Capacity
(lps )
Pumping Head (m) Wrkg Std By
Pump Type
Pump Make
Motor capacity
(kW)
Motor Type
Suctn Dlvry
25 22 2 1 VNC Jyoti 15 Sq. Cage TEFC 125 100
10 22 1 1 VNC MM 7.5 Sq. Cage TEFC 100 80
TEFC – Totally Enclosed Fan Cooled VNC – Vertical Non Clog
Total installed capacity – 95 lps, peak capacity with approx 50% stand-by – 60 lps (5.18 mld).
• Rising main 200 mm • Dry Sump
The dry sump houses the pumps and motors on (different) level. The pump floor level is at 73.00 R.L. and the motor floor level is at 89.20 R.L.
• Electrical System
1) Incoming Supply - The electric supply is taken through an underground cable from Over Head Distribution system of UPPCL at medium voltage of 415 V for operation of the Pumping Station.
2) LT Panel - One Incoming SFU and five outgoing feeders for operation of the five existing pumps are provided through protective switchgears.
3) Cables – PVC insulated and PVC sheathed armoured cable. 4) Starters - Star delta / ATS starters are provided for starting the pumps. 5) DG set - 63 kVA Diesel Generating Set is available as stand by power. 6) Three Nos liquid starters and 2 Nos. manual star delta starters
Future Flows
Final Report on Water Quality Management Plan for Ganga RiverVolume IV-3, Feasibility Study for Allahabad City, Part I, Sewerage Scheme
3-30
Anticipated peak flows that this pumping station will receive are :
• 56 lps in the year 2015 • 98 lps in the year 2030
Inadequacies of the Existing System The present sump capacity is sufficient for present flows and slightly undersized for ultimate peak flows.
• No Mechanical bar screen • Removal of screening is not done on regular basis • Supply of Diesel is inadequate and irregular. • Pump and Motor alignment is improper
Rehabilitation / Upgradation Proposed The present capacities of the SPS meet the requirement. The sump capacity must be enhanced to meet the peak sewage discharge in the year of 2015. Mechanical Bar screens 2 Nos. and Manual bar screens 3 Nos. with necessary sluice gates, channels for diverting the flow are to be provided. The sullage to be trapped from the open Nalas to the newly laid Daraganj sewer gradually will necessitate enhancing the capacity on the basis of 2030 AD and the pumps shall have to be replaced. The installed capacity is considered adequate for 2015 AD, hence it is not to be increased. Although the Electrical and mechanical equipment has outlived its useful life, but their operation is still trouble free. Now it is proposed to divert the flow to Alopibagh for further treatment at proposed Rajapur STP.
Table 3.23 Pump Design for the Year 2015
• Immediate:
Mechanical Works: Following items are to be installed
1) Mechanical Fine Bar Screen 640 mm wide - 2 Nos. 2) Manual Coarse Bar Screen 650 mm wide - 2 Nos. 3) Sluice Gates 600 x 600 - 3 Nos. 4) Sluice Gates 650 x 650 - 2 Nos.
• Civil Works
Ant
icip
ated
Pea
k D
isch
arge
(lps
)
No
of P
umps
Cap
acity
(lps
)
Wor
king
Stan
d by
Peak
dis
char
ge
Req
uire
d
Peak
dis
char
ge (l
ps)
Avai
labl
e
Aver
age
disc
harg
e (lp
s)
Req
uire
d
Aver
age
disc
harg
e (lp
s)
Avai
labl
e
Lea
n di
scha
rge
(lps)
R
equi
red
Lea
n di
scha
rge
(lps)
Av
aila
ble
3 25 2 1 50 25 12.5 56
2 10 1 1 10 10 5 Total 5
56 60
28 35
14 17.5
Final Report on Water Quality Management Plan for Ganga RiverVolume IV-3, Feasibility Study for Allahabad City, Part I, Sewerage Scheme
3-31
Wet sump has retention capacity for 4.4 minutes, based on the projected peak flow in the year 2030, which is slightly undersized for ultimate peak discharge; hence it can serve the purpose. To house mechanical bar screens and manual bar screen; necessary channel shall have to be constructed.
• In year of 2030:
Table 3.24 Design for the Year 2030
Ant
icip
ated
Pea
k D
isch
arge
(lps
)
No
of P
umps
Cap
acity
(lps
)
Wor
king
Stan
d by
Peak
dis
char
ge
Req
uire
d
Peak
dis
char
ge (l
ps)
Avai
labl
e
Aver
age
disc
harg
e (lp
s)
Req
uire
d
Aver
age
disc
harg
e (lp
s)
Avai
labl
e
Lea
n di
scha
rge
(lps)
R
equi
red
Lea
n di
scha
rge
(lps)
Av
aila
ble
3 40 2 1 98 80 39 40 19 5 98
2 20 1 1 - 20 - - - - Total 5 5 98 100 39 40 20
Rehabilitation Cost The total cost for rehabilitation of Daraganj SPS is Rs. 10.51 million including dedicated electrical feeders. Civil cost is Rs. 2.50 million and E&M cost is Rs. 7.76 million.
Table 3.25 Rehabilitation Cost of Daraganj Pumping Station
Amount (Thousand Rs.)
Civil 2,500 E & M 7,760
Electrical Feeder 250 Total 10,510
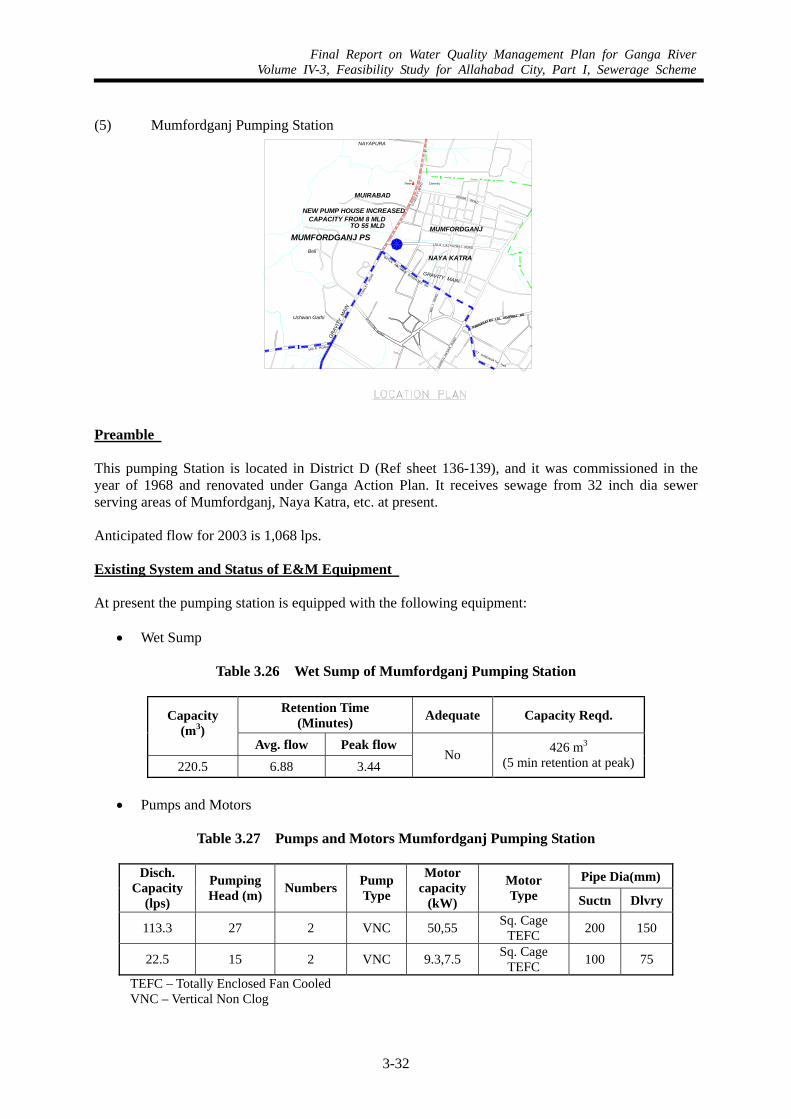
Final Report on Water Quality Management Plan for Ganga RiverVolume IV-3, Feasibility Study for Allahabad City, Part I, Sewerage Scheme
3-32
(5) Mumfordganj Pumping Station
MISS ION
ROAD
MUI R ROAD
JA
RAMNARAYAN LAL AGARWAL RD
ZAHR
UL
HASA
NRO
AD
NAYAPURA
MUIRABAD
Beli
Uchwan Garhi
HR
STAN
LEY
ROAD
MUMFORDGANJ
NAYA KATRA
AKBAR I ROAD
BATUKKR I SHNA
BANERJEERD
LALA LAJPATRA I ROAD
BE
LI
ROAD
RAMNARAYAN LAL AGARWAL RD
Cemetry
STA
NLE
YRO
AD
StPeter
MUMFORDGANJ PS
NEW PUMP HOUSE INCREASED CAPACITY FROM 8 MLD
TO 55 MLD
GRA
VITY
MAI
N
GRAVITY MAIN
PT GANGANATHH
Preamble This pumping Station is located in District D (Ref sheet 136-139), and it was commissioned in the year of 1968 and renovated under Ganga Action Plan. It receives sewage from 32 inch dia sewer serving areas of Mumfordganj, Naya Katra, etc. at present.
Anticipated flow for 2003 is 1,068 lps. Existing System and Status of E&M Equipment At present the pumping station is equipped with the following equipment:
• Wet Sump
Table 3.26 Wet Sump of Mumfordganj Pumping Station
Retention Time (Minutes) Adequate Capacity Reqd. Capacity
(m3) Avg. flow Peak flow
220.5 6.88 3.44 No 426 m3
(5 min retention at peak)
• Pumps and Motors
Table 3.27 Pumps and Motors Mumfordganj Pumping Station
Pipe Dia(mm)Disch. Capacity
(lps)
Pumping Head (m) Numbers Pump
Type
Motor capacity
(kW)
Motor Type Suctn Dlvry
113.3 27 2 VNC 50,55 Sq. Cage TEFC 200 150
22.5 15 2 VNC 9.3,7.5 Sq. Cage TEFC 100 75
TEFC – Totally Enclosed Fan Cooled VNC – Vertical Non Clog
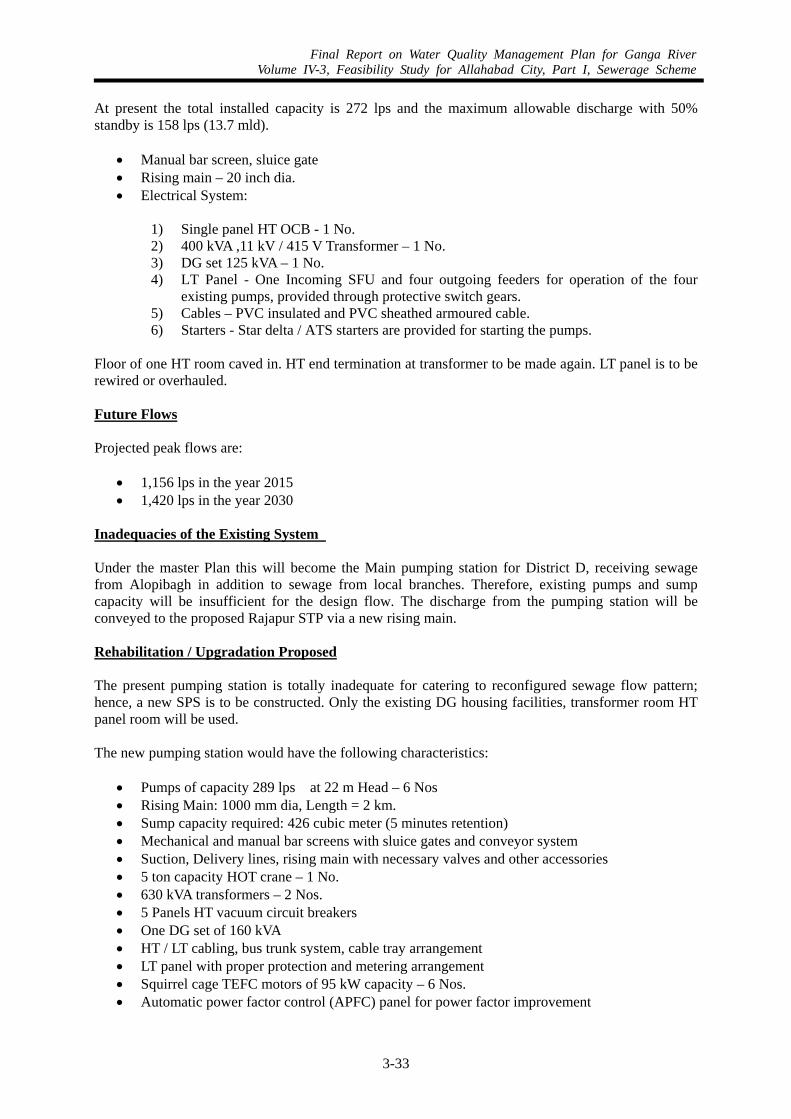
Final Report on Water Quality Management Plan for Ganga RiverVolume IV-3, Feasibility Study for Allahabad City, Part I, Sewerage Scheme
3-33
At present the total installed capacity is 272 lps and the maximum allowable discharge with 50% standby is 158 lps (13.7 mld).
• Manual bar screen, sluice gate • Rising main – 20 inch dia. • Electrical System:
1) Single panel HT OCB - 1 No. 2) 400 kVA ,11 kV / 415 V Transformer – 1 No. 3) DG set 125 kVA – 1 No. 4) LT Panel - One Incoming SFU and four outgoing feeders for operation of the four
existing pumps, provided through protective switch gears. 5) Cables – PVC insulated and PVC sheathed armoured cable. 6) Starters - Star delta / ATS starters are provided for starting the pumps.
Floor of one HT room caved in. HT end termination at transformer to be made again. LT panel is to be rewired or overhauled. Future Flows Projected peak flows are:
• 1,156 lps in the year 2015 • 1,420 lps in the year 2030
Inadequacies of the Existing System Under the master Plan this will become the Main pumping station for District D, receiving sewage from Alopibagh in addition to sewage from local branches. Therefore, existing pumps and sump capacity will be insufficient for the design flow. The discharge from the pumping station will be conveyed to the proposed Rajapur STP via a new rising main. Rehabilitation / Upgradation Proposed The present pumping station is totally inadequate for catering to reconfigured sewage flow pattern; hence, a new SPS is to be constructed. Only the existing DG housing facilities, transformer room HT panel room will be used. The new pumping station would have the following characteristics:
• Pumps of capacity 289 lps at 22 m Head – 6 Nos • Rising Main: 1000 mm dia, Length = 2 km. • Sump capacity required: 426 cubic meter (5 minutes retention) • Mechanical and manual bar screens with sluice gates and conveyor system • Suction, Delivery lines, rising main with necessary valves and other accessories • 5 ton capacity HOT crane – 1 No. • 630 kVA transformers – 2 Nos. • 5 Panels HT vacuum circuit breakers • One DG set of 160 kVA • HT / LT cabling, bus trunk system, cable tray arrangement • LT panel with proper protection and metering arrangement • Squirrel cage TEFC motors of 95 kW capacity – 6 Nos. • Automatic power factor control (APFC) panel for power factor improvement
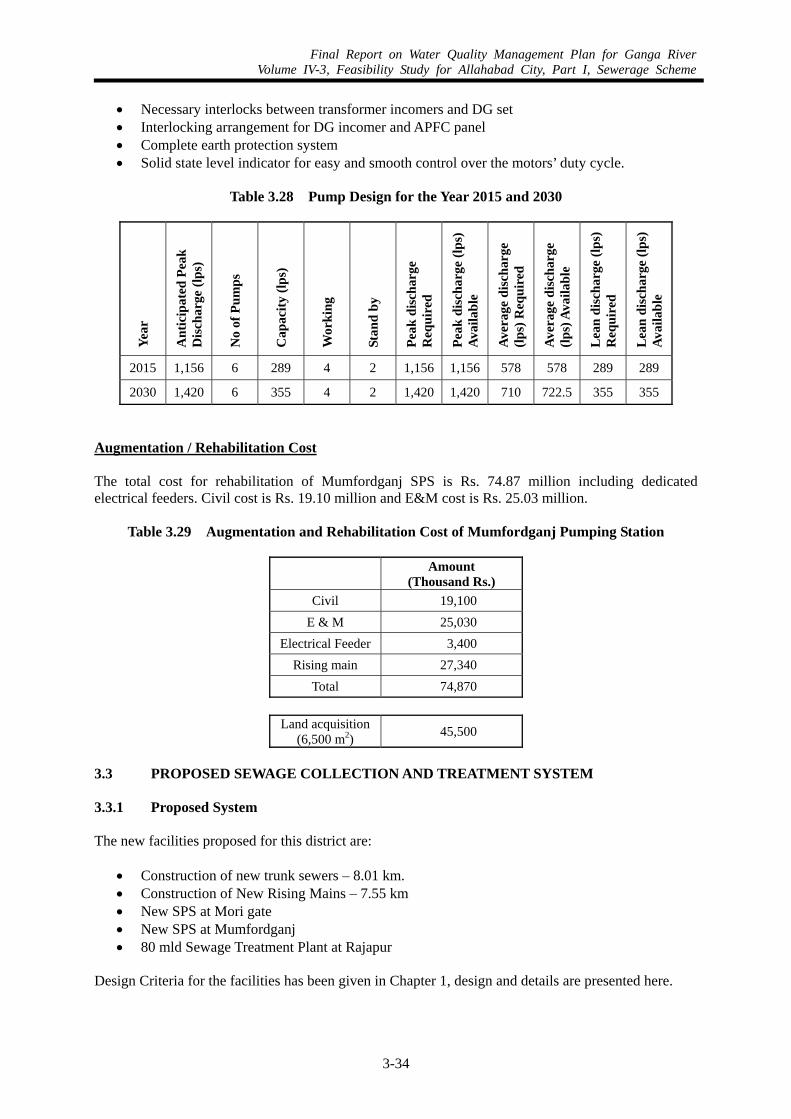
Final Report on Water Quality Management Plan for Ganga RiverVolume IV-3, Feasibility Study for Allahabad City, Part I, Sewerage Scheme
3-34
• Necessary interlocks between transformer incomers and DG set • Interlocking arrangement for DG incomer and APFC panel • Complete earth protection system • Solid state level indicator for easy and smooth control over the motors’ duty cycle.
Table 3.28 Pump Design for the Year 2015 and 2030
Year
Ant
icip
ated
Pea
k D
isch
arge
(lps
)
No
of P
umps
Cap
acity
(lps
)
Wor
king
Stan
d by
Peak
dis
char
ge
Req
uire
d
Peak
dis
char
ge (l
ps)
Avai
labl
e
Aver
age
disc
harg
e (lp
s) R
equi
red
Aver
age
disc
harg
e (lp
s) A
vaila
ble
Lea
n di
scha
rge
(lps)
R
equi
red
Lea
n di
scha
rge
(lps)
Av
aila
ble
2015 1,156 6 289 4 2 1,156 1,156 578 578 289 289
2030 1,420 6 355 4 2 1,420 1,420 710 722.5 355 355
Augmentation / Rehabilitation Cost The total cost for rehabilitation of Mumfordganj SPS is Rs. 74.87 million including dedicated electrical feeders. Civil cost is Rs. 19.10 million and E&M cost is Rs. 25.03 million.
Table 3.29 Augmentation and Rehabilitation Cost of Mumfordganj Pumping Station
Amount (Thousand Rs.)
Civil 19,100 E & M 25,030
Electrical Feeder 3,400 Rising main 27,340
Total 74,870
Land acquisition(6,500 m2) 45,500
3.3 PROPOSED SEWAGE COLLECTION AND TREATMENT SYSTEM 3.3.1 Proposed System The new facilities proposed for this district are:
• Construction of new trunk sewers – 8.01 km. • Construction of New Rising Mains – 7.55 km • New SPS at Mori gate • New SPS at Mumfordganj • 80 mld Sewage Treatment Plant at Rajapur
Design Criteria for the facilities has been given in Chapter 1, design and details are presented here.
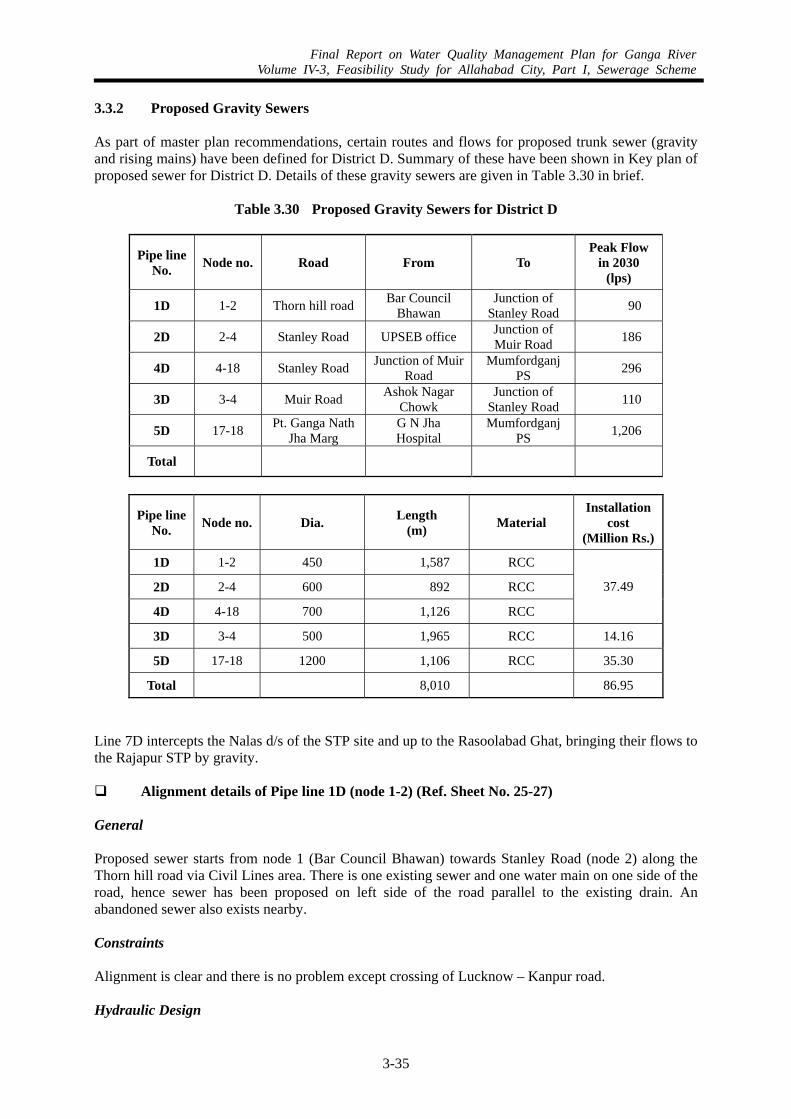
Final Report on Water Quality Management Plan for Ganga RiverVolume IV-3, Feasibility Study for Allahabad City, Part I, Sewerage Scheme
3-35
3.3.2 Proposed Gravity Sewers As part of master plan recommendations, certain routes and flows for proposed trunk sewer (gravity and rising mains) have been defined for District D. Summary of these have been shown in Key plan of proposed sewer for District D. Details of these gravity sewers are given in Table 3.30 in brief.
Table 3.30 Proposed Gravity Sewers for District D
Pipe line No. Node no. Road From To
Peak Flow in 2030
(lps)
1D 1-2 Thorn hill road Bar Council Bhawan
Junction of Stanley Road 90
2D 2-4 Stanley Road UPSEB office Junction of Muir Road 186
4D 4-18 Stanley Road Junction of Muir Road
Mumfordganj PS 296
3D 3-4 Muir Road Ashok Nagar Chowk
Junction of Stanley Road 110
5D 17-18 Pt. Ganga Nath Jha Marg
G N Jha Hospital
Mumfordganj PS 1,206
Total
Pipe line No. Node no. Dia. Length
(m) Material Installation
cost (Million Rs.)
1D 1-2 450 1,587 RCC
2D 2-4 600 892 RCC
4D 4-18 700 1,126 RCC
37.49
3D 3-4 500 1,965 RCC 14.16
5D 17-18 1200 1,106 RCC 35.30
Total 8,010 86.95
Line 7D intercepts the Nalas d/s of the STP site and up to the Rasoolabad Ghat, bringing their flows to the Rajapur STP by gravity. Alignment details of Pipe line 1D (node 1-2) (Ref. Sheet No. 25-27)
General Proposed sewer starts from node 1 (Bar Council Bhawan) towards Stanley Road (node 2) along the Thorn hill road via Civil Lines area. There is one existing sewer and one water main on one side of the road, hence sewer has been proposed on left side of the road parallel to the existing drain. An abandoned sewer also exists nearby. Constraints Alignment is clear and there is no problem except crossing of Lucknow – Kanpur road. Hydraulic Design
Final Report on Water Quality Management Plan for Ganga RiverVolume IV-3, Feasibility Study for Allahabad City, Part I, Sewerage Scheme
3-36
The sewer has been designed for a maximum peak flow of 90 lps. Diameter of the pipe is 450 mm and slope is 1 in 500. Detailed SEWERCAD data output and analysis has been given in Annexure 1.3.1. Depth of Sewer Detailed description of sewer and manholes has been given in Annexure 1.3.2 and 1.3.3. Alignment details of Pipe line 2D (node 2-4) (Ref. Sheet No. 27-29)
General Proposed sewer starts from node 2 (UPPCL office) at Stanley Road, where it crosses Stanley road and comes on the right side of the road. Further the sewer has been proposed on right side of the Stanley road up to Mauhal chowk where it crosses the Stanley road and comes on left side as there are two existing services on right side of the road, one is existing water main of 10” dia and other is OFC cable. Finally, it ends at the junction of Muir road along Stanley road. Constraints Alignment is clear and there is not any problem except two major crossings as described above. Hydraulic Design The sewer has been designed for a maximum peak flow of 186 lps. Diameter of the pipe is 600 mm and slope is 1 in 500. Detailed SEWERCAD data output and analysis has been given in Annexure 1.3.1. Depth of Sewer Detailed description of sewer and manholes has been given in Annexure 1.3.2 and 1.3.3. Alignment details of Pipe line 3D (node 3-4) (Ref. Sheet No. 31-34)
General Proposed sewer starts from (node 3) Ashok Nagar Chowk at Muir Road near Yogendra Puri Colony and has been proposed on left side of the road, as there are two existing services on right side of the road, one is existing water main and other is OFC cable. The pipe line passes through Railway Colony, Maa Kali Temple, Traffic Police Line and finally ends at node 4 at Junction of Stanley road. Constraints Alignment is clear and there is no problem except for some part of the reach from ch. 900 m to ch. 1500 m, which is slightly congested. Hydraulic Design The sewer has been designed for a maximum peak flow of 110 lps. Diameter of the pipe is 500 mm and slope is 1 in 700. Detailed SEWERCAD data output and analysis has been given in Annexure 1.3.4.
Final Report on Water Quality Management Plan for Ganga RiverVolume IV-3, Feasibility Study for Allahabad City, Part I, Sewerage Scheme
3-37
Depth of Sewer Detailed description of sewer and manholes has been given in Annexure 1.3.5 and 1.3.6. Alignment details of Pipe line 4D (node 4-18) (Ref. Sheet No. 29-30)
General From (node 4), the trunk main has been proposed up to Mumfordganj PS (node 18). Trunk sewer has been proposed on left side of the Stanley road as there are two existing services on right side of the road, one is existing water main and other is OFC cable. The sewer passes through Traffic Police Line area, Katchery road, Tej Bahadur Sapru Hospital, Allahabad Bible Seminary and finally ends at Mumfordganj Raw Sewage Pumping Station. Constraints There is no major constraint however the sewer terminates at the inlet of new proposed pumping station at Mumfordganj, hence it has been designed accordingly. Hydraulic Design The sewer has been designed for a maximum peak flow of 296 lps. Diameter of the pipe is 700 mm and slope is 1 in 500. Detailed SEWERCAD data output and analysis has been given in Annexure 1.3.1. Depth of Sewer Detailed description of sewer and manholes has been given in Annexure 1.3.2 and 1.3.3. Alignment details of Pipe line 5D (node 17-18) (Ref. Sheet No. 35-37)
General The proposed sewer is an extension of the rising main from Alopibagh to Mumfordganj Pumping station. Since this point (ch. 3100 m) near G N Jha Hospital (node 17) is a ridge point of this pipe line hence rising main from Alopibagh discharges to the receiving chamber at this point. Further sewage from this point is carried to the Mumfordganj PS (node 18) by gravity. Trunk sewer has been proposed on left side of the road, which passes through the premises of Pump house at ch. 3500 m as there is no space because of existing rising main on other side of the road that is to be abandoned by renovating the Mumfordganj PS. Constraints The pipe line is to pass through existing pump house premises as described. In addition, the other major constraint is the intersection of Bali Road, where the pipe crosses the Krishna Bannered mar and pipe comes to right side of the road as the existing rising main has been laid on left side onwards. Finally the proposed sewer terminates at the inlet of new proposed pumping station at Mumfordganj; hence it has been designed accordingly Hydraulic Design
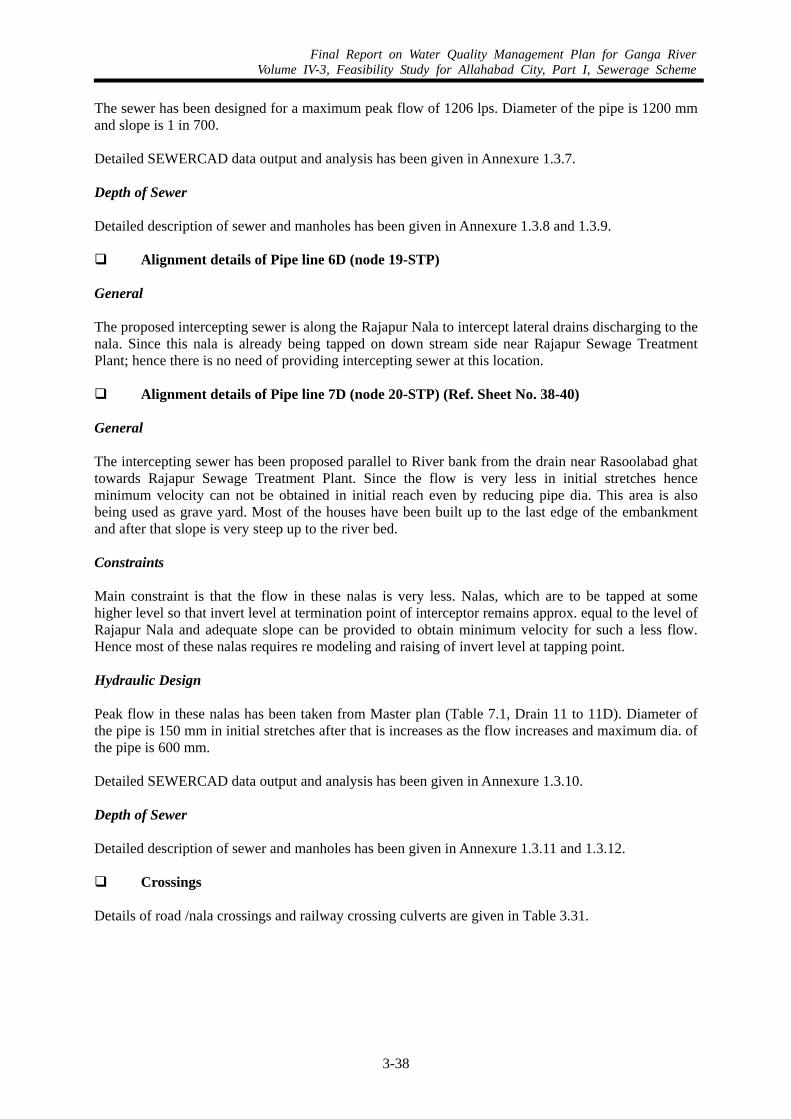
Final Report on Water Quality Management Plan for Ganga RiverVolume IV-3, Feasibility Study for Allahabad City, Part I, Sewerage Scheme
3-38
The sewer has been designed for a maximum peak flow of 1206 lps. Diameter of the pipe is 1200 mm and slope is 1 in 700. Detailed SEWERCAD data output and analysis has been given in Annexure 1.3.7. Depth of Sewer Detailed description of sewer and manholes has been given in Annexure 1.3.8 and 1.3.9. Alignment details of Pipe line 6D (node 19-STP)
General The proposed intercepting sewer is along the Rajapur Nala to intercept lateral drains discharging to the nala. Since this nala is already being tapped on down stream side near Rajapur Sewage Treatment Plant; hence there is no need of providing intercepting sewer at this location. Alignment details of Pipe line 7D (node 20-STP) (Ref. Sheet No. 38-40)
General The intercepting sewer has been proposed parallel to River bank from the drain near Rasoolabad ghat towards Rajapur Sewage Treatment Plant. Since the flow is very less in initial stretches hence minimum velocity can not be obtained in initial reach even by reducing pipe dia. This area is also being used as grave yard. Most of the houses have been built up to the last edge of the embankment and after that slope is very steep up to the river bed. Constraints Main constraint is that the flow in these nalas is very less. Nalas, which are to be tapped at some higher level so that invert level at termination point of interceptor remains approx. equal to the level of Rajapur Nala and adequate slope can be provided to obtain minimum velocity for such a less flow. Hence most of these nalas requires re modeling and raising of invert level at tapping point. Hydraulic Design Peak flow in these nalas has been taken from Master plan (Table 7.1, Drain 11 to 11D). Diameter of the pipe is 150 mm in initial stretches after that is increases as the flow increases and maximum dia. of the pipe is 600 mm. Detailed SEWERCAD data output and analysis has been given in Annexure 1.3.10. Depth of Sewer Detailed description of sewer and manholes has been given in Annexure 1.3.11 and 1.3.12. Crossings
Details of road /nala crossings and railway crossing culverts are given in Table 3.31.
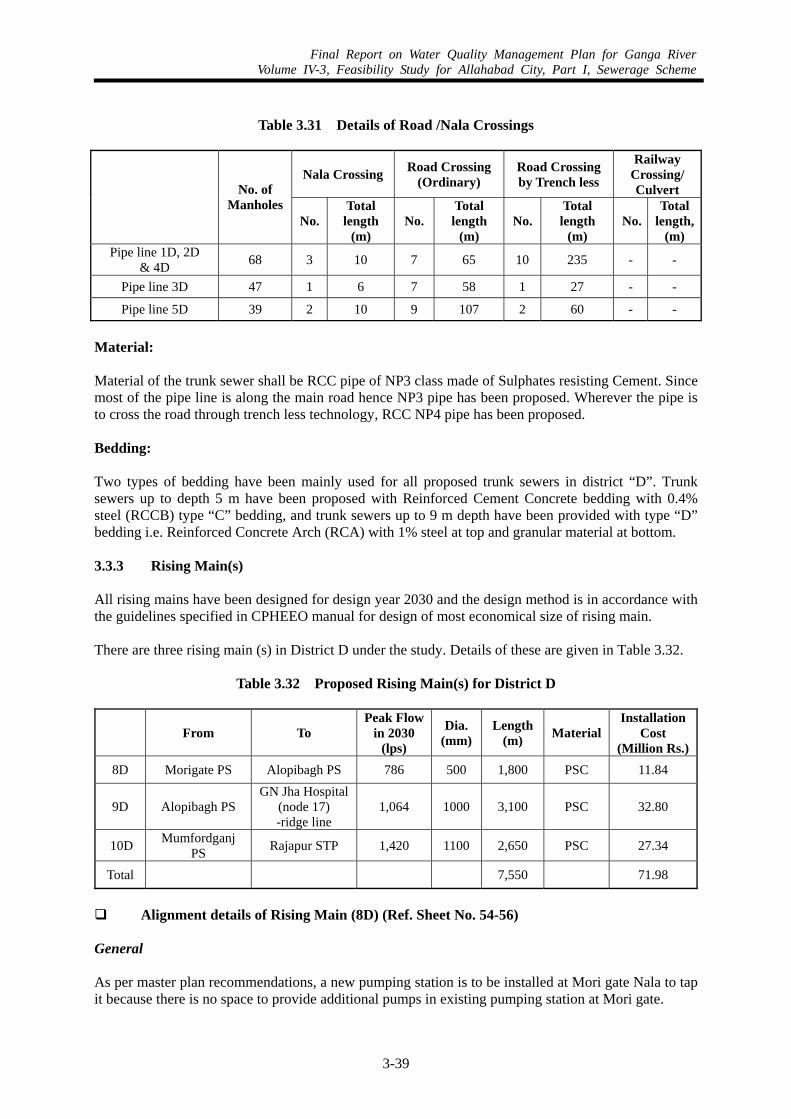
Final Report on Water Quality Management Plan for Ganga RiverVolume IV-3, Feasibility Study for Allahabad City, Part I, Sewerage Scheme
3-39
Table 3.31 Details of Road /Nala Crossings
Nala Crossing Road Crossing (Ordinary)
Road Crossing by Trench less
Railway Crossing/ Culvert
No. of
Manholes No.
Total length
(m) No.
Total length
(m) No.
Total length
(m) No.
Total length,
(m) Pipe line 1D, 2D
& 4D 68 3 10 7 65 10 235 - -
Pipe line 3D 47 1 6 7 58 1 27 - -
Pipe line 5D 39 2 10 9 107 2 60 - -
Material: Material of the trunk sewer shall be RCC pipe of NP3 class made of Sulphates resisting Cement. Since most of the pipe line is along the main road hence NP3 pipe has been proposed. Wherever the pipe is to cross the road through trench less technology, RCC NP4 pipe has been proposed. Bedding: Two types of bedding have been mainly used for all proposed trunk sewers in district “D”. Trunk sewers up to depth 5 m have been proposed with Reinforced Cement Concrete bedding with 0.4% steel (RCCB) type “C” bedding, and trunk sewers up to 9 m depth have been provided with type “D” bedding i.e. Reinforced Concrete Arch (RCA) with 1% steel at top and granular material at bottom. 3.3.3 Rising Main(s) All rising mains have been designed for design year 2030 and the design method is in accordance with the guidelines specified in CPHEEO manual for design of most economical size of rising main. There are three rising main (s) in District D under the study. Details of these are given in Table 3.32.
Table 3.32 Proposed Rising Main(s) for District D
From To Peak Flow
in 2030 (lps)
Dia. (mm)
Length (m) Material
InstallationCost
(Million Rs.)8D Morigate PS Alopibagh PS 786 500 1,800 PSC 11.84
9D Alopibagh PS GN Jha Hospital
(node 17) -ridge line
1,064 1000 3,100 PSC 32.80
10D Mumfordganj PS Rajapur STP 1,420 1100 2,650 PSC 27.34
Total 7,550 71.98
Alignment details of Rising Main (8D) (Ref. Sheet No. 54-56)
General As per master plan recommendations, a new pumping station is to be installed at Mori gate Nala to tap it because there is no space to provide additional pumps in existing pumping station at Mori gate.
Final Report on Water Quality Management Plan for Ganga RiverVolume IV-3, Feasibility Study for Allahabad City, Part I, Sewerage Scheme
3-40
Rising main has been proposed along the nala in initial stretches (ch. 1639 m - ch. 1150 m) after that it crosses National high way no. 2, below the Shastri Bridge. Again it is parallel to the nala up to ch. 900 m where it crosses Sangam road and the nala also. After that pipe line has been proposed on left side of the road up to ch. 400 m where it crosses one nala and the road leads to Fort. Since there are two services on right side of the road, one is OFC cable and other is PSC water main (500 mm dia.) hence it is necessary to cross the road. After crossing this road pipe line has been proposed on left side of this road up to Alopibagh pumping station Constraints There is no problem in this alignment except the nala crossings and road crossings as defined above. However this rising main terminates at the inlet chamber of proposed augmentation at Alopibagh Raw Sewage Pumping Station. Invert level of this receiving chamber has been kept designed such that invert level of the proposed additional sump will be same as of existing sump. Hydraulic Design As per design, the required size:
Diameter – 500 mm Length – 1,800 m Material – PSC
Minimum cover for laying of the rising main has been considered as 1.5 m from the ground level. Alignment details of Rising Main (9D) (Ref. Sheet No. 57-62)
General Presently sewage from the Alopibagh is discharged towards Gaughat Raw Sewage Pumping Station. However, as per master plan recommendation this sewage has to be carried out towards Mumfordganj Raw Sewage Pumping Station and ultimately to Rajapur STP. Accordingly rising main has been proposed from Augmented Alopibagh pumping station, parallel to Bahraini road and further parallel to Jawaharlal All Nehru Marg towards Mumfordganj PS. Rising main passes through Tulare Baugh, Tag ore town, Blazon chowk, Indian Press Chowk, An and Bhawan, D J hostel and Allahabad university. Rising main is parallel to Jawaharlal Lal Nehru Marg up to LIC road. Further there are two water mains and one existing brick sewer on right side hence it has been kept on the left side again up to G N Jha hostel at Pt. Ganga Nath Jha Marg where it terminates to the receiving man hole at ch. 3100m. Constraints There are under ground water mains, drains and existing sewers on both sides of Jawaharlal All Nehru mar. Further there are two Railway embankments which are to be crossed at ch. 550 m and ch. 825 m. Further there are two major crossing at Blazon chowk and Indian Press chowk which are to be taken care of while executing the work. In addition to these there are some important roads, which are required to be crossed by trench less technology. Hydraulic Design As per design, the required size:
Final Report on Water Quality Management Plan for Ganga RiverVolume IV-3, Feasibility Study for Allahabad City, Part I, Sewerage Scheme
3-41
Diameter – 1000 mm Length – 3,100 m Material – PSC Ground levels from Alopibagh PS up to this point are continuously rising and after wards ground levels are decreasing, hence this point onwards this rising main converts to the gravity pipe line (5D) up to Mumfordganj PS. Minimum cover for laying of the rising main has been considered as 1.5 m from the ground level. Alignment details of Rising Main (10D) (Ref. Sheet No. 63-67)
General Existing rising main from Mumfordganj PS, discharge in to existing sewer towards Alopibagh pumping station. However as per master plan recommendations, proposed rising main from Augmented Mumfordganj PS (new PS) is to discharge towards Rajapur Sewage Treatment Plant. Rising main first crosses the Stanley road and after that it has been proposed parallel to the road on left side of it. After chainage 900 m, cantonment area starts on both sides of the road. Rising main will be along the road unto ch. 1850 m after that it will enter to the cantonment area and finally terminates at the inlet chamber of Rajapur Sewage Treatment Plant. Constraints There are two major constraints in this alignment one is crossing of Stanley road and other constraint is that rising main is to pass through cantonment area. Hydraulic Design As per design, the required size: Diameter – 1100 mm Length – 2,559 m Material – PSC Minimum cover for laying of the rising main has been considered as 1.5 m from the ground level. Crossings Details of road /nala crossings and railway crossing culverts are given in Table 3.33.
Final Report on Water Quality Management Plan for Ganga RiverVolume IV-3, Feasibility Study for Allahabad City, Part I, Sewerage Scheme
3-42
Table 3.33 Details of Road /Nala Crossings
Nala Crossing Road Crossing (Ordinary)
Road Crossing by Trenchless
Railway Crossing/ Culvert
No.
Total length
(m) No.
Total length
(m) No.
Total length
(m) No.
Total length
(m) Morigate PS to Alopibagh PS
(8D) 2 13 5 90 1 11 - -
Alopibagh PS to Mumfordganj PS (9D) - - 23 190 7 160 2 10
Mumfordganj PS to Rajapur Sewage Treatment Plant
(10D) 2 17 7 28 1 16 - -
Valves
Details of valves are given in Table 3.34.
Table 3.34 Details of Valves
Air Valve Scour Valve Isolation Valve
No. Size (mm) No Size
(mm) No.
Morigate PS to Alopibagh PS (8D) 4 100 2 400 1
Alopibagh PS to Mumfordganj PS (9D) 5 150 3 500 2
Mumfordganj PS to Rajapur Sewage Treatment Plant (10D) 4 150 3 600 2
Bedding For all rising main(s) in District D, PCC bedding type “B” has been used. 3.3.4 Proposed Rajapur STP (ref. drg. sheets number 177 – 183) (1) Design Flow The design flow as specified in the Master Plan is 65 mld for 2015, and 80 mld ultimate capacity. (2) Sitting of the STP Two possible locations were identified in the MP, for sitting the Rajapur STP, ref photos attached below.
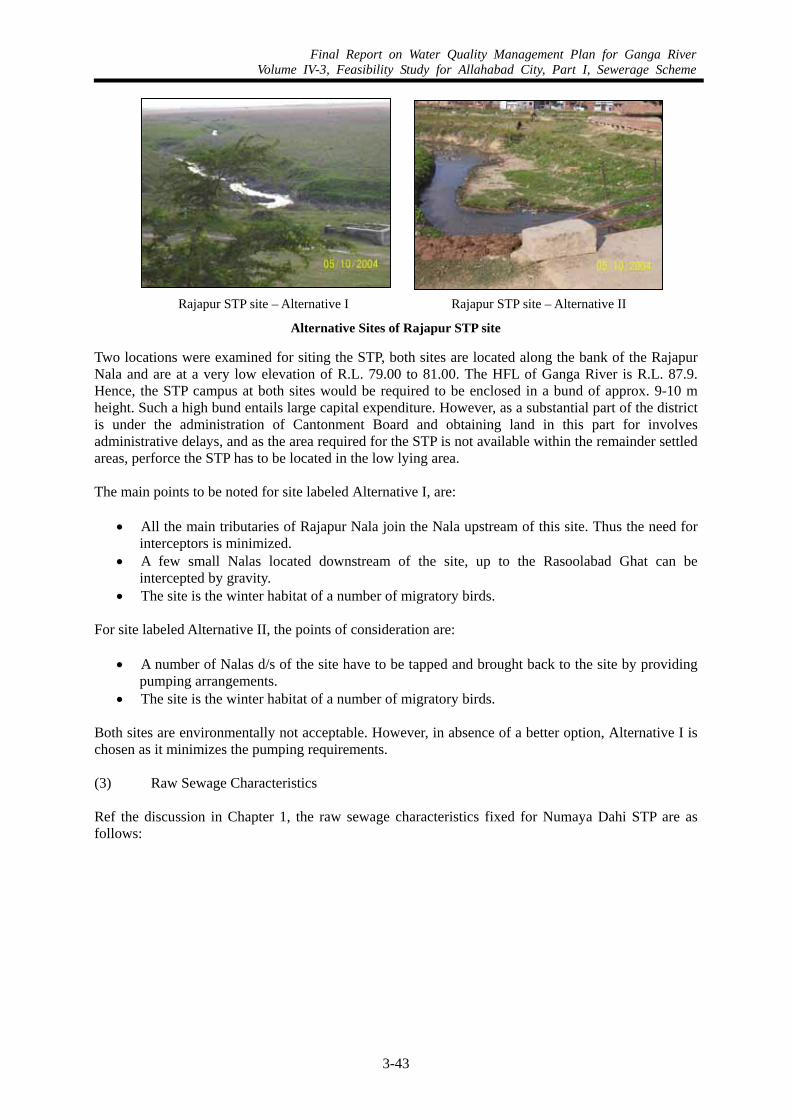
Final Report on Water Quality Management Plan for Ganga RiverVolume IV-3, Feasibility Study for Allahabad City, Part I, Sewerage Scheme
3-43
Two locations were examined for siting the STP, both sites are located along the bank of the Rajapur Nala and are at a very low elevation of R.L. 79.00 to 81.00. The HFL of Ganga River is R.L. 87.9. Hence, the STP campus at both sites would be required to be enclosed in a bund of approx. 9-10 m height. Such a high bund entails large capital expenditure. However, as a substantial part of the district is under the administration of Cantonment Board and obtaining land in this part for involves administrative delays, and as the area required for the STP is not available within the remainder settled areas, perforce the STP has to be located in the low lying area. The main points to be noted for site labeled Alternative I, are:
• All the main tributaries of Rajapur Nala join the Nala upstream of this site. Thus the need for interceptors is minimized.
• A few small Nalas located downstream of the site, up to the Rasoolabad Ghat can be intercepted by gravity.
• The site is the winter habitat of a number of migratory birds. For site labeled Alternative II, the points of consideration are:
• A number of Nalas d/s of the site have to be tapped and brought back to the site by providing pumping arrangements.
• The site is the winter habitat of a number of migratory birds. Both sites are environmentally not acceptable. However, in absence of a better option, Alternative I is chosen as it minimizes the pumping requirements. (3) Raw Sewage Characteristics Ref the discussion in Chapter 1, the raw sewage characteristics fixed for Numaya Dahi STP are as follows:
Rajapur STP site – Alternative II Rajapur STP site – Alternative I
Alternative Sites of Rajapur STP site
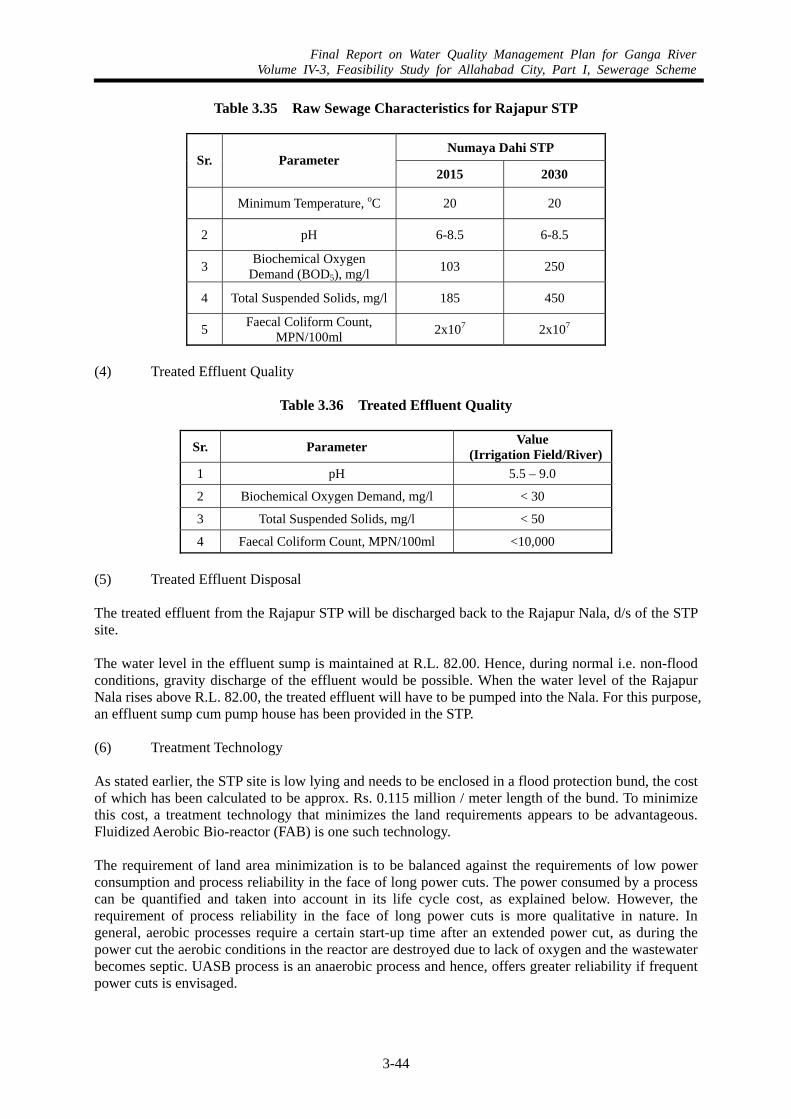
Final Report on Water Quality Management Plan for Ganga RiverVolume IV-3, Feasibility Study for Allahabad City, Part I, Sewerage Scheme
3-44
Table 3.35 Raw Sewage Characteristics for Rajapur STP
Numaya Dahi STP Sr. Parameter
2015 2030
Minimum Temperature, oC 20 20
2 pH 6-8.5 6-8.5
3 Biochemical Oxygen Demand (BOD5), mg/l 103 250
4 Total Suspended Solids, mg/l 185 450
5 Faecal Coliform Count, MPN/100ml 2x10⁷ 2x10⁷
(4) Treated Effluent Quality
Table 3.36 Treated Effluent Quality
Sr. Parameter Value (Irrigation Field/River)
1 pH 5.5 – 9.0
2 Biochemical Oxygen Demand, mg/l < 30
3 Total Suspended Solids, mg/l < 50
4 Faecal Coliform Count, MPN/100ml <10,000 (5) Treated Effluent Disposal The treated effluent from the Rajapur STP will be discharged back to the Rajapur Nala, d/s of the STP site. The water level in the effluent sump is maintained at R.L. 82.00. Hence, during normal i.e. non-flood conditions, gravity discharge of the effluent would be possible. When the water level of the Rajapur Nala rises above R.L. 82.00, the treated effluent will have to be pumped into the Nala. For this purpose, an effluent sump cum pump house has been provided in the STP. (6) Treatment Technology As stated earlier, the STP site is low lying and needs to be enclosed in a flood protection bund, the cost of which has been calculated to be approx. Rs. 0.115 million / meter length of the bund. To minimize this cost, a treatment technology that minimizes the land requirements appears to be advantageous. Fluidized Aerobic Bio-reactor (FAB) is one such technology. The requirement of land area minimization is to be balanced against the requirements of low power consumption and process reliability in the face of long power cuts. The power consumed by a process can be quantified and taken into account in its life cycle cost, as explained below. However, the requirement of process reliability in the face of long power cuts is more qualitative in nature. In general, aerobic processes require a certain start-up time after an extended power cut, as during the power cut the aerobic conditions in the reactor are destroyed due to lack of oxygen and the wastewater becomes septic. UASB process is an anaerobic process and hence, offers greater reliability if frequent power cuts is envisaged.
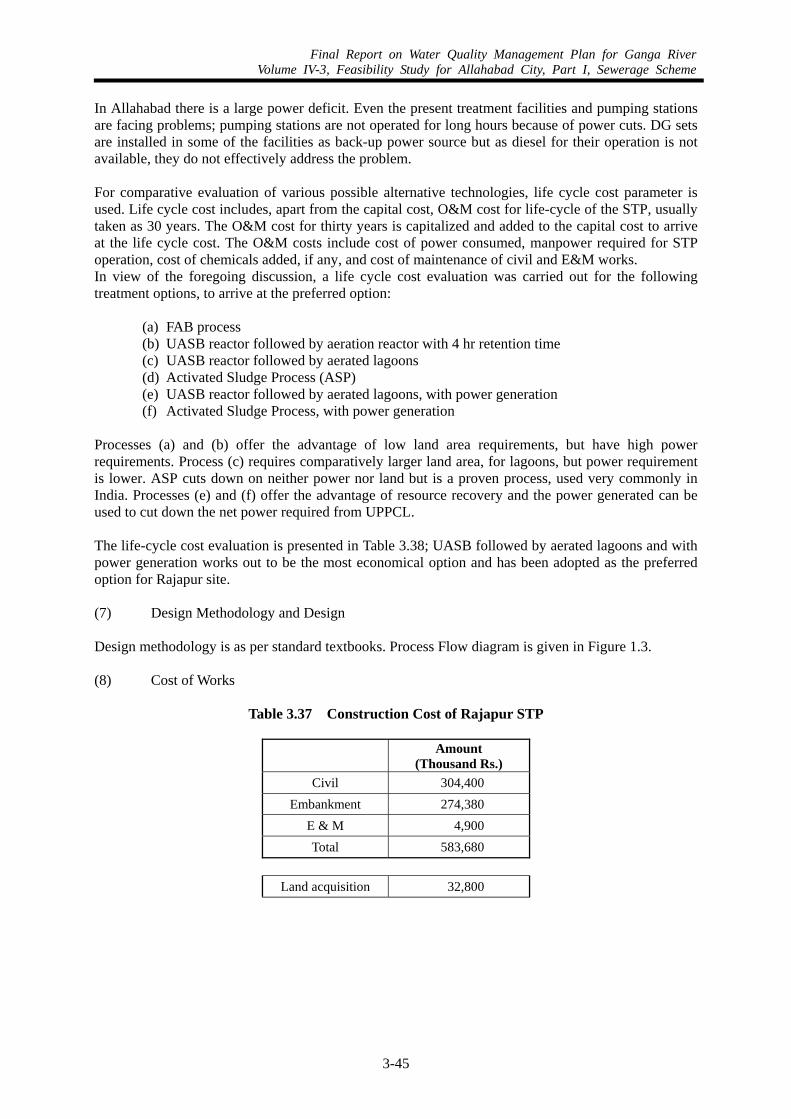
Final Report on Water Quality Management Plan for Ganga RiverVolume IV-3, Feasibility Study for Allahabad City, Part I, Sewerage Scheme
3-45
In Allahabad there is a large power deficit. Even the present treatment facilities and pumping stations are facing problems; pumping stations are not operated for long hours because of power cuts. DG sets are installed in some of the facilities as back-up power source but as diesel for their operation is not available, they do not effectively address the problem. For comparative evaluation of various possible alternative technologies, life cycle cost parameter is used. Life cycle cost includes, apart from the capital cost, O&M cost for life-cycle of the STP, usually taken as 30 years. The O&M cost for thirty years is capitalized and added to the capital cost to arrive at the life cycle cost. The O&M costs include cost of power consumed, manpower required for STP operation, cost of chemicals added, if any, and cost of maintenance of civil and E&M works. In view of the foregoing discussion, a life cycle cost evaluation was carried out for the following treatment options, to arrive at the preferred option:
(a) FAB process (b) UASB reactor followed by aeration reactor with 4 hr retention time (c) UASB reactor followed by aerated lagoons (d) Activated Sludge Process (ASP) (e) UASB reactor followed by aerated lagoons, with power generation (f) Activated Sludge Process, with power generation
Processes (a) and (b) offer the advantage of low land area requirements, but have high power requirements. Process (c) requires comparatively larger land area, for lagoons, but power requirement is lower. ASP cuts down on neither power nor land but is a proven process, used very commonly in India. Processes (e) and (f) offer the advantage of resource recovery and the power generated can be used to cut down the net power required from UPPCL. The life-cycle cost evaluation is presented in Table 3.38; UASB followed by aerated lagoons and with power generation works out to be the most economical option and has been adopted as the preferred option for Rajapur site. (7) Design Methodology and Design Design methodology is as per standard textbooks. Process Flow diagram is given in Figure 1.3. (8) Cost of Works
Table 3.37 Construction Cost of Rajapur STP
Amount (Thousand Rs.)
Civil 304,400 Embankment 274,380
E & M 4,900 Total 583,680
Land acquisition 32,800
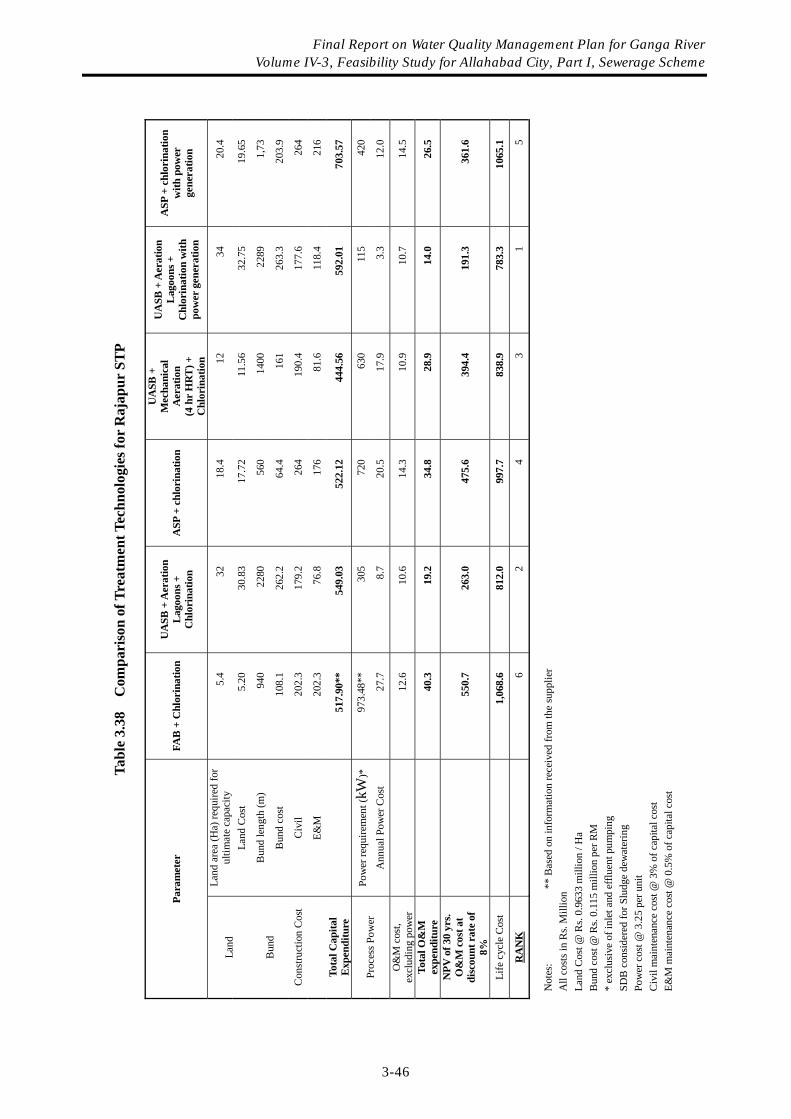
Ta
ble
3.38
C
ompa
riso
n of
Tre
atm
ent T
echn
olog
ies f
or R
ajap
ur S
TP
Para
met
er
FAB
+ C
hlor
inat
ion
UA
SB +
Aer
atio
n L
agoo
ns +
C
hlor
inat
ion
ASP
+ c
hlor
inat
ion
UA
SB +
M
echa
nica
l A
erat
ion
(4
hr
HR
T) +
C
hlor
inat
ion
UA
SB +
Aer
atio
n L
agoo
ns +
C
hlor
inat
ion
with
po
wer
gen
erat
ion
ASP
+ c
hlor
inat
ion
with
pow
er
gene
ratio
n
Land
are
a (H
a) re
quire
d fo
r ul
timat
e ca
paci
ty
5.4
32
18.4
12
34
20
.4
Land
La
nd C
ost
5.20
30
.83
17.7
2 11
.56
32.7
5 19
.65
Bun
d le
ngth
(m)
940
2280
56
0 14
00
2289
1,
73
Bun
d B
und
cost
10
8.1
262.
2 64
.4
161
263.
3 20
3.9
Con
stru
ctio
n C
ost
Civ
il 20
2.3
179.
2 26
4 19
0.4
177.
6 26
4
E&
M
202.
3 76
.8
176
81.6
11
8.4
216
Tota
l Cap
ital
Exp
endi
ture
517.
90**
54
9.03
52
2.12
44
4.56
59
2.01
70
3.57
Pow
er re
quire
men
t (kW
)*
973.
48**
30
5 72
0 63
0 11
5 42
0 Pr
oces
s Pow
er
Ann
ual P
ower
Cos
t 27
.7
8.7
20.5
17
.9
3.3
12.0
O
&M
cos
t, ex
clud
ing
pow
er
12
.6
10.6
14
.3
10.9
10
.7
14.5
Tota
l O&
M
expe
nditu
re
40
.3
19.2
34
.8
28.9
14
.0
26.5
NPV
of 3
0 yr
s. O
&M
cos
t at
disc
ount
rat
e of
8%
55
0.7
263.
0 47
5.6
394.
4 19
1.3
361.
6
Life
cyc
le C
ost
1,
068.
6 81
2.0
997.
7 83
8.9
783.
3 10
65.1
RA
NK
6 2
4 3
1 5
Not
es:
** B
ased
on
info
rmat
ion
rece
ived
from
the
supp
lier
A
ll co
sts i
n R
s. M
illio
n
La
nd C
ost @
Rs.
0.96
33 m
illio
n / H
a
B
und
cost
@ R
s. 0.
115
mill
ion
per R
M
* ex
clus
ive
of in
let a
nd e
fflue
nt p
umpi
ng
SDB
con
sider
ed fo
r Slu
dge
dew
ater
ing
Pow
er c
ost @
3.2
5 pe
r uni
t
C
ivil
mai
nten
ance
cos
t @ 3
% o
f cap
ital c
ost
E&M
mai
nten
ance
cos
t @ 0
.5%
of c
apita
l cos
t
Final Report on Water Quality Management Plan for Ganga River Volume IV-3, Feasibility Study for Allahabad City, Part I, Sewerage Scheme
3-46
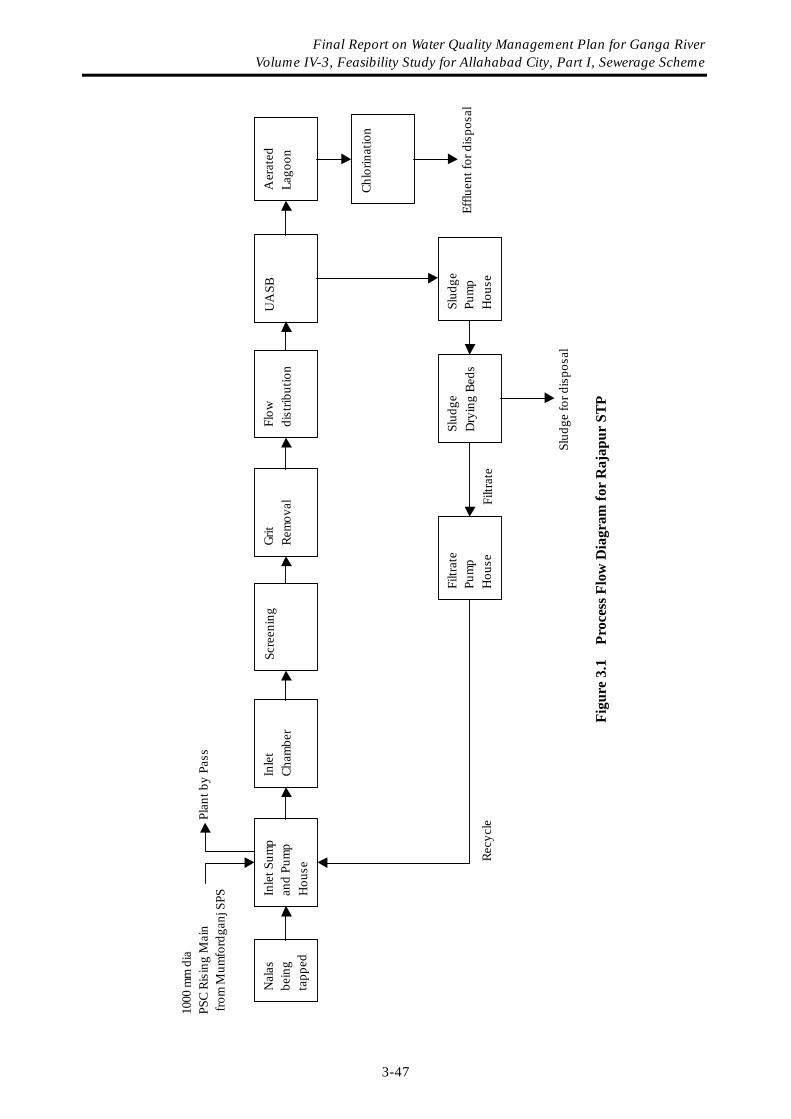
Fi
gure
3.1
Pr
oces
s Flo
w D
iagr
am fo
r R
ajap
ur S
TP
Nal
asbe
ing
tapp
ed
Inle
t Sum
pan
d Pu
mp
Hou
se
Inle
tCh
ambe
rSc
reen
ing
Grit
Rem
oval
Flow
dist
ribut
ion
UA
SB
Chlo
rinat
ion
Aer
ated
Lago
on
Slud
gePu
mp
Hou
se
Slud
geD
ryin
g Be
dsFi
ltrat
ePu
mp
Hou
seRe
cycl
e
1000
mm
dia
PSC
Risi
ng M
ain
from
Mum
ford
ganj
SPS
Plan
t by
Pass
Filtr
ate
Slud
ge fo
r dis
posa
l
Efflu
ent f
or d
ispo
sal
Final Report on Water Quality Management Plan for Ganga River Volume IV-3, Feasibility Study for Allahabad City, Part I, Sewerage Scheme
3-47
CHAPTER 4
PROVISIONS FOR DISTRICT B AND DISTRICT E
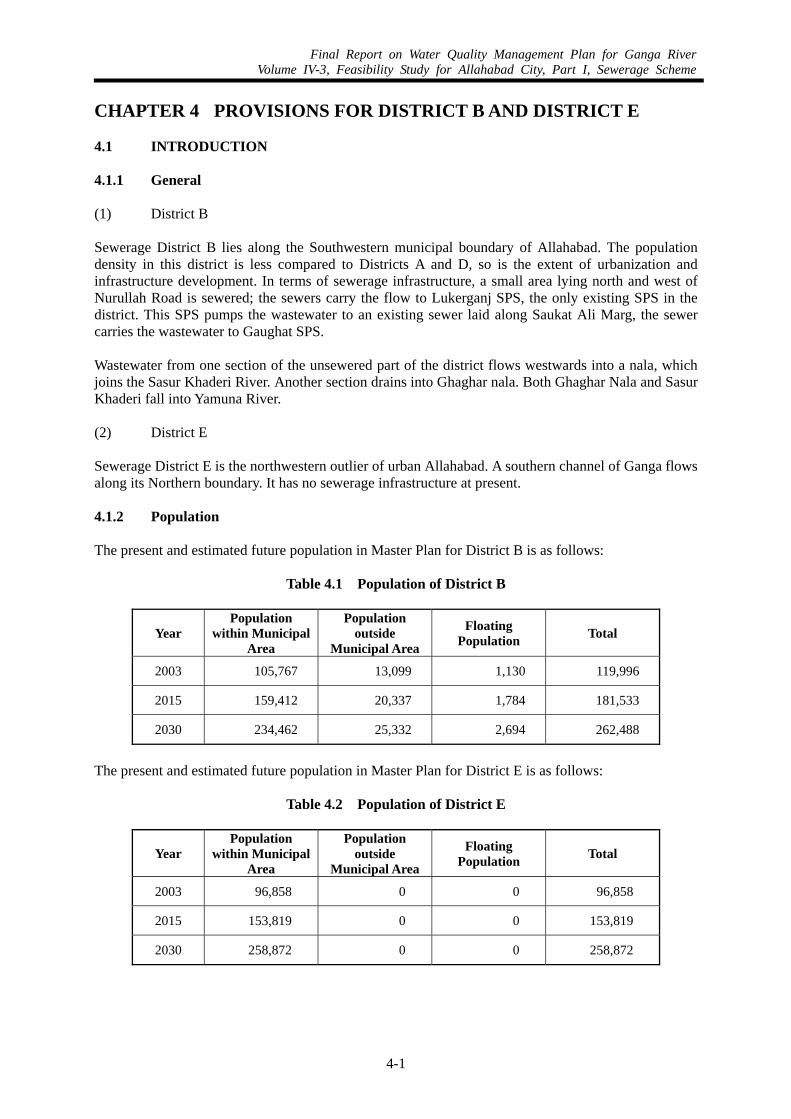
Final Report on Water Quality Management Plan for Ganga RiverVolume IV-3, Feasibility Study for Allahabad City, Part I, Sewerage Scheme
4-1
CHAPTER 4 PROVISIONS FOR DISTRICT B AND DISTRICT E 4.1 INTRODUCTION 4.1.1 General (1) District B Sewerage District B lies along the Southwestern municipal boundary of Allahabad. The population density in this district is less compared to Districts A and D, so is the extent of urbanization and infrastructure development. In terms of sewerage infrastructure, a small area lying north and west of Nurullah Road is sewered; the sewers carry the flow to Lukerganj SPS, the only existing SPS in the district. This SPS pumps the wastewater to an existing sewer laid along Saukat Ali Marg, the sewer carries the wastewater to Gaughat SPS. Wastewater from one section of the unsewered part of the district flows westwards into a nala, which joins the Sasur Khaderi River. Another section drains into Ghaghar nala. Both Ghaghar Nala and Sasur Khaderi fall into Yamuna River. (2) District E Sewerage District E is the northwestern outlier of urban Allahabad. A southern channel of Ganga flows along its Northern boundary. It has no sewerage infrastructure at present.
4.1.2 Population The present and estimated future population in Master Plan for District B is as follows:
Table 4.1 Population of District B
Year Population
within Municipal Area
Population outside
Municipal Area
Floating Population Total
2003 105,767 13,099 1,130 119,996
2015 159,412 20,337 1,784 181,533
2030 234,462 25,332 2,694 262,488
The present and estimated future population in Master Plan for District E is as follows:
Table 4.2 Population of District E
Year Population
within Municipal Area
Population outside
Municipal Area
Floating Population Total
2003 96,858 0 0 96,858
2015 153,819 0 0 153,819
2030 258,872 0 0 258,872
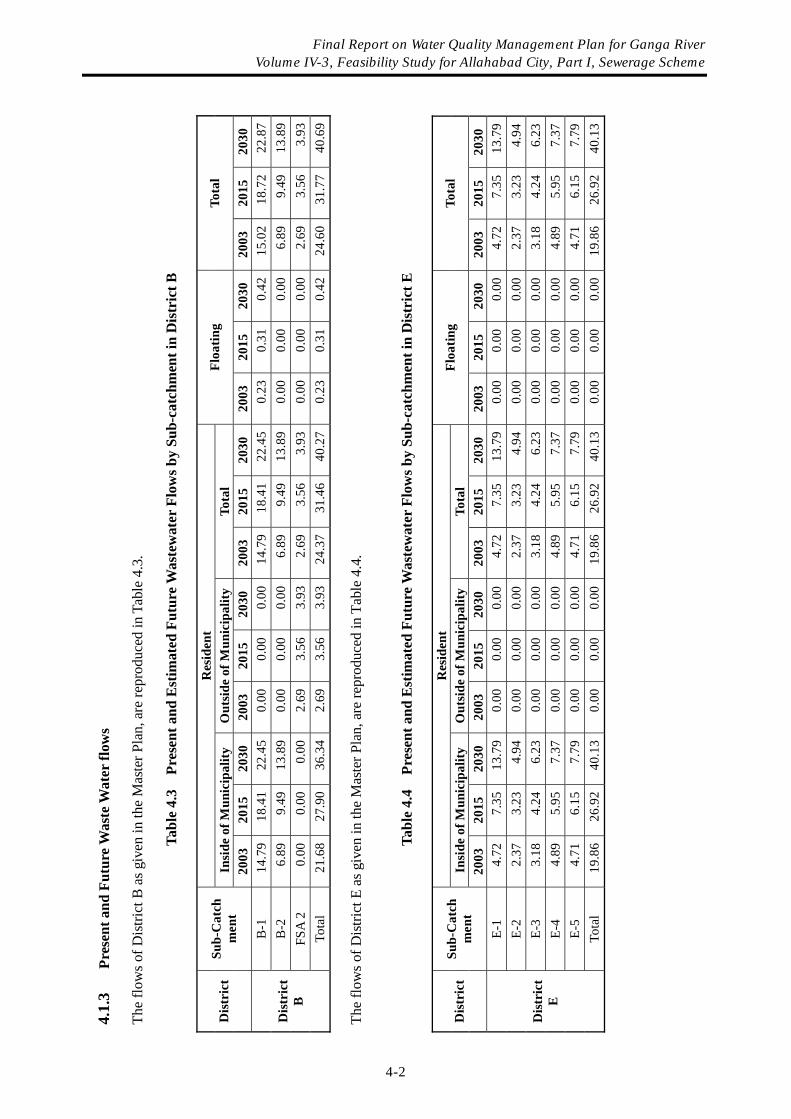
4.1.
3 Pr
esen
t and
Fut
ure
Was
te W
ater
flow
s Th
e flo
ws o
f Dis
trict
B a
s giv
en in
the
Mas
ter P
lan,
are
repr
oduc
ed in
Tab
le 4
.3.
Ta
ble
4.3
Pre
sent
and
Est
imat
ed F
utur
e W
aste
wat
er F
low
s by
Sub-
catc
hmen
t in
Dis
tric
t B
R
esid
ent
Insi
de o
f Mun
icip
ality
O
utsi
de o
f Mun
icip
ality
To
tal
Floa
ting
Tota
l D
istr
ict
Sub-
Cat
chm
ent
2003
20
15
2030
20
03
2015
20
30
2003
20
15
2030
20
03
2015
20
30
2003
20
15
2030
B
-1
14.7
9
18.4
1
22.4
5
0.00
0.
00
0.00
14
.79
18
.41
22
.45
0.
23
0.31
0.
42
15.0
2
18.7
2
22.8
7 B
-2
6.89
9.
49
13.8
9
0.00
0.
00
0.00
6.
89
9.49
13
.89
0.
00
0.00
0.
00
6.89
9.
49
13.8
9 FS
A 2
0.00
0.
00
0.00
2.
69
3.56
3.
93
2.69
3.
56
3.93
0.
00
0.00
0.
00
2.69
3.
56
3.93
D
istr
ict
B
Tota
l 21
.68
27
.90
36
.34
2.
69
3.56
3.
93
24.3
7
31.4
6
40.2
7
0.23
0.
31
0.42
24
.60
31
.77
40
.69
Th
e flo
ws o
f Dis
trict
E a
s giv
en in
the
Mas
ter P
lan,
are
repr
oduc
ed in
Tab
le 4
.4.
Ta
ble
4.4
Pre
sent
and
Est
imat
ed F
utur
e W
aste
wat
er F
low
s by
Sub-
catc
hmen
t in
Dis
tric
t E
R
esid
ent
Insi
de o
f Mun
icip
ality
O
utsi
de o
f Mun
icip
ality
To
tal
Floa
ting
Tota
l D
istr
ict
Sub-
Cat
chm
ent
2003
20
15
2030
20
03
2015
20
30
2003
20
15
2030
20
03
2015
20
30
2003
20
15
2030
E-
1 4.
72
7.35
13
.79
0.
00
0.00
0.
00
4.72
7.
35
13.7
9
0.00
0.
00
0.00
4.
72
7.35
13
.79
E-2
2.37
3.
23
4.94
0.
00
0.00
0.
00
2.37
3.
23
4.94
0.
00
0.00
0.
00
2.37
3.
23
4.94
E-
3 3.
18
4.24
6.
23
0.00
0.
00
0.00
3.
18
4.24
6.
23
0.00
0.
00
0.00
3.
18
4.24
6.
23
E-4
4.89
5.
95
7.37
0.
00
0.00
0.
00
4.89
5.
95
7.37
0.
00
0.00
0.
00
4.89
5.
95
7.37
E-
5 4.
71
6.15
7.
79
0.00
0.
00
0.00
4.
71
6.15
7.
79
0.00
0.
00
0.00
4.
71
6.15
7.
79
Dis
tric
t E
Tota
l 19
.86
26
.92
40
.13
0.
00
0.00
0.
00
19.8
6 26
.92
40
.13
0.
00
0.00
0.
00
19.8
6 26
.92
40
.13
Final Report on Water Quality Management Plan for Ganga River Volume IV-3, Feasibility Study for Allahabad City, Part I, Sewerage Scheme
4-2
Final Report on Water Quality Management Plan for Ganga RiverVolume IV-3, Feasibility Study for Allahabad City, Part I, Sewerage Scheme
4-3
4.1.4 Existing and Proposed Sewerage Pattern (1) District B A small area lying north and west of Nurullah Road is sewered; the sewers carry the flow to Lukerganj SPS, the only existing SPS in the district. This SPS pumps the wastewater to an existing sewer laid along Saukat Ali Marg, the sewer carries the wastewater to Gaughat SPS. Wastewater from one section of the unsewered part of the district flows westwards into a nala, which joins the Sasur Khaderi River. Another section drains into Ghaghar nala. Both Ghaghar Nala and Sasur Khaderi fall into the Yamuna.
(2) District E District E has no existing sewage collection or treatment facilities.
4.1.5 Proposed System (1) District B The proposed augmentation/ new construction measures, under priority projects, for this district are:
• Construction of new trunk sewers – 4.92 km. • Construction of new Rising Mains – 7.9 km • Construction of a new SPS to tap Ghaghar Nala - 94.2 mld in 2003, 92.9 mld in 2015,
94.17 mld in 2030. • Construction of a new SPS at Sasur Khaderi - 32 mld in 2015, 57 mld in 2030. • Construction of a new STP at Numaya Dahi – 50 mld capacity in 2015. • Treated Effluent Channel from Numaya Dahi Sewage Treatment Plant to outfall into Yamuna,
at Bisona Village
(2) District E
• Construction of a new STP at Ponghat – 10 mld capacity in 2015. • Construction of a new STP at Kodara – 15 mld capacity in 2015, 30 mld capacity in 2030.
4.1.6 Cost Summary Summary of cost of District B and E have been given in Table 4.5 and 4.6, respectively.
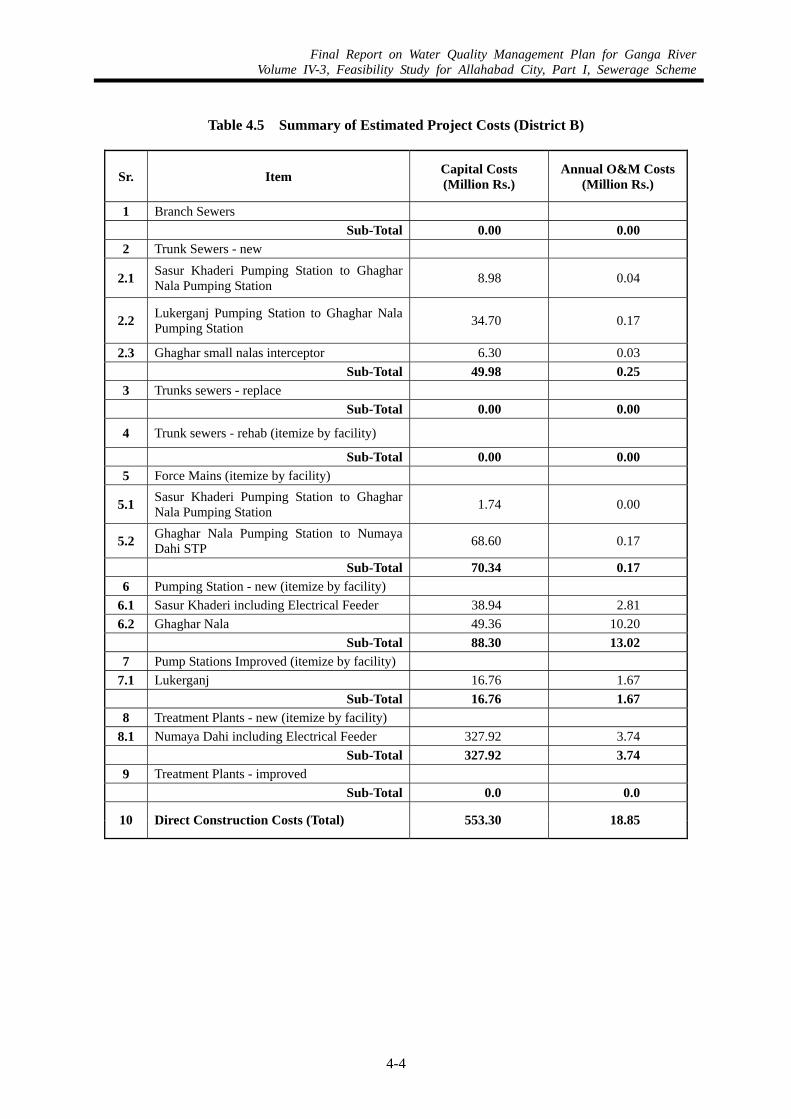
Final Report on Water Quality Management Plan for Ganga RiverVolume IV-3, Feasibility Study for Allahabad City, Part I, Sewerage Scheme
4-4
Table 4.5 Summary of Estimated Project Costs (District B)
Sr. Item Capital Costs (Million Rs.)
Annual O&M Costs(Million Rs.)
1 Branch Sewers Sub-Total 0.00 0.00
2 Trunk Sewers - new
2.1 Sasur Khaderi Pumping Station to Ghaghar Nala Pumping Station 8.98 0.04
2.2 Lukerganj Pumping Station to Ghaghar Nala Pumping Station 34.70 0.17
2.3 Ghaghar small nalas interceptor 6.30 0.03 Sub-Total 49.98 0.25
3 Trunks sewers - replace Sub-Total 0.00 0.00
4 Trunk sewers - rehab (itemize by facility)
Sub-Total 0.00 0.00 5 Force Mains (itemize by facility)
5.1 Sasur Khaderi Pumping Station to Ghaghar Nala Pumping Station 1.74 0.00
5.2 Ghaghar Nala Pumping Station to Numaya Dahi STP 68.60 0.17
Sub-Total 70.34 0.17 6 Pumping Station - new (itemize by facility)
6.1 Sasur Khaderi including Electrical Feeder 38.94 2.81 6.2 Ghaghar Nala 49.36 10.20
Sub-Total 88.30 13.02 7 Pump Stations Improved (itemize by facility)
7.1 Lukerganj 16.76 1.67 Sub-Total 16.76 1.67
8 Treatment Plants - new (itemize by facility) 8.1 Numaya Dahi including Electrical Feeder 327.92 3.74
Sub-Total 327.92 3.74 9 Treatment Plants - improved Sub-Total 0.0 0.0
10 Direct Construction Costs (Total) 553.30 18.85
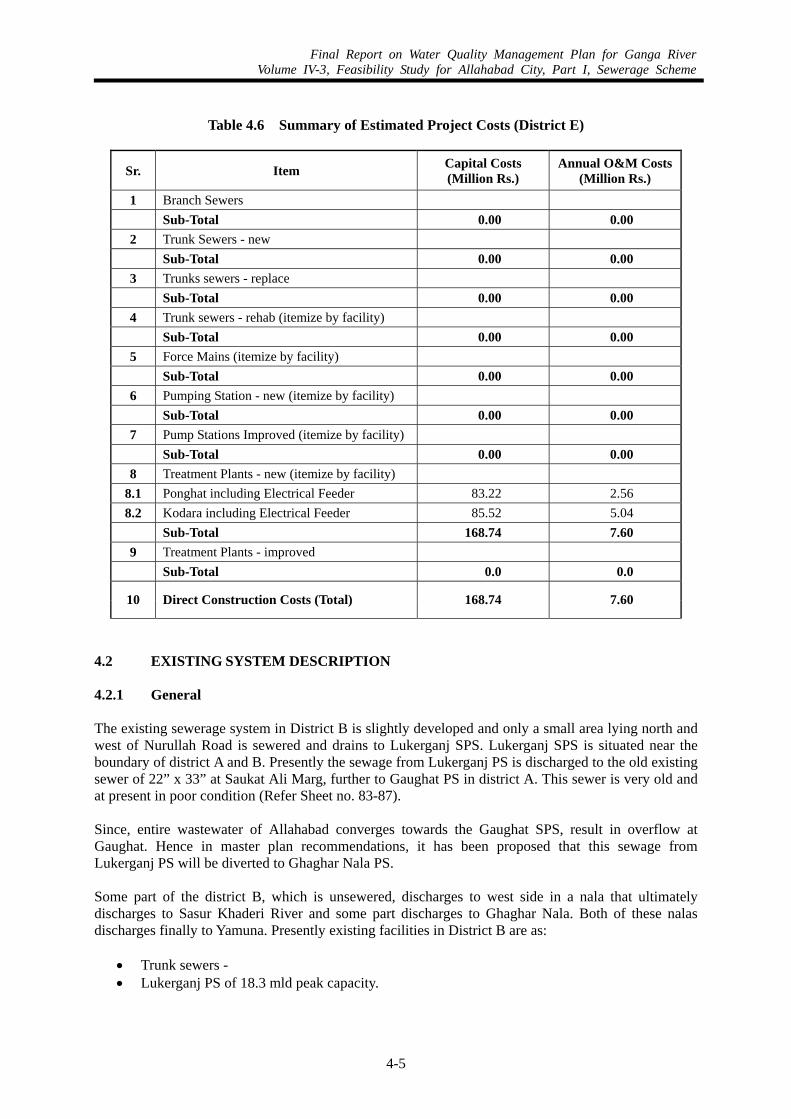
Final Report on Water Quality Management Plan for Ganga RiverVolume IV-3, Feasibility Study for Allahabad City, Part I, Sewerage Scheme
4-5
Table 4.6 Summary of Estimated Project Costs (District E)
Sr. Item Capital Costs (Million Rs.)
Annual O&M Costs(Million Rs.)
1 Branch Sewers Sub-Total 0.00 0.00
2 Trunk Sewers - new Sub-Total 0.00 0.00
3 Trunks sewers - replace Sub-Total 0.00 0.00
4 Trunk sewers - rehab (itemize by facility) Sub-Total 0.00 0.00
5 Force Mains (itemize by facility) Sub-Total 0.00 0.00
6 Pumping Station - new (itemize by facility) Sub-Total 0.00 0.00
7 Pump Stations Improved (itemize by facility) Sub-Total 0.00 0.00
8 Treatment Plants - new (itemize by facility) 8.1 Ponghat including Electrical Feeder 83.22 2.56 8.2 Kodara including Electrical Feeder 85.52 5.04
Sub-Total 168.74 7.60 9 Treatment Plants - improved Sub-Total 0.0 0.0
10 Direct Construction Costs (Total) 168.74 7.60
4.2 EXISTING SYSTEM DESCRIPTION 4.2.1 General The existing sewerage system in District B is slightly developed and only a small area lying north and west of Nurullah Road is sewered and drains to Lukerganj SPS. Lukerganj SPS is situated near the boundary of district A and B. Presently the sewage from Lukerganj PS is discharged to the old existing sewer of 22” x 33” at Saukat Ali Marg, further to Gaughat PS in district A. This sewer is very old and at present in poor condition (Refer Sheet no. 83-87). Since, entire wastewater of Allahabad converges towards the Gaughat SPS, result in overflow at Gaughat. Hence in master plan recommendations, it has been proposed that this sewage from Lukerganj PS will be diverted to Ghaghar Nala PS. Some part of the district B, which is unsewered, discharges to west side in a nala that ultimately discharges to Sasur Khaderi River and some part discharges to Ghaghar Nala. Both of these nalas discharges finally to Yamuna. Presently existing facilities in District B are as:
• Trunk sewers - • Lukerganj PS of 18.3 mld peak capacity.
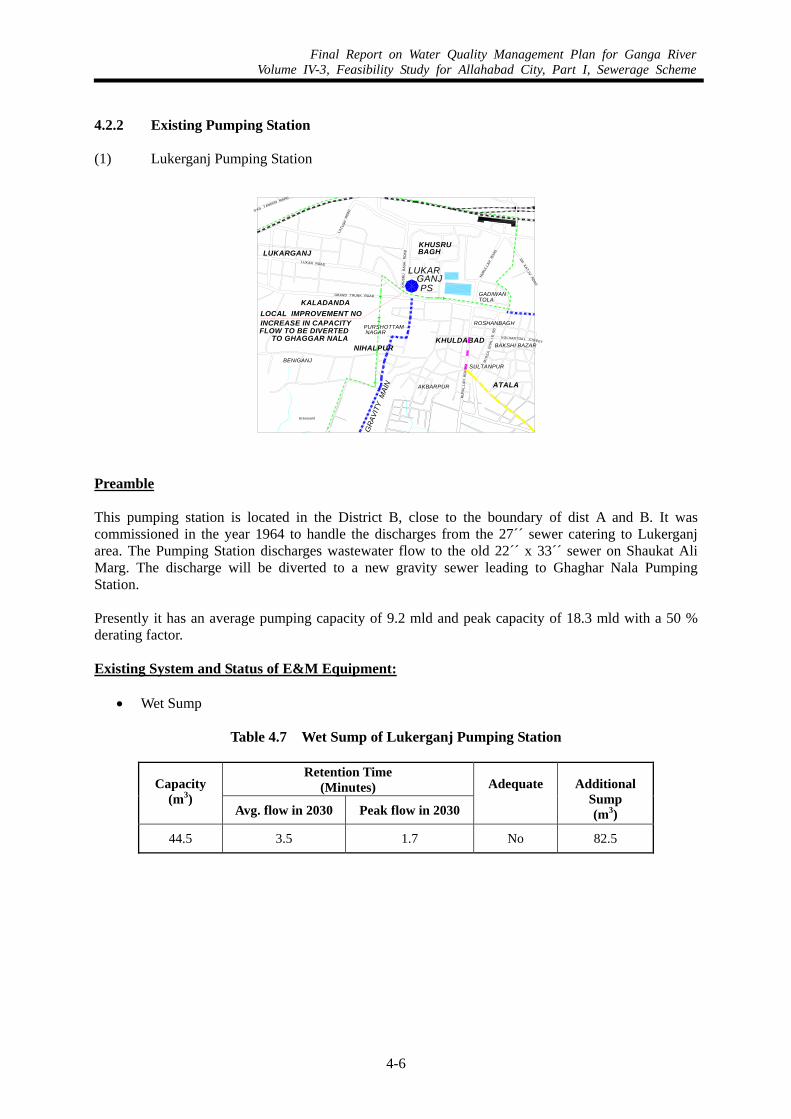
Final Report on Water Quality Management Plan for Ganga RiverVolume IV-3, Feasibility Study for Allahabad City, Part I, Sewerage Scheme
4-6
4.2.2 Existing Pumping Station (1) Lukerganj Pumping Station
KHUSRUBAGH
ATALA
ROSHANBAGH
AKBARPUR
SULTANPUR
BAKSHI BAZARKHULDABAD
MI R
ZA
GH
AL
I BR
D
DRKAT
JURO
AD
NU
RU
LL
AH
RO
AD
NURU
L LAH
ROAD
GADIWANTOLA
KOLHANTOA L STREE
NIHALPUR
KALADANDA
PURSHOTTAM
LUKARGANJ
BENIGANJ
LATU
SHRO
AD
LUKAR ROAD
KH
US
RU
BAG
HR
OA
D
DAS TANDON MARG
GRAND TRUNK ROAD
Graveyard
GR
AVIT
Y M
AIN
LUKAR GANJPS
LOCAL IMPROVEMENT NOINCREASE IN CAPACITYFLOW TO BE DIVERTED
TO GHAGGAR NALA NAGAR
T
Preamble
This pumping station is located in the District B, close to the boundary of dist A and B. It was commissioned in the year 1964 to handle the discharges from the 27´´ sewer catering to Lukerganj area. The Pumping Station discharges wastewater flow to the old 22´´ x 33´´ sewer on Shaukat Ali Marg. The discharge will be diverted to a new gravity sewer leading to Ghaghar Nala Pumping Station. Presently it has an average pumping capacity of 9.2 mld and peak capacity of 18.3 mld with a 50 % derating factor.
Existing System and Status of E&M Equipment:
• Wet Sump
Table 4.7 Wet Sump of Lukerganj Pumping Station
Retention Time (Minutes) Capacity
(m3) Avg. flow in 2030 Peak flow in 2030
Adequate Additional Sump (m3)
44.5 3.5 1.7 No 82.5
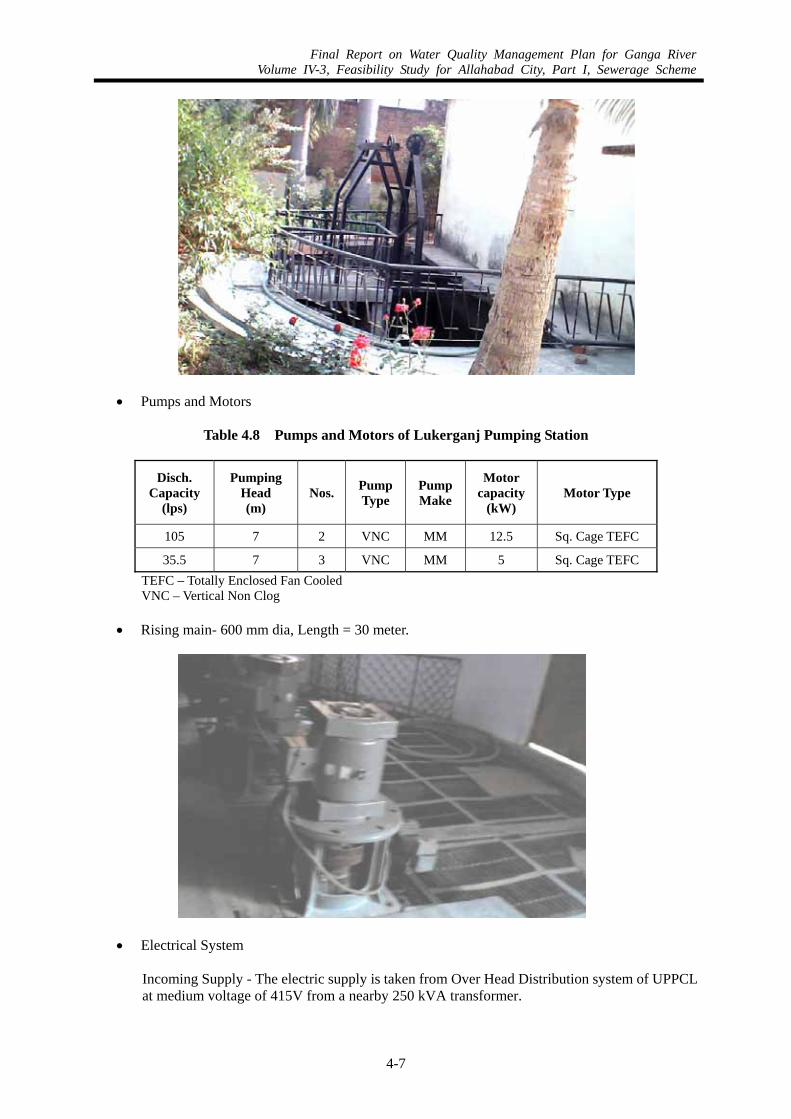
Final Report on Water Quality Management Plan for Ganga RiverVolume IV-3, Feasibility Study for Allahabad City, Part I, Sewerage Scheme
4-7
• Pumps and Motors
Table 4.8 Pumps and Motors of Lukerganj Pumping Station
Disch. Capacity
(lps)
Pumping Head (m)
Nos. Pump Type
Pump Make
Motor capacity
(kW) Motor Type
105 7 2 VNC MM 12.5 Sq. Cage TEFC
35.5 7 3 VNC MM 5 Sq. Cage TEFC TEFC – Totally Enclosed Fan Cooled VNC – Vertical Non Clog
• Rising main- 600 mm dia, Length = 30 meter.
• Electrical System
Incoming Supply - The electric supply is taken from Over Head Distribution system of UPPCL at medium voltage of 415V from a nearby 250 kVA transformer.
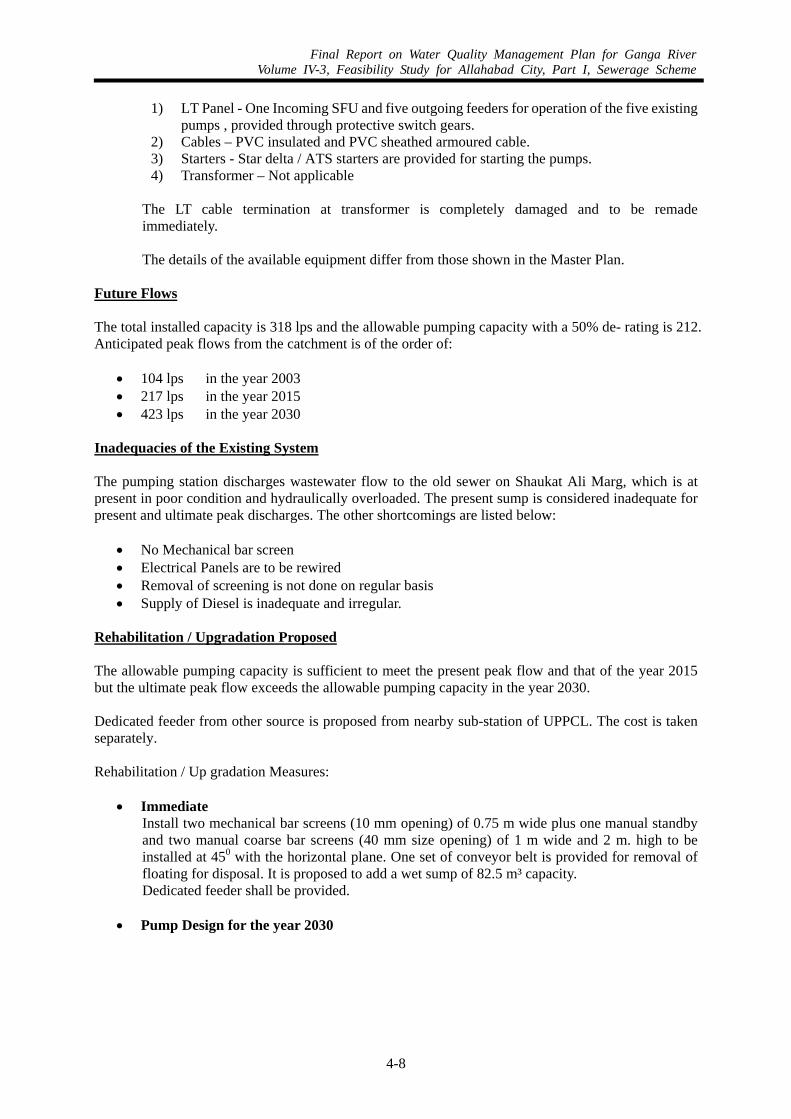
Final Report on Water Quality Management Plan for Ganga RiverVolume IV-3, Feasibility Study for Allahabad City, Part I, Sewerage Scheme
4-8
1) LT Panel - One Incoming SFU and five outgoing feeders for operation of the five existing pumps , provided through protective switch gears.
2) Cables – PVC insulated and PVC sheathed armoured cable. 3) Starters - Star delta / ATS starters are provided for starting the pumps. 4) Transformer – Not applicable
The LT cable termination at transformer is completely damaged and to be remade immediately. The details of the available equipment differ from those shown in the Master Plan.
Future Flows The total installed capacity is 318 lps and the allowable pumping capacity with a 50% de- rating is 212. Anticipated peak flows from the catchment is of the order of:
• 104 lps in the year 2003 • 217 lps in the year 2015 • 423 lps in the year 2030
Inadequacies of the Existing System The pumping station discharges wastewater flow to the old sewer on Shaukat Ali Marg, which is at present in poor condition and hydraulically overloaded. The present sump is considered inadequate for present and ultimate peak discharges. The other shortcomings are listed below:
• No Mechanical bar screen • Electrical Panels are to be rewired • Removal of screening is not done on regular basis • Supply of Diesel is inadequate and irregular.
Rehabilitation / Upgradation Proposed The allowable pumping capacity is sufficient to meet the present peak flow and that of the year 2015 but the ultimate peak flow exceeds the allowable pumping capacity in the year 2030. Dedicated feeder from other source is proposed from nearby sub-station of UPPCL. The cost is taken separately. Rehabilitation / Up gradation Measures:
• Immediate Install two mechanical bar screens (10 mm opening) of 0.75 m wide plus one manual standby and two manual coarse bar screens (40 mm size opening) of 1 m wide and 2 m. high to be installed at 450 with the horizontal plane. One set of conveyor belt is provided for removal of floating for disposal. It is proposed to add a wet sump of 82.5 m³ capacity. Dedicated feeder shall be provided.
• Pump Design for the year 2030
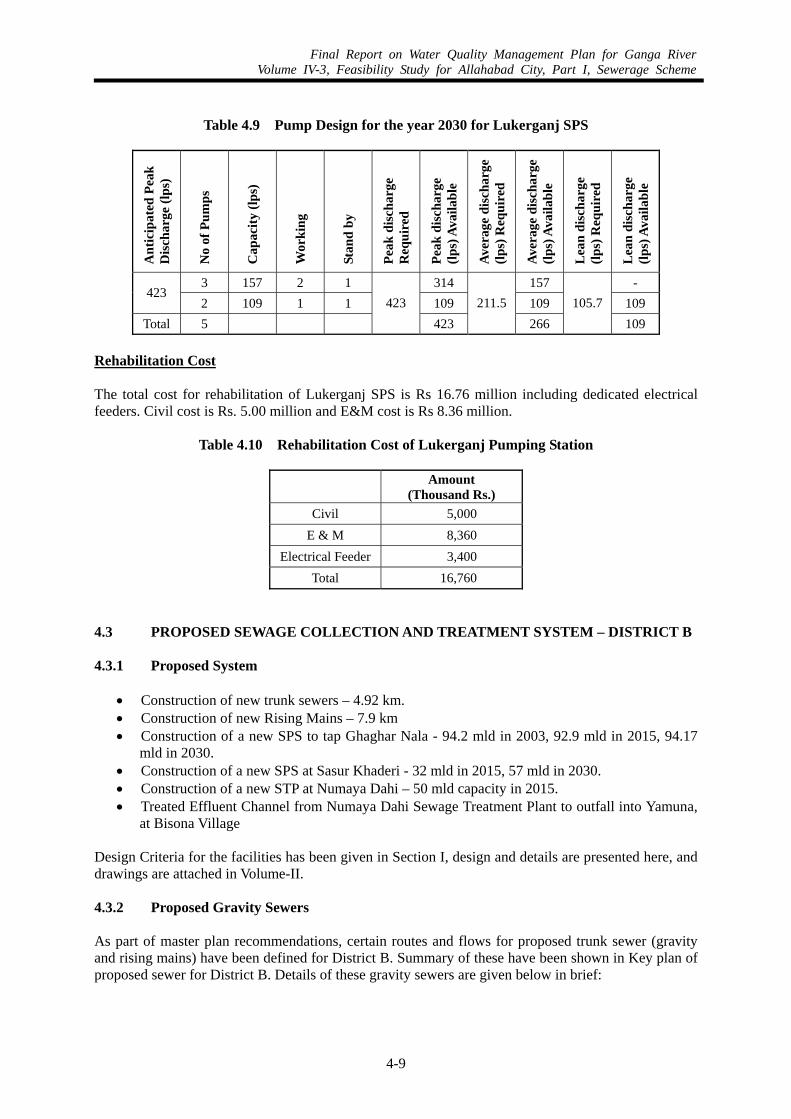
Final Report on Water Quality Management Plan for Ganga RiverVolume IV-3, Feasibility Study for Allahabad City, Part I, Sewerage Scheme
4-9
Table 4.9 Pump Design for the year 2030 for Lukerganj SPS
A
ntic
ipat
ed P
eak
Dis
char
ge (l
ps)
No
of P
umps
Cap
acity
(lps
)
Wor
king
Stan
d by
Peak
dis
char
ge
Req
uire
d
Peak
dis
char
ge
(lps)
Ava
ilabl
e
Aver
age
disc
harg
e (lp
s) R
equi
red
Aver
age
disc
harg
e (lp
s) A
vaila
ble
Lea
n di
scha
rge
(lps)
Req
uire
d
Lea
n di
scha
rge
(lps)
Ava
ilabl
e
3 157 2 1 314 157 - 423
2 109 1 1 109 109 109 Total 5
423 423
211.5266
105.7 109
Rehabilitation Cost The total cost for rehabilitation of Lukerganj SPS is Rs 16.76 million including dedicated electrical feeders. Civil cost is Rs. 5.00 million and E&M cost is Rs 8.36 million.
Table 4.10 Rehabilitation Cost of Lukerganj Pumping Station
Amount (Thousand Rs.)
Civil 5,000 E & M 8,360
Electrical Feeder 3,400 Total 16,760
4.3 PROPOSED SEWAGE COLLECTION AND TREATMENT SYSTEM – DISTRICT B 4.3.1 Proposed System
• Construction of new trunk sewers – 4.92 km. • Construction of new Rising Mains – 7.9 km • Construction of a new SPS to tap Ghaghar Nala - 94.2 mld in 2003, 92.9 mld in 2015, 94.17
mld in 2030. • Construction of a new SPS at Sasur Khaderi - 32 mld in 2015, 57 mld in 2030. • Construction of a new STP at Numaya Dahi – 50 mld capacity in 2015. • Treated Effluent Channel from Numaya Dahi Sewage Treatment Plant to outfall into Yamuna,
at Bisona Village
Design Criteria for the facilities has been given in Section I, design and details are presented here, and drawings are attached in Volume-II. 4.3.2 Proposed Gravity Sewers As part of master plan recommendations, certain routes and flows for proposed trunk sewer (gravity and rising mains) have been defined for District B. Summary of these have been shown in Key plan of proposed sewer for District B. Details of these gravity sewers are given below in brief:
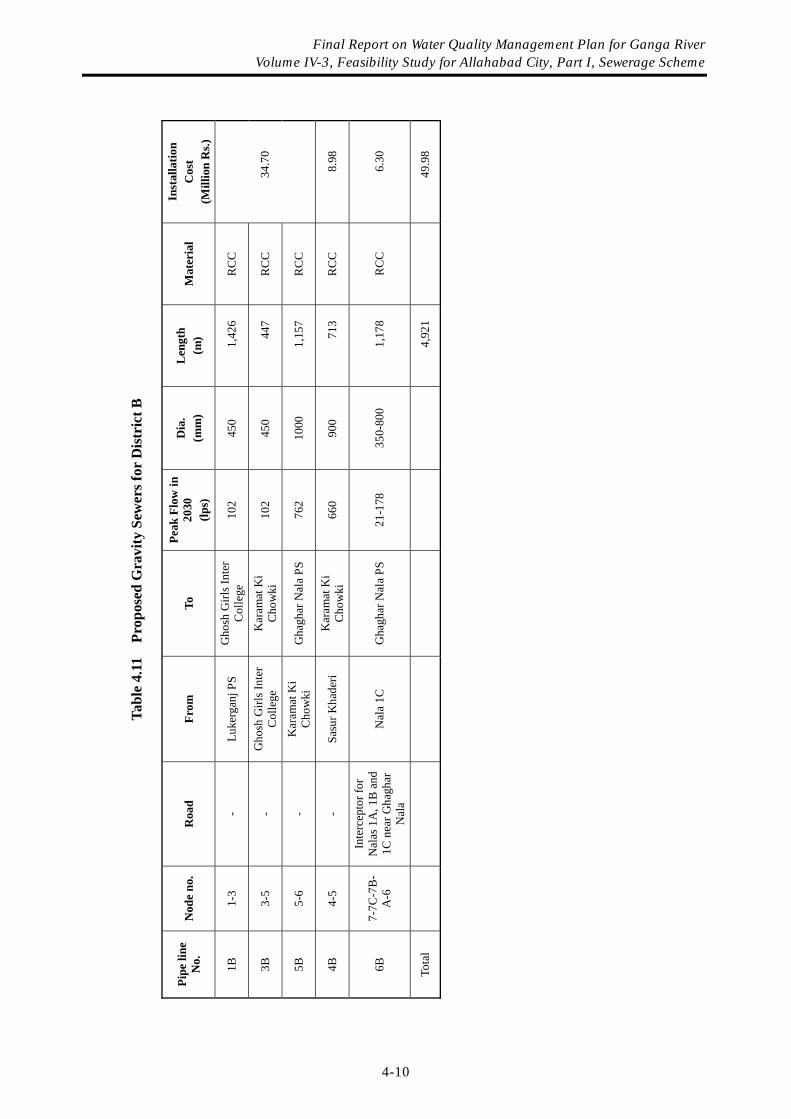
Ta
ble
4.11
Pr
opos
ed G
ravi
ty S
ewer
s for
Dis
tric
t B
Pipe
line
N
o.
Nod
e no
. R
oad
From
To
Pe
ak F
low
in
2030
(lp
s)
Dia
. (m
m)
Len
gth
(m)
Mat
eria
l In
stal
latio
n C
ost
(Mill
ion
Rs.)
1B
1-3
- Lu
kerg
anj P
S G
hosh
Girl
s Int
er
Col
lege
10
2 45
0 1,
426
RC
C
3B
3-5
- G
hosh
Girl
s Int
er
Col
lege
K
aram
at K
i C
how
ki
102
450
447
RC
C
5B
5-6
- K
aram
at K
i C
how
ki
Gha
ghar
Nal
a PS
76
2 10
00
1,15
7 R
CC
34.7
0
4B
4-5
- Sa
sur K
hade
ri K
aram
at K
i C
how
ki
660
900
713
RC
C
8.98
6B
7-7C
-7B
-A
-6
Inte
rcep
tor f
or
Nal
as 1
A, 1
B a
nd
1C n
ear G
hagh
ar
Nal
a
Nal
a 1C
G
hagh
ar N
ala
PS
21-1
78
350-
800
1,17
8 R
CC
6.
30
Tota
l
4,
921
49
.98
Final Report on Water Quality Management Plan for Ganga River Volume IV-3, Feasibility Study for Allahabad City, Part I, Sewerage Scheme
4-10
Final Report on Water Quality Management Plan for Ganga RiverVolume IV-3, Feasibility Study for Allahabad City, Part I, Sewerage Scheme
4-11
Alignment details of Pipe line 1B (node 1-3) (Ref. Sheet No. 15-17)
General Proposed sewer starts from node 1 (Lukerganj PS). Presently sewage pumped from Lukerganj SPS is being discharged to the existing sewer towards Gaughat pumping station (District A). As per the master plan recommendations, this sewage is to be rerouted towards Ghaghar Nala pumping station (District B). Rising main from Lukerganj SPS is to be diverted towards the proposed sewer out side the pumping station, which will carry sewage to Ghaghar Nala Raw Sewage Pumping Station. Proposed sewer is from the Lukerganj PS (node 1) up to Ghosh Girls Inter College, near IOCL pipe line Corridor (node 3). The direction of travel is towards Ghaghar PS. Constraints Initial approx 200 m of the proposed sewer route is very congested. Since this sewer will be laid at a depth of only 2.0 to 3.0 m, there might not be much problem in laying the sewer; however, some additional safety measures are required to be taken while executing the work. Hydraulic Design The sewer has been designed for a maximum peak flow of 102 lps. Diameter of the pipe is 450 mm and slope is 1 in 500. Alignment details of Pipe line 2B (node 2-3) (Ref. Sheet No. 17)
General As per master plan a sewer had been proposed between node 2 and 3. On conducting a field survey, it was found that the route lay along a gas pipe line corridor and cannot be used for laying a trunk sewer. A joint site inspection was held with JICA representatives and it was found that this sewer route was not feasible. At present, sewage of this area is being discharged into the nala, which flows towards Sasur Khaderi River. Hence as an alternative route it was decided that a separate pumping station should be installed at the downstream of this nala just before it falls into the Sasur Khaderi River. This sewage is to be carried to the Numaya Dahi Sewage Treatment plant; it was not economical to provide a separate rising main up to the STP. Hence it was decided that this sewage can be carried to the trunk main towards Ghaghar nala.
Alignment details of Pipe line 3B (node 3-5) (Ref. Sheet No. 17-18)
General Proposed sewer starts from node 3 (Ghosh Girls Inter College) unto Karamat Ki Chowki (node 5) where another trunk sewer from Sasur Khaderi merges with it and ultimately flows towards Ghaghar Nala Pumping Station. Constraints Since this sewer has to discharge to another proposed gravity sewer at node 5 hence it has been designed accordingly. Hydraulic Design The sewer has been designed for a maximum peak flow of 102 lps. Diameter of the pipe is 450 mm
Final Report on Water Quality Management Plan for Ganga RiverVolume IV-3, Feasibility Study for Allahabad City, Part I, Sewerage Scheme
4-12
and slope is 1 in 500. Alignment details of Pipe line 4B (node 4-5) (Ref. Sheet No. 20-21)
General As per the decision taken as in above paragraph, a detailed study was carried out by JICA Study Team and followed by detailed survey carried out by M/s STUP Consultants, it was found that a new Raw Sewage Pumping Station can be provided at the location as mentioned above and a trunk sewer is possible from Sasur Khaderi (node 4) up to Karamat ki Chowki (node 5), where it will discharge to the main trunk sewer from Luker ganj PS to Ghaghar Nala. Rising main from this pumping station discharges the sewage at the main Numaya road near Sasur Khaderi Bridge. Constraints Since this sewer has to discharge to another proposed gravity sewer at node 5 hence it has been designed accordingly. Hydraulic Design The sewer has been designed for a maximum peak flow of 660 lps. Diameter of the pipe is 900 mm and slope is 1 in 500. Alignment details of Pipe line 5B (node 5-6) (Ref. Sheet No. 18-19)
General From node 5, the trunk main has been proposed up to Ghaghar Nala PS (node 6). Constraints There is an existing drain on one side of the road hence sewer has been proposed on other side of the road. The sewer also crosses the Ghaghar nala in this reach. After crossing Nurullah road chainage 2800 m, there are two water mains on both sides of the road up to Ghaghar Nala PS for a length of approx. 230 m. Moreover one rising main of 1000 mm diameter has to be laid up towards Numaya Dahi Sewage Treatment Plant. Hence shifting of these services is required so that proposed sewer and rising main can be laid. Hydraulic Design The sewer has been designed for a maximum peak flow of 762 lps. Diameter of the pipe is 1000 mm and slope is 1 in 500. Alignment details of Pipe line 6B (node 7-7C-7B-7A-6) (Refer Sheet no. 22-23)
General The intercepting sewer has been proposed by diverting Nala 1C at Harshwardhan Nagar area towards Nala 1B further to Nala 1A and finally to Ghaghar Nala Raw Sewage Pumping Station. Constraints
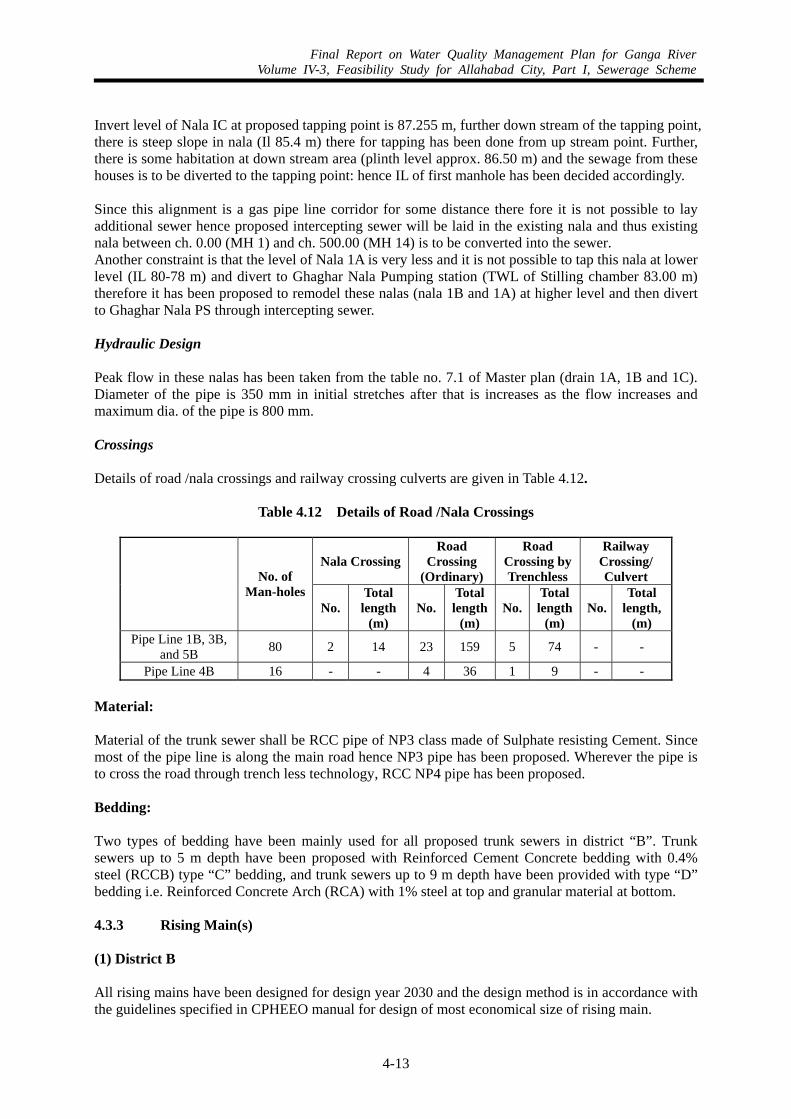
Final Report on Water Quality Management Plan for Ganga RiverVolume IV-3, Feasibility Study for Allahabad City, Part I, Sewerage Scheme
4-13
Invert level of Nala IC at proposed tapping point is 87.255 m, further down stream of the tapping point, there is steep slope in nala (Il 85.4 m) there for tapping has been done from up stream point. Further, there is some habitation at down stream area (plinth level approx. 86.50 m) and the sewage from these houses is to be diverted to the tapping point: hence IL of first manhole has been decided accordingly. Since this alignment is a gas pipe line corridor for some distance there fore it is not possible to lay additional sewer hence proposed intercepting sewer will be laid in the existing nala and thus existing nala between ch. 0.00 (MH 1) and ch. 500.00 (MH 14) is to be converted into the sewer. Another constraint is that the level of Nala 1A is very less and it is not possible to tap this nala at lower level (IL 80-78 m) and divert to Ghaghar Nala Pumping station (TWL of Stilling chamber 83.00 m) therefore it has been proposed to remodel these nalas (nala 1B and 1A) at higher level and then divert to Ghaghar Nala PS through intercepting sewer. Hydraulic Design Peak flow in these nalas has been taken from the table no. 7.1 of Master plan (drain 1A, 1B and 1C). Diameter of the pipe is 350 mm in initial stretches after that is increases as the flow increases and maximum dia. of the pipe is 800 mm. Crossings Details of road /nala crossings and railway crossing culverts are given in Table 4.12.
Table 4.12 Details of Road /Nala Crossings
Nala CrossingRoad
Crossing (Ordinary)
Road Crossing by Trenchless
Railway Crossing/ Culvert
No. of
Man-holes No.
Total length
(m) No.
Total length
(m) No.
Total length
(m) No.
Total length,
(m) Pipe Line 1B, 3B,
and 5B 80 2 14 23 159 5 74 - -
Pipe Line 4B 16 - - 4 36 1 9 - -
Material: Material of the trunk sewer shall be RCC pipe of NP3 class made of Sulphate resisting Cement. Since most of the pipe line is along the main road hence NP3 pipe has been proposed. Wherever the pipe is to cross the road through trench less technology, RCC NP4 pipe has been proposed. Bedding: Two types of bedding have been mainly used for all proposed trunk sewers in district “B”. Trunk sewers up to 5 m depth have been proposed with Reinforced Cement Concrete bedding with 0.4% steel (RCCB) type “C” bedding, and trunk sewers up to 9 m depth have been provided with type “D” bedding i.e. Reinforced Concrete Arch (RCA) with 1% steel at top and granular material at bottom. 4.3.3 Rising Main(s) (1) District B All rising mains have been designed for design year 2030 and the design method is in accordance with the guidelines specified in CPHEEO manual for design of most economical size of rising main.
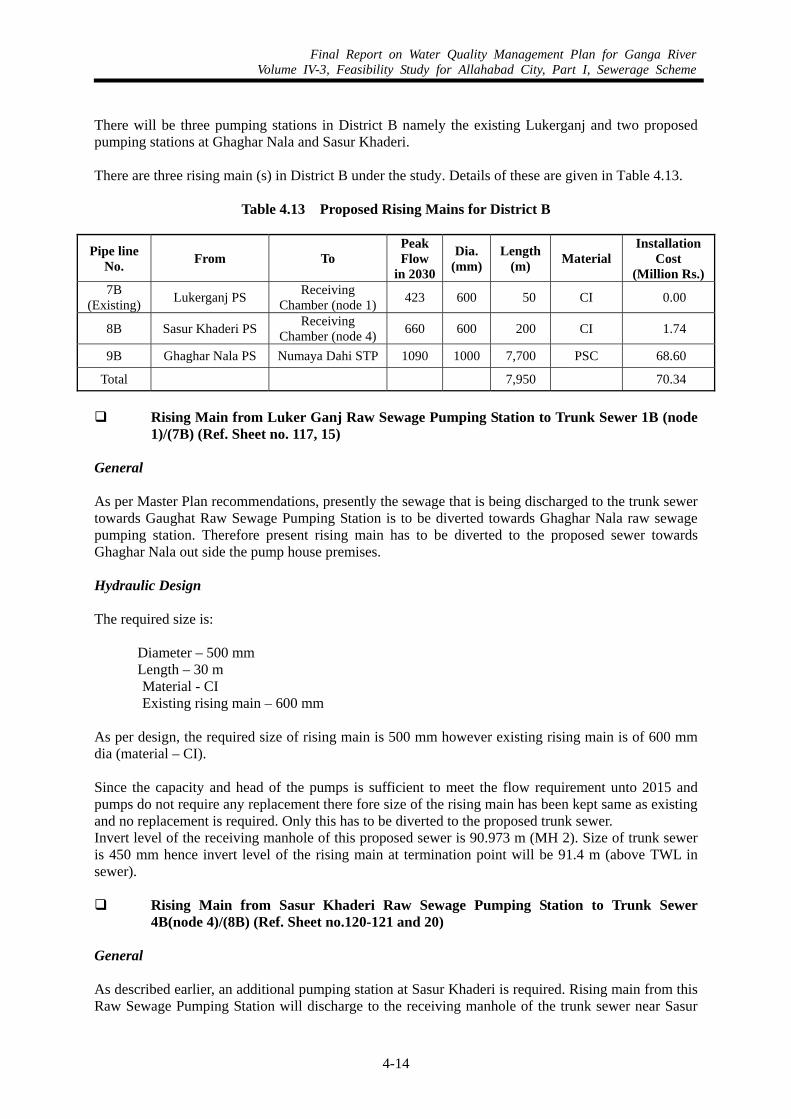
Final Report on Water Quality Management Plan for Ganga RiverVolume IV-3, Feasibility Study for Allahabad City, Part I, Sewerage Scheme
4-14
There will be three pumping stations in District B namely the existing Lukerganj and two proposed pumping stations at Ghaghar Nala and Sasur Khaderi. There are three rising main (s) in District B under the study. Details of these are given in Table 4.13.
Table 4.13 Proposed Rising Mains for District B
Pipe line No. From To
Peak Flow
in 2030
Dia. (mm)
Length (m) Material
Installation Cost
(Million Rs.)7B
(Existing) Lukerganj PS Receiving Chamber (node 1) 423 600 50 CI 0.00
8B Sasur Khaderi PS Receiving Chamber (node 4) 660 600 200 CI 1.74
9B Ghaghar Nala PS Numaya Dahi STP 1090 1000 7,700 PSC 68.60
Total 7,950 70.34
Rising Main from Luker Ganj Raw Sewage Pumping Station to Trunk Sewer 1B (node 1)/(7B) (Ref. Sheet no. 117, 15)
General As per Master Plan recommendations, presently the sewage that is being discharged to the trunk sewer towards Gaughat Raw Sewage Pumping Station is to be diverted towards Ghaghar Nala raw sewage pumping station. Therefore present rising main has to be diverted to the proposed sewer towards Ghaghar Nala out side the pump house premises. Hydraulic Design The required size is:
Diameter – 500 mm Length – 30 m Material - CI Existing rising main – 600 mm
As per design, the required size of rising main is 500 mm however existing rising main is of 600 mm dia (material – CI). Since the capacity and head of the pumps is sufficient to meet the flow requirement unto 2015 and pumps do not require any replacement there fore size of the rising main has been kept same as existing and no replacement is required. Only this has to be diverted to the proposed trunk sewer. Invert level of the receiving manhole of this proposed sewer is 90.973 m (MH 2). Size of trunk sewer is 450 mm hence invert level of the rising main at termination point will be 91.4 m (above TWL in sewer). Rising Main from Sasur Khaderi Raw Sewage Pumping Station to Trunk Sewer
4B(node 4)/(8B) (Ref. Sheet no.120-121 and 20) General As described earlier, an additional pumping station at Sasur Khaderi is required. Rising main from this Raw Sewage Pumping Station will discharge to the receiving manhole of the trunk sewer near Sasur
Final Report on Water Quality Management Plan for Ganga RiverVolume IV-3, Feasibility Study for Allahabad City, Part I, Sewerage Scheme
4-15
Khaderi bridge ultimately flowing towards Ghaghar Nala. Constraints There is not any problem in this alignment except crossing of Numaya road. Hydraulic Design The required size is:
Diameter – 600 mm Length – 200 m Material – CI
Since total length of the rising main is very short (200 m) and most of the reach is within the plant premises. As per practice, all the piping within plant premises is considered of CI. Hence the material of rising main has been taken as CI. Minimum cover for laying of the rising main has been considered as 1.5 m from the ground level. Invert level of the receiving manhole is 85.778 m. Diameter of trunk sewer is 900 mm. Hence invert level of the rising main at termination level will be 86.5 m. Rising Main from Ghaghar Nala Raw Sewage Pumping Station to Numaya Dahi
STP/(9B) (Ref. Sheet No. 41-53) General As per master plan recommendations, a new pumping station is to be constructed at Ghaghar Nala to tap it. Sewage, which is coming to this nala and from trunk sewer of dist B, is to be pumped towards Numaya Dahi Sewage treatment plant. From the pumping station rising main is to be laid on left side of the road. There are two water mains on both sides of the road from Ghaghar Nala PS for a length of approx. 230 m. hence right side water main (500 mm dia.) has to be shifted towards left side. After crossing the Nurullah road (ch. 200 m), rising main has been proposed on left side of the road up to Karamat Ki Chowki (ch. 1100 m). At this point, pipe line crosses the Numaya road after wards rising main has been proposed on right side of the road up to Numaya Dahi Sewage Treatment Plant. This reach is highly undulating and ground levels are varying between 87.0 m to 95.0 m. Constraints There are two main constraints in this point, one is crossing of Sasur Khaderi river and other is HT transmission lines, which have been taken care off. Hydraulic Design The required size is:
Diameter – 1000 mm Length – 7,700 m Material – PSC
Minimum cover for laying of the rising main has been considered as 1.5 m from the ground level. Crossings
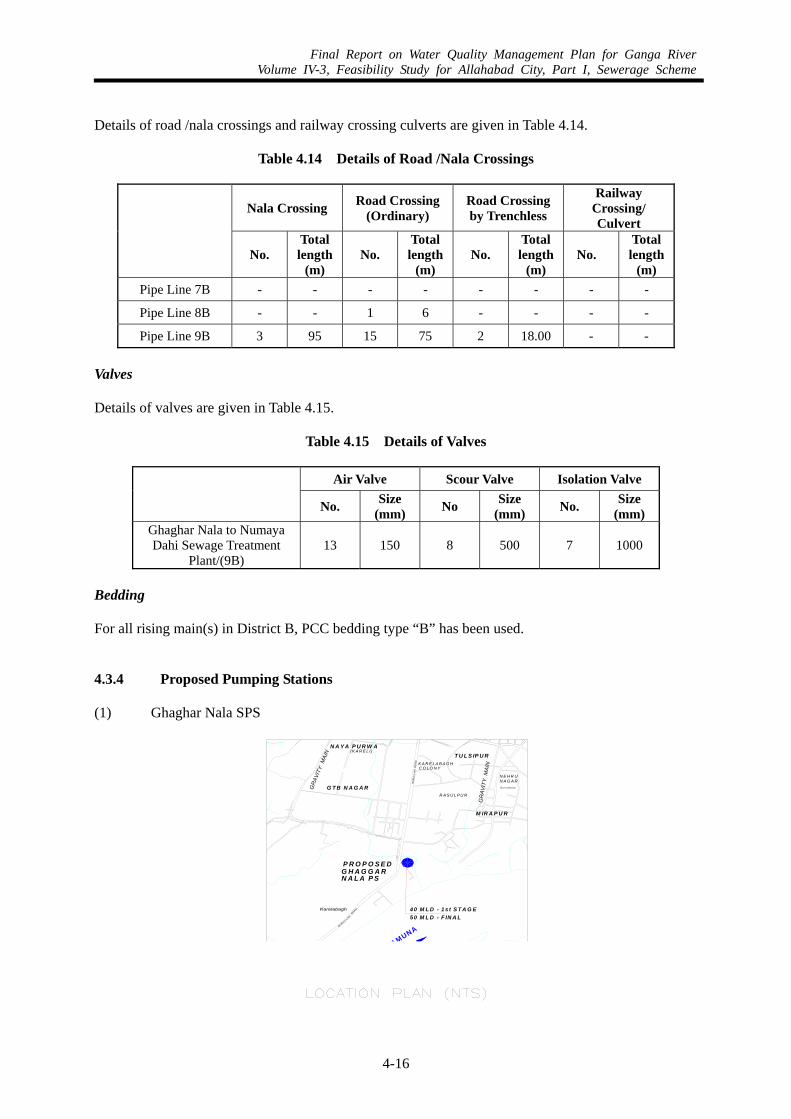
Final Report on Water Quality Management Plan for Ganga RiverVolume IV-3, Feasibility Study for Allahabad City, Part I, Sewerage Scheme
4-16
Details of road /nala crossings and railway crossing culverts are given in Table 4.14.
Table 4.14 Details of Road /Nala Crossings
Nala Crossing Road Crossing (Ordinary)
Road Crossing by Trenchless
Railway Crossing/ Culvert
No.
Total length
(m) No.
Total length
(m) No.
Total length
(m) No.
Total length
(m) Pipe Line 7B - - - - - - - -
Pipe Line 8B - - 1 6 - - - -
Pipe Line 9B 3 95 15 75 2 18.00 - -
Valves Details of valves are given in Table 4.15.
Table 4.15 Details of Valves
Air Valve Scour Valve Isolation Valve No. Size
(mm) No Size (mm) No. Size
(mm) Ghaghar Nala to Numaya Dahi Sewage Treatment
Plant/(9B) 13 150 8 500 7 1000
Bedding For all rising main(s) in District B, PCC bedding type “B” has been used. 4.3.4 Proposed Pumping Stations (1) Ghaghar Nala SPS
N A Y A P U R W A(K A R E L I)
NURU L L AHRO AD
G T B N A G A R
M IR A P U R
R A S U L P U R
N A G A R
T U L S IP U RK A R E L A B A G HC O LO N Y
NU
RU
LL A
HR
OA
D
G u rud w a ra
RIVER YAMUNA
G H A G G A R
GR
AVIT
Y M
AIN
P R O P O S E D
4 0 M L D - 1 s t S T A G E 5 0 M L D - F IN A L
N A L A P S
GR
AVI
TY M
AIN
N E H R U
Final Report on Water Quality Management Plan for Ganga RiverVolume IV-3, Feasibility Study for Allahabad City, Part I, Sewerage Scheme
4-17
Preamble The Ghaghar nala Pumping Station will be located near outfall of Ghaghar Nala at its left bank in District B (Ref Sheet No.124-127). This pumping station will be the main pumping station receiving all the wastewater from District B. This will receive wastewater from Lukerganj pumping station as well as from Sasur Khaderi PS, in addition to the command area. Final Proposal
The wastewater from the nala is tapped and carried to Numaya Dahi Sewage Treatment Plant. Pumping station is proposed to be built on columns, i.e., elevated bar screen chambers/ channels to save lot of electrical energy in addition to civil cost of construction. Projected wastewater flows from District B, including Ghaghar nala flow are as follows: Total Design Flow 2015 : 44.5 mld (average), 89 mld (peak) 2030 : 47.1 mld (average), 94.2 mld (peak) To meet the above requirement, 6 pumps have been proposed with following capacities: 273 lps, 37 m head - 6 Nos.
• Wet Sump designed for the year 2030.
Table 4.16 Wet Sump of Ghaghar Nala Pumping Station
Retention Time (Minutes) Capacity
(m³) Avg. flow Peak flow Adequate
327 10 5 yes
• Rising main 1000 mm, L = 7.7 Km to the proposed Numaya Dahi STP
The other equipment to be installed for successful operation are enumerated below:
• Mechanical:
1) Two no. of Mechanical bar screens (10 mm opening size) and conveyor system with one no. of manual standby screen
2) Two nos. of coarse bar manual screens 3) Sluice gates 4) Suction, Delivery lines, rising main with necessary
valves and other accessories 5) 5 ton capacity HOT crane – 1 No.
• Electrical:
1) Incoming Supply – The electric supply will be taken from 11 kV , UPPCL power
network opposite the road. The second feeder from the nearby sub station is proposed through an under ground cable. The cost is taken separately.
2) 11kV / 415 V, 1250 kVA transformers – 2 Nos.
Final Report on Water Quality Management Plan for Ganga RiverVolume IV-3, Feasibility Study for Allahabad City, Part I, Sewerage Scheme
4-18
3) 5 Panels HT vacuum circuit breakers 4) One DG set of 320 kVA 5) HT / LT cabling , bus trunk system , cable tray arrangement 6) LT panel with proper protection and metering arrangement 7) Squirrel cage TEFC motors of 150 kW capacity – 6 Nos. 8) Automatic power factor control (APFC) panel for power
factor improvement 9) Necessary interlocks between transformer incomers
and DG set 10) Interlocking arrangement for DG incomer and APFC panel 11) Complete earth protection system 12) Solid state level indicator for easy and smooth control over the motors’ duty cycle.
Since it is a new proposal hence the wastewater shall be pumped to Numaya Dahi STP for treatment and its disposal.
Table 4.17 Pump Design for the Year 2015 and 2030
Year
Ant
icip
ated
Pea
k D
isch
arge
(lps
)
No
of P
umps
Cap
acity
(lps
)
Wor
king
Stan
d by
Peak
dis
char
ge
Req
uire
d (lp
s)
Peak
dis
char
ge
(lps)
Ava
ilabl
e
Aver
age
disc
harg
e (lp
s) R
equi
red
Aver
age
disc
harg
e (lp
s) A
vaila
ble
Lea
n di
scha
rge
(lps)
Req
uire
d
Lea
n di
scha
rge
(lps)
Ava
ilabl
e
2015 1,075 6 273 4 2 1,075 1,092 537.5 546 268. 273
2030 1,090 6 273 4 2 1,090 1,092 545 546 272.5 273
Cost of Work The total cost for construction is Rs 49.36 million including dedicated electrical feeders. Civil cost is Rs. 19.79 million and E&M cost is Rs 29.57 million.
Table 4.18 Rehabilitation Cost of Ghaghar Nala Pumping Station
Amount (Thousand Rs.)
Civil 19,790 E & M 26,170
Electrical Feeder 3,400 Total 49,360
Rising Main 75,460
Land acquisition (1.0 ha) 960
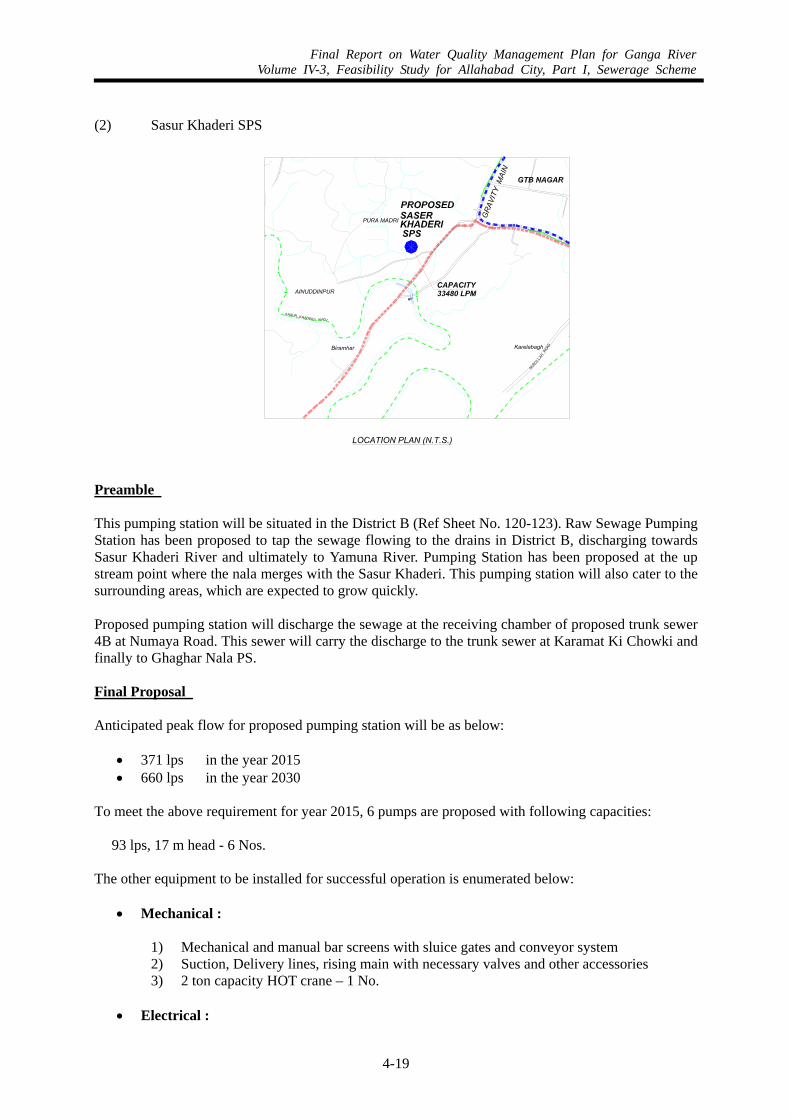
Final Report on Water Quality Management Plan for Ganga RiverVolume IV-3, Feasibility Study for Allahabad City, Part I, Sewerage Scheme
4-19
(2) Sasur Khaderi SPS
Preamble This pumping station will be situated in the District B (Ref Sheet No. 120-123). Raw Sewage Pumping Station has been proposed to tap the sewage flowing to the drains in District B, discharging towards Sasur Khaderi River and ultimately to Yamuna River. Pumping Station has been proposed at the up stream point where the nala merges with the Sasur Khaderi. This pumping station will also cater to the surrounding areas, which are expected to grow quickly. Proposed pumping station will discharge the sewage at the receiving chamber of proposed trunk sewer 4B at Numaya Road. This sewer will carry the discharge to the trunk sewer at Karamat Ki Chowki and finally to Ghaghar Nala PS. Final Proposal Anticipated peak flow for proposed pumping station will be as below:
• 371 lps in the year 2015 • 660 lps in the year 2030
To meet the above requirement for year 2015, 6 pumps are proposed with following capacities:
93 lps, 17 m head - 6 Nos. The other equipment to be installed for successful operation is enumerated below:
• Mechanical :
1) Mechanical and manual bar screens with sluice gates and conveyor system 2) Suction, Delivery lines, rising main with necessary valves and other accessories 3) 2 ton capacity HOT crane – 1 No.
• Electrical :
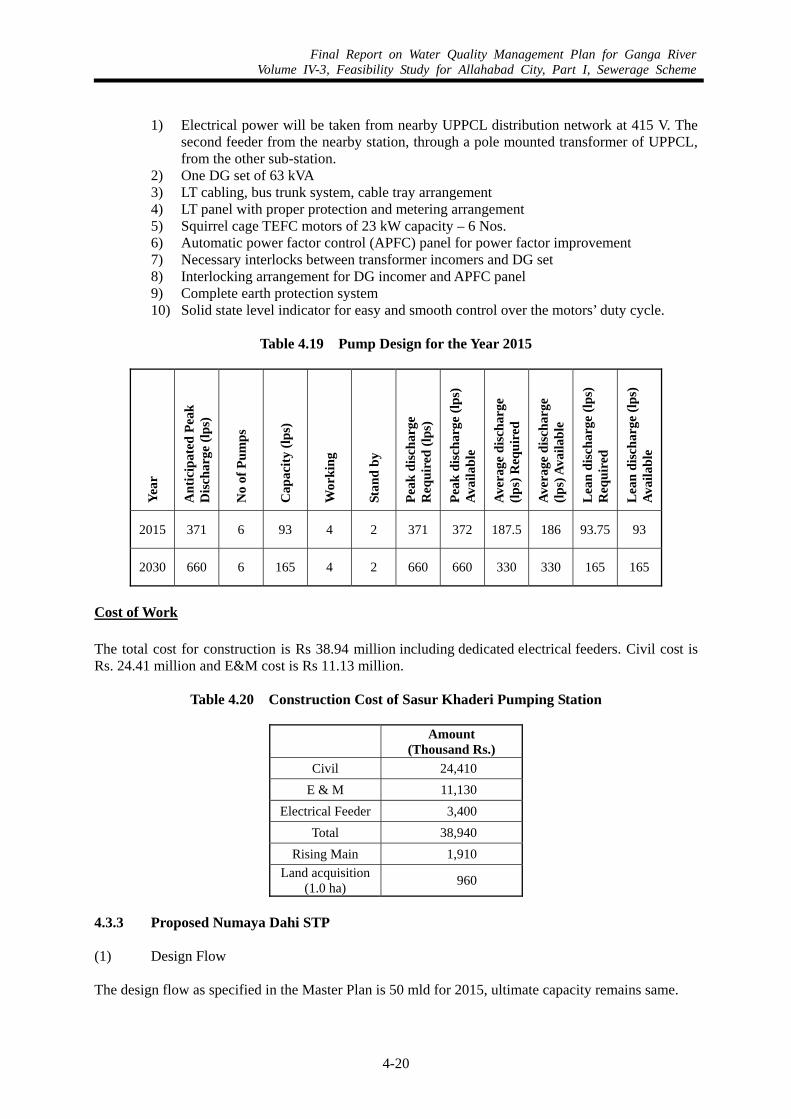
Final Report on Water Quality Management Plan for Ganga RiverVolume IV-3, Feasibility Study for Allahabad City, Part I, Sewerage Scheme
4-20
1) Electrical power will be taken from nearby UPPCL distribution network at 415 V. The
second feeder from the nearby station, through a pole mounted transformer of UPPCL, from the other sub-station.
2) One DG set of 63 kVA 3) LT cabling, bus trunk system, cable tray arrangement 4) LT panel with proper protection and metering arrangement 5) Squirrel cage TEFC motors of 23 kW capacity – 6 Nos. 6) Automatic power factor control (APFC) panel for power factor improvement 7) Necessary interlocks between transformer incomers and DG set 8) Interlocking arrangement for DG incomer and APFC panel 9) Complete earth protection system 10) Solid state level indicator for easy and smooth control over the motors’ duty cycle.
Table 4.19 Pump Design for the Year 2015
Year
Ant
icip
ated
Pea
k D
isch
arge
(lps
)
No
of P
umps
Cap
acity
(lps
)
Wor
king
Stan
d by
Peak
dis
char
ge
Req
uire
d (lp
s)
Peak
dis
char
ge (l
ps)
Avai
labl
e
Aver
age
disc
harg
e (lp
s) R
equi
red
Aver
age
disc
harg
e (lp
s) A
vaila
ble
Lea
n di
scha
rge
(lps)
R
equi
red
Lea
n di
scha
rge
(lps)
Av
aila
ble
2015 371 6 93 4 2 371 372 187.5 186 93.75 93
2030 660 6 165 4 2 660 660 330 330 165 165
Cost of Work
The total cost for construction is Rs 38.94 million including dedicated electrical feeders. Civil cost is Rs. 24.41 million and E&M cost is Rs 11.13 million.
Table 4.20 Construction Cost of Sasur Khaderi Pumping Station
Amount (Thousand Rs.)
Civil 24,410 E & M 11,130
Electrical Feeder 3,400 Total 38,940
Rising Main 1,910 Land acquisition
(1.0 ha) 960
4.3.3 Proposed Numaya Dahi STP (1) Design Flow The design flow as specified in the Master Plan is 50 mld for 2015, ultimate capacity remains same.
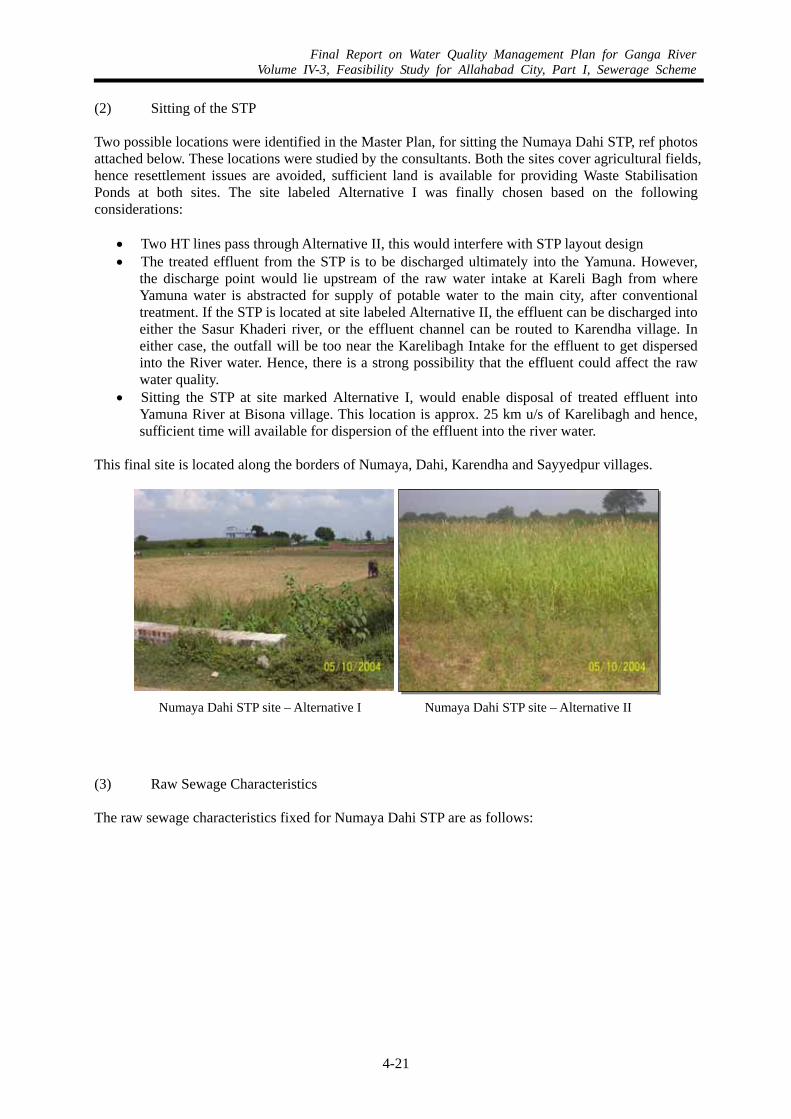
Final Report on Water Quality Management Plan for Ganga RiverVolume IV-3, Feasibility Study for Allahabad City, Part I, Sewerage Scheme
4-21
(2) Sitting of the STP Two possible locations were identified in the Master Plan, for sitting the Numaya Dahi STP, ref photos attached below. These locations were studied by the consultants. Both the sites cover agricultural fields, hence resettlement issues are avoided, sufficient land is available for providing Waste Stabilisation Ponds at both sites. The site labeled Alternative I was finally chosen based on the following considerations:
• Two HT lines pass through Alternative II, this would interfere with STP layout design • The treated effluent from the STP is to be discharged ultimately into the Yamuna. However,
the discharge point would lie upstream of the raw water intake at Kareli Bagh from where Yamuna water is abstracted for supply of potable water to the main city, after conventional treatment. If the STP is located at site labeled Alternative II, the effluent can be discharged into either the Sasur Khaderi river, or the effluent channel can be routed to Karendha village. In either case, the outfall will be too near the Karelibagh Intake for the effluent to get dispersed into the River water. Hence, there is a strong possibility that the effluent could affect the raw water quality.
• Sitting the STP at site marked Alternative I, would enable disposal of treated effluent into Yamuna River at Bisona village. This location is approx. 25 km u/s of Karelibagh and hence, sufficient time will available for dispersion of the effluent into the river water.
This final site is located along the borders of Numaya, Dahi, Karendha and Sayyedpur villages.
(3) Raw Sewage Characteristics The raw sewage characteristics fixed for Numaya Dahi STP are as follows:
Numaya Dahi STP site – Alternative I Numaya Dahi STP site – Alternative II
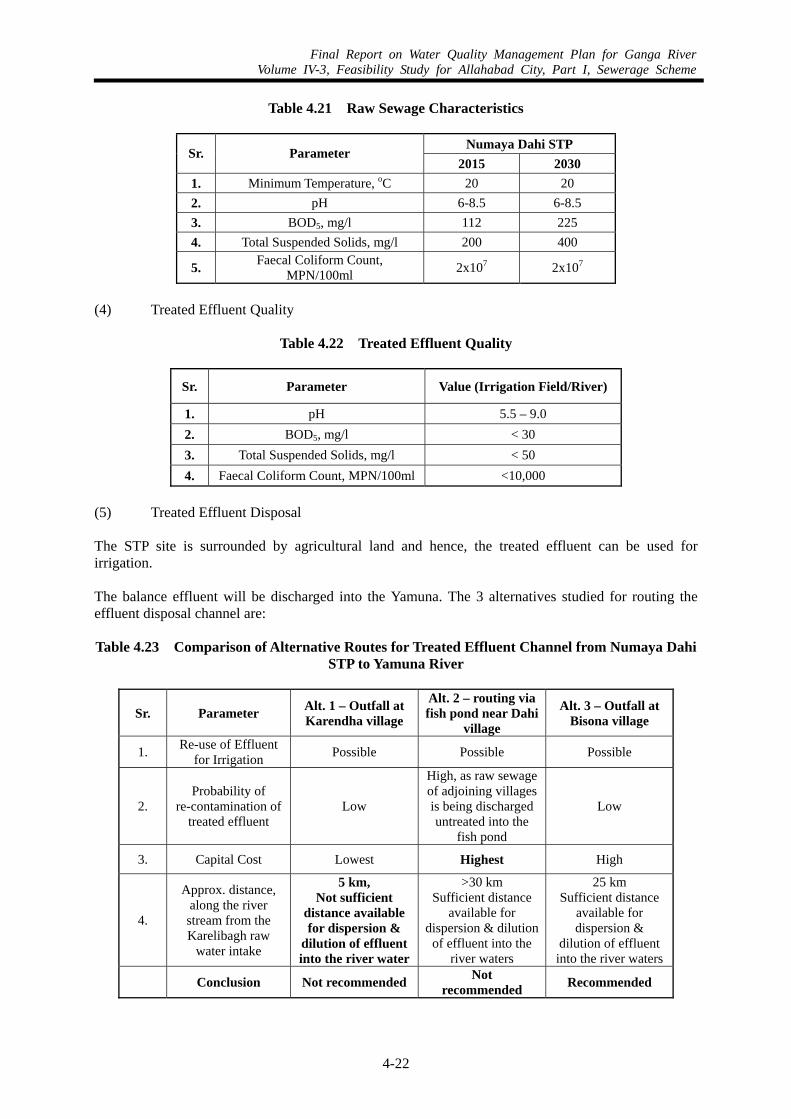
Final Report on Water Quality Management Plan for Ganga RiverVolume IV-3, Feasibility Study for Allahabad City, Part I, Sewerage Scheme
4-22
Table 4.21 Raw Sewage Characteristics
Numaya Dahi STP Sr. Parameter
2015 2030 1. Minimum Temperature, oC 20 20 2. pH 6-8.5 6-8.5 3. BOD5, mg/l 112 225 4. Total Suspended Solids, mg/l 200 400
5. Faecal Coliform Count, MPN/100ml 2x10⁷ 2x10⁷
(4) Treated Effluent Quality
Table 4.22 Treated Effluent Quality
Sr. Parameter Value (Irrigation Field/River)
1. pH 5.5 – 9.0 2. BOD5, mg/l < 30 3. Total Suspended Solids, mg/l < 50 4. Faecal Coliform Count, MPN/100ml <10,000
(5) Treated Effluent Disposal The STP site is surrounded by agricultural land and hence, the treated effluent can be used for irrigation. The balance effluent will be discharged into the Yamuna. The 3 alternatives studied for routing the effluent disposal channel are: Table 4.23 Comparison of Alternative Routes for Treated Effluent Channel from Numaya Dahi
STP to Yamuna River
Sr. Parameter Alt. 1 – Outfall at Karendha village
Alt. 2 – routing via fish pond near Dahi
village
Alt. 3 – Outfall at Bisona village
1. Re-use of Effluent for Irrigation Possible Possible Possible
2. Probability of
re-contamination of treated effluent
Low
High, as raw sewage of adjoining villages is being discharged untreated into the
fish pond
Low
3. Capital Cost Lowest Highest High
4.
Approx. distance, along the river stream from the Karelibagh raw
water intake
5 km, Not sufficient
distance available for dispersion &
dilution of effluent into the river water
>30 km Sufficient distance
available for dispersion & dilution
of effluent into the river waters
25 km Sufficient distance
available for dispersion &
dilution of effluent into the river waters
Conclusion Not recommended Not recommended Recommended
Final Report on Water Quality Management Plan for Ganga RiverVolume IV-3, Feasibility Study for Allahabad City, Part I, Sewerage Scheme
4-23
Total length of the channel from STP site to outfall at Bisona works out to 3.82 km. The ground profile along the route alternates between ridges and depressions and the channel gets elevated 3-4 m above the ground in some stretches and dips 3m below the general ground level in others. Wherever the channel is 1m or more below the ground, a box section has been provided to prevent cattle / other animals from falling into the water. To reduce the variation of channel levels from the ground levels, two different channel slopes have been used along the route. Additionally, a drop in invert levels has been proposed at Chainage 1.55. Inverted siphons have been provided to cross roads and other structures en-route. Details of Channel have been given in Table 4.24.
Table 4.24 Details of Effluent Channel
Section Type of Section
Chainage(km)
Length (m) Slope Size
(m)
Section-1 Rectangular 0 to 1.55 1,550 1 in 868 1.8 m x 0.91 m (FB - 0.29m)
Section 2 Rectangular 1.55 to 3.82 22,722 1 in 2481 1.8 m x 1.2 m
(FB - 0.30m)
(6) Treatment Technology The STP will be based on Waste Stabilisation Ponds because it is possible to acquire enough land for this technology. Anaerobic, Facultative and Maturation Ponds have been provided in series to achieve the desired effluent quality. (7) Design Methodology and Design Design methodology is as per the ‘Design Manual for Waste Stabilisation Ponds in India’ authored by Duncan Mara. Process Flow diagram is given in Figure 4.1. (8) Cost of Work
Table 4.25 Construction Cost of Numaya Dahi STP
Amount (Thousand Rs.)
Civil 227,260 Effluent channel to Bisona 38,850
Channel for irrigation 29,550 E & M 11,360
Electrical Feeder 20,900 Total 327,920
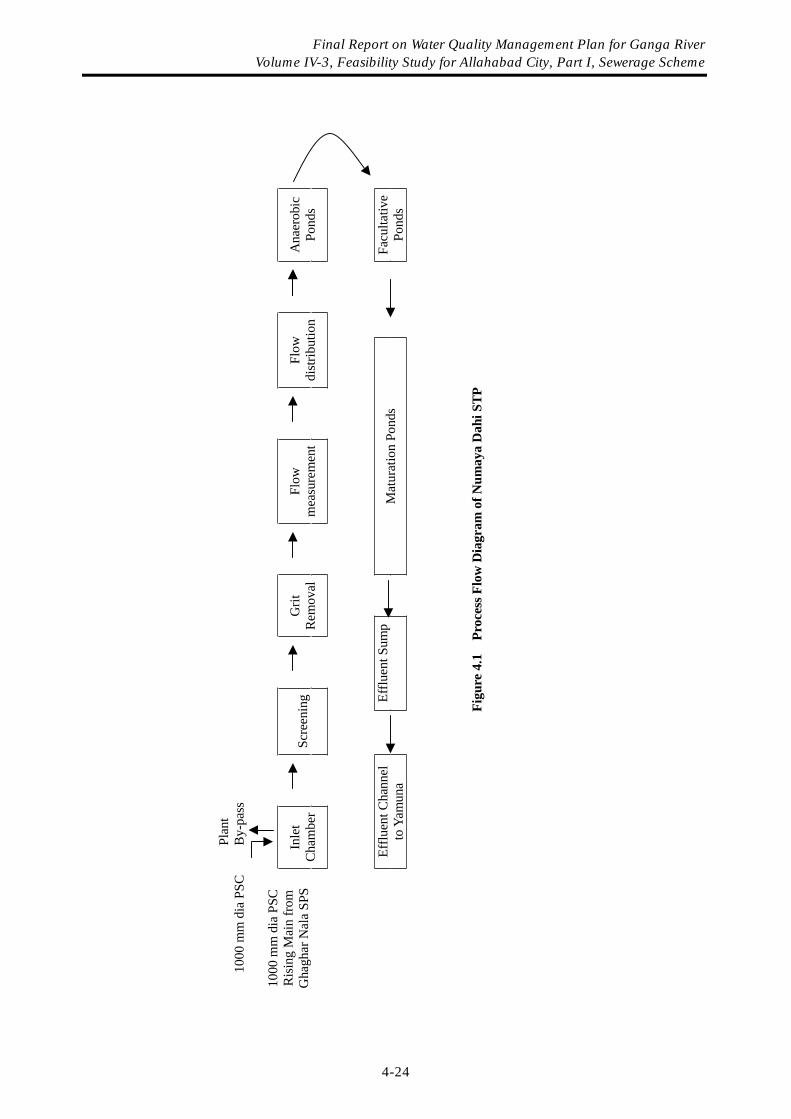
Pl
ant
1000
mm
dia
PSC
B
y-pa
ss
10
00 m
m d
ia P
SC
Ris
ing
Mai
n fro
m
Gha
ghar
Nal
a SP
S
Inle
tC
ham
ber
Scre
enin
gG
ritR
emov
alFl
owm
easu
rem
ent
Flow
dist
ribut
ion
Ana
erob
icPo
nds
Efflu
ent C
hann
el
to Y
amun
a
Efflu
ent S
ump
Mat
urat
ion
Pond
s Fa
culta
tive
Pond
s
Figu
re 4
.1
Proc
ess F
low
Dia
gram
of N
umay
a D
ahi S
TP
Final Report on Water Quality Management Plan for Ganga River Volume IV-3, Feasibility Study for Allahabad City, Part I, Sewerage Scheme
4-24
Final Report on Water Quality Management Plan for Ganga RiverVolume IV-3, Feasibility Study for Allahabad City, Part I, Sewerage Scheme
4-25
4.4 PROPOSED SEWAGE COLLECTION AND TREATMENT SYSTEM - DISTRICT E 4.4.1 Proposed System
• Construction of a new STP at Ponghat – 10 mld capacity in 2015. • Construction of a new STP at Kodara – 15 mld capacity in 2015, 30 mld capacity in 2030.
Design Criteria for the facilities has been given in Section I, design and details are presented here.
4.4.2 Proposed Ponghat STP (1) Design Flow The design flow as specified in the Master Plan is 10 mld for 2015, ultimate capacity remains same.
(2) Sitting of the STP The STP has been located along the borders of Mariyadih and Ponghat. The area use is agricultural, no resettlement issues are involved. The STP site is located slightly u/s of the Ponghat’s outfall into Ganga River. A small sump with screening and pumping arrangements has been provided to tap the Ponghat Nala. The trunk sewer for the area, to be laid in future (and not included in the priority projects) can be joined into this chamber for pumping of sewage to the STP, as the STP has been located on a local plateau to avoid costly flood protection works.
(3) Raw Sewage Characteristics The raw sewage characteristics fixed for Ponghat STP are as follows:
Table 4.26 Raw Sewage Characteristics
Value Sr. Parameter
2015 2030 1. Minimum Temperature, oC 20 20 2. pH 6-8.5 6-8.5 3. BOD5, mg/l 115 200 4. Total Suspended Solids, mg/l 207 360 5. Faecal Coliform Count, MPN/100ml 2x10⁷ 2x10⁷
(4) Treated Effluent Quality
Table 4.27 Treated Effluent Quality
Sr. Parameter Value (Irrigation Field/River)
1. pH 5.5 – 9.0 2. BOD5, mg/l < 30 3. Total Suspended Solids, mg/l < 50 4. Faecal Coliform Count, MPN/100ml <10,000
Final Report on Water Quality Management Plan for Ganga RiverVolume IV-3, Feasibility Study for Allahabad City, Part I, Sewerage Scheme
4-26
(5) Treated Effluent Disposal Treated effluent from Ponghat STP will be discharged back into the Nala, downstream of the tapping point. This STP will also be based on the pond technology and thus the effluent will be suitable for re-use as irrigation water in the fields adjoining the STP site.
(6) Treatment Technology The STP will be based on Waste Stabilisation Ponds because it is possible to acquire enough land for this technology. Anaerobic, Facultative and Maturation Ponds have been provided in series to achieve the desired effluent quality. (7) Design Methodology and Design Design methodology is as per the ‘Design Manual for Waste Stabilisation Ponds in India’ authored by Duncan Mara. Process Flow diagram is given in Figure 4.2.
(8) Cost of Work
Table 4.28 Construction Cost of Ponghat STP
Amount (Thousand Rs.)
Civil 67,200 Mechanical and Electrical 16,020
Total 83,220
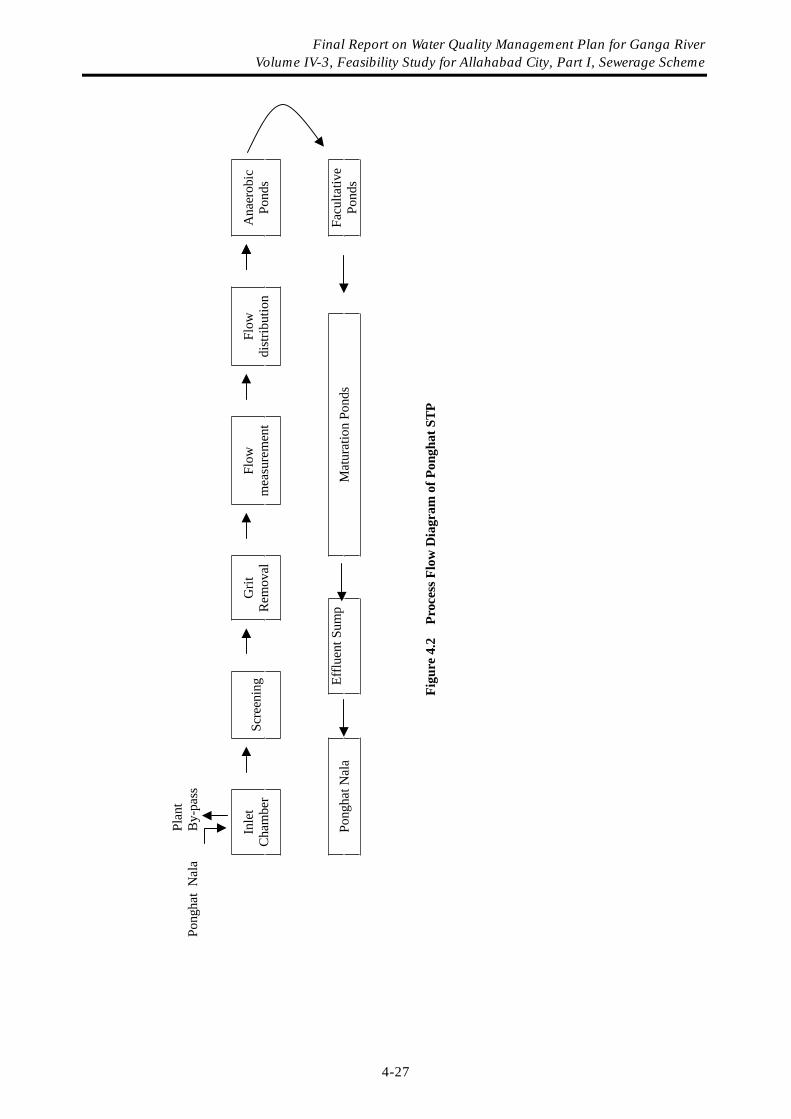
Pl
ant
Pong
hat
Nal
a
By-
pass
Inle
tC
ham
ber
Scre
enin
gG
ritR
emov
alFl
owm
easu
rem
ent
Flow
dist
ribut
ion
Ana
erob
icPo
nds
Po
ngha
t Nal
a
Efflu
ent S
ump
Mat
urat
ion
Pond
s Fa
culta
tive
Pond
s
Figu
re 4
.2
Proc
ess F
low
Dia
gram
of P
ongh
at S
TP
Final Report on Water Quality Management Plan for Ganga River Volume IV-3, Feasibility Study for Allahabad City, Part I, Sewerage Scheme
4-27
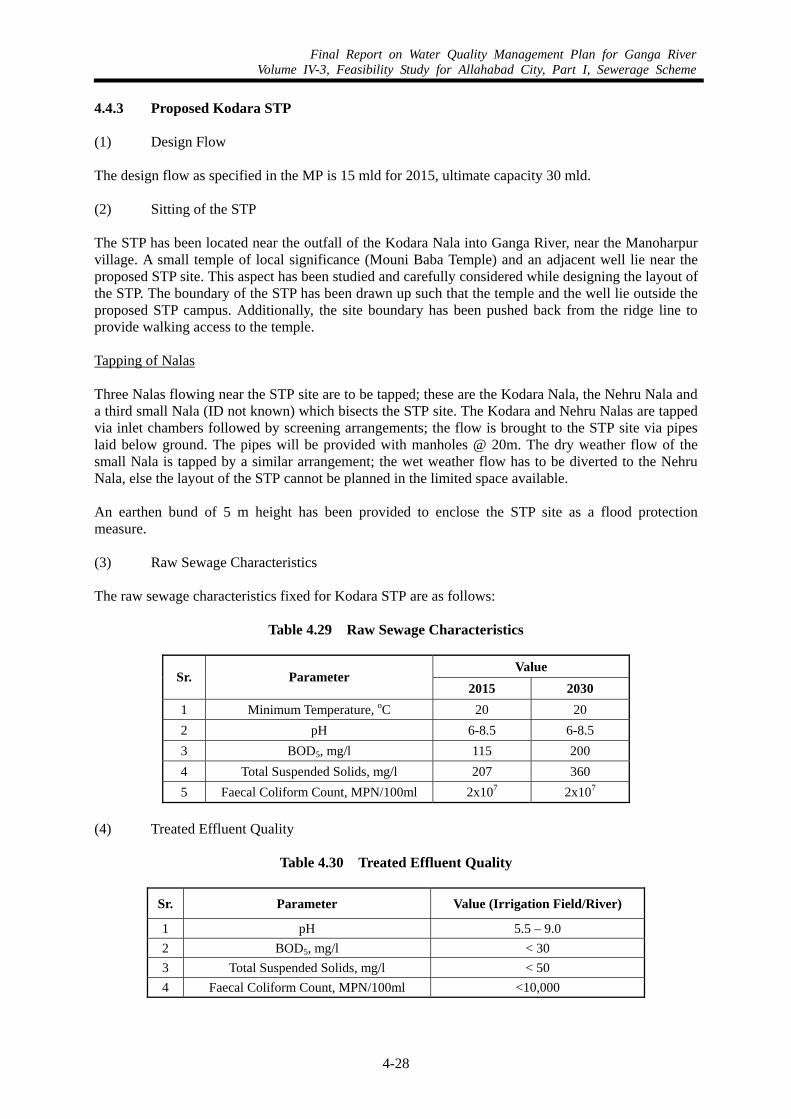
Final Report on Water Quality Management Plan for Ganga RiverVolume IV-3, Feasibility Study for Allahabad City, Part I, Sewerage Scheme
4-28
4.4.3 Proposed Kodara STP (1) Design Flow The design flow as specified in the MP is 15 mld for 2015, ultimate capacity 30 mld. (2) Sitting of the STP The STP has been located near the outfall of the Kodara Nala into Ganga River, near the Manoharpur village. A small temple of local significance (Mouni Baba Temple) and an adjacent well lie near the proposed STP site. This aspect has been studied and carefully considered while designing the layout of the STP. The boundary of the STP has been drawn up such that the temple and the well lie outside the proposed STP campus. Additionally, the site boundary has been pushed back from the ridge line to provide walking access to the temple. Tapping of Nalas Three Nalas flowing near the STP site are to be tapped; these are the Kodara Nala, the Nehru Nala and a third small Nala (ID not known) which bisects the STP site. The Kodara and Nehru Nalas are tapped via inlet chambers followed by screening arrangements; the flow is brought to the STP site via pipes laid below ground. The pipes will be provided with manholes @ 20m. The dry weather flow of the small Nala is tapped by a similar arrangement; the wet weather flow has to be diverted to the Nehru Nala, else the layout of the STP cannot be planned in the limited space available. An earthen bund of 5 m height has been provided to enclose the STP site as a flood protection measure. (3) Raw Sewage Characteristics The raw sewage characteristics fixed for Kodara STP are as follows:
Table 4.29 Raw Sewage Characteristics
Value Sr. Parameter
2015 2030 1 Minimum Temperature, oC 20 20 2 pH 6-8.5 6-8.5 3 BOD5, mg/l 115 200 4 Total Suspended Solids, mg/l 207 360 5 Faecal Coliform Count, MPN/100ml 2x10⁷ 2x10⁷
(4) Treated Effluent Quality
Table 4.30 Treated Effluent Quality
Sr. Parameter Value (Irrigation Field/River)
1 pH 5.5 – 9.0 2 BOD5, mg/l < 30 3 Total Suspended Solids, mg/l < 50 4 Faecal Coliform Count, MPN/100ml <10,000
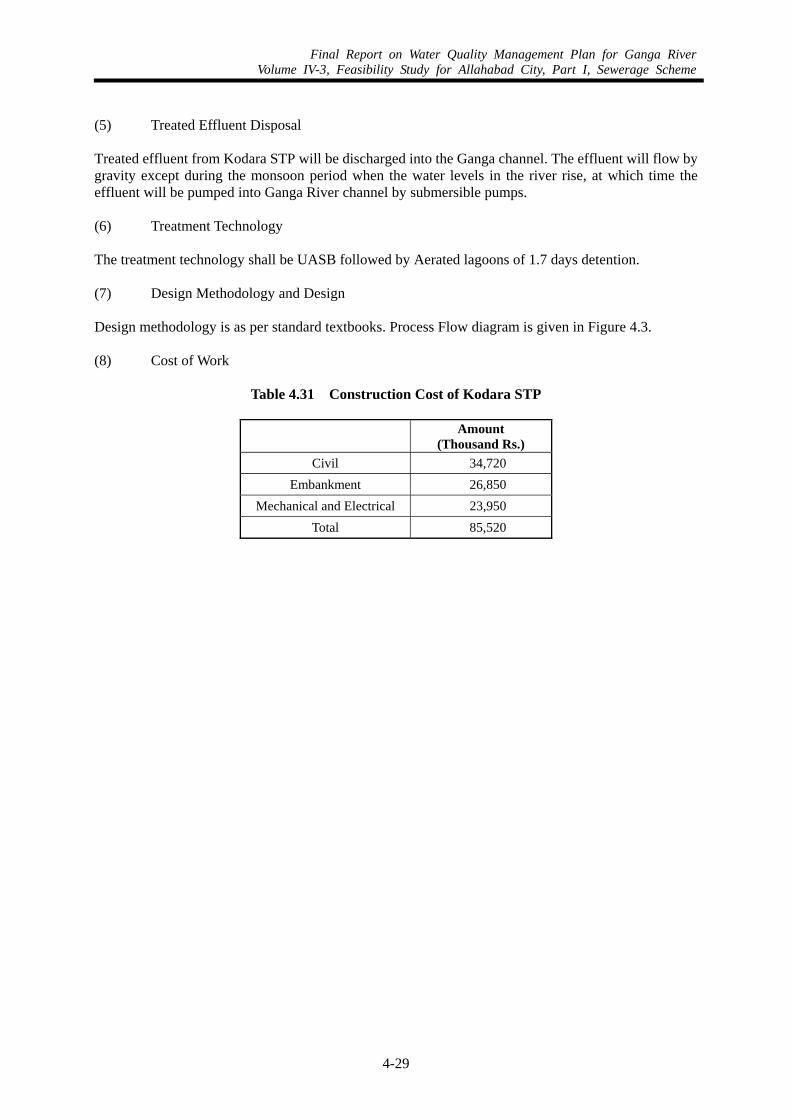
Final Report on Water Quality Management Plan for Ganga RiverVolume IV-3, Feasibility Study for Allahabad City, Part I, Sewerage Scheme
4-29
(5) Treated Effluent Disposal Treated effluent from Kodara STP will be discharged into the Ganga channel. The effluent will flow by gravity except during the monsoon period when the water levels in the river rise, at which time the effluent will be pumped into Ganga River channel by submersible pumps. (6) Treatment Technology The treatment technology shall be UASB followed by Aerated lagoons of 1.7 days detention. (7) Design Methodology and Design Design methodology is as per standard textbooks. Process Flow diagram is given in Figure 4.3.
(8) Cost of Work
Table 4.31 Construction Cost of Kodara STP
Amount (Thousand Rs.)
Civil 34,720 Embankment 26,850
Mechanical and Electrical 23,950 Total 85,520
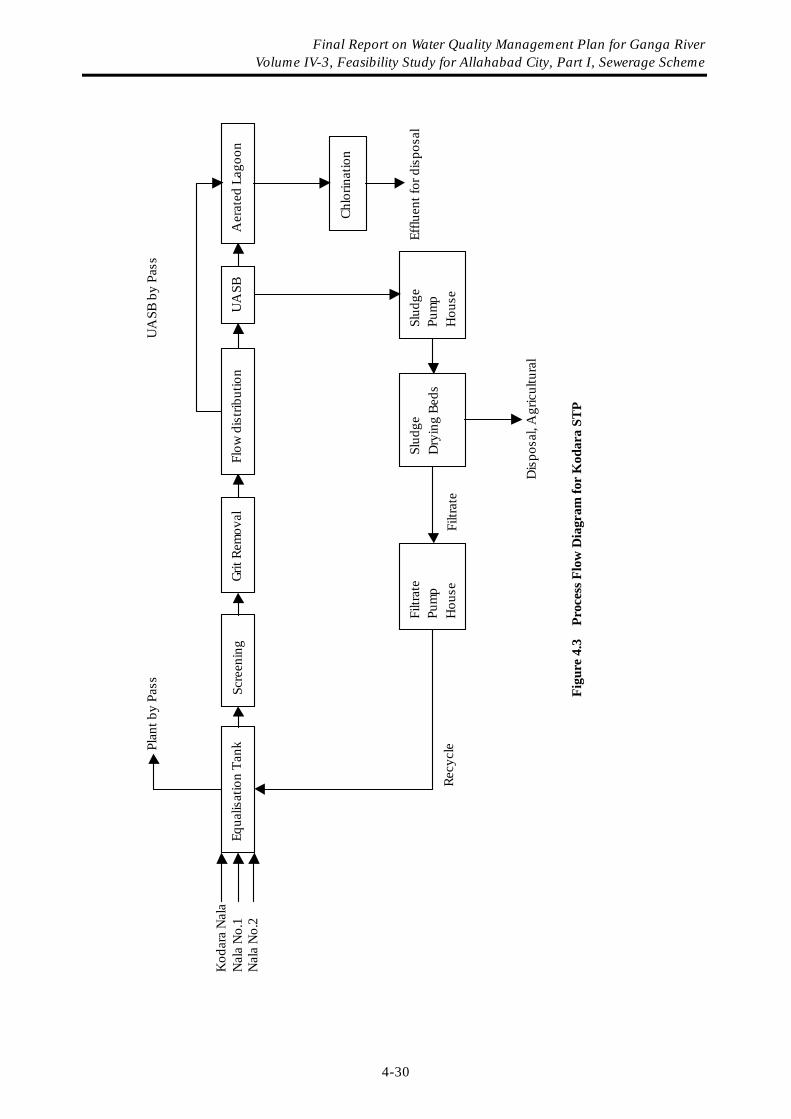
Figu
re 4
.3
Proc
ess F
low
Dia
gram
for
Kod
ara
STP
Equa
lisat
ion
Tank
Scre
enin
gGr
it Re
mov
al
Chlo
rinat
ion
Slud
gePu
mp
Hou
se
Slud
geD
ryin
g Be
dsFi
ltrat
ePu
mp
Hou
seRe
cycl
ePlan
t by
Pass
Filtr
ate
Dis
posa
l, A
gric
ultu
ral
Efflu
ent f
or d
ispo
sal
Kod
ara
Nal
aN
ala
No.
1N
ala
No.
2Fl
ow d
istri
butio
nU
ASB
Aer
ated
Lag
oon
UA
SB b
y Pa
ss
Final Report on Water Quality Management Plan for Ganga River Volume IV-3, Feasibility Study for Allahabad City, Part I, Sewerage Scheme
4-30