Upper San Joaquin River Regional Flood Management Plan
302
FINAL Upper San Joaquin River Regional Flood Management Plan February 2015 Prepared by:
-
Upload
khangminh22 -
Category
Documents
-
view
0 -
download
0
Transcript of Upper San Joaquin River Regional Flood Management Plan

FINAL
Upper San Joaquin River Regional Flood Management Plan
February 2015
Prepared by:


Funded by the California Department of Water Resources, with special acknowledgement of Paul Romero and Greg Farley of the South Central Region Office for their assistance.

Table of Contents Acronyms and Abbreviations ....................................................................................................................................................... vii Executive Summary ..................................................................................................................................................................... ES-1
Introduction ...................................................................................................................................................................... ES-1 Relationship to Central Valley Flood Protection Plan ......................................................................................... ES-1 Purpose and Goals .......................................................................................................................................................... ES-2 Regional Partners ............................................................................................................................................................ ES-3 Regional Setting and Demographics ....................................................................................................................... ES-4 Land Use ............................................................................................................................................................................. ES-7 Natural Resources ........................................................................................................................................................... ES-7 Flood Management Issues ........................................................................................................................................... ES-8 System Improvements and Prioritization ............................................................................................................... ES-9 Financial Plan ................................................................................................................................................................. ES-11 Recommendations ....................................................................................................................................................... ES-12
Prioritized System Improvements ................................................................................................................. ES-12 Financial Planning .............................................................................................................................................. ES-12 Multibenefit Projects ......................................................................................................................................... ES-13 Proposed Studies ................................................................................................................................................ ES-14
Future Implementation .............................................................................................................................................. ES-15 1.0 Introduction ........................................................................................................................................................................ 1-1
1.1 Background ............................................................................................................................................................ 1-1 1.2 Purpose and Goals ............................................................................................................................................... 1-1 1.3 Regional Partners ................................................................................................................................................. 1-5 1.4 Organization .......................................................................................................................................................... 1-6 1.5 Limitation of Information Sources ................................................................................................................. 1-6
2.0 Regional Setting ................................................................................................................................................................ 2-1 2.1 General Description of the Region ................................................................................................................. 2-1 2.2 Flood Hazards ........................................................................................................................................................ 2-7 2.3 Demographics .................................................................................................................................................... 2-15
2.3.1 Madera County ...................................................................................................................................... 2-16 2.3.2 Merced County ...................................................................................................................................... 2-17 2.3.3 Fresno County ....................................................................................................................................... 2-17
2.4 Land Use ............................................................................................................................................................... 2-17 2.4.1 Land Use Data ........................................................................................................................................ 2-18 2.4.2 Significant Land Uses .......................................................................................................................... 2-25 2.4.3 Land Use by County ............................................................................................................................. 2-32
2.5 Natural Resources ............................................................................................................................................. 2-45 2.5.1 Geology .................................................................................................................................................... 2-46 2.5.2 Hydrology................................................................................................................................................ 2-47
Upper San Joaquin River Regional Flood Management Plan i

TABLE OF CONTENTS
2.5.3 Biological Resources ............................................................................................................................ 2-52 3.0 Institutional and Governance ....................................................................................................................................... 3-1
3.1 Local Agencies ...................................................................................................................................................... 3-1 3.1.1 Lower San Joaquin Levee District ...................................................................................................... 3-2 3.1.2 San Joaquin River Flood Control Project Agency ......................................................................... 3-2 3.1.3 Madera County FCWCA ......................................................................................................................... 3-2 3.1.4 Merced Streams Group .......................................................................................................................... 3-3 3.1.5 Central California Irrigation District .................................................................................................. 3-3 3.1.6 Merced Irrigation District ...................................................................................................................... 3-3 3.1.7 Kings River Conservation District ....................................................................................................... 3-3 3.1.8 Grasslands Water District ...................................................................................................................... 3-4 3.1.9 Gravelly Ford Water District ................................................................................................................. 3-4 3.1.10 Chowchilla Water District ..................................................................................................................... 3-4 3.1.11 Fresno Slough Improvement Group ................................................................................................. 3-4 3.1.12 Cities and Counties ................................................................................................................................. 3-4
3.2 Federal Agencies .................................................................................................................................................. 3-5 3.2.1 United States Army Corps of Engineers ........................................................................................... 3-5 3.2.2 United States Bureau of Reclamation ............................................................................................... 3-7 3.2.3 NOAA Fisheries ......................................................................................................................................... 3-7 3.2.4 United States Fish and Wildlife Service ............................................................................................ 3-7
3.3 State Agencies ....................................................................................................................................................... 3-7 3.3.1 California Department of Water Resources .................................................................................... 3-7 3.3.2 Central Valley Flood Protection Board ............................................................................................. 3-8 3.3.3 California Office of Emergency Services ....................................................................................... 3-11 3.3.4 California Department of Fish and Wildlife ................................................................................. 3-11 3.3.5 State Water Resources Control Board and Regional Water Quality Control Board ....... 3-11 3.3.6 California Department of Conservation ....................................................................................... 3-11
3.4 Regulatory and Environmental Compliance ........................................................................................... 3-12 3.4.1 Legislation and Regulatory Requirements .................................................................................. 3-12 3.4.2 Environmental Compliance and Permitting ............................................................................... 3-16
3.5 Planning, Restoration, and Conservation Programs ............................................................................. 3-20 3.6 Institutional Issues and Deficiencies .......................................................................................................... 3-32
4.0 Flood Management .......................................................................................................................................................... 4-1 4.1 Flood Risk ................................................................................................................................................................ 4-1 4.2 Existing Flood Management Infrastructure ................................................................................................ 4-2
4.2.1 San Joaquin River Flood Control Project ......................................................................................... 4-4 4.2.2 Upstream Flood Facilities ..................................................................................................................... 4-5 4.2.3 Project Levees ........................................................................................................................................... 4-6 4.2.4 Bypasses and Other Flood Management Structures ................................................................... 4-7 4.2.5 Merced Streams Group ....................................................................................................................... 4-12 4.2.6 Madera County Flood Facilities ....................................................................................................... 4-14
ii Upper San Joaquin River Regional Flood Management Plan

TABLE OF CONTENTS
4.3 Local Agency Flood Management Operations and Maintenance ................................................... 4-15 4.3.1 Lower San Joaquin Levee District ................................................................................................... 4-15 4.3.2 Merced Streams Group ....................................................................................................................... 4-20 4.3.3 Madera County FCWCA ...................................................................................................................... 4-22 4.3.4 Fresno Slough Improvement Group .............................................................................................. 4-23 4.3.5 Nonproject Facilities ............................................................................................................................ 4-24 4.3.6 Agencies with O&M Responsibility for Upstream Flood Facilities ....................................... 4-25
4.4 Emergency Management ............................................................................................................................... 4-25 4.4.1 What is Flood Emergency Management? .................................................................................... 4-26 4.4.2 Why Is Emergency Management Planning Important? .......................................................... 4-26 4.4.3 Flood Response ..................................................................................................................................... 4-28 4.4.4 Agency Roles and Responsibilities ................................................................................................. 4-33 4.4.5 Emergency Management Planning ............................................................................................... 4-41
4.5 Flood Management Issues and Deficiencies ........................................................................................... 4-51 4.5.1 Flood Management Infrastructure ................................................................................................. 4-51 4.5.2 Operations and Maintenance........................................................................................................... 4-58 4.5.3 Emergency Management .................................................................................................................. 4-64 4.5.4 Funding .................................................................................................................................................... 4-64
4.6 Summary of Flood Issues and Deficiencies .............................................................................................. 4-65 4.6.1 Lower San Joaquin Levee District ................................................................................................... 4-65 4.6.2 Merced Streams Group ....................................................................................................................... 4-66 4.6.3 Madera County FCWCA ...................................................................................................................... 4-66
5.0 Proposed System Improvements ................................................................................................................................ 5-1 5.1 System Improvement Identification .............................................................................................................. 5-1 5.2 System Improvement Database ..................................................................................................................... 5-1 5.3 System Improvement List ................................................................................................................................. 5-2 5.4 Cost Estimating ..................................................................................................................................................... 5-3
6.0 Evaluation of System Improvements ......................................................................................................................... 6-1 6.1 Criteria Selection .................................................................................................................................................. 6-1
6.1.1 Senate Bill 5 ............................................................................................................................................... 6-1 6.1.2 FloodSAFE Initiative ................................................................................................................................ 6-1 6.1.3 CVFPP SSIA ................................................................................................................................................. 6-2 6.1.4 CVFPP Conservation Strategy ............................................................................................................. 6-2 6.1.5 Criteria Definition .................................................................................................................................... 6-3
6.2 Criteria Importance Factors .............................................................................................................................. 6-3 6.3 Criteria Scoring ..................................................................................................................................................... 6-3 6.4 System Improvement Evaluation ................................................................................................................ 6-11 6.5 System Improvement Prioritization Results ............................................................................................ 6-11
7.0 Regional Finance Plan...................................................................................................................................................... 7-1 7.1 Introduction ........................................................................................................................................................... 7-1 7.2 Regional Economic Outlook ............................................................................................................................. 7-1
Upper San Joaquin River Regional Flood Management Plan iii

TABLE OF CONTENTS
7.2.1 Disadvantaged Communities.............................................................................................................. 7-1 7.2.2 Counties ...................................................................................................................................................... 7-2 7.2.3 Local Implementing Agencies ............................................................................................................ 7-3
7.3 Funding Sources ................................................................................................................................................... 7-5 7.3.1 Federal Programs .................................................................................................................................... 7-5 7.3.2 State Programs ......................................................................................................................................... 7-8
7.4 System Improvements .................................................................................................................................... 7-10 7.4.1 Tier 1 System Improvements ............................................................................................................ 7-10 7.4.2 Potential System Improvement Funding ..................................................................................... 7-10 7.4.3 Summary of Tier 1 Funding Scenarios .......................................................................................... 7-37 7.4.4 Tier 2 and Tier 3 System Improvements ....................................................................................... 7-37
7.5 Findings ................................................................................................................................................................ 7-40 7.6 Recommendations ........................................................................................................................................... 7-40
8.0 Recommendations and Future Implementation ................................................................................................... 8-1 8.1 Recommendations .............................................................................................................................................. 8-1
8.1.1 Prioritization of System Improvements ........................................................................................... 8-1 8.1.2 Multibenefit Projects .............................................................................................................................. 8-2 8.1.3 Proposed Studies ..................................................................................................................................... 8-4
8.2 Future Implementation ...................................................................................................................................... 8-6 9.0 References ........................................................................................................................................................................... 9-1
Appendixes Appendix A: Flood Risk Calculations Appendix B: Species Identified with Potential to Exist in the USJR Region Appendix C: Permitting Requirements Appendix D: Summary of Key Information from County Emergency Operation Plans Appendix E: Proposed System Improvements – Worksheet Template Appendix F: Communications with Stakeholders Appendix G: Proposed System Improvements – Backup Information Worksheets Appendix H: Proposed System Improvements – Backup Information for Cost Estimates Appendix I: Proposed System Improvements Evaluation
List of Tables Table ES-1. Stakeholder Entities in the USJR Region .................................................................................................... ES-3 Table ES-2. Tier 1 System Improvements ...................................................................................................................... ES-10 Table ES-3. Tier 1 Non-Urban System Improvements Funding Scenarios Summary ..................................... ES-12 Table ES-4. Tier 1 Urban System Improvements Funding Scenarios Summary ............................................... ES-12 Table 1-1. Stakeholder Entities in the USJR Region ...................................................................................................... 1-5 Table 2-1. San Joaquin River Reaches................................................................................................................................ 2-1 Table 2-2. History of Flood Events in the Upper San Joaquin River Region ......................................................... 2-9
iv Upper San Joaquin River Regional Flood Management Plan

TABLE OF CONTENTS
Table 2-3. Percentage of County Area in the USJR Region ..................................................................................... 2-16 Table 2-4. Demographics and Income Levels in the USJR Region ....................................................................... 2-16 Table 2-5. Types of Crops in the Upper San Joaquin River Region....................................................................... 2-21 Table 2-6. Summary of Land Use Data within USJR Region .................................................................................... 2-23 Table 2-7. Generalized Effects on Geomorphic Processes by Flood Control Infrastructure ........................ 2-47 Table 2-8. Sequential Summary of Modifications to the Hydrology of the San Joaquin River ................... 2-47 Table 2-9. Upper San Joaquin River Region Flood Frequency Analysis .............................................................. 2-50 Table 3-1. Concurrent Planning Efforts in the USJR Region.................................................................................... 3-20 Table 3-2. Ecological Goals, Objectives, and Metrics ................................................................................................ 3-24 Table 4-1. Summary of Components of the Upper San Joaquin River Flood Control System....................... 4-3 Table 4-2. Summary of Components of Merced and Madera Flood Control Systems ..................................... 4-3 Table 4-3. Levees within USJR Region ............................................................................................................................... 4-6 Table 4-4. Published Design Capacity for the Bypass System of Lower San Joaquin Flood Control
Project ...................................................................................................................................................................... 4-7 Table 4-5. Agency Flood Emergency Management Responsibility by County ................................................ 4-35 Table 5-1. SI Database Worksheet ...................................................................................................................................... 5-2 Table 5-2. Summary of System Improvements .............................................................................................................. 5-5 Table 5-3. Proposed System Improvements by Category ....................................................................................... 5-17 Table 6-1. USJR RFMP Evaluation Criteria ........................................................................................................................ 6-4 Table 6-2. Public Safety System Improvement Subcriteria Definitions ................................................................. 6-6 Table 6-3. Environmental Stewardship System Improvement Subcriteria Definitions .................................... 6-7 Table 6-4. Economic Stability System Improvement Subcriteria Definitions ...................................................... 6-9 Table 6-5. Regional Issues System Improvement Subcriteria Definitions ......................................................... 6-10 Table 6-6. Public Safety Evaluation Results .................................................................................................................. 6-13 Table 6-7. Environmental Stewardship Evaluation Results ..................................................................................... 6-17 Table 6-8. Economic Stability Evaluation Results ....................................................................................................... 6-21 Table 6-9. Regional Issues Evaluation Results.............................................................................................................. 6-25 Table 6-10. Overall Tiered Evaluation Results ................................................................................................................ 6-29 Table 7-1. Federal Public Safety Grant Programs .......................................................................................................... 7-6 Table 7-2. Federal Environmental Stewardship Grant Program .............................................................................. 7-7 Table 7-3. State Public Safety Grants Program ............................................................................................................... 7-8 Table 7-4. State Environmental Stewardship Grants Programs ............................................................................... 7-9 Table 7-5. System Improvements Matched with Public Safety Funding Sources ........................................... 7-13 Table 7-6. System Improvements Matched with Environmental Stewardship Funding Sources ............. 7-17 Table 7-7. Detailed Public Safety Funding Source Descriptions ........................................................................... 7-21 Table 7-8. Detailed Environmental Funding Source Descriptions ....................................................................... 7-25 Table 7-9. Tier 1 Non-Urban System Improvement Funding Information ........................................................ 7-30 Table 7-10. Tier 1 Urban System Improvements Funding Information ................................................................ 7-35 Table 7-11. Tier 1 Non-Urban System Improvements Funding Scenarios Summary ....................................... 7-38 Table 7-12. Tier 1 Urban System Improvements Funding Scenarios Summary ................................................. 7-39
Upper San Joaquin River Regional Flood Management Plan v

TABLE OF CONTENTS
vi Upper San Joaquin River Regional Flood Management Plan
List of Figures Figure ES-1. Upper San Joaquin River Regional Flood Management Planning Area .......................................... ES-5 Figure 1-1. Upper San Joaquin River Regional Flood Management Planning Area ............................................ 1-3 Figure 2-1. Upper San Joaquin River Region Map .......................................................................................................... 2-3 Figure 2-2. Upper San Joaquin River Reach Locations .................................................................................................. 2-5 Figure 2-3. Land Use in the USJR Region ........................................................................................................................ 2-19 Figure 2-4. Farmland of Statewide Significance in the USJR Region ..................................................................... 2-27 Figure 2-5. Managed Environmental Lands ................................................................................................................... 2-29 Figure 2-6. Comparison of Changes in Land Use in the Southeastern Portion of USJR Region in
Fresno County 1986-2000 .............................................................................................................................. 2-35 Figure 2-7. Comparison of the Change in Land Use in the USJR Region in Madera County near the
Confluence of the Fresno River and Eastside Bypass 1995-2001 ..................................................... 2-39 Figure 2-8. Comparison of Changes in Land Use in the USJR Region in Merced County near Los
Banos Wildlife Area 1995-2002 ..................................................................................................................... 2-43 Figure 3-1. State Plan of Flood Control Area..................................................................................................................... 3-9 Figure 3-2. IRWM Areas in the USJR Region ................................................................................................................... 3-27 Figure 4-1. Existing Critical Facilities and Economic Assets...................................................................................... 4-29 Figure 4-2. Levee Issues and Problem Areas .................................................................................................................. 4-31 Figure 4-3. Location and Amount of Published Maximum Upstream Design Flow Capacity ...................... 4-39 Figure 4-4. Subsidence Rates in the Washington Avenue/Red Top Areas .......................................................... 4-51 Figure 4-5. Cross Section Demonstrating Effects of Subsidence and Photos of Subsidence ....................... 4-53 Figure 4-6. Areas of Subsidence in the USJR Region................................................................................................... 4-55 Figure 4-7. Slope Instability and Erosion Locations in the USJR Region .............................................................. 4-59 Figure 4-8. Seepage Map of the USJR Region ............................................................................................................... 4-61 Figure 7-1. Matching System Improvements with Outside Funding Sources ................................................... 7-11 Figure 7-2. Cost Allocation for Different Funding Scenarios for Tier 1 Non-Urban Improvements ........... 7-38 Figure 7-3. Cost Allocation for Different Funding Scenarios for Tier 1 Urban Improvements ..................... 7-39

Acronyms and Abbreviations °F degrees Fahrenheit
AB Assembly Bill
ACEP Agricultural Conservation Easement Program
ACHP Advisory Council on Historic Preservation
AF acre-feet
BCSDS Bear Creek siphon and diversion structure
BMP best management practice
Cal EMA California Emergency Management Agency
Cal FIRE California Department of Forestry and Fire Protection
Cal OES California Office of Emergency Services
CalEPPC California Exotic Pest Plant Council
Caltrans California Department of Transportation
CCC California Conservation Corps
CCID Central California Irrigation District
CDEC California Data Exchange Center
CDFW California Department of Fish and Wildlife
CDP Census-Designated Place
CEC California Energy Commission
Census United States Census Bureau
CEO County Executive Officer
CEQA California Environmental Quality Act
CESA California Endangered Species Act
CFR Code of Federal Regulations
cfs cubic feet per second
CHP California Highway Patrol
CNRA California Natural Resources Agency
CRPR California Rare Plant Rank
CSP California State Parks
CVFPB Central Valley Flood Protection Board
CVFPP Central Valley Flood Protection Plan
CVP Central Valley Project
CVPIA Central Valley Project Improvement Act of 1992
DAC disadvantaged community
Upper San Joaquin River Regional Flood Management Plan vii

ACRONYMS AND ABBREVIATIONS
Delta Sacramento-San Joaquin Delta
DFM Division of Flood Management
DMC Delta-Mendota Canal
DOC California Department of Conservation
DPS distinct population segment
DSOD Division of Safety of Dams
DWR California Department of Water Resources
EAH expected annual habitat
EAP Emergency Action Plan
EFH Essential Fish Habitat
EIS Environmental Impact Statement
ENR Engineering News Record
EOC Emergency Operation Center
EOP Emergency Operation Plan
EQIP Environmental Quality Incentives Program
ESA Endangered Species Act
ESU evolutionary significant unit
FCWCA Flood Control and Water Conservation Agency
FEMA Federal Emergency Management Agency
FIP floodplain inundation potential
FOC Flood Operations Center
FY fiscal year
gpm gallons per minute
GVGSP Great Valley Grasslands State Park
H:V horizontal to vertical
HCP Habitat Conservation Plan
hp horsepower
ID Irrigation District
IRWM Integrated Regional Water Management
IWM Integrated Water Management
JOC Joint Operations Center
KRCD Kings River Conservation District
LM levee mile
LMA local maintaining agency
LSJLD Lower San Joaquin Levee District
MBTA Migratory Bird Treaty Act
viii Upper San Joaquin River Regional Flood Management Plan

ACRONYMS AND ABBREVIATIONS
MHI median household income
MSG Merced Streams Group
NAHC Native American Heritage Commission
NAWCA North American Wetlands Conservation Act of 1989
NCCP Natural Community Conservation Planning
NFIP National Flood Insurance Program
NGO nongovernmental organization
NIMS National Incident Management System
NMFS National Marine Fisheries Service
NPDES National Pollutant Discharge Elimination System
NPS National Park Service
NRCS Natural Resources Conservation Service
NRDC Natural Resources Defense Council
NRHP National Register of Historic Places
NULE non-urban levee Evaluation
NWR National Wildlife Refuge
NWS National Weather Service
O&M operations and maintenance
OES Office of Emergency Services
Parkway Plan San Joaquin River Parkway Master Plan
PEIS/R Programmatic Environmental Impact Statement/Environmental Impact Report
PIO Public Information Officer
PL Public Law
Reclamation United States Bureau of Reclamation
RFMP Regional Flood Management Plan
RIP Rehabilitation and Inspection Program
RM river mile
RWQCB Regional Water Quality Control Board
SB Senate Bill
SCADA supervisory control and data acquisition
SCE Southern California Edison
SEMS Standardized Emergency Management System
Settlement Notice of Lodgment of Stipulation of Settlement (NRDC v. Rodgers et al., 2006)
SHPO State Historic Preservation Office
Upper San Joaquin River Regional Flood Management Plan ix

ACRONYMS AND ABBREVIATIONS
SI System Improvement
SJRC San Joaquin River Conservancy
SJRECWA San Joaquin River Exchange Contractors Water Authority
SJRFCPA San Joaquin River Flood Control Project Agency
SJRP San Joaquin River Partnership
SJRRP San Joaquin River Restoration Program
SLC State Lands Commission
SMARA California Surface Mining and Reclamation Act of 1975
SPFC State Plan of Flood Control
SSIA State Systemwide Investment Approach
SSJV Sacramento-San Joaquin Valley
SWRCB State Water Resources Control Board
T&E threatened and endangered
U.S.C. United States Code
ULE urban levee evaluation
USACE United States Army Corps of Engineers
USDA United States Department of Agriculture
USEPA United States Environmental Protection Agency
USFWS United States Fish and Wildlife Service
USGS United States Geological Survey
USJR Upper San Joaquin River
WCB Wildlife Conservation Board
WD Water District
x Upper San Joaquin River Regional Flood Management Plan

Executive Summary
Introduction The Upper San Joaquin River (USJR) region is an agricultural area that has historically experienced major losses as a result of flooding events. Significant improvements are needed to reduce the risk of flooding to appropriate levels, and substantial funding sources are needed to support these investments. The USJR region has made significant progress reaching out to local stakeholders through the Regional Flood Management Plan (RFMP) process to identify needed flood improvements and evaluate opportunities for developing potential multibenefit projects. Because the USJR region has minimal capacity to generate local funding for flood system improvements (SIs), the region will need to seek Federal and State sources to fund structural and nonstructural improvements to reduce residual flood risk.
Agriculture provides the foundation for the regional economy, and development of a flood management plan that supports sustainable agriculture is critical to the long-term economic viability of the region. Loss of highly productive agricultural lands would have an impact on the long-term economy of the region and would degrade the capabilities of local maintaining agencies (LMAs) to sustain existing facilities. The USJR region also includes a variety of habitats that support fish and wildlife species, large areas of managed wildlife refuges, and a multiagency program with a focus on native fisheries restoration. For this reason, the USJR RFMP has adopted a principle of promoting environmental and agricultural stewardship, which requires that benefits provided by the natural environment and agriculture be recognized and considered when evaluating potential improvements to the flood management system.
The USJR RFMP does not include any mega-projects that will solve the regional public safety, environmental, and flood management issues alone; however, the RFMP identifies a series of smaller structural and nonstructural SIs and actions that address a range of critical flood-related problems. When taken holistically, these improvements and actions will work to reduce residual flood risk in the Central Valley. Only through careful evaluation of these identified SIs can a mix of single-purpose flood and multibenefit SIs be developed to significantly improve flood infrastructure, flood system resiliency, operations and maintenance (O&M), emergency management, and environmental enhancement.
Making commitments regarding how specific SIs will be bundled or combined to create multibenefit projects is not feasible or reasonable at this time because many of the projects require refinements prior to implementation. However, the RFMP does identify potential linkages between SIs where integration opportunities can be evaluated in future planning and implementation phases when cost-sharing and financing capabilities are more fully understood. The USJR RFMP also identifies a number of example multibenefit SIs that provide broad regional potential benefits and have the support of local stakeholders.
Relationship to Central Valley Flood Protection Plan The San Joaquin River Flood Control Project Agency (SJRFCPA) is developing the USJR RFMP in support of the Central Valley Flood Protection Plan (CVFPP) effort. The SJRFCPA is a joint powers authority created to coordinate the efforts of the RFMP process and to represent local agency and landowner interests. The SJRFCPA consists of the Lower San Joaquin Levee District (LSJLD) and San Joaquin River Exchange Contractors Water Authority.
Upper San Joaquin River Regional Flood Management Plan ES-1

EXECUTIVE SUMMARY
This plan, along with two other regional plans—the Middle San Joaquin RFMP and the Lower San Joaquin RFMP—will provide local stakeholder information that will be used to support the development of the San Joaquin River Basinwide Feasibility Study (BWFS) and refinement of the State Systemwide Investment Approach (SSIA) and priorities for improving the flood management system to be incorporated in the 2017 update of the CVFPP. The RFMP effort was funded by a Proposition 1E grant from California Department of Water Resources (DWR).
The RFMP identifies and articulates flood management challenges and deficiencies at the regional level, and reviews the potential actions and SIs brought forward by local agencies and other stakeholders in the region. The RFMP provides a vision for flood management in the USJR region, identifies high-priority solutions to improve flood management, prioritizes needed projects, provides cost estimates and a preliminary finance plan, and identifies potential opportunities to develop multibenefit projects consistent with the Draft Central Valley Flood System Conservation Strategy.
Purpose and Goals The purpose of this USJR RFMP is to develop a plan that incorporates local knowledge and experience, and represents regional interests in development of short-term and long-term structural and nonstructural SIs for flood risk reduction. The RFMP provides a reconnaissance-level assessment of regional flood risk that:
• Documents existing flood risk conditions and management along the USJR and its tributaries • Identifies flood problems and issues, such as subsidence, seepage, and aging infrastructure in the
USJR region • Develops criteria for use in SI/action prioritization in the USJR region, which will preserve the
unique and historical agricultural community while enhancing flood management and natural systems
• Develops potential SIs/actions and priorities in the USJR region identified by the LSJLD, Merced Streams Group (MSG), the County of Madera Flood Control and Water Conservation Agency (FCWCA), and other stakeholders and regional planning efforts
• Develops a financial plan with costs and financial strategies, which identifies the types and levels of potential funding available to the USJR region
• Coordinates this plan with other planning efforts in the region, such as the BWFS, CVFPP, Integrated Regional Water Management (IRWM) Plans, and San Joaquin River Restoration Program (SJRRP), that have potential overlapping objectives and SIs that have flood components or may influence flood operations
The goals of the USJR RFMP include:
• Restore the flood system to the original design capacity or increased capacity where it is feasible and reasonable to do so
• Preserve the unique and historical agricultural community • Provide 200-year flood protection per Senate Bill (SB) 5 for urban areas • Provide 100-year flood protection per SB 5 for small communities • Improve O&M • Expedite SI permitting and construction • Environmental enhancement • Promote development of multibenefit SIs
ES-2 Upper San Joaquin River Regional Flood Management Plan

EXECUTIVE SUMMARY
Regional Partners The region includes a diverse set of stakeholder groups representing urban cities, small communities, and rural areas. The RFMP was developed by participants from the region’s counties, cities, LMAs, nongovernmental organizations, landowners, participating State and Federal agencies, and other interested parties. The stakeholder groups that were identified in the development of the USJR RFMP are listed in Table ES-1.
Table ES-1. Stakeholder Entities in the USJR Region Stakeholders in Upper San Joaquin River Region
American Rivers Madera County Flood Control and Water Conservation Agency
Audubon California Madera County Farm Bureau
Building Industry Association Madera County Office of Emergency Services
California Department of Fish and Wildlife Madera County Sheriff
California Department of Transportation Madera Engineering Department
California Emergency Management Agency Madera Irrigation District
California State Parks Merced County
Central California Irrigation District Merced County Farm Bureau
Central Valley Flood Protection Board Merced County Office of Emergency Services
Chowchilla Water District Merced County Public Works
City of Chowchilla Merced County Sheriff
City of Dos Palos Merced County Streams Group
City of Firebaugh Merced Irrigation District
City of Los Banos National Marine Fisheries Service
City of Mendota Natural Resources Defense Council
City of Merced Reclamation District 1606
Columbia Canal Company Reclamation District 2092
California Department of Water Resources River Partners
DWR Department of Flood Management Root Creek Water District
Fresno County Rural County Representatives of California
Fresno County Department of Public Works and Planning San Joaquin River Conservancy
Fresno County Farm Bureau San Joaquin River Exchange Contractors Water Authority
Fresno County Office of Emergency Services San Joaquin River Parkway and Conservation Trust
Fresno County Sheriff San Joaquin River Partnership
Fresno Irrigation District San Joaquin River Restoration Program
Friant Water Authority San Luis & Delta-Mendota Water Authority
Fresno Slough Water District Stevinson Water District
Grasslands Water District The Nature Conservancy
Gravelly Ford Water District Tranquility Irrigation District
Inter-Tribal Council of California Trout Unlimited
Kings River Conservation District Tule River Tribe of California
Lower San Joaquin Levee District United States Bureau of Reclamation
Madera County United States Fish and Wildlife Service
Note: Reclamation = United States Bureau of Reclamation
Upper San Joaquin River Regional Flood Management Plan ES-3

EXECUTIVE SUMMARY
Regional Setting and Demographics The USJR region is home to some of the most productive agricultural land found in California, and agriculture accordingly accounts for a large portion of its economy. The region has a long history of flooding, which has shaped the landscape and the lifestyles of those who live there. Flooding is a significant threat to life-safety, the environment, and the economy of the region; however, flood impacts vary across the region due to hydrology, infrastructure, and topography. Flood hazards include urban stormwater, flash flooding, and flooding caused by insufficient or aging infrastructure, seepage, subsidence, and loss of hydraulic capacity due to sedimentation and vegetation encroachment. Even with development of significant flood infrastructure, the series of flood events in 1983, 1986, 1995, 1997, 1998, 2005, 2006, 2007, 2010, and 2011 demonstrate that a significant flood threat still exists in the region.
In 1997, the LSJLD experienced levee breaches on the San Joaquin River between Fresno and the Chowchilla Canal Bypass, inundating agricultural lands north and south of the river. These levee failures attenuated the flood flows and prevented substantial flood damage to downstream areas, such as the city of Firebaugh. Historically, the City does not have adequate facilities or resources for flood fighting and depends on DWR during flood events. In the MSG area, there is inadequate upstream storage and channel capacity to protect the downtown area of the city of Merced. Flooding in 2006 forced the evacuation of more than 3,400 citizens in Merced. Numerous lawsuits over residential structural damage in Merced are due, in part, to lack of flood management improvements and recurring flooding. The primary flood issues in Madera are erosion and vegetation management problems with facilities that Madera County FCWCA maintains.
The USJR region covers approximately 660 square miles of the San Joaquin Valley, and encompasses areas that are protected by the State Plan of Flood Control (SPFC) facilities along the San Joaquin River from Gravelly Ford to the confluence of the Merced River in Merced County; Ash Slough, Berenda Slough, and the Fresno River in Madera County; and Owens Creek and Bear Creek in Merced County. Figure ES-1 shows the USJR RFMP planning area within SPFC jurisdiction. Approximately 31 percent of the USJR region lies in Madera County, 54 percent in Merced County, and 15 percent in Fresno County. The cities in Fresno County that are partially within the USJR region boundary are the city of Firebaugh with a population of 7,561 and Mendota with a population of 11,014. No population centers in Madera County lie within the USJR regional boundary. A portion of the city of Merced (population 78,950) lies within the USJR region boundary along with the city of Dos Palos (population 4,950). Almost all of the communities in the USJR region are considered disadvantaged communities (DACs) based on income level. No known tribal lands are located within the USJR region.
The boundaries of the USJR region also intersect the planning area for the SJRRP, a long-term effort by Reclamation and other Federal and State agencies to restore flows to the San Joaquin River from Friant Dam to the confluence of the Merced River.
Black Rascal Creek Flooding, 2006
ES-4 Upper San Joaquin River Regional Flood Management Plan

EXECUTIVE SUMMARY
Figure ES-1. Upper San Joaquin River Regional Flood Management Planning Area
Upper San Joaquin River Regional Flood Management Plan ES-5

EXECUTIVE SUMMARY
This page intentionally left blank.
ES-6 Upper San Joaquin River Regional Flood Management Plan

EXECUTIVE SUMMARY
Row Crops in the San Joaquin Valley
Land Use Land use in the USJR region has changed with development of water management infrastructure for flood management, irrigation, and water supply. Managing available water resources and controlling seasonal flooding have enabled the region to develop into an area rich in agricultural production. The development of water management infrastructure has provided a widespread and deeply rooted agricultural community and ethic, which is the lifeblood of the USJR regional economy and culture.
The USJR region is primarily rural and dominated by agriculture (266,000 acres, almost 63 percent of the total land area in the region), including row crops, orchards, and grazing operations. Responding to economic drivers, regional agriculture is evolving from production of field and row crops to production of orchards and vineyards. Urban development in the USJR region is largely restricted to areas adjacent to the cities of Firebaugh, Dos Palos, Los Banos, and Merced. Urban land use covers a little over 7,500 acres (less than 2 percent). Native vegetation/riparian habitat covers just over a third of the region (145,000 acres).
Natural Resources The San Joaquin Valley has a complex, unique, and diverse ecosystem that has evolved and changed over many years. The region supports endemic species of plants and animals that are inextricably linked to the varied habitat complexes, including grasslands, vernal pools, seasonal floodplains, and riparian woodlands. The distribution and extent of natural land cover and ecologically valuable habitats in the USJR region have changed markedly in the last 150 years as a result of human settlement, dam construction, water diversions and groundwater extraction, flood control infrastructure, and agricultural development. The changes in historical habitat conditions, including the dewatering of several reaches of the San Joaquin River as a result of Friant Dam construction and operations, combined with the introduction of non-native fish species, have resulted in a general decline in both the abundance and distribution of native fish species including steelhead trout and spring- and fall-run chinook salmon. Other notable threatened and endangered species that historically occurred in the USJR region include Swainson's hawk, giant garter snake, blunt-nosed leopard lizard, Delta button celery, valley elderberry longhorn beetle, least Bell’s vireo, western yellow-billed cuckoo, and greater sandhill crane.
Despite this, conservation efforts in the USJR region have been substantial, and include more than 55,000 acres of United States Fish and Wildlife Service (USFWS) managed wildlife refuges. Merced County currently has the largest patches of pristine, high-density, vernal pool grassland habitat remaining in the State. The USJR region includes significant portions of the Grasslands Ecological Area and contiguous wetland complexes in Federal, State, and private ownership that support more than 550 identified species of birds, animals, and plants These USJR wetlands together are recognized as a Wetland of International Importance by the Ramsar Convention (1 of only 22 such wetlands in the world).
Several concurrent restoration and conservation planning efforts along the San Joaquin River could influence the development of multibenefit actions and priorities for improvement of flood management
Upper San Joaquin River Regional Flood Management Plan ES-7

EXECUTIVE SUMMARY
systems in the USJR region. These efforts include the CVFPP Conservation Framework (and recently released Draft Conservation Strategy), IRWM Plans, the SJRRP, the San Joaquin River Parkway Master Plan, the San Joaquin River Blueway Vision, and other plans.
Flood Management Issues Flood management issues include subsidence, insufficient or aging infrastructure, seepage, loss of hydraulic capacity due to sedimentation and vegetation encroachment, complex system operations, and lack of adequate funding. Complex, institutional, and onerous permitting and compliance issues make implementation of flood management actions, and even routine O&M, difficult if not impossible. These issues and deficiencies challenge the function and reliability of the flood management system.
The LSJLD is the primary agency responsible for flood management within the planning area. Other agencies that operate and maintain flood facilities within the USJR region include the MSG and the Madera County FCWCA. These agencies are responsible for coordination with the DWR Flood Operations Center, patrols of flood facilities, and flood fighting during periods of flood danger. Maintenance activities include periodic inspections of all project facilities; herbicide spraying in the floodways; removal of vegetation, trash, debris, and sediment from the floodways and structures; repair of damaged or deteriorated project facilities; and control or extermination of burrowing animals in levees and embankments.
The primary issues facing the LSJLD include the following:
• Many reaches now have inadequate hydraulic capacity to convey published design flows.
• Levees constructed using local materials are subject to seepage and stability problems
• Subsidence in the Washington Avenue/Red Top area is occurring at a rate of 0.75 foot per year (9 inches), resulting in a reduction in Eastside Bypass channel capacity and impacting flood operations.
• Facilities constructed between 1959 and 1967 are reaching the end of expected service life.
• Levees and facilities need upgrades to comply with current criteria.
• Porous material used to construct the levees results in seepage problems to adjacent agricultural lands even during lower flows.
• SJRRP poses special challenges and opportunities for flood operations and management.
The primary issues facing the MSG include the following:
• Inadequate upstream storage and channel capacities to protect the downtown area of the city of Merced.
• Numerous lawsuits over residential structural damage are due, in part, to lack of flood management improvements and recurring flooding.
Eastside Bypass Scour Caused by Subsidence, 2013
ES-8 Upper San Joaquin River Regional Flood Management Plan

EXECUTIVE SUMMARY
• Haystack Dam, identified by USACE as a measure to protect downstream areas, has never been constructed; however, an alternate project is being pursued.
• Bear Creek and Black Rascal Creek have capacity deficiencies, and existing levees do not meet freeboard requirements of the Federal Emergency Management Agency (FEMA).
• Existing canal systems are vulnerable to failure during severe weather events.
The primary issues with the facilities maintained by Madera County FCWCA include the following:
• Erosion, sedimentation, and vegetation (including invasive species) encroachment • Site encroachments and slope stability • Revetments and other structural appurtenances that are rated as minimally acceptable
System Improvements and Prioritization For an SI to be considered for inclusion in the plan, it must have a flood management nexus, a local proponent, and willing participants. The USJR RFMP identified 88 SIs, with 57 SIs proposed to be constructed in the short term (construction feasible within the next 5 years) and 31 SIs that are long term (with construction timeframe of greater than 5 years). The SIs were submitted by 24 different proponents addressing flood management issues in Fresno, Madera, and Merced counties. The SIs include both structural and nonstructural actions, and range from repair or upgrade of specific flood management facilities (e.g., Bear Creek diversion structure) to conceptual flood management SIs (e.g., development of ring levees) to technical studies or planning processes (e.g., sediment transport investigations). Also included in the list are SIs that SJRRP identified as having a potential flood nexus, which Reclamation and DWR submitted.
The SIs are presented as individual projects, enabling evaluation of each project based on its own merits. Attempting to combine and evaluate groupings of projects was beyond the resources of this initial planning effort. The RFMP does identify opportunities to combine public safety, environmental, and recreational projects together to create multibenefit projects and provides supporting project information on potential project linkages. The SIs were also grouped to identify common types of deficiencies in the region, as well as the variability of issues based on location. This information will promote opportunities to bundle different SIs in the future based on funding opportunities to develop multibenefit projects.
Cost estimates for the RFMP were developed from existing estimates calculated by other sources or calculated as part of the RFMP process. In some cases, older cost estimates were converted to 2014 dollars. The total cost estimated for the SIs identified in the RFMP is more than $1.7 billion; however, this includes related SJRRP costs. The total SI costs, excluding the SJRRP costs, are more than $738 million. Of the 88 SIs identified, 11 SIs did not have cost estimates because the SIs do not have enough information or a specific location. The short-term SIs have an estimated cost of $501 million inclusive of SJRRP estimates (approximately $81 million without SJRRP), and the long-term SIs have an estimated cost of $1,221 million inclusive of SJRRP estimates (approximately $657 million without SJRRP).
A multicriteria evaluation methodology was used to evaluate and rank the SIs into three categories (Tier 1, Tier 2, or Tier 3). This type of methodology enables multiple SIs to be compared against the same set of criteria. The criteria used in the analysis cover a range of benefits that address deficiencies or issues identified in the RFMP area. These criteria were developed based on information from a number of sources, including stakeholder input, SB 5, CVFPP, SSIA, CVFPP Conservation Strategy, and DWR’s Integrated Water Management (IWM) approach to water management.
Upper San Joaquin River Regional Flood Management Plan ES-9

EXECUTIVE SUMMARY
The initial recommended Tier 1 SIs are listed in Table ES-2. Tier 2 and 3 SIs may change to Tier 1 as project descriptions are refined and better information on the multibenefit nature of the projects becomes available. The process that is described in this document could be used to update SI rankings in the future. It is recognized that this is intended to be a ‘living document,’ which could be updated. Combining individual SIs in the future to create larger multibenefit projects may also increase scores and ranking. Many of these opportunities are identified in this Executive Summary, in the SI descriptions (Section 5.0), and in the recommendations (Section 8.0).
Table ES-2. Tier 1 System Improvements
No. System Improvement Estimated Cost
System Improvement Timeframe
Short-term <5 years Long-term >5 years
System Improvement
Category
1 Bear Creek Diversion Structure $260,000 Short-term Rural
2 Levee Breaches Unit 1, LM 9.90; Unit 5, LM 0.25 $535,000 Short-term Rural
4 Modernize Electrical Controls, Level Sensors and SCADA for Control Structures
$1,885,000 Short-term Rural
5A Rehabilitation of San Joaquin River Control Structure
$340,000 Short-term Rural
6 Sediment Removal Chowchilla Canal Bypass Control Structure
$175,000 Short-term Rural
7 Levee Improvements in Subsidence Area $ Short-term Rural
8 Sediment Removal in the Eastside Bypass $12,850,000 Short-term Rural
12 Great Valley Grasslands State Park Levee Deauthorization
$4,930,000 Short-term Environmental
13 Bridge Enlargement over Eastside Bypass at Sandy Mush Road
$1,610,000 Short-term Rural
14 Install New Gaging Stations $330,000 Short-term Rural
15 Western Madera and Merced County Subsidence Solution
$19,600,000 Short-term Groundwater Recharge/Conjunctive
Use/Water Supply
17 Update San Joaquin River Flood Control Project Operations and Maintenance Manual
$500,000 Short-term O&M
19 Fresno Slough South Levee Repair and Floodplain Enhancement Project
$1,340,000 Short-term Rural
21 Upper San Joaquin Sediment Study $100,000 Short-term Rural
22 Bear Creek Diversion Channel Feasibility Study $100,000 Short-term Urban
23 Le Grand/Planada Flood Control/Conjunctive Use Expansion Study
$240,000 Short-term Urban
24 Le Grand Canal Flood Control Structure at Black Rascal Creek
$490,000 Short-term Urban
44 San Joaquin River Levee at Firebaugh Waste Water Treatment Plant
$1,280,000 Short-term Small Community/DAC
45 San Joaquin River Bank Stabilization at Firebaugh $1,800,000 Short-term Small Community/DAC
46 San Joaquin River Levee at Firebaugh Rodeo Grounds
$1,450,000 Short-term Small Community/DAC
3 Raise Part of Left Bank Levee Unit 6 $4,250,000 Long-term Rural
ES-10 Upper San Joaquin River Regional Flood Management Plan

EXECUTIVE SUMMARY
Table ES-2. Tier 1 System Improvements
No. System Improvement Estimated Cost
System Improvement Timeframe
Short-term <5 years Long-term >5 years
System Improvement
Category
5 Enlarge Chowchilla Canal Bypass Control Structure
$3,380,000 Long-term Rural
25 Bear Reservoir Enlargement and Downstream Levee and Channel Improvements
$202,940,000 Long-term Urban
26 Mariposa Reservoir Enlargement and Downstream Levee and Channel Improvements
$112,500,000 Long-term Urban
27 Owens Reservoir Enlargement and Downstream Levee and Channel Improvements
$8,850,000 Long-term Urban
28 Burns Reservoir Enlargement and Downstream Levee and Channel Improvement
$39,180,000 Long-term Urban
31 Black Rascal Creek Flood Control Project $32,980,000 Long-term Urban
Note: LM = levee mile
Financial Plan The USJR faces many financial challenges, and the region is characterized by implementing agencies and DACs with limited local fundraising capacity. Fundraising and financial strategies vary across these agencies depending on their identification as a special flood district, city, county, or irrigation district.
The RFMP identifies a range of potential funding options that could support multibenefit SIs. Funding sources are divided into two primary categories, those related to public safety and those for environmental stewardship. Federal funding programs for public safety come primarily from FEMA and USACE. Federal funding for environmental stewardship includes the Natural Resources Conservation Service, USFWS, National Park Service, and Reclamation programs. DWR programs dominate the State funding sources for public safety. State environmental stewardship funding sources include California State Parks, Wildlife Conservation Board, the State Water Resources Control Board, and the California Natural Resources Agency.
Three hypothetical Tier 1 funding scenarios were evaluated to provide a range of potential cost shares for Federal, State, and local agencies. Table ES-3 shows a summary breakdown of the potential costs and the total cost of $57.3 million to implement all the Tier 1 non-urban SIs. The local obligation for these improvements ranges from $600,000 to $7.8 million. Table ES-4 shows a summary of the potential costs and the total cost of $396 million to implement all the Tier 1 urban SIs. The local obligation for these improvements ranges from $31 million to $370 million.
Ranking the SIs into three tiers does not determine an order of SI implementation. Future implementation will consider which types of funding sources may be available throughout the planning horizon, and which SIs or groups of SIs are potentially eligible.
Upper San Joaquin River Regional Flood Management Plan ES-11

EXECUTIVE SUMMARY
Table ES-3. Tier 1 Non-Urban System Improvements Funding Scenarios Summary USJR Tier 1 Non-Urban Scenario Summary
Total USJR Tier 1 Non-Urban System Improvement Costs: $57,345,000
Total Local Obligation $600,000-$7,865,500
Scenario Total Federal Contribution Total State Contribution Total Local Contribution
Past Practices $23,692,000 $33,053,000 $600,000
Decreased Federal Funding $6,357,500 $47,670,000 $3,317,500
Increased Local Participation $3,674,500 $45,805,000 $7,865,500
Table ES-4. Tier 1 Urban System Improvements Funding Scenarios Summary
USJR Tier 1 Urban Scenario Summary
Total USJR Tier 1 Urban System Improvement Costs: $396,550,000
Total Local Obligation $31,180,000 - $370,560,000
Scenario Total Federal Contribution Total State Contribution Total Local Contribution
Past Practices $183,555,000 $181,815,000 $31,180,000
Decreased Federal Funding $18,490,000 $323,811,000 $54,249,000
Increased Local Participation $1,500,000 $24,490,000 $370,560,000
The total cost to implement the Tier 1 flood SIs totals over $450 million. Depending on the scenarios examined, State and Federal assistance programs may cover over half of these costs, which leaves local implementing agencies responsible for $32 million to $370 million.
Recommendations
Prioritized System Improvements The short-term and long-term Tier 1 SIs identified in the RFMP are recommended for inclusion in the basinwide feasibility studies and funding through State and Federal grant programs. These SIs were developed through extensive coordination with local stakeholders and were prioritized as Tier 1 SIs through an evaluation process that included consideration of 42 subcriteria in four broad categories, including public safety, environmental stewardship, economic stability, and regional issues. These high-level categories mirror the FloodSAFE vision objectives.
Current Tier 2 or Tier 3 SIs will be reevaluated as more information becomes available. Based on further evaluation and refinement, some Tier 2 and 3 SIs could be raised to a higher tier in subsequent evaluations. Bundling SIs may also provide opportunities to raise the priority of the combined projects because it includes a wider range of potential benefits.
Financial Planning A total of 88 SIs is identified in this plan. Because of constraints on the time and budget allocated to develop the USJR RFMP, only the Tier 1 SIs were included in the initial financial analysis. However, it is recognized that securing State and Federal funds is critical to advance all of the regional SIs. All of the communities in the USJR region are considered DACs by the State. Therefore, the provision of State funds to help support implementing agencies with grant writing for Federal and State assistance programs is
ES-12 Upper San Joaquin River Regional Flood Management Plan

EXECUTIVE SUMMARY
necessary. Detailed financial plans will need to be prepared for each project as more information becomes available and as projects are considered for specific funding opportunities.
The State should use this Finance Plan to gauge the level of support needed by the USJR region. The Finance Plan provides an estimate of the range of total funds needed from each funding source to achieve the multibenefit outcomes from the prioritized SIs.
Certain State or Federal grant programs have monies available specifically for conducting planning and feasibility studies for SIs. Implementing agencies should apply for these grants to perform comprehensive studies to better promote SIs for future design and construction funding. The SJRRP may represent a significant opportunity for funding or cost-sharing flood protection improvements and multibenefit projects if congressional appropriations are secured.
Multibenefit Projects The USJR RFMP has identified a suite of SIs that has the potential to achieve multiple benefits such as reducing flood risk, enhancing fish and wildlife habitats, improving water supply reliability, addressing subsidence, providing recreational opportunities, and helping to advance other regional planning efforts. The potential multibenefit opportunities in the USJR region involve diversion of flood flows onto adjacent lands through levee deauthorization or removal, levee breaching, operable gates, pumps, and improved conveyance between the floodplains and the main river channel or bypass system. This provides flood attenuation, transitory storage of floodwaters, and localized reductions in flood stage and velocities. The ecosystem benefits of these improvements include:
• Increases in the extent and frequency of floodplain inundation
• Removal of hard bank protection
• Restoration and enhancement of native wetland, riparian, and floodplain vegetation communities
• Restoration of hydrologic connectivity between the channel corridor and adjacent floodplain terraces and removal of barriers to fish migration
• Recharge of groundwater basins
These groupings of SIs are drawn from many SI tiers and categories that when combined could provide a range of increased benefits, including enhanced water supplies for agriculture and managed wetlands, improvement of water conveyance infrastructure, and enhanced recreational opportunities. These groupings represent promising multibenefit opportunities identified by stakeholders in the USJR region; although many of these SIs do not rank yet as Tier 1, they are recommended for more detailed analyses that are beyond the scope of this planning effort.
Examples of proposed multibenefit opportunities in the USJR RFMP are provided in the following descriptions:
• Great Valley Grasslands State Park (GVGSP) Levee Deauthorization. Adjacent to the San Luis National Wildlife Refuge, the GVGSP project would involve breaching and decommissioning levees to allow transitory storage of floodwaters, localized increases in channel capacity through this reach, improvements to optimize floodplain inundation. In addition, the project would remove the GVGSP levees from the maintenance burden currently assumed by LSJLD.
• City of Firebaugh. The city of Firebaugh has a history of flooding. Small community 100-year flood protection for Firebaugh could combine structural flood protection (levee improvements) with potential levee setbacks and ecosystem restoration.
Upper San Joaquin River Regional Flood Management Plan ES-13

EXECUTIVE SUMMARY
• Merced and Western Madera County Subsidence. Multibenefit flood attenuation and groundwater recharge SIs that involve diversion of flood flows into recharge basins, providing not only localized flood attenuation but also augmentation of regional groundwater basins and improved reliability of the regional water supply, while addressing subsidence issues.
• USFWS Transitory Storage. The USFWS manages a number of projects on Federal refuge lands that could provide transitory storage of floodwaters.
• Enhance Connectivity between the Eastside Bypass and Floodplain. Three SIs along the Eastside Bypass could divert floodwater into adjacent parcels to provide flood attenuation during high flows, which would enhance wetland, riparian, and floodplain habitats. The 3F Group (Trout Unlimited, Ducks Unlimited, and American Rivers), in collaboration with private landowners and USFWS, is advancing these projects.
• Invasive Vegetation Monitoring and Treatment. Many areas of the USJR region have dense communities of invasive vegetation established in the floodway, including the mainstem San Joaquin River, the flood bypass system, and many of the tributaries. This vegetation in these locations has compromised the hydraulic performance of the flood management system and displaced the establishment of native riparian vegetation that serves as critical habitat for fish and wildlife communities. Regional coordination could help to improve invasive vegetation monitoring and treatment efforts, enhancing the performance of flood infrastructure and regional habitats.
Proposed Studies Local stakeholders identified many proposed studies as part of the planning process that deserve evaluation; however, such evaluation was not possible due to the limited resources and schedule for the RFMP planning process. Brief descriptions of a few studies recommended for further evaluation follow:
• Forecast-Coordinated Operations. This involves careful coordination of releases from different reservoirs to reduce downstream flood peaks, thus improving the overall system reliability.
• Forecast-Based Operations. Involves relying more heavily on hydrologic forecasts as the ability to forecast anticipated runoff becomes more reliable. It might be possible to make anticipatory releases in advance of major flood peaks, which would take maximum advantage of downstream channel capacities, thus reducing the risk of downstream flooding.
• Evaluation of Upstream Storage. Development of additional upstream reservoir storage could provide potential flood protection and water supply benefits to the USJR region.
• Regional Sediment Study. Conduct a sediment management study for the San Joaquin River basin to develop a sediment management strategy for the basin. The USJR region has a significant sediment management problem due to the transport of large volumes of sediment into the area from upstream sources.
• Regional O&M Permitting. Regional coordination with all permitting agencies to develop a streamlined cost reimbursable permitting program that will reduce the time and cost required to permit routine maintenance actions. A program that allows for habitat protection and timely, cost-effective, flood system maintenance needs to be developed and implemented.
• Improved Governance and Sustainable Funding. A number of governance issues exist in the USJR region, including the need to formalize current agreements for the MSG and the need for additional funding to support flood management activities in Merced and Madera counties.
ES-14 Upper San Joaquin River Regional Flood Management Plan

EXECUTIVE SUMMARY
Future Implementation The RFMP is envisioned to be an ongoing regional planning process that will continue to be updated as new information becomes available. To the extent that DWR provides funding for regional planning through adoption of the 2017 update to the CVFPP, the RFMP process will continue to provide regional support and coordination to promote better flood management in the USJR region. In addition, it is envisioned that the RFMP process will work to facilitate and acquire funding to implement the recommendations in the RFMP, including the following specific actions:
• Participate in the development of the San Joaquin River Basinwide Feasibility Study, including planning assumptions, hydrologic and hydraulic modeling analyses, ecosystem restoration opportunities, benefits, peer review, and financing capabilities.
• Monitor future funding opportunities from potential State and Federal sources, such as the Urban Flood Risk Reduction and Small Communities Programs, to identify recommended regional improvements that may be eligible for direct or competitive funding.
• Conduct continuing stakeholder outreach and coordination to promote better flood management in the region, including emergency management, O&M, environmental enhancement, and flood risk reduction.
• Continue coordination with the SJRRP to ensure that integrated restoration efforts along with flood management improvements are consistent with regional flood management priorities.
• Conduct further planning activities not only to develop more-refined descriptions of SIs, detailed costs, and schedules, but also to identify potential multibenefit opportunities and permit requirements.
• Work with SI proponents to investigate potential funding opportunities for multibenefit and IWM projects.
• Continue coordination with the Mid- and Lower San Joaquin River RFMP planning teams to ensure that regional and SIs are not in conflict and can be integrated with plans of adjacent planning regions to promote greater benefit.
Upper San Joaquin River Regional Flood Management Plan ES-15

EXECUTIVE SUMMARY
This page intentionally left blank.
ES-16 Upper San Joaquin River Regional Flood Management Plan

1.0 Introduction
1.1 Background The San Joaquin River Flood Control Project Agency (SJRFCPA) is developing the Upper San Joaquin River (USJR) Regional Flood Management Plan (RFMP) in support of the Central Valley Flood Protection Plan (CVFPP) effort. The USJR region lies within the counties of Fresno, Madera, and Merced and encompasses the areas that are protected by the State Plan of Flood Control (SPFC) facilities along the San Joaquin River from Gravelly Ford to the confluence of the Merced River in Merced County; Ash Slough, Berenda Slough, and the Fresno River in Madera County; and Owens Creek and Bear Creek in Merced County.
This plan, along with two other regional plans under development—the Middle San Joaquin RFMP and the Lower San Joaquin RFMP—will provide local stakeholder information that will be used to support the development of the San Joaquin River Basinwide Feasibility Study and inform the 2017 update of the CVFPP. This basinwide study, along with one for the Sacramento River, will provide the basis for further developing the State Systemwide Investment Approach (SSIA) and priorities for improving the flood management system identified in the 2012 CVFPP. Figure 1-1 shows the USJR RFMP planning area within SPFC jurisdiction.
The SJRFCPA is a joint powers authority created to coordinate the efforts of the RFMP process and to represent local agency and landowner interests. The SJRFCPA consists of the Lower San Joaquin Levee District (LSJLD) and San Joaquin River Exchange Contractors Water Authority (SJRECWA). In addition, the County of Merced is a co-signer that provides auditor and controller services. The SJRFCPA is responsible for developing the RFMP and contracting with the California Department of Water Resources (DWR).
The RFMP identifies and articulates flood management challenges and deficiencies at the regional level, and reviews the potential actions and system improvements (SIs) brought forward by local agencies and other stakeholders in the region. The RFMP provides a vision for flood management in the Upper San Joaquin Region and identifies high-priority solutions to improve flood management, prioritizes needed projects, provides cost estimates and a preliminary finance plan, and evaluates potential opportunities to develop multibenefit projects.
The region includes a diverse set of stakeholder groups representing urban cities, small communities, and rural areas. The RFMP was developed by participants from the region’s counties, cities, local maintaining agencies (LMAs), nongovernmental organizations (NGOs), landowners, and other interested parties. The RFMP effort was funded by a Proposition 1E grant from DWR.
1.2 Purpose and Goals The purpose of this USJR RFMP is to develop a plan that incorporates local knowledge and experience, and represents regional interests in development of short-term and long-term flood risk reduction projects. The RFMP provides a reconnaissance-level assessment of regional flood risk that:
• Documents existing flood risk conditions and management along the San Joaquin River and its tributaries
• Identifies flood problems and issues, such as subsidence, seepage, and aging infrastructure in the USJR region
Upper San Joaquin River Regional Flood Management Plan 1-1

INTRODUCTION
• Develops criteria for use in SI/action prioritization in the USJR region, which will preserve the unique and historical agricultural community while enhancing flood management and natural systems
• Develops potential SIs/actions and priorities in the USJR region identified by the LSJLD, Merced Streams Group (MSG), the County of Madera Flood Control and Water Conservation Agency (FCWCA), and other stakeholders and regional planning efforts
• Develops a financial plan with costs and financial strategies, which identifies the types and levels of potential funding available to the USJR region
• Coordinates this plan with other planning efforts in the region, such as the San Joaquin River Restoration Program (SJRRP), that have potential overlapping objectives and SIs that have flood components or may influence flood operations
The goals of the USJR RFMP include the following:
• Restore the flood system to the original design capacity or increased capacity where it is feasible and reasonable to do so
• Preserve the unique and historical agricultural community
• Provide 200-year flood protection per Senate Bill (SB) 5 for urban areas
• Provide 100-year flood protection per SB 5 for small communities
• Improve operations and maintenance (O&M)
• Expedite SI permitting and construction
• Environmental enhancement
• Promote development of multibenefit SIs
This report uses the best available existing information and does not include new system modeling or study material.
1-2 Upper San Joaquin River Regional Flood Management Plan

INTRODUCTION
Figure 1-1. Upper San Joaquin River Regional Flood Management Planning Area
Upper San Joaquin River Regional Flood Management Plan 1-3

INTRODUCTION
This page intentionally left blank.
1-4 Upper San Joaquin River Regional Flood Management Plan

INTRODUCTION
1.3 Regional Partners The stakeholder groups that were identified in the development of the USJR RFMP are listed in Table 1-1.
Table 1-1. Stakeholder Entities in the USJR Region
Stakeholders in Upper San Joaquin River Region
American Rivers Madera County Flood Control and Water Conservation Agency
Audubon California Madera County Farm Bureau
Building Industry Association Madera County Office of Emergency Services
California Department of Fish and Wildlife Madera County Sheriff
California Department of Transportation Madera Engineering Department
California Emergency Management Agency Madera Irrigation District
California State Parks Merced County
Central California Irrigation District Merced County Farm Bureau
Central Valley Flood Protection Board Merced County Office of Emergency Services
Chowchilla Water District Merced County Public Works
City of Chowchilla Merced County Sheriff
City of Dos Palos Merced County Streams Group
City of Firebaugh Merced Irrigation District
City of Los Banos National Marine Fisheries Service
City of Mendota Natural Resources Defense Council
City of Merced Reclamation District 1606
Columbia Canal Company Reclamation District 2092
California Department of Water Resources River Partners
DWR Department of Flood Management Root Creek Water District
Fresno County Rural County Representatives of California
Fresno County Department of Public Works and Planning San Joaquin River Conservancy
Fresno County Farm Bureau San Joaquin River Exchange Contractors Water Authority
Fresno County Office of Emergency Services San Joaquin River Parkway and Conservation Trust
Fresno County Sheriff San Joaquin River Partnership
Fresno Irrigation District San Joaquin River Restoration Program
Friant Water Authority San Luis & Delta-Mendota Water Authority
Fresno Slough Water District Stevinson Water District
Grasslands Water District The Nature Conservancy
Gravelly Ford Water District Tranquility Irrigation District
Inter-Tribal Council of California Trout Unlimited
Kings River Conservation District Tule River Tribe of California
Lower San Joaquin Levee District United States Bureau of Reclamation
Madera County United States Fish and Wildlife Service
Note: Reclamation = United States Bureau of Reclamation
Upper San Joaquin River Regional Flood Management Plan 1-5

INTRODUCTION
1.4 Organization This RFMP is organized in sections that provide a description of the region, flood management risk, existing flood management infrastructure, and operational/emergency response practices. It outlines opportunities, challenges, and potential SI/action alternatives; it prioritizes SIs/actions and develops financial strategies for advancing those SIs/actions. Specifically, this report is organized in the following sections and appendixes.
• Section 1.0 – Introduction • Section 2.0 – Regional Setting • Section 3.0 – Institutional and Governance • Section 4.0 – Flood Management • Section 5.0 – Proposed System Improvements • Section 6.0 – Evaluation of System Improvements • Section 7.0 – Regional Finance Plan • Section 8.0 – Recommendations and Future Implementation • Section 9.0 – References • Appendix A – Flood Risk Calculations • Appendix B – Species Identified with Potential to Exist in the USJR Region • Appendix C – Permitting Requirements • Appendix D – Summary of Key Information from County Emergency Operation Plans • Appendix E – Proposed System Improvements – Worksheet Template • Appendix F – Communications with Stakeholders • Appendix G – Proposed System Improvements – Backup Information for Worksheets • Appendix H – Proposed System Improvements – Backup Information for Cost Estimates • Appendix I – Proposed System Improvements Evaluation
1.5 Limitation of Information Sources The RFMP used best available information and did not generate any new data or perform new hydraulic flood modeling. Information in this RFMP was compiled from a number of documents, each with differing levels of detail, completeness, and study area boundaries. Therefore, available data sets may not fall entirely within the USJR region boundaries. This is important because the population projections and other demographic information were available only on a countywide basis. These projections could lead to demographic projections greater than actual numbers located within the USJR region. This approach was deemed appropriate because floods do not conform to institutional boundaries, and most of this information will not result in erroneous conclusions and recommendations.
In addition, flood risk information was available only in impact areas developed by the CVFPP, and these impact areas do not follow the boundaries of the USJR region. Some information about infrastructure located upstream or outside the region was provided because the operations of the flood management system are affected by these areas. This document represents a first attempt at compiling and synthesizing information for this region.
1-6 Upper San Joaquin River Regional Flood Management Plan

INTRODUCTION
The list of SIs was compiled from local agency and other SI proponents. No detailed engineering analysis or additional study was performed to verify the implementability of the proposed SIs. Therefore, a number of the SIs will require feasibility-level analysis or other studies prior to implementation. Also, a list of potential SI groupings is provided to help identify potential IRWM and multibenefit project opportunities; however, additional analysis and coordination between the project proponents will be required to determine if there is an interest in combining the improvements, or to determine if it is feasible to combine the SIs.
Upper San Joaquin River Regional Flood Management Plan 1-7

INTRODUCTION
This page intentionally left blank.
1-8 Upper San Joaquin River Regional Flood Management Plan

2.0 Regional Setting
2.1 General Description of the Region The USJR region encompasses the areas of the San Joaquin systems that are protected by the SPFC facilities along the San Joaquin River from Gravelly Ford to the confluence of the Merced River, as well as portions of Ash Slough, Fresno River, Owen Creek, and Bear Creek, as shown in Figure 2-1. The USJR region is part of the San Joaquin River system, which originates in the Sierra Nevada Mountains at an elevation of more than 10,000 feet. The river flows west out of the mountains, abruptly turns north near Mendota, then flows through the San Joaquin Valley to the southern limit of the Sacramento-San Joaquin Delta (Delta) at Vernalis, California. The river drains approximately 13,500 square miles bounded by the Sierra Nevada Mountains to the east, the Coast Range to the west, and the Tulare Lake Basin to the south. The USJR region covers approximately 660 square miles of the San Joaquin Valley, including the San Joaquin River (Reaches 1 through 5) and Bypasses, as well as upstream tributaries (Ash Slough, Fresno River, Owens Creek, and Bear Creek). San Joaquin River Reaches 1 through 5 are described in more detail in Table 2-1, and locations of the reaches are shown in Figure 2-2. Even though Reach 1 (Friant Dam to Highway 99) is not in the region, information is provided for context because the operations of Friant Dam are an integrated part of flood management operations in the region.
The region is dominated by a Mediterranean climate with dry summers and rain during the winter months. Historically, the region has experienced extreme runoff that inundated large areas of the valley floor, resulting in standing water and sediment deposition on the floodplain. This has produced a unique and productive agricultural landscape. The region includes important ecosystems that have both historically and currently serve an important ecological function. The purpose of this Regional Setting section is to provide a brief description of the USJR region.
Table 2-1. San Joaquin River Reaches
Reach Location Published Capacity
(cfs) Description of Levee
Source of Flood Flows
Responsible Maintaining Agency
Reach 1 – Friant Dam to Gravelly Ford
1A Friant Dam to Highway 99
Maximum flow objective of 8,000 cfs based on downstream capacity
Meandering channel confined by natural bluffs and terraces
San Joaquin River (Friant Dam releases)
No maintaining agency
1B Highway 99 to the Gravelly Ford gauging station
Maximum flow objective of 8,000 cfs based on downstream capacity
Meandering channel confined by natural bluffs and terraces that taper off and then disappear
San Joaquin River (Friant Dam releases)
No maintaining agency
Reach 2 – Gravelly Ford to Mendota Dam
2A Gravelly Ford gauging station to Chowchilla Bifurcation Structure
8,000 Channel with project levees that lack structural integrity
San Joaquin River (Friant Dam releases)
Lower San Joaquin Levee District
Upper San Joaquin River Regional Flood Management Plan 2-1

REGIONAL SETTING
Table 2-1. San Joaquin River Reaches
Reach Location Published Capacity
(cfs) Description of Levee Source of Flood
Flows Responsible
Maintaining Agency
2B Chowchilla Bifurcation Structure to Mendota Dam
1,300 Channel with nonproject levees that lack structural integrity and are more susceptible to failure due to fluctuations in flows
San Joaquin River Private landowners
3 Mendota Dam to Sack Dam
4,500 Nonproject levees and canal embankments
San Joaquin and Kings rivers
Private landowners and irrigation districts
Reach 4 – Sack Dam to confluence with the Eastside Bypass
4A Sack Dam to Sand Slough Control Structure
4,500 Nonproject levees San Joaquin and Kings rivers
Private landowners and irrigation districts
4B Upper
Sand Slough Control Structure to the Mariposa Bypass
0 - 200 Nonproject levees San Joaquin and Kings rivers
Private landowners
4B
Lower
Mariposa Bypass to Bear Creek/Eastside Bypass
10,000 SPFC levees San Joaquin and Kings rivers
Lower San Joaquin Levee District
5 Bear Creek to confluence with the Merced River
26,000 SPFC levees San Joaquin and Kings rivers
Lower San Joaquin Levee District
Notes: Published values from Lower San Joaquin Flood Control Project O&M Manual (Amended 1987) except where revised, for Reaches 2B and 4B Upper, based on estimates from field observations. cfs cubic feet per second
2-2 Upper San Joaquin River Regional Flood Management Plan

REGIONAL SETTING
Figure 2-1. Upper San Joaquin River Region Map
Upper San Joaquin River Regional Flood Management Plan 2-3

REGIONAL SETTING
This page intentionally left blank.
2-4 Upper San Joaquin River Regional Flood Management Plan

REGIONAL SETTING
Figure 2-2. Upper San Joaquin River Reach Locations
Upper San Joaquin River Regional Flood Management Plan 2-5

REGIONAL SETTING
This page intentionally left blank.
2-6 Upper San Joaquin River Regional Flood Management Plan

REGIONAL SETTING
2.2 Flood Hazards Flooding can be a significant threat to life-safety, the environment, and the economy of the USJR region; however, flood impacts vary across the region due to hydrology, infrastructure, and topography. Types of flooding occur due to variations in the following:
• Weather and climate patterns (e.g., El Niño, La Niña, Pineapple Express, Atmospheric River) • Hydrologic features • Composition of soil and bedrock • Type and density of vegetation • Patterns of land use • Age and condition of flood management infrastructure
These conditions result in floods that can differ in characteristics such as warning time, duration, depth, and levels of loss, depending on where, when, why, and how the flooding occurs. The types of flooding that can occur in the region include the following:
• Flash flooding – Quickly forming floods with high-velocity flows. Often caused by stationary or slow-moving storms. Typically occurs on steep slopes and impermeable surfaces, and in areas adjacent to streams and creeks. In 1998, the Saint Valentine’s Day Storm resulted in damage to roads and structures in the USJR region.
• Slow-rise flooding – Gradual inundation as waterways or lakes overflow their banks. Most often caused by heavy precipitation, especially with heavy snowmelt. This type of flood includes riverine flooding in deep floodplains and ponding of water in low-lying urban areas, as well as
gradual flooding in areas adjacent to local streams and creeks. Warning times for slow-rise flooding can be hours, days, and sometimes weeks—but not months. This type of flooding is the most common to the USJR region. In 2005-2006, historic flooding in the region resulted when over 20 inches of rain fell between December 24 and January 3.
• Debris-flow flooding – Flows made up of water, liquefied mud, and debris. Can form and accelerate quickly, reach high velocities, and travel great distances. Commonly caused by heavy localized rainfall on hillsides devoid of vegetation. In 2006, severe flooding caused landslides and mudslides resulting in debris flows in the USJR region.
• Alluvial fan flooding – Flows of shallow depth and high velocity, with sediment transport, along uncertain flow paths on the surface and at the toe of alluvial fans. Typically caused by localized rainstorms, often with snowmelt. A 1982-1983 flood closed roads and clogged culverts with silt on State Highway 99 in the USJR region.
San Joaquin River Flooding, 2006
Eastside Bypass San Joaquin River Flooding, 2006
Upper San Joaquin River Regional Flood Management Plan 2-7

REGIONAL SETTING
Downtown Merced Flooding, 1935
• Stormwater flooding – Localized flooding that occurs in urbanized areas during or after a storm event. Generally, the extent of flooding is confined to a smaller area compared to other types of flooding. Local stormwater flooding usually results from clogged or overwhelmed storm drain systems that are incapable of efficiently conveying stormwater runoff to outfalls or into creeks and rivers. This type of flooding is common in urban areas such as the city of Merced in the USJR region. In 2002, flooding resulted in clogged storm drains on 16th
Street between V Street and 18th Street in the city of Merced.
• Engineered structure failure flooding – Flooding as a result of the failure of a dam or levee presents the potential of catastrophic impact, depending on the amount of water impounded and location of populated areas downstream. Historically, some dam failures occurred in the USJR region before modern construction techniques were employed. These failures were often caused by sack and rock dams washing away. In 1997, there were multiple levee failures along both the north and south sides of the San Joaquin River upstream of the Chowchilla Bifurcation Structure.
All communities in the region are at risk of at least one of these types of flood, and most communities are vulnerable to more than one type. However, slow-rise, stormwater, and flash flooding are the most common types in the USJR region. Also, due to the historical alluvial nature of the region, alluvial fan flooding can occur even during low flows. Table 2-2 provides a summary of significant flood events that have occurred in USJR region. Selected significant floods are briefly described below.
1861-62. The “Great Flood.” The “Great Flood” of 1861-1862 was remarkable for the exceptionally high stages reached on most streams, repeated large floods, and prolonged and widespread inundation in the San Joaquin Valley.
April 1935. On April 6, 1935, Bear Creek overflowed its banks and inundated Merced streets, flooding homes and businesses. Due to the severity of this storm, an Act of Congress created the MSG.
November 1950. A 3-day heavy rain event from November 17 through November 19 in the Sierra Nevada brought more than 15 inches of rain to some areas located as high as 5,500 feet and heavy rain as high as 10,000 feet, which melted snowpack and resulted in historic flooding. Hardest hit were Merced and Chowchilla, with damage estimated at $12 million and several lives were lost.
Flooding in City of Merced
2-8 Upper San Joaquin River Regional Flood Management Plan

REGIONAL SETTING
Table 2-2. History of Flood Events in the Upper San Joaquin River Region
Hydrologic Region
Flood Year
Flood Month County
River/Stream/ Region Flooded Notes
Type of Flood
San Joaquin River, Tulare Lake
1805 Fresno Regionwide The flood of 1805 inundated “the entire valley floor.” Slow-Rise
San Joaquin River, Tulare Lake
1861-1862
December-March
Fresno, Madera, Merced
Regionwide The “Great Flood” was remarkable for the exceptionally high stages reached on most streams, repeated large floods, and prolonged and widespread inundation throughout the San Joaquin Valley. Source: DWR, 2009
Slow-Rise
San Joaquin River 1867 December Madera Fresno River Source: Madera County, 2008 Slow-Rise
San Joaquin River 1867 February Merced
Sacramento, San Joaquin River Basins, Friant
One of four largest floods between 1850 and 1900. Source: DWR, 2009 Slow-Rise
San Joaquin River 1868 January,
March Madera Fresno River Source: Madera County, 2008 Slow-Rise
San Joaquin River, Tulare Lake
1907 Fresno Central Valley floods of 1907 and 1909 revised flood control plans of the time and led to development of the San Joaquin River flood control system. Source: DWR, 2009
Slow-Rise
San Joaquin River, Tulare Lake
1909 Fresno, Madera, Merced
San Joaquin River Hydrologic Region
Central Valley floods of 1907 and 1909 revised flood control plans of the time and led to development of the San Joaquin River flood control system. The San Joaquin River Hydrologic Region experienced urban and small-stream flooding in every large storm. Source: DWR, 2009
Slow-Rise
San Joaquin River 1911 Madera,
Merced Bear Creek, Fresno River Source: DWR, 2009 Slow-Rise
San Joaquin River 1914 Madera Fresno River Source: Madera County, 2008 Slow-Rise
San Joaquin River 1925
Merced
Source: City of Merced, 2011
San Joaquin River 1935 April 6 Merced Bear Creek
On April 6, 1935, Bear Creek overflowed its banks and inundated Merced streets flooding homes and businesses. Due to the severity of this storm, an Act of Congress created the MSG. Source: City of Merced, 2013
Flash; Slow-Rise
San Joaquin River 1938 February-
March Madera Fresno River Source: Madera County, 2008 Slow-Rise
San Joaquin River 1943 Madera Fresno River Source: Madera County, 2008 Slow-Rise
Upper San Joaquin River Regional Flood Management Plan 2-9

REGIONAL SETTING
Table 2-2. History of Flood Events in the Upper San Joaquin River Region
Hydrologic Region
Flood Year
Flood Month County
River/Stream/ Region Flooded Notes
Type of Flood
San Joaquin River 1945 Madera Fresno River Source: Madera County, 2008 Slow-Rise
San Joaquin River 1950 November Merced Bear Creek
Thanksgiving Flood. A 3-day heavy rain event from November 17 through November 19 in the Sierra Nevada brought more than 15 inches of rain to some areas located as high as 5,500 feet and heavy rain as high as 10,000 feet, which melted snowpack and resulted in historic flooding. Hardest hit were Merced, Chowchilla, Centerville, Visalia, Porterville, Oildale, Isabella, and Kernville. Damage was estimated at $12 million at the time, and several lives were lost. Source: City of Merced, 2011a
Flash
San Joaquin River 1952 Madera Fresno River Source: Madera County, 2008 Slow-Rise
San Joaquin River, Tulare Lake
1955-1956
December-January
Fresno, Madera, Merced
Regionwide
Preceding the December 1955 flood, heavy rainfall and snowmelt occurred in the upper watersheds of the east-side tributaries to the San Joaquin River. This caused extensive flooding along the San Joaquin River and all its major east-side tributaries, as well as flooding on the larger west-side tributaries. This flood caused extensive damage to agriculture, homes, and public facilities. Thousands of people were evacuated from their homes during the Christmas holiday season, and several people died of heart attacks during the flood.
Slow-Rise
San Joaquin River, Tulare Lake
1958 February-April Fresno, Madera, Merced
Fresno River, San Joaquin River Friant Dam-Merced River, Bear Creek
Debris flows destroyed a bridge west of Mendota in March 1958, and one life was lost as a result. Flooding in Firebaugh was reported. Source: DWR, 2009; City of Firebaugh, 2009
Debris Flow; Slow-Rise
San Joaquin River, Tulare Lake
1962-1963
December-February
Fresno, Madera, Merced
Regionwide Flood damage to agricultural and public facilities during the flood was particularly serious along the streams flowing from west-side tributaries. Source: DWR, 2009 Slow-Rise
San Joaquin River, Tulare Lake
1964-1965
December-January
Fresno, Madera, Merced
Regionwide – San Joaquin Basin
Major flooding and substantial damages occurred along Dry Creek. Source: USACE, 1967 Slow-Rise
San Joaquin River, Tulare Lake
1966-1967
December-March Fresno Regionwide
USACE estimated about $1.3 million in flood damages. Flooding was characterized by extremely large flows, including record flows at some locations. Fresno-Kings River: Flooding along the Kings River near Fresno took three lives and inundated 142,000 acres of agricultural land. Source: USACE, 1967; DWR, 2009
Slow-Rise, Alluvial Fan
2-10 Upper San Joaquin River Regional Flood Management Plan

REGIONAL SETTING
Table 2-2. History of Flood Events in the Upper San Joaquin River Region
Hydrologic Region
Flood Year
Flood Month County
River/Stream/ Region Flooded Notes
Type of Flood
San Joaquin River, Tulare Lake
1967 April-July Fresno, Madera
San Joaquin River, Fresno River
Prolonged high flows in leveed channels led to extensive seepage damage, about 90 percent to agricultural lands but also to a few commercial, residential, and other areas, including public campgrounds, a sewage treatment plant, a country club, settling ponds, roads, and private levees. USACE estimated 44,340 acres flooded with damages of $4.8 million. Two private levees breached on the Fresno River, flooding 1,800 acres of croplands in Madera County. Source: San Joaquin County Resource Conservation District, 2002; DWR, 1968.
Slow-Rise, Engineered Structure Failure; Alluvial Fan
San Joaquin River, Tulare Lake
1968-1969
December-February
Fresno, Madera, Merced
Regionwide, San Joaquin River
Both rain and snowmelt floods occurred in the southern part of the region. Heavy rains fell during January 1969 and substantial but lesser amounts in February. As the heavy rains continued in the valley, a snowpack of unprecedented depth and water content accumulated in the watersheds above 8,000 feet along the crest of the Sierra Nevada. Declared Federal January 26, 1969. Source: USACE, 1969; DWR, 2009
Flash; Slow-Rise
San Joaquin River, Tulare Lake
1969 April-July Fresno San Joaquin River, tributaries
The flood season was climaxed by near-record snowmelt floods. Significant flooding on Central Valley rivers and reformation of Tulare Lake in the San Joaquin Valley occurred as extended precipitation fell across the State. Heavy snow fell in all mountain ranges, and the monthly rainfall record was set in Sacramento. Forty counties were declared disasters. Calculated Damages: 47 dead, 161 injured, $300 million in economic losses. Source: City of Merced, 2011
Slow-Rise
San Joaquin River, Tulare Lake
1982-1983
December-March
Fresno, Madera, Merced
Regionwide
Floods closed northbound Highway 99 in February. Many roads were closed, and many bridges and culverts were clogged with silt. Generally wet conditions damaged crops and cut dairy production. Source: Water Resources Institute at California State University and Alluvial Fan Task Force, 2001
Alluvial Fan, Slow-Rise, Stormwater
San Joaquin River, Tulare Lake
1986 February-March
Fresno, Madera, Merced
Regionwide St. Valentine's Day Storm: Flash flooding damaged roads and some structures in scattered places. Source: DWR, 2009
Flash; Stormwater
San Joaquin River 1992 January-
February Madera Fresno River Source: Madera County, 2008 Slow-Rise
San Joaquin River, Tulare Lake
1993 January-February
Fresno, Madera Fresno River Storm, rain and high winds.
Source: Fresno County, 2009
Slow-Rise, Flash, Stormwater
San Joaquin River, Tulare Lake
1995 January-April Fresno, Madera, Merced
Regionwide
Urban stormwater and small-stream flooding was widespread. Severe winter storms, flooding, landslides, mudflows were prevalent. Three major flood events in the Central Valley caused little damage in the San Joaquin River region, although urban and small-stream flooding was widespread. Source: Madera County, 2008
Slow-Rise, Debris Flow, Stormwater
Upper San Joaquin River Regional Flood Management Plan 2-11

REGIONAL SETTING
Table 2-2. History of Flood Events in the Upper San Joaquin River Region
Hydrologic Region
Flood Year
Flood Month County
River/Stream/ Region Flooded Notes
Type of Flood
San Joaquin River, Tulare Lake
1997 January Fresno, Madera, Merced
Regionwide: San Joaquin valley region, Fresno River, Bear Creek, Central Valley, San Joaquin Valley
This event has been called the largest flood disaster in California history. Fourteen levee breaches occurred along the San Joaquin River between Fresno and the Chowchilla Bypass, inundating agricultural lands, including many vineyards north of the river. Three hundred square miles of land flooded and caused mudslides. Source: DWR, 2009
Slow-Rise, Debris flows; Engineered Structure Failure
San Joaquin River, Tulare Lake
1998 January-June Fresno Regionwide, San Joaquin Valley Region
El Niño Floods: In 1998, a heavy snowpack and warm rains produced flooding that closed Highway 99 for a week. In Yosemite, campgrounds were evacuated. The mountains had the wettest snowpack in 50 years. La Niña conditions produced flooding throughout the spring. Coast Range runoff inundated farmland around Mendota. Source: Fresno County, 2009
Flash, Slow-Rise
San Joaquin River 2000 April Merced
There was some minor flooding around Merced April 17 and 18, including some flooding approximately 3 miles north of Merced on Black Rascal Creek. Merced received around 1.42 inches of rain. Source: City of Merced, 2011
Flash; Slow-Rise
San Joaquin River 2001 November Merced
Minor flooding in Merced on November 12, 2001. Source: City of Merced, 2011
Flash; Slow-Rise
San Joaquin River 2002 December Merced San Joaquin River
A tornado and heavy rain from December 13 to December 17 caused damage to an apartment and flooding. Merced received 1.78 inches of rain. This rain caused storm drains to be clogged on 16th Street, west of “V” Street and 18th Street. Source: City of Merced, 2011
Flash; Slow-Rise
San Joaquin River, Tulare Lake
2006 March 29-April 1, April 5, May 10
Fresno, Madera, Merced
Regionwide
Local flooding was adjacent to some streams. Floods followed a month of above-average rainfall in California. Heavy rains, flooding, landslides, and mudslides were prevalent. Two levees near Merced burst, flooding a trailer park, housing development, and farmland. Two hundred people were evacuated from trailer parks. Source: DWR, 2009
Debris Flow, Flash, Engineered Structure Failure
San Joaquin River 2006 April Madera,
Merced Black Rascal Creek
The flood lasted 12 hours, forced the evacuation of 3,400 citizens in Merced, and damaged numerous structures. The flood also caused a sanitary sewer treatment plant in a neighboring town to overflow, which led to widespread water contamination issues. Many believe the flood and related damage hinged on Black Rascal Creek and its complete lack of flood control facilities. The damaged school and mobile home park area are also where Black Rascal Creek used to flow prior to being connected to Bear Creek, indicating that it is a low-lying area. Source: City of Merced, 2011
Flash; Slow-Rise
2-12 Upper San Joaquin River Regional Flood Management Plan

REGIONAL SETTING
Table 2-2. History of Flood Events in the Upper San Joaquin River Region
Hydrologic Region
Flood Year
Flood Month County
River/Stream/ Region Flooded Notes
Type of Flood
San Joaquin River 2010 December Merced Bear Creek
On December 28 and December 29, the City of Merced received about 0.75 inch of rain. There was a flood advisory for the central and southern San Joaquin Valley. The Merced Sun Star reported that “Bear Creek through Merced was high Wednesday, with parts of the bike path disappearing into swift brown water.” Source: City of Merced, 2011
Flash; Slow-Rise
San Joaquin River 2011 March Merced Bear Creek
Storms in the middle of March followed earlier storms in December 2010. Bear Creek flooded again. Inmates sandbagged Bear Creek around Highway 59. The inmates put down hundreds of 35-pound bags between Bear Creek and the road. Merced Airport received 1.78 inches of rain between 10 a.m. Saturday and 10 a.m. Monday (March 19 to March 21). Source: City of Merced, 2011
Flash; Slow-Rise
Note: USACE = United States Army Corps of Engineers
Upper San Joaquin River Regional Flood Management Plan 2-13

REGIONAL SETTING
Eastside Bypass Flooding at Greenhouse Bridge Road, 1997
Christmas Eve Flood, Merced, 1955
December 1955-January 1956. Heavy rainfall and snowmelt occurred in the upper watersheds of the eastside tributaries to the San Joaquin River. This caused extensive flooding along the river and all its major tributaries on the east side, as well as flooding on the larger tributaries on the west side. This flood caused extensive damage to agriculture, homes, and public facilities.
April-July 1958. Along the San Joaquin River from Stockton to Fresno, 250,000 acres were flooded. South of the Merced River, there were six breaches of nonproject levees. North of the
Merced River, there were numerous breaches, and most east-west highways were closed. Due to high snowmelt, low-lying areas along the San Joaquin River from Gravelly Ford to north of the Merced River remained flooded until July, which also forced deferral of levee repairs.
December 1964-January 1965. Major flooding and substantial damages occurred along the Merced, San Joaquin, Chowchilla, and Fresno rivers and streams in Merced County. USACE estimated that 71,900 acres were flooded by stream overflow, particularly west of Merced and along the Merced River. The Merced River floodwaters damaged camping and recreational facilities and infrastructure in Yosemite Valley. There was a levee breach on the Eastside Bypass. USACE estimated $4.5 million in flood damages in the San Joaquin River region.
December 1968-February 1969. Both rain and snowmelt caused floods in the southern part of the region. Highway 99 was closed by floodwaters in four places in Madera County, and numerous other roads were flooded.
January 1997. Levee breaches occurred on the San Joaquin River between Fresno and the Chowchilla Bypass, inundating agricultural lands, including many vineyards north of the river. There was extensive damage in Yosemite Valley from Merced River overflow. Yosemite National Park was closed, and highways in the region incurred damage.
In the LSJLD system, 10 levee failures occurred in the reach between Gravelly Ford and the Chowchilla Bifurcation Structure. These levee failures attenuated the flood flows and prevented substantial flood damage downstream. In addition, the LSJLD system experienced seven failures along the north levee in Madera County, and the south levee failed at four locations, threatening the city of Firebaugh in Fresno County. Levee subsidence between Sandy Mush Road and Washington Avenue has reduced the flow capacity of the Eastside Bypass. During the flood event of 1997, this area was within 1 foot of over topping the levees on both the north and south banks.
2-14 Upper San Joaquin River Regional Flood Management Plan

REGIONAL SETTING
Black Rascal Creek Flooding, 2006
April 2006. There was an all-time record flood due to more than a month of above-average rainfall. Severe storms, flooding, mudslides, and landslides were prevalent. Two levees near the city of Merced failed, flooding a trailer park, housing development, and farmland forcing evacuation of about 200 people from the trailer park. About 100 homes were evacuated after 4 inches of rain fell in 24 hours, weakening an earthen dam.
2.3 Demographics The USJR region is home to some of the most productive agricultural land found in California, and agriculture accordingly accounts for a large portion of its economy. The region has a long history of flooding, which has shaped the landscape and the lifestyles of those who live there. This section discusses the population, small and disadvantaged communities (DACs), economic factors, and the economy of the area. Demographic facts in this section derive from the United States Census Bureau (Census) (2010) and data developed for the CVFPP, unless otherwise stated. The calculation of flood risk information is described in Appendix A. Demographic and land use information is important in the RFMP because SB 5, signed in 2007, requires cities with populations over 10,000, which are defined to be “urban or urbanizing,” to provide protection to withstand flooding that has a 1-in-200 chance of occurring in any given year. SB 5 also requires these cities to amend land use codes and general plans to restrict development in the floodplain.
The USJR region lies within the counties of Madera, Merced, and Fresno in the Central Valley of California. Approximately 31 percent of the USJR region lies in Madera County, 54 percent in Merced County, and 15 percent in Fresno County, as shown in Table 2-3. The total population in these three counties is over 1.3 million people, but the population within the USJR region is just over 20,300 (Census, 2000). Fresno has the largest population of the three counties with just over 930,000 people as of 2010, but only a small portion (5 to 10 percent) live in the USJR region. The discrepancy of total population between the USJR region and the county is a result of significant population centers lying outside the USJR region boundary. For example, the majority of the Fresno County population, over 60 percent, is in the Fresno-Clovis area, which is outside the USJR region.
In fact, the only cities in Fresno County that are partially within the USJR region boundary are the city of Firebaugh with a population of 7,561 and the city of Mendota with a population of 11,014. No population centers in Madera County lie within the USJR regional boundary. Within the county, the city of Madera with a population of 61,416 and the city of Chowchilla with a population of 18,720 could benefit from USJR SIs. In addition, large areas of Merced County, including areas in the city of Merced (population 78,950) and other population centers such as Planada (population 4,584), Le Grand (population 1,659), and Los Banos (population 35,972), do not lie within the USJR region boundary; however, they might benefit from USJR SIs. The city of Dos Palos, with a population of 4,950, is the only city in Merced County that is fully within the USJR region. No known tribal lands are within the USJR region. Table 2-4 provides a summary of demographics and income levels in the USJR region. The following subsections provide demographic information for each county in the USJR region.
Upper San Joaquin River Regional Flood Management Plan 2-15

REGIONAL SETTING
Table 2-3. Percentage of County Area in the USJR Region
County County Area
(Square Miles)
County Area inside USJR Boundary
(Square Miles)
Percent of County Area within USJR Region
(%)
Madera County 2,150 203 31
Merced County 2,000 358 54
Fresno County 6,000 100 15
Total 10,150 661 100
Table 2-4. Demographics and Income Levels in the USJR Region
County/City 2010
Population
2013 Population (Estimate)
Population Change, April 1,
2010, to July 1, 2013
(%)
Median Household
Income, 2008-2012
Persons Below
Poverty Level, 2008- 2012 (%)
Persons Age 25+
with High School
Diploma or Higher,
2008-2012 (%)
Bachelor's Degree or
Higher, Percent of
Persons Age 25+,
2008-2012
Madera County 150,865 152, 389 1 47,937 21.1 68.0 13.9
Merced County 255,798 263,228 2.9 43,465 24.6 66.6 12.5
Fresno County 930.450 955,272 2.7 45,741 24.8 72.8 19.4
City of Dos Palos 4,950 5,057 2.2 34,522 28.1 63.2 7.2
City of Los Banos 35,972 36,822 2.4 49,131 24.8 64.4 10.1
City of Merced 78,950 81,102 2.7 38,253 27.0 72.1 15.3
City of Firebaugh 7,561 8,106 7.2 32,875 34.9 42.0 5.1
City of Mendota 11,014 11,420 3.7 26,061 45.6 30.4 0.0
Planada CDP 4,584 N/A N/A 32,266 26.1 43.1 1.5
Le Grand CDP 1,659 N/A N/A 37,095 25.0 48.6 0.0
City of Madera 61,416 63,105 2.7 43,240 27.4 55.5 1.2
City of Chowchilla 18,720 17,383 -7.1 41,373 18.4 67.4 1.2
California 37,253,959 38,332,521 2.9 $61,400 15.3 81.0 30.5
Note: CDP = Census-Designated Place N/A = Not Available
2.3.1 Madera County Madera County is approximately 2,150 square miles in area, with approximately 203 square miles in the USJR region, 2 incorporated cities (Chowchilla and Madera), and 13 unincorporated communities. Neither Chowchilla nor Madera is located within the USJR region boundary.
The largest industry in Madera County is the service sector, accounting for 67 percent of all employment, followed by government at 24 percent, according to 2009 data from the State of California Employment Development Department. The predominance of service sector industry is likely due to the Department of Corrections being a major employer in the area. Agriculture makes up about 22 percent of all jobs. Because of the large amount of agriculture in the county, the unemployment rate varies seasonally, depending on crop production (Madera County, 2011).
2-16 Upper San Joaquin River Regional Flood Management Plan

REGIONAL SETTING
2.3.2 Merced County Merced County is approximately 2,000 square miles in area; however, only approximately 358 square miles of that area are located within the USJR region. The county has six incorporated cities within its boundaries, including the cities of Atwater, Dos Palos, Gustine, Livingston, Los Banos, and Merced. Merced is the largest of the cities. The county also has 18 unincorporated communities.
Merced is the fifth largest agricultural county in the State and the sixth largest in the nation. With a raw product value of over $2.3 billion (in 2005 dollars), agriculture is Merced County’s primary industry and is the county’s largest source of employment. The county has approximately 1.15 million acres of agricultural land, with pasture taking up 54 percent of its area, while the rest is used for crop production. Of the total crop-cultivated acreage, field crops account for 67 percent, followed by produce and nuts at 32 percent. Nursery and seed crops account for less than 1 percent of total crop acreage (Merced County, 2011a).
Although Merced has a thriving agricultural economy, many of the communities are considered DACs. DACs are defined as having an annual median household income (MHI) below 80 percent of the statewide annual MHI ($61,632). In Merced County, the cities of Dos Palos, Los Banos, and Merced are considered DACs.
2.3.3 Fresno County Fresno County is approximately 6,000 square miles in area, with approximately 100 square miles of the county within the USJR region. The county has 15 incorporated cities within its boundaries, including Coalinga, Clovis, Firebaugh, Fowler, Fresno, Huron, Kerman, Kingsburg, Mendota, Orange Cove, Parlier, Reedley, San Joaquin, Sanger, and Selma. Firebaugh and Mendota are the only cities in Fresno County that are located partially within the USJR region. More than half of the population of Fresno County lives in the cities of Fresno and Clovis. Nearly 50 percent of the county’s total land acreage is listed as agriculture, which makes up the largest sector of the economy.
Fresno County is one of the largest, fastest growing, and most diverse counties in California. It is the State’s tenth most populous county with an estimated 930,000 residents. Approximately 50 percent of the growth in Fresno County is expected in the city of Fresno, with the rest occurring in other areas of the county and areas adjacent to the city of Fresno (Fresno County, 2009). Agriculture is the largest economic driver in the region, accounting for nearly $7 billion in total gross production value in 2011, which was highest in the State (California Farm Bureau Federation, 2013).
2.4 Land Use Land use in the USJR region has changed with development of water management infrastructure for flood management, irrigation, and water supply. Managing available water resources and controlling seasonal flooding have enabled the region to develop into an area rich in agricultural production while significantly altering natural hydrologic regimes and associated ecosystems. The development of the water management infrastructure has provided a widespread and deeply rooted agricultural community and ethic, which is the lifeblood of the USJR region’s economy and culture. However, this same development has led to a decline over time in the natural processes and habitats that supported many native species in the region. The region has lost 90 to 95 percent of natural wetlands and riparian habitat due to the development of water and flood management infrastructure. This section of the report will provide an
Upper San Joaquin River Regional Flood Management Plan 2-17

REGIONAL SETTING
overview of significant land uses in the USJR region, as well as land uses by the county. Figure 2-3 shows general land uses in the region.
2.4.1 Land Use Data For this RFMP, trends were analyzed using data from DWR surveys of land use for each county, which represents the best available data (DWR, 2013a). Data used in this analysis are based on the following survey dates:
• Fresno County – 1986, 1994, and 2000 1 • Madera County – 1995 and 2001 • Merced County – 1995 and 2002
These surveys focused primarily on mapping agricultural land, which matches the rural nature of the USJR region. These survey data identify more than 90 agricultural classes, 40 urban classes, and more than 25 native classes of land use. For this analysis, these classes were grouped under four main types of land use—Agriculture, Urban, Native, and Unclassified.
Agricultural land use includes the following:
• Row crops, including grain and hay crops, rice, field crops, and truck, nursery, and berry crops
• Pasture
• Citrus, vineyards, fruits, and nuts, including deciduous fruits and nuts, citrus, and subtropical
• Idle land
• Semiagricultural, including farm residences, livestock feed operations, dairies, poultry farms, farmsteads, and nonplanted areas
Table 2-5 shows the specific crops that belong to each of the agricultural land use types.
Urban land consists of residential, commercial, industrial, landscaping, and vacant land use. Native lands consist of native vegetation and riparian vegetation.
In the USJR region, more than 99 percent of the total area was surveyed; however, a few small areas (less than 1 percent of total) was not surveyed because either entry was denied or it was outside the study area. The DWR land surveys were processed to exclude data not within the USJR region, and to group the data under the four types of land use. Table 2-6 provides a summary of these data by type, class, and county. These data reveal the following trends over the last 30 years:
• Agriculture is the primary type of land use in the region and has grown by just over 1,000 acres.
• Urban development in the USJR region is limited but has grown by 390 acres.
• Native land use covers about 34 percent of the region and has lost over 1,200 acres, primarily of native vegetation. Madera County accounted for a majority of the change where areas of native vegetation were converted to pasture and row crops.
Land use changes in the region are primarily a conversion of row crops, pasture, and idle land to permanent crops such as trees and vines.
1 Note: Additional data are available for Fresno County; however, the data provide information for areas outside the RFMP region or the data have not been standardized. These additional data were excluded from the land use data used in this RFMP.
2-18 Upper San Joaquin River Regional Flood Management Plan

REGIONAL SETTING
Figure 2-3. Land Use in the USJR Region Source: DWR, 2013a
Upper San Joaquin River Regional Flood Management Plan 2-19

REGIONAL SETTING
This page intentionally left blank.
2-20 Upper San Joaquin River Regional Flood Management Plan

REGIONAL SETTING
Table 2-5. Types of Crops in the Upper San Joaquin River Region Classification Specific Crop
Row Crops
Grain and Hay Crops
Barley Wheat Oats Miscellaneous Grain and Hay Mixed Grain and Hay
Rice Rice Wild Rice
Field Crops
Cotton Safflower Flax Hops Sugar beets Corn (field and sweet) Grain sorghum Sudan Castor beans bean (dry) Miscellaneous field Sunflowers Hybrid sorghum/sudan Millet Sugar cane
Truck, Nursery, and Berry Crops
Artichokes Asparagus Beans (green) Cole crops Carrots Celery Lettuce (all types) Melons, Squash, and Cucumber (all types) Onions and Garlic Peas Potatoes Sweet Potatoes Spinach Tomatoes (processing) Flowers, Nursery and Christmas Tree Farms Mixed (four or more) Miscellaneous Truck Bush Berries Strawberries Peppers (chili, bell, etc.) Broccoli Cabbage Cauliflower Brussels Sprouts Tomatoes (market) Greenhouse
Upper San Joaquin River Regional Flood Management Plan 2-21

REGIONAL SETTING
Table 2-5. Types of Crops in the Upper San Joaquin River Region Classification Specific Crop
Pasture
Pasture
Alfalfa and Alfalfa Mixtures Clover Mixed Pasture Native Pasture Induced High Water Table Native Pasture Miscellaneous Grasses Turf Farms Bermuda Grass Rye Grass Klein Grass
Citrus, Vineyards, Fruits, and Nuts
Deciduous Fruits and Nuts
Apples Apricots Cherries Peaches and Nectarines Pears Plums Prunes Figs Miscellaneous Deciduous Mixed Deciduous Almonds Walnuts Pistachios
Citrus and Subtropical
Grapefruit Lemons Oranges Dates Avocados Olives Miscellaneous Subtropical Fruits Kiwis Jojoba Eucalyptus Mixed Subtropical Fruits
Vineyards Table Grapes Raisin Grapes Wine Grapes
Idle Land
Idle Land not cropped currently or for previous crop season but cropped within past 3 years New lands being prepared for crop production
Semiagricultural
Semiagricultural
Farmsteads (Includes a Farm Residence) Livestock feed lot operations Dairies Poultry Farms Farmsteads (without a Farm Residence) Miscellaneous Semiagriculture (small roads, ditches, nonplanted areas of cropped fields)
Source: DWR, 2013a
2-22 Upper San Joaquin River Regional Flood Management Plan

REGIONAL SETTING
Table 2-6. Summary of Land Use Data within USJR Region
Land Use Classification
Land Area (in acres)
Fresno County (1986)
Fresno County (1994)
Fresno County (2000)
Change in Fresno County
(1986-2000)
Madera County (1995)
Madera County (2001)
Change in Madera County
(1995-2001)
Merced County (1995)
Merced County (2002)
Change in Merced County
(1995-2002)
Change in Total Area (1986-2002)
Agricultural 49,021 48,062 47,694 (1,327) 97,504 102,900 5,396 122,459 119,489 (2,970) 1,099
Row Crops: 34,728 31,583 29,946 (4,782) 51,385 42,147 (9,238) 74,554 74,250 78 (11,422)
Grain and Hay Crops 4,102 2,817 1,361 (2,741) 11,036 10,715 (321) 6,883 10,878 4,088 1,026
Rice 546 480 774 229 428 65 (363) 879 945 8 (4)
Field Crops 26,738 24,404 21,497 (5,241) 36,220 29,031 (7,189) 54,345 44,247 (9,934) (20,060)
Truck, Nursery and Berry Crops 3,343 3,884 6,314 2,972 3,701 2,335 (1,366) 12,447 18,180 5,915 7,616
Pasture 11,062 12,362 11,593 531 28,162 31,005 2,843 39,830 41,369 1,116 5,822
Pasture 11,062 12,362 11,593 531 28,162 31,005 2,843 39,830 41,369 1,116 5,822
Citrus, Vineyards, Fruits, and Nuts 1,914 3,275 4,938 3,024 14,349 27,256 12,907 1,846 1,734 (117) 15,818
Deciduous Fruits and Nuts 658 1,340 2,416 1,758 7,369 12,343 4,974 1,410 1,582 172 6,904
Citrus and Subtropical - - 31 31 - 5 5 14 13 (5) 36
Vineyards 1,256 1,936 2,491 1,235 6,980 14,908 7,928 422 138 (284) 8,878
Idle 681 319 543 (138) 2,777 1,077 (1,701) 4,465 367 (4,071) (5,909)
Semi-Agricultural 636 522 674 38 831 1,416 585 1,764 1,768 (28) 676
Urban 723 1,361 1,087 364 623 545 (79) 6,112 6,090 104 556
Urban 353 862 417 64 177 140 (38) 4,459 3,590 (708) (618)
Residential 6 - 175 170 - 1 1 76 420 344 515
Commercial 11 48 7 (4) 14 11 (3) 24 76 12 69
Industrial 153 - 129 (24) 356 205 (151) 51 609 558 383
Landscape 0 0 58 58 - - - 354 108 (246) (188)
Vacant 200 450 301 101 76 188 112 1,147 1,286 143 395
Native 13,930 14,348 15,048 1,118 31,823 26,506 (5,317) 100,129 103,126 2,918 (1,188)
Native Vegetation 13,000 14,160 5,649 (7,351) 31,597 24,507 (7,090) 99,506 101,956 2,371 (11,977)
Riparian Vegetation 108 - 7,450 7,342 - 995 995 - 773 773 9,110
Water Surface 822 188 1,949 1,127 226 1,004 778 623 398 (226) 1,679
Unclassified 157 60 2 (155) 2 2 0 - - 0 (4,351)
TOTAL 63,831 63,831 63,831 0 129,953 129,953 0 228,700 228,705 5 (3,884)
Percentage 15% 15% 15% 31% 31% 54% 54% Source: DWR, 2013a
Upper San Joaquin River Regional Flood Management Plan 2-23

REGIONAL SETTING
This page intentionally left blank.
2-24 Upper San Joaquin River Regional Flood Management Plan

REGIONAL SETTING
2.4.2 Significant Land Uses Agriculture, including grazing of livestock, is the predominant land use in the USJR region. As early as 1905, agricultural development was widespread and included crops and grazing lands. In 1937, extensive areas used for grazing in the region were converted to agriculture crops. Land use practices and development have contributed over time to changes in vegetation composition, distribution, and abundance. Today, the USJR region is primarily rural and dominated by agriculture, including row crops, orchards, and grazing operations. Urban development in the USJR region is largely restricted to areas adjacent to the cities of Firebaugh, Dos Palos, Los Banos, and Merced. Land use in the region is evolving from production of field and row crops to production of orchards and vineyards. There also is a conversion of land back to native or riparian vegetation. Agriculture is the most dominant land use with more than 266,000 acres (almost 63 percent of the total land area) dedicated to growing crops. Urban development in the region is limited to the cities of Los Banos, Dos Palos, and portions of Firebaugh and Merced. Urban land use covers a little over 7,500 acres (less than 2 percent). Native vegetation/riparian habitat cover about just over a third of the region (145,000 acres). The following subsections discuss the two most significant land uses in the USJR region—agriculture, and wildlife areas and refuges.
Agriculture The development of the USJR region is tied to the rise of agriculture. Initially, major portions of the region were used for grazing cattle and other livestock, supporting the needs of booming cities in northern California, including San Francisco and Sacramento. Agricultural infrastructure (such as canals and ditches) in the region was established to support this effort. Over time, development of row and permanent crops (trees and vines) has occurred as more reliable water sources and flood management facilities have been developed.
In the 1850s, irrigation development began with crude diversions adjacent to the river. Between the 1870s and 1940s, natural sloughs were converted to earth-lined canals that led to the development of cultivated agriculture. In the 1930s, new groundwater pumping technology facilitated the development of deep aquifer supplies to supplement inadequate surface water supplies. In the 1950s, flood control improvements provided incentive for investment in intensive farming operations.
Today, grazing is still a significant land use in the USJR region. Almost 30 percent of the agricultural land use in the region is Prime Farmland. Prime Farmland is land that has the best combination of physical and chemical characteristics for the production of crops. This means it has the soil quality, growing season, and moisture supply needed to produce sustained high yields of crops when managed effectively (i.e., proper water management and use of current farming methods). The region also has significant areas of Farmland of Statewide Importance (almost 20 percent) and Unique Farmland (almost 18 percent), as shown in Figure 2-4. Farmland of Statewide Importance is similar to Prime Farmland but has some minor shortcomings, including higher slopes and lower soil moisture storage, which necessitates irrigation. Unique Farmland has lower quality soils, is usually irrigated, and may include nonirrigated orchards or vineyards. A noticeable shift has occurred over the last 10-years to more permanent crops, including fruit and nut trees and vines, along the upstream portion of the San Joaquin River and Bypass. This change has resulted in demand hardening for water because it takes several years to establish trees and vines, and once established, they cannot be fallowed on a year-by-year basis.
Land use in the USJR region also is affected by changes in farm size. There has been a 6 percent reduction in the number of farms in Fresno, Madera, and Merced counties between 2000 and 2007, although the
Upper San Joaquin River Regional Flood Management Plan 2-25

REGIONAL SETTING
average acreage of farms has increased by 8 percent (United States Department of Agriculture [USDA], 2002; USDA, 2007). These numbers are a reflection of the changing agricultural landscape of the Central Valley and California as a whole, with agricultural operations shifting in size and geographic location around the region.
Fresno County ranks first in the State in terms of total agricultural value with approximately $7 billion of production. Leading commodities in Fresno County include almonds, milk, livestock, raisin grapes, and tomatoes. Merced County ranks fifth in the State with approximately $3.3 billion in agricultural production. The leading commodities in Merced County are milk, almonds, cattle and calves, chickens, and sweet potatoes. Madera County ranks twelfth in the State with $1.6 billion in production, having leading commodities of almonds, milk, wine grapes, pistachios, and raisin grapes. The three counties account for $43.5 billion dollars of agricultural value, or 27 percent of the agricultural production in California.
Wildlife Areas Several significant wildlife areas in the USJR region encompass large tracts of preserved lands with high-value habitat offering varying levels of recreational opportunities. These preserved lands consist of native vegetation and riparian areas that serve important ecological functions for the region, such as providing habitat, ecological connectivity, refugia, and water quality benefits. The USJR region also includes a variety of managed environmental lands, which are operated by governmental and NGOs. The California Department of Fish and Wildlife (CDFW) manages Los Banos Wildlife Area, Volta Wildlife Area, Mendota Wildlife Area, and the Alkali Sink Ecological Reserve. The United States Fish and Wildlife Service (USFWS) manages the San Luis National Wildlife Refuge (NWR) Complex, which consists of the San Luis NWR, Merced NWR, San Joaquin River NWR (outside the planning area), and the Grasslands Wildlife Management Area. Figure 2-5 shows the managed environmental lands in the USJR region area (DWR, 2013b.
In addition to Federally and State-managed wildlife areas, there are many private duck clubs throughout the region. Recreational activities associated with these wildlife areas contribute to the regional economies through tourism, hunting, and wildlife viewing, although the specific economic contribution is not available for the counties in the region.
Preserves and Refuges Several wildlife areas and refuges, ecological reserves, and State parks are located in the USJR region. The most significant areas are described below:
• San Luis NWR Complex Grasslands Ecological Area • Mendota Wildlife Area • Los Banos Wildlife Area • Volta Wildlife Area • Great Valley Grasslands State Park (GVGSP)
In addition, smaller reserves and parks are located either inside or close to the USJR region. These include the following areas:
• Alkali Sink Ecological Reserve • San Joaquin Ecological Reserve • Kerman Ecological Reserve • Fresno County Parks • San Joaquin River Conservancy (SJRC) and Parkway holdings
2-26 Upper San Joaquin River Regional Flood Management Plan

REGIONAL SETTING
Figure 2-4. Farmland of Statewide Significance in the USJR Region
Upper San Joaquin River Regional Flood Management Plan 2-27

REGIONAL SETTING
This page intentionally left blank.
2-28 Upper San Joaquin River Regional Flood Management Plan

REGIONAL SETTING
Figure 2-5. Managed Environmental Lands
Upper San Joaquin River Regional Flood Management Plan 2-29

REGIONAL SETTING
This page intentionally left blank.
2-30 Upper San Joaquin River Regional Flood Management Plan

REGIONAL SETTING
San Luis NWR Complex and Grasslands Ecological Area The San Luis NWR Complex, a portion of which is located within the USJR region, consists of the 27,054-acre San Luis NWR, the 10,184-acre Merced NWR, and the 80,200-acre Grasslands Wildlife Management Area. San Luis NWR and Merced NWR are fee-title lands owned and managed by the USFWS. The Grasslands Wildlife Management Area consists of private lands that are enrolled in USFWS perpetual conservation easements and are managed by the respective landowners. These lands are a mix of managed seasonal and permanent wetlands, riparian habitat, native grasslands, alkali sinks, and vernal pools. These privately held wetlands and associated grasslands, complemented by two NWRs and four State wildlife areas, comprise more than 160,000 acres (not all located in the USJR region) and are collectively known as the Grasslands Ecological Area, which was designated as a Wetland of International Importance by the Ramsar Convention on Wetlands.
The refuges and private easement lands are allocated water from the CVP Improvement Act of 1992 (CVPIA) to manage wetland habitat—primarily to provide fall and winter habitat for migratory waterbirds, including large numbers of ducks, geese, swans, cranes, and shorebirds. The San Luis NWR Complex provides habitat for a wide array of wildlife, including waterfowl, shorebirds, and other wetland-dependent wildlife, songbirds, uplands-associated wildlife, and endangered species. The largest concentrations of mallards, pintails, green-winged teal, and lesser sandhill cranes in the San Joaquin Valley are found here. Public uses within the fee-title refuges include interpretive wildlife observation programs, hiking, fishing, and hunting waterfowl and pheasants (Woolington, 2013).
Mendota Wildlife Area The 12,425-acre Mendota Wildlife Management Area is managed by the CDFW. Established between 1954 and 1966, the refuge is located on a part of the Coelho Family Trust and is adjacent to the Fresno Slough Water District (WD), the Tranquillity Public Utilities District, Reclamation District 1606, Tranquillity Irrigation District (ID), and the 900-acre Alkali Sink Ecological Reserve. Approximately 8,300 acres of wetlands are maintained on the refuge, including almost 6,800 acres of seasonal wetlands that are used by migratory ducks and shorebirds. To feed these waterfowl, several crops, including corn, barley, milo, and safflower, are raised. Giant garter snakes have been observed in the refuge. The waters used to maintain these seasonal wetlands are from allocations from the Central Valley Project (CVP).
Los Banos Wildlife Area Purchased in 1929, the Los Banos Wildlife Management Area was the first of a series of waterfowl refuges established in California to manage habitat for wintering waterfowl. Expanded from its original 3,000 acres, there are now 6,217 acres of wetland habitat, which includes lakes, sloughs, and managed marshes. The refuge provides habitat for western pond turtles, raccoons, striped skunks, beaver, muskrat, and more than 200 varieties of bird species, including ducks, geese, shorebirds, coots, wading birds, and cranes. Pintail ducks and lesser snow geese are the most common waterfowl in the refuge. Swainson’s hawks are known to nest near the refuge and to use the refuge for foraging. Special-status species known to reside in the refuge include the giant garter snake and Delta button celery.
Volta Wildlife Area The 3,000-acre Volta Wildlife Management Area is located approximately 5 miles east of the Centinela WD. The refuge maintains more than 1,800 acres of wetlands, including 1,400 acres of moist-soil plants and 720 acres of alkali sink habitat preserved in the refuge as a rare ecological community. The Volta Wildlife Management Area provides habitat for a variety of bird species, including ducks, geese, shorebirds, coots, and wading birds. Black-necked stilts, sandpipers, dunlins, and dowitchers dominate shorebird species.
Upper San Joaquin River Regional Flood Management Plan 2-31

REGIONAL SETTING
Great Valley Grasslands State Park The GVGSP represents one of the few remaining intact examples of native grasslands in the Central Valley. Several rare and endangered plant and animal species use the park for habitat. Included within the boundaries of the park is a 10-mile section of SPFC levees. Currently, there are proposals to remove or deauthorize these levees and allow natural flooding in the area. This park is a portion of the Grasslands Ecological Area, a wetland complex made up of privately owned duck clubs (many of which have conservation easements) and is a site of international importance that supports huge numbers of migratory waterfowl. It is the largest remaining block of wetlands in the Central Valley, containing 70,000 acres of private wetlands and associated lands, and it encompasses 53,000 acres of State and Federal lands. This area is extremely important to Pacific Flyway populations of 19 duck species and 6 goose species. The Grasslands Ecological Area has been officially recognized as an integral unit of the Western Hemispheric Shorebird Reserve Network.
2.4.3 Land Use by County This subsection of the RFMP provides a summary of land use information by county in the USJR region.
Fresno County The predominant land use in the Fresno County portion of the USJR region is agriculture, covering approximately 47,700 acres in the year 2000 (or almost 75 percent of the total area). Fresno County consistently has been one of the leading agricultural counties in the United States in the value of farm products. Preservation of agricultural lands reduces the conversion of farmland to other land uses and is a General Plan policy important to the long-term economic viability of the local economy. Other land uses in the county include Urban land, which covers approximately 1,100 acres (almost 2 percent), mainly in the Mendota and Firebaugh areas, and native land, which covers just over 15,000 acres (more than 23 percent) primarily in the southeastern portion of the region.
Land uses in the Fresno region over the last 25 years were marked by the following changes (Fresno County, 2013):
• More than 1,300 acres of agricultural land were converted to Urban and Native land uses, which made up 90 percent of the land that was converted. The majority of this conversion occurred in the expansion of the Alkali Sink Ecological Reserve.
• More than 4,700 acres of row crops have been converted to citrus or vineyards and pasture. The field crops included crops such as sugar beets, corn, and grain sorghum, as well as grains and hay.
Agriculture Most of the agriculture in the region are row crops (almost 63 percent), which primarily consist of field crops, including cotton, sugar beets, corn, grain sorghum, sudan grass, and beans. Over the last 25 years, there has been a reduction in row crops and an increase in fruit and nut trees, as well as vineyards. This conversion to trees and vines occurred in the southeastern area of the USJR region, south of the San Joaquin River (near Mendota). Pastureland use has remained fairly consistent. Figure 2-6 shows a comparison of land use data for 2000 and 1986, covering the southeastern portion of the USJR region (i.e., the portion in Fresno County).
Urban In the Fresno County portion of the USJR region, less than 2 percent of the land surveyed is Urban. Urban land uses are within the city of Firebaugh, at a commercial site located near Highway 180, and at
2-32 Upper San Joaquin River Regional Flood Management Plan

REGIONAL SETTING
miscellaneous small commercial/industrial facilities and vacant areas scattered throughout the region. Note that a majority of the city of Firebaugh is outside the USJR region.
Native In the Fresno County portion of the USJR region, more than 23 percent of the land use is listed as Native. Of the 15,000 acres of native land, roughly half is riparian vegetation (approximately 7,400 acres). In addition, Native land use has grown by 1,100 acres as a result of agricultural conversion, shown in Figure 2-6. Native land use areas include Mendota Wildlife Area and the Alkali Sink Ecological Reserve.
Upper San Joaquin River Regional Flood Management Plan 2-33

REGIONAL SETTING
This page intentionally left blank.
2-34 Upper San Joaquin River Regional Flood Management Plan

REGIONAL SETTING
Figure 2-6. Comparison of Changes in Land Use in the Southeastern Portion of USJR Region in Fresno County 1986-2000 Source: DWR, 2013a
Upper San Joaquin River Regional Flood Management Plan 2-35

REGIONAL SETTING
This page intentionally left blank.
2-36 Upper San Joaquin River Regional Flood Management Plan

REGIONAL SETTING
Upper San Joaquin River Regional Flood Management Plan 2-37
Madera County The predominant land use in the Madera County portion of the USJR region is Agriculture, covering approximately 102,900 acres (more than 79 percent) in 2001. Other land uses include Urban, which covers approximately 500 acres (less than half of 1 percent), and Native, which covers just over 26,500 acres (more than 20 percent). Land uses over the last 20 years in Madera County were marked by the following changes (Madera County, 2008):
Approximately 7,100 acres of native vegetation has been converted to agricultural land. Much of this land now produces grains and hay, primarily along the north side of the Fresno River east of the Eastside Bypass.
More than 9,000 acres of row crops have been converted to citrus, vineyards, and pasture, which reduced the native lands and field crops such as cotton, safflower, beans, and sudan grass.
Another 7,900 acres of row crops and pasture were converted to vineyards.
Agriculture Most of the agriculture in the region consists of row crops (almost 41 percent), primarily corn. Over the last 20 years, there has been a reduction in row crops and an increase in fruit and nut trees, pasture, and vineyards. Conversion to pasture, trees, and vines has occurred west of the Eastside Bypass (south of Highway 152). Pastureland has increased by more than 2,800 acres, most likely because a number of dairies moved operations from Southern California to the region (Madera County, 2011). The increase in dairy operations will require additional focus on how to evacuate while continuing dairy activities during flood events as part of the overall flood emergency management planning efforts. Figure 2-7 shows a comparison of the land use data from 1995 and 2001 for areas in the eastern portion of the USJR region near the confluence of the Fresno River and Eastside Bypass. Conversion of row crops to trees and vineyards has continued since 2001, especially along the Eastside Bypass near the confluence with the Fresno River. The change in agricultural land use has increased the amount of groundwater used in the region, resulting in a 0.75-foot of land subsidence per year in this area (SJRECWA, 2012).
Urban In the Madera County portion of the USJR region, there are no significant urban areas; in fact, there was a loss of approximately 80 acres in total Urban land use (Madera County, 2011). This change occurred when an industrial facility near Firebaugh Boulevard was demolished (City of Firebaugh, 2009). Urban areas are located directly east of the city of Firebaugh in Madera County where a small unincorporated area of the county is located called Eastside Acres, which consists of approximately 85 homes.
Native In the Madera County portion of the USJR region, more than 20 percent of the land use is listed as Native. Over 5,300 acres of Native land use has been converted to agriculture from 1995-2001, as shown in Figure 2-7.
REGIONAL SETTING
This page intentionally left blank.
2-38 Upper San Joaquin River Regional Flood Management Plan

REGIONAL SETTING
Upper San Joaquin River Regional Flood Management Plan 2-39
Figure 2-7. Comparison of the Change in Land Use in the USJR Region in Madera County near the Confluence of the Fresno River and Eastside Bypass 1995-2001 Source: DWR, 2013a

REGIONAL SETTING
This page intentionally left blank.
2-40 Upper San Joaquin River Regional Flood Management Plan

REGIONAL SETTING
Merced County Agricultural and Native land uses cover more than 97 percent of land in the Merced portion of the USJR region. Agricultural land covers approximately 119,500 acres (over 52 percent), and native lands cover 103,100 acres (over 45 percent). The county is one of California’s top five producers of milk and cream, chickens, almonds, alfalfa, cattle and calves, silage, and tomatoes. Urban land is also present in the region, and accounts for most of the remaining acreage in the county. Urban areas account for almost 3 percent (approximately 6,100 acres) in the Merced County portion of the USJR region, including Dos Palos, Los Banos, and portions of the city of Merced. Over the last 20 years, almost 3,000 acres of agricultural land in the region reverted to native vegetation (Merced County, 2011a).
Agriculture The County General Plan identifies agriculture as “the backbone and essential part of Merced County’s economy. It is a way of life that must be supported and protected to assure the industry’s continued vitality.” Merced County is the fifth largest county in the State and sixth largest county in the nation in annual market value of farm products. The Merced County Land Use Element includes multiple goals and policies aimed at concentrating future urban development in existing urban areas or in new areas not located in Prime Agricultural areas (Merced County, 2011b).
Most of the agriculture in the region is row crops (more than 62 percent), primarily consisting of sugar beets, corn, sudan grass, and beans. Another major agricultural use in the area is pasture (approximately 41,400 acres), which represents over 45 percent of the agricultural land use in Merced County. In some areas, changes in land use or crop type have resulted in increased groundwater pumping and subsidence, such as in the area between the Eastside Bypass and the San Joaquin River north of Highway 152.
Urban In the Merced County portion of the USJR region, almost 3 percent of the land surveyed is identified as Urban. Urban land uses are in the cities of Los Banos, Dos Palos, and Merced, although much of the city of Merced is outside the USJR region.
Native In the Merced County portion of the USJR region, more than 45 percent of the land use is listed as Native. Almost all of the 103,100 acres of native land is native vegetation (approximately 102,000 acres). Native land use has increased over the last 20 years by almost 3,000 acres. Agricultural conversion, including conversion at the Los Banos Wildlife Area, added 1,100 acres of new native land, as shown in Figure 2-8. Native land use in the Merced County portion of the USJR region includes the San Luis NWR, Merced NWR, Los Banos Wildlife Area, and Volta Wildlife Area.
Upper San Joaquin River Regional Flood Management Plan 2-41

REGIONAL SETTING
This page intentionally left blank.
2-42 Upper San Joaquin River Regional Flood Management Plan

REGIONAL SETTING
Upper San Joaquin River Regional Flood Management Plan 2-43
Figure 2-8. Comparison of Changes in Land Use in the USJR Region in Merced County near Los Banos Wildlife Area 1995-2002 Source: DWR, 2013a

REGIONAL SETTING
This page intentionally left blank.
2-44 Upper San Joaquin River Regional Flood Management Plan

REGIONAL SETTING
2.5 Natural Resources The USJR region has a Mediterranean climate with dry and hot summers and mild winters. Geographically, the USJR region is located in the Central Valley. The Central Valley is an alluvial plain and is drained primarily by the San Joaquin River and its tributaries, which originate in the Sierra Nevada Mountains. The average annual precipitation at the valley floor, including the USJR region, is less than 10 inches per year, typically occurring during the fall and winter.
The USJR region has unique natural resources, including vernal pool, grasslands, plant and animal species, and wetland preserves. This region has the largest, contiguous block of remaining wetlands in California. This is significant because currently less than 5 percent of historical wetlands remain. The United States Environmental Protection Agency (USEPA) defines vernal pools as (USEPA, 2013):
…seasonal depressional wetlands that occur under the Mediterranean climate conditions of the West Coast. They are covered by shallow water for variable periods from winter to spring, but may be completely dry for most of the summer and fall.
Grasslands are generally defined as land that is dominated by grasses, as opposed to trees and shrubs. Native grasses typically have deep roots that help stabilize soil, encourage infiltration, and provide habitat for native species.
The San Joaquin River is a complex, unique, and diverse ecosystem that has evolved and changed over many years. As a result, the region has a great deal of biological diversity. This diversity has enhanced the region’s quality of life and economic health. The region also is home to many endemic species of both plants and animals that are inextricably linked to the varied habitats, including grasslands, vernal pools, and riparian woodlands. More than 127,500 acres of riparian vegetation and more than 55,000 acres of USFWS critical habitat are in the USJR region, as well as a number of threatened and endangered (T&E) species, including Swainson's hawk, giant garter snake, and the blunt-nosed leopard lizard.
Fish communities in the USJR region have changed markedly in the last 150 years as a result of human settlement, dam construction, flood control infrastructure, and water diversions. The changes in historical habitat conditions, dewatering of several reaches of the San Joaquin River as a result of Friant Dam construction and operations, combined with the introduction of non-native fish species, have resulted in a general decline in both the abundance and distribution of native fish species, including steelhead trout and chinook salmon. Members of each of the historical fish assemblages are thought to be present in the USJR region, although specific information about the USJR region does not exist. The environmental conditions that have changed and currently influence the abundance and distribution of fish species include:
• Altered flow regimes with substantial flow reductions • Reductions in the frequency, magnitude, and duration of floodplain inundation • Isolation of floodplains from the river channel by channelization and levee construction • Changes in the supply and transport of sediment • Habitat fragmentation and blockage of migration pathways by physical barriers • Poor water quality • Water temperature constraints
The rainbow trout, California roach, and pikeminnow-hardhead-sucker species generally inhabit portions of the river. The deep-bodied fish assemblage previously occupied San Joaquin Valley flood reaches, lakes,
Upper San Joaquin River Regional Flood Management Plan 2-45

REGIONAL SETTING
and floodplain habitats, but native fish species in this assemblage are now extinct (e.g., thicktail chub), extirpated, or are substantially reduced in abundance and distribution because of the drastic changes that have occurred in these ecosystems. The habitats once occupied by this assemblage are now inhabited primarily by non-native fish species. Reclamation and CDFW studies conducted between 2003 and 2005 inventoried fish distributions by reach in the San Joaquin River.
In the USJR region, the relationship between land use and the natural landscape, ecosystem processes, fish, and wildlife has a complex history. In the Mediterranean climate of the San Joaquin Valley, a delicate balance exists between land use (urban, agriculture, native, and unclassified), water management (cycle of floods and droughts), and the ecological importance of the fish and wildlife species in the river corridor.
This section describes the natural resources in the USJR region as well as ongoing planning efforts related to these resources. Understanding these resources is
important because of the flood management paradigm of the CVFPP, which includes promoting natural processes, increasing and improving the quantity, diversity, and connectivity of natural habitat areas, and promoting the recovery and stability of native species. The focus is on characterizing those landscapes, processes, and habitats that could benefit from flood management actions, or those that adversely affect the ability of local entities to maintain or improve flood management facilities. A summary of concurrent planning efforts (including the SJRRP and the CVFPP Conservation Framework, among others) is included to provide context for the development and prioritization of flood management actions.
2.5.1 Geology The Central Valley is an alluvial plain 40 to 60 miles wide and 400 miles long in the central part of California, stretching from just south of Bakersfield to Redding. The San Joaquin Valley makes up approximately half of the Central Valley and is drained by the San Joaquin River. The San Joaquin River and its tributaries flow out of the Sierra Nevada into the Central Valley, depositing sediments on the alluvial fans, riverbeds, floodplains, and historical wetlands. Sediment in the San Joaquin River primarily consists of large boulders, cobbles, fine sand, and less commonly, intermediate-size gravels. The sediment load of the San Joaquin River becomes finer with distance downstream. One major impact on sediment loads in the river is the impediment to transport at dams, drop structures, and other facilities where flow is obstructed. The impact of this infrastructure is summarized in Table 2-7. For example, although the water and some of its fine sediment may be released on the downstream side of a dam, the majority of the sediment loads, particularly coarse materials, remains on the upstream side. This sediment accumulation over time can significantly decrease the storage volume of a reservoir or change the capacity of flood system conveyance.
Sediment loads are carried by flows, and infrastructure that reroutes flows alters sediment transport within the watershed. Flood control bypasses carry a major portion of the sediment load of the San Joaquin River, which is diverted from Reach 2 into the bypass system and affects downstream river sedimentation patterns. Diversion and other hydraulic control structures may constrict the river channel, altering local incision and deposition patterns. Levees and canal embankments on the historical floodplain prevent
Eastside Bypass
2-46 Upper San Joaquin River Regional Flood Management Plan

REGIONAL SETTING
natural channel migration. Thus, oxbow formations do not develop and the velocity of the flow increases, thereby encouraging channel incision, bed armoring, and channel simplification. This has resulted in sediment issues in the riverbed, including levee erosion, incised channels, and formation of sand bars, all of which reduce flow capacities within the flood management system.
Table 2-7. Generalized Effects on Geomorphic Processes by Flood Control Infrastructure
Infrastructure Effects Diversion structures Backwater effects cause disruption of local incision and deposition patterns; riprap protection prevents
channel migration and avulsion Bypass diversion structures
Backwater effects cause disruption of local incision and deposition patterns; reroutes sediment load
Other hydraulic control structures
Backwater effects cause disruption of local incision and deposition patterns; reroutes sediment load
Offstream flood control dams
Dams re-sort sediment load
Levees Levees stop channel migration, increase river velocity, and therefore, increase incision, bed armoring, and channel simplification
Canals Embankments stop channel migration and increase river velocity, and therefore, increase incision, bed armoring, and channel simplification; reroutes sediment load
2.5.2 Hydrology As early as the 1800s, local landowners began constructing infrastructure to protect lands from floods and supply water for irrigation. Over time, many of the natural sloughs that emerged and reconnected with the river were converted into surface-water conveyance and return channels, or they were filled. Private levees were constructed adjacent to the main river channel at various locations from Gravelly Ford to the confluence with the Merced River. In addition, diversion canals and dams were constructed to irrigate lands, which resulted in reduced flows in the river below these structures. Between the 1940s and 1970s, a number of dams including Friant, Hidden, and Buchanan dams, as well as the San Joaquin River Flood Control Project, were constructed, which further altered the flow regime in the river. Table 2-8 provides a sequential summary of modifications to the hydrology of the USJR region.
Today, the San Joaquin River flows are controlled during much of the year with reaches of the river running dry prior to the releases of interim flows as part of the SJRRP (for more information see Section 3.5). However, major storm events can lead to uncontrolled flows that flood vast areas of land. This subsection discusses area hydrology, including existing streams and rivers, as well as hydraulics of river and stream systems.
Table 2-8. Sequential Summary of Modifications to the Hydrology of the San Joaquin River Time Period Description
Pre-Settlement • Reach 1 water historically was conveyed in a single channel confined by natural bluffs and terraces. • Terraces and bluffs began tapering down near Herndon and became flush with the floodplain near Gravelly Ford. • Below Reach 1, a complex network of parallel secondary channels emerged and reconnected with the San Joaquin
River. • High flows were spread over an extensive flood basin.
Early Development
• Early settlers converted many of the secondary channels to canals that conveyed surface water flows from the San Joaquin River for water supply.
• Many secondary channels were filled as floodplain was developed. • Private levees were established along many segments of the San Joaquin River to protect private property from high
flows.
Upper San Joaquin River Regional Flood Management Plan 2-47

REGIONAL SETTING
Table 2-8. Sequential Summary of Modifications to the Hydrology of the San Joaquin River Time Period Description
Late 1800s • Major diversion canals were developed in the USJR region to divert San Joaquin River flows. • Mendota Dam was constructed in 1871 by Miller and Lux. • Mendota Dam diverted water into canals that supplied water for cattle operations. • Mendota Dam was originally constructed of brush and sand and was replaced by a wooden dam in 1890s. • A rock dam was constructed near current location of Friant Dam. • This rock dam was abandoned in the late 1880s because the structure was damaged repeatedly during high flows. • A temporary dam of sand-filled sacks (currently Sack Dam) was constructed annually to divert water from the San
Joaquin River into Temple Slough (currently Arroyo Canal) during periods of low flow. • Other temporary sand dams were constructed on the San Joaquin River at several locations to divert flows into
irrigation canals.
Early 1900s • Several reservoirs were constructed in the USJR watershed for hydropower generation. • The reservoirs altered the hydrology of the USJR by capturing spring flows and releasing the stored water in the
summer. • To protect their riparian water rights, Miller and Lux negotiated contracts with the power companies that owned the
dams to restrict the storage of water behind the dams. • The original Mendota Dam was replaced with a 13-foot-tall concrete and wood structure in the 1920s.
1942 • Friant Dam was completed. • Releases from Friant Dam continued downstream for a significant amount of time. • The Friant Dam releases were required to provide water to the Exchange Contractors at this time because the DMC
had not yet been completed.
1949 • Diversion of water from Friant Dam into the Friant-Kern Canal commenced. • Between the completion of Friant Dam in 1949 and the SJRRP interim flows that were initiated in 2009, many sections
of the channel were completely or substantially dewatered (especially Reach 2 and portions of Reach 4), and most releases from Friant Dam were for water management.
1951 • The DMC was completed, and the Exchange Contractors began diverting small quantities of imported Delta water. • Flows in Reaches 3, 4, and 5 (Mendota to the Merced River confluence) were the result of water provided by the DMC
and agricultural return flows.
1954 • Friant diversion of flows into the Madera and Friant-Kern Canal reached full capacity. • Releases from Friant Dam were required to satisfy riparian water rights to the head of Reach 2.
1966 • The San Joaquin River Flood Control Project was constructed. Elements include: − Construction of project levees and a system of bypass channels. The levees prevented the inundation of the
adjacent lands during periods of high flows by containing most high flows in the main San Joaquin River Channel and bypass channels.
− Delivery of flow contributions from tributaries, such as the Fresno River and the Chowchilla River, to the bypass channel rather than to the main San Joaquin River Channel.
1975 • Hidden Dam was constructed on the Fresno River, and Buchanan Dam was constructed on the Chowchilla River.
Note: DMC = Delta-Mendota Canal
Existing and Historical Hydrologic Conditions The USJR region has a climate that is generally warm and dry, with summer temperatures reaching 100 degrees Fahrenheit (°F) or more and mild winters, during which most of the rainfall for the year falls. The USJR region is affected by the rainfall and runoff patterns in the San Joaquin River Basin, which varies temporally and with elevation. The Mediterranean climate of the San Joaquin River Basin creates predictable seasonal variations in precipitation. The lower elevations characteristically experience wet, cool winters with temperatures usually above freezing and dry, hot summers with highs above 100°F. The average annual precipitation at the valley floor, including the USJR region, is less than 10 inches per year, typically occurring during the fall and winter. Higher elevations receive more precipitation than the valley. Average annual precipitation at higher elevations is up to 70 inches per year.
2-48 Upper San Joaquin River Regional Flood Management Plan

REGIONAL SETTING
The San Joaquin River is the major river in the USJR region and receives flows from several major tributaries (for example, Ash Slough, Fresno River, Merced River, Chowchilla River, Kings River) in addition to receiving surface runoff from the upper watershed and contributions from groundwater. The Fresno and Chowchilla rivers, on average, annually contribute a combined runoff of approximately 160,000 acre-feet (AF) to the San Joaquin River below the current location of Mendota Pool into Reaches 3 and 5 of the San Joaquin River. The majority of these inflows occur during the fall and winter. Historically, Kings River flowed into Tulare Lake; however, when Tulare Lake exceeded its storage capacity, water spilled into Fresno Slough, which discharges into the San Joaquin River near the current location of Mendota Pool.
High flows in the USJR region typically occur during winter-season rainfall and the spring snowmelt period. These flows typically occur in the fall and winter and are generated from direct rainfall runoff or from rain-on-snow storm events. These winter-season events typically produce the highest flows, with rainfall on large snowpack generating the largest discharge rates, which characteristically cause rapid increases in stream flows that decrease quickly to typical winter baseflow levels. High flows from snowmelt typically produce moderately high, longer-duration flows during the spring and early summer. In addition, heavy rainfall events can produce significant flows of shorter duration. These flows are often caused by Atmospheric Rivers, which are warm heavy storms that strike in winter, producing intense rainfall over large areas.
Hydrology and Geomorphology The San Joaquin River originates above an elevation of 10,000 feet in the Sierra Nevada Mountains, near Thousand Island Lake (Middle Fork) and Mount Lyell (North Fork). The river flows generally southwest through four different hydroelectric projects and is impounded by Friant Dam at Millerton Lake as it exits the foothills into the Central Valley. Friant Dam, built in 1942, changed the natural hydrologic and geomorphic regimes of the river, as described in detail in this section.
Below Friant Dam, the San Joaquin River continues west/southwest, north of Fresno. This reach is primarily gravel bedded and confined by bluffs and terraces. At Gravelly Ford, the character of the river changes to an unconfined, sand-bedded channel. This breakpoint defines the transition between Reach 1 (Friant Dam to Gravelly Ford) and Reach 2 (Gravelly Ford to Mendota). 2
Below Gravelly Ford, the river meanders across the San Joaquin alluvial fan, forming a low-gradient, sand-bedded channel, which is characteristic of the San Joaquin River, to the confluence with the Merced River. At Mendota, the river channel turns to the northwest, following a trajectory influenced by confinement between the alluvial fans from tributaries draining the uplifting Sierra Nevada and the Coastal Range. Mendota also marks the location of the Fresno Slough, which forms hydrologic connections between the San Joaquin River and the Tulare Basin. The relationship between the San Joaquin River and the Tulare Basin has been described as follows (McBain & Trush, 2002):
Historically, flood flows likely drained from the San Joaquin River into Tulare Basin when Tulare Lake was at a moderate to low elevation, and when Tulare Lake was higher or the Kings River was at high flow, flood flows from the Tulare Basin drained into the San Joaquin River. This flood flow contribution from the Kings River still occurs, but the contribution of flood flows from the San Joaquin River to Tulare Lake is rare.
Below Mendota, the channel continues through agricultural lowlands to the confluence with the Fresno River, Chowchilla River, Bear Creek, Merced River, and Mariposa Creek, and eventually flows near Vernalis
2 San Joaquin River Reach designations are defined in Table 2-1 and in Figure 2-2.
Upper San Joaquin River Regional Flood Management Plan 2-49

REGIONAL SETTING
into the Delta, which drains into the San Francisco Bay. In the USJR region, Fresno River, Chowchilla River, and Bear Creek are the primary tributaries.
Spring snowmelt runoff is the primary contributor of water to the river channel, although large flood events have resulted from winter rain-on-snow events. Before the construction of Friant Dam, flows typically ranged from 3 cfs to more than 30,000 cfs at the spring peak runoff event, while flood flows often exceeded 95,000 cfs (McBain & Trush, 2002). As detailed in this document, large flood events still occur. The most recent large flood occurred in 1997 when more than 60,000 cfs were released from Friant Dam (USACE, 1999).
After the 1997 flood, the USACE completed frequency analyses of the San Joaquin River (below Friant Dam and at Gravelly Ford), Fresno River, Chowchilla River, Ash Slough, Berenda Slough, and the Fresno River (USACE, 1999), as displayed in Table 2-9. No data were available for the Owens and Bear creek tributaries.
Table 2-9. Upper San Joaquin River Region Flood Frequency Analysis
Gage and Identification
Period of Record
Watershed Area
(square miles)
Q1.5 1.5-Year
Recurrence Interval Flow
(cfs)
Q10 10-Year
Recurrence Interval Flow
(cfs)
Q100 100-Year
Recurrence Interval Flow
(cfs)
San Joaquin River below Friant. USGS: 11-251000
1949-1997
(post-Friant)
1,676 220 8,000 70,000
San Joaquin River at Gravelly Ford. CDEC: GRF
1949-1997
(post-Friant)
1,805 110 9,000 65,000
Fresno River below Hidden Valley Dam. USGS: 11-258000
1976-1998 234 250 3,700 5,000
Chowchilla River below Buchanan Dam. USGS: 11-2590
1976-1998 235 470 3,700 7,000
Ash Slough below Chowchilla River (no gage given)
1976-1998 268 340 2,600 5,000
Berenda Slough below Chowchilla River (no gage given)
1976-1998 268 135 1,050 2,000
Source: USACE, 1999 Notes: USGS United States Geological Survey CDEC California Data Exchange Center
With the exception of the 1997 flood, peak flows on the San Joaquin River have been reduced in both magnitude and frequency due to the construction of upstream water and flood management infrastructure.
Landscape Alteration The USJR region is located in a topographically low-lying, depositional area of the Central Valley. Before the construction of water and flood management infrastructure, the San Joaquin River would frequently overflow its banks during the winter and spring peak flows, spreading floodwaters laterally onto wide, dynamic floodplains, sloughs, and flood basins that supported a large diversity of native fish and wildlife.
2-50 Upper San Joaquin River Regional Flood Management Plan

REGIONAL SETTING
Sediment eroded from the Sierra Nevada Mountains and transported through the steep, confined reaches of the headwaters would deposit into the lower-gradient meandering channel, riparian areas, and floodplains. Flood events would rearrange sediments that formed the river corridor, creating a dynamic ecosystem with a complex distribution of meanders, avulsions, bars, pools, and other geomorphic features. This provided ideal conditions for the establishment of large areas of native vegetation along the river corridor.
The hydrology of the San Joaquin River watershed has changed dramatically from historical conditions, primarily as a result of the development of dams, water diversions, and flood management infrastructure (see Table 2-8 for a summary of historical modifications). These modifications have affected the fluvial geomorphic functions of the river, disconnecting the vast floodplain and riparian areas that historically existed along the river corridor, and altered the magnitude, duration, frequency, and timing of flood flows that supported native populations of fish, wildlife, and riparian and wetland vegetation. Between 1949 (when Friant Dam did not provide flows past the last water rights holder at Gravelly ford [end of Reach 1]) and 2009 (when the SJRRP interim flows were initiated), many sections of the channel were completely or substantially dewatered (especially Reach 2 and portions of Reach 4), and the majority of releases from Friant Dam were for water management. Flows in Reaches 3, 4, and 5 (Mendota to the Merced River confluence) were the result of water provided by the DMC and agricultural return flows. Tributary baseflows and floodflows into the San Joaquin River (primarily from Chowchilla River, Fresno River, Owens Creek, and Bear Creek) also have been reduced as a result of upstream impoundments and flood management infrastructure.
Sediment transport downstream has been inhibited by impoundments on the San Joaquin River, as well as its major tributaries, effectively “starving” the river of coarse sediments such as gravel and cobble. In all reaches, the channel has become more homogeneous in terms of bed formation and bed grain size compared to historical conditions, and flood management infrastructure such as the Chowchilla Bifurcation Structure has altered the natural patterns of deposition and erosion by diverting flow and sediment into bypass channels (McBain & Trush, 2002).
Historically, the large flood basins that existed in the USJR region provided floodwater storage and attenuated the peak flows of large flood events. Construction of levees and development of these flood basins has disconnected the flood basins, reduced the travel time of flood waves, and reduced the degree of flood-peak attenuation compared to unimproved conditions (McBain & Trush, 2002). Most of the San Joaquin River was a gaining reach, meaning that it received flow from shallow groundwater. This process helped to regulate baseflow in the river during dry seasons.
Additionally, the withdrawal of groundwater has led to severe land subsidence in many areas. Currently, subsidence is a major issue in the region, particularly along the Eastside Bypass. This subsidence is important to flood management because it reduces the capacity of the system.
San Joaquin River near Chowchilla Bifurcation Structure
Upper San Joaquin River Regional Flood Management Plan 2-51

REGIONAL SETTING
Projected Alterations from Climate Change Expected future changes to the climate could profoundly influence flood management needs and priorities in the USJR region. The brochure, Our Changing Climate 2012, Vulnerability & Adaptation to the Increasing Risks from Climate Change in California, the State of California’s third major assessment on climate change, summarizes climate change trends across the State, as well as in the USJR region (California Energy Commission [CEC], 2012). The following are key indicators of the trajectory of change in California’s climate:
• Average temperatures have increased by about 1.7 degrees °F from 1895 to 2011, and warming has been greatest in the Sierra Nevada.
• No consistent trend in the overall amount of precipitation has been detected, except that a larger proportion of total precipitation is falling as rain instead of snow, and snow pack in the Sierra Nevada is melting earlier in the spring (Kapnick and Hall, 2009).
• During the last 35 years, the Sierra Nevada range has witnessed both the wettest and the driest years in more than 100 years of recording.
• Substantially higher temperatures, more extreme wildfires, and rising sea levels are just some of the direct impacts experienced in California that can be attributed, at least partially, to climate change (CEC, 2012).
The Climate Change and Sea Level Rise Scenarios for California Vulnerability and Adaptation Assessment analyzed future climate change scenarios and provided the following predictions for future climate change (Cayan et al., 2012):
• By 2050, California is projected to warm by approximately 2.7°F higher than average temperatures in 2000, representing a threefold increase in the rate of warming over the last century.
• By 2100, average temperatures could increase by 4.1°F to 8.6°F, depending on emissions levels.
• Springtime warming—a critical influence on snowmelt—will be particularly pronounced.
• Summer temperatures will rise more than winter temperatures, and the increases will be greater in inland California.
• Heat waves will be more frequent, hotter, and longer.
These trends have serious implications for local economies (agricultural productivity), environmental conditions (stressing existing natural communities), and regional water management (allocation and flood management) in the USJR region. These changes could impact the flow release patterns, water storage, and flood management capabilities in the region, potentially increasing competition among urban and agricultural water users and environmental needs. Projections show that for the latter half of the twenty-first century, critically dry water years could occur 28 percent to 35 percent more often compared to the historical period of 1951 to 2000 (Null and Viers, 2012). These future climate-driven changes to regional hydrology could impact flood management infrastructure capacities by changing the size, duration, and timing of flood events.
2.5.3 Biological Resources In its natural condition, the vegetation on the floor of the San Joaquin Valley included permanently flooded tule marshes; seasonal marshes (intermittently inundated); riparian forests along perennial streams, lakes, or sloughs; and oak woodlands in 100-year floodplains. Extensive prairies were in upland
2-52 Upper San Joaquin River Regional Flood Management Plan

REGIONAL SETTING
areas with San Joaquin saltbush on more xeric, alkaline sites. Vernal pools, a type of seasonal wetland, were once commonly interspersed on the prairies of the San Joaquin Valley (Moore et al., 1990; USEPA, 2013).
In the San Joaquin River basin, the frequency and average duration of floodplain inundation flows have greatly decreased because of retention of flows behind dams and diversion of flows into the bypass system. As a result, little of the region can be considered a “typical” floodplain because it is no longer regularly inundated. Reaches 4 and 5 contain by far the greatest extent of floodplain vegetation because they are largely within or adjacent to the various units of the San Luis NWR complex (DWR, 2002).
There was a 92 percent decrease in herbaceous riparian and marsh vegetation along the San Joaquin River between 1937 and 1957. Riparian scrub declined by 38 percent during this period, but riparian forest showed a slight increase. The large decline in riparian, and especially marsh, habitat appears to have been caused primarily by conversion of these lands to agricultural fields, although changes in hydrology resulting from river operations probably had an effect. Since 1957, there has been an increase in conversion of grassland, pasture, and agricultural fields to orchards and vineyards, and an increase in aggregate mining and urban development (Reclamation, 1998).
Upstream flood management infrastructure, including dams, has reduced the frequency of channel-forming and scouring flows, which has resulted in a gradual decline of bare gravel and sandbar surfaces. Vegetation succession of riparian scrub to forest is no longer balanced by periodic loss of forest to the river because of erosion and the appearance of new riparian scrub on sand and gravel bars. The recruitment of cottonwoods and willows depends not only on geomorphic processes that create bare mineral soil through erosion and deposition of sediment along river channels and on floodplains, but also on flow events that result in floodplain inundation. Receding flood flows that expose moist mineral soil create ideal conditions for germination of cottonwood and willow seedlings. In addition, river operations have altered the natural regime of gradually declining flows in spring, which are periodically necessary to disperse seed of willows and cottonwoods.
Terrestrial Habitats and Species On the San Joaquin River from Friant Dam to the confluence with the Merced River, there are approximately 60,000 acres of riparian corridor and floodplain with native or naturalized vegetation, with the remainder being urban, disturbed, cultivated, or open water. Existing habitat types found along the San Joaquin River include riparian forest, scrub, wetlands/marsh, grassland, alkali sink, agriculture, and riverwash (DWR, 2002). The following subsections document the diversity and distribution of plant species, both native and introduced, within each of these habitat types.
Riparian Forest Riparian forest has been classified into four major types, based on the dominant species—cottonwood riparian forest, willow riparian forest, mixed riparian forest, and oak riparian forest (DWR, 2002). Cottonwood riparian forest is a multilayered riparian forest found on the active low floodplain of the San
Row Crops in the San Joaquin Valley
Upper San Joaquin River Regional Flood Management Plan 2-53

REGIONAL SETTING
Joaquin River. Older stands of cottonwood riparian forest also exist in areas that were formerly active floodplains, but which are now on functional terraces because of the reduction in high flows. Dominant species are Fremont cottonwood and Goodding’s black willow; other willow species include red willow and arroyo willow. Box elder and ash are also commonly found in this vegetation type. The understory is typically dense with young willows and cottonwoods. Other understory species include wild rose and introduced Himalayan blackberry.
Willow riparian forest is frequently dominated almost exclusively by black willow. Red willow and arroyo willow are also common. Usually, cover is dense. Occasional scattered cottonwoods, ashes, or white alders might be present but are never an important part of the canopy cover. Buttonwillow is also a common component of this habitat type.
Mixed riparian forest is a multilayered winter-deciduous forest generally found on the intermediate terraces of the floodplain along the San Joaquin River. Typical dominant trees in the overstory and midstory include Fremont cottonwood, box elder, Oregon ash, western sycamore, and Goodding’s black willow. White alder occurs immediately along the water’s edge in the upper portion of the study area. The understory of mixed riparian forest is similar to that of cottonwood riparian forest. Common shrubs include red willow, arroyo willow, and California buttonbush.
Oak riparian forest is a tree-dominated habitat with an open to closed canopy. Valley oak is the dominant tree in this vegetation type, although California sycamore, Oregon ash, and Fremont cottonwood are present in small numbers. Open woodlands with only valley oak trees and grassy understory are typical of areas farther away from the active channel and are exposed to less flood-related disturbance than other
riparian vegetation types. A valley oak/sycamore co-dominated type is found along the lower edges of the bluffs along the upper river in San Joaquin River Reach 1A (DWR, 2002).
The larger, mature, mixed-riparian forest stands along the San Joaquin River once supported the densest and most diverse breeding bird communities in California (Gaines, 1974) and still provide high-quality nesting habitat for raptors such as red-tailed hawk and red-shouldered hawk. These forest stands also provide nesting habitat for cavity-nesting species such as downy woodpecker, wood duck, northern flicker, and white-breasted nuthatch. Riparian forests and associated wetlands produce populations of insects that feed on foliage
and stems during the growing season. These insects, in turn, are prey for migratory and resident birds, including olive-sided flycatcher, warbling vireo, and yellow warbler. Mammalian species using riparian forests include coyote, raccoon, and striped skunk.
Scrub Three types of scrub habitat—willow scrub, riparian scrub, and elderberry savanna—have been found along the San Joaquin River (DWR, 2002). Typical bird species found in scrub habitats include western wood-pewee, black phoebe, yellow-billed magpie, bushtit, Bewick’s wren, lazuli bunting, blue grosbeak,
San Joaquin River at the confluence with the Merced River
2-54 Upper San Joaquin River Regional Flood Management Plan

REGIONAL SETTING
and American goldfinch. Mammal species using scrub habitats are similar to those described for riparian forests.
Willow scrub is a dense assemblage of willow shrubs often found within the active floodplains of the river. These sites are subject to deeper flooding and higher flows that bury and break woody stems. The most common dominants are Goodding’s black willow and narrow-leaved willow, with the narrow-leaved willows frequently forming dense clonal stands. Cottonwood seedlings are often present but rarely reach reproductive size. Buttonwillow is also a common component of this habitat (DWR, 2002).
Areas classified as riparian scrub consist of woody shrubs and herbaceous species and are dominated by different species, depending on river reach. Some areas are dominated by stinging nettle, mugwort, and various tall weedy herbs; others are dominated either by blackberry (usually the introduced Himalayan blackberry) or by wild rose in dense thickets. These ruderal associations may be maintained by periodic disturbance (i.e., flood management clearing of woody vegetation).
Elderberry savanna is a shrub-dominated community characterized by widely spaced blue elderberry shrubs with an herbaceous understory typically dominated by non-native grasses and forbs that are characteristic of annual grassland communities (DWR, 2002). This community is found on fine-textured, rich alluvium outside active channels in areas that are subject to periodic flooding (Holland, 1986). Although only a few areas of this vegetation type were within the study area, it was considered a significant resource because of its scarcity (it was thought by some to have been extirpated from the San Joaquin Valley) and because it provides potential habitat for the endangered valley elderberry longhorn beetle (DWR, 2002).
Wetland/Marsh All types of wetlands and emergent marsh vegetation fall into this category. Emergent wetlands typically occur in the river bottom immediately adjacent to, or just a few meters from, the low-flow channel. They are most abundant in Reaches 4B and 5 (DWR, 2002). Sites like backwaters and sloughs, where water is present through much of the year, support emergent marsh vegetation such as tules and cattails. Along the margins of the river and in swales adjacent to the river, more ephemeral wetlands support an array of native and non-native herbaceous species, including smartweed, saltgrass, sunflower, curly dock western goldenrod, Mexican rush, and horseweed. Vernal pools might be found in these areas (USEPA, 2013).
Within the USJR region, Merced County has the largest block of pristine, high-density, vernal pool grassland habitat remaining in the State. This unique community supports Federally designated critical habitat for four listed vernal pool crustacean species, one listed vernal pool amphibian and, six listed vernal pool plant species. The four listed vernal pool crustacean species are longhorn fairy shrimp, conservancy fairy shrimp, vernal pool fairy shrimp, and vernal pool tadpole shrimp. The listed vernal pool amphibian is the California tiger salamander. The six listed vernal pool plant species are Hoover’s spurge, fleshy owl’s clover, Colusa grass, Greene’s tuctoria, hairy Orcutt grass, and San Joaquin Orcutt grass. Merced County contains over 20 percent of the remaining wetlands in California (Merced County, 2011a).
Marshes along the edges of the low-flow channel and in backwaters and sloughs can be extensive in downstream areas and support an array of wildlife. Species such as song sparrow, common yellowthroat, marsh wren, red-winged blackbird, and Virginia rail are present in this habitat during the nesting season and, in some cases, throughout the year. Pacific chorus frog, bullfrog, and western terrestrial garter snake are common amphibians and reptiles found in this habitat. Mammalian species that use this habitat include California vole, muskrat, and Norway rat.
Upper San Joaquin River Regional Flood Management Plan 2-55

REGIONAL SETTING
Grassland Grassland is a forb- and grass-dominated plant community found on sites that are well drained and flood only occasionally. Most areas of grassland are above the frequently flooded zone of the San Joaquin River. Some areas may intergrade with seasonal wetlands or contain vernal pools (USEPA, 2013). The most abundant species are non-native grasses (ripgut brome, foxtail fescue, and foxtail barley) and forbs (red-stemmed filaree and horseweed). Typical bird species associated with grasslands include northern harrier, ring-necked pheasant, mourning dove, loggerhead shrike, and savannah sparrow. Mammalian species that use grasslands include deer mouse, California vole, California ground squirrel, Botta’s pocket gopher, and coyote. Common amphibian and reptile species associated with grasslands in the San Joaquin Valley include western toad, western fence lizard, and gopher snake.
Alkali Sink Alkali sinks are shallow seasonally flooded areas or playas that are dominated by salt-tolerant plants such as iodine bush and seablites. An herbaceous understory usually is lacking, but sparse cover of annual grasses such as Mediterranean barley and red brome may be present. Alkali sinks flood seasonally, but they do not flood every year or respond to local thunderstorms. Vernal pools might be found in this habitat type. A small amount of alkali sink was found in Reach 5 (DWR 2002), as well as at the Alkali Sink Ecological Reserve. Wildlife species typically associated with alkali sink habitat include kangaroo rat, Nelson’s antelope squirrel, San Joaquin kit fox, coyote, side-blotched lizard, and blunt-nosed leopard lizard.
Agricultural Lands Agricultural lands consist primarily of annual crops, orchards, and vineyards. The annual crops include field or row crops such as cotton, sweet corn, and safflower; and truck, nursery, and berry crops such as lettuce, bell peppers, strawberries, melons, and tomatoes; and rice. The orchards consist of citrus and deciduous fruit and nut crops. The vineyards produce table, and wine grapes and raisins. Agricultural lands can provide food and cover for wildlife species, but the value of the habitat varies greatly among crop type and agricultural practices. Pastures, alfalfa, and row crops such as beets and tomatoes provide foraging opportunities for raptors, and grain crops provide forage for songbirds, small rodents, and waterfowl at certain times of year. Orchards and vineyards have relatively low value for wildlife.
Riverwash Riverwash consists of alluvial sands and gravel associated with the active channel of the San Joaquin River. Generally, riverwash areas exist as sand and gravel point bars in the floodplain of the river. The scattered vegetation on riverwash and other exposed areas provides nesting habitat for shorebirds, such as killdeer, black-necked stilt, and American avocet. Other species, such as mallard ducks, might use riverwash habitats for roosting or resting.
Aquatic Habitats and Species The San Joaquin River historically was an alluvial river downstream of Friant Dam. The channel in Reach 1 was generally gravel bedded, with bedrock exposures that controlled river gradient. The river often
2-56 Upper San Joaquin River Regional Flood Management Plan

REGIONAL SETTING
formed multiple channels in this reach due to periodic migration and avulsion during large floods. In Reaches 2 through 5, the river was sand bedded, forming meanders, and in some reaches had multiple channels. The lower reaches (Reach 3 through Reach 5) had notable floodplains and flood basins adjacent to the river. These floodplains and flood basins were vast and seasonally inundated, allowing fish periodic access to high-quality aquatic habitat.
As described previously, the natural or “unimpaired” flow regime of the San Joaquin River varied greatly in the magnitude, timing, duration, and frequency of streamflows, both seasonally and annually. The historically variable flow regime of the San Joaquin River resulted in spatial and temporal differences in sediment transport, scour, and deposition on alternate bar features that created morphologic and hydraulic complexity, which in turn produced diverse, high-quality aquatic habitat for salmon and other aquatic species (McBain & Trush, 2002). These habitats sustained multiple salmonid species, numerous resident native fish species, and other aquatic species.
The aquatic environment of the USJR has been significantly altered over the past century due to changes in land and water use. The construction and operation of Friant Dam significantly reduced base flows and higher flows that support recruitment of riparian vegetation. Habitat conditions for fish in Reach 2 through Reach 5 have been substantially modified by construction of levees and dikes, agricultural encroachment, and water diversions that dewatered most of Reaches 2 and 4. These changes have reduced the habitat complexity in the main channel and have reduced the quantity and quality of off-channel habitat. Much of the floodplain habitat has been isolated from the river by dikes and levees, and the remaining floodplain habitat is rarely inundated under current hydrologic conditions (Reclamation and DWR, 2011). Isolation of the river from its floodplain has cut off frequent flooding, reducing the cyclical replenishing of food web productivity in important rearing habitat.
Physical barriers, reaches with poor water quality and little or no surface flow, and the presence of false migration pathways have reduced habitat connectivity for anadromous and resident native fish. In addition to barriers, false migration pathways could affect both upstream and downstream movement of fish. Bypass flows could attract fish into drains and bypasses where habitat is nonexistent because environmental conditions are unsuitable. As a result of these habitat changes, fish communities in the San Joaquin River basin have undergone substantial changes in the last 150 years. Of the approximately 21 native fish species historically present in the San Joaquin River, at least 8 species are now uncommon, rare, or extinct, and an entire fish assemblage—the deep-bodied fish assemblage (e.g., Sacramento splittail, Sacramento blackfish)—has been largely replaced by non-native warm-water fish species (e.g., carp, catfish) (Moyle, 2002).
Spring and fall runs of chinook salmon formerly existed in the major San Joaquin River tributaries and in the USJR (Fry, 1961), and there may have been a late-fall run in the main stem San Joaquin River. The numbers of salmon that at one time existed in the San Joaquin River were, by some accounts, significant. The former spring salmon run of the San Joaquin River has been described as “one of the largest chinook salmon runs anywhere on the Pacific Coast” and numbering “possibly in the range of 200,000 to 500,000 spawners annually” (Yoshiyama et al., 2001). However, the historical population of spring-run chinook salmon in the San Joaquin River was extirpated by the operations of Friant Dam that resulted in dewatering the river and making fish passage impossible.
Fall-run chinook salmon historically composed a smaller portion of the river’s salmon population (Moyle, 2002). However, by the 1920s, reduced autumn flows in the mainstem San Joaquin River had reduced the fall run of chinook salmon. The CDFW (formerly California Department of Fish and Game) currently
Upper San Joaquin River Regional Flood Management Plan 2-57

REGIONAL SETTING
operates an artificial fish barrier on the San Joaquin River to direct migrating adult salmon into the Merced River, preventing them from entering the USJR (CDFW, 1990). Despite the barrier, fall-run chinook salmon occasionally stray up the San Joaquin River, especially during wet years.
Steelhead are believed to have been historically abundant in the San Joaquin River, although little detailed information on their distribution and abundance is available (Lindley et al., 2006; McEwan, 2001). The
extent to which steelhead currently use this section of river is not well known; however, steelhead are believed to have been extirpated from the USJR for the same reasons as described for salmon.
Aquatic Species by River Reach Reach 1. Native fish species captured in Reach 1A included rainbow trout, Sacramento sucker, threespine stickleback, lamprey species, sculpin species, and Sacramento pikeminnow. No native fish species were captured in Reach 1B during the inventory; however, earlier investigations report occurrence in Reach 1 of riffle sculpin, prickly sculpin, hardhead, tule perch, and fall-run chinook salmon. Also, a number of introduced fish species were captured in Reach 1A, including green sunfish,
western mosquitofish, largemouth bass, red-ear sunfish, brown bullhead, black crappie, bluegill, channel catfish, common carp, goldfish, golden shiner, kokanee, and spotted bass. In Reach 1B, the introduced fish species captured were bluegill, green sunfish, redear sunfish, and spotted bass.
Reach 2. Species diversity increases downstream mostly due to the shift from native species to non-native species. Significant portions of Reach 2 are typically dry, so fish populations are confined to reaches where flows exist (i.e., to Reaches 1A and 1B upstream from Gravelly Ford, and to Mendota Pool in the lower part of Reach 2). Hitch is the only native species found in Reach 2. Rainbow trout and potentially riffle sculpin are the only native species known to occur historically that are found in Reach 1 but not in Reaches 2 through 5. Reach 2 also has the same composition of non-native species, with the addition of white crappie, threadfin shad, fathead minnow, white catfish, and striped bass. A recent fish monitoring survey, conducted in October 2014, also identified a Weather Loach, a previously undocumented invasive species in the San Joaquin River.
Reach 3. Prickly sculpin, hitch, Sacramento blackfish, and tule perch are the native fish species identified in Reach 3. Non-native fish species present in Reach 3 include all of those documented in Reaches 1 and 2, as well as inland silverside and red shiner
Reach 4. Reach 4 is dry much of the year; therefore, only inland silverside, a non-native species, has been documented in the reach during the past 25 years.
Reach 5. The Sacramento sucker, prickly sculpin, hitch, Sacramento blackfish, Sacramento pikeminnow, Sacramento splittail, and tule perch are native species documented in Reach 5. All non-native species present upstream from Reach 5 are also in this reach. In addition, pumpkinseed and spotted bass have been detected in Reach 5.
The current distributions of white sturgeon, green sturgeon, river lamprey, Kern brook lamprey, and western brook lamprey within the region are unknown. In the bypasses, fish enter the systems if they are available upstream of the diversion facilities.
Chinook Salmon
2-58 Upper San Joaquin River Regional Flood Management Plan

REGIONAL SETTING
Species of Concern Exotic and invasive species are described in this section due to their ability to interact and adversely affect other native species of concern.
Plant Species Based on the results of searches of the California Natural Diversity Database and the California Native Plant Society Inventory of Rare Plants, and on review of existing environmental documentation, 30 plant species of concern were identified as having potential to occur between Friant Dam and the Merced River (Reclamation and DWR, 2011). These species are listed in Table B-1 of Appendix B.
Wildlife Species Sixty-one wildlife species of concern were identified to have a potential to occur in the area between Friant Dam and the Merced River. Although historically known to exist in the region, California red-legged frog and giant kangaroo rat are considered, at present, to be extirpated from this area. Wildlife species of concern could occur in areas where they have not been documented, if suitable habitat is present. These species are listed in Table B-2 of Appendix B.
Fish Species Five fish species of concern (spring-run chinook salmon, fall/late fall-run chinook salmon, steelhead, hardhead, and Sacramento splittail) were identified to have the potential to occur in the San Joaquin River between Friant Dam and the Merced River. All of these species have special-status designation by Federal or State resource agencies. These species are listed in Table B-3 of Appendix B.
Exotic/Invasive Species
Invasive Plants Exotic plants are plant species that are not native to the region and persist without human assistance. The term “invasive plant” differs from the classification “exotic,” or “introduced plant” because it is used to describe only those non-native plant species that displace native species on a large enough scale to alter habitat functions and values. Invasive plants also have the ability to rapidly colonize bare or disturbed areas, constricting flows and increasing the hydraulic roughness of the channel, river bank, and floodplain, potentially causing increased flood hazard.
As a component of the Programmatic Environmental Impact Statement/Environmental Impact Report (PEIS/R) for SJRRP interim flows, Reclamation, in partnership with San Joaquin River Parkway and Conservation Trust and River Partners, has been conducting comprehensive surveys for invasive non-native plants, treating areas of invasive vegetation, managing labor crews, reaching out to landowners within the area of interest, and attaining all necessary permits for the work. The project has been underway since 2010 and the SJRRP has identified and is actively treating five primary invasive plant species in the USJR region:
Restricted channel capacity
Upper San Joaquin River Regional Flood Management Plan 2-59

REGIONAL SETTING
• Giant reed (Arundo donax), hereinafter called “arundo” • Sponge plant (Limnobium spongia) • Chinese tallow (Sapium sebiferum) • Red sesbania (Sesbania punicea) • Salt cedar (Tamarix species)
Additionally, perennial pepperweed (Lepidium latifolium) is of special concern in Reaches 4 and 5 because of its extensive coverage in those areas (SJRP, 2012).
The most abundant invasive species found along the San Joaquin River are eucalyptus and arundo. Eucalyptus is considered a List A-1 plant (“Most Invasive Wildland Pest Plants; Widespread”) by the California Exotic Pest Plant Council (CalEPPC). Eucalyptus can take over riparian corridors, crowding and shading out other species. Eucalyptus are widespread on the river, occurring in all reaches except Reach 3 and Reach 4 (DWR, 2002). Arundo is one of the most problematic invasive species in many riparian systems and is considered another List A-1 species by CalEPPC. Arundo occurs in all reaches except Reach 4; it is most abundant in Reach 2 and Sub-Reach 1A between Friant Dam and the Highway 99 bridge (DWR, 2002). Arundo is also a problem on the Ash and Berenda sloughs where Madera County FCWCA spends most of the agency’s O&M budget trying to eradicate it.
Tree of heaven is another problematic weed in riparian systems and in other Central Valley habitats. It is considered by CalEPPC as List A-2 (“Most Invasive Wildland Pest Plants; Regional”). A small amount of tree of heaven is found in Reaches 1 and 2 (DWR, 2002).
Other exotic species include scarlet wisteria, pampas grass, and Himalayan blackberry. Scarlet wisteria is an up-and-coming invasive species, with populations well established in the Sacramento and San Joaquin riparian zones. CalEPPC considers it a “Red Alert” species with the potential to spread explosively. At present, scarlet wisteria is found only in Reach 1, but it has invaded wide areas of the floodplain in this reach, displacing willow scrub along the edge of the low-flow channel (DWR, 2002). Pampas grass is another List A-1 weed according to CalEPPC. Only two occurrences of this weed were noted on the San Joaquin River, thus it is not currently widespread. Himalayan blackberry was introduced from Eurasia, and the weed is on List A-1 as determined by CalEPPC. It is extremely widespread in California, but only one occurrence of this species was mapped (in Sub-Reach 1A) due to the difficulty in distinguishing it from the native blackberry. However, most of the blackberry along the river appears to be this species, particularly in the riparian scrub habitats where it lines the banks of the channelized river for long stretches (DWR, 2002). Other exotic species that were noted, including edible fig, white mulberry, Lombardy poplar, and castor bean were limited to only a few small occurrences and are not considered to be major weed problems in this region (DWR, 2002).
Invasive Wildlife The introduction of non-native wildlife species can be detrimental to native species. Distribution of non-native wildlife species along the San Joaquin River is unknown but likely includes bullfrog, crayfish, and red-eared sliders (a turtle), which are common in most of California’s waterways. Several invasive invertebrate species, such as quagga and zebra mussels, Asian clams, and New Zealand mud snails, could occur in aquatic habitats but have not been found in the San Joaquin River thus far (CDFW, 2013; USGS, 2012; USGS, 2013).
2-60 Upper San Joaquin River Regional Flood Management Plan

3.0 Institutional and Governance A number of agencies have responsibility or authority related to flood management systems within the USJR region. Agency roles and responsibilities are both defined and sometimes limited by how the agency was formed—by an enabling legislation, by charter, by a memorandum of understanding with other agencies, or by ownership. This is notable because agency funding is tied to governance structure.
In the USJR region, the primary types of agencies with responsibility for flood management are local agencies, including cities, Madera County FCWCA, LSJLD, counties, and State and Federal resource management and regulatory agencies. Duties of flood management agencies include planning, funding, permitting, constructing, operating (including emergency management), and maintaining flood management facilities. These duties sometimes overlap or must be coordinated with other functions. Examples of this include:
• Flood management agencies could be responsible for either managing or coordinating with surface water supply or groundwater management programs, particularly given DWR’s emphasis on Integrated Water Management (IWM).
• Some agencies might have to coordinate with clean water programs under the jurisdiction of the National Pollutant Discharge Elimination System (NPDES).
• Flood management might be part of land use planning and require coordination with emergency services.
Regulatory or environmental compliance also is an important role of flood management agencies. A number of laws or regulatory requirements impact flood management. These requirements range from efforts to reduce flood risk and protect public safety and property to those focused on protecting or restoring ecosystems. This section of the RFMP discusses local agencies and Federal/State agencies that have authority over or interest in flood management in the USJR region. In addition, relevant Federal, State, regional, and local mandates that serve not only to protect and manage those resources and provide guidance to facilitate compliance relevant to flood management planning are summarized.
3.1 Local Agencies Local agencies with primary responsibility for flood management in the USJR region include the LSJLD, Madera County FCWCA, Merced County, MSG, Fresno County, Madera County, and the cities of Merced, Firebaugh, Los Banos, and Dos Palos. Other agencies with responsibilities or interests in flood management in the region include Columbia Canal Company (which maintains their canal banks that in some cases act as levees along the San Joaquin River in Reach 2B), City of Mendota, Central California Irrigation District (CCID), Fresno Slough Improvement Group, Grasslands WD, Gravelly Ford WD, and Merced ID. In addition, a number of local agencies are located either upstream or downstream of the USJR region and have the potential to influence or be influenced by flood operations in the region. These include Chowchilla WD, City of Chowchilla, City of Mendota, Fresno ID, James ID, Fresno Slough WD, Friant Water Authority, Kings River Conservation District (KRCD), Reclamation District 1606, Madera ID, Tranquillity ID, Tranquillity Public Utilities, Root Creek WD, San Luis & Delta-Mendota Water Authority, and Reclamation District 2092. The following subsections provide a brief overview of the primary flood management agencies in the region, including a discussion of the agency formation and responsibilities.
Upper San Joaquin River Regional Flood Management Plan 3-1

INSTITUTIONAL AND GOVERNANCE
3.1.1 Lower San Joaquin Levee District The LSJLD was formed in 1955 by special act of the legislature to operate, maintain, and perform minor repairs on levees, bypasses, and other facilities built in connection with the San Joaquin River Flood Control Project. DWR designed and constructed this project between 1959 and 1966 and is responsible for major capital repairs and improvements of the project. It is located along the San Joaquin River and portions of its east-side tributaries in Merced, Madera, and Fresno counties. The service area of the project covers 108 river miles (RM) and 192 miles of levees, which protect more than 300,000 acres of land (468 square miles). The LSJLD boundary extends for a distance of approximately 35 miles along the south side of the San Joaquin River from the Merced County line to a point just north of the city of Kerman. Jurisdiction of the LSJLD includes portions of the cities of Mendota and Firebaugh and extends to portions of Madera and Merced counties. The portion of Fresno County within the LSJLD encompasses approximately 60,000 acres (94 square miles). The San Joaquin River Flood Control Project constitutes approximately 90 percent of the total USJR region. LSJLD is responsible for O&M and emergency management of SPFC facilities within LSJLD boundaries, which includes levees, channel bottoms, and flood management facilities. The LSJLD is not responsible for O&M of nonproject levees along the San Joaquin River.
The LSJLD is funded by property tax assessments on lands within the LSJLD boundaries that receive flood control benefits. As a result of conversion of lands to State and Federal ownership (primarily for wildlife areas), the LSJLD is facing a disappearing tax base at a time when O&M costs are rising. This is important because O&M will face additional costs to maintain the channel, levee, and related flood management facilities that might be constructed as part of the SJRRP, which will far exceed the LSJLD’s current operating budget. If flow regimes are changed in the system, additional costs would result from more vegetation management activities, more sediment management and removal activities, cleaning of screens and trash racks on facilities, staff time to open and close gates and flap gates (in the bypass systems), and staff time for flood watch (24-hour staffing is needed when flows abut the toe of the levees). Additionally, the presence of water in the river channel year round or for extended periods would change LSJLD maintenance activities, including the timing, tools, and techniques used. Under existing conditions, most maintenance activities are conducted when the river is dry, allowing for easy access to the river, reducing the potential for safety hazards, and allowing the use of tools and techniques (including certain herbicides) that cannot be used in wet conditions.
3.1.2 San Joaquin River Flood Control Project Agency The SJRFCPA is a joint powers authority created to coordinate the efforts of the RFMP process and to represent local agency and landowner interests. The SJRFCPA consists of the LSJLD and SJRECWA. In addition, the County of Merced is a co-signer that provides only auditor and controller services. The SJRFCPA is responsible for developing the RFMP and contracting with the DWR.
3.1.3 Madera County FCWCA The Madera County FCWCA was formed in 1969 by Madera County Flood Control Act 4525 to be responsible for flood control planning in the county. Madera County FCWCA is responsible for the maintenance of 75 miles of channels and 25 miles of SPFC levees on Ash Slough and Berenda Slough, as well as on the Fresno and Chowchilla river systems.
In the USJR region, the Madera County FCWCA is responsible for levees along Ash and Berenda sloughs and the Fresno River Diversion Weir. Madera County FCWCA has contracted with the Chowchilla WD for 3-2 Upper San Joaquin River Regional Flood Management Plan

INSTITUTIONAL AND GOVERNANCE
O&M of the weir structures where Ash and Berenda sloughs split, and the Chowchilla River is diverted. Madera County FCWCA has many authorized functions and authorities, including the ability to tax and issue certain bonds for SI work, along with many enforcement powers. However, Madera County FCWCA currently does not have sufficient staff and funding to adequately address flood management in the county (Madera County, 2008.
3.1.4 Merced Streams Group MSG is a nonbinding partnership between the City of Merced, County of Merced, and Merced ID. The MSG project was authorized by the Flood Control Act of 1944, which was part of the comprehensive plan for flood control for the Sacramento and San Joaquin River Basins. This project was completed in 1957 and consists of four flood control reservoirs on Burns, Bear, Owens, and Mariposa creeks, including downstream improvements. In the 1970s, the MSG project was reauthorized in the Flood Control Act of 1970. This authorization provided for enlargement of the four existing reservoirs, construction of three new reservoirs, and channel improvements along Bear Creek and Mariposa Creek systems; however, only Castle Dam was completed (in 1992). Since 2005, no money has been appropriated by Congress to support the MSG project.
Recently, MSG and the USACE have discussed completing feasibility studies to support the construction of a dam on Black Rascal Creek that would provide a portion of the city of Merced with 200-year protection.
MSG is responsible for O&M on approximately 107 miles of natural channels within Merced County, covering nine creeks (Black Rascal, Burns, Bear, Canal, Edendale, Fahrens, Miles, Mariposa, and Owens creeks). MSG facilities within the USJR region include 6 miles of levees and channel along Black Rascal Creek and Owens Creek, the Owens Creek Siphon Structure, and the Black Rascal Creek Drop Structure.
3.1.5 Central California Irrigation District CCID is a public agency established in 1951 to distribute water to consumers in an orderly, efficient, and equitable manner. CCID is one of the largest irrigation districts in the Central Valley, serving over 1,600 farms across more than 143,000 acres of prime farmland. CCID is a member of the SJRECWA. CCID is responsible for the operations of the Mendota Dam on the San Joaquin River, thus having a role in flood management in the USJR region.
3.1.6 Merced Irrigation District The Merced ID became a legal entity on December 8, 1919, and provides an average of 300,000 AF of water each year to approximately 2,200 growers. Approximately 6,000 residential customers and 1,300 business customers receive services from Merced ID. Castle Dam is maintained by the Merced ID but is owned by DWR and Merced County.
3.1.7 Kings River Conservation District KRCD is located in Fresno County and was formed through special legislation in 1951. The mission of KRCD is to provide flood protection, cooperate with other agencies to achieve a balanced and high-quality water supply, provide on-farm support in efficient water conservation practices, and develop power resources for the public good.
KRCD maintains lower river levees and channels, and it operates and maintains the Kings River flood control project for the USACE. Kings River flows are diverted to the San Joaquin River through the James
Upper San Joaquin River Regional Flood Management Plan 3-3

INSTITUTIONAL AND GOVERNANCE
Bypass at James Weir located approximately 24 miles upstream of Mendota Pool. Additionally, KRCD sells electricity generated at Pine Flat dam to DWR for powering State Water Project pumping facilities.
3.1.8 Grasslands Water District The Grasslands WD is approximately 51,537 acres in size with the majority of this land in wetland habitat. The primary function of Grasslands WD is the delivery of water to landowners and O&M of approximately 110 miles of canal.
3.1.9 Gravelly Ford Water District The Gravelly Ford WD was formed in 1962 to serve water for agricultural use. The Gravelly Ford WD is approximately 10,398 acres in size with a majority of the land in agricultural production. The primary function of Gravelly Ford WD is the delivery of water for irrigation and O&M of approximately 15 miles of unlined canals. Water for the Gravelly Ford WD is from the CVP via a contract with Reclamation.
3.1.10 Chowchilla Water District The Chowchilla WD was formed in 1949 for the purpose of furnishing a supplemental water supply for agriculture within its boundaries. The Chowchilla WD receives water from two sources—Madera Canal and Buchanan Dam. The Chowchilla WD uses portions of the Chowchilla River, Ash Slough, and Berenda Slough to convey irrigation water to the Chowchilla WD distribution system for irrigation water, which consists of 150 miles of unlined canals and 49 miles of pipeline, as well as over 950 turnouts where irrigation water is delivered to water users.
3.1.11 Fresno Slough Improvement Group The Kings River system is connected to the San Joaquin River by the James Bypass Channel and Fresno Slough. Several miles of nonproject flood protection levees along Fresno Slough, south of Highway 180, are within the region. A group of eight agencies formed the Fresno Slough Improvement Group to make upgrades in this area. The group includes KRCD, Kings River Water Association, Tranquillity ID, Fresno Slough WD, James ID, Reclamation District 1606, San Luis & Delta-Mendota Water Authority, and the SJRECWA. Currently, no formal agreement exists among the member agencies, but there have been several meetings and discussions among members about improving the levees and reducing flood risks along this section of Fresno Slough.
3.1.12 Cities and Counties Cities primarily are responsible for NPDES permits, National Flood Insurance Program (NFIP) participation, emergency management, and O&M of flood management facilities. Cities are responsible for facilities within their jurisdictional boundaries unless the facility is maintained by another agency.
In the USJR region, the cities of Firebaugh and Merced are within the 100-year floodplain. The City of Merced has primary responsibility for flood fighting within its boundaries but does coordinate efforts with the County of Merced.
Historically, flood fighting in the city of Firebaugh has been undertaken by DWR because the City does not have adequate resources. DWR has undertaken flood fighting on the nonproject levees adjacent to the city of Firebaugh on the San Joaquin River. The State’s and the LSJLD’s responsibility for O&M in the region
3-4 Upper San Joaquin River Regional Flood Management Plan

INSTITUTIONAL AND GOVERNANCE
includes the channel bottom of the San Joaquin River adjacent to the city of Firebaugh. It does not include the nonproject levees adjacent to the city of Firebaugh on the San Joaquin River.
Counties are typically responsible for flood management of facilities or systems in unincorporated areas of the county, as well as NPDES permits, emergency management, and participation in the NFIP. In the USJR region, Madera, Merced, and Fresno counties have this responsibility; however, these efforts could be led by or coordinated with other agencies such as the LSJLD within district boundaries. In Merced County, flood fighting is led by the county with Merced ID providing resources to fight floods.
Counties also are responsible for coordinating emergency management activities. County sheriff and offices of emergency services often have the primary responsibility for responding to flood emergencies and working with other response agencies, including DWR. These officials are responsible for preparing, responding, and recovering from flood events.
3.2 Federal Agencies
3.2.1 United States Army Corps of Engineers USACE is the nation’s flood risk management agency. USACE partners with the Central Valley Flood Protection Board (CVFPB) in developing new flood management projects in the San Joaquin River watershed. USACE has been involved in the USJR region since the 1950s, working with local agencies on flood management issues, building facilities, and preparing O&M manuals. USACE also is a participating agency in the SJRRP and has participated in the following activities in the USJR region:
• Project to reduce flood risk for areas above the mouth of Merced River authorized by the Emergency Flood Control Act of 1955.
• The Buchanan Dam and Eastman Lake Project authorized by the Flood Control Act of 1962 (Public Law [PL] 87-874, 87th Congress). The dam and reservoir are not within the USJR region but do provide flood risk reduction.
• The Hidden Dam and Hensley Lake Project authorized by the Flood Control Act of 1962 (PL 87-874, 87th Congress). The dam and reservoir are not within the USJR region but do provide flood risk reduction.
• Improvement of the Merced County Streams authorized by the Flood Control Act of 1944 (PL 78-534, 78th Congress). The project includes a diversion from Black Rascal Creek to Bear Creek, a diversion between Owens Creek and Mariposa Creek, channel improvements and levees, and one retarding-type reservoir east of the city of Merced. The project reduces flood risk to agricultural areas, the city of Merced, the towns of Planada and Le Grand, and other smaller communities. Four additional reservoirs east of the City of Merced include Burns, Bear, Owens, and Mariposa, as well as Castle Reservoir to the north.
• Pine Flat Dam authorized by the Flood Control Act of 1944 (PL 78-534, 78th Congress). The dam was constructed in 1954 and has a capacity of 1,000,000 AF. Pine Flat Dam is located in Fresno County, and USACE operates it for flood management purposes.
Upper San Joaquin River Regional Flood Management Plan 3-5

INSTITUTIONAL AND GOVERNANCE
In addition, USACE provides the following assistance in support of project planning and implementation:
• Assists in statewide and regional planning efforts
• Partners with the CVFPB in project development, in addition to planning, designing, and constructing flood risk-reduction facilities
• Funds the Federal share of costs of project development (up-front funds, credits, and reimbursements)
• Permits project modifications
• Funds and manages PL 84-99 programs, including flood-fight and rehabilitation assistance
• Inspects and coordinates inspection of completed works and rehabilitation for compliance with regulations and O&M manual requirements to maintain Active status for PL 84-99
• Regulates projects with regard to Section 10 of the Rivers and Harbors Act and Section 404 of the Clean Water Act
• Reviews and, as necessary, modifies reservoir water control manuals for improved flood management, including consideration of climate change
• Maintains current O&M manuals for completed works
• Assists in interpreting Federal laws, regulations, and policies
Public Law 84-99 PL 84-99 is the discretionary authority given to USACE by Congress to act and react to emergencies caused by floods, contaminated water sources, drought, or dam failures. This authority allows USACE to repair and/or rehabilitate any qualified flood control project (levee) whether it is Federally constructed or privately owned. USACE will provide assistance in the rehabilitation of flood damage reduction projects (levees) only when the Federal or non-Federal project is in “Active” status in the USACE Rehabilitation and Inspection Program (RIP), the damage has been caused by a recent high-water event, and repairs are clearly beyond the normal, physical, and financial capabilities of the project sponsor. The urgency of the work is considered when determining local interest capability. Flood damage reduction projects must be designed and constructed to provide appreciable and dependable protection in preventing damage from irregular and unusual rises in water levels to be considered “flood damage reduction projects” (USACE, 2012). In the Central Valley, compliance with the “Active” status has been difficult due to “limited funding, increasing regulatory constraints, and changing expectations for the multiple uses of the flood management system” as stated in the CVFPP (DWR, 2012a). In addition, the CVFPP identified a number of issues with compliance with PL 84-99; specifically, the CVFPP states the following (DWR, 2012a):
Although the Public Law 84-99 Rehabilitation and Inspection Program can be helpful to nonfederal sponsors in rehabilitating damaged levees after a flood, its usefulness is limited in the Central Valley for the following reasons:
• Funding for Public Law 84-99 rehabilitation assistance is generally very limited. Public Law 84-99 rehabilitation assistance for significant damage repairs usually requires a special appropriation by Congress.
• There is no mechanism to obtain reimbursement or credit when a nonfederal sponsor performs the repairs, or pays USACE to perform the repairs.
3-6 Upper San Joaquin River Regional Flood Management Plan

INSTITUTIONAL AND GOVERNANCE
• Increasingly stringent USACE maintenance requirements, especially for encroachments and vegetation, can be difficult to meet and are unaffordable.
• Rehabilitation projects need to be economically justified with a benefit-to cost ratio of 1.0 or greater to justify federal involvement. In rural-agricultural areas of the Sacramento and San Joaquin river basins, this requirement can be difficult to achieve.
3.2.2 United States Bureau of Reclamation Reclamation has been involved in the USJR region since the 1930s, working with local agencies on water supply issues that have resulted in flood risk reduction. Friant Dam, completed in 1942, impounds Millerton Lake. Friant Dam was part of the first major Federal project that significantly affected San Joaquin River flows in the region. This project was part of the CVP, which was authorized by Congress in 1933 to satisfy increasing water demands. It is managed by Reclamation to provide flood storage in addition to water supply. In addition, Reclamation provides water supply for irrigation purposes using an extensive canal system. Reclamation is also the lead agency for implementation of the SJRRP, which is discussed in Section 3.5.
3.2.3 NOAA Fisheries NOAA Fisheries is responsible for the protection of anadromous fisheries, including salmon and steelhead. NOAA Fisheries plays an important role in the flood project planning process, providing guidance on ways to design and operate flood control works to minimize impacts and enhance fisheries habitat. USACE and other project proponents must consult with NOAA Fisheries in all phases of Federal flood management project planning, design, and construction that have the potential for impacting species of concern. In administering various Federal statutes and regulations protecting migratory species of concern, NOAA Fisheries may also impose conditions on the operation of multipurpose dams and reservoirs with Federal participation.
3.2.4 United States Fish and Wildlife Service The USFWS is the primary Federal agency responsible for conserving, protecting, and enhancing fish and wildlife and their habitats for the continuing benefit of the American people. Although the USFWS shares this responsibility with other Federal, State, Tribal, local, and private entities, USFWS has the specific responsibilities for migratory birds, T&E species, anadromous and interjurisdictional fish, and certain marine mammals. These are referred to as Federal Trust species. The USFWS also manages the Refuge System and National Fish Hatcheries, enforces Federal wildlife laws and international treaties on importing and exporting wildlife, assists State fish and wildlife programs, and helps other countries develop wildlife conservation programs (USFWS, 2009).
3.3 State Agencies
3.3.1 California Department of Water Resources DWR has the responsibility for facilities that fall under the SPFC along the San Joaquin River and its tributaries. However, O&M of these facilities is performed by LMAs. In the USJR region, LMAs include the LSJLD, Madera County FCWCA, and MSG. The SPFC consists collectively of the facilities, lands, programs, conditions, and mode of O&M for the State-Federal flood protection system in the Central Valley, as shown
Upper San Joaquin River Regional Flood Management Plan 3-7

INSTITUTIONAL AND GOVERNANCE
in Figure 3-1. DWR provides staff support and is responsible for managing a variety of programs related to flood management. The SPFC and most of the Madera County FCWCA easements/fee titles in the area are held in the name of the CVFPB.
Examples of work that DWR performs include the following:
• Development and maintenance of the California Levee Database, emergency preparedness, emergency response, and participation in post-emergency recovery
• O&M of some of the facilities
• Inspections
• Floodplain management, planning, and delineation
• Flood project funding and grant administration
Major SPFC facilities along the San Joaquin River and tributaries include the following:
• Chowchilla Canal Bypass, which begins at the San Joaquin River downstream from Gravelly Ford, diverts San Joaquin River flows, and discharges the flows into the Eastside Bypass
• Eastside Bypass, which begins at the Fresno River, collects drainage from the east, and discharges to the San Joaquin River between Fremont Ford and Bear Creek
• Mariposa Bypass, which begins at the Eastside Bypass and discharges to the San Joaquin River
• Approximately 99 miles of levees along the San Joaquin River and approximately 135 miles of levees along San Joaquin River tributaries and distributaries
• Six in-stream control structures—Chowchilla Canal Bypass Control Structure, San Joaquin River Control Structure, Mariposa Bypass Control Structure, Eastside Bypass Control Structure, Sand Slough Control Structure, and San Joaquin River Structure
3.3.2 Central Valley Flood Protection Board The CVFPB, formerly known as the Reclamation Board, was organized by the State in 1911 under the Statutes of 1911, 1st Executive Session, Chapter 25. CVFPB is the State agency responsible for the O&M of existing flood facilities and for working with USACE to develop flood damage reduction projects in the Central Valley. The mission of the CVFPB is as follows:
• To control flooding along the Sacramento and San Joaquin rivers and their tributaries
• To cooperate with local, State, and Federal agencies in establishing, planning, constructing, operating, and maintaining flood management systems
• To maintain the integrity of existing flood management systems by issuing permits for encroachments
The CVFPB works in cooperation with the USACE and LMAs to establish, plan, construct, and maintain flood control works to help prevent flooding along the Sacramento and San Joaquin rivers, their tributaries, and their distributaries. The CVFPB maintains the integrity of the existing flood control system and designated floodways through its regulatory authority by issuing encroachment permits.
3-8 Upper San Joaquin River Regional Flood Management Plan

INSTITUTIONAL AND GOVERNANCE
Figure 3-1. State Plan of Flood Control Area
Upper San Joaquin River Regional Flood Management Plan 3-9

INSTITUTIONAL AND GOVERNANCE
This page intentionally left blank.
3-10 Upper San Joaquin River Regional Flood Management Plan

INSTITUTIONAL AND GOVERNANCE
3.3.3 California Office of Emergency Services The California Office of Emergency Services (Cal OES) has overall State emergency response management authority. Among other things, that authority includes assuring that State and local agencies operate in accordance with the Standardized Emergency Management System (SEMS).
3.3.4 California Department of Fish and Wildlife The CDFW administers State laws and regulations regarding the protection of fish and wildlife resources. As such, CDFW exerts permitting authority over flood control project construction and O&M activities, and manages State wildlife areas in the region.
3.3.5 State Water Resources Control Board and Regional Water Quality Control Board
The State Water Resources Control Board (SWRCB) and the Regional Water Quality Control Board (RWQCB), administer State water rights and water quality laws and regulations. The SWRCB, given its authority over water rights, including stream diversions, can exert regulatory authority over flood control or environmental restoration projects that result in new diversions from existing channels. The RWQCB requires that construction projects, such as levee improvement projects, avoid injurious discharges from worksites to streams by preparing and adhering to Stormwater Management Plans and following Best Management Practices (BMPs) for chemicals, diesel fuel, drilling fluid, and other typical construction fluids. The RWQCB also works closely with USACE when it issues Section 404 permits, which must include a certification by the RWQCB that water quality will not be impaired (Section 40122 permit).
3.3.6 California Department of Conservation The California Department of Conservation (DOC) is responsible for administering the California Surface Mining and Reclamation Act (SMARA) of 1975. It assures that local governments, such as cities and counties, adopt and administer ordinances compliant with the law. SMARA is an important consideration for most flood control projects because it applies to any projects that disturb more than 1 acre of land or move more than 1,000 cubic yards of material. SMARA compliance involves formulating projects that do not result in injurious discharges from the disturbed area during the mining operation, followed by a reclamation plan that restores the mined land to beneficial use.
DOC also administers the Williamson Act, enacted in 1965, designed to help preserve agricultural land through property tax incentives and long-term contracts. It was enhanced in 1998 with the addition of Farmland Security Zone provisions, which offers additional incentives to extend the contract period from the normal 10-year period to 20 years.
The DOC also administers various grant programs for the acquisition of agricultural and open space preservation. Such programs could work synergistically with nonstructural flood management projects, which may improve flood system capacity, reduce long-term risks to life and property, and improve resiliency through actions such as agricultural conservation easements, open space easements, levee setbacks, and floodplain restoration, where locally supported and feasible.
Upper San Joaquin River Regional Flood Management Plan 3-11

INSTITUTIONAL AND GOVERNANCE
3.4 Regulatory and Environmental Compliance This subsection of the report focuses on legislation and regulatory requirements, as well as on environmental compliance and permitting related to flood management.
3.4.1 Legislation and Regulatory Requirements A number of legislative and regulatory requirements have been enacted to help reduce flood risk in the Central Valley. Such legislation comes about due to the State’s liability for flood management within the SPFC as a result of the precedent that was set in the Paterno vs. the State of California decision. In the Paterno decision, the State Supreme Court held the State liable for flood-related damages caused by a levee failure due to inverse condemnation (i.e., failure of a section of levee was foreseeable, and the State is liable for the damages). As a result of this decision and the focus that Hurricane Katrina and other flood disasters put on flood management, in 2007, the Legislature enacted flood risk management legislation. This legislation includes SB 5, Assembly Bill (AB) 162, AB 70, and AB 156, which were signed by then Governor Schwarzenegger, adding to and amending State flood and land use management laws. These new laws are intended to improve local land use and other planning decisions by strengthening the link between land use and flood management. The laws became effective in January 2008, containing requirements and considerations that outline a comprehensive approach to improving flood management at the State and local levels. In addition, city and county General Plans related to flood management facilities outline a number of requirements.
The requirements of the 2007 Flood Risk Management Legislation apply to three areas of California—statewide, the Sacramento-San Joaquin Valley (SSJV), and the Sacramento-San Joaquin Drainage District. One result of this legislation was the official adoption of the CVFPP in June 2012. The CVFPP, established rules and guidance for required updates to general plans within the USJR region, information on adoption of Flood Emergency Plans, assessed SPFC facilities, and zoning code amendments that are required within 3 years of the adoption of the CVFPP (in other words, before June 2015).
Senate Bill 5 The California Central Valley Flood Protection Act of 2008 (SB 5) defined objectives, codified in California Water Code Section 9616, for reducing the risk of flooding in the Central Valley. Per California Water Code Section 9616, the CVFPP is to describe both structural and nonstructural means for improving the performance and eliminating the deficiencies of levees, weirs, bypasses, and other SPFC facilities. Wherever feasible, these actions should meet multiple objectives, including:
• Reduce the risk to human life, health, and safety from flooding, including protection of public safety infrastructure.
• Expand the capacity of the flood management system in the SSJV to either reduce floodflows or convey floodwaters away from urban areas.
• Link the flood protection system with the water supply system.
• Reduce flood risks in currently non-urbanized areas.
• Increase the engagement of local agencies willing to participate in improving flood protection, ensuring a better connection between State flood protection decisions and local land use decisions.
• Improve flood protection for urban areas to the urban level of flood protection.
3-12 Upper San Joaquin River Regional Flood Management Plan

INSTITUTIONAL AND GOVERNANCE
• Promote natural dynamic hydrologic and geomorphic processes.
• Reduce damage from flooding.
• Increase and improve the quantity, diversity, and connectivity of riparian, wetland, floodplain, and shaded riverine aquatic habitats, including the agricultural and ecological values of these lands.
• Minimize flood management system O&M requirements.
• Promote the recovery and stability of native species’ populations and overall biotic community diversity.
• Identify opportunities and incentives for expanding or increasing use of floodway corridors.
• Provide a feasible, comprehensive, and long-term financing plan for implementing the CVFPP.
• Identify opportunities for reservoir reoperation in conjunction with groundwater flood storage.
SB 5 prohibits cities or counties in the Central Valley from entering into a development agreement, approving any permit, entitlement, or subdivision map unless an urban level of flood protection is provided by 2015. (“Urban level of flood protection” is defined as the level of protection necessary to withstand flooding that has a 1-in-200 chance of occurring in any given year.) SB 5 requires DWR to examine and evaluate the performance of State and Federal flood protection facilities in the Central Valley. The evaluation of current system performance is to include an estimate of the risk of levee failure, a discussion of the inspection and reviews performed, and recommendations regarding the levees and future work activities.
Urban and Non-Urban Levee Evaluation DWR undertook the urban and non-urban levee evaluation (ULE and NULE) in the Central Valley to comply with SB 5. This evaluation includes geotechnical engineering performed through the ULE and NULE projects that helps flood managers not only understand the overall flood risks in the Central Valley but also evaluate alternative changes to the flood management system that would better manage the risks. To accomplish this, DWR engaged in an effort to evaluate 470 miles of urban levees and 1,620 miles of non-urban levees for hidden defects. The ULE and NULE effort evaluated State-Federal project levees, including associated nonproject levees, to determine whether they met defined geotechnical criteria and, where needed, identified remedial measures, including cost estimates, to meet those desired geotechnical criteria.
The ULE/NULE database was evaluated to categorize the reported levee performance events related to seepage, stability, erosion, overtopping, and levee breach. Based on the review of these data, geotechnical analyses, and literature, the primary factors that influence levee performance consist of levee foundation characteristics, levee material, levee geometry, and hydraulic head. Additional external factors that influence levee performance consist of animal burrows and utility penetrations. In this RFMP, the ULE/NULE information was used to identify levee issues in Sections 4.0 and 5.0.
Assembly Bill 70 AB 70 provides that a city or county might be responsible for its reasonable share of property damage caused by a flood if the State liability for property damage has increased due to approval of new development after January 1, 2008.
Upper San Joaquin River Regional Flood Management Plan 3-13

INSTITUTIONAL AND GOVERNANCE
Assembly Bill 156 AB 156 directs DWR to map areas in the Central Valley that are at risk of flooding, identify system deficiencies, identify flood zones protected by levees, and supply notification about flood risk and flood insurance to property owners in those levee-protected flood zones.
Assembly Bill 162 AB 162 requires review of General Plans for areas subject to flooding and review of information on flood hazards.
Senate Bill 1278 SB 1278 requires DWR to release maps indicating areas protected by the SPFC; offer financial assistance, to the extent funds are available, to assist local governments in updating their General Plans to reflect the CVFPP; and extends existing deadlines for the General Plan updates.
City and County General Plans Cities and Counties are responsible for adopting and updating General Plans that specify appropriate land use to meet public goals and administration policies. California law mandates that development be consistent with such General Plans. General Plans further specify allowable land uses, given existing zoning structure, and provide guidelines to influence the types of development or actions that could be taken in any given area. Due to the rural agricultural nature of the USJR region, this discussion focuses on specific elements, including agricultural and wetland protection, along with natural resource and flood management elements.
Agriculture The State of California has implemented legislation to protect farmlands. The Williamson Act, also known as the California Land Conservation Act, was passed into law in 1965. This legislation limits the conversion of agricultural lands, recognizing that agricultural lands provide not only food but also a number of values to society and California. The act further provides that any City or County with a General Plan be allowed to establish agricultural preserves to solidify this protection of agricultural land.
All three counties have an agricultural element that is focused on protecting against urban development of agricultural land. As noted in Section 2.3 (Demographics), the USJR region has significant farmland that is designated as Unique, Historic, or of Statewide Significance. Madera County (Madera County, 1995), Merced County (Merced County, 2011b), and Fresno County (Fresno County, 2013) each have policies that provide for the maintenance of currently designated agricultural areas. Such maintenance is implemented by requiring buffers between agricultural and nonagricultural uses and by encouraging agricultural preservation programs, such as land trusts, conservation easements, and other tax incentive-type programs.
All three counties have policies that allow limited development in, and conversion of, agricultural areas. In addition, Merced County specifically limits land uses within agricultural areas and pasturelands to agriculturally related activities and uses. The Merced County General Plan promotes land acquisition for conservation easements, agricultural reserves, and the creation of agricultural buffers (Merced County, 2011b). The Fresno County General Plan has elements that enhance and protect surface water and groundwater deemed critical to agriculture, and allows aggregate mining and recreation in association with agriculture land use practices (Fresno County, 2013).
3-14 Upper San Joaquin River Regional Flood Management Plan
INSTITUTIONAL AND GOVERNANCE
Wetland Resources All three counties support the Federal policy of “no net loss” of wetland habitat and promote acquisition of wetlands and riparian habitats for flood management, public access, and wildlife habitat. In addition, the three counties require protective buffers, and vegetated areas are restricted from development around wetland resources (e.g., development is restricted within 100 feet from the top of bank of unvegetated channels in Madera County to help reduce potential impacts to riparian areas). In Merced County, the General Plan recognizes that Merced County is “home to Merced Grasslands, one of the largest and most intact grassland wetland habitat in the world” (Merced County, 2011b). The Merced County General Plan has a number of elements to protect wetland habitats through establishment of buffer zones, setbacks, and conservation easements.
Natural Resources and Flood Management Open space, including water, mineral, wetland, and riparian resources, fish and wildlife habitat, and parks and recreation, are protected by county general plans. Fresno County explicitly promotes County acquisition of floodplain lands for the purposes of flood protection, public safety and access, groundwater exchange, and wildlife preservation. The Madera County General Plan includes elements of the San Joaquin River Parkway Master Plan (Parkway Plan), a conceptual long-term plan prepared by the SJRC to preserve and enhance the San Joaquin River corridor (Madera County, 1995). The General Plan also stipulates that development in and near the San Joaquin River corridor and/or its mapped floodplains (e.g., 100-year, 250-year) is governed through policies that require consistency with other plans (e.g., the Parkway Plan) or consultation with specific entities such as the SJRC. The City of Firebaugh has recommendations in its General Plan that encourage lands adjacent to the river to be maintained as open space and recreational areas, serving the dual purpose of providing a barrier against flood events and providing recreational areas (City of Firebaugh, 2009). The City of Los Banos requires all new development to prepare hydrologic studies and take appropriate mitigation measures to address flooding and surface water flows (City of Los Banos, 2009).
Open Space “Open space” is defined by the Governor’s Office of Planning and Research (OPR) as “any parcel or area of land or water that is essentially unimproved and devoted to open-space use.” General Plans are required to have open space elements for guiding “the comprehensive and long-range preservation and conservation of “open space land” (OPR, 2003).
In the Fresno County General Plan, open space is defined as “any parcel or area of land or water that is essentially unimproved and devoted to an open-space use for the purposes of: 1) the preservation of natural resources; 2) the managed production of resources; 3) outdoor recreation; or 4) public health and safety” (Fresno County, 2013). Within the General Plan, Part 2, the Open Space and Conservation Element is focused on preserving open space in the county through development requirements, easements, buffers, and purchasing of lands.
Open space is defined in the Madera County General plan as (Madera County, 1995):
. . . low-intensity agricultural uses, grazing, forestry, golf courses, recreational, equestrian uses, major electrical or trunk communication transmission lines, habitat protection, irrigation canals, reservoirs, refuse disposal sites, airports and airstrips, watershed management, public and quasi-public uses, mining, and areas typically unsuitable to human occupation due to public health and safety hazards such as earthquake faults, floodways, unstable soils, or areas containing wildlife habitat or other environmentally sensitive features.
Upper San Joaquin River Regional Flood Management Plan 3-15

INSTITUTIONAL AND GOVERNANCE
The Madera General Plan has elements that encourage protection of open spaces in development proposals and zoning ordinances in the Land Use, Agricultural, and Natural Resource elements.
In the Merced General plan, open space is addressed in four elements—Water, Health and Safety, Agricultural, and Land Use. The Merced County General Plan has an open space requirement that “encourages open space use in flood hazard areas.” Open space use also is encouraged by limiting land uses on agricultural lands and by designating foothill areas on the eastern and western edges of Merced County as pastureland.
3.4.2 Environmental Compliance and Permitting This subsection reviews major permitting or environmental compliance required for flood projects as well as ongoing efforts to develop regional strategies for permitting. In addition, it provides preliminary information on the major requirements for flood management permitting, along with environmental review and compliance. It provides information on current progress toward development of a regional permitting process for implementation of possible flood management actions. Certain State and Federal regulations require issuance of permits prior to project implementation. Other regulations require agency consultation but might not require issuance of any entitlements prior to project implementation. Appendix C, Table C-1 provides a preliminary list of Federal, State, and local permits and approvals that could be required. Table C-2 describes the major State and Federal laws that specify permitting and environmental review and consultation requirements.
Permitting is important because it is a complex and time-intensive issue for many local agencies statewide, not only in the USJR region. For example, onerous permit requirements have resulted in reduced maintenance of flood management facilities. In addition, even during emergencies after flood events, the time for repair and maintenance of facilities is limited because the Federal Emergency Management Agency (FEMA) allows only a short period for emergency repairs, and completing all repairs within this period of time can be challenging. Repairs after the prescribed timeframe require separate permits, which are costly and cumbersome.
Clean Water Act Under Section 404 of the Clean Water Act, a USACE permit must be obtained for the discharge of dredged or fill material into waters of the United States, including wetlands. Wetlands are defined under Section 404 as (Code of Federal Regulations [CFR] § 122.2):
… those areas that are inundated or saturated by surface water or groundwater at a frequency and duration sufficient to support, and that under normal circumstances do support, a prevalence of vegetation typically adapted for life in saturated soil conditions.
The USACE reviews applications for permits in accordance with Section 404 guidelines that have been established by USACE and USEPA.
To issue a permit under Section 404, the USACE must ensure that the discharge will not violate the State’s water quality standards. Therefore, in California, the proponent of any activity that might result in a discharge to a surface water of the United States requires water quality certification or a waiver of certification from the SWRCB pursuant to Section 401 of the Clean Water Act.
Section 402 of the Clean Water Act established the NPDES permit program to regulate point source discharges of pollutants into waters of the United States. An NPDES permit sets specific discharge limits for point sources that discharge pollutants into waters of the United States, and it establishes monitoring and
3-16 Upper San Joaquin River Regional Flood Management Plan

INSTITUTIONAL AND GOVERNANCE
reporting requirements, as well as special conditions. In California, NPDES permits, which are valid for 5 years, typically are issued by one of the RWQCBs.
Rivers and Harbors Act of 1899, Section 10 Section 10 of the Rivers and Harbors Act prohibits work affecting the course, location, conditions, or capacity of navigable waters of the United States without a permit from the USACE. “Navigable waters of the United States” is defined as "those waters subject to the ebb and flow of the tide shoreward to the mean high-water mark, or as those waters that are used, have been used in the past, or may be susceptible to use in interstate or foreign commerce” (CFR Section 329.4). Activities requiring a permit from the USACE include actions such as the construction of any structure in or over any navigable water; excavation or deposition of materials in such waters; and various types of work performed in such waters, including placement of fill and stream channelization. USACE compliance with Section 404 of the Clean Water Act and the National Environmental Policy Act will satisfy requirements under Section 10 of the Rivers and Harbors Act.
CVFPB Encroachment Permit The CVFPB issues encroachment permits to maintain the integrity of the existing flood control system and designated floodways. An encroachment permit is required for every proposal or plan of work that satisfies one or more of the following criteria:
• Is located between or in the vicinity of any SPFC facility • Is located within a CVFPB easement • Is located within a Designated Floodway that has been adopted by CVFPB • Is located near a regulated stream, including the San Joaquin River • May have a negative effect on the Adopted Plan of Flood Control
An encroachment permit is necessary for any project that requires any work to be done in a regulated stream, designated floodway, or on any levee slopes for a Federal flood control project, including the area 10 feet landward of the land-side levee toe. Such activities might include the placement, construction, reconstruction, removal, or abandonment of any landscaping, culvert, bridge, conduit, fence, projection, fill, embankment, building, structure, obstruction, encroachment, or works of any kind. Additional activities might include the planting, excavation, or removal of vegetation, and any repair or maintenance that involves cutting into the levee, wholly or in part, in an area for which there is an adopted plan of flood control.
Federal Endangered Species Act The Federal Endangered Species Act (ESA) applies to proposed Federal, State, local, or individual projects that might affect fish, wildlife, or plant species that are Federally listed as threatened or endangered. Section 7 of the Federal ESA requires Federal agencies, in consultation with the USFWS and National Marine Fisheries Service (NMFS), to ensure that any action they authorize, fund, or carry out is not likely to jeopardize the continued existence of a listed species or to result in the destruction or adverse modification of designated critical habitat. In fulfilling these requirements, each agency must use the best scientific and commercial data available. Formal consultation becomes necessary when the action agency requests consultation after determining the proposed action might affect listed species or critical habitat, or if the USFWS or NMFS, through informal consultation, does not concur with the action agency’s finding that the proposed action is not likely to adversely affect the listed species or critical habitat.
Upper San Joaquin River Regional Flood Management Plan 3-17

INSTITUTIONAL AND GOVERNANCE
Take is defined under the Federal ESA as actions to “harass, harm pursue, hunt, shoot, wound, kill, trap, capture, or collect or attempt to engage in such conduct.” USFWS further defines harm to include “significant habitat modification or degradation that results in death or injury to listed species by significantly impairing behavioral patterns such as breeding, feeding, or sheltering.” USFWS defines harass as “actions that create likelihood of injury to listed species to such an extent as to significantly disrupt normal behavior patterns which include, but are not limited to, breeding, feeding, or sheltering.” Under the Federal ESA, the USFWS has jurisdiction over terrestrial wildlife, nonanadromous fish species, plants, and a few marine mammal species (such as the California sea otter), and the NMFS has jurisdiction over anadromous fish species, marine fish, and most marine mammals.
When no Federal nexus exists, Section 10 of the Federal ESA applies. The purpose of Section 10 is to conserve endangered and threatened species, and the ecosystems upon which they depend. This is typically accomplished through development of a conservation plan that describes the anticipated effects of the proposed taking and how those impacts will be minimized, mitigated, and funded. Once approved by the USFWS or NMFS, a permit is issued.
California Endangered Species Act California Fish and Game Code Sections 2050–2115.5, otherwise known as the California Endangered Species Act (CESA), protects the following (California Fish and Game Code Section 2051):
. . . all native species of fish, wildlife, and plants that are in danger of or threatened with extinction because their habitats are threatened with destruction, adverse modification, or severe curtailment, or because of overexploitation, disease, predation, or other factors are of ecological, educational, historical, recreational, esthetic, economic, and scientific value to the people of the State. The conservation, protection, and enhancement of these species and their habitat are of statewide concern.
Similar to the Federal ESA, CESA strictly prohibits the “take” of any threatened or endangered fish, wildlife, or plant species, or species that is a candidate for listing as threatened or endangered under CESA. Under Section 2081 of the California Fish and Game Code, an Incidental Take Permit from CDFW is required for projects that could result in the “take” of a species that is State listed as threatened or endangered, or that is a candidate for listing. Under CESA, take is defined as an activity that would directly or indirectly kill an individual of a species, but the definition does not include harm or harass, which the definition of take under the Federal ESA includes. As a result, the threshold for take under CESA may be more stringent than that under the Federal ESA.
Fish and Wildlife Coordination Act The Fish and Wildlife Coordination Act, as amended in 1964, was enacted to protect fish and wildlife when Federal actions result in the control or modification of a natural stream or body of water. The statute requires Federal agencies to consult with USFWS and State fish and game agencies before undertaking or approving projects that control or modify surface water (water projects). Consultation and coordination with USFWS and State fish and game agencies are required to address ways to prevent loss of and damage to fish and wildlife resources and to further develop and improve these resources.
Magnuson-Stevens Fishery Conservation and Management Act The Magnuson-Stevens Fishery Conservation and Management Act, as amended by the Sustainable Fisheries Act (PL 104–297), requires that all Federal agencies consult with NMFS on activities or proposed activities authorized, funded, or undertaken by that agency that may adversely affect essential fish habitat (EFH) for commercially managed marine and anadromous fish species. EFH includes specifically identified
3-18 Upper San Joaquin River Regional Flood Management Plan

INSTITUTIONAL AND GOVERNANCE
waters and substrate necessary for fish spawning, breeding, feeding, or growing to maturity. EFH also includes all habitats necessary to allow the production of commercially valuable aquatic species, support a long-term sustainable fishery, and contribute to a healthy ecosystem (16 United States Code [U.S.C.] § 1802(10)).
National Historic Preservation Act Section 106 of the National Historic Preservation Act requires Federal agencies to evaluate the effects of Federal undertakings on historical, archeological, and cultural resources that are or that may be eligible for listing in the National Register of Historic Places (NRHP). To be eligible for NRHP listing, cultural resources must retain integrity and must exhibit an association with broad patterns of our history, be associated with an important person, embody a distinctive characteristic, or yield information important to prehistory or history. If a project is determined to have an adverse effect on NRHP-listed properties or those eligible for listing in the NRHP, the agencies are required to consult with the State Historic Preservation Office (SHPO) and the Advisory Council on Historic Preservation (ACHP) to develop alternatives or mitigation measures to allow the project to proceed.
California Fish and Game Code Section 1600 Sections 1600–1616 of the California Fish and Game Code state that it is unlawful for any person or agency to do any of the following actions without first notifying CDFW:
• Substantially divert or obstruct the natural flow of the bed, channel, or bank of any river, stream, or lake
• Substantially change the bed, channel, or bank of any river, stream, or lake
• Use any material from the bed, channel, or bank of any river, stream, or lake
• Deposit or dispose of debris, waste, or other material containing crumbled, flaked, or ground pavement where it may pass into any river, stream, or lake in California
With certain exceptions, a Streambed Alteration Agreement must be obtained if CDFW determines that substantial adverse effects on existing fish and wildlife resources are expected to occur. The Streambed Alteration Agreement must include measures designed to protect the affected fish and wildlife and associated riparian resources.
State Lands Commission The California State Lands Commission (SLC) was established in 1938 to provide stewardship of the lands and waterways of California. The State owns nearly 4 million acres of Sovereign Lands, including the beds of navigable rivers, lakes, and streams, tidal waterways, tidelands up to the ordinary high-water mark, and submerged lands along the coastline extending from the shoreline to 3 miles offshore. The SLC can lease Sovereign Lands for any public trust purpose, including recreation, navigation, fisheries, commerce, and open space. For instance, a public or private entity must lease sites for marinas and recreational piers that fall within Sovereign Lands. In addition, SLC issues permits for dredging lands that fall under its jurisdiction.
Native American Heritage Commission The Native American Heritage Commission (NAHC) identifies and manages a catalog of places of special religious or social significance to Native Americans. This database, known as the “Sacred Lands File,” is a compilation of information on known graves and cemeteries of Native Americans on private lands and
Upper San Joaquin River Regional Flood Management Plan 3-19

INSTITUTIONAL AND GOVERNANCE
other places of cultural or religious significance to the Native American community. The NAHC also performs other duties regarding the preservation and accessibility of sacred sites and burials, and the disposition of Native American human remains.
Migratory Bird Treaty Act The Migratory Bird Treaty Act (MBTA) prohibits taking of any native birds. Taking is defined as killing or possessing parts, including feathers and eggs. MBTA specifies exceptions for research and permitted hunting activities. MBTA establishes a Federal prohibition, unless permitted by regulations, of any of the following actions (16 U.S.C. 703):
. . . pursue, hunt, take, capture, kill, attempt to take, capture or kill, possess, offer for sale, sell, offer to purchase, purchase, deliver for shipment, ship, cause to be shipped, deliver for transportation, transport, cause to be transported, carry, or cause to be carried by any means whatever, receive for shipment, transportation or carriage, or export, at any time, or in any manner, any migratory bird, included in the terms of this Convention . . . for the protection of migratory birds … or any part, nest, or egg of any such bird.
3.5 Planning, Restoration, and Conservation Programs Several concurrent planning efforts along the San Joaquin River could influence the development of multibenefit actions and priorities for improvement of flood management systems in the USJR region. These efforts include ecosystem conservation and restoration, as well as recreation elements, including the CVFPP Conservation Framework (and recently released Draft Conservation Strategy), IRWM Plans, the SJRRP, the Parkway Plan, the San Joaquin River Blueway Vision, and other plans. Table 3-1 identifies the implementing agency and provides a brief summary of the key elements of each of these plans.
Table 3-1. Concurrent Planning Efforts in the USJR Region
Plan Name Lead Agency Summary/Key Elements
IRWM Plans • Upper Kings Basin Water
Forum IRWM • Westside San Joaquin
IRWM • Madera IRWM • Merced IRWM
There are four IRWM plans that cover a portion of the USJR region. The purpose of these plans is to identify water management issues, needs, objectives, actions, and priorities to meet the long-term water needs in the region through a collaborative effort.
CVFPP Conservation Framework and Draft Conservation Strategy
California DWR The CVFPP Conservation Framework (and recently release Draft Conservation Strategy) provides guidance for conservation planning in the context of flood management along the Sacramento River and San Joaquin River systems. These documents inform the development of multibenefit projects in the USJR region, including: • Ecological goals, objectives, and metrics • Relative targets for conservation based on project type and definition • Specific opportunities for conservation/restoration in the USJR RFMP region • Opportunities for ecological restoration of floodplain areas using Floodplain
Restoration Opportunity Analysis • Regional permitting, and other implementation strategies
San Joaquin River Restoration Program
Reclamation Multiagency program, including State and Federal implementing agencies, to restore and maintain fish populations in the San Joaquin River below Friant Dam to the confluence of the Merced River; including interim and restoration flows, and specific restoration and conservation actions that are currently being planned and implemented along the river corridor in the USJR region.
3-20 Upper San Joaquin River Regional Flood Management Plan

INSTITUTIONAL AND GOVERNANCE
Table 3-1. Concurrent Planning Efforts in the USJR Region
Plan Name Lead Agency Summary/Key Elements
San Joaquin River Parkway Master Plan (located upstream of regional planning area)
San Joaquin River Conservancy
A plan that includes a 22-mile regional green space and wildlife corridor along both sides of the San Joaquin River, extending from Friant Dam to Highway 99, with an interconnected trail system and recreational and educational features; includes acquisition of 5,900 acres of public conservation lands, restoration, and development of educational and recreational amenities.
San Joaquin River Blueway Vision
San Joaquin River Partnership
Provides a regional vision that promotes recreational, educational, economic, environmental, public health, and aesthetic benefits along the entire San Joaquin River corridor.
CVFPP Conservation Framework and Draft Conservation Strategy The CVFPP Conservation Framework was developed as an integral part of the 2012 CVFPP. It provides guidance for conservation planning in the context of flood management within the USJR region, and supports the development and prioritization of relevant environmental policies and conservation elements in the regional flood management plans. The CVFPP is required to be updated every 5 years with the next update due in 2017. As part of the 2017 CVFPP update, the Conservation Framework is being updated and revised into a Conservation Strategy that includes input from representatives of State and Federal resource agencies, agricultural, rural, and conservation groups, and from local governments. In July of 2014, the Draft Conservation Strategy was released for review by the RFMPs. The Conservation Framework was used as the foundation for developing ecological opportunities associated with flood SIs in the USJR region and is referenced in this RFMP. Where appropriate, updates from the July 2014 Draft Conservation Strategy also have been included.
The Conservation Framework is an integral part of the CVFPP in support of the primary goal of improving flood risk management and the supporting goals of improving O&M, promoting ecosystem functions, improving institutional support, and promoting multibenefit projects. As noted in the CVFPP Conservation Framework, “In particular, the Conservation Framework focuses on promoting ecosystem functions and multibenefit projects” (DWR, 2012b).
The Conservation Framework provides a broad vision that includes the following specific objectives, which are based on environmental objectives in the Central Valley Flood Protection Act of 2008:
• Promote natural dynamic hydrologic and geomorphic processes.
• Increase and improve the quantity, diversity, and connectivity of riparian, wetland, floodplain, and shaded riverine aquatic habitats, including the agricultural and ecological values of these lands.
• Promote the recovery and stability of populations of native species and overall biotic community diversity.
The Conservation Framework has three additional conservation goals that contribute to conservation success:
• Reduce stressors related to the development and operation of the flood management system that negatively affect important species (e.g., loss and degradation of ecosystem functions and habitat, invasive species, impairments to in-stream water quality and flows, fish passage barriers).
• Increase support and collaboration among flood managers, regulatory agencies, local Natural Community Conservation Planning and Habitat Conservation Plan (HCP) planning staff,
Upper San Joaquin River Regional Flood Management Plan 3-21

INSTITUTIONAL AND GOVERNANCE
environmental NGOs, and agricultural interests for multibenefit flood projects by achieving the following:
− Increasing the use of collaborative regional planning and sustainable long-term approaches that provide multiple benefits (flood risk reduction, water supply, habitat, agricultural stewardship, recreational opportunities, and others)
− Improving environmental benefits from all flood projects − Reducing long-term costs for O&M and repair in flood-prone areas − Improving efficiency and effectiveness of flood project environmental approval
• Increase the quality of environmental information and tools for informing flood management and conservation activities.
The 2017 CVFPP Conservation Strategy provides a more-refined long-term vision and Conservation Framework goals, contains more information about key factors that influence achievement of those goals, describes how applying specific management actions can work effectively at achieving those goals, and sets conservation priorities among management actions and regions. The Conservation Strategy expands upon and replaces the existing Conservation Framework, and it will be updated along with the CVFPP every 5 years.
The existing Conservation Framework identifies a broad range of improvements that should be considered throughout the SPFC region. These improvements include ecological restoration, setback levees, fish passage, corridor management planning, easements, and landowner incentive programs. In addition,
improvements are included for levee maintenance and repair; floodway management; construction, reconstruction, and improvement of levees; removal of SPFC facilities; flood control structures; floodwater storage and reservoir forecasting, operations, and coordination; land-use coordination to reduce peak runoff; regional environmental permitting; bypass expansion and construction; and recreational opportunities. The Conservation Framework outlines a general approach for measuring the performance of ecological and planning objectives, including potential indicators.
The Conservation Framework provides guidance on several key issues related to the implementation of flood management projects in the context of promoting ecosystem functions and multibenefit projects, including the State strategy for levee vegetation management, environmentally related funding issues for flood SIs, permitting, mitigation planning, and adaptive management. For more information, see Chapter 5 of the 2012 Public Draft Conservation Framework document (DWR, 2012b).
Conservation Framework Guidance Specific to the USJR Region The Conservation Framework identifies several specific opportunities in the USJR region. These include:
• Collaborate with the SJRRP to improve fish passage at the Sand Slough Control Structure, Stevenson Weir, Helm Canal, Sack Dam, and the Chowchilla Bifurcation Structure.
CVFPP Conservation Framework Relevance to
the USJR RFMP: Provides general objectives
and guidance for CVFPP conservation and restoration
Identifies specific conservation opportunities in the USJR region
Identifies preliminary implementation strategies relevant to the USJR region
Evaluates floodplain restoration opportunities and constraints in the USJR region at a planning level
3-22 Upper San Joaquin River Regional Flood Management Plan
INSTITUTIONAL AND GOVERNANCE
• Improve flood protection for small communities by reconstructing and improving existing levees or, potentially, by constructing setback levees with habitat enhancement and restoration measures incorporated, wherever possible.
• Collaborate with the SJRRP to modify levees and floodways to convey mandated flows and provide floodplain habitat, including constructing setback levees, between the Bifurcation Structure at the Chowchilla Bypass and Mendota Pool, and in the Mendota Pool Bypass, and modifying the San Joaquin River Headgate Structure.
• Collaborate with the SJRP to integrate recreational facilities along the San Joaquin River in accordance with the San Joaquin River Blueway Vision (SJRP, 2011).
Regional Permitting for Flood Management Projects The traditional approach toward implementing flood management actions typically involves project-by-project permitting, which can be expensive, time consuming, and problematic in terms of performing the rigor necessary to secure permits by identifying and developing mitigation for impacts. Especially in the USJR region, flood management actions, including routine O&M, are often prevented or delayed due to the expense, time, and hardship involved in environmental compliance and permitting.
The Public Draft 2012 Central Valley Flood Protection Plan Attachment 9G: Regional Permitting Options lays out a programmatic approach toward permitting flood projects. The process aims to circumvent the project-by-project approach by satisfying “the collective permitting needs for multiple projects on a regional scale and for longer time periods while also consolidating mitigation efforts into larger, more viable conservation areas that can be more effectively managed long term” (DWR, 2012c):
An Interagency Advisory Committee and a Regional Permitting Subcommittee are actively working through the approach toward regional permitting for CVFPP projects. CVFPP Attachment 9G identifies initial programmatic permitting mechanisms such as programmatic Section 7 consultations, regional HCPs, and Natural Community Conservation Plans, as well as additional approaches that are under development, including Regional Advance Mitigation Planning and Corridor Management Plans (DWR, 2012c).
A pilot regional permitting approach is being tested in the Feather River Conservation Planning Area. Federal ESA compliance could be achieved through development of an HCP, which would be inclusive of the major regulatory compliance laws, incorporate the major flood management compliance needs for DWR and LMAs, provide support for overlapping DWR programs, and be responsive to input from local stakeholders. CESA compliance issues are still being negotiated. The Feather River Regional Permitting Program would include 12 maintaining agencies (DWR and LMAs) and more than 300 miles of SPFC facilities in the Feather River, its tributaries, and Sutter and Tisdale Bypasses, as well as a 1-mile buffer from the centerline of the waterway. The Feather River Regional Permitting Program will require:
• Locally led, sufficiently defined prioritized projects that are currently being developed in the Feather River RFMP
• A list of covered activities that would include O&M, structural repairs, reconstruction, improvements to or new levee construction, multibeneficial conservation actions
• Impacts analyses, mitigation strategies, and funding strategies
There is a potential shortcoming to the programmatic permitting approach. The length of time, cost, and complexity that are required to perform the necessary studies and adhere to the public and agency review process is such that local implementing agencies are not likely able to accomplish flood management
Upper San Joaquin River Regional Flood Management Plan 3-23

INSTITUTIONAL AND GOVERNANCE
actions necessary to achieve short-term objectives, such as routine O&M or emergency repairs. Although the State and local entities continue to chart a path toward a programmatic, regional permitting approach, a recognized need exists for a short-term, interim permitting approach that has not yet been defined or developed.
Conservation Strategy Ecological Goals and Objectives The July 2014 Draft Conservation Strategy provides specific ecological goals and objectives (targeted ecosystem processes, habitats, species, and stressors) that guide the development of multibenefit projects in the USJR region, as shown in Table 3-2 (DWR, 2014). These targeted ecosystem processes, habitats, species, and stressors were used to guide development of specific ecosystem conservation and restoration opportunities associated with USJR RFMP projects, as well as the evaluation criteria described in Section 6.0.
Table 3-2. Ecological Goals, Objectives, and Metrics
Goal
Objectives (Targeted Ecosystem
Process, Habitat, Species, or Stressor)
Metric
Ecosystem Processes. Improve dynamic hydrologic and geomorphic processes.
Inundated Floodplain Inundated floodplain―Inundated floodplain is the total amount (acres) of EAH (units) with sustained spring and 50% FIP, and total amount of expected annual inundated floodplain habitat: FIP is the potential to be inundated by a particular flow (e.g., a 50% chance event). EAH units represent the annual average of the area expected to be inundated in general, or inundated by flows meeting defined criteria for timing and duration (e.g., sustained spring flows). These are metrics of the amount of inundated floodplain and of the proportion of ecological benefits that a floodplain provides. DWR has already mapped FIP for several ecologically distinct flows and calculated EAH units for rearing of chinook salmon, and can do the same for green sturgeon and other native fish.
Riverine Geomorphic Processes
Natural bank―total length (miles): Natural bank is a component of shaded riverine aquatic cover and bank habitat, and is necessary for migration of the river channel. Its length is related to the area of floodplain potentially reworked by channel migration (river meander). The length of natural bank can be readily measured from imagery, topographic data, and DWR-maintained inventories of revetment. River Meander Potential―total amount (acres): Movement of a river channel across its floodplain is an important riverine geomorphic process that regenerates channel and floodplain habitats. River meander potential is the area of floodplain that has the potential to be reworked by the meandering channel because it is within the river’s natural meander zone, not underlain by substrates resistant to erosion, and not isolated by revetment or levees. Areas with river meander potential can be cost-effectively mapped using aerial photography, inventories of revetment and levees, and existing geologic/soils data.
Habitats. Increase and improve quantity, diversity, quality, and connectivity of riverine aquatic and floodplain habitats.
Shaded Riverine Aquatic Cover
Shaded riverine aquatic cover; bank and vegetation attributes of shaded riverine aquatic cover―total length (miles): Because shaded riverine aquatic cover exists only along channel margins, length is a direct measure of its quantity. Mapping shaded riverine aquatic cover (and its natural bank and vegetation components) is related to the mapping of riparian vegetation, natural bank, and revetment, all of which DWR already inventories for multiple purposes.
Riparian Habitat amount―total amount (acres) in floodways: The area of riparian vegetation (i.e., riparian forests, woodlands, and scrub) is a direct measure of its quantity. DWR has already mapped this vegetation in the SSJV.
Habitat connectivity―median patch size (acres): Median patch size increases as corridors of riparian habitat become more continuous and wider, which also corresponds to greater habitat quality and diversity. These metrics can be readily derived from a vegetation map.
3-24 Upper San Joaquin River Regional Flood Management Plan

INSTITUTIONAL AND GOVERNANCE
Table 3-2. Ecological Goals, Objectives, and Metrics
Goal
Objectives (Targeted Ecosystem
Process, Habitat, Species, or Stressor)
Metric
Marsh (and Other Wetlands)
Habitat amount―total area (acres) in floodways: The area of marsh and other wetlands is a direct measure of their quantity. DWR has already mapped this vegetation in the SSJV.
Floodplain Agriculture Habitat amount―total amount (acres) of wildlife-friendly agriculture in floodways: The area of floodplain agricultural land is a direct measure of its quantity. DWR has mapped vegetation in the SSJV, but wildlife-friendly attributes have not yet been mapped.
Species. Contribute to the recovery and stability of native species populations and overall biotic community diversity.
Targeted Species Inclusion in restoration action of features designed to increase benefits to targeted species―total amount (acres or length): To increase the benefits provided to targeted species, design criteria for restoration actions have been identified as additional specificity for ecological process, habitat, and stressor objectives. Implemented project plans and designs will document the amount of restoration that included these design features. Species relevant to the USJR Conservation Planning Area include: • Delta button celery (Eryngium racemosum) • Slough thistle (Cirsium crassicaule) • Valley elderberry longhorn beetle (Desmocerus californicus dimorphus) • California Central Valley steelhead DPS (Oncorhynchus mykiss) • Chinook salmon—Central Valley fall/late fall–run ESU (Oncorhynchus tshawytscha) • Chinook salmon—Central Valley spring-run ESU (Oncorhynchus tshawytscha) • Giant garter snake (Thamnophis gigas) • Greater sandhill crane (Grus canadensis tabida) • Least Bell's vireo (Vireo bellii pusillus) • Swainson’s hawk (Buteo swainsoni) • Western yellow-billed cuckoo (Coccyzus americanus occidentalis)
Stressors. Reduce stressors related to the development and operation of the flood risk management system that negatively affect at-risk species.
Revetment Revetment removed to increase meander potential and/or natural bank―total length (miles): This metric documents the extent of actions that remove unnecessary revetment. DWR maintains revetment inventories and will archive records for implemented projects.
Levees Levees relocated to reconnect floodplain or improved to eliminate hydraulic constraints on restoration―total length (miles): This metric documents the extent of actions that relocate narrowly confining levees, or improve levees to allow for restoration of ecosystem processes and habitats. DWR maintains inventories of these facilities and will archive records for implemented projects.
Fish Passage Barriers Fish passage barriers―modified or removed: This metric documents the number of barriers eliminated or modified to improve passage. DWR has inventoried barriers in the SSJV, and this inventory will be updated to support multiple programs.
Invasive Plants Invasive plant–dominated vegetation―total area reduced (acres): Land identified as channel maintenance areas in the CVFPP SPFC Descriptive Document (DWR, 2010) includes areas dominated by invasive plants. For species prioritized for treatment, this metric measures reduction in the extent of infested areas that impact both ecosystem targets and O&M of the SPFC.
Source: DWR, 2014. Data compiled in 2012. Notes: DPS = distinct population segment EAH = expected annual habitat ESU = evolutionary significant unit FIP = floodplain inundation potential
Upper San Joaquin River Regional Flood Management Plan 3-25

INSTITUTIONAL AND GOVERNANCE
Integrated Regional Water Management Integrated Regional Water Management (IRWM) is the regional application of IWM in California. IRWM incorporates the physical, environmental, societal, economic, legal, and jurisdictional aspects of water management into regional solutions through open and collaborative stakeholder processes to promote sustainable water use. IRWM crosses jurisdictional, watershed, and political boundaries. It involves multiple agencies, stakeholders, individuals, and groups, and it attempts to address the issues and differing perspectives of all the entities involved through mutually beneficial solutions. The methods used in the IRWM include a range of water management strategies. DWR defines water management to include the efforts required to produce desired outcomes related to all aspects of water supply, including groundwater management, treatment of water and wastewater, recycled water, flood management, stormwater management, ecosystem management, and other associated resources. Figure 3-2 shows the four IRWM regions that are within the USJR region.
San Joaquin River Restoration Program The SJRRP is a direct result of a Settlement reached in September 2006 on an 18-year lawsuit to provide sufficient fish habitat in the San Joaquin River below Friant Dam near Fresno, California, by the United States Departments of the Interior and Commerce, the Natural Resources Defense Council (NRDC), and the Friant Water Users Authority. The Settlement received Federal court approval in October 2006. Federal legislation was passed in March 2009 authorizing Federal agencies to implement the Settlement.
The Settlement is based on two goals:
• Restoration: To restore and maintain fish populations in "good condition" in the main stem of the San Joaquin River below Friant Dam to the confluence of the Merced River, including naturally reproducing and self-sustaining populations of salmon and other fish.
• Water Management: To reduce or avoid adverse water supply impacts to all of the Friant Division long-term contractors, which might result from the interim flows and restoration flows provided for in the Settlement.
The SJRRP Restoration Area is defined as the San Joaquin River from Friant Dam to the Merced River confluence. This river corridor has been segmented into distinct reaches based on geomorphic characteristics, hydrology, and infrastructure. These reaches are described in Table 2-1 and shown in Figure 2-2 in Chapter 2, Regional Setting.
3-26 Upper San Joaquin River Regional Flood Management Plan

INSTITUTIONAL AND GOVERNANCE
Figure 3-2. IRWM Areas in the USJR Region
Upper San Joaquin River Regional Flood Management Plan 3-27
INSTITUTIONAL AND GOVERNANCE
This page intentionally left blank.
3-28 Upper San Joaquin River Regional Flood Management Plan

INSTITUTIONAL AND GOVERNANCE
In 2007, the Implementing Agencies, including Reclamation, USFWS, NMFS, DWR, and CDFW, established the structure for the SJRRP and began work on the PEIS/R, which was completed in 2012 with a signed Record of Decision (Reclamation and DWR, 2012).
The Settlement includes milestone dates for completion of specified activities, including the initiation of interim flows in 2009, completion of a permit application for the collection of spring-run chinook salmon in 2010, and the reintroduction of spring-run and fall-run chinook salmon in 2012. The Settlement also specifies the completion of highest priority channel and structural improvement projects in 2013 and initiation of restoration flows in 2014.
The following site-specific proposed actions are defined in the PEIS/R and are currently in the planning or feasibility analysis phase:
1. Mendota Pool Bypass and Reach 2B Channel Capacity Improvements Project: The Mendota Pool Bypass would include conveying at least 4,500 cfs around the Pool from Reach 2B to Reach 3, and a fish barrier to direct up-migrating adult salmon into the bypass. The bypass could be accomplished by constructing a new channel around Mendota Pool or by limiting Mendota Pool to areas outside of the San Joaquin River. This action would include the ability to divert 2,500 cfs to the pool and may consist of a bifurcation structure in Reach 2B. The bifurcation structure would include a fish passage facility to enable up-migrating salmon to pass the structure, and may include a fish screen to direct outmigrating fish into the bypass channel and minimize or avoid fish entrainment to the pool. Improvements to Reach 2B would include modifications to the San Joaquin River channel from the Chowchilla Bifurcation Structure to the new Mendota Pool Bypass to provide a capacity of at least 4,500 cfs with integrated floodplain habitat. The options under consideration include potential levee setbacks along Reach 2B to increase the channel and floodplain capacity and provide for floodplain habitat. Floodplain habitat is included along the Reach 2B portion of the project as required by the Settlement. In the Mendota Pool Bypass and Reach 2B Improvements Project Description Technical Memorandum, four different alternatives are considered for the purposes of evaluation for the PEIS/R.
2. Reach 4B, Eastside Bypass, and Mariposa Bypass Channel Capacity Improvements Project: The Reach 4B project could include modifications in San Joaquin River channel capacity to ensure conveyance of at least 475 cfs through Reach 4B and associated modifications to structures to ensure fish passage and enable flow routing. These include the Reach 4B Headgate, the Sand Slough Control Structure, modifications to structures in the Eastside and Mariposa bypass channels, and modifications in the Eastside and Mariposa bypass channels to establish a suitable low-flow channel. The Settlement also requires an analysis of whether the long-term high-flow of 4,500 cfs should be accommodated through an expansion of Reach 4B or should be routed through the Eastside Bypass at the Sand Slough Control Structure. The final determinations will be made through the preparation of the Environmental Impact Statement/Environmental Impact Report.
3. Arroyo Canal and Sack Dam Site-Specific Project: This project implements two of the highest priority projects identified in the 2006 Settlement: a fish screen on the Arroyo Canal to prevent entrainment of juvenile chinook salmon in the canal, and modifications to Sack Dam to allow for fish passage around the structure. The Arroyo Canal project’s environmental permitting process has been completed but is currently on hold pending resolution of subsidence issues.
The SJRRP is a large program with uncertainty regarding future funding. The SJRRP is working with many stakeholders, including all of the agencies in the San Joaquin River Flood Control Project Agency, to come
Upper San Joaquin River Regional Flood Management Plan 3-29

INSTITUTIONAL AND GOVERNANCE
Parkway Plan Relevance to the USJR RFMP:
• Conservation, infrastructure development and management, and riparian and floodplain habitat restoration actions in this area could affect flood management and operations relevant to the USJR RFMP.
• Connectivity between the USJR RFMP and the Parkway Plan could enhance ecological and recreational amenities throughout the USJR region.
to a plan for future implementation of the SJRRP, including schedule and budget. DWR and the CVFPB are also included in these discussions. Continued coordination among the USJR RFMP, the San Joaquin River Flood Control Project Agency, and the SJRRP will be key in the future because many efforts may overlap. The SJRRP may be able to provide funding and permitting support to flood projects where overlap between SJRRP and flood projects exists.
San Joaquin River Parkway Master Plan The Parkway Plan is a 22-mile regional greenspace and wildlife corridor along both sides of the river, extending from Friant Dam (RM 267.6) to Highway 99 (RM 243.2), with an interconnected trail system, as well as recreational and educational features. Although this is located upstream of the USJR region
protected by SPFC facilities, the implementation of the Parkway Plan potentially includes land conversion, infrastructure development and management, and riparian and floodplain habitat restoration actions that could affect flood management and operations in the USJR region.
This particular reach of the San Joaquin River has attained statewide significance through legislative action that created a State agency (the SJRC) to oversee the San Joaquin River Parkway. In 1992, California enacted the San Joaquin River Conservancy Act, finding that:
…the San Joaquin River, its broad corridors, and its prominent bluffs constitute a unique and important environmental, cultural, scientific, agricultural, educational, recreational, scenic, floodwater conveyance, and wildlife resource that should be preserved for the enjoyment of, and appreciation by, present and future generations.
The mission of the SJRC is to implement the Parkway Plan; acquire approximately 5,900 acres from willing sellers; operate and manage lands for public enjoyment consistent with protection of natural resources; protect, enhance, and restore riparian and riverine habitat and ecological diversity; and facilitate the development of the Parkway, garner public support, and secure its future (San Joaquin River Parkway and Conservation Trust, 2012).
The Parkway Plan underwent environmental review (California Environmental Quality Act [CEQA]) and was adopted by the SJRC in December 1997. Currently, the Parkway Plan is being updated and reevaluated under CEQA. The Parkway Plan Update, a programmatic document, is a long-term, large-scale plan that would be implemented incrementally and in phases over many years. The proposed Parkway Plan Update presents conceptual Parkway development projects, along with goals and policies under which the development would be pursued and implemented. The development of individual projects would be evaluated separately by the SJRC or other appropriate lead agencies subject to separate site-specific CEQA analysis (SJRC, 2013).
The Parkway Plan Update may consist of the following projects or actions:
• Acquisition of a total of 5,900 acres of public conservation lands
• Revegetation, restoration, and enhancement of self-sustaining riparian, wetland, floodplain, and upland habitats on SJRC and other public lands
3-30 Upper San Joaquin River Regional Flood Management Plan

INSTITUTIONAL AND GOVERNANCE
• Development and O&M of a 23-mile paved primary multiple-use Parkway trail, and a system of interconnected secondary trails
• Rehabilitation of inadequate bridges and crossings, along with development and O&M of permanent, temporary, and seasonal bridges and crossings to connect the primary trail system, provide separation from roads, and improve safety
• Development and O&M of a river nonmotorized boating trail; designated campgrounds; visitor and interpretive centers; vista points, observation decks, and fishing piers and docks; community-supported small-scale farming and agriculture; and offices for use by SJRP staff
• Development and O&M of ancillary facilities and features to support public access, educational and recreational uses, and SJRP infrastructure
San Joaquin River Blueway Vision The San Joaquin River Blueway Vision was developed by a partnership of 14 nonprofit organizations with shared ideas for improving conditions of the natural resources of the San Joaquin River and enhancing the quality of life for Californians. In May 2009, these organizations formalized their working relationship and formed the SJRP. Member agencies of SJRP include Audubon California, Defenders of Wildlife, Ducks Unlimited, NRDC, Point Blue Conservation Science Point Reyes Bird Observatory, Revive the San Joaquin, River Partners, Sierra Foothill Conservancy, San Joaquin River Parkway and Conservation Trust, The Bay Institute, The Trust for Public Land, The Nature Conservancy, Trout Unlimited, and the Tuolumne River Trust.
The Blueway Vision takes a holistic look at the entire length of the San Joaquin River and includes a mosaic of parks, wildlife refuges, and other publicly accessible places that provide an opportunity to explore and enjoy the San Joaquin River. It aims to connect San Joaquin Valley residents to our shared natural and cultural heritage, to recreational opportunities, and to each other by fostering health, strengthening community ties, enhancing learning, reflecting our pride of place, and supporting restoration and conservation efforts along the river.
The Blueway Vision supports the full implementation of the SJRRP, but it aims to leverage additional opportunities that promote recreational, educational, economic, environmental, public health, and aesthetic benefits for San Joaquin Valley residents and visitors.
Although the Blueway Vision has identified no specific projects, its overall goals are to:
• Build a coalition of stakeholders by reaching out to community members, agencies, local land use jurisdictions, landowners, and key organizations to discuss a vision for a San Joaquin River Blueway, and find common ground and support for the way forward.
− Action: Develop partnerships and pursue funding to plan and design the San Joaquin River Blueway.
• Integrate the Blueway into planning and policy efforts by working with agencies and other partners to facilitate implementation of the San Joaquin River Blueway through ongoing local, regional, and State planning efforts and policy development, and through SJRRP projects as appropriate.
Blueway Vision Relevance to the USJR RFMP:
• Although the Blueway Vision does not specifically include flood management, other elements of the Vision, including regional connectivity and ecological restoration, may be addressed in the USJR RFMP.
Upper San Joaquin River Regional Flood Management Plan 3-31

INSTITUTIONAL AND GOVERNANCE
− Action: Work with stakeholders to identify and advance Blueway projects that will improve access to the river in the near term.
• Expand educational and outreach resources by developing the San Joaquin River Blueway with a stewardship ethic that provides user guidance, develops educational and interpretive materials, seeks responsible management approaches, and works directly with visitors through programs and other means. The goal is to promote respect for private property, appreciation and care for sensitive environmental resources, and awareness of the historical legacy of the San Joaquin River.
− Action: Create and publicize a map and guide with information about existing public access sites on the river, including a boating guide for key reaches.
Other Plans In 2009, California State Parks (CSP) Planning Division published the Central Valley Vision Implementation Plan, a 20-year vision for improving State parks in the Central Valley. The plan is a catalog of proposed initiatives to be implemented over the next 20 years, which will improve recreation and resource protection in the Central Valley. The plan resulted from analysis by CSP with input from Central Valley residents and partners, including public agencies and nonprofit organizations. The only initiative in the USJR region identified in the Central Valley Vision Implementation Plan is related to GVGSP. The plan simply states that CSP will cooperate with other entities involved in the implementation of the SJRRP (CSP Planning Division, 2009).
Recently, CSP has commissioned several studies that evaluate the feasibility of removing or notching existing levees adjacent to the San Joaquin River to induce more regular flooding on CSP lands in an effort to control invasive vegetation and passively restore floodplain and riparian habitat areas. Initial feasibility studies demonstrated that this could be achieved with relatively simple engineering. Subsequent planning and feasibility analyses are currently ongoing.
3.6 Institutional Issues and Deficiencies Institutional issues pose significant concern for the region due to the number of agencies and other stakeholder groups with interest in the region, the complex nature of flood operations, restrictive permitting requirements, and the implementation of the SJRRP.
The following institutional issues face the area:
• Complex operations due to upstream inflows to the system, requiring additional coordination between multiple agencies in the region
• Difficulty in performing maintenance due to funding issues and permitting requirements
• Inadequate staffing levels for required level of maintenance
• Declining agency revenues due to changes in land use from agriculture to wildlife areas
• Completion of Emergency Response and Recovery Plans needed
• Financing of restoration facilities and flood SIs to allow implementation of the SJRRP not determined, and no long-term O&M agreements in place yet
• Revenue shortfall due to Propositions 13 and 218
3-32 Upper San Joaquin River Regional Flood Management Plan

4.0 Flood Management The USJR region lies within the counties of Fresno, Madera, and Merced and encompasses the areas that are protected by the SPFC along the San Joaquin River from Gravelly Ford in Fresno County to the confluence of the Merced River in Merced County; Ash Slough, Berenda Slough, and the Fresno River in Madera County; and Mariposa Creek, Owens Creek, Bear Creek, and Merced River in Merced County. Figure 1-1 indicates the planning area boundaries, which lie within portions of Fresno, Madera, and Merced counties. The LSJLD is the primary agency responsible for flood management within the planning area. The LSJLD operates and maintains the Lower San Joaquin River Flood Control Project, which was completed in 1966. The project includes levees along portions of the San Joaquin River and other tributary east-side rivers and streams from Gravelly Ford to the Merced River, as well as flood bypass channels and various types of structures necessary for the project's operation.
Other agencies that operate and maintain flood facilities within the USJR region include the MSG and the Madera County FCWCA. Both of these agencies are responsible for the O&M of lengthy levee systems along several of the aforementioned east-side rivers and streams that flow into the LSJLD project facilities. However, the length of these tributary rivers and streams that lie within the planning area is relatively small in comparison to the entirety of the LSJLD project facilities. It should be noted that two separate areas—one along Owens Creek and the other along Bear and Black Rascal creeks, which are operated and maintained by MSG—are included in the USJR region.
This section of the report outlines the flood risks, flood management infrastructure, O&M of the flood management system, flood emergency management, and flood system issues and deficiencies.
4.1 Flood Risk Floods can be caused by bodies of water that leave their boundaries due to heavy rainfall, failure of dams and levees (or other engineered structures), or extreme wet-weather patterns. In the USJR region, flood risk generally is caused by one of two reasons:
• Due to snowmelt, rainfall, or a combination of the two that overwhelms existing systems • Due to seepage under existing levees and along historically filled-in channels into agricultural fields
Flood risk is not simply the loss of life or damage incurred due to a single catastrophic event. Flood risk is assessed as a function of five components:
• Hazard (what causes the harm) • Performance (how the flood management system reacts to the harm) • Exposure (who and what can be harmed) • Vulnerability (how susceptible people and property are to the harm) • Consequence (what are the costs in lives lost and dollars)
Using the factors described is important because they help calculate the impact and cost of potential floods. Expected annual damage is a commonly used measuring unit for characterizing and comparing flood risk based on these factors. Once computed, “flood risk” can be used to plan budgets for O&M, to ensure the sustainability of infrastructure investments, and to set SI priorities. It is important to note that flood risk can never be 100 percent eliminated and residual risk always exists.
Upper San Joaquin River Regional Flood Management Plan 4-1

FLOOD MANAGEMENT
Residual risk is the likelihood of damage or other adverse consequence remaining after flood management actions are taken. For example, if a new dam were constructed, that reservoir would reduce the risk to people and property in the floodplain because it limits the flow of water in the channel by storing some of the water upstream, thereby limiting overflow from the channel into the floodplain. The dam limits the loading or hazard. The dam and reservoir would be designed and built with a certain storage capacity—a capacity that would be exceeded, albeit rarely. A floodplain is never fully protected with 100 percent certainty.
Within the USJR region, there is a long history of flooding, along with flood management activities to address flood risk. In the USJR region, 43 percent of the population lives within the 100-year floodplain. Of note, the cities of Firebaugh and Merced have areas that are within the 100-year floodplain. In fact, almost 60 percent of population in the city of Firebaugh lives within the 100-year floodplain. In addition, more than 446,000 acres of land, or almost 70 percent of the region, is within the 100-year floodplain. Much of this is farmland that has been designated as Prime, Unique, or of Statewide Importance.
The total value associated with commercial, industrial, public, and residential structures is approximately $425 million. Residential structures constitute approximately 75 percent, public structures values approximately 16 percent, commercial structures approximately 7 percent, and industrial structures approximately 3 percent. The expected annual damage associated with these structures is more than $1.7 million. The calculation of flood risk information is described in Appendix A.
Agricultural activities are the major economic driver in the region. Most of the agricultural activities occur along historical rivers, streams, creeks, and canals, which are primarily located within 100-year floodplains. Of more than 423,600 acres of agricultural land in the region, 29 percent is Prime Farmland, 27 percent Grazing Land, 20 percent Farmland of Statewide Importance, 18 percent Unique Farmland, and the remainder is confined-animal agriculture land, local farmland, rural land, and semi-agricultural land. Expected annual damage from crop losses in this region is projected to be over $11 million for a disaster in the 100-year floodplain. Other agricultural-related losses due to flooding would result in an additional $1.8 million in damages to structures and business operations. The calculation of flood risk information is described in Appendix A.
4.2 Existing Flood Management Infrastructure Major flood management infrastructure in the USJR region includes facilities developed under the San Joaquin River Flood Control Project and the Merced County Streams Project. In addition, Madera County has 25 miles of levees along the Fresno River and Ash Slough. Federal authorizations for these projects began in 1944, and State authorization began in 1955. Major facilities in the region are described in Table 4-1. The main components of the Merced and Madera flood control systems are listed in Table 4-2.
4-2 Upper San Joaquin River Regional Flood Management Plan

FLOOD MANAGEMENT
Table 4-1. Summary of Components of the Upper San Joaquin River Flood Control System
Component Location Description or Comments Levees
Private Levees San Joaquin River from RM 216.1 to RM 148 (Chowchilla Bifurcation Structure to Mariposa Bypass)
Private levees were constructed by individual landowners to protect localized areas (private properties).
Project Levees SPFC levees from RM 225 (south bank) and RM 227 (north bank) to RM 216.1 (Gravelly Ford to Chowchilla Bifurcation Structure)
From RM 148 to RM 118.5 (Mariposa Bypass to Merced River)
Along Chowchilla Canal Bypass, Eastside Bypass, and Mariposa Bypass
Along Ash and Berenda sloughs and the Fresno River
Constructed as part of the San Joaquin River Flood Control Project, project levees were designed to provide 50-year flood protection.
Diversion Structures
Chowchilla Bifurcation Structure (composed of the San Joaquin River Control Structure and the Chowchilla Canal Control Structure)
RM 216.1 The structures control the diversion of flows from San Joaquin River into the Chowchilla Canal Bypass.
Eastside Bypass Control Structure
Controls flow in the Eastside Bypass downstream of the Mariposa Bypass
Sand Slough Control Structure and San Joaquin River Control Structure
RM 168 The structure diverts San Joaquin River flows into Reach 4B. The gates in the structure are currently closed, and flood flows have not been released into Reach 4B in many years.
Mariposa Bypass Structure RM 147 The structure diverts flow from Eastside Bypass into the Mariposa Bypass and the San Joaquin River.
Bypass Channels
Fresno Slough RM 204.6 The channel conveys high flows from Kings River to Mendota Pool.
Chowchilla Canal Bypass RM 216.1 The channel conveys high flows from Chowchilla Bifurcation Structure to Eastside Bypass.
Eastside Bypass RM 136 Conveys flows from Chowchilla Canal Bypass to Mariposa Bifurcation Structure and Bear Creek (both of which convey flows back into San Joaquin River).
Mariposa Bypass RM 147.2 Conveys water from the Mariposa Bypass Bifurcation Structure into the San Joaquin River.
Table 4-2. Summary of Components of Merced and Madera Flood Control Systems
Facility Year Constructed Capacity (AF)
Merced Facilities
Burns Reservoir 1957 6,800
Bear Reservoir 1957 7,700
Owens Reservoir 1957 3,600
Mariposa Reservoir 1957 15,000
Castle 1992 6,400
Upper San Joaquin River Regional Flood Management Plan 4-3

FLOOD MANAGEMENT
Table 4-2. Summary of Components of Merced and Madera Flood Control Systems Facility Year Constructed Capacity (AF)
Merced Channel Improvements and Diversions
Black Rascal Creek to Bear Creek
1958 3,000
Owens Creek to Mariposa Creek Reservoir
1958 400
Madera County
Levees on Fresno River 1977 5,000
Levee on Berenda Slough 1977 2,000
Levee on Ash Slough 1977 5,000
Eastman Lake 1975 150,000
Hensley Lake 1975 90,000
4.2.1 San Joaquin River Flood Control Project The San Joaquin River Flood Control Project, which was constructed between 1959 and 1966, was designed to provide protection for a 50-year flood event. The San Joaquin River Flood Control Project includes a network of bypass channels, levees, and structures to provide flood management from Gravelly Ford to the confluence with the Merced River.
Project levees (levees constructed as part of the San Joaquin River Flood Control Project) now extend from Gravelly Ford to the Chowchilla Bifurcation Structures, where high flood flows can be diverted into the Chowchilla Canal Bypass. Flood flows in the Chowchilla Canal Bypass are conveyed into the Eastside Bypass, which also receives flood flows from the Fresno and Chowchilla Rivers. Flood flows that are in the San Joaquin River, downstream of the bifurcation, are routed further downstream into the bypass system
at the Interchange Area of the Sand Slough Control Structure. Flood flows in the Eastside Bypass are delivered to the San Joaquin River, either through the Mariposa Bypass or continue down the Eastside Bypass that converges with Bear Creek flows, then into the San Joaquin River. Project levees, along the river, in this portion of the USJR region extend from the confluence of the Mariposa Bypass outlet to the confluence of the Merced River.
The San Joaquin River Flood Control Project has altered the hydrologic regime downstream of Reach 2A by routing the majority of winter and spring high flows away from the main river channel to protect downstream
areas and the city of Firebaugh. This has reduced the inundation of the historical floodplain and the attenuation of high flows. The project as designed confines flows to the primary San Joaquin River channel and the bypass channels.
Friant Dam, 2006
4-4 Upper San Joaquin River Regional Flood Management Plan

FLOOD MANAGEMENT
4.2.2 Upstream Flood Facilities Upstream flood facilities impact the San Joaquin River Flood Control Project but are not part of the project or operated by the LSJLD. Friant Dam, which impounds Millerton Lake, provides significant reduction of flood risk in the USJR region. Friant Dam, which Reclamation operates, impounds more than 520,500 AF of water, with a maximum of 170,000 AF reserved for flood storage between November and February. The flood storage space in Millerton Lake can be reduced (to allow for more water storage) by transferring up to 85,000 AF of reserved flood control space to Mammoth Pool. Depending on the forecasted unimpaired runoff and irrigation demand, 390,000 AF of supplemental storage space can be reserved during the snowmelt runoff period (from February 1 through July 1). For the remainder of the year, the storage capacity of the reservoir is reserved for water supply storage rather than flood control.
Reclamation is required to make releases from Friant Dam to maintain minimum base flows to provide water to landowners along the river who have entered into contracts with Reclamation. The original established minimum flow was 5 cfs past the property of each holder of such a contract. Historically, water flowed to just beyond Gravelly Ford, where the last landowner who has such a contract is, and the channel was usually dry in the reach from Gravelly Ford to the Bifurcation Structure. But with the establishment of the SJRRP under the Settlement, water will be flowing when Reclamation is making Restoration Flow releases and/or there are flood flows.
A number of dams alter the hydrology of the USJR through storage of spring runoff when reservoir inflows exceeded turbine flow capacity. Southern California Edison (SCE) and Pacific Gas and Electric operate seven major dams, providing 616,100 AF of reservoir storage capacity in the watershed upstream of Friant Dam. Except for Mammoth Pool, which has 85,000 AF of reserved storage space for flood control, these dams are not operated for flood storage, but spring runoff storage provides some flood attenuation.
The San Joaquin River receives flood flows from Pine Flat Dam on the Kings River. Fresno Slough, also known as the North Fork of Kings River, is connected to San Joaquin River by James Bypass, a man-made canal. James Bypass directs floodwater from the Kings River to the San Joaquin River. During flood releases from Pine Flat Reservoir, about half of the Kings River flows (up to 4,750 cfs) may be diverted north at James Weir through James Bypass into the San Joaquin River.
Changes to flows on the Kings River also have altered the hydrology of the San Joaquin River system. Historically, water frequently flowed from Kings River into San Joaquin River via Fresno Slough to Mendota Pool. Construction of Pine Flat Dam in 1954 on the Kings River reduced the frequency and magnitude of high flows in the river system. However, the frequency and magnitude of high-flow contributions from the Kings River to the San Joaquin River have increased as a result of the development of the flood control system on the Kings River, which routes water into Fresno Slough. The Kings River contributed to the San Joaquin River flow in 10 of the 31 years between 1922 and 1953; the average annual contribution was 226,500 AF. The Kings River contributed to the San Joaquin River flow in 20 of the 46 years between 1954 and 2000; the average annual contribution was 483,800 AF. The conveyance of flood flows from the Kings River has priority over the conveyance of flows from San the Joaquin River.
Mendota Pool
Upper San Joaquin River Regional Flood Management Plan 4-5

FLOOD MANAGEMENT
4.2.3 Project Levees SPFC project levees were constructed along natural drainage channels to increase floodwater carrying capacity, and to create floodwater bypass channels. Top-of-levee crowns have widths of 12, 20, 24, or 28 feet and are covered with gravel roads (for patrolling the levee). Water-side slopes are 3 to 1 (horizontal to vertical [H:V]) and land-side slopes are 2 to 1 (H:V). The design freeboard is 3 feet for rivers and streams and 4 feet for bypass channels. However, on the right bank of levee Units 5, 7, 8, 9, and 10, freeboard was constructed as much as 2 feet higher than on the left banks because levees in this section were constructed at different times with different hydraulic capacities. Actual freeboard may be different from the original design values due to land subsidence, along with erosion and sediment deposits in the channels. Tables 2-1 and 4-3 provide information about USJR region levees and the agencies responsible for their O&M.
Table 4-3. Levees within USJR Region
Channel From To County Responsible Agency
San Joaquin River
Gravelly Ford Chowchilla Canal Bypass Fresno, Madera LSJLD
Chowchilla Canal Bypass Mendota Pool Fresno, Madera Nonproject
Mendota Pool 1.6/2.2 miles upstream of Sand Slough Control Structure
Fresno, Madera, Merced Nonproject
1.6/2.2 miles upstream of Sand Slough Control Structure
Sand Slough Control Structure Merced LSJLD
Sand Sough Control Structure
2.0/3.0 miles upstream of Mariposa Bypass Merced Nonproject
2.0/3.0 miles upstream of Mariposa Bypass
Merced River Confluence Merced LSJLD
Chowchilla Canal Bypass San Joaquin River Junction with Eastside
Bypass at Fresno River Madera LSJLD
Eastside Bypass Junction with Chowchilla Canal Bypass at Fresno River
San Joaquin River downstream of Bear Creek
Madera, Merced LSJLD
Fresno Slough Junction with James Bypass (west of railroad tracks)
Mendota Pool Fresno Nonproject
Fresno River Road 18 (approximately)
Junction with Chowchilla Canal Bypass
Madera Madera County
Berenda Slough Avenue 17 1/2 (approximately)
Junction with Eastside Bypass Madera Madera County, LSJLD
Ash Slough Road 8 (approximately) Junction with Eastside Bypass Madera Madera County, LSJLD
Chowchilla River Highway 59 Junction with Eastside Bypass Madera, Merced Madera County
Owens Creek
Upstream of Mission Avenue
Junction with Mariposa Creek Merced MSG
Eastside Canal Junction with Eastside Bypass Merced LSJLD
Black Rascal Creek Upstream of Yosemite Avenue
Junction with Bear Creek Merced MSG
Bear Creek Eastside Canal Junction with Eastside Bypass Merced LSJLD
4-6 Upper San Joaquin River Regional Flood Management Plan

FLOOD MANAGEMENT
DWR designed the flood system to provide protection from a 50-year flood event, according to the definition of the event at the time of design in the 1950s. The published design flow capacity for the main San Joaquin River channel is based on a design freeboard requirement of 3 feet. The published design capacity for the bypass channels is based on a design freeboard requirement of 4 feet. The San Joaquin River from the Chowchilla Bifurcation Structure to the Mariposa Bypass is lined with nonproject levees or canal banks. Aggradations of the channel bed, subsidence, and vegetation encroachment have reduced the capacity of the channel to convey the published design flows. Portions of levees along Ash and Berenda sloughs and the Fresno River are also part of the system. A reach-specific discussion of the flood control system, the operating rules of the system, and the hydraulic capacity of the channels follows.
There are access roads to the levees and patrol bridges across the flood and river channels from levee crown to levee crown such that all portions of the flood control system are reachable by vehicle at all times for maintenance of the levee or flood fighting, as well as project maintenance activities. Fencing along the levees and fence gates on the levee patrol and access roads secure the project. There are two areas where levees have been breached to allow flows to reenter the bypass. These breaches impact travel during emergency operations.
The LSJLD has not been able to conduct O&M activities in the San Joaquin River channel for many years due to permitting issues and environmental restrictions. In certain areas where it is possible to get permits, project channels are cleared and grubbed of debris, brush, trees, and other wild growth to maintain the floodwater design carrying capacity.
4.2.4 Bypasses and Other Flood Management Structures Table 4-4 presents a summary of the characteristics of the components of the Lower San Joaquin Flood Control Project and lists the published capacities for each reach of the bypass system.
Table 4-4. Published Design Capacity for the Bypass System of Lower San Joaquin Flood Control Project
Bypass Location
Description
Published Capacity with 4-foot Freeboard
(cfs)
Chowchilla Canal Bypass San Joaquin River to the Eastside Bypass confluence 5,500
Eastside Bypass Fresno River to Berenda Slough confluence 10,000
Eastside Bypass Berenda Slough to Ash Slough confluence 12,000
Eastside Bypass Ash Slough to Sand Slough Control Structure confluence 17,500
Eastside Bypass Sand Slough Control Structure to Mariposa Bypass confluence 16,500
Eastside Bypass Mariposa Bypass to Owens Creek confluence 12,000
Eastside Bypass Owens Creek confluence to Bear Creek confluence 13,500
Eastside Bypass Bear Creek to San Joaquin River confluence 18,500
Mariposa Bypass Eastside Bypass to San Joaquin River confluence 8,500
Note: Published values from Lower San Joaquin Flood Control Project O&M Manual. Existing capacities for the Eastside Bypass from Berenda Slough to Mariposa Bypass are reduced due to sedimentation and subsidence.
Upper San Joaquin River Regional Flood Management Plan 4-7

FLOOD MANAGEMENT
Chowchilla Bifurcation Structure The Chowchilla Bifurcation Structure controls the flows routed into the Chowchilla Canal Bypass and the flows routed into Reach 2B of the San Joaquin River. This structure consists of two identical gate control structures, one in each channel, at the junction of the San Joaquin River and the Chowchilla Canal Bypass.
These structures are the Chowchilla Canal Bypass Control Structure, and the San Joaquin River Control Structure. The structures are operated together to control the flow that is diverted from the San Joaquin River to the bypass channel. Each structure has four 20-foot-wide bays with fabricated steel radial gates. The gates are raised and lowered by cable hoists with electric motors. A standby engine-generator set with a propane fuel tank provides backup electrical power to the gate hoists in the event of a power outage. Electrical controls for the gates are located in a concrete-block control building.
Chowchilla Canal Bypass Control Structure The Chowchilla Canal Bypass Control Structure is an SPFC facility consisting of four gated bays, each 20 feet wide, with a published total design capacity of 5,500 cfs. Water enters the bypass system from the San Joaquin River through the Chowchilla Canal Bypass Structure. Historically, higher discharges of up to 12,000 cfs have been diverted into the bypass under extreme flood conditions. The gates were designed for automatic operation; however, they currently are operated manually. Approach embankments connect the structure with the levee system. The Chowchilla Canal Bypass Control Structure operates in conjunction with a nearby identical structure across the San Joaquin River.
San Joaquin River Control Structure The San Joaquin River Control Structure is an SPFC facility, identical to the Chowchilla Canal Bypass Control Structure. The structure has four gated bays, each 20 feet wide. The gates were designed for automatic operation; however, the gates are currently operated manually. This control structure differs from the Chowchilla structure in that it has a trash rack, which can slow flows during flood events. Approach embankments connect the structure with the levee system. The San Joaquin River Control Structure operates in conjunction with the Chowchilla Canal Bypass Control Structure at the head of the Chowchilla Canal Bypass. The San Joaquin River has no SPFC facilities downstream from the control structure for about 33 miles (near the Sand Slough Control Structure).
Chowchilla Bifurcation Structure Operations The operation of the Chowchilla Bifurcation Structure depends on the following factors:
• Flood flows delivered to the San Joaquin River from Kings River (via Fresno Slough) at Mendota Pool
• Water diversions from Mendota Pool, which determine the need for check boards and the water elevation at the dam
Chowchilla Canal Bypass
San Joaquin River Control Structure
4-8 Upper San Joaquin River Regional Flood Management Plan

FLOOD MANAGEMENT
The conveyance of high flows from the Kings River via Fresno Slough has priority over the conveyance of San Joaquin River flows through Mendota Pool. When the combined flow contributions from the Kings River and San Joaquin River are below the hydraulic capacity of the downstream channel (the capacity of Reach 3 is 4,500 cfs), the operating rules for the Chowchilla Bifurcation Structure are not explicit, and the LSJLD has the flexibility to “best utilize the design capacities of the San Joaquin River Flood Control Project.” When flows are less than or equal to irrigation demands, the check boards at Mendota Dam remain in place to maintain the water surface elevation of Mendota Pool.
If the flow contribution from the Kings River is below 3,000 cfs, as much as 1,300 cfs of San Joaquin River water could be routed to Mendota Pool at the Chowchilla Bifurcation Structure. To sustain a total combined flow of less than 4,500 cfs in Reach 3 (total of San Joaquin River and Kings River flows), incremental increases in flow contributed from the Kings River above 3,000 cfs are offset by reduced flows at the San Joaquin River Control Structure. The residual San Joaquin River flow is routed into the bypass channel.
Surplus flows (flows not diverted by the Exchange Contractors to meet water demands) are released through Mendota Dam into Reach 3. Mendota Dam can pass up to 1,500 cfs via manual and automated sluice gates in the dam. The checkboards in Mendota Dam are removed to pass flows greater than 1,500 cfs. The O&M manual states that “should the flows exceed 8,000 cfs at the control structures or 10,000 cfs at the latitude of Mendota, the District will operate the control structures at their own discretion with the objective of minimizing damage to the flood control project and protected area.”
Chowchilla, Eastside, and Mariposa Bypasses The bypass system for the San Joaquin River begins at the river about 5 miles east of the town of Mendota. Most of the flow from Friant Dam is diverted to the Chowchilla Canal Bypass, which branches off the San Joaquin River about 11 RM upstream of Mendota Dam. The Chowchilla Canal Bypass is designed to carry most of the flood flows from the San Joaquin River at that location if Kings River floodwater (up to 4,750 cfs) is entering downstream through the James Bypass. The bypass system discharges water back to the San Joaquin River at two locations—one at approximately 42 miles and the other at approximately 50 miles downstream from the upstream end of the bypass. Portions of levees already in place along canal banks were rehabilitated, and new reaches of levees were built as part of the bypass system, which includes about 192 miles of levees. Levees along tributary streams were designed with 3 feet of freeboard.
Over time, encroachment of vegetation, substantial sedimentation, and land subsidence have considerably reduced channel capacity. Erosion, seepage, and prolonged high water compromise levee integrity. Downstream of the Chowchilla Canal Bypass, the river is confined by nonproject levees and generally carries no more than 1,300 cfs due to sedimentation and seepage impacts.
There are two bypass control structures, one in each channel, at the junction of the Eastside Bypass and Mariposa Bypass. The bypasses generally remain dry, with the exception of some ponding in low-lying areas, until they are needed to convey flood flows or SJRRP releases. The structures control the flow that is diverted from the Eastside Bypass into the Mariposa Bypass, which discharges back into the San Joaquin River about 4 miles west of the structures.
Mariposa Bypass Control Structure
Upper San Joaquin River Regional Flood Management Plan 4-9

FLOOD MANAGEMENT
Mariposa Bypass Control Structure The operating rules for the Mariposa Bypass Control Structure require that the structure divert the first 8,500 cfs of flow from the Eastside Bypass into the San Joaquin River. The water remaining in the Eastside Bypass is released into the San Joaquin River via Bear Creek. At high flow levels in the bypass, flows from creeks in the MSG cannot enter the bypass; therefore, water flows around the levee system along the Eastside Irrigation Canal, which causes flooding problems. The Mariposa Bypass control structure consists of 14 bays, each 20 feet wide. The outer four bays on each end (eight total) are fitted with fabricated steel radial gates, and the inner six bays are not gated. The structure includes a reinforced-concrete spillway on the downstream side to dissipate energy from the elevation drop from the Eastside Bypass to the Mariposa Bypass.
Eastside Bypass Control Structure The Eastside Bypass control structure consists of six 20-foot-wide bays with fabricated steel radial gates on all bays. The gates are raised and lowered by cable hoists with electric motors. A standby engine-generator set with a propane fuel tank provides backup electrical power to the gate hoists if a power outage occurs. Electrical controls for the gates are located in a concrete-block control building.
Other Control Structures Other control structures are located at the confluence of the Fresno and San Joaquin rivers just north of Highway 152, at the Sand Slough interchange where the San Joaquin River intersects the Eastside Bypass Channel, at the junction of Owens Creek and the Eastside Canal, and at the junction of Bear Creek and the Eastside Canal.
Fresno River Drainage Structure The Fresno River drainage structure is a 4-foot by 6-foot reinforced-concrete box culvert through the right bank levee of the San Joaquin River. Drainage flow is controlled by a slide gate located on the landward side of the San Joaquin River. There is also a levee embankment just east of the gate structure that plugs the Fresno River. The Fresno River Channel between the Eastside Bypass and the San Joaquin River is considered interior drainage and is not part of the project facilities.
Sand Slough Control Structure The Sand Slough Control Structure was originally designed to route up to 3,000 cfs of water into the Eastside Bypass and divert 1,500 cfs into the San Joaquin River. Flows from Reach 4A have not been diverted into Reach 4B in many years, including during the 1997 flood, because of vegetation growth and lack of channel hydraulic capacity. The San Joaquin River Structure includes a four-bay reinforced-concrete box culvert through the left bank of the San Joaquin River just south of Washington Road.
Owens Creek Control Structure Flow from Owens Creek enters the Eastside Canal through a culvert at the east bank of the canal and can be released into the Eastside Bypass through the control structure. The Owens Creek structure has a reinforced-concrete invert slab, pier walls, end walls, and wing walls, with a 12-foot-wide timber bridge
Sand Slough Control Structure
4-10 Upper San Joaquin River Regional Flood Management Plan

FLOOD MANAGEMENT
deck for access across Owens Creek along the west bank of the Eastside Canal. There are seven bays with timber flashboards in the upstream side of the structure.
Bear Creek Control Structure The Bear Creek structure has a reinforced-concrete invert slab, pier walls, end walls, and wing walls, with a 3-foot-wide catwalk spanning six bays with flashboards. Bear Creek flows directly into the Eastside Canal, and flow can be released into the Eastside Bypass through the control structure. There is a reinforced-concrete patrol bridge along the west bank of the Eastside Canal about 250 feet downstream of the control structure. The existing Bear Creek diversion weir was built in the 1960s with the original project. The structure invert is higher than the upstream channel invert, which constrains Bear Creek flood flows entering the Eastside Bypass and causes upstream ponding on Bear Creek. Flows migrate around the project levee and flood the land-side of the project levee. Modifying the structure to minimize the flow restriction would allow ponded water to flow to the Eastside Bypass
Drop Structures Two drop structures with an elevation drop of approximately 4 feet are located in a 0.5-mile section of the Eastside Bypass, just upstream of Road 9. Four drop structures with an elevation drop of approximately 10 feet are in a 1-mile section of Ash Slough. A single drop structure with an elevation drop of approximately 15 feet is at the confluence of the Mariposa Bypass and San Joaquin River. As noted earlier, there is a drop structure at the beginning of the Mariposa Bypass, which is integral with the control gate structure at that location. Drop structures have reinforced-concrete cutoff walls, crest or head walls, spillway apron slabs, floor blocks, end sills, side walls, and wing walls. Riprap is included upstream and downstream of the drop structures to minimize erosion of the channels and levee slopes.
Sediment Basin A sediment settling basin is included at the upstream end of the Chowchilla Canal Bypass. The basin is designed to store up to 200,000 cubic yards of sediment. On the land side of both the right and left banks of the bypass channel, there are sediment disposal areas that are about 1.3 miles long.
Mendota Pool Mendota Pool, impounded by Mendota Dam, is a 5,000-AF reservoir located just outside the city of Mendota on the San Joaquin River. Mendota Dam provides no operational or flood management storage. The function of the Mendota Pool is to distribute water from the San Joaquin River or DMC to the various water rights diversions for agricultural irrigation. However, the water level in the pool also functions to maintain water levels in the Mendota Wildlife Management Area. CCID, which owns and operates the dam, maintains water surfaces in Mendota Pool at a level between 14.2 feet and 14.5 feet on the staff gauge at the dam. At levels below 14.2 feet, diversions to the Mendota Wildlife Management Area and to other water users on Fresno Slough are impaired. Operating criteria, established by the Division of Safety of Dams (DSOD), limit the maximum water surface to 14.5 feet. Above 14.5 feet, seepage problems begin to occur at the upper end of Mendota Pool.
Mendota Dam contains flow from the San Joaquin River and flood flows from the Kings River via the Fresno Slough and James Bypass. The DMC conveys Delta water to Mendota Pool from the north, and several irrigation channels divert flows from it.
Upper San Joaquin River Regional Flood Management Plan 4-11

FLOOD MANAGEMENT
Hydrologic Facilities Hydrologic facilities include staff gauges and water stage recorders that are located at critical locations such as control structures and channel junctions. Staff gauge installations consist of three timber posts in a line perpendicular to the levee centerline. One post is located in the low-water channel, another on the berm between the low-water channel and the levee, and a third is on the levee slope. Enamel-coated metal staff gauges graduated in tenths of a foot are attached to the timber posts and set to a known elevation datum. LSJLD notes that staff gauges might no longer be reliable reference points from one flood event to the next due to the land subsidence that persists throughout the area. Patrollers therefore drive a temporary lath into the levees to monitor water level changes.
Water stage recorders typically consist of a stilling well with an inlet from the channel and a water-level telemetering device in the stilling well. Recorded flows from these wells are monitored by LSJLD, with adjustments made for flow curve corrections due to channel cross sectional changes. Due to unreliable automatic gate control equipment, the primary control structures described earlier are manually operated.
An additional feature critical to O&M activities is the mile marker. The project is divided into levee units, and mile markers are included every 0.5 mile of each unit. Signs on the markers indicate the levee unit number and the mile beginning at the downstream end and proceeding upstream. The signs are visible from vehicles traveling in either direction along the levee patrol roads.
Bridges, Low-Water and Dip Crossings There are 24 bridges, and several low-water and dip crossings, included in the project. Bridges are reinforced-concrete structures consisting of piles, deck slabs, and abutments. Patrol and access bridges are 18.3 feet wide, and county road bridges are 30.3 feet wide. The bridge at Highway 152 is 34 feet wide. Embankments for these bridges have riprap slope protection. As noted earlier, there are four additional bridges that are integral with the control gate structures at the Bifurcation Structure and the Mariposa Bypass. Low-water and dip crossings are generally gravel surfaced roads that cross the interior of the bypass channels. Low flows pass through culverts under the roads; however, at higher flows, the roads are inundated and cannot be used. There are also reinforced-concrete bridges that cross the low-flow channel and are inundated during high-water conditions.
Irrigation and Drainage Structures Numerous irrigation and drainage structures pass through, under, or over the project levees. These facilities provide for the passage of water from the flood waterway to the protected area for irrigation or other usage, or from the protected area to the waterway for drainage purposes. The structures are generally corrugated metal, steel, or reinforced-concrete pipes and reinforced-concrete box culverts with reinforced-concrete end walls and head walls. Flow through the culverts is controlled with slide or flap gates. Slide gates are located in riser pipes near the top of the levees; therefore, the gates can be accessed during high-water conditions. Flap gates are attached to culvert ends on the water side of the levees.
4.2.5 Merced Streams Group Improvement of the MSG was authorized by the Flood Control Act of 1944 (PL 78-534, 78th Congress) as part of the comprehensive plan for flood control for the Sacramento and San Joaquin River Basins. The authorization was based on United States House Document 473 (78th Congress). Section 12650 of the California Water Code provides the State authorization for the improvement project. The project consisted of four flood control reservoirs on Burns, Bear, Owens, and Mariposa creeks and was completed in 1957. USACE maintains the facilities.
4-12 Upper San Joaquin River Regional Flood Management Plan

FLOOD MANAGEMENT
SPFC facilities include a diversion channel from Black Rascal Creek to Bear Creek, a diversion channel from Owens Creek to Mariposa Creek, levee improvements, and Castle Dam on Canal Creek. These facilities are maintained by the MSG.
An authorization provided for enlargement of the four original reservoirs, construction of three additional reservoirs (Castle, Haystack, and Marguerite), and channel improvements on Bear and Mariposa creek systems. These channel improvements included two diversions—Black Rascal Creek to Bear Creek (3,000 cfs capacity) and Owens Creek to Mariposa Creek (400 cfs). Reevaluation and technical studies later modified the design to include only the construction of Castle Reservoir and Haystack Reservoir, enlargement of Bear Reservoir, and about 33 miles of channel improvements along Bear Creek.
To date, the MSG project is mostly complete, but key features needed to protect downtown Merced have not been built as yet. These features include Haystack Dam, a dam on Black Rascal Creek, and levees along local creeks, including Black Rascal, Bear, Burns, Miles, Owens, and Mariposa creeks. USACE has studied feasible alternatives for flood control structures to address these issues. The MSG Feasibility Study is intended to evaluate options to increase the current level of flood protection along Black Rascal Creek and Bear Creek beyond a 50-year level. Congress has not appropriated funding for the MSG project since 2005. The MSG currently is working with DWR and the USACE to develop a joint project on Black Rascal Creek.
Channels, Floodways, and Project Levees SPFC project levees are on Owens and Black Rascal creeks in the USJR region. These facilities are maintained by Merced County. Owens Creek, with a design capacity of 2,000 cfs, enters the Eastside Bypass on the left bank. Levees on Owens Creek extend about 0.8 miles upstream from the bypass. SPFC facilities include a siphon structure, which diverts flows from Mariposa Creek to Owens Creek with a design capacity of 400 cfs, and 1.5 miles of levees on the left and right banks of Owens Creek. SPFC levees in the region consist of 1.6 miles along the right bank and 1.9 miles along the left bank of Black Rascal Creek.
The Black Rascal Diversion Channel is approximately 10,000 feet long with levees on both sides. It begins just north of Yosemite Avenue outside the city of Merced and discharges into Bear Creek south of Olive Avenue. The design capacity of the channel is 3,000 cfs. Black Rascal Creek is a tributary to Bear Creek at two different locations.
The Owens Creek Diversion Channel is approximately 8,900 feet long with levees on both sides and is located outside the city boundaries. It begins just north of Mission Avenue in the city of Merced and discharges into Mariposa Creek at the east side of Burchell Road. The design capacity of the channel is 400 cfs.
Other channelized creeks that make up the MSG project facilities include Miles Creek (1,000 cfs), Burns Creek (2,000 cfs), Bear Creek (2,000 to 7,000 cfs), Black Rascal Slough (3,900 cfs), Owens Creek (250 to 400 cfs), and Mariposa Creek (1,000 to 1,250 cfs).
Merced River Upstream of City of Merced
Upper San Joaquin River Regional Flood Management Plan 4-13

FLOOD MANAGEMENT
Dams Four detention dams are included in the MSG project. Burns Creek and Bear Creek dams each have two nongated culvert outlets rated at 1,800 cfs. Owens Creek dam has a single nongated culvert outlet rated at 185 cfs. Mariposa Creek dam has two nongated culvert outlets rated at 1,000 cfs.
Castle Dam, an SPFC facility completed in 1992, is located about 6 miles northeast of Merced on Canal Creek, a tributary of Black Rascal Creek. Castle Reservoir has 6,400 AF of flood storage. DWR and Merced County own Castle Dam, and it is operated and maintained by the Merced ID.
Irrigation and Drainage Structures Numerous irrigation and drainage structures exist, extending through the levees of the Black Rascal Creek and Owens Creek diversion channels. These structures are either inverted siphons that run under the channels or drainage inlets into the channels. Most of the siphons and drainage inlets are corrugated metal pipe, and most drainage inlets have flap gates on the water side of the levees to prevent flood flows from escaping the channel.
4.2.6 Madera County Flood Facilities Madera County FCWCA is responsible for approximately 25 miles of SPFC levees in the USJR region. These levees are along Ash Slough upstream of the Ash Slough drop structure and on the Fresno River upstream of the confluence with the bypass.
Channels, Floodways, and Levees The Fresno River enters the bypass system at the downstream end of the Chowchilla Canal Bypass. The facilities on the river include an excavated trapezoidal channel with levees on both banks for a realigned Fresno River and a diversion weir. The channel has a design capacity of 5,000 cfs and the levees are each about 18.3 miles long. The Fresno River Diversion Weir provides for release of flows for riparian water users along the right and left banks of the river. The facilities are intended to reduce flood risk to adjacent agricultural land and the City of Madera, and are maintained by the Madera County FCWCA in cooperation with Madera ID.
Berenda Slough is a distributary channel that enters the Eastside Bypass downstream of the Fresno River. The published design capacity of Berenda Slough at its confluence with the Eastside Bypass (where it enters the planning area south of 17-1/2 Avenue) is 2,000 cfs. The project levees are approximately 1.7 miles long on the right bank and 2.5 miles long on the left bank.
Upstream Project Facilities Weir structures exist where Berenda and Ash sloughs split and the Chowchilla River is diverted. These structures are operated and maintained by Chowchilla WD. In addition, weirs and diversion gate structures are operated and maintained by Madera ID. These structures are located south of the city of Chowchilla and upstream of the planning area, but their operation could affect flood flows that enter the planning area and the bypass. The flow capacity of the upper Chowchilla River is rated 20,000 cfs, but the flow is diverted into Ash Slough east of Chowchilla, so the capacity rating is only about 75 cfs as it enters the planning area.
Ash Slough at Eastside Bypass
4-14 Upper San Joaquin River Regional Flood Management Plan

FLOOD MANAGEMENT
The right-bank levee is about 1.9 miles long, and the left-bank levee is about 2.7 miles long. A diversion dam on Berenda Slough sends excess flows through a diversion channel to Ash Slough. Several other flow diversions move water between streams. The facilities are intended to reduce flood risk to adjacent agricultural land and the City of Chowchilla, and are maintained by Madera County.
Ash Slough is a distributary channel that enters the bypass system of the Chowchilla River. The design capacity of Ash Slough at its confluence with the Eastside Bypass is 5,000 cfs. The right-bank levee is about 2.7 miles long and the left-bank levee is about 2.3 miles long. Four drop structures help control the channel grade. Ash Slough is maintained by Madera County FCWCA upstream of the Ash Slough Drop Structure and by the LSJLD downstream of the Ash Slough drop structure.
Upstream Facilities Upstream facilities include Hidden Dam and Buchanan Dam. Hidden Dam, constructed on the Fresno River in 1975, and Buchanan Dam, constructed on the Chowchilla River in 1975, reduce flood flows entering the San Joaquin River. USACE owns Buchanan Dam, which has a capacity of 150,000 AF. USACE also owns Hidden Dam, which has a capacity of 90,000 AF.
4.3 Local Agency Flood Management Operations and Maintenance
This portion of the report focuses on O&M in the USJR region. Most of the information in this section focuses on the LSJLD facilities because a majority of infrastructure and levees exist within the LSJLD boundaries; however, information about portions of MSG and Madera County FCWCA facilities within the region also are included. In addition, O&M issues upstream of the USJR region are included to provide context for how these issues might impact flood operations. Also, some areas of the region have nonproject levees, including much of the levee system along the San Joaquin River from the Bifurcation Structure east of Mendota to a point about 2 miles south of the Mariposa Bypass Channel. As such, the maintenance of these facilities is often limited and not conducted at regular intervals. Other agencies responsible for O&M of flood facilities that are entirely outside the planning area, although they release flow into project facilities, include KRCD (and associated Kings River districts), Chowchilla WD, and Madera ID.
Typical operational activities that are performed by the agencies identified above include coordination with the DWR Flood Operations Center (FOC), patrols of the flood facilities, and flood fighting during periods of flood danger. Maintenance activities include periodic inspections of all project facilities; herbicide spraying in the floodways; removal of vegetation, trash, debris, and sediment from the floodways and structures; repair of damaged or deteriorated project facilities; and control or extermination of burrowing animals in levees and embankments. Other responsibilities include review of encroachment applications for improvements within project easements, regulation of unauthorized encroachments, coordination of private livestock grazing on project easements, and maintaining records of the project drawings, inspections, and repairs.
4.3.1 Lower San Joaquin Levee District In 1958, the LSJLD agreed to operate and maintain the SJRFCP after its completion in 1966. The LSJLD is responsible for the O&M of the project, including all levees, channels, and control structures. The project is located within the LSJLD boundaries in the counties of Merced, Madera, and Fresno.
Upper San Joaquin River Regional Flood Management Plan 4-15

FLOOD MANAGEMENT
Operations Flood season, as defined in the SJRFCP O&M manual, is from November 15 to June 15 of each year. In the early part of this season, the San Joaquin Valley can be threatened by rain-flood runoff (Reclamation Board, 1978). In the latter part of the season, there can be a threat of flooding from snowmelt runoff. High water is defined as flow that overflows the low-water channel and comes in contact with the levee. There are also specific staff gauge readings at the Eastside Bypass near El Nido and at the San Joaquin River near Newman that indicate a high-water condition.
The joint Federal-State river forecasters of the FOC in Sacramento closely follow storm and snowmelt runoff events in the Central Valley. Flows are monitored from Pine Flat Dam on the Kings River, Friant Dam on the San Joaquin River, Big Dry Creek Reservoir and Diversion Channel, Fresno and Chowchilla rivers, MSG reservoirs (Burns, Bear, Owens and Mariposa creeks), New Exchequer Dam on the Merced River, and other miscellaneous local streams. Forecasts of significant runoff, including a weather summary and other data pertinent to the situation, are issued to the LSJLD. After the initial notification from the FOC, it is the responsibility of LSJLD to keep itself informed of river and weather conditions. The LSJLD maintains daily communication with the FOC during flood events.
During high-water periods, the LSJLD patrols the project levees continuously to locate possible sand boils or unusual wetness on the landward slope of the levees, slides or sloughs, wave wash or scouring, overtopping, debris jams, or other conditions that might endanger the levees. Seven LSJLD staff members are available for patrolling. Each patrol vehicle has one person driving and one person observing the flood conditions. When a flood event begins, it is not uncommon for patrollers to work 20-hour shifts until the event becomes stabilized. LSJLD uses 12-hour patrol shifts that begin and end at 12 am and 12 pm. This allows patrollers to assess the conditions from both day and nighttime perspectives. During critical events staff from DWR, Reclamation, local counties, landowners and irrigation districts can be used for additional patrols. Irrigation district staff are typically available for patrolling and flood fighting during nonirrigation winter periods, but they might not be available during snowmelt flood events, which can occur during the irrigation season. DWR, Reclamation, and local county participation is governed by available funding.
Advanced measures are taken to ensure the availability of adequate labor and materials to make repairs or otherwise mitigate conditions that threaten the levees. Prior to an anticipated flood event, trailers with sandbags, rubble, and other levee repair materials are staged at key locations within areas of concern. Before each flood season, irrigation and drainage structures are inspected for debris that might prevent gates from closing, and gates and valves are closed to prevent the escape of floodwater from the channels. Wooden guardrails on private-access bridges are removed during flood season to provide unimpeded flow of water across low bridges.
There are specific protocols in the SJRFCP O&M manual for operation of the primary gate structures at the Chowchilla Bifurcation Structure and the Mariposa Bypass (Reclamation Board, 1978). The procedures are dependent upon upstream reservoir releases, water levels, and whether water levels are rising or falling. The sequence in which individual gate bays are to be opened or closed and the rates of opening or closure are specified. Should the flows exceed the specified rates at the control structures, in conjunction with Kings River flows, the LSJLD will operate the control structures at its own discretion with the objective of minimizing damage to the flood project and protected area. Manual operation procedures are preferred due to issues with the originally installed automatic systems, which are outdated and malfunctioning.
Flood operations per the O&M manual have been affected by subsidence and aggradation of the system that have reduced the capacity of the channels to convey published design flows during flood events. A
4-16 Upper San Joaquin River Regional Flood Management Plan

FLOOD MANAGEMENT
recent DWR study estimated that the Eastside Bypass would experience a reduction in freeboard of up to 1.5 feet between 2011 and 2016 if current trends continue. This would cause a reduction in capacity of up to 25 percent, but would be variable based on location. Continued subsidence along the bypass would have significant impacts on future flood management operations.
Flood fighting operations include placing sandbags and other levee repair materials to reduce or eliminate boils, increase levee freeboard, and minimize erosion. LSJLD staff members perform such operations themselves or direct the use of equipment and manpower provided by State and local agencies. Following a declared flood event, FEMA, California Office of Emergency Services (OES), and USACE have programs available to reimburse LSJLD for flood fighting expenses and the repair of specific damages to the facilities resulting from flood flows.
Maintenance The SJRFCP is inspected every 90 days. DWR makes two inspections (spring and fall), and the LSJLD makes two inspections (summer and winter). Inspections are to confirm the following:
• Brush, trees, and wild growth other than sod are removed from the levee crown and slopes.
• Burrowing animals are exterminated or otherwise controlled.
• Damage to the levees such as caves, sloughs, burrows, holes, or slips are repaired.
• No revetment work or riprap slope protection is displaced.
• The crown of the levee is well shaped.
• Floodway channels are clear of debris and wild vegetation growth (except for authorized plantings in the CDFW pilot reach).
• Channel capacity is not reduced by excessive formation of shoals.
• Sufficient space is available in the sediment basin.
• Unauthorized vehicular travel on the project facilities is restricted.
• Livestock grazing is being appropriately managed.
• No unauthorized encroachments or structures are present on the project easements
• Control structures, bridges, irrigation and drainage structures, hydrologic facilities, fences and gates are undamaged, in good working condition, and free of debris.
In recent years, USACE has also made inspections of the project and issued notifications of facilities not in conformance with current USACE standards. Under USACE standards, certain project facilities are rated as “unacceptable” until remediation is completed. LSJLD must respond to these inspections or USACE, through noncompliance with the USACE RIP for eligibility for PL 84-99 assistance, will not provide support for future repairs of the project following flood events. Inspections of culverts that pass through project levees is a requirement of that compliance, but can only be accomplished through possible video surveillance.
Typical levee repairs include scarifying the surface and placing compacted layers of suitable fill material to restore the original cross section. Patrol roads must be usable for all-weather access, so approximately 5 miles of roads are resurfaced with gravel annually within the LSJLD budget.
Upper San Joaquin River Regional Flood Management Plan 4-17

FLOOD MANAGEMENT
Channels are to be kept clear of regrowth vegetation that can change flood flow characteristics. According to the O&M manual, channels are to be maintained in a condition similar to when the project was constructed (Reclamation Board, 1978). Regrowth is primarily controlled by herbicide spraying. Shoaling or aggradation at inlets and outlets of side drainage structures is removed so the drains function properly. Eroded riprap material is replaced for slope protection and at critical points of channel stabilization. Sediment is periodically removed from the sediment basin, and the basin is regraded to the approximate original lines and grade.
Maintenance and repairs to structures include replacement of broken or missing gate parts, lubrication of moving gate parts, repair of protective coatings on metal, and repair of eroded structural concrete or structure settlement. Prior to flood season each year, an electrician from LSJLD checks the electrical systems of the gate hoists in the primary control structures. The backup electrical generators at these structures are started to confirm that they are operational. Rusty areas on the control gates are repaired instead of sand blasting and recoating because new coatings do not bond to the metal as well as the original coatings. LSJLD, Madera County, and Merced County share responsibilities for maintenance of bridges that cross the project. The LSJLD maintains the substructure, water-side approach embankments, and riprap embankment slope protection. The counties are generally responsible for maintaining roadway surfaces, bridge superstructures (including the deck, roadway, and guardrails), signage, and traffic control.
Enhanced Operations and Maintenance This subsection summarizes difficulties that LSJLD has implementing its O&M obligations, methods it has used to improve O&M, and improvements that could be made to enhance existing O&M.
The LSJLD service area is large relative to other special districts, and its facilities are inspected, maintained, and patrolled by a small staff of employees. LSJLD's only source of revenue for general operating expenses is through benefit assessments on the lands within the LSJLD boundary. Lands within its jurisdiction are being acquired by State and Federal agencies for wildlife refuges and other purposes, which exempt the areas from property assessments. LSJLD operating expenses are increasing with typical inflation indices while their revenue base shrinks. LSJLD's limited staffing and financial resources are currently not sufficient to reliably meet its statutory obligations to the State.
USACE has recently begun making inspections of the LSJLD project and has issued notices of violation for facilities not conforming to USACE RIP standards. If LSJLD does not respond to these notices, it will be denied assistance from USACE to repair damage from future flood events. Failure to repair future flood damage will accelerate aging of the SJRFCP project and result in further reduction of performance.
DWR has requested video inspections of culverts that pass through project levees. Routine inspections by the LSJLD and DWR have identified numerous levee sections in need of repair. Land-side slopes lack stabilizing vegetation in some areas. Also, the right-of-way fences near the outside toe of the levees limit the work space available to replace eroded material and seed the slopes.
LSJLD is currently able to resurface with gravel about 5 miles of levee patrol roads each year. Resurfacing of patrol roads is done in accordance with the O&M manual, but with 195 miles of levees to maintain, a given section of patrol road might not be resurfaced for about 40 years.
Sediment is periodically removed from designated and other sediment-collection areas in the channels, but much more sediment removal is needed. The material is essentially pure sand with little cohesion, so it has limited market value. There is limited demand for the material to provide dust control. As such, LSJLD
4-18 Upper San Joaquin River Regional Flood Management Plan

FLOOD MANAGEMENT
typically, along with assistance from landowners, WDs, local public agencies and contractors, bears the cost of excavating, hauling, and disposing of the material.
Recent regulations for spraying herbicides in wet environments have severely limited the ability of the LSJLD to control vegetation growth inside project levees since the initiation of interim restoration flows. Employing a permanent herbicide consultant to complete the necessary permitting paperwork and direct the spraying operations would alleviate the difficulty, but it would be very expensive.
LSJLD currently uses bait stations for rodent control. Traps do not work well and require more attention from the staff. With additional manpower and equipment, a grout rig could be used to regularly fill rodent holes in levees with bentonite cement, which would greatly reduce rodent damage to levees. Alternatively, LSJLD could contract to others a grout rig program.
LSJLD needs additional financial resources to accomplish the following:
• Bring the project into conformance with current USACE standards • Perform video inspections of culverts that pass through project levees • Secure temporary construction easements to repair and stabilize land-side levee erosion • Regularly resurface levee patrol roads • Sufficiently remove and dispose of sediment deposited in the floodways • Hire an herbicide consultant for vegetation control • Implement a grout rig program to fill rodent holes in levees
LSJLD has also identified a number of infrastructure improvements that would enhance its O&M, which are summarized as follows:
• The electrical controls and water level sensors for the primary control structures were installed in the 1960s with the original project. They are out of date and should be modernized for improved reliability and integration with a new supervisory control and data acquisition (SCADA) system.
• The control structure at the headworks of the Chowchilla Canal Bypass should be enlarged with two additional gate bays to increase operational flexibility to control flows into the bypass channel. Settlement has occurred at the San Joaquin River Control Structure, resulting in the wing walls separating from the structure. The joint has been temporarily filled, but it continues to widen. The wing wall backfill could be excavated and voids grouted under the spread footings, or spread footings could be added or enlarged to minimize further settlement. Erosion of the structural concrete is minimal, and no repairs of this type are currently needed.
• The existing Bear Creek diversion weir was built in the 1960s with the original project. The structure invert is higher than the upstream channel invert, which constrains Bear Creek flood flows entering the Eastside Bypass and causes upstream ponding on Bear Creek. Flows migrate around the project levee and flood the land side of the project levee. Modifying the structure to minimize the flow restriction and adding spills through the project levees on each side of the Eastside Canal siphon would allow ponded water to drain into Bear Creek and then flow to the Eastside Bypass.
• Currently, project levees are breached at Unit 1(RM 9.90) and at Unit 5 (RM 0.25). Recent USACE inspections rated the levee units as unacceptable and suggested that new structures be installed to allow the project to operate as intended. The new structures would include flashboards to prevent floodwater from escaping the project floodway, but the flashboards could be manually removed to allow flooding on the land side of the levees to drain into the river channel.
Upper San Joaquin River Regional Flood Management Plan 4-19

FLOOD MANAGEMENT
• The right bank of levee Units 5, 7, 8, 9, and 10 were constructed as much as 2 feet higher than the left bank levees. As such, these reaches do not have the design freeboard as documented in the O&M manual (Reclamation Board, 1978). The left bank levees should be raised to the same elevation as the right bank levees.
• LSJLD, along with other local, State, and Federal agencies, is concerned about the impacts land subsidence is having on its project facilities. Recent Reclamation surveys indicate that subsidence has a rate of more than 0.75 foot per year (Reclamation, 2014b). It may no longer be possible to convey the same level of flood flows that were conveyed through the system just a few years ago without encroaching on the design freeboard of levees and structures. This not only will reduce the level of protection for lands within the planning area, but also will limit the capacity to convey flood flows upstream of the planning area, which in turn will reduce protection for those lands. Mitigation of subsidence impacts could be a costly undertaking involving major upgrades or replacement of project facilities.
4.3.2 Merced Streams Group The MSG does not maintain a regular staff. Its facilities are maintained by Merced County, the City of Merced, and Merced ID. These three agencies share the cost of O&M equally, and the combined resources they provide are typically sufficient for required O&M. Currently, no formal (written) agreement exists between the agencies but the agencies are considering formation of a joint powers authority.
MSG's flood facilities include detention dams, channelized streams, and levees on the Bear Creek system with its tributaries, Black Rascal Creek, Fahrens Creek, and Burns Creek, as well as the Mariposa Creek system with its tributaries, Miles and Owens creeks. Most of the project facilities were constructed by USACE in the 1950s, and USACE operates the reservoirs. Castle Reservoir was built in the 1990s and is operated by MSG. The original project facilities were designed to protect about 136,000 acres of agricultural land, the city of Merced, and communities of Planada and Le Grand.
The MSG system is incomplete; consequently, the city of Merced is not protected from flooding along Black Rascal Creek. A detention reservoir (Haystack Reservoir) is needed on Black Rascal Creek upstream of Merced, but the project has been delayed due to environmental concerns at the reservoir site. The project would provide 200-year flood protection for Merced. The latest cost estimate of the Haystack Reservoir project is $35 million. MSG conducted a study for an alternative reservoir site that is downstream from the Haystack site; however, the new site includes almond orchards, the land value of which could make the alternative even more costly. Lack of funding has limited the implementation of studies that are necessary to mitigate the environmental concerns or identify another, more feasible, project site. MSG has applied for grant funds to complete the environmental studies and is working on potential project cost-sharing options with DWR and USACE.
Operations MSG monitors flood flows through the DWR website and notifies fire department officials if flood fighting is needed. Flood fighting operations include placing sandbags and other levee repair materials to reduce or eliminate boils, increase levee freeboard and minimize erosion. Merced ID staff and equipment typically are used for patrolling.
Reserve supplies of materials needed for flood emergencies are kept on hand at all times, including rock or other suitable protective materials staged at critical locations in the system.
4-20 Upper San Joaquin River Regional Flood Management Plan

FLOOD MANAGEMENT
Maintenance The MSG O&M Manual requires that inspections of the project facilities are to be made just before flood season (November 1 through May 1), at the beginning of the season, and at the end of flood season, as well as immediately after each high-water period, and otherwise at intervals not exceeding 90 days (USACE, 1984). Inspections of flood channels include a recorded assessment of vegetation growth, debris accumulation, new construction in the right-of-way, aggradation or degradation, riprap areas, and bridges. Inspections of levees confirm that no unusual settlement, sloughing, or loss of material has occurred, and no caving has occurred on either the land side or water side that might affect the stability of the levee. No seepage, saturated areas, or sand boils have occurred, and drains through the levees and appurtenant gates are in good working condition. In addition, no revetment work or riprap has been displaced; cattle guards and gates are in good condition; the crown of the levee and roadway, if any, are shaped well and drain readily; no unauthorized grazing or other encroachments to the right-of-way exist; and all burrowing animals have been exterminated.
Immediate steps are to be taken to correct dangerous conditions disclosed by inspections. Repairs are made to restore the project facilities to their original line and grade. Maintenance is done in a manner that minimizes adverse environmental impacts. Dead trees with wildlife value are retained, except where they constitute a hazard. Drains are kept open and unobstructed where shoaling or aggradation has occurred at inlets and outlets. Sediment, debris plugs, or other obstructions are removed from channels particularly at the mouth of tributary channels. Weeds and other vegetation in the channel are cut in advance of flood season and removed from the channels along with trash as funding allows. Rodent control measures are implemented at project levees. Eroded structural concrete is repaired, and major settlement, uplift, or failures of concrete structures are referred to the DWR for remedial measures. Damaged fencing and gates are repaired. Automatic drainage gates that become jammed with debris in the open position are cleared and verified to swing freely. Missing or broken parts are replaced.
Enhanced Operations and Maintenance The MSG has difficulties implementing its O&M obligations and improvements that are needed to enhance existing O&M of the project.
A major O&M limitation identified by MSG is its inability to effectively remove vegetation from floodways while remaining in compliance with its 2007 programmatic permitting agreement with the CDFW. Sediment, trash removal, and rodent control activities are permitted in dry season, but vegetation removal can be done only during limited periods when there is often runoff water in the channels. Downed trees can be removed in dry season. Trees larger than 3 inches in diameter that are removed must be replanted with saplings at a replacement ratio of 10 to 1. Only one bank of a given channel is permitted to be cleared during a maintenance cycle. Such limitations are in conflict with the MSG O&M manual; however, MSG elects to comply with the CDFW permit under the threat of possible fines or prosecution for noncompliance. Streamlining or rectifying obvious conflicts between O&M obligations and CDFW permitting would enhance MSG's O&M capabilities.
The most critical infrastructure improvement needed is the construction of a detention reservoir on Black Rascal Creek with project funding by USACE and DWR. MSG also indicated that a dry stockpile facility would improve O&M.
Upper San Joaquin River Regional Flood Management Plan 4-21

FLOOD MANAGEMENT
4.3.3 Madera County FCWCA Madera County FCWCA is responsible for O&M of the Fresno River, Berenda Slough, and Ash Slough, portions of which are within the SPFC planning area. The agency has a one-person staff with limited availability of County staff and equipment. The operating budget, which relies entirely upon property assessments, is limited for the scope of facilities to be maintained. The current annual budget is about $170,000 for removal of channel vegetation and flood fighting.
The only Madera County FCWCA SPFC facilities included in the USJR region are channels and levees for the farthest downstream reaches of Berenda Slough, Ash Slough, and Fresno River. Some of the Chowchilla River, which Madera County FCWCA also maintains, is within the USJR but does not include SPFC facilities.
Operations The Madera County FCWCA monitors flood flows primarily on the DWR website. Flood fighting consists of monitoring and maintaining levees by placing sandbags and other levee repair materials to reduce or eliminate boils, increase levee freeboard, and minimize erosion. Two Madera County staff members are generally dispatched to patrol the levees and look for sand boils during a flood event. An additional three staff members, for a maximum of five Madera County staff, can be called for flood fighting. If necessary, additional personnel from the Madera County's Probations Department can be used. Madera County FCWCA maintains stockpiles of materials for flood fighting at the Madera County's corporation yard. Drainage structures in the floodway levees are sometimes opened to intentionally flood adjacent lands, thereby avoiding a levee breach. Owners of these lands accept this practice. On the Fresno River, gates can be opened to allow adjacent flooded lands to drain to the river after the river level subsides.
Maintenance Inspections of the project facilities are made just before flood season (November 1 through April 15), at the beginning of the season, and at the end of flood season, as well as immediately after each high-water period, and otherwise at intervals not exceeding 90 days. Inspections of flood channels include a recorded assessment of vegetation growth, debris accumulation, aggradation or degradation, and riprap areas.
Inspections of levees confirm that:
• No unusual settlement, sloughing, or loss of material has occurred.
• No caving has occurred on either the land side or water side that might affect the stability of the levee.
• No seepage, saturated areas, or sand boils occurred.
• Drains through the levees and appurtenant gates are in good working condition.
• No revetment work or riprap has been displaced.
• Cattle guards and gates are in good condition.
• The crown of the levee and roadway are well shaped and readily drain.
• The levee patrol roads are accessible at all times for truck delivery of flood fighting materials.
• No unauthorized grazing or other encroachments to the right-of-way exist.
• All burrowing animals have been exterminated.
4-22 Upper San Joaquin River Regional Flood Management Plan

FLOOD MANAGEMENT
Immediate steps are taken to correct dangerous conditions disclosed by inspections. Repairs are made to restore the facilities to their original line and grade. Maintenance is done in a manner that minimizes adverse environmental impact. Dead trees with wildlife value are retained, except where they constitute a hazard to the project. Drains are kept open and unobstructed where shoaling or aggradation has occurred at inlets and outlets. Sediment, debris plugs, or other obstructions are removed from channels, particularly at the mouth of tributary channels. Weeds and other vegetation in the channel are cut in advance of flood season and removed from the channels along with trash. Rodent control measures are implemented at levees. Damaged fencing and gates are repaired. Automatic drainage gates that become jammed with debris in the open position are cleared so gates swing freely, and missing or broken parts are replaced.
Enhanced Operations and Maintenance The biggest maintenance challenges for Madera County FCWCA are removal of the aggressive arundo bamboo species and mitigating impacts of land subsidence. Primary O&M activities are mulching and spraying to eradicate bamboo growth. Historically, Madera County landscape maintenance staff assisted with vegetation removal; however, those staff positions were restructured in 2011 and since that time, little or no maintenance has been done. Madera County FCWCA is reviewing options to use outside contractors for this work. The Madera County Roads Department is responsible for maintaining road culverts and bridges at channel crossings. Often, the Madera County Roads Department will remove debris and vegetation approximately 100 feet upstream and downstream of the crossings, which assists the Madera County FCWCA.
Madera County FCWCA has similar permitting restrictions for vegetation removal as that described for MSG. Areas that are not within the SPFC levee units require onerous preliminary monitoring; therefore, those areas are not currently being maintained. A sediment removal project was recently suspended due to these restrictions.
The greatest need that Madera County FCWCA has in terms of improving its O&M is more funding. The funding could be used for the following:
• Purchasing mowing equipment and hiring new staff to operate it would improve vegetation control in the flood channels.
• Hiring an herbicide applicator and purchasing a spray rig would reduce the amount of mowing needed and further reduce regrowth.
• Implementing a more aggressive rodent control program is needed. Currently, only a few bait stations are being used. More staff and funding would improve the program.
• Renting a grout rig and finding staff to operate it could help to regularly fill rodent holes in levees with bentonite cement and reduce rodent damage to levees.
4.3.4 Fresno Slough Improvement Group The Kings River system is connected to the San Joaquin River by the James Bypass Channel and Fresno Slough. Several miles of nonproject flood protection levees are along Fresno Slough, south of Highway 180, within the SPFC planning area. Eight local agencies, as identified previously, formed the Fresno Slough Improvement Group to coordinate better O&M of these nonproject levees.
Reclamation District 1606 is responsible for O&M of the levees along the James Bypass from Highway 180 to the railroad crossing where the James Bypass flows into Fresno Slough. Fresno Slough and the associated levees from Highway 180 to the railroad crossing are within the SPFC planning area. The levees
Upper San Joaquin River Regional Flood Management Plan 4-23

FLOOD MANAGEMENT
are nonproject and generally in poor condition. The levee crowns are too low in areas, the levees were constructed of unsuitable materials, and there is cracking and settlement. In recent years, a levee failure occurred at one location. During the 2006 flood event, levee breaches occurred, which caused flooding of private lands west of the railroad crossing. Adjacent landowners have open drains at the toe of the levees to intercept seepage. The drains promote underflow and sloughing of the land-side levee slopes, making levees unstable and vulnerable to failure.
Vegetation removal is not a significant issue in this reach of Fresno Slough and would most likely be infeasible near or within the Mendota Wildlife Refuge or other habitat areas. Sediment buildup downstream of the reach, north of Highway 180, has been problematic. In 2011, sediment was removed near a levee failure area during a maintenance dewatering of Mendota Pool. This project was successfully undertaken by several of the Fresno Slough Improvement Group agencies. Tranquillity ID, Fresno Slough WD, and James ID provided labor and equipment forces. KRCD completed applications and acquired environmental permitting. The SJRECWA coordinated lowering of the water level in the Mendota Pool.
Group members have suggested drafting written agreements among the members to implement future improvement projects. The scope of the projects and the agencies that would need to be involved vary, depending on whether the location is in or out of the Wildlife Refuge or other sensitive habitat areas. The Fresno Slough Improvement Group identified the following O&M improvement projects, but have not determined a source of funding and/or a group of stakeholders to implement the work.
• Levee Improvements – Improve the south levee, which has open toe drains and inadequate freeboard. Improvements might include removing the toe drains, rebuilding the levees, and bringing the levees under the jurisdiction of a responsible stakeholder.
• Sediment Removal – Remove sediment from Fresno Slough both inside and outside the Wildlife Refuge. It is uncertain, but probable, that permits are required to do this work. It would be easier and less costly if the work could be done at the same time that the Mendota Pool is dewatered for maintenance.
• Floodplain Enhancements – Enhancements include the modification of existing levees surrounding a State-owned parcel of land. The levee modifications would improve flow over the land and reduce pressure on other nearby levees during flood events. The current configuration of levees concentrates channel flow and increases the pressure at a weak point of the nearby levees.
Also, Kings River agencies, KRCD in particular, want to promote levee improvements in the cities of Mendota and Firebaugh so upstream Kings River capacities can be maintained.
4.3.5 Nonproject Facilities Other public and private nonproject levees are along the San Joaquin River and its tributaries. These levees may be located on private land or on land owned by other State, Federal, and local agencies, and the levees work in conjunction with SPFC facilities. For example, CCID owns and operates Mendota Dam and maintains canal banks along the San Joaquin River. Nonproject levees along portions of the San Joaquin River begin in Reach 2B below the Chowchilla Bifurcation Structure and continue north of Highway 152. There are 1.6 miles (left bank) and 2.2 miles (right bank) of Lower San Joaquin River Flood Control Project levees along the San Joaquin River south of the Sand Slough Control Structure.
River flows at this location are typically diverted into the Eastside Bypass. The San Joaquin River Structure includes slide gates in the left bank levee of the river that can divert flow into San Joaquin River Reach 4B, which continues northwesterly from the Sand Slough. This reach is currently unsuitable for flow due to 4-24 Upper San Joaquin River Regional Flood Management Plan

FLOOD MANAGEMENT
heavy sedimentation and vegetation growth in the channel. There are private levees along River Reach 4B to a point approximately 3 miles south of the Mariposa Bypass channel. This channel is assigned a published design flow capacity of 1,500 cfs, but there is no SJRFCP documentation to substantiate this value. There is also no assigned levee freeboard above the water surface elevation for this reach. Flows that were diverted into this reach in the past caused major flood damages to adjacent properties due to significant seepage problems. Therefore, flood flows have not been diverted into this reach since the early 1970s.
Because no public agencies are responsible for the O&M of nonproject levees on private lands along the river, their condition is generally uncertain. Fresno County staff indicated that nonproject levees along the river north of Mendota Pool might be repaired at times by local irrigation districts such as Firebaugh Canal WD and CCID. CCID's Poso and Riverside canals run directly adjacent to the left bank of the San Joaquin River from Firebaugh to the SPFC project levees south of the Sand Slough Control Structure. The left bank of the river is common to the right bank of these canals; therefore, CCID is maintaining the left-bank levee along this 20-mile-plus reach of the river. DWR and LSJLD have documented and reviewed San Joaquin River levee sloughing and erosion along the river by the city of Firebaugh.
Conditions of the nonproject levees along Fresno Slough, south of Highway 180, are described under the subsection for the Fresno Slough Improvement Group.
Improving the O&M of nonproject levees in poor condition, and more specifically, implementing regular inspection and maintenance of the levees, may require bringing them under the jurisdiction of one or more public agencies as has been suggested by the Fresno Slough Improvement Group. This would be a costly endeavor in terms of acquiring easements, environmental permitting, and the construction necessary to bring the levees into conformance with acceptable minimum standards.
4.3.6 Agencies with O&M Responsibility for Upstream Flood Facilities As noted previously, there are upstream facilities and local agencies responsible for the O&M that are not within the SPFC planning area. KRCD, Tranquillity ID, and Reclamation District 1606 operate and maintain levees along the Kings River system, including the James Bypass. Chowchilla WD and Madera ID are responsible for O&M of weir structures east of Chowchilla, which divert and control flood flows in the Chowchilla River, Berenda Slough, and Ash Slough. The Madera County FCWCA has written agreements with these agencies for the O&M of these structures, which are critical in managing downstream flood flows. O&M activities by Kings River agencies, Chowchilla WD, and Madera ID can impact flood facilities within the planning area. Conversely, O&M activities within the planning area can affect the ability to convey upstream flood flows from the Kings River system.
4.4 Emergency Management Unlike most other natural disasters, such as earthquakes, which usually strike without warning, proper planning and preparation can prevent flooding or greatly reduce flood damage, except for events that exceed flood system capabilities. The time to prepare for a flood event is not when it begins to rain but before the storm season begins.
All levels of government share responsibility for emergency management preparation and flood fighting. Local government agencies (including special districts), State agencies, and Federal agencies have specific responsibilities prior to and during a flood fight. There are a number of potential causes of flooding, including a heavy rainfall event that causes snowmelt, overflow of a natural waterway, rising lake waters,
Upper San Joaquin River Regional Flood Management Plan 4-25

FLOOD MANAGEMENT
dam overtopping or failure, levee breach or failure, or other circumstances. Flood watch operations begin when a flood is forecast and water reaches the levee toe. Actual flood fighting is initiated when a threat to life and/or property exists. This section of the report will provide an overview of emergency management, and how emergency management is handled in the USJR region.
Emergency response to flood threats will be conducted using the SEMS. SEMS is designed to standardize response to emergencies involving multiple jurisdictions or multiple agencies. SEMS is flexible and adaptable to the needs of all emergency responders in California. SEMS requires emergency response agencies to use basic principles and components of emergency management, and includes the Incident Command System, mutual aid, multi/interagency coordination, and the Operational Area concept.
4.4.1 What is Flood Emergency Management? Flood emergency management is the practice of dealing with and avoiding flood risk. It consists of three primary components—
• Readiness: preparing for floods before an event occurs • Response: knowing who will respond to a flood event and what will be done • Recovery: taking actions to return communities and flood management systems to preflood
conditions
In the USJR region, the detail and complexity of each of these components changes by agency.
Flood readiness activities include planning, training, monitoring, and initiating flood fighting activities associated with preparing for a flood. Planning activities include preparation of service support plans, operating procedures, and checklists detailing the use and disposition of resources in a flood emergency. Such plans and procedures include coordination and communication lines with counterpart organizations of other departments and jurisdictions. Training includes individual flood fight drills and online exercises, as well as agencywide, countywide, regionwide, or statewide emergency management exercises. These large-scale exercises are developed to test flood fighting protocols and find potential deficiencies. Monitoring activities include tracking and updating the status of weather and riverine conditions that could result in a flood, such as continuing and excessive rainfall, an unusually rapid snowmelt, or rising rivers. The last part of flood readiness is moving from preparedness to response. This occurs when it is clear that flood conditions will occur (DWR, 2011b).
4.4.2 Why Is Emergency Management Planning Important? Emergency management planning is important because areas adjacent to rivers, sloughs, creeks, and drainage canals, as well as other low-lying areas, are subject to flooding that puts life, property, agriculture, natural resources, and the State’s economy at risk. The purpose of an emergency management plan is to provide information, policies, and procedures that will guide and assist agencies to efficiently deal with flood emergencies. An emergency management plan addresses flood preparedness, levee patrol, flood fight, floodwater removal, and other related subjects.
4-26 Upper San Joaquin River Regional Flood Management Plan

FLOOD MANAGEMENT
Emergency planning is also important because of the historical nature of flooding in the USJR region dating to the 1800s. Since 1950, there have been at least 25 flood events in the USJR region. Potential impacts of flooding include loss of life, loss of agricultural production, and degradation of natural ecosystems and infrastructure, as well as economic impacts. Even with development of significant flood infrastructure (including dams, bypasses, and levees) that provide risk reduction, the flood events of 1986, 1995, 1997, 1998, and 2006 demonstrated that a significant flood threat still exists in the region. The USJR region is vulnerable to a number of flood hazard types as described in Section 4.0. Another concern of flood emergency managers is protecting critical facilities such as hospitals, schools, police stations, fire stations, bridges, and airports that are located in or near floodplains. Figure 4-1 shows the location of critical infrastructure within the floodplain, including hospitals, schools, and police and fire stations in the USJR region.
Historically, levee breaches in the USJR region have occurred in the areas upstream and downstream of the Chowchilla Bifurcation Structure. In 1997, 14 levee breaches occurred along the San Joaquin River between Gravelly Ford and the Chowchilla Bypass, inundating agricultural lands north and south of the river. Levee breaches in this area have often worked to reduce flooding downstream, which reduces the potential for breaches in the Firebaugh area.
Future flooding in the USJR region could be exacerbated by continuing problems with levee stability, seepage, and subsidence issues. These issues make monitoring fluctuations in water surface elevations, seepage, and slope stability paramount during flood conditions. This is particularly important because, although LMAs have kept the flood management system functional, most of these systems have lost conveyance capacity due to sedimentation and vegetation growth and do not currently meet the original published design flow capacities. Many systems are in need of both capital improvements and enhanced O&M activities.
A majority of levees in the USJR region were constructed of a combination of native materials built on top of native ground, including sand, making the levees and their foundations porous in nature. This has resulted in unstable levee slopes, seepage of water through levees and foundations, and inability of existing levees to meet current design criteria. Water surface elevations that reach even the toe of the levee are a condition for concern. Flood flows increase the potential for levee instability, erosion, and seepage due to fluctuating water surface elevations and increased flow velocities that put levees under stress.
Levee stability problems are also the result of age with associated wear-and-tear of levee crowns and access roads, which are necessary for access for flood fighting.
In the USJR region, subsidence is a significant issue along 8 miles of the Eastside Bypass, in the Red Top area of Western Madera County, and along 6 miles of the Eastside Bypass north of Washington Avenue in Merced County, which increases the complexity of addressing emergency management in the region. Figure 4-2 indicates levee issues and problem areas, including subsidence, in the USJR region. Land subsidence reduces capacity in the system through channel sedimentation and lowering levee height and freeboard. Additionally, subsidence can increase the potential for flooding by increasing the land area exposure within the floodplain.
Upper San Joaquin River Regional Flood Management Plan 4-27

FLOOD MANAGEMENT
4.4.3 Flood Response This section outlines protocols, roles and responsibilities, and communications procedures during a flood response. The initial step in flood response is to implement the flood emergency management plan process, including the following (DWR, 2011b):
• Advise flood responders to activate resources and advise the County Office of Emergency Services (OES).
• Prepare to apply for and receive mutual aid where resources appear insufficient.
• Contact the OES to give available information regarding the kind of threat, its imminence, potential severity, area affected, and associated problems. Reports will include action being planned or taken and possible deficiencies in critical emergency resources.
• Should the possible or expected emergency develop, ensure that ALL alerted agencies are promptly notified of this new change in conditions. This might also prompt immediate public notification, as is required by the nature of the threat.
• Recommend that the Emergency Operation Center (EOC) be opened when projections clearly indicate a potential need for EOC multiagency coordination.
The nature of response operations is dependent upon the characteristics and requirements of the flooding situation. The emergency organization will be mobilized to cope with the specific situation. Specific flood response activities that occur during a flood include (DWR, 2011b):
• Survey and evaluate the emergency, and advise the responsible agencies. • Mobilize, allocate, and position personnel and materials for patrolling and flood fight. • Establish staging areas for personnel, supplies, and equipment. • Establish evacuation centers to aid in managing the movement of people from the area. • Initiate evacuation of livestock. • Produce and disseminate emergency information and advice to other EOCs when a Joint
Information Center is not operational. • Protect, control, and allocate vital resources. • Restore or activate essential facilities and systems.
Flood recovery activities have three major objectives (DWR, 2011b):
• Reinstatement of family autonomy and provision of essential public services • Permanent restoration of public property, along with reinstatement of public services • Performance of research to uncover residual hazards, to advance knowledge of disaster
phenomena, and to provide information to improve future flood operations
4-28 Upper San Joaquin River Regional Flood Management Plan

FLOOD MANAGEMENT
Figure 4-1. Existing Critical Facilities and Economic Assets
Upper San Joaquin River Regional Flood Management Plan 4-29

FLOOD MANAGEMENT
This page intentionally left blank.
4-30 Upper San Joaquin River Regional Flood Management Plan

FLOOD MANAGEMENT
Figure 4-2. Levee Issues and Problem Areas
Upper San Joaquin River Regional Flood Management Plan 4-31

FLOOD MANAGEMENT
This page intentionally left blank.
4-32 Upper San Joaquin River Regional Flood Management Plan

FLOOD MANAGEMENT
Specific activities associated with flood recovery include (DWR, 2011b):
• Removal of debris
• Clearance of roadways
• Demolition of unsafe structures
• Reestablishment of public services and utilities
• Provision of care and welfare for the affected population, including temporary housing for displaced persons
• Care of animals and disposal of carcasses (this has never occurred in the LSJLD)
Recovery efforts also may include coordination with State or Federal agencies to manage disaster recovery process including reimbursement. This usually occurs when a flood event is declared a State, Federal, or joint Federal/State disaster. Emergency recovery support is provided when the following steps occur (DWR, 2011b):
• If the county declares a disaster, the governor may support it by proclaiming a State of Emergency and then requesting the President make a National Disaster declaration for the affected area.
• If the President declares the area a national disaster, assistance from FEMA will be requested.
• If residential flooding occurs, regardless of the declaration, the USACE can provide Federal funds for recovery operations for up to 30 days following the incident.
• USACE assistance can also be requested to repair eroded and damaged levees following high flows. Request for this authority must be made in a timely manner (within 30 days).
4.4.4 Agency Roles and Responsibilities In the USJR region, the following agencies have responsibility for flood emergency management:
• State and Federal agencies • Several upstream agencies that control flows into the region • LMAs (LSJLD, MSG, and Madera County FCWCA) • Counties and Cities
Table 4-5 provides an overview by county of agency responsibility for flood emergency management.
State and Federal Agencies State agencies with responsibilities for flood management include DWR, Cal OES, California Department of Forestry and Fire Protection (Cal FIRE), and California Conservation Corps (CCC). Federal agencies with responsibilities for flood management include USACE, Reclamation, National Weather Service (NWS), USGS, and FEMA. These agencies have established the State-Federal FOC located in Sacramento, California. The FOC is a component of the DWR Division of Flood Management (DFM) Flood Operations Branch. The mission of the DWR DFM is to prevent loss of life, reduce property damage caused by floods, and assist in recovery efforts following any natural disaster. Year around, the FOC is the focal point for the gathering, analysis, and dissemination of flood- and water-related information to stakeholders. During emergencies, the FOC provides a facility from which DWR can centrally coordinate emergency response statewide.
Upper San Joaquin River Regional Flood Management Plan 4-33

FLOOD MANAGEMENT
California Department of Water Resources DWR has primary responsibility for flood emergency management in the State; thus, DWR is responsible for State flood management operations through the FOC, DFM, and other divisions, as well as its flood management and flood fight technical experts. DWR maximizes the State’s initial response by assisting local agencies technically first and then providing resources once an emergency occurs that overwhelms local resources and capabilities. DWR also operates the CDEC, which monitors rainfall, stream flow, river stages, and reservoir releases across the State.
California Emergency Management Agency Cal OES coordinates the emergency activities of all State agencies. When requested by a County, Cal EMA will direct (through the assignment of mission task numbers) those State agency resources necessary to support flood fight operations. Cal OES will request, as directed by the governor, a Presidential Emergency and/or a major disaster declaration. DWR representatives are dispatched as needed to the Cal OES Inland (Sacramento) Region, while Cal OES representatives are assigned to the FOC (DWR, 2012d).
California Department of Forestry and Fire Protection Cal FIRE provides many of the crews used in flood fight activities. Cal FIRE assists Cal EMA by setting up mobilization centers, mobile kitchens, and other facilities. Cal FIRE’s expertise in the Incident Command System is a valuable resource during flood emergencies (DWR, 2012d).
California Conservation Corps The CCC was created in 1976 and, since then, has assisted in every major flood fight in the State. The CCC provides personnel for flood fight crews and levee patrols during emergencies. Standby crews are frequently stationed near sites where problems are anticipated due to storm activity, high river stages, high tides, or large reservoir releases (DWR, 2012d).
United States Army Corps of Engineers PL 84-99 is a Federal law that gives USACE the legal authority to conduct emergency preparation, response, and recovery activities and to supplement local efforts in flood damage-reduction projects. USACE has a major responsibility for overseeing reservoir releases and supporting the State’s effort in maintaining the levees and structures associated with the SPFC. In instances when the nature of the disaster exceeds the capabilities of State and local interests, USACE could provide assistance under PL 84-99 to save human life, prevent immediate human suffering, or mitigate residential and commercial property damage. Assistance includes acquisition of flood fight materials, geotechnical evaluation of levees and other flood operations structures, contracts for emergency flood fight and temporary repairs, clearance of drainage channels or blocked structures, technical assistance for development of plans, and upon request, inspection of non-Federal dams and flood control projects. USACE also has jurisdiction over storage capacity that is seasonally reserved for flood control on most major reservoirs throughout the State.
4-34 Upper San Joaquin River Regional Flood Management Plan

FLOOD MANAGEMENT
Table 4-5. Agency Flood Emergency Management Responsibility by County
Pre-Flood Event
Community Outreach
Leads Development of Emergency Response Plan
Organizes and Communicates
with First Responders
Monitors Flows in
Rivers and Creeks
Sets Up Evacuation
Plan and Declares an Emergency
Distributes Information Through
Media, Emergency Alert System, or
Reverse 911
Stockpiles Sand and
Distributes Sandbags
Patrols Levees
Repairs, Leads and Executes
Post Flood Cleanup
Applies for Recovery
Plans
Fresno County
County P P P P P S S P
Sheriff S S P S
Fire Dept. S S S
Public Works S
USACE S
FEMA S
Levee District* S S S P P P P S
Cities S
LMAs S S S S S S
Madera County
County S S S S S S S
Sheriff P P P P P P P P
Fire Dept. S S S
Public Works S
USACE S
FEMA S
Levee District* S P P P P S
Cities S S
LMAs S S S S P S
Merced County
Sheriff S P P
Fire Dept. S S S P P
Public Works S S
USACE S
FEMA S
Levee District* S P P P P S
Upper San Joaquin River Regional Flood Management Plan 4-35

FLOOD MANAGEMENT
Table 4-5. Agency Flood Emergency Management Responsibility by County
Pre-Flood Event
Community Outreach
Leads Development of Emergency Response Plan
Organizes and Communicates
with First Responders
Monitors Flows in
Rivers and Creeks
Sets Up Evacuation
Plan and Declares an Emergency
Distributes Information Through
Media, Emergency Alert System, or
Reverse 911
Stockpiles Sand and
Distributes Sandbags
Patrols Levees
Repairs, Leads and Executes
Post Flood Cleanup
Applies for Recovery
Plans
Cities
LMAs S S S P S S
County P P S P S S S P
Notes: P = Primary or Lead agency S = Agency with secondary responsibility * = LSJLD is an LMA, responsible for a only small portion of Fresno County
4-36 Upper San Joaquin River Regional Flood Management Plan

FLOOD MANAGEMENT
United States Bureau of Reclamation Reclamation is primarily involved in the irrigation and hydropower purposes of its Federal water projects; many Reclamation reservoirs also provide flood control storage. In the Central Valley, such projects include Friant Dam on the San Joaquin River. CVP operations personnel participate in daily briefings, planning activities, and coordinated reservoir operations (DWR, 2012d).
National Weather Service The mission of the NWS Hydrologic Services Program is to (DWR, 2012d):
• Provide river and flood forecasts and warnings for the protection of lives and property.
• Provide basic hydrologic forecast information for the nation’s environmental and economic well-being. Eleven Weather Forecast Offices located in Medford, Oregon; Eureka, Reno, and Las Vegas, Nevada; Sacramento, Monterey, Hanford, Oxnard, and San Diego, California; Phoenix, Arizona; and the California-Nevada River Forecast Center accomplish this. Sacramento offices are co-located with the FOC at the Joint Operations Center (JOC).
United States Geological Survey USGS participates in a flood emergency by measuring, processing, and sharing streamflow data. USGS cooperates with DWR and NWS in establishing and maintaining telemetered stream gauges necessary for flood operations (DWR, 2012d).
Federal Emergency Management Agency FEMA participates in flood emergencies by providing training materials, flood insurance, and reimbursement for Federally declared disasters. FEMA also prepares flood-hazard maps to show the flood risk for communities, which helps inform communities about their risks.
Upstream Agencies In the USJR region, the timing and quantity of flood flows that enter the system are controlled by upstream agencies. Agencies operating upstream reservoirs that release flows into the USJR region include USACE and Reclamation. Friant Dam, which impounds Millerton Lake, on the San Joaquin River upstream of the region, is the largest contributor of flows to the region and is managed by Reclamation. When Millerton Lake reaches flood stage, water is released from Friant Dam, and that water travels downstream into the USJR region. When LMAs are notified of the release of flood flows, a limited amount of time (3 days) exists for final preparations to address these flood inflows by mobilizing flood watch crews and opening bypasses as necessary. Releases from Friant Dam are restricted to quantities that will not cause downstream flows to exceed, insofar as possible, the following criteria:
• 8,000 cfs between Friant and Little Dry Creek, which is computed as the sum of the flow at the USGS gauging station "San Joaquin River below Friant," the flow at the Reclamation Station "Little Dry Creek near Friant," and the flow into Little Dry Creek from Big Dry Creek Reservoir
• 4,750 cfs at the USGS gauging station "San Joaquin River near Mendota"
Although releases from Friant Dam, based on the O&M manual, are restricted to the quantities listed above, there have been greater flows released in the past. For example, a 60,000-cfs flow was released during 1997, which was estimated to be a 125-year event but later was downgraded to less than a 100-year event.
Upper San Joaquin River Regional Flood Management Plan 4-37

FLOOD MANAGEMENT
In the event that the reservoir level rises above elevation 578.0 feet at Friant Dam (top of spillway gates), operation of the Dam shall be adjusted according to the following criteria (USACE, 1965):
• Not exceed the criteria outlined above
• Not to cause the maximum release from the reservoir to exceed the estimated maximum flow that would have occurred under the conditions existing prior to the construction of the Dam (the natural flow)
Another upstream contributor of flows into the USJR region is the Kings River, which diverts flows to the San Joaquin River through the James Bypass at James Weir, located approximately 24 miles upstream of Mendota Pool. KRCD operates and maintains the Kings River Flood Control Project for the USACE; however, flood release decisions are made by USACE. During flood release events from Pine Flat Reservoir, the first 4,750 cfs are diverted north to the San Joaquin River. The next 3,250 cfs are diverted into the Tulare Lake basin. Flows beyond these two totals are split 50/50 between the two regions. Flows in the Kings River are diverted north at James Weir through James Bypass into the San Joaquin River. The conveyance of flood flows from Kings River has priority over the conveyance of flows from San Joaquin River. Figure 4-3 presents a map showing the location of these inflows.
USJR Region Local Maintaining Agencies Local agencies have primary authority for both maintenance of levees and flood fighting. Levee maintenance is provided by public levee districts, local government entities, and private levee land owners. LMAs in the region have no influence on diverted flows and must manage flood flows with a limited number of options. Currently, the LMAs do not have formalized flood safety or emergency management plans, or mutual aid agreements. LMAs include LSJLD, MSG, and Madera County FCWCA.
Lower San Joaquin Levee District The LSJLD was formed to operate, maintain, and repair levees, bypasses, and other facilities that were built in connection with the San Joaquin River Flood Control Project. Jurisdiction of the LSJLD includes SPFC levees and riverine sections of the San Joaquin River from Gravelly Ford to the confluence with the Merced River. LSJLD is the agency that is initially responsible for emergency management within its jurisdiction and has stockpiles of materials, as well as staff, to assist with flood fighting. In addition, the LSJLD office is often used during flood fighting as the incident command center when State assistance is requested.
Merced Streams Group MSG comprises resources from the Merced ID, Merced County Public Works, and the City of Merced. Currently, there is no memorandum of understanding between the agencies for emergency management activities. When a flood occurs, the City of Merced is responsible for flood emergency management within its jurisdiction and relies on the Merced ID for patrolling flood infrastructure. Merced County Public Works has limited stockpiles of sandbags available for its residents.
4-38 Upper San Joaquin River Regional Flood Management Plan

FLOOD MANAGEMENT
Figure 4-3. Location and Amount of Published Maximum Upstream Design Flow Capacity
Upper San Joaquin River Regional Flood Management Plan 4-39

FLOOD MANAGEMENT
This page intentionally left blank.
4-40 Upper San Joaquin River Regional Flood Management Plan

FLOOD MANAGEMENT
Madera County Flood Control and Water Conservation Agency The Madera County FCWCA was formed in 1969 by Madera County Flood Control Act 4525 to be responsible for flood control planning in the county. Madera County FCWCA is responsible for the maintenance of 75 miles of channels and 25 miles of SPFC levees on Ash Slough and Berenda Slough, and along the Fresno and Chowchilla river systems. Madera County FCWCA currently does not have sufficient staff and funding to adequately address flood control in the county or to provide flood fighting assistance; therefore, Madera County FCWCA uses the OES of both the county and State to perform flood fighting.
Counties Counties are typically responsible for flood management of facilities or systems in unincorporated areas of the county, as well as NPDES permits, emergency management, and participation in the NFIP. Madera, Merced, and Fresno counties have such responsibilities in the USJR region. Counties also are responsible for coordinating emergency management activities for a variety of disasters, including floods. The county sheriff and OES often have the primary responsibility for responding to flood emergencies and working with many response agencies, including DWR. These officials are responsible for preparing for, responding to, and recovering from flood events.
Cities Cities are responsible primarily for emergency management and O&M for flood management facilities within their jurisdiction, unless the facilities are maintained by another agency. The city of Merced and city of Firebaugh are two cities located within the floodplain in the USJR region. The City of Merced handles flood fighting activities within the city boundaries. Historically, flood fighting in the city of Firebaugh has been undertaken by DWR because the City does not have adequate resources. DWR has undertaken flood fighting on the nonproject levees adjacent to Firebaugh on the San Joaquin River, and the City takes care of the other flood fighting needs. DWR’s flood fighting is normally triggered by a request from an agency. The responsibility that lies with the State and LSJLD for O&M includes the San Joaquin River adjacent to the city of Firebaugh. The LSJLD has not been able to conduct O&M activities in the river channel for many years due to permitting issues and environmental restrictions, which hinder the ability of LSJLD to prepare for and respond to flood related emergencies in this section of the river. LSJLD O&M responsibilities do not include the nonproject levees adjacent to Firebaugh.
4.4.5 Emergency Management Planning Emergency management planning is an important part of every community's planning activities. Planning and preparing for flood events in the USJR region is crucial to its residents and businesses. Responsibilities are often divided between a variety of agencies that face a variety of challenges as the region continues to change and develop. This section is divided into the three primary components of emergency management—readiness, response, and recovery.
Upper San Joaquin River Regional Flood Management Plan 4-41

FLOOD MANAGEMENT
Flood Readiness State and Federal Agencies State and Federal agencies provide technical tools, expertise, and experience to help agencies at all levels prepare for and respond to flooding. Key tools include FEMA National Incident Management System (NIMS), DWR SEMS, weather forecasting, and stream gauge monitoring. These tools are used by local agencies, as well as State and Federal agencies, to manage flood events. Coordination of these efforts is accomplished via the State-Federal FOC.
NIMS identifies concepts and principles that answer how to manage emergencies from preparedness to recovery regardless of their cause, size, location, or complexity. NIMS provides a consistent, nationwide approach and vocabulary for multiple agencies or jurisdictions to work together to build, sustain, and deliver the core capabilities needed to achieve security. Consistent implementation of NIMS strategy provides a solid foundation across jurisdictions and disciplines to ensure effective and integrated preparedness, planning, and response. NIMS focuses on the following key components of emergency management:
• Preparedness • Communications and information management • Resource management • Command and management • Ongoing management and maintenance
These components link together and work in unison to form a larger comprehensive incident management system. In conjunction with NIMS, the State has developed SEMS and provides training on both systems.
SEMS is the cornerstone of California’s emergency response system and, as such, is the fundamental structure for the response phase of emergency management. SEMS is required by the California Emergency Services Act for managing multiagency and multijurisdictional responses to emergencies in California. The system unifies all elements of California’s emergency management community into a single integrated system with standardized key elements. SEMS incorporates the use of the Incident Command
System, California Disaster, and Civil Defense Master Mutual Aid Agreement, the Operational Area concept, and multiagency or interagency coordination. State agencies are required to use SEMS, and local government entities must use SEMS to be eligible for any reimbursement of response-related costs under the State’s disaster assistance programs.
In California, the State and Federal governments also serve an important service of coordinating flood emergency management for the SPFC along the San Joaquin River via
the State-Federal FOC. The FOC is operated year around and serves as a focal point for the gathering, analysis, and dissemination of flood- and water-related information to stakeholders. During emergencies, the FOC provides a facility from which DWR can centrally coordinate emergency response statewide. Several local, State, and Federal agencies work together at the FOC to coordinate flood fights, share resources, and provide a common communication platform. The FOC coordinates regionwide conference
4-42 Upper San Joaquin River Regional Flood Management Plan

FLOOD MANAGEMENT
calls during which information on flood flows, weather, and emergency operations are shared with stakeholders.
In preparation for a flood event, DWR places sandbags and other material in strategic positions around the State. DWR provides periodic flood training for local agencies and identifies local resources that are available on an as-needed basis in potential flood hazard zones. These resources can include supplies of rock and sand or heavy equipment that might be needed for flood fighting. In addition, DWR has access to additional manpower and equipment for use in flood fighting through contracts with private companies.
Upstream Agencies Upstream agencies, including Reclamation and KRCD, have a large role in flood operations and emergency management because those agencies are responsible for releasing flows before and during flood events. In preparation for flood events and releases, these agencies inspect and maintain their facilities. Aided by established management protocols, agencies collect data that are used to determine when releases are required. Such protocols are established in agency-specific O&M handbooks. When a flood is imminent, these agencies (and other agencies along the San Joaquin River) participate in coordination calls led by the FOC. These agencies impart information on downstream releases to provide warning time to prepare for flood conditions.
Local Maintaining Agencies LMAs have primary responsibility for flood preparedness activities; however, these agencies have limited funding and staffing capabilities and often reach out during flood events to County, State, and Federal agencies.
Lower San Joaquin Levee District Flood fighting and recovery are funded through the use of contingency funds in the LSJLD budget. These funds are set aside for use in the event of a major flood. In addition, LSJLD maintains stockpiles of flood fighting materials, including sandbags and other revetment materials. Prior to a flood event, trailers with sandbags, rubble, and other levee repair materials are staged at key locations within the LSJLD. Irrigation and drainage structures are inspected for debris that might prevent gates from closing, and gates and valves are closed to prevent the escape of floodwater from the channels. Wooden guardrails on private access bridges are removed during flood season to provide unimpeded flow of water across the low bridges. Smaller items, including burlap sandbags, sand, shovels, and other equipment and materials, are placed in strategic areas throughout the LSJLD. These materials are often co-located with materials from DWR. Historically, materials provided by DWR have not met the needs of the LSJLD, so materials are added to increase the amounts stockpiled. LSJLD usually adds three to four times the number of sandbags suggested.
LSJLD staff members throughout the year conduct other preparation activities by checking and maintaining machinery, and inspecting and repairing infrastructure located throughout the district. Generators are serviced and inspected, along with flood control structures. Many of these activities are performed based on historical information and experience. In addition to the positioning of materials beforehand, the LSJLD maintains a list of personnel to patrol more than 191 miles of levees that the LSJLD is responsible for during flood events. The personnel include those from local and State agencies, local landowners, State employees, and LSJLD employees.
Upper San Joaquin River Regional Flood Management Plan 4-43

FLOOD MANAGEMENT
Merced Streams Group MSG does not have any staff but relies on the staff of its member agencies. Emergency management planning is primarily handled by the County of Merced. Merced County Public Works provides administrative activities to the MSG and maintains flood stockpiles. Currently, Merced County Public Works stores sandbags at a Merced County facility that is not designed for this activity. Flood preparedness activities, including stockpiling of supplies and planning, are handled as part of the City of Merced emergency management program. In the City of Merced, localized flooding has been known to occur during heavy flood events. Some areas of particular concern are along city of Merced trails. Sandbags are used to control this localized flooding. In the past, flooding has threatened roadways in the region, and coordination with the California Department of Transportation (Caltrans) was initiated when needed to address the situation.
Outside the city of Merced, the Merced County Public Works and Merced ID work together to provide staff, materials, and stockpiling of materials. However, there is a need for additional planning and a permanent location to store flood fighting materials. Merced ID manages upstream facilities for MSG. Merced ID has responsibility for patrolling the levees during a flood event.
Madera County Flood Control and Water Conservation Agency In Madera County, flood preparedness activities are primarily handled by the county; however, the Madera County FCWCA has only a few staff members and limited resources for flood fighting. The Madera County FCWCA participates in regional flood meetings/calls and provides support for flood fight activities. Additional funding for the Madera County FCWCA is needed to provide more staff to assist with flood preparedness activities.
Counties Generally, each county has responsibility for emergency management activities within its jurisdiction. Their activities are summarized in Emergency Operation Plans (EOPs). EOPs provide a method for command and communication during any emergency, including floods. In addition, counties set up EOCs to improve communication between agencies, departments, and emergency workers. Appendix D provides a summary of key points of each county’s EOP.
Fresno County Fresno County is in the process of updating its Operational Area EOP. During floods, Fresno County activates the EOC, provides announcements via the internet about where sandbags can be obtained, and communicates with LMAs. Fresno County does not have the resources or expertise to fight floods and depends on DWR for assistance. Fresno County has approximately 20,000 sandbags on hand for distribution during flood events. Fresno County maintains flood fighting and recovery equipment in maintenance yards throughout the county, and has standing agreements with local vendors for equipment and materials that might be needed during a flood emergency. The County assists with flood issues in unincorporated areas of the county, as needed.
4-44 Upper San Joaquin River Regional Flood Management Plan

FLOOD MANAGEMENT
Madera County Madera County updated its EOP in 2010. The Madera County OES ensures that all emergency preparedness information from local, State, and Federal sources is available to the Operational Area Member Jurisdictions and the citizens of Madera County. The Madera County OES ensures that all emergency response personnel can demonstrate and maintain the minimum SEMS/NIMS performance objectives through incorporation of the objectives into emergency training exercises. The Madera County Operational Area OES informs County departments and Operational Areas of training opportunities associated with emergency management. Throughout Madera County, yard facilities for local fire stations, the road department, and public works department have been designated as drop sites for sand and sandbags during flood-condition weather.
Merced County Merced County updated its EOP in 2007, and the update to that plan is ongoing. The Merced County OES ensures that all emergency preparedness information from local, State, and Federal sources is available to the Operational Area Member Jurisdictions and the citizens of Merced County. The Merced County OES ensures that all emergency response personnel can demonstrate and maintain the minimum SEMS/NIMS performance objectives through incorporation of the objectives into emergency training exercises. Merced County has identified off-incident locations, has signed mutual aid agreements, and is set up to make mutual aid requests. Merced County has identified the jurisdictions, special districts, volunteer agencies, and private agencies within the county geographical area that may have an emergency response role during an emergency or disaster that affects Merced County. The emergency roles have been identified, and provisions for coordination have been made. Merced County OES (Fire) and the Merced County Sheriff's Department are responsible for distribution of sandbags. There is currently no place to stockpile resources, which is a significant issue for the county during flood fighting.
Flood Response State and Federal Agencies In the USJR region, the FOC is used to coordinate calls with agencies with emergency management responsibilities during a flood event. As major storm systems approach California, forecasters from NWS and DWR calculate the location, amount, and timing of expected precipitation and make initial river projections. Flows are monitored from Pine Flat Dam on the Kings River, Friant Dam on the San Joaquin River, Big Dry Creek Reservoir and Diversion Channel, Fresno and Chowchilla rivers, MSG reservoirs (Burns, Bear, Owens, and Mariposa creeks), New Exchequer Dam on the Merced River, and other miscellaneous local streams. Typically, once a storm arrives and runoff begins, forecasts are updated and issued as necessary to various local, State, and Federal agencies. Reservoir operators adjust flood control releases as inflows increase or downstream channels swell with runoff. If runoff is sufficient to raise streams to threatening levels, the NWS and DWR issue these forecasts as “Official Public Bulletins,” disseminated by automated NWS and DWR computer systems.
Upper San Joaquin River Regional Flood Management Plan 4-45

FLOOD MANAGEMENT
When streams are forecast to rise above certain predetermined stages (water surface elevations) or flow rates, FOC personnel make high-water notification calls to appropriate local flood system maintaining and emergency response agencies. LMAs are required to patrol their levees on a 24-hour basis, as long as the water level is at or above the monitoring stage and until no threat remains to the levees.
Sustained severe storms and flooding for an extended period might require additional DWR personnel, equipment, material, and financial resources to respond to high-water events and flood system threats. To meet the emergency response needs statewide, the DWR Director could, upon the recommendation of the DFM Chief, declare a Flood Mobilization, which authorizes the DFM to use any DWR personnel in accordance with Water Resources Engineering Memorandum No. 63 (DWR, 1999).
Local emergency and public works personnel, volunteers, humanitarian organizations, and other private interest groups provide emergency assistance required to protect the public's health and safety and to satisfy immediate human needs. If necessary, the governor can declare a state of emergency and invoke the State's emergency plan to augment individual and public resources, as required.
Upstream Agencies Upstream agencies primarily participate in flood response activities by participating on FOC coordination conference calls and by notification of flood flow releases.
Local Maintaining Agencies
Lower San Joaquin Levee District Flood season, as defined in the LSJLD O&M manual, is from November 15 to June 15 of each year. In the early part of this season, the San Joaquin Valley can be threatened by rain-flood runoff. In the latter part of the season, there can be a threat of flooding from snowmelt runoff. High water is defined as flow that overflows the low-water channel and comes in contact with the levee. Once a flood release is identified, forecasts of significant runoff, including a weather summary and other data pertinent to the situation, are issued to the LSJLD. After the initial notification from the FOC, LSJLD is responsible for keeping itself informed of river and weather conditions through coordinated communications with the joint FOC and upstream reservoir operators.
During high-water periods, the LSJLD patrols the project levees continuously to locate possible sand boils or unusual wetness on the landward slope of the levees, slides or sloughs, wave wash or scouring, overtopping, debris jams, or other conditions that might endanger the levees. Patrol of the levees starts as soon as water touches the levee toe. Seven LSJLD staff members are available for patrolling. Designated patrol routes are assigned to staff. Each patrol vehicle has one person driving and one person observing the flood conditions. When a flood event begins, it is not uncommon for patrollers to work 20-hour shifts until the event becomes stabilized. LSJLD uses 12-hour patrol shifts that begin and end at 12 a.m. and 12 p.m. Timing of the shifts are designed to allow each shift the opportunity to patrol during daytime and nighttime hours so teams have a better familiarity and understanding of the system in both day and night. Flood height is measured by a staff gauge—a plank or metal plate used to indicate the height of the water or a wooden lath if a staff gauge is not available. During critical events, staff from DWR, local counties, and irrigation districts can be used for additional patrols. Irrigation district staff are typically available for patrolling and flood fighting during nonirrigation winter periods, but they might not be available during snowmelt flood events, which can occur during the irrigation season.
4-46 Upper San Joaquin River Regional Flood Management Plan

FLOOD MANAGEMENT
Patrols drive designated circular routes on the levees, looking for any potential issues along the levees, including, boils, potential weak spots, or other signs of damage. The LSJLD uses a standard reporting form that each patrol is required to complete. These forms identify the flood stage and other pertinent information. Upon completion of a shift, each patrol returns the original form to the offices and provides the next shift with a copy for their records and for comparison purposes. On occasion, there have been several issues that make patrolling the levees more difficult. An example of such an issue is near Bear Creek where two sections of the levee have been breached to allow upstream flood flows to enter the river. These breaks require the patrols to drive off the levee and detour around it before climbing back onto the levee to continue patrols and inspections, which reduces the efficiency of the patrolling process by adding extra time and cost. Another example of levees that are difficult to patrol concerns cattle standing on (and blocking) the levee patrol route during floods. LSJLD typically allows grazing only by permit to owners of land contiguous to the levee. This permit enables landowners to graze cattle on the levee, with the understanding that the cattle must be removed within 24 hours after notification. Certain reaches of the levees traverse public wildlife refuges, where grazing permits have been issued by the maintaining refuge agency. Figure 2-5 shows the managed environmental lands in the USJR region. Grazing permits have been issued to cattle owners who are not located in the area. During the last flood, these cattle blocked patrols and were not removed even after the 24-hour notification.
Advance measures are taken to ensure the availability of adequate labor and materials to make repairs or otherwise mitigate conditions that threaten the levees. The O&M discussions in Section 4.5 describe specific protocols in the SJRFCP O&M manual for operation of the primary gate structures at the Chowchilla Bifurcation Structure and the Mariposa Bypass.
When USACE identifies the need to release flood flows from Friant Dam and Millerton Lake, the LSJLD has approximately 3 days to make final preparations before these releases enter the LSJLD system. From the time that the LSJLD is notified of flood flow releases, staff and volunteers work 24 hours a day to ensure that the system is prepared for the incoming flows. Crews move materials around, replenish stockpiles, and stabilize known weak spots in the system. Flood fighting operations include placing sandbags and other levee repair materials to reduce or eliminate boils, increase levee freeboard, and minimize erosion. LSJLD staff members perform such operations themselves, or direct the use of equipment and manpower provided by State and local agencies.
LSJLD is primarily responsible for patrolling and making small repairs or quick fixes to the system, as required. On an hourly basis, each patrol must traverse the portion of levee it is responsible for and report the condition of the levees to the LSJLD EOC. The County is the primary responsible agency for local emergency management coordination, with plans in place under existing EOPs. Once flood response has begun, the LSJLD will notify the counties of flood response operations during a standard call to all the responsible agencies. If the situation worsens and the LSJLD can no longer handle the response activities, it alerts DWR, which then coordinates onsite directives with LSJLD on flood-fighting activities.
DWR has the ability to bring in more heavy equipment, people, and materials to respond to a flood event. Once the DWR is called in, a command center is set up, typically in the LSJLD office, where flood-fighting
Upper San Joaquin River Regional Flood Management Plan 4-47

FLOOD MANAGEMENT
activities can be more readily assessed and overseen for coordinated actions. Part of DWR's flood readiness includes ensuring that contracts are in place with local suppliers to provide materials as needed during flood fighting events. When these resources are needed, DWR has the ability to quickly obtain them and provide for response activities.
Merced Streams Group In the city of Merced, localized flooding has been known to occur during large events, including some areas of particular concern along trails. Sandbags are used to control this localized flooding. In the past, flooding has threatened roadways in the region, so MSG coordinates with Caltrans to address the situation, when needed. Merced ID manages upstream facilities for MSG. The two agencies coordinate efforts and work together. Merced ID has responsibility for patrolling the levees during a flood event.
Madera County Flood Control and Water Conservation Agency The Madera County FCWCA monitors flood flows remotely, primarily using the DWR website. Flood fighting consists mostly of monitoring and maintaining levees by placing sandbags and other levee repair materials to reduce or eliminate boils, increase levee freeboard, and minimize erosion. Two Madera County staff are generally dispatched to patrol the levees and look for sand boils during a flood event. An additional three persons, for a maximum of five Madera County staff members, can be called for flood fighting. If necessary, additional personnel from the Madera County's Probations Department can be used. Madera County FCWCA maintains stockpiles of materials for flood fighting at the Madera County corporation yard. Drainage structures in the floodway levees are sometimes opened to intentionally flood adjacent lands, thereby avoiding a levee breach. Owners of these lands accept the practice. On the Fresno River, gates can be opened to allow adjacent flooded lands to drain to the river after river levels subside.
County
Fresno County Localized flooding in Fresno County is identified by the Fresno County Sheriff’s Office or Fire Department. The LMAs are tasked with performing levee patrols and levee repairs. Fresno County staff is contacted for help as needed by the LMAs. Road crews familiar with an area will be assigned to patrol those areas. The EOC is activated for larger events. Fresno County will alert OES if it needs help, and at that time, OES will send out notices to participants. Fresno County gathers information to better forecast and manage flood operations. Responders are contacted in advance of large events to help prepare for flood flows. Shelter and welfare activities are managed by the Fresno County Sheriff’s Office.
Madera County Madera County staff work to assess flood damages and mitigate flooding. Upstream flow releases are regulated by USACE, and the county stays informed and prepares as needed. The Madera County EOC is activated when field response agencies need support and/or activation requirements are met. The Madera County EOC is designed to serve as a combined center for the Operational Area and the County of Madera, enabling the efficient use of available Madera County staff.
Madera County's initial response activities are primarily performed at the field response level. The Incident Command System is used for small and large events. The Madera County Director of Emergency Services, the Deputy Directors of Emergency Services, or the Incident Commander activate the Emergency Alert List when a disaster occurs. Emergency responders (Madera County Fire, Sheriff’s, and Public Works departments, along with the California Highway Patrol [CHP]) conduct a survey and assess the nature, severity, and extent of the situation in the county and/or communicate an evacuation to the public. Field
4-48 Upper San Joaquin River Regional Flood Management Plan

FLOOD MANAGEMENT
Commanders have access to checklists in the case of dam failure or floods, which allow commanders to address every flood situation in a consistent manner. The Madera County Sheriff and Fire Departments, and Public Information Officer (PIO) alert and warn the public through the Emergency Alert System, special broadcasts, or by simply driving up and down the streets using a public address system.
Merced County Merced County's initial response activities are performed primarily at the field response level. The Incident Command System is used for small and large events. The Merced County Director of Emergency Services, the Deputy Directors of Emergency Services, or the Incident Commander may activate the Emergency Alert List when a disaster occurs. Emergency responders (employees of the Merced County Fire Department,
Sheriff’s Office, Public Works Department, and CHP) will conduct a survey and assess the nature, severity, and extent of the situation in the county and/or communicate to the public of an evacuation. Merced County monitors flood flows using DWR’s FOC website and notifies the Merced County Fire Department if flood fighting is needed.
Field Commanders have access to checklists after dam failures or floods, which allow the commander to address every flood situation in a consistent manner. The Merced County Sheriff’s Office, Fire Department,
and PIO alert or warn the public through the Emergency Alert System, special broadcasts, or simply driving up and down the streets using a public address system. The Merced County EOC is activated when field response agencies need support and/or activation requirements are met. The Merced County EOC is designed to serve as a combined center for the Operational Area and the County of Merced, enabling the efficient use of available Merced County staff. If temporary shelters are needed, the Fire Department would be the responsible agency. During flood events Merced County will patrol channels, using Merced ID resources, when the channels are safe and accessible. The Friant Dam Emergency Action Plan (EAP), located in the Merced County OES in the Sheriff’s Department, would be activated if a dam failure occurred.
Recovery State and Federal Agencies State and Federal agencies have a role in disbursing relief funds and offering help to communities that have been damaged during flood events. USACE has the responsibility to coordinate levee repairs with interested local, State, and Federal agencies following natural disaster events where flood control works are damaged. If the requirements of PL 84-99 are satisfied, then USACE has the ability to help fund recovery activities. The governor might determine, after consulting with local government officials, that the recovery appears to be beyond the combined resources of both the State and local governments and that Federal assistance might be needed. In requesting supplemental Federal assistance under the Robert T. Stafford Disaster Relief and Emergency Assistance Act, 42 U.S.C. Sections 5121-5206 (Stafford Act), the governor must certify that the severity and magnitude of the disaster exceeded State and local capabilities; certify that Federal assistance is necessary to supplement the efforts and available resources of the State and local governments, disaster relief organizations, and compensation by insurance for
Upper San Joaquin River Regional Flood Management Plan 4-49

FLOOD MANAGEMENT
disaster-related losses; confirm execution of the State's emergency plan; and certify adherence to cost-sharing requirements.
Local Maintaining Agencies After a flood event has occurred, recovery activities begin almost immediately to return the region to normal conditions as quickly as possible. The LMAs follow State and Federal protocols to apply for and disperse funds to cover damages from a given flood event. Local landowners are responsible for dewatering; the LMAs do not perform dewatering activities. Even before the end of a flood event, some landowners need to begin dewatering and pumping floodwaters into the river or bypass as a result of ongoing seepage or other flood flows. To pump the flows into the river, landowners must lay hoses or pipes across the levees, which is permissible as long as the patrols are able to drive unimpeded on the tops of the levees.
LMAs are responsible for repairs and fixes to flood system facilities. Recovery repairs that are beyond LMA resources may be accomplished by USACE or DWR, if the event is declared disaster.
Counties Recovery activities are typically outlined in County EOC plans; however, Fresno County has no formal flood recovery plan. Post-flood activities, such as debris removal and repairs, are performed by the LMAs and local agencies and are supported by the county. Flood hazards are not widespread in the region, and localized flooding is addresses accordingly. The EOP contains a section for Recovery Operations, which describes in general terms the county’s role in recovering funds from State and Federal emergency programs for both government and private expenditures.
In Madera and Merced counties, the EOC plan has short-term and long-term recovery components built in. Recovery operations are managed and directed by the County Executive Officer (CEO). Short-term recovery operations begin during the response phase of the emergency. The major objectives of short-term recovery operations include rapid debris removal and cleanup, along with orderly and coordinated restoration of essential services (electricity, water, and sanitary systems). Short-term recovery operations will include some or all agencies participating in the Operational Area. The County OES Director and Deputy Directors will assist the CEO in facilitating and leading the recovery process. A recovery damage/safety assessment is the basis for determining the type and amount of State or Federal financial assistance necessary for recovery. Under the Madera County Operational Area Emergency Operations Center's Standard Operating Procedures, an Initial Damage Estimate is developed during the emergency response phase to support a request for a gubernatorial proclamation and for the State to request a Presidential declaration of emergency.
4-50 Upper San Joaquin River Regional Flood Management Plan

FLOOD MANAGEMENT
4.5 Flood Management Issues and Deficiencies
4.5.1 Flood Management Infrastructure Flood management issues include subsidence, insufficient or aging infrastructure, seepage, sedimentation, and vegetation encroachment, complex system operations, and O&M. These issues and deficiencies challenge the function and reliability of the flood management system. Aggradation of the channel bed, subsidence, and vegetation encroachment have all played a role in reducing the capacity of the channel to convey the published design flows. In addition, aging infrastructure can result in structural integrity issues, operational failure, or inadequate capacity at facilities. The following subsections describe the different types of issues and deficiencies facing the USJR region.
Subsidence In the USJR region, subsidence is a significant issue along 8 miles of the Eastside Bypass from Berenda Slough past Ash Slough, and along 6 miles of the Eastside Bypass from the Washington Avenue area north to the Mariposa Bypass. Land subsidence occurs as a result of large amounts of groundwater being withdrawn from certain types of geologic formations, such as fine-grained sediments without sufficient groundwater recharge. Over time, as water is removed from an area, the ground level sinks. Land subsidence can lead to many problems, including damage to structures, such as canals, levees, and buildings, and to infrastructure, such as roads, wells, and pipelines. Additionally, subsidence can increase the potential for flooding by increasing the land area within the floodplain. Subsidence also increases scour problems by increasing channel slope, which causes higher flow velocities and incision of the low-flow channel and around bridge infrastructure.
Subsidence in the Red Top area is shown in Figure 4-4. The subsidence rate in this area is more than 0.75 foot (9 inches) per year. This has affected area infrastructure, including water diversions and system operations, and has reduced flood flow capacity.
Figure 4-4. Subsidence Rates in the Washington Avenue/Red Top Areas
Upper San Joaquin River Regional Flood Management Plan 4-51

FLOOD MANAGEMENT
Subsidence in the USJR region is the result of groundwater pumping from a lower confined aquifer that is beneath the Corcoran Clay that has occurred since 1980. Groundwater pumping is occurring in areas northeast of the San Joaquin River and on both sides of the Eastside Bypass. Before the 1980s, subsidence was not a significant issue because groundwater was withdrawn from an upper unconfined aquifer, which was above the Corcoran Clay. The Corcoran Clay is a confining clay bed beneath the west and central parts of the San Joaquin Valley, which separates the upper unconfined aquifer from the lower confined aquifer. Generally, strata below the Corcoran Clay are highly compactable. Compaction of the clay layers occurs as water is removed from the pores between the clay particles, resulting in lowering the ground surface in the area where the groundwater is being pumped.
Subsidence in the region has been increasing since 2005 as more water is pumped from the lower aquifer. Today, water levels in both the upper and lower aquifers are declining, resulting in subsidence of up to 0.75 foot per year and damage to infrastructure. This impacts water supply, water quality, capacity of channels and dams, as well as the condition of roads and other structures. The economic impacts of this subsidence are being felt in the region with property owners experiencing damage to pipes and roads, and some projects being delayed or put on hold indefinitely.
Eastside Bypass levees in the Washington Avenue and Red Top areas are lower in elevation than in surrounding areas, which reduces conveyance capacity and increases flood risk in the area. Water supply infrastructure is no longer at design elevations. Figure 4-5 shows a cross section of subsidence and photos of subsidence in the Red Top area. Figure 4-6 shows subsidence areas across the USJR region.
A recent DWR study estimated that the Eastside Bypass would experience a reduction in freeboard of up to 1.5 feet between 2011 and 2016 if current trends continue (DWR, 2013c). This would cause a reduction in capacity of up to 4,500 cfs, which would be variable based on location. It is not clear at this time if the resulting increases in sedimentation would cause further reductions in capacity; areas like Sand Slough are especially susceptible to sedimentation. DWR is continuing surveys of the area to monitor subsidence within the Eastside Bypass. Subsidence in this area is of particular importance because it impacts flood operations and will impact long-term flood management facilities needs and planning.
Eastside Bypass Scour Caused by Subsidence, 2013
4-52 Upper San Joaquin River Regional Flood Management Plan

FLOOD MANAGEMENT
Figure 4-5. Cross Section Demonstrating Effects of Subsidence and Photos of Subsidence Source: San Joaquin River Exchange Contractors Water Authority, 2012
Upper San Joaquin River Regional Flood Management Plan 4-53

FLOOD MANAGEMENT
This page intentionally left blank.
4-54 Upper San Joaquin River Regional Flood Management Plan

FLOOD MANAGEMENT
Figure 4-6. Areas of Subsidence in the USJR Region
Upper San Joaquin River Regional Flood Management Plan 4-55

FLOOD MANAGEMENT
This page intentionally left blank.
4-56 Upper San Joaquin River Regional Flood Management Plan

FLOOD MANAGEMENT
Insufficient or Aging Infrastructure Insufficient and aging infrastructure has significant impacts on flood management in the region. Most of the flood infrastructure in the USJR region was developed between the 1940s and 1970s. The San Joaquin River Flood Control Project and MSG facilities were built between 40 and 55 years ago and are reaching the end of expected service life. For example, wear and tear on access roads and levee crowns have affected levee stability and access for flood fighting. Also, a majority of levees in the San Joaquin River Flood Control Project were constructed of native materials, including sand, making the levees porous in nature. This results in unstable levee slopes, seepage of water through levees, and inability of existing levees to meet current design criteria for reduction of flood risk. Levee stability problems in Reach 2A and slope stability issues in Firebaugh in Reach 3 are the result of age and erosion from fluctuations in water surface elevations. Although LMAs have kept the flood management system functional, most of these systems do not have capacity to convey original published design flows. Many systems are in need of both capital improvements and enhanced O&M activities to continue to provide protection for the region. Figure 4-7 shows areas where there is slope instability or erosion within the USJR region based on information from the DWR ULE/NULE project.
In the Merced portion of the USJR region, significant portions of flood management infrastructure, which were identified by the USACE as necessary, have not been constructed. This infrastructure would provide significant reductions in flood risk for areas of downtown Merced. As part of the MSG Program, the Haystack Reservoir, enlargement of Bear Reservoir, and about 33 miles of channel improvements along Bear Creek were identified but never completed.
Seepage Seepage is caused by a hydraulic head differential between the water surface in the river channel and adjacent groundwater levels. In the USJR region, seepage occurs when flows in the river follow historical underground sloughs and rivulets, eventually showing in agricultural lands. This lateral seepage of water from the river under or through a levee can result in boils, levee failure, and impaired development of crops.
A boil occurs when the upward pressure of water flowing through soil under a levee exceeds the downward pressure from the weight of the soil above it. The water flowing
through the soil resurfaces on the land side of the levee. Boils signify instability and other conditions that could lead to erosion of the levee foundation, which in turn could cause a complete breach of the levee.
Levee seepage impacts in the USJR region are caused primarily by the type of materials used for levee construction. The levees were constructed of local materials and built on native soil without structural
Seepage Damage along the San Joaquin River, 2006
Landslide Adjacent to Firebaugh along San Joaquin River
Upper San Joaquin River Regional Flood Management Plan 4-57

FLOOD MANAGEMENT
“keying” of the levee foundation to prevent underground movement of flows. As a result of the pervious condition of these materials, the levees are subject to seepage and stability problems. Also, in some locations, the soil adjacent to the river is near saturation because of a high groundwater level; thus, the lateral flow of water toward an area already approaching saturation can cause groundwater levels to rise into the root zone and impair crop production in adjacent fields.
Lateral flow through a levee occurs when water levels in the channel approach the toe of the levee and generate sufficient hydraulic head. Seepage in the USJR region is a significant problem because it can occur even in low-flow conditions. Unfortunately, seepage occurs in large portions of the region as shown in Figure 4-8. San Joaquin River Reaches 2, 3, 4A, and 5 have seepage issues during high flows that result in decreases in crop production in adjacent agricultural fields. This issue is critical because the SJRRP plans to increase the frequency and amount of flow in the system. The SJRRP is required in its own PEIS/R to limit flow releases to levels that do not cause groundwater seepage impacts, as discussed in SJRRP's Seepage Management Plan, or levee impacts, with reach capacities for levee stability defined in SJRRP's Channel Capacity Advisory Group Report. Reclamation is currently working on addressing groundwater seepage concerns and has not released flows below Sack Dam since 2011, because of these concerns.
4.5.2 Operations and Maintenance Federal agencies, including USACE and Reclamation, are responsible for the O&M of dams in the San Joaquin Valley. USACE develops O&M manuals for facilities constructed where USACE is a Federal cost-sharing partner. The State of California is responsible for levees, channel bottoms, and other facilities within the SPFC; however, much of this responsibility in the USJR region is assigned to the LSJLD (the LMA in the region). The State also has assumed flood-fighting activities in the past on non-SPFC levees near the city of Firebaugh. The USJR region has a number of private landowners who are responsible for maintaining levees on their property. Under existing conditions, most maintenance activities are conducted by the LSJLD when the river is dry, allowing for easy access to the river, reducing the potential for safety hazards, and allowing for the use of tools (including certain herbicides) and techniques that cannot be used in wet conditions. However, the interim flows from the SJRRP have made this type of O&M difficult by maintaining higher flows in the river. The LSJLD has also had difficulty in obtaining permits to conduct maintenance to remove excess vegetation. This creates a complex network of coordination that must be navigated to perform O&M, as well as emergency management activities.
Through a collaborative partnership, the County of Merced, City of Merced, and Merced ID operate as the MSG to maintain the flood management system in Merced County. The flood management system was originally constructed with the help of USACE and DWR. The MSG is now the LMA for the system, which includes an area of SPFC facilities that protects a portion of the city of Merced. There are also nonproject levee systems along portions of the Bear and Owens creeks, south of Highway 99 that are not the responsibility of any LMA.
In Madera County, flood management facilities are maintained by the Madera County FCWCA. The Madera County FCWCA is responsible for maintaining approximately 25 miles of SPFC levees, as well as local facilities, including the Fresno River Diversion Weir. Currently, the Madera County FCWCA has limited funding and resources, which impacts its ability to maintain the system (Madera County, 2008).
4-58 Upper San Joaquin River Regional Flood Management Plan

FLOOD MANAGEMENT
Figure 4-7. Slope Instability and Erosion Locations in the USJR Region
Upper San Joaquin River Regional Flood Management Plan 4-59

FLOOD MANAGEMENT
This page intentionally left blank.
4-60 Upper San Joaquin River Regional Flood Management Plan

FLOOD MANAGEMENT
Figure 4-8. Seepage Map of the USJR Region
Upper San Joaquin River Regional Flood Management Plan 4-61

FLOOD MANAGEMENT
This page intentionally left blank.
4-62 Upper San Joaquin River Regional Flood Management Plan

FLOOD MANAGEMENT
The public agencies continue to perform O&M activities in accordance with their respective project O&M manuals or other agreements. LSJLD, MSG, and Madera County FCWCA are limited in their capabilities due to budget shortfalls. LSJLD has identified the need for additional staffing, equipment, and infrastructure improvements to enhance their current level of O&M. Madera County FCWCA could also enhance its O&M activities with additional staff and equipment, but its biggest limitation is funding. Both MSG and Madera County FCWCA have identified difficulties in reconciling their O&M obligations with stringent permitting requirements by CDFW for vegetation control and removal in floodways. Streamlining or rectifying conflicts between O&M obligations and environmental permitting would enhance the O&M capabilities of these agencies.
Nonproject levees and flood facilities on private land within the planning area are, in most cases, not well maintained. Bringing these facilities under the jurisdiction of public agencies might enhance the O&M by requiring regular maintenance and inspections.
Sedimentation, Vegetation, and Land Use Encroachment Managing sedimentation, vegetation, and land use encroachment on levees and in channel beds is key to maintaining system capacity and reducing flood risk. Sedimentation causes a reduction in designed flow capacities in channels and reservoirs due to deposition of soil and other debris. Over time, if sedimentation is not addressed through O&M activities, system facilities will no longer function in the way they were designed. In the USJR region, sedimentation is an issue at flow control structures, as well as in bypasses and river reaches.
Vegetation encroachment reduces channel capacity by increasing friction within the channel and by impacts to slope stability on levees. Significant resources are employed by LMAs to sustain channel capacities by controlling vegetation. In the San Joaquin River channel, many reaches lack capacity to convey published 50-year flood flows. The capacity of the channels to convey high flows has been reduced as a result of extensive and mature riparian vegetation. In recent years, obtaining the necessary permits for O&M for dredging or clearing vegetation has been difficult, which results in delays that allow time for additional vegetation growth. Vegetation encroachment is problematic in San Joaquin River Reaches 1, 3, and 4B. In Madera County, arundo removal is needed in channels. Arundo is an invasive species commonly found in streambeds, and it spreads quickly displacing native plants and associated wildlife species.
Landowners gradually have encroached on flood infrastructure. Land use encroachment reduces areas available to access, maintain, and operate flood management facilities and increases costs.
Complex System Operations Operations of flood management systems in the USJR region are complex due to the number of agencies and facilities involved. Coordination of operations includes local, State, Federal agencies and WDs and private landowners. Also, there are competing operations in the USJR region for managing water to satisfy needs for water for irrigation, flood management, and environmental restoration.
The LSJLD covers a majority of the USJR region; however, the system receives flows from the Kings River and MSG and must provide conveyance for San Joaquin River flows. Flood emergency operations require constant communication between local, State, and Federal involved parties.
Dense Vegetation at Owen’s Creek Diversion, 2012
Upper San Joaquin River Regional Flood Management Plan 4-63

FLOOD MANAGEMENT
4.5.3 Emergency Management The USJR region is vulnerable to flooding, and although many flood management measures are in place to help reduce the risk of flooding, residual flood risk remains. Large flood events have damaged public infrastructure, agriculture, and other public and private property as recently as 2006. Preliminary findings of a review of existing flood emergency operations and informed practices in the USJR region include:
• LMAs each need to complete a Flood Safety Plan or other Flood Emergency Management Plan that formalizes protocols and procedures.
• LMAs in the region are under-resourced for flood management.
• Flood fighting stockpiles need to be increased threefold in the region.
• LMAs in the region have no influence on the magnitude of flows that enter the region from upstream releases and are forced to manage flood flows with a limited number of options.
• Increased resources in the region could encourage additional mutual aid agreements.
• MSG needs a trailer or other facility to store flood-fighting supplies.
• A Memorandum of Understanding between the MSG partners could formalize emergency management responsibilities.
• Grazing permits in the region need to ensure that cattle can and will be evacuated within 24 hours of notification.
• Consistent regional mutual agreements with the permitting agencies, for levee and channel O&M to promote flood risk reduction are needed.
• Levee breaches near Bear Creek need to be replaced by outlet structures that allow levee patrols and flows to enter the Eastside Bypass.
• Levee O&M needs to be expanded to include remediation of stability problems caused by age and wear-and-tear on access roads and levee crowns. Age-related degradation of the levees has affected safe access for flood fighting.
4.5.4 Funding The LSJLD is funded by property tax assessments on lands within the LSJLD boundaries that receive flood control benefits. As a result of conversion of lands to State and Federal ownership (primarily for wildlife areas), the LSJLD is facing a disappearing tax base at a time when O&M costs are rising. This issue could be exacerbated by the additional costs to maintain the channel, levee, and related flood control facilities that would be constructed as part of the SJRRP. The costs to address additional vegetation management activities, additional sediment management and removal activities, cleaning of screens and trash racks on facilities, staff time to open and close gates and flap gates (in the bypass system), and staff time for flood watch (24-hour staffing needed when flows abut the toe of the levees) would far exceed the current operating budget of LSJLD. Additionally, the presence of restoration flows in the river channel year-round or for extended times during the year will significantly increase the need for LSJLD maintenance activities, including the timing, tools, and techniques used.
The MSG has not received appropriations from Congress for projects since 2005. Haystack Dam, channel improvements, and other projects have been identified by USACE as potential solutions to the flooding issues in the city of Merced; however, these projects require funding before additional study and
4-64 Upper San Joaquin River Regional Flood Management Plan

FLOOD MANAGEMENT
implementation can occur. Merced County is proposing the creation of a flood control agency for the region, either as an adjunct of Merced County, or as a joint powers authority that would be responsible for planning, coordinating, and managing flood control projects for the region.
Madera County FCWCA has difficulty maintaining its facilities due to inadequate funding. A feasibility study has been proposed to determine the adequate staffing and funding needs to properly maintain the agency’s facilities.
4.6 Summary of Flood Issues and Deficiencies Local flood management agencies in this region are struggling to upgrade or improve insufficient or aging infrastructure, which involves addressing issues such as seepage, subsidence, loss of hydraulic capacity, sedimentation, vegetation encroachment, O&M, and lack of sufficient funding. Complex, institutional, and onerous permitting and compliance issues associated with environmental regulations make implementation of flood management actions—even routine O&M—difficult and sometimes impossible. The focus on restoration of flows and listed fish species in the river channel presents additional challenges for flood management. The following subsections outline issues facing LMAs in the USJR region.
4.6.1 Lower San Joaquin Levee District The primary issues facing the San Joaquin River Flood Control Project include:
• Many reaches now have inadequate hydraulic capacity to convey published 50-year flood flows.
• Levees constructed using local materials are subject to seepage and stability problems in the San Joaquin River along Reaches 2A, 3, 4, and 5.
• Subsidence in the Washington Avenue/Red Top area is occurring at a rate of 0.75 foot per year (9 inches) resulting in a reduction in bypass channel capacity and impacting flood operations.
• Facilities constructed between 1959 and 1967 are reaching the end of expected service life.
• Facilities need upgrades to meet current criteria.
• Complex flood operations require coordination between multiple WDs, and local, State, and Federal agencies.
• Portions of the system are still manually operated, posing potential health and safety risks.
• Sedimentation and vegetation encroachment have reduced flood flow capacity below published design values.
• Porous material used to construct the levees results in seepage problems to adjacent agricultural lands even during lower flows.
• Slope instability have affected Reaches 2 and 3.
• SJRRP poses special challenges for flood operations and management.
Channel maintenance in the USJR region was identified in the Flood Control System Status Report (DWR, 2011a) as unacceptable primarily due to excessive vegetation. Most of the flood management facilities were given an acceptable rating.
Upper San Joaquin River Regional Flood Management Plan 4-65

FLOOD MANAGEMENT
4.6.2 Merced Streams Group The primary issues facing the MSG area are inadequate upstream storage and channel capacities to protect the downtown area of the city of Merced. Numerous lawsuits over residential structural damage are due, in part, to lack of flood management improvements and recurring flooding. Haystack Dam, identified by USACE as a measure to protect downstream areas, has never been constructed. Bear Creek and Black Rascal Creek have capacity deficiencies, and existing levees do not meet FEMA freeboard requirements. Existing canal systems are vulnerable to failure during severe weather events. Deadman Slough, Duck Slough (Mariposa Creek), Miles Creek, and Owens Creek lack adequate capacity to convey 100-year flows (Merced County, 2011b).
In addition, a number of other facilities have been identified in the Flood Control System Status Report as having deficiencies (DWR, 2011a). These deficiencies include:
• Channel maintenance along Bear Creek, Black Rascal Creek, Owens Creek, and Mariposa Creek is rated as minimally acceptable.
• Black Rascal Creek drop structure and Bear Creek diversion structure are rated minimally acceptable for structural integrity.
• Owens Creek overflow structure is rated unacceptable for structural integrity.
• Owens Creek siphon structure is rated minimally acceptable for vegetation and obstruction conditions.
• Owens Creek siphon structure is rated minimally acceptable for encroachment conditions.
• Owens Creek siphon structure is rated minimally acceptable for erosion, bank caving, shoaling, and sedimentation.
4.6.3 Madera County FCWCA The primary issues with the facilities maintained by Madera County FCWCA are erosion and vegetation. In addition, significant rodent activity exists along the levees. Other issues identified are site encroachments and slope stability. The area experiences trash accumulation due to illegal dumping. A number of facilities have been identified in the Flood Control System Status Report as having deficiencies (DWR, 2011a). These deficiencies include:
• Sedimentation and shoaling in the Fresno River.
• Revetments and other structural appurtenances are listed as minimally acceptable on the Fresno River.
• Fresno River Diversion Weir is listed as acceptable but has vegetation and obstruction issues, including spread of Arundo.
4-66 Upper San Joaquin River Regional Flood Management Plan

5.0 Proposed System Improvements This chapter describes the proposed SIs/actions that were identified through an extensive stakeholder outreach effort and a series of public workshops conducted in support of the RFMP effort. SI project descriptions were developed and refined working with participating stakeholders, and cost estimates were developed or updated to current dollars for those projects where enough information was available.
Proposed SIs were identified from three sources:
• Research of existing documents • Identification to address a flood issue and deficiencies • Identification and submittal from stakeholders
The criteria and methodology used to evaluate and prioritize the SIs are presented in Chapter 6, Evaluation of System Priorities.
5.1 System Improvement Identification The SI identification process started at the beginning of the RFMP development process. This was accomplished by identifying deficiencies and issues during plan formulation, reaching out to stakeholders, and establishing a process for stakeholders to submit proposed SIs.
Appendix E presents a sample form for proposed SIs. This form was first uploaded to the SFMP website on June 19, 2013, and stakeholders were encouraged to submit SIs at the first RFMP stakeholder meeting on June 26, 2013. This invitation was repeated at all RFMP meetings held between June 2013 and March 2014. In addition, the USJR RFMP worked with local stakeholders to refine projects and identify information needed to develop more complete project descriptions to allow development of cost estimates.
Appendix F presents a summary of the meetings and communications with stakeholders to identify and review SIs. The project team provided periodic updates to a summary SI list, which was provided at RFMP meetings and available on the USJR RFMP website. Eighty-eight projects were identified between June 26, 2013, and August 6, 2014. All stakeholder SI suggestions were included on the final list, including conceptual ideas, capital improvements, O&M activities, studies, and recommended actions. The list contains projects that are located within the RFMP boundaries along with those located outside the RFMP boundary that either influence flood management within the RFMP boundary or address deficiencies and issues within the RFMP boundary.
5.2 System Improvement Database The USJR RFMP Proposed Improvement Database was used to provide a consistent and structured format to compile essential and relevant detail about each SI, and to provide a way to track this information throughout the development of information and refinement for each SI. An overview of the SI Database Worksheet is provided in Table 5-1. No judgment was made on SI feasibility in the compilation of SIs; however, the phase (conceptual, study, recommended action, and construction timeframe) was identified as available.
The RFMP uses short-term and long-term construction timeframes. Short-term SIs are those whose construction is feasible within the next 5 years (i.e., groundbreaking occurs within 5 years), and long-term
Upper San Joaquin River Regional Flood Management Plan 5-1

PROPOSED SYSTEM IMPROVEMENTS
SIs are those whose construction will take place after 5 years. For planning efforts, short-term denotes studies underway within 5 years.
Table 5-1. SI Database Worksheet
Component Area Description
SI Background Lists the lead agency, partner agency (if applicable), and general description of the SI.
Permits Type of local, State, and Federal permitting required for the SI.
Structural Deficiencies Identifies structural deficiency that the SI addresses, including conditions such as erosion, subsidence, seepage, invasive species, and O&M issues.
System Improvement Addresses Nonstructural Deficiencies
Identifies nonstructural deficiency that the SI addresses, including governance, permitting, and funding limitations.
SI Status Provides the current status or status at the time the SI was documented. SI Status refers to where the SI is in the formation process, including conceptual idea, planning, preliminary design, final design, construction, or O&M.
Type of IWM System Improvement IWM type identifies if the SI has multiple partnering agencies or multiple benefits. A multiple-benefit SI has a flood management benefit as well as another benefit (such as agriculture, groundwater recharge, recreation, transportation, water supply, water quality, ecosystem, etc.)
Cost Total cost of the SI as well as information about the source of the cost estimate
Cost Estimate A breakdown of the cost for each phase of the SI
Cost Estimate Status Indicates the status of the SI cost estimate. This was used during the RFMP to track the status of the cost estimating.
Geographic Information System information Provides geographical information needed to locate an SI to its exact or general location. Also, it identifies whether a KMZ file is available for the SI location.
Coordination with Other System Improvements List the identification numbers of other SIs that could be grouped with the SI based on geography, SI type, and SI proponent. The SI identification numbers listed were not evaluated for willingness of SI proponent to participate; therefore, all potential identification number groupings may not be recommended.
System Improvement Phase Where the SI is in the process of development, including conceptual, study, capital SI (long term or short term), recommended action.
Resiliency Resiliency is the ability of a system to respond to and recover from a stressful event that threatens to disrupt the expected level of service of the system (whether the stressful event occurs quickly or over a number of years). Resiliency evaluations are based on four qualities of systems including: • Robustness – the inherent strength or resistance in a system to withstand
external changes and demands without degradation or loss of the expected level of service
• Redundancy – system properties that allow for alternate options, choices, and substitutions to be used to attempt to provide the expected level of service while the system is under stress
• Resourcefulness – the capacity within the system to mobilize needed resources and services in response to significant stress events or long-term external changes
• Rapidity – the speed with which a system can return to the expected level of service after a significant disruption occurs
System Improvement Group Provides the group category of SI including rural, urban, small community/DAC, environmental, emergency management, O&M, SJRRP, Groundwater Recharge, Study, recommended action, conceptual
5.3 System Improvement List A summary list of SIs identified through the RFMP process is presented in Table 5-2. The detailed worksheets for each SI are provided in Appendix G. There were 88 SIs identified, with 57 SIs proposed to
5-2 Upper San Joaquin River Regional Flood Management Plan

PROPOSED SYSTEM IMPROVEMENTS
be constructed in the short term (construction feasible within the next 5 years) and 31 SIs that are long term (those whose construction timeframe is greater than 5 years). The SIs were submitted by 24 different proponents regarding issues facing flood management in Fresno, Madera, and Merced counties.
For an SI to be considered for inclusion in the plan, it must have a flood management nexus, a local proponent, and willing participants. The SIs range from repair or upgrade of specific flood management facilities (e.g., Bear Creek diversion structure) to conceptual flood management SIs (e.g., development of ring levees). Also, SIs identified by the SJRRP that may have a flood nexus were submitted by Reclamation/DWR and are included in the SI list.
The SIs are presented as individual projects so each project can be evaluated based on its own merits. Attempting to combine and evaluate groupings of projects was beyond the resources of this initial planning effort. The plan does identify opportunities to combine public safety, environmental, and recreational projects together to create multibenefit projects and provides supporting project information on potential project linkages in the appendix. This will promote bundling various SIs in the future based on potential funding opportunities to develop multibenefit projects. Almost all the SIs have some ability to be bundled with other projects to achieve multiple objectives.
The SIs were grouped to identify common types of deficiencies in the region as well as the variability of issues based on location. This allowed a check to ensure that deficiencies/issues and geographic concerns were addressed. The grouping categories included:
• Rural • Urban • Small communities/DACs • Environmental • Emergency Management • O&M • SJRRP • Groundwater recharge/conjunctive use/water supply • Recommended actions • Conceptual ideas
Table 5-3 shows the SIs organized by category.
5.4 Cost Estimating Cost estimates for the RFMP were developed from existing estimates calculated by other sources or calculated as part of the RFMP process. In some cases, older cost estimates were converted to 2014 dollars. The total cost estimated for the SIs identified in the RFMP is more than $1.7 billion; however, this includes related SJRRP costs. The total SI costs, excluding the SJRRP costs, are more than $738 million. Of the 88 SIs identified, 11 SIs did not have cost estimates because the SIs do not have enough information or a specific location. The short-term SIs have an estimated cost of $501 million inclusive of SJRRP estimates (approximately $81 million without SJRRP), and the long-term SIs have an estimated cost of $1,221 million inclusive of SJRRP estimates (approximately $657 million without SJRRP).
A requirement of the USJR RFMP is to establish a current (January 2014) baseline cost for proposed SIs. For this information to be useful for comparison purposes and prioritization, information must be grounded in
Upper San Joaquin River Regional Flood Management Plan 5-3

PROPOSED SYSTEM IMPROVEMENTS
real data or justifiable assumptions. The information available to initiate development of a cost estimate or update an existing cost for a proposed SI varied considerably. Studies prepared by the USACE or other government agencies may provide a lot of detail but may not be up to date. Some local flood management agencies have costs developed for proposed improvements, but typically the conceptual ideas with no prior engineering studies do not have enough detailed information required to develop costs. The following assumptions were used to develop the SI cost estimates:
• Where cost estimates existed, these estimates were reviewed to verify whether they were applicable using best engineering judgment.
• Material quantities provided in existing estimates were generally assumed to be accurate unless specific variances were identified using best engineering judgment.
• Unit and lump sum costs were updated to current prices by multiplying the original costs by an inflation factor. Inflation factors were based on Engineering News Record (ENR) indices that Reclamation compiled.
• Whenever possible, ENR indices specific to a particular construction process were used.
• The composite ENR index was used to inflate prices of items not specifically listed by ENR.
• SIs without cost information were broken down into the different work components such as earthwork, structural concrete, slope protection, and electrical work. Preliminary design layouts were prepared to identify SI components and limits. Volume or other types of measurement were then used to estimate material quantities. These quantities were then multiplied by the current unit prices to develop the estimate. Unit and lump sum prices were developed based on local bidding prices for similar work in the RFMP area and discussions with local contractors and/or suppliers of construction materials, as necessary.
• Planning and design costs were generally determined using best engineering judgment as a percentage of the construction costs, unless special aspects of an SI required a premium added cost.
• Contingency and incidental costs include allowances for property acquisition for rights-of-way or environmental mitigation, environmental documentation and permitting, and legal services. Contingency and legal services costs were determined using best engineering judgment from past efforts as a percentage of construction costs. Site-specific requirements for property acquisition and environmental work were analyzed, and those costs were developed based on estimated acreages, land costs, and labor hours for environmental review and documentation.
The cost estimates and references for each SI can be found in the cost worksheets in Appendix H.
5-4 Upper San Joaquin River Regional Flood Management Plan

PROPOSED SYSTEM IMPROVEMENTS
Table 5-2. Summary of System Improvements
System Improvement
ID
System Improvement Name Lead Agency
Contact Person
Partner Agency System Improvement Description Estimated Cost
System Improvement
Timeframe (Short-term <5 yrs, Long-term >5 yrs)
1 Bear Creek Diversion Structure
Lower San Joaquin Levee District
Reggie Hill, Bob Kelly
Stevinson Water District
In 1963, DWR constructed the BCSDS at the intersection of Bear Creek and the East Side Canal. The facility was intended to channel Bear Creek flows over the East Side Canal Siphon during the winter and to divert these flows into the East Side Canal during the irrigation season. The invert of the structure is higher than the upstream channel which constrains flood flows, causes upstream ponding and migration of flood flows around the SI levee unit, and results in landside flooding. The proposed SI will enlarge the BCSDS by building additional bays to extend the structure to the south. These bays would be used at times of unusual storm runoff when properties, both agricultural and residential, are threatened by rising floodwaters in Bear Creek. Design would incorporate fish passage elements. The Bear Creek Diversion Structure SI could also be developed in conjunction with proposed improvements on the Sno-Bird Unit of the San Luis NWR Complex, as described in projects 67 and 68 on this list, to enhance the ability of this project to provide multiple benefits
$ 260,000 Short-term
2 Levee Breaches Unit 1, LM 9.90; Unit 5, LM 0.25
Lower San Joaquin Levee District
Reggie Hill, Bob Kelly
Stevinson Water District
Levee breaches at Unit 1, LM 9.90 and Unit 5, LM 0.25 are the result of previous flood flow actions. Recent USACE inspection rated the levee units unacceptable to project standards (potential PL84-99). It is proposed to add structures with removable flashboards that would contain floodwater in the river channel and permit land-side floodwater to drain into the river by removing the flashboards.
$ 535,000 Short-term
3 Raise Part of Left Bank Levee Unit 6
Lower San Joaquin Levee District
Reggie Hill Portions of the left bank levee Unit 6 that are opposite right bank levee Units 5, 7, 8, 9 and 10, were constructed as much as 2 feet lower than the right bank levees and need to be raised to provide the design freeboard. SI would require modeling of the system in the area to set levee elevation. Project levee was never accepted by LSJLD (governance issue).
$ 4,250,000 Long-term
4 Modernize Electrical Controls, Level Sensors, and SCADA for Control Structures
Lower San Joaquin Levee District
Reggie Hill The electrical controls and water level sensors for the primary control structures were installed in the 1960s with the original SI. They are antiquated and should be modernized for improved reliability and integration with a new SCADA system. SI location is at Chowchilla Canal bypass control structure, San Joaquin River control structure, eastside bypass control structure, and Mariposa bypass control structure.
$ 1,885,000 Short-term
5 Enlarge Chowchilla Canal Bypass Control Structure
Lower San Joaquin Levee District
Reggie Hill The control structure at the headwaters of the Chowchilla Canal Bypass should be enlarged with two additional gate bays to minimize upstream seepage and levee failure. This will increase the emergency flow capacity and operational flexibility of the structure. The bypass channel may need to be evaluated for increased channel capacity. SI will require geotechnical analyses and would include fish passage.
$ 3,380,000 Long-term
5A Rehabilitation of San Joaquin River Control Structure
Lower San Joaquin Levee District
Reggie Hill Settlement has occurred at the San Joaquin River control structure, resulting in the wing walls separating from the structure. The wing wall backfill could be excavated and voids grouted under the spread footings, or spread footings could be added or enlarged to minimize further settlement. Depending on phasing and/or timing, the design could be coordinated with the SJRRP 2B project to allow incorporation of fish passage and/or habitat restoration elements within the project footprint. However, it is also possible that any improvements to the San Joaquin River control structure resulting from implementation of the 2B project would occur as a separate project
$ 340,000 Short-term
6 Sediment Removal Chowchilla Canal Bypass Control Structure
Lower San Joaquin Levee District
Reggie Hill Remove sediment upstream from the Chowchilla Canal bypass control structure. As part of this project, opportunities for riparian and wetland habitat enhancements will be considered.
$ 175,000 Short-term
7 Levee Improvements in Subsidence Area
Lower San Joaquin Levee District
Reggie Hill Improve Eastside Bypass levees in areas of subsidence. As part of this project, opportunities for riparian and wetland habitat enhancements will be considered.
$ - Short-term
8 Sediment Removal in the Eastside Bypass
Lower San Joaquin Levee District
Reggie Hill Sediment removal in the Eastside Bypass to restore channel design capacity. $ 12,850,000 Short-term
9 Sand Slough Control Structure Removal
Lower San Joaquin Levee District
Reggie Hill Removal of the Sand Slough control structure to improve fish passage and increase flow capacity. $ 290,000 Long-term
Upper San Joaquin River Regional Flood Management Plan 5-5

PROPOSED SYSTEM IMPROVEMENTS
Table 5-2. Summary of System Improvements
System Improvement
ID
System Improvement Name Lead Agency
Contact Person
Partner Agency System Improvement Description Estimated Cost
System Improvement
Timeframe (Short-term <5 yrs, Long-term >5 yrs)
10 Gravelly Ford Madera Ranch Recharge Project
Gravelly Ford Water District
Don Roberts Madera Irrigation District
Gravelly Ford WD is located north and east of the San Joaquin River in Madera County. The District has an existing diversion from the river located approximately 8 miles upstream of the Chowchilla bifurcation structures. The District's existing water delivery system includes open ditches, pipelines, control structures, and pumps. The system runs west from the river diversion point then turns north. The proposed Madera Irrigation Water Bank land is located between Avenue 7, which is about 3 miles north of the turn, and Avenue 12. Gravelly Ford's system has the ability to convey water from the river to the water bank lands, but a number of improvements are needed to maximize capacity and improve the operating efficiency. The improvements would include replacement of existing road crossing culverts, modifications to control structures, water measurement improvements, and canal and pipeline enlargements. Floodwater diverted to the land would be spread for groundwater recharge and then reused for irrigation. The proposed improvements would allow the delivery system to operate in both directions to bring floodwater in and then later distribute the recaptured groundwater for irrigation. With the proposed improvements the system could divert a maximum flow of 50 cfs. A possible secondary benefit would be to make some of the banked water available to the Red Top area through transfers to help mitigate subsidence.
$ 1,970,000 Short-term
11 Flooding Existing Pasturelands
Gravelly Ford Water District
Don Roberts Madera Irrigation District
There are two blocks of existing pastureland located immediately north of Firebaugh Avenue, which crosses the Chowchilla Canal Bypass channel about 7 miles east of Firebaugh. On the west side of the Bypass channel, approximately 1,400 acres of nonirrigated pasture could be flooded. A new turnout from the Bypass channel and a pipeline across the Chowchilla Canal would be needed to deliver floodwater to this land. On the east side of the Bypass channel, approximately 1,700 acres of pasture could be flooded. About half of this acreage already has an existing flood irrigation system that could be used to distribute floodwater. The system irrigates from east to west, so approximately 2 miles of new pipeline would be needed to divert Bypass water to the east side of the property.
$ - Long-term
12 Great Valley Grasslands State Park Levee Deauthorization
Great Valley Grasslands State Park, Lower San Joaquin Levee District
Heather Reith, Reggie Hill
In 2011, the California Department of Parks and Recreation assessed the feasibility of restoring floodplain connectivity and dependent habitats to approximately 330 acres within the GVGSP. The SI would provide a more natural floodplain process to help control exotic species and restore geomorphic and ecological conditions similar to the pre-levee conditions. The SI would reduce flood flow constraints below Highway 165, thereby improving upstream flood conditions in Stevinson WD. The levee along the river would be deauthorized to allow floodwater to flow into State Park lands. SI will include wetland creation and invasive species removal. Proposed improvements on GVGSP should be coordinated with adjacent SIs proposed on San Luis NWR units (projects 60-65 on this list) to optimize attainment of flood and ecosystem benefits in this area.
$ 4,930,000 Short-term
13 Bridge Enlargement over Eastside Bypass at Sandy Mush Road
Lower San Joaquin Levee District
Reggie Hill Merced County The Sandy Mush Road crossing of the Eastside Bypass Channel includes a bridge deck and piles with elevated road embankments at each end of the bridge. The flow area under the bridge and between the embankments is much less than the upstream flow area of the Bypass. This constricts flood flows and causes upstream freeboard encroachment. The elevated road embankments have been cut three times in the past to allow the flood flows to pass. Cutting the road is problematic for Merced County because the road is designated as an arterial evacuation route. The bridge needs to be lengthened to reduce the flow restriction. An alternative option could be to install culverts in the embankments to reduce the flow area. As part of this project, opportunities for riparian and wetland habitat enhancements will be considered.
$ 1,610,000 Short-term
14 Install New Gaging Stations Lower San Joaquin Levee District
Reggie Hill Gaging stations to anticipate flows into the Eastside Bypass. $ 330,000 Short-term
15 Western Madera and Merced County Subsidence Solution
Red Top and Washington Avenue area growers
Chris White, CCID
Central California Irrigation District and San Luis Canal Company, Madera County
The Red Top Area Joint Banking project would consist of a combined banking and overdraft correction program in the Red Top/El Nido (Washington Avenue) areas east of the San Joaquin River in an effort to reduce pumping groundwater from below the Corcoran Clay. Significant subsidence has been observed in this area. Red Top area growers are planning to develop 720 acres of recharge ponds, 30 new shallow water wells, and surface water distribution to 26,000 acres of lands currently irrigated with well water. The recharge areas could be expanded, and if flood flows occur before vine or tree budding, larger cropped areas could be flooded. Based on current projections the 720 acres of ponds can provide capacity to absorb about 180 cfs off the flood system. Over 3 months that adds up to 32,400 AF. Potential rehabilitation of existing and construction of new turnouts from the San Joaquin River flood system will be considered along with direct pipelines to the recharge sites. The water source could be from the Fresno and Chowchilla River systems, San Joaquin River flood flows, Kings River flood flows, which are limited to a few months in wet years. Also, the SJRECWA and/or Friant. Contractors could sell water to the growers directly. For the El Nido/Washington Avenue area, the projects would consist of detention reservoirs scattered throughout the area north of Highway 152 to enable transitory storage, thereby extending the availability of surface water by a month for use by growers. This reduces groundwater pumping, which will help reduce subsidence. Additional turnouts from the Eastside Bypass and potential extensions of local irrigation systems to the area are under evaluation. Adding tile drains to the reservoirs with connections to the aquifer below the Corcoran Clay would also be evaluated.
$ 19,600,000 Short-term
5-6 Upper San Joaquin River Regional Flood Management Plan

PROPOSED SYSTEM IMPROVEMENTS
Table 5-2. Summary of System Improvements
System Improvement
ID
System Improvement Name Lead Agency
Contact Person
Partner Agency System Improvement Description Estimated Cost
System Improvement
Timeframe (Short-term <5 yrs, Long-term >5 yrs)
16 Los Banos Creek Recharge and Recovery
Central California Irrigation District
Chris White, General Manager
SJRECWA, San Luis Water District, Grassland Water District, City of Los Banos
The Los Banos Creek Recharge and Recovery project includes construction of 103 acres of recharge ponds and six recovery wells along Los Banos Creek between the California Aqueduct and the CCID Outside Canal. The project would receive surface water from Los Banos Creek, the SJRECWA, San Luis WD, CCID Main, and Outside Canals or through exchange from other contractors. The DMC and Outside Canal would be used to convey the water to the bank. Water wells will be piped to the DMC and CCID Outside canals.
$ 5,000,000 Short-term
17 Update San Joaquin River Flood Control Project Operations and Maintenance Manual
Lower San Joaquin Levee District
Reggie Hill Update the existing San Joaquin River Flood Control Project Operations and Maintenance Manual for Levees, Irrigation and Drainage Structures, Channels, and Miscellaneous Facilities that the Reclamation Board prepared in 1967. This update will require hydraulic modeling and will include significant USACE, CVFP, and DWR coordination.
$ 500,000 Short-term
18 Eastside Acres San Joaquin River Levee Project
Madera County Johannes Hoevertsz
City of Firebaugh and CSA 5 Eastside Acres
The Community of Eastside Acres, a housing subdivision consisting of about 70 residences and one commercial business, is located east of the city of Firebaugh along the right bank of the San Joaquin River in Madera County. Eastside Acres is in the 100-year flood plain and sand bagging is required during routine flood events. The conceptual levee project layout consists of a ring levee system that would encircle the housing subdivision. The ring levee would be approximately 1.32 miles in length, and have an average height of 4.63 feet.
$ 1,210,000 Long-Term
19 Fresno Slough South Levee Repair and Floodplain Enhancement Project
Fresno Slough Improvement Group
Steve Stadler (KRCD)
Improve the south levee, which has open toe drains and inadequate freeboard. Improvements might include removing the toe drains, rebuilding the levees, and bringing the levees under the jurisdiction of a responsible stakeholder. Enhancements would involve the modification of existing levees surrounding a State-owned parcel of land. The levee modifications would improve flow over the land and reduce pressure on other nearby levees during flood events. The current configuration of levees and cuts concentrates channel flow and increases the pressure at a weak point of the nearby levees.
$ 1,340,000 Short-term
20 Fresno Slough Sediment Removal
Fresno Slough Improvement Group
Steve Stadler (KRCD)
Remove sediment from Fresno Slough both inside and outside the Wildlife Refuge. It is uncertain, but probable to obtain permits to do this work. It would be easier and less costly if the work could be done at the same time that the Mendota Pool is dewatered for maintenance.
$ 720,000 Short-term
21 Upper San Joaquin Sediment Study
Lower San Joaquin Levee District
Reggie Hill Develop a sediment study in USJR region that identifies upstream sources of sediment and expand regional mitigation efforts. $ 100,000 Short-term
22 Bear Creek Diversion Channel Feasibility Study
Merced Streams Group Based upon review of existing information, a diversion channel located upstream of Merced may significantly reduce flood risk within the City. The diversion channel would run in a south/southwest direction from Bear Creek. A feasibility study is needed to evaluate different options for the SI and define benefits and applicability.
$ 100,000 Short-term
23 Le Grand/Planada Flood Control/Conjunctive Use Expansion Study
Merced Irrigation District
Hicham Eltal Merced Streams Group
The Le Grand canal was originally constructed to convey irrigation flows from Lake Yosemite south to the Planada and Le Grand area. The canal crosses multiple ravines and waterways along its course, including Black Rascal Creek and Bear Creek. The canal is the official spillway for Lake Yosemite. During flood season, Merced ID breaches its southerly bank to discharge conveyed flows from the lake to Black Rascal Creek and prevent the canal from overtopping downstream due to limited channel capacity downstream. This multipurpose SI study is to redirect and route the floodwaters from Lake Yosemite, Black Rascal Creek, Bear Creek and the watershed between them safely downstream through various conveyance systems for beneficial uses in the southern Merced region where groundwater is the main supply. A series of checks and diversion structures would be constructed along the canal to control and manage flood flows. Various reaches of Le Grand and Planada Canals must be enlarged as well to accommodate higher flows. The SI is needed to provide protection against the overtopping of Lake Yosemite, especially in the case of storms occurring within the irrigation season. The SI would allow Merced ID to move from an irrigation season mode to flood management mode and vice versa with minimal impact to the system, University of California at Merced, the city of Merced, and Merced County. Additionally, the SI is needed to prevent the Le Grand and Planada Canals from breaching during high flood flows. The controlled floodwaters may be re-routed to provide additional water supply downstream for various uses such as environmental, recharge, and counter subsidence measures. This multiphased and multipurpose SI allows the MSG to direct floodwater away from the city of Merced, Franklin Beachwood, Stevinson, and Planada areas as needed. Floodwaters would then be directed to other areas downstream for flood management, natural resources management, water supply, land subsidence mitigation, and providing in-lieu recharge. This SI also provides for Lake Yosemite’s volume to increase by 4,000 AF for irrigation purposes and allows for draining of 4,000 AF from Lake Yosemite in less than half the current time in preparation for major storms.
$ 240,000 Short-term
Upper San Joaquin River Regional Flood Management Plan 5-7

PROPOSED SYSTEM IMPROVEMENTS
Table 5-2. Summary of System Improvements
System Improvement
ID
System Improvement Name Lead Agency
Contact Person
Partner Agency System Improvement Description Estimated Cost
System Improvement
Timeframe (Short-term <5 yrs, Long-term >5 yrs)
24 Le Grand Canal Flood Control Structure at Black Rascal Creek
Merced Irrigation District
Hicham Eltal Merced Streams Group
Le Grand Canal is considered the official spillway to Lake Yosemite by the DSOD. The canal commences at the lake and traverses southeasterly along the foothills toe contour toward the town of Planada. As a result, the canal intercepts or bypasses all creeks and ravines draining the foothills. The first major waterway it crosses is Black Rascal Creek. The Canal crosses the creek with a double-barrel reinforced-concrete box. However, at the end of the irrigation season, Merced ID breaches the right bank of the canal and places a temporary dam, whereby all flood flows from Lake Yosemite are deposited to the creek. With the start of every irrigation season, the canal is repaired and flows could continue downstream. A control structure connected to Merced ID SCADA system would give Merced ID the flexibility to react timely and divert all or portion of flood flows as needed.As part of this project, opportunities for riparian and wetland habitat enhancements will be considered.
$ 490,000 Short-term
25 Bear Reservoir Enlargement and Downstream Levee and Channel Improvements
Merced Streams Group Kellie Jacobs Bear Reservoir was constructed in the early 1950s as an element of the MSG Project authorized by the 1944 Flood Control Act. The Flood Control Act of 1970 called for three additional flood control reservoirs, enlargement of existing reservoirs, and 52 miles of levee and channel modifications. To date, only one additional reservoir has been built (Castle Dam). The enlargement of Bear Reservoir, along with downstream levee and channel improvements, would increase the level of flood protection to the most populated areas of Merced County. Bear Reservoir was originally constructed to provide protection for up to a 50-year storm event. The State of California has adopted legislation that calls for a minimum of 200-year flood protection for urbanized areas. This SI would meet the requirements of the new flood control legislation. As part of this project, opportunities for riparian and wetland habitat enhancements will be considered.
$ 202,940,000 Long-term
26 Mariposa Reservoir Enlargement and Downstream Levee and Channel Improvements
Merced Streams Group Kellie Jacobs Mariposa Reservoir was constructed in the early 1950s as an element of the MSG Project authorized by the 1944 Flood Control Act. The Flood Control Act of 1970 called for three additional flood control reservoirs, enlargement of existing reservoirs, and 52 miles of levee and channel modifications. To date, only one additional reservoir has been built (Castle Dam). The enlargement of Mariposa Reservoir, along with downstream levee and channel improvements, would increase the level of flood protection to Planada and Le Grand, both of which are DACs in Merced County. Mariposa Reservoir was originally constructed to provide protection for up to a 50-year storm event. The State of California has adopted legislation that calls for a minimum of 200-year flood protection for urbanized areas. This SI would meet the requirements of the new flood control legislation. As part of this project, opportunities for riparian and wetland habitat enhancements will be considered.
$ 112,500,000 Long-term
27 Owens Reservoir Enlargement and Downstream Levee and Channel Improvements
Merced Streams Group Kellie Jacobs Owens Reservoir was constructed in the early 1950s as an element of the MSG Project authorized by the 1944 Flood Control Act. The Flood Control Act of 1970 called for three additional flood control reservoirs, enlargement of existing reservoirs, and 52 miles of levee and channel modifications. To date, only one additional reservoir has been built (Castle Dam). The enlargement of Owens Reservoir would increase the level of flood protection to Planada and Le Grand, both of which are DACs in Merced County. Owens Reservoir was originally constructed to provide protection for up to a 50-year storm event. The State of California has adopted legislation that calls for a minimum of 200-year flood protection for urbanized areas. This SI would meet the requirements of the new flood control legislation. As part of this project, opportunities for riparian and wetland habitat enhancements will be considered.
$ 8,850,000 Long-term
28 Burns Reservoir Enlargement and Downstream Levee and Channel Improvement
Merced Streams Group Kellie Jacobs Burns Reservoir was constructed in the early 1950s as an element of the MSG Project authorized by the 1944 Flood Control Act. The Flood Control Act of 1970 called for three additional flood control reservoirs, enlargement of existing reservoirs, and 52 miles of levee and channel modifications. To date, only one additional reservoir has been built (Castle Dam). The enlargement of Burns Reservoir would increase the level of flood protection to the most populated areas of Merced County. Burns Reservoir was originally constructed to provide protection for up to a 50-year storm event. The State of California has adopted legislation that calls for a minimum of 200-year flood protection for urbanized areas. This SI would meet the requirements of the new flood control legislation. As part of this project, opportunities for riparian and wetland habitat enhancements will be considered.
$ 39,180,000 Long-term
29 Merced Region Programmatic Environmental Impact Report for Streambed and Vegetation Control
Merced Streams Group Kellie Jacobs Vegetation and streambed/channel management is critical to decrease flood-related impacts in Merced County. Recent interpretations and application of CDFW codes have nearly halted streambed and channel maintenance. CEQA analyses for streambed alteration permitting for each project is expensive and defers maintenance creating complex unintended outcomes. The Merced region should explore the effectiveness and cost of preparing a local Programmatic Environmental Impact Report to reduce evaluation costs and speed up CEQA reviews related to flood management.
$ 300,000 Short-term
30 Merced County Flood Control District
Merced Streams Group Kellie Jacobs In the past decade, established flood control agencies have had great success in mitigating flood risk throughout California, due to their singular focus. Examples include the Sacramento Area Flood Control Agency, the Sutter Butte Flood Control Agency, the San Joaquin Area Flood Control Agency, and the San Joaquin County Flood Control and Water Conservation District. This option would involve the creation of a flood control agency for the region, either as an adjunct of Merced County or as a joint powers authority. The agency would be responsible for planning, coordinating, and managing flood control projects for the region. A central flood control agency could also perform O&M functions.
$ 100,000 Short-term
5-8 Upper San Joaquin River Regional Flood Management Plan

PROPOSED SYSTEM IMPROVEMENTS
Table 5-2. Summary of System Improvements
System Improvement
ID
System Improvement Name Lead Agency
Contact Person
Partner Agency System Improvement Description Estimated Cost
System Improvement
Timeframe (Short-term <5 yrs, Long-term >5 yrs)
31 Black Rascal Creek Flood Control Project
Merced County Kellie Jacobs Merced Streams Group
Construction of a regulating reservoir on the Black Rascal Creek watershed. SI location is immediately north of Yosemite Avenue and Arboleda Drive in northeast Merced. SI will provide protection against a 200-year storm event and much-needed flood control on the currently unprotected Black Rascal Creek watershed. SI will benefit all downstream areas of watershed. The reservoir will maintain a deadpool for wildlife purposes. During flood season the reservoir would be used primarily as a flood retention basin. During irrigation season, the reservoir would regulate irrigation flows and improve efficiency of Merced ID's water system without impacting power generation scheduling by the Independent System Operator at New Exchequer Dam. Based upon initial review of existing information, reducing flood flows in Black Rascal Creek at the Yosemite Avenue diversion to less than about 3,000 cfs by use of upstream detention will substantially reduce the flooding in the city of Merced. The completed SI could protect houses in the Franklin-Beachwood area, where over 80 homes were flooded during the 2006 flood. A flood control structure on Black Rascal Creek could also offer protection to other areas situated along Bear Creek. Merced County retained a consultant to investigate the feasibility of alternative flood control improvements, including alternative operation procedures and infrastructure improvements to the Lake Yosemite facilities, to reduce the peak flows at the Black Rascal Creek diversion. The study identified four different sites along Black Rascal Creek for construction of a detention basin. The amount of new storage provided by the various detention basins ranged from 300 to 2,500 AF. As part of this project, opportunities for riparian and wetland habitat enhancements will be considered.
$ 32,980,000 Long-term
32 Construct Ring Levees around Flood-Prone Areas
Merced County A ring levee is a levee that completely encircles an area subject to inundation from all directions. These can effectively protect structures or areas from shallow flooding. Ring levees are generally less than 5 feet tall and have minor impacts to the floodplain outside the ring. Ring levees could be constructed around single facilities or could encircle larger areas. For example, Marysville, California, is encircled by a ring levee. A recent residential subdivision on Hotchkiss Tract (Reclamation District 799) included a ring levee to reduce the likelihood of flood damage to these structures. A key to the feasibility of ring levees, particularly on discrete facilities, is the availability of right-of-way and the acceptability of risk of remaining inside during a flood with evacuation routes cut off.
$ - Long-term
33 Channel Dredging and/or Vegetation Removal
Merced County Merced Irrigation District, City of Merced
Streams, creeks, and rivers within the Merced region are periodically choked with vegetation, causing channel capacities to be exceeded during major floods. Removing some of this vegetation and/or excavating the channel would increase the carrying capacity and decrease the flood risk for select areas. This option could benefit reaches of Bear Creek, Black Rascal Creek, and Black Rascal Slough where current channel capacities are well below the 100-year level. This option could be implemented as a capital improvement project or implemented via current O&M activities.
$ 2,200,000 Short-term
34 Construct Levees or Channel Widening Projects along Creeks/Streams in the Region
Merced County Merced Irrigation District, City of Merced
Levees or channel widening projects would contain flood flows in existing channels for Bear Creek, Black Rascal Creek, Black Rascal Slough, Deadman Creek, Dry Creek, Fahrens Creek, and Mariposa Creek, all of which are subject to flooding. As part of this project, opportunities for riparian and wetland habitat enhancements will be considered.
$ - Long-term
35 Divert Flood Flows to Agricultural Lands
Merced County Merced Irrigation District, City of Merced
Diverting flood flows from Bear Creek, east of City of Merced, onto nearby agricultural land could decrease peak flows within the channel. Depending on the topography, the types of crops, and the willingness of the landowners, agricultural land could be utilized as detention basins where excess flood flows would be temporarily stored until water percolates back into the ground. Agricultural lands would be temporarily flooded, and the waters would be routed back into the channel after the high flows recede.
$ - Long-term
36 Ecosystem Restoration along Waterways
Merced County Merced Irrigation District, City of Merced
An alternative similar to routing flood flows onto agricultural land (SI 35) would be to acquire riparian areas of agricultural land and restore natural floodplains. This type of flood control SI could be implemented as an ecosystem mitigation bank. A secondary benefit to this option would be the direct recharge of groundwater. This type of SI might be feasible for reaches of Bear Creek located upstream and downstream of city of Merced. Costs would vary, depending on the number of parcels acquired, willingness of landowner to sell all or part of their property, and environmental impacts.
$ - Long-term
37 Modify Land Use Designations
Merced County City of Merced Merced County currently imposes development restrictions for Special Flood Hazard Areas (Chapter 18.34 of the County Code) in accordance with FEMA and the National Flood Insurance Program. Merced County’s Floodplain Land Use Ordinance also provides formal primary and secondary floodplain zones along streams and describes limitations on land uses in these zones. Modifications to the existing land use designations within the Merced Region could direct growth outside of the floodplain. New options include: imposing elevation requirements for new development within the 200-year or 500-year floodplain, limiting or restricting new development within the 200-year or 500-year floodplain in accordance with SB 5 requirements, or designating permanent agricultural zones. Although this option might inhibit economic growth in floodplains, it may reduce flood risk and ultimately cost less than flood control system capital improvements.
$ - Short-term
38 Develop Emergency Response Plans
Merced County City of Merced The objective of an emergency response plan is to prevent loss of life, reduce physical damage to public and private property (e.g., evacuation equipment, pre- and post-flood fight materials), and plan for speedy recovery with disaster management and communication. The development of emergency response plans are typically a low-cost/high-benefit option for mitigating flood risk.
$ 100,000 Short-term
Upper San Joaquin River Regional Flood Management Plan 5-9

PROPOSED SYSTEM IMPROVEMENTS
Table 5-2. Summary of System Improvements
System Improvement
ID
System Improvement Name Lead Agency
Contact Person
Partner Agency System Improvement Description Estimated Cost
System Improvement
Timeframe (Short-term <5 yrs, Long-term >5 yrs)
39 Increase Public Awareness of Flooding
Merced County Merced Irrigation District, City of Merced
Increasing the public’s knowledge about flood risk is another nonstructural alternative for mitigating flood risk. In addition to improving safety during floods, the efforts can enhance public support of flood control projects. Typical forms of outreach include press releases, individual mailer brochures, website development, posters, “flood awareness month,” and social networking site involvement. Note that the public outreach efforts can often be completed in conjunction with other related projects to reduce costs. Merced and other communities are prone to flooding from the creeks in the region. Increasing public awareness of flood season, precautionary measures, and their location with respect to the floodplain may be effective in reducing flood damages.
$ 50,000 Short-term
40 Monitor Creek Water Quality and Storm Drainage Discharges
City of Merced This SI is to monitor the discharges from stormwater runoff into the local creeks and monitor the quality of those creeks affected by the discharges.
$ 100,000 Short-term
41 Update Stormwater Design Standards for the City and Region
City of Merced Update the design standards for stormwater for the Merced region. $ 80,000 Short-term
42 Windmill Ditch Drainage Merquin County Water District
Garth A. Pecchenino
Installation of approximately 4,500 feet of pipeline to transport drainage waters to an existing ditch that discharges to the San Joaquin River. The existing Windmill Ditch intercepts floodwater upstream of the community in the northeast area. This installation would allow floodwaters to be moved around the community.
$ 1,900,000 Short-term
43 McCullough Road Drainage Project
Merquin County Water District
Merced County Installation of approximately 5,000 feet of pipeline to replace the use of existing on-farm ditches and roadside ditches to convey storm floodwaters and drainage waters away from the intersection of 4th Avenue and McCullough Road. The makeshift operation of using private and public facilities over the years has left the area flooded in most wet years.
$ 2,700,000 Short-term
44 San Joaquin River Levee at Firebaugh Wastewater Treatment Plant
City of Firebaugh Mario Gouveia, City Engineer
The City of Firebaugh's wastewater treatment plant is located near the west bank of the San Joaquin River at the south end of Firebaugh. Flood flows in the river have threatened the treatment plant in recent years. Constructing an earthen levee between the river and the treatment plant would protect it against future flooding. Undeveloped space along the upper floodplain of the river is available for the proposed levee. Untreated effluents from the City of Firebaugh's waste water treatment plant would threaten the water quality of the San Joaquin River in case of catastrophic flooding in the area. This project could include recreation and environmental enhancement components.
$ 1,280,000 Short-term
45 San Joaquin River Bank Stabilization at Firebaugh
City of Firebaugh Mario Gouveia, City Engineer
Just north of 13th Street (Firebaugh Boulevard) the San Joaquin River turns due west toward downtown Firebaugh. It then makes a sharp turn to the northwest and parallels the downtown area. In recent years, a bank stabilization project was constructed at this turn that included sheet piling and rock-filled wire cages. About 0.25 mile downstream of this project, the river makes another sharp turn to the northeast near the intersection of 9th Street and Q Street. The west bank at this turn is steep, unstable, and less than 50 feet from several residences. A second bank stabilization SI with a similar configuration to the first is needed at this location. This project could include recreation and environmental enhancement components.
$ 1,800,000 Short-term
46 San Joaquin River Levee at Firebaugh Rodeo Grounds
City of Firebaugh Mario Gouveia, City Engineer
One of Firebaugh's water treatment plants is located south of the 13th Street (Firebaugh Boulevard) bridge that crosses the San Joaquin River. The City's rodeo grounds and a park area are located north of the bridge. Flood flows in the river have inundated the rodeo grounds and threatened the treatment plant in recent years. Constructing an earthen levee between the river and the facilities would protect them from future flooding. Undeveloped space along the upper floodplain of the river is available for the proposed levee. This project could include recreation and environmental enhancement components.
$ 1,450,000 Short-term
47 Three Rivers Ranch Study 3F Group (Trout Unlimited, Ducks Unlimited, and American Rivers)
Chris Unkel Trout Unlimited, Ducks Unlimited, and American Rivers
Three Rivers Ranch is situated on 205 acres directly adjacent to the Eastside Bypass on the west, Owen’s Creek on the north, and the Eastside Canal on the other. Currently, the entire property is managed for waterfowl habitat and includes seasonal and semi-permanent wetlands, riparian habitat and grassland, and shrub/scrub uplands. Water is supplied to the wetlands either from the Eastside Canal, which then must be lifted, or from a deep well that flows approximately 2,000 gallons per minute (gpm). The landowner is continually working to restore native habitats on the property and allows limited waterfowl hunting during the hunting season. The SI consists of improvements to the connection of the wetlands to the adjacent waterways, providing flood attenuation, juvenile salmonid rearing, groundwater recharge, more stable wetlands, and recreation.
$ 100,000 Short-term
48 Cinnamon Slough Study (Merced National Wildlife Refuge)
3F Group (Trout Unlimited, Ducks Unlimited, and American Rivers)
Chris Unkel Trout Unlimited, Ducks Unlimited, and American Rivers
This unit of the Merced NWR, adjacent to the Eastside Bypass, has recently been restored for wetlands by Ducks Unlimited. The USFWS staff at the refuge complex is supportive of a SI that would connect the Bypass to the Unit and thereby provide additional irrigation for wetlands while also providing rearing opportunities for spring and fall-run chinook salmon. Water is supplied by a low-lift pump on the northwest end of the site. Additional lands within the NWR boundaries, adjacent to the Unit and inside the Bypass, could also serve as rearing habitat if the topography were slightly modified. This SI would provide flood attenuation, juvenile salmonid rearing, groundwater recharge, more stable wetlands, and recreation.
$ 100,000 Short-term
5-10 Upper San Joaquin River Regional Flood Management Plan

PROPOSED SYSTEM IMPROVEMENTS
Table 5-2. Summary of System Improvements
System Improvement
ID
System Improvement Name Lead Agency
Contact Person
Partner Agency System Improvement Description Estimated Cost
System Improvement
Timeframe (Short-term <5 yrs, Long-term >5 yrs)
49 Sunrise Ranch Study 3F Group (Trout Unlimited, Ducks Unlimited, and American Rivers)
Chris Unkel Trout Unlimited, Ducks Unlimited, and American Rivers
Owned and operated by Grissom Family Land and Cattle, Sunrise Ranch is situated on 1,750 acres with the Eastside Canal passing through on the westerly portion. Currently, the entire property is managed for cattle grazing and waterfowl habitat, including seasonal and semi-permanent wetlands and grassland uplands. The landowner maintains a low-pressure grazing program to promote excellent grass growth in future years. Ducks Unlimited is currently working on a wetland restoration project with the landowner to restore wetland topography and hydrology. The SI consists of improvements to the connection of the wetlands to the adjacent waterways, providing flood attenuation, juvenile salmonid rearing, groundwater recharge, more stable wetlands, and recreation.
$ 100,000 Short-term
50 SJRRP Seepage Management Projects
San Joaquin River Restoration Program
Katrina Harrison
Reclamation Existing SJRRP seepage management options include actions that could benefit flood management in the region, including levee improvements, drainage improvements, conveyance improvements, and property acquisition. These actions are being evaluated throughout the San Joaquin River and Eastside Bypass. Continuing coordination with Reclamation on seepage management strategies may result in identification of potentially‐compatible flood projects that can be coordinated with the USJR RFMP (such as the Firebaugh Flood Protection/Habitat Project).
$ 185,000,000 Short-term, Long-term
51 Firebaugh Habitat Projects San Joaquin River Restoration Program
Katrina Harrison
Reclamation SJRRP is appraising several properties that might be affected by shallow groundwater seepage in Reach 3 of the San Joaquin River due to the SJRRP. SJRRP acquisition of these properties could result in multibenefit projects for transitory flood storage near Firebaugh and floodplain habitat and associated flood benefits. In addition, the properties could be rented or leased back to growers (estimated farmable in 80% of years) to eliminate or minimize the amount of agricultural land taken out of production. Habitat work could be done by economically DACs of Firebaugh and Mendota to provide flood benefits. This project should be coordinated with the City of Firebaugh levee improvement projects (44 to 46 on this list) to provide mitigation and multibenefit SIs for this area.
$ - Long-term
52 Levee Improvements in Reach 2A, 3, 4A, Eastside Bypass, Mariposa Bypass, and Reach 5
San Joaquin River Restoration Program
Paul Romero California DWR The SJRRP is increasing channel capacity to 4,500 cfs in Reaches 2B and 4B through major projects. Levees in other reaches might also need improvements to increase capacity to 4,500 cfs. An initial hydraulic evaluation has been done, and DWR has prioritized the next step in data collection and geotechnical evaluation. The result of the further evaluation will help the SJRRP identify future remediation needs for existing levees. Initial SI costs were developed assuming that all levees will need remediation; these costs will decrease as geotechnical evaluations are completed. As a part of this project, interagency agreements, funding, and coordination will be formalized.
$ 235,000,000 Short-term, Long-term
53 Sediment Removal in Reach 4A and Eastside Bypass
San Joaquin River Restoration Program
Katrina Harrison
Reclamation Reclamation is pursuing sand removal on the Merced NWR to improve conveyance capacity in the Eastside Bypass at and downstream of El Nido Road. Permitting is underway, and sand is expected to be removed by 2015.
$ - Short-term
54 Reach 2B/Mendota Pool Bypass
San Joaquin River Restoration Program
Katrina Harrison
Reclamation Reach 2B levees will be set back by the SJRRP to provide floodplain habitat for fish and increase the capacity of Reach 2B to 4,500 cfs (from an estimated 1,300 cfs). Floodplain could be used as transitory storage, and this SI will repair any levee stability issues in this reach by replacing them. This SI would increase flood protection to lands in the area and could increase operational flexibility to manage flood releases. Continued coordination with flood agencies could result in additional benefits. The SJRRP will be constructing a means for fish passage over Mendota Dam, either through the Mendota Pool Bypass or the Fresno Slough Dam. Fresno Slough Dam may have benefits to improving the ability of CCID to manage flood flows in Mendota Pool through a new dam. The Mendota Pool Bypass could provide flood benefits by an expanded river width/floodplain and an alternate channel around Mendota Pool. As a part of this project, interagency agreements, funding, and coordination will be formalized.
$ 295,000,000 Long-term
55 Reach 4B Improvements San Joaquin River Restoration Program
Katrina Harrison
Reclamation The SJRRP is required in the Settlement to increase the capacity of Reach 4B1 of the San Joaquin River to 475 cfs (from an estimated 20 cfs). In addition, the SJRRP will determine whether to route fish and flows up to 4,500 cfs through Reach 4B1 of the San Joaquin River, or through the Eastside Bypass, or some combination. Setback levees would be built in any case. If flows are to be routed into the Eastside Bypass, Mariposa Bypass, and then to Reach 4B2, Mariposa Bypass setback levees might also be built. Setback levees maintain flood capacity, repair existing flood levees, and allow for habitat improvements such as vegetation growth within the channels. As a part of this project, interagency agreements, funding, and coordination will be formalized.
$ 234,199,000
Long-term
56 Reach 2B Project – San Mateo Road Crossing
San Joaquin River Restoration Program
Katrina Harrison
Reclamation Construct a crossing across the San Joaquin River at San Mateo Avenue and build levee setbacks as part of the project in Reach 2B. $ 9,600,000
Long-term
57 Fish Passage Improvement at Flood Control Structures
San Joaquin River Restoration Program
Katrina Harrison
Reclamation Flood control structures in the Mariposa Bypass, Eastside Bypass, and the San Joaquin River including the Sand Slough control structure, Reach 4B head gates, and the Chowchilla bifurcation structure are partial barriers to fish passage at higher flows and might be complete barriers at lower flows. Some of these structures could be in need of repair or replacement by SJRRP in order to adequately serve their intended flood management purpose and meet fish passage requirements.
$ - Long-term
Upper San Joaquin River Regional Flood Management Plan 5-11

PROPOSED SYSTEM IMPROVEMENTS
Table 5-2. Summary of System Improvements
System Improvement
ID
System Improvement Name Lead Agency
Contact Person
Partner Agency System Improvement Description Estimated Cost
System Improvement
Timeframe (Short-term <5 yrs, Long-term >5 yrs)
58 Arroyo Canal Screening and Sack Dam Passage
San Joaquin River Restoration Program
Katrina Harrison, Chase Hurley
Reclamation, Henry Miller Reclamation District
The SJRRP and Henry Miller Reclamation District will be constructing the new Sack Dam and providing a fish screen at Arroyo Canal. The new Sack Dam could improve the operational ability to release water into Reach 4A during flood conditions.
$ 25,000,000 Long-term
59 Salt Slough Barrier and Mud Slough Barrier
San Joaquin River Restoration Program
Katrina Harrison, Chase Hurley
Reclamation, Henry Miller Reclamation District
Construct fish screens/barriers at Salt Slough and Mud Sloughs to prevent fish straying. $ - Long-term
60 Modify water intake structures at selected NWR units
USFWS, San Luis National Wildlife Refuge Complex
Kim Forrest There are 40 locations on the East Bear Creek Unit, West Bear Creek Unit, and San Luis Unit where pipes with flap gates are present in the flood control levees of the San Joaquin River and Eastside Bypass. Some of these locations are well situated to divert floodwaters onto NWR lands. Screw gates could be installed where needed, and catwalks to these screw gates could be placed on existing pipes. In some locations water control structures and/or armoring of existing water conveyance facilities would be needed. This would allow multiple controlled diversions onto refuge floodplain lands.Control on volume and limits on amounts of water diverted at these locations would be necessary to prevent damage to refuge infrastructure, resource values, and adjacent private lands. A study would be needed to determine which of these possible diversion points for floodwater would benefit wildlife conservation and floodwater storage objectives the best. At some locations, enhancement of existing channels likely would be necessary to achieve the desired outcome—placing water into already defined managed wetlands, managed riparian habitat, or low elevation uplands, which evolved under conditions that included low-depth (sheet-water) flooding. This SI would seek to further develop a subset of the 40 available sites.
$ 1,540,000 Short-term
61 San Luis NWR East Bear Creek Unit Install lift pumps to divert water onto 1,000 acres of wetland basins during flood flows
USFWS, San Luis National Wildlife Refuge Complex
Kim Forrest The East Bear Creek Unit has a pumping plant on Bear Creek that is used to flood approximately 1,000 acres of managed wetlands when the water level elevation of Bear Creek is between 66 feet and 83 feet. The pumping plant is equipped with four 125-hp lift pumps. Until a water level elevation of 83 feet is reached, the pumping plant can divert up to 120 AF per day of floodwater into managed wetlands and floodplain. When water level elevation exceeds 83 feet (a common condition during flood events), the pumping plant intake alarm goes off, and the pumping plant is shut down. Once a water level elevation of 83 feet is exceeded, the following options could be implemented to divert water onto the unit (which is bounded by levees on all sides but does have frequent intake/discharge points):
a) Install a lift pump (125-hp pump capable of diverting 30 AF per day) just northeast of the pumping plant on Bear Creek and build a short pipeline to connect with the existing 2-mile-long pipeline utilized by the pumping plant. This would enable NWR staff to continue diversions into the East Bear Creek Unit throughout a flood event regardless of water level elevation. Electrical power is available at the site.
b) Install a lift pump (125-hp pump capable of diverting 30 AF per day) at an existing but now defunct diversion point on the San Joaquin River and build a short pipeline to connect with the terminus of the existing 2-mile-long pipeline. The station could also divert water into an existing 0.8-mile-long canal running parallel to the San Joaquin River, which delivers water to a series of riparian wetlands currently cutoff from the river by the flood control levee. The improvements would restore floodplain channel and basins that extend across the length of the unit.
$ 1,260,000 Short-term
62 San Luis NWR East Bear Creek Unit Restore a wetland swale to divert floodwaters onto 1,000 acres of wetland basins during flood flows
USFWS, San Luis National Wildlife Refuge Complex
Kim Forrest Utilize an existing pipe and screw gate on the flood control levee east of the USFWS pumping station to divert floodwaters. Construct a wide swale leading from the levee to an existing refuge ditch to convey water to the restored floodplain swales and basins extending across the East Bear Creek Unit.
$ 340,000 Short-term
63 San Luis NWR East Bear Creek Unit Enhance existing wetland depth and configuration to provide additional habitat and floodwater storage on approximately 500 acres of wetland basins
USFWS, San Luis National Wildlife Refuge Complex
Kim Forrest A portion of the existing restored wetlands in the East Bear Creek Unit, which currently comprise approximately 1,000 acres, could be enhanced by deepening, expanding, and reconfiguring the current wetland acreage. This work would increase the capability of the unit for transitory floodwater storage while improving the wetlands for wildlife. This project would identify several options to achieve these objectives and fully develop and implement those options most feasible and efficient to meet the desired objectives.
$ 1,150,000 Short-term
5-12 Upper San Joaquin River Regional Flood Management Plan

PROPOSED SYSTEM IMPROVEMENTS
Table 5-2. Summary of System Improvements
System Improvement
ID
System Improvement Name Lead Agency
Contact Person
Partner Agency System Improvement Description Estimated Cost
System Improvement
Timeframe (Short-term <5 yrs, Long-term >5 yrs)
64 San Luis NWR Freitas Unit – restore anabranches of Salt Slough
USFWS, San Luis National Wildlife Refuge Complex
Kim Forrest During flood events, water from the San Joaquin River backs up and raises the level of Salt Slough. Numerous anabranches extend out of Salt Slough and have potential to spread water westward into the Freitas floodplain. However, the capacity for this is limited because most of the anabranches are silted in at their confluences with Salt Slough. Silt removal could be implemented to lower the channel grades back to level that would more readily accept high water from Salt Slough. Floodwaters would be spread into floodplain basins and swales west of Highway 165. The large double- and triple-box culvert crossings under the highway should readily accommodate any flows through the anabranch channels. Highway 165 was built before flood control levee constructed. Restoring the channel grades might protect Highway 165 better than the existing condition because floodwaters would be conveyed west of the highway as waters were rising, rather than waiting until the floodwaters overtopped the Salt Slough main channel and caused much higher water levels to advance upon the highway.
$ 50,000 Short-term
65 San Luis NWR West Bear Creek Unit Restore wetland slough channel connectivity with the San Joaquin River to accommodate flood flows
USFWS, San Luis National Wildlife Refuge Complex
Kim Forrest This project seeks to enhance an existing location where a pipe and screw gate already permit the diversion of flood flows from the San Joaquin River into a water delivery canal that provides water to some 3,500 acres of wetlands. This project would enhance the size of the structures both leading into and exiting this canal at a location that would allow the diversion of water into a naturally existing floodwater basin that is currently cut off from the San Joaquin River. This project likely would require increasing the size and armoring four existing water control structures to accommodate the increased capacity at these four locations.
$ 354,000 Short-term
66 Merced NWR Merced Unit Enhance infrastructure to divert flood flows onto 1,200 acres of existing wetlands and other NWR lands
USFWS, San Luis National Wildlife Refuge Complex
Kim Forrest There are numerous locations on the Merced Unit where pipes with flap gates are present in the flood control levees of the Eastside Bypass, and are well situated to potentially divert floodwaters onto NWR lands. However, there is no direct connection to move that water into the NWR water conveyance system. The refuge currently uses a pipeline to move water throughout the managed wetland units and other refuge lands. The pipeline is close to the flood control levee. Additionally, there are refuge pumps in place that could be used to lift the water from the Bypass into the pipeline, but the pumps are currently not connected to the pipeline. At two locations along the levee, existing pumps could be reconfigured and connected to the existing pipeline. The connection between the pumps and the pipeline would allow floodwater to be diverted from the eastside Bypass into NWR managed wetlands. Control on volume and limits on amounts of water diverted at these locations would be necessary to prevent damage to refuge infrastructure, resource values, and adjacent private lands.
$ 235,000 Short-term
67 Merced NWR – Modify water intake structures at selected NWR units
USFWS, San Luis National Wildlife Refuge Complex
Kim Forrest Existing pipes with flap gates on flood control levee – further develop these sites to divert floodwaters onto refuge floodplain lands. There are numerous locations along the flood control levees at the Merced, Lonetree, and Sno-Bird units of Merced NWR where replacement of existing flap gates with new screw gates. Where necessary, catwalks would allow controlled diversion of floodwaters onto refuge lands. In some locations water control structures and/or armoring of existing water conveyance facilities would be needed. This would allow controlled diversions onto refuge floodplain lands at approximately 15 locations, some of which are noted as follows:
a) Merced Unit – There is potential for diverting water into Cinnamon Slough area. However, there is a need to consider impacts to managed refuge wetlands adjacent to the north.
b) Lonetree Unit – Floodwater could be diverted to areas outside the levee. However, there is a need to consider impacts to adjacent private farmlands to the east.
c) Sno-Bird Unit – There is potential to divert waters into north, middle, and south subunits. However, there is a need to consider flood impacts to adjacent landowners.
Control on volume and limits on amounts of water diverted at these locations would be necessary to prevent damage to refuge infrastructure, resource values, and adjacent private lands.
$ 580,000 Short-term
68 Merced NWR Sno-Bird Unit – Construct diversions off Eastside Canal
USFWS, San Luis National Wildlife Refuge Complex
Kim Forrest The Eastside Canal, which runs along the northern boundary of the Sno-Bird Unit, is also affected by flood events and can exceed its conveyance capacity and flood downstream locations. There is an opportunity to divert excess floodwater from the canal onto NWR floodplain lands.
a) Remove sediment in the canal at the existing weir diversion structure and rehabilitate the first section of the existing canal downstream of the weir. Replace the weir boards and make minor repairs to the concrete structure. Install two canal gates where the refuge canal flows into Bear Creek. One gate would be for an existing culvert and the other for a new culvert through the Bear Creek flood control levee. A new channel would be excavated inside the levee to connect the new culvert to the Bear Creek pilot channel. These improvements would allow floodwater to be spread in basins and swales in the north and middle subunits and then drain into the Eastside Bypass.
b) Install a new canal turnout structure in the Eastside Canal at the northwest corner of the Sno-Bird Unit. The site has been breached in the past to relieve pressure on the Eastside Canal and prevent downstream flooding. Controlled diversions could be spread into basins and swales of the north subunit and then drain back into the Eastside Bypass.
$ 263,000 Short-term
Upper San Joaquin River Regional Flood Management Plan 5-13

PROPOSED SYSTEM IMPROVEMENTS
Table 5-2. Summary of System Improvements
System Improvement
ID
System Improvement Name Lead Agency
Contact Person
Partner Agency System Improvement Description Estimated Cost
System Improvement
Timeframe (Short-term <5 yrs, Long-term >5 yrs)
69 Ash Slough Arundo and Channel Cleaning
Madera County Johannes Hoevertsz
Approximately 21 miles of channel clearing and arundo eradication within Ash Slough. Arundo is an aggressive bamboo weed that requires continual herbicide treatment to fully eradicate. Due to the high cost and lack of funding, Arundo has been allowed to grow unabated, and it is now constricting flood flows and reducing channel capacity. USACE has indicated that Ash Slough is no longer eligible under PL 84-99.
$ 1,500,000 Short-term
70 Berenda Slough Arundo and Channel Clearing
Madera County Johannes Hoevertsz
Approximately 18 miles of channel clearing and arundo eradication within Berenda Slough. Arundo is an aggressive bamboo weed that requires continual herbicide treatment to fully eradicate. Due to the high cost and lack of funding, Arundo has been allowed to grow unabated, and it is now constricting flood flows and reducing channel capacity.
$ 1,300,000 Short-term
71 Erosion Repair Project Madera County Johannes Hoevertsz
Perform erosion repairs in Fresno River and Berenda Slough. $ 1,500,000 Short-term
72 Levee Patrol Road Repair Madera County Johannes Hoevertsz
Perform repair and place aggregated base for levee patrol roads on approximately 12 miles on the Fresno River, Berenda Slough, and Ash Slough. Due to high cost and limited funding, repairs on levee patrol roads have been delayed, and vegetation has been allowed to grow unabated. In addition, adjacent landowners have made modifications to levee patrol roads to access private properties.
$ 500,000 Short-term
73 Berenda Creek Arundo Removal and Channel Clearing
Madera Irrigation District
Dina Nolan Approximately 13 miles of channel clearing and arundo eradication within Berenda Creek. Arundo is an aggressive bamboo weed that requires continual herbicide treatment to fully eradicate. Due to the high cost and lack of funding, Arundo has been allowed to grow unabated, and it is now constricting flood flows and reducing channel capacity.
$ 500,000 Short-term
74 Dry Creek Arundo and Channel Clearing
Madera Irrigation District
Dina Nolan Approximately 13 miles of channel clearing and invasive species removal within Dry Creek. Due to the high cost and lack of funding, vegetation has been allowed to grow unabated, and it is now constricting flood flows and reducing channel capacity.
$ 500,000 Short-term
75 Cottonwood Creek Arundo and Channel Clearing
Madera Irrigation District
Dina Nolan Approximately 13 miles of channel clearing and invasive species removal within Cottonwood Creek. Due to the high cost and lack of funding, vegetation has been allowed to grow unabated, and it is now constricting flood flows and reducing channel capacity.
$ 500,000 Short-term
76 Madera Irrigation District Water Bank Facility
Madera Irrigation District
Dina Nolan Develop water bank facility to capture flood flows and perform groundwater recharge. The facility can be used to bank water for future use.
$ 124,000,000 Long-term
77 Madera Canal/Hidden Dam Pump Storage Project
Madera Irrigation District
Dina Nolan The Madera Canal Hidden Dam Pump Storage Project has the potential to provide an average of up to 6,000 AF per year of additional water supply for use by Madera ID. Madera ID is currently seeking authorization from the USACE and will have to seek funding for the project. There are potential partnering opportunities for Madera County and other water agencies in Madera County that should be pursued. Flows for this SI could be diverted from Hidden Dam during floods.
$ 11,500,000 Long-term
78 Madera Lake Regulating and Recharge Project
Madera Irrigation District
Dina Nolan Regulating and recharge at Madera Lake. As part of this project, opportunities for riparian and wetland habitat enhancements will be considered.
$ 3,500,000 Long-term
79 Siphon Extension near Chamberlain Road
Lone Tree Mutual Water Company
George Parks Lone Tree Mutual Water Company has an existing irrigation ditch that crosses the East Side Bypass 0.5 mile south of Chamberlain Road. There are existing culverts under the Eastside Bypass levees and an existing siphon under the pilot channel of the Bypass, but there is open ditch within the Bypass channel between the levees and the pilot channel. High flows in the Bypass are impeded by the ditch banks, and the ditch must be cleaned and maintained following flood flows. Extending the siphon so it is continuous across the entire Bypass channel would improve flood operations, reduce maintenance, and bring the siphon up to current flood system standards.
$ 700,000 Short-term
80 Ingomar Reservoir Surface Storage
Central California Irrigation District and San Luis Canal Company
Chris White, CCID
The Ingomar Reservoir surface storage project includes expansion of the existing Ingomar Reservoir. The project is located east of the CCID Main Canal and north of Henry Miller Road. A 2013 report evaluated the expansion of the existing 41-acre site to about 650 acres (San Luis & Delta-Mendota Water Authority, 2013). The project would receive surface water from the SJRECWA or flood flows off the San Joaquin River or Kings River. CCID facilities would be used to convey water to the project lands.
$ 18,300,000 Long-term
81 San Joaquin River Invasive Species Management
River Partners and San Joaquin Parkway and Conservation Trust
Julie Rentner Map, treat, and monitor populations of invasive weeds within the channel and floodplain of the San Joaquin River between Friant Dam and the Merced River confluence.
$ 2,800,000 Short-term, Long-term
5-14 Upper San Joaquin River Regional Flood Management Plan

PROPOSED SYSTEM IMPROVEMENTS
Table 5-2. Summary of System Improvements
System Improvement
ID
System Improvement Name Lead Agency
Contact Person
Partner Agency System Improvement Description Estimated Cost
System Improvement
Timeframe (Short-term <5 yrs, Long-term >5 yrs)
82A Municipal Well Relocation/ Floodproofing in City of Mendota
City of Mendota David McGlasson
The City of Mendota relies on three municipal wells, all located south of the San Joaquin River and east of the Mendota Pool. Each of these wells is in a location that would be inundated by the flood levees proposed for construction by the San Joaquin River Restoration Program. Inundation of even one of the wells would result in loss of the City’s ability to deliver clean, healthful water to its customers. The wells are in the only local general location known to overlie water of such quality. All wells west of the Mendota Pool are of much lower quality, containing levels of iron, manganese, and turbidity exceeding the California Department of Public Health maximum concentration limits.
The first form of the project: Extend well casings to 3.0 feet above the maximum breakover elevation of the new flood channel. Build corresponding improvements to access roads, power supplies site lighting, distribution piping, fencing and other associated construction, so that the wells could remain in operation and be fully accessible by City staff under the most extreme and potentially long-lasting flood conditions. The City has no other water resources and so cannot plan for these wells to be out of service for even 24 hours at a time.
$ 6,431,782 Long-term
82B Municipal Well Relocation/ Floodproofing in City of Mendota
City of Mendota David McGlasson
The City of Mendota relies on three municipal wells, all located south of the San Joaquin River and east of the Mendota Pool. Each of these wells is in a location that would be inundated by the flood levees proposed for construction by the San Joaquin River Restoration Program. Inundation of even one of the wells would result in loss of the City’s ability to deliver clean, healthful water to its customers. The wells are in the only local general location known to overlie water of such quality. All wells west of the Mendota Pool are of much lower quality, containing levels of iron, manganese, and turbidity exceeding the California Department of Public Health maximum concentration limits.
The second form of the project: Relocate all three wells outside the proposed flood levee, farther to the south and still north of State Route 180. (This location has been validated as being the best location for municipal water wells.) Relocate all power supply and SCADA equipment. Extend raw water transmission pipeline from the existing well area to the new wells. Construct new access roads as needed.
$ 23,110,603 Long-term
83 Wastewater Treatment Plant Flood Levee in City of Mendota
City of Mendota David McGlasson
The City of Mendota wastewater treatment facility is located west of the Mendota Pool, separated from the waterway by a single parcel of farmland owned by another party. The plant is a series of open lagoons. Any inundation by the Mendota Pool would result not only in loss of wastewater treatment for the city of Mendota, but in flushing wastewater into the San Joaquin River. The plan itself has no outlet. Discharge is by percolation and evaporation only. The total volume of the wastewater lagoons onsite is approximately 250 million gallons. This project could include recreation components
$ 10,885,000 Long-term
84 Mendota Pool Park Flood Protection
City of Mendota David McGlasson
Mendota Pool Park is located adjacent to the west bank of the San Joaquin River and would be inundated in a major flood event, leading to damage to the park, picnic equipment, and associated improvements. Construction of a flood protection levee along the park boundary could mitigate this risk. This project could include recreation components.
$ 1,737,000 Long-term
85 Camp 13 Area Surface Storage
Central California Irrigation District & San Luis Canal Company
Chris White, CCID
The Camp 13 Area surface storage project includes construction of a reservoir project west of Firebaugh between the CCID Outside Canal and Main Canal. A 2013 report evaluated about 5,200 acres of land for potential storage (San Luis & Delta-Mendota Water Authority, 2013). The evaluation considered options for 500-, 1,000-, and 1,800-acre reservoir sites, at specific locations to be determined in the future. The project would receive surface water from the SJRECWA or flood flows off the San Joaquin River or Kings River. CCID facilities would be used to convey water to the project lands.
$ 44,000,000 Long-term
86 Orestimba Creek Recharge and Recovery Project
Central California Irrigation District and San Luis Canal Company
Chris White, CCID
The Orestimba Creek Recharge and Recovery Project includes construction of 85 acres of recharge ponds and five recovery wells along Orestimba Creek between the DMC and the Eastin WD boundary. The project would receive surface water from Orestimba Creek, San Joaquin River flood system, and CCID and/or Del Puerto WD. The DMC or CCID Main Canal could be used to convey San Joaquin River floodwater to the water bank. Water wells will be piped to the DMC or CCID Main Canal.
$ 8,200,000 Long-term
Notes: BCSDS = Bear Creek siphon and diversion structure hp = horsepower LM = levee mile
Upper San Joaquin River Regional Flood Management Plan 5-15

PROPOSED SYSTEM IMPROVEMENTS
This page intentionally left blank.
5-16 Upper San Joaquin River Regional Flood Management Plan

PROPOSED SYSTEM IMPROVEMENTS
Table 5-3. Proposed System Improvements by Category
System Improvement ID System Improvement Name
System Improvement Timeframe Short-term <5 years Long-term >5 years
System Improvement Category – Rural
1 Bear Creek Diversion Structure Short-term
2 Levee Breaches Unit 1, LM 9.90; Unit 5, LM 0.25 Short-term
4 Modernize Electrical Controls, Level Sensors, and SCADA for Control Structures
Short-term
5A Rehabilitation of San Joaquin River Control Structure Short-term
6 Sediment Removal Chowchilla Canal Bypass Control Structure Short-term
7 Levee Improvements in Subsidence Area Short-term
8 Sediment Removal in the Eastside Bypass Short-term
13 Bridge Enlargement over Eastside Bypass at Sandy Mush Road Short-term
14 Install New Gaging Stations Short-term
19 Fresno Slough South Levee Repair and Floodplain Enhancement Project
Short-term
21 Upper San Joaquin Sediment Study Short-term
79 Siphon Extension near Chamberlain Road Short-term
3 Raise Part of Left Bank Levee Unit 6 Long-term
5 Enlarge Chowchilla Canal Bypass Control Structure Long-term
9 Sand Slough Control Structure Removal Long-term
System Improvement Category – Urban
22 Bear Creek Diversion Channel Feasibility Study Short-term
23 Le Grand/Planada Flood Control/Conjunctive Use Expansion Study
Short-term
24 Le Grand Canal Flood Control Structure at Black Rascal Creek Short-term
29 Merced Region Programmatic Environmental Impact Report for Streambed and Vegetation Control
Short-term
25 Bear Reservoir Enlargement and Downstream Levee and Channel Improvements
Long-term
26 Mariposa Reservoir Enlargement and Downstream Levee and Channel Improvements
Long-term
27 Owens Reservoir Enlargement and Downstream Levee and Channel Improvements
Long-term
28 Burns Reservoir Enlargement and Downstream Levee and Channel Improvement
Long-term
31 Black Rascal Creek Flood Control Project Long-term
System Improvement Category – Small Community/DAC
42 Windmill Ditch Drainage Short-term
43 McCullough Road Drainage Project Short-term
44 San Joaquin River Levee at Firebaugh Wastewater Treatment Plant
Short-term
45 San Joaquin River Bank Stabilization at Firebaugh Short-term
46 San Joaquin River Levee at Firebaugh Rodeo Grounds Short-term
18 Eastside Acres San Joaquin River Levee Project Long-Term
82A Municipal Well Relocation/ Floodproofing in City of Mendota Long-term
Upper San Joaquin River Regional Flood Management Plan 5-17

PROPOSED SYSTEM IMPROVEMENTS
Table 5-3. Proposed System Improvements by Category
System Improvement ID System Improvement Name
System Improvement Timeframe Short-term <5 years Long-term >5 years
82B Municipal Well Relocation/ Floodproofing in City of Mendota Long-term
83 Wastewater Treatment Plant Flood Levee in City of Mendota Long-term
84 Mendota Pool Park Flood Protection Long-term
System Improvement Category – Environmental
81 San Joaquin River Invasive Species Management Short-term, Long-term
12 Great Valley Grasslands State Park Levee Deauthorization Short-term
47 Three Rivers Ranch Study Short-term
48 Cinnamon Slough Study (Merced Wildlife Refuge) Short-term
49 Sunrise Ranch Study Short-term
60 Modify water intake structures at selected refuge units Short-term
61 San Luis NWR East Bear Creek Unit Install lift pumps to divert water onto 1,000 acres of wetland basins during flood flows
Short-term
62 San Luis NWR East Bear Creek Unit Restore a wetland swale to divert floodwaters onto 1,000 acres of wetland basins during flood flows
Short-term
63 San Luis NWR East Bear Creek Unit Enhance existing wetland depth and configuration to provide additional habitat and floodwater storage on approximately 500 acres of wetland basins
Short-term
64 San Luis NWR Freitas Unit – restore anabranches of Salt Slough Short-term
65 San Luis NWR West Bear Creek Unit Restore wetland slough channel connectivity with the San Joaquin River to accommodate flood flows
Short-term
66 Merced NWR Merced Unit Enhance infrastructure to divert flood flows onto 1,200 acres of existing wetlands and other NWR lands
Short-term
67 Merced NWR – Modify water intake structures at selected NWR units
Short-term
68 Merced NWR Sno-Bird Unit – Construct diversions off Eastside Canal
Short-term
System Improvement Category – Emergency Management
38 Develop Emergency Response Plans Short-term
System Improvement Category – O&M
20 Fresno Slough Sediment Removal Short-term
33 Channel Dredging and/or Vegetation Removal Short-term
40 Monitor Creek Water Quality and Storm Drainage Discharges Short-term
69 Ash Slough Arundo and Channel Clearing Short-term
70 Berenda Slough Arundo and Channel Clearing Short-term
71 Erosion Repair Project Short-term
72 Levee Patrol Road Repair Short-term
73 Berenda Creek Arundo Removal and Channel Clearing Short-term
74 Dry Creek Arundo and Channel Clearing Short-term
75 Cottonwood Creek Arundo and Channel Clearing Short-term
5-18 Upper San Joaquin River Regional Flood Management Plan

PROPOSED SYSTEM IMPROVEMENTS
Table 5-3. Proposed System Improvements by Category
System Improvement ID System Improvement Name
System Improvement Timeframe Short-term <5 years Long-term >5 years
17 Update San Joaquin River Flood Control Project Operations and Maintenance Manual
Short-term
System Improvement Category – SJRRP Related Projects
52 Levee Improvements in Reach 2A, 3, 4A, Eastside Bypass, Mariposa Bypass, and Reach 5
Short-term, Long-term
50 SJRRP Seepage Management Projects Short-term, Long-term
53 Sediment Removal in Reach 4A and Eastside Bypass Short-term
51 Firebaugh Habitat Projects Long-term
54 Reach 2B/Mendota Pool Bypass Long-term
55 Reach 4B Improvements Long-term
56 Reach 2B Project – San Mateo Road Crossing Long-term
57 Fish Passage Improvement at Flood Control Structures Long-term
58 Arroyo Canal Screening and Sack Dam Passage Long-term
59 Salt Slough Barrier and Mud Slough Barrier Long-term
System Improvement Category – Groundwater Recharge/Conjunctive Use/Water Supply
10 Gravelly Ford Madera Ranch Recharge Project Short-term
15 Western Madera and Merced County Subsidence Solution Short-term
16 Los Banos Creek Recharge and Recovery Short-term
76 Madera Irrigation District Water Bank Facility Long-term
77 Madera Canal/Hidden Dam Pump Storage Project Long-term
78 Madera Lake Regulating and Recharge Project Long-term
80 Ingomar Reservoir Surface Storage Long-term
85 Camp 13 Area Surface Storage Long-term
86 Orestimba Creek Recharge and Recovery Project Long-term
System Improvement Category – Recommended Action
30 Merced County Flood Control District Short-term
37 Modify Land Use Designations Short-term
39 Increase Public Awareness of Flooding Short-term
41 Update Stormwater Design Standards for the City and Region Short-term
System Improvement Category – Conceptual
11 Flooding Existing Pasture Lands Long-term
32 Construct Ring Levees around Flood-Prone Areas Long-term
34 Construct Levees or Channel Widening Projects along Creeks/Streams in the Region
Long-term
35 Divert Flood Flows to Agricultural Lands Long-term
36 Ecosystem Restoration along Waterways Long-term
Upper San Joaquin River Regional Flood Management Plan 5-19

PROPOSED SYSTEM IMPROVEMENTS
This page intentionally left blank.
5-20 Upper San Joaquin River Regional Flood Management Plan

6.0 Evaluation of System Improvements A multicriteria evaluation methodology was used to evaluate the SIs. This type of methodology enables multiple SIs to be compared against the same set of criteria. The criteria used in the analysis cover a range of benefits that address deficiencies or issues identified in the RFMP area. A multicriteria evaluation tool was used to manage data, evaluate the SIs, and assist with communication of recommended actions. The tool enables the SIs to be evaluated and ranked based on a number of criteria. These criteria were developed based on information from a number of sources, including stakeholder input, SB 5, CVFPP, SSIA, CVFPP Conservation Strategy, and DWR’s IWM approach to water management. The following subsections outline how the criteria were developed and ranked, and presents results from the evaluation.
6.1 Criteria Selection The first step in the process was to develop evaluation criteria. Criteria were identified initially to address USJR RFMP identified deficiencies and issues. Then, language from SB 5, the CVFPP SSIA, and the CVFPP Conservation Strategy were reviewed to determine if additional criteria were needed. Next, a set of high-level criteria was established, along with subcriteria for evaluating the SIs. In addition, recommendations and suggestions from the RFMP stakeholders were reviewed and included in the criteria identification and definition process. The high-level criteria are public safety, environmental stewardship, economic stability, and regional issues. The first three criteria align directly with the vision objectives of the FloodSAFE Program.
The following paragraphs provide a synopsis and examples of the types of information used to develop the USJR RFMP evaluation criteria. Some of the criteria developed meet requirements, objectives, or issues from multiple sources.
6.1.1 Senate Bill 5 SB 5, The Central Valley Flood Protection Act of 2008, focuses on identifying SPFC components and flood risks, as well as ways to reduce this flood risk (and associated damage) and establishing a level of flood protection for urban and non-urban areas. Counties and cities within the Central Valley are required to implement plans to meet the established levels of flood protection and develop emergency management plans.
6.1.2 FloodSAFE Initiative In 2006, DWR launched FloodSAFE, a multifaceted initiative to improve public safety through integrated flood management. FloodSAFE is a collaborative statewide effort designed to achieve five broad goals:
• Reduce the chance of flooding • Reduce the consequences of flooding • Sustain economic growth • Protect and enhance ecosystems • Promote sustainability
The FloodSAFE vision is a sustainable integrated flood management and emergency response system throughout California that improves public safety, protects and enhances environmental and cultural
Upper San Joaquin River Regional Flood Management Plan 6-1

EVALUATION OF SYSTEM IMPROVEMENTS
resources, and supports economic growth by reducing the probability of destructive floods, promoting beneficial floodplain processes, and lowering the damages caused by flooding.
The USJR RFMP uses FloodSAFE vision objectives (public safety, ecosystem conditions, and economic sustainability) as three high-level criteria for evaluating SIs. The RFMP uses the benefits described in the SSIA vision as subcriteria in the evaluation.
6.1.3 CVFPP SSIA The CVFPP SSIA “sets forth a strategy for responsibly meeting the State’s objectives to improve public safety, ecosystem conditions, and economic sustainability, while recognizing the financial challenges facing local, State, and Federal governments.”
The SSIA vision was to develop a flood management plan that provides for the following benefits (DWR, 2012a):
• Providing a minimum of 200-year level of protection for urban communities protected by facilities of the SPFC
• Lowering peak flood stage through much of the system, especially for the Feather, lower Sacramento, and lower San Joaquin rivers
• Providing 100-year level of protection for small communities, where feasible
• Ensuring proactive floodplain management, including a program to floodproof and/or relocate structures in the floodplains where ring levees or other flood structures are not feasible
• Enhancing rural-agricultural area flood protection by repairing known localized problems that cause the highest risk of exposure and by restoring all-weather roads on levee crests
• Leveraging flood SIs to create habitat through levee setbacks, water-side planting berms, and extension and expansion of bypass systems to connect riparian habitat from the Delta to Butte Basin, Oroville, and the San Joaquin River
• Connecting fishery habitat from the Delta to Yolo and Sutter bypasses and to Butte Creek
• Supporting policies, implementation programs, and financing strategy
6.1.4 CVFPP Conservation Strategy The CVFPP Conservation Strategy describes integration of environmental stewardship in flood management improvements and establishes environmental objectives throughout the SPFC system. This integration is accomplished by striving to meet multiple objectives, including the following:
• Promote natural dynamic hydrologic and geomorphic processes
• Increase and improve the quantity, diversity, and connectivity of riparian, wetland, floodplain, and shaded riverine aquatic habitats, including the agricultural and ecological values of these lands
• Minimize flood management system O&M requirements
• Promote the recovery and stability of native species populations and overall biotic community diversity
6-2 Upper San Joaquin River Regional Flood Management Plan

EVALUATION OF SYSTEM IMPROVEMENTS
The CVFPP Conservation Strategy has developed a number of draft potential evaluation goals to achieve these objectives. These potential evaluation goals are used as the subcriteria in the USJR RFMP, as detailed in Table 6-1 under the Environmental Stewardship criteria.
6.1.5 Criteria Definition Once the criteria from these sources were identified, they were categorized under four high-level criteria—public safety, environmental stewardship, economic stability, and regional flood management issues and concerns. Each high-level criterion has a number of subcriteria that were derived from the sources previously discussed. The four high-level criteria and subcriteria for each are shown in Table 6-1.
6.2 Criteria Importance Factors Once the criteria and subcriteria were identified, an importance factor was established for the high-level criteria. The importance factors for the high-level criteria were established as:
• Public Safety: 40 percent • Environmental Stewardship: 25 percent • Economic Stability: 25 percent • Regional Issues: 10 percent
These importance factors were established to emphasize the relative importance with extra weighting given to public safety because flood management and damage reduction are key focal points of the USJR RFMP.
6.3 Criteria Scoring Criteria scoring is the second step in the evaluation methodology. The process allows each SI to be rated by assigning values based on the defined scales for the criteria. Therefore, each criterion must be defined such that the SI can be scored against each of the subcriteria. For the USJR RFMP, subcriteria definitions were established for a range of scores:
• Low score (0) indicates no change or benefit • Median score (5) indicates an incremental benefit • High score (10) indicates a significant benefit
Each SI was scored based on where the SI best fits in correlation to the definition. Tables 6-2 through 6-5 provide the scoring definitions developed for each of the subcriteria. The subcriteria definitions were qualitative in nature because the USJR RFMP does not have the resources to perform detailed technical analysis of the SIs. Appendix I contains the scores under each criteria for the proposed SIs. This appendix contains the raw score for each SI under each criteria as well as a nominalized score. The scores were normalized to provide equal weighting for each subcriteria under each high-level criteria. To accomplish this task, each high-level criteria had a maximum score of 100. For example, the public safety criteria have eight subcriterion, with a potential maximum raw score of 80, so to normalize the score, each proposed SI was multiplied by 1.25 (or 100/80).
Upper San Joaquin River Regional Flood Management Plan 6-3

EVALUATION OF SYSTEM IMPROVEMENTS
Table 6-1. USJR RFMP Evaluation Criteria
Criteria Definition
Public Safety
People and Property at Risk (Level of Protection) Benefit to level of protection in system
Flood System Flexibility/Robustness Benefit to system flexibility
Increased Hydraulic Capacity Benefit to the hydraulic capacity in system
Flood System Resiliency (Damage Reduction) Reduction in the amount of potential damage in system
Asset Condition Benefit to asset condition
Wise Floodplain Management/Emergency Management (Improved Flood Fighting and Response, Information, and Tools )
Benefit to flood fighting capabilities in the area (i.e., provides for new systems, equipment, monitoring, notification)
Subsidence Benefit to addressing subsidence issue
Climate Change Adaptability Level of climate change adaptability incorporated into the SI
Environmental Stewardship
Increased Flood Inundation – Sustained Spring Flows Increase in the total area of floodplain inundation during sustained spring flows
Increased Flood Inundation – 2-Year Flows Increase in the total area of floodplain inundation during 2-year flows
Increased Riverine Geomorphic Process – River Meander Increase in channel migration
Increased Riverine Geomorphic Process – Natural Bank Increase in the length of natural bank
Extension and Continuity of Shaded Riverine Aquatic Coverage Increase in the extent of shaded riverine aquatic cover
Riparian Habitat Coverage Increase in the quantity of native riparian vegetation coverage
Riparian Habitat Connectivity Increase in riparian vegetation connectivity
Marsh Habitat Coverage Increase in the quantity of native marsh/wetland vegetation
Floodplain Agriculture Increase in the quantity of wildlife-friendly floodplain agriculture
Improved Conditions for T&E Target Species – Aquatic (Steelhead, Chinook Salmon Fall Run, Chinook Salmon Spring Run, Sturgeon)
Amount of improvement in critical habitat for identified aquatic T&E species for the San Joaquin Basin
Improved Conditions for T&E Target Species – Wetlands and Seasonally Flooded (Delta Button Celery, Slough Thistle, Giant Garter Snake, California Black Rail, Greater Sandhill Crane)
Amount of improvement in critical habitat for identified wetland T&E species for the San Joaquin Basin
Improved Conditions for T&E Target Species – Riparian (Valley Elderberry Longhorn Beetle, Bank Swallow, Least Bell's Vireo, Swanson's Hawk, Yellow-Billed Cuckoo, Brush Rabbit, Riparian Woodrat)
Amount of improvement in critical habitat for identified riparian T&E species for the San Joaquin Basin
Improved Fish Passage Improvement/incorporation of fish passage
Invasive Plant Management and Prevention Reduction in the area of vegetation dominated by invasive plants
Revetment Removal or Improvement Amount of removal/improvement of revetment along channel bank to increase river meander potential and natural bank
Levee Relocation or Removal Removal/relocation of levees
Economic Stability
Compliance with PL 84-99 Increase in PL 84-99 Compliance
Reduced Liability Reduction in liability
Protect Critical Infrastructure or Resource Amount of protection for critical infrastructure (i.e., hospital, school, major highway, or evacuation routes)
Protection of Farmlands of Statewide Significance Amount of protection for Farmland of local or Statewide Significance
Groundwater Recharge Amount of water recharge benefits
Improved O&M Change in O&M costs
Agency Funding Change in agency revenue base
6-4 Upper San Joaquin River Regional Flood Management Plan

EVALUATION OF SYSTEM IMPROVEMENTS
Table 6-1. USJR RFMP Evaluation Criteria
Criteria Definition
IWM System Improvement (Multibenefit) Multiple sponsors and purposes
Regional Issues
Within the SPFC Boundaries Level of protection within/outside SPFC boundary
Services or Protects Small Communities or DACs Level of flood protection for DACs/small communities
Provides Recreational Benefit Level of recreational benefits
Services or Protects Tribes Level of increased flood protection for tribes
Improved Governance Level of formalization of existing agreements and/or improves funding, coordination, or planning efforts
Systemwide Benefits Extent of systemwide benefits
SPFC Facility Level of protection benefit to SPFC facilities
Compatibility with SJRRP Level of compatibility with SJRRP goals
Public Awareness Level of outreach for increasing public awareness of flood risk, emergency preparedness, and safety
Self-Mitigating System Improvement
(Capital and O&M)
Level of mitigation
Upper San Joaquin River Regional Flood Management Plan 6-5

EVALUATION OF SYSTEM IMPROVEMENTS
Table 6-2. Public Safety System Improvement Subcriteria Definitions
Feature/Benefit Low = 0 Medium = 5 High = 10
People and Property at Risk (Level of Protection)
Maintains or restores existing level of protection.
Increases existing level of protection. Provides 200-year level of protection for urban areas, 100-year level of protection for non-urban areas, and/or restores rural areas to design capacity or equivalent.
Flood System Flexibility/Robustness No change. Incremental increases in system flexibility. Significant increase in system flexibility.
Increased Hydraulic Capacity Maintains existing hydraulic capacity. Returns system to design capacity or equivalent.
Increases hydraulic capacity in system above design capacity.
Flood System Resiliency (Damage Reduction) No change in potential damage. Incremental reduction in potential damage. Significant reduction in potential damage.
Asset Condition No change or maintains capability. Asset is repaired or enhanced to improve capabilities.
Asset is replaced to upgrade and modernize.
Wise Floodplain Management/Emergency Management (Improved Flood Fighting and Response, Information and Tools)
Supports existing levels of flood fighting capabilities in the area.
Enhances levels of flood fighting capabilities in the area (i.e., provides for additional manpower, materials, and improved coordination).
Modernizes flood fighting capabilities in the area (i.e., provides for new systems, equipment, monitoring, notification).
Subsidence Results in no change in subsidence issue. Results in incrementally addressing subsidence issue.
Results in significant reduction in subsidence or addressing subsidence issue.
Climate Change Adaptability No changes are assumed for climate change. Developed to provide an incremental increase in capacity.
Developed to include components to address climate change or significantly increase capacity.
6-6 Upper San Joaquin River Regional Flood Management Plan

EVALUATION OF SYSTEM IMPROVEMENTS
Table 6-3. Environmental Stewardship System Improvement Subcriteria Definitions
Feature/Benefit Low=0 Medium=5 High=10
Increased Flood Inundation – Sustained Spring Flows
Increase the total area of floodplain inundation during sustained spring flows (i.e., between March 15 and May 15 for fewer than 7 days) by a net increase of less than 5% compared to existing conditions.
Increase the total area of floodplain inundation during sustained spring flows (i.e., between March 15 and May 15 and for fewer than 7 days) by a net increase of between 5% and 50% compared to existing conditions.
Increase the total area of floodplain inundation during sustained spring flows (i.e., between March 15 and May 15 and for fewer than 7 days) by a net increase of greater than 50% compared to existing conditions.
Increased Flood Inundation – 2-Year Flows Increase the total area of floodplain inundation during 50% chance flows by a net increase of less than 10% compared to existing conditions.
Increase the total area of floodplain inundation during 50% chance flows by a net increase of between 10% and 50% compared to existing conditions.
Increase the total area of floodplain inundation during 50% chance flows by a net increase of greater than 50% compared to existing conditions.
Increased Riverine Geomorphic Process – River Meander
Increase channel migration through a net increase of less than 1 acre of river meander potential.
Increase channel migration through a net increase of between 1 and 30 acres of river meander potential.
Increase channel migration through a net increase of more than 30 acres of river meander potential.
Increased Riverine Geomorphic Process – Natural Bank
Increase the length of natural bank by a net increase of less than 10% compared to existing conditions.
Increase the length of natural bank by a net increase of between 10% and 50% compared to existing conditions.
Increase the length of natural bank by a net increase of greater than 50% compared to existing conditions.
Extension and Continuity of Shaded Riverine Aquatic Coverage
Increase the extent of shaded riverine aquatic cover by a net increase of less than 10% compared to existing conditions.
Increase the extent of shaded riverine aquatic cover by a net increase of between 10% and 50% compared to existing conditions.
Increase the extent of shaded riverine aquatic cover by a net increase of greater than 50% compared to existing conditions.
Riparian Habitat Coverage Increase the quantity of native riparian vegetation by less than 10% compared to existing conditions.
Increase the quantity of native riparian vegetation by a net increase of between 10% and 50% compared to existing conditions.
Increase the quantity of native riparian vegetation by a net increase of greater than 50% compared to existing conditions.
Riparian Habitat Connectivity Median riparian vegetation patch size increases by less than 10% compared to existing conditions.
Median riparian vegetation patch size increases by a net increase of between 10% and 50% compared to existing conditions.
Median riparian vegetation patch size increases by a net increase of greater than 50% compared to existing conditions.
Marsh Habitat Coverage Increase the quantity of native marsh/wetland vegetation by less than 10% compared to existing conditions.
Increase the quantity of native marsh/wetland vegetation by a net increase of between 10% and 50% compared to existing conditions.
Increase the quantity of native marsh/wetland vegetation by a net increase of greater than 50% compared to existing conditions.
Floodplain Agriculture Increase the quantity of wildlife-friendly floodplain agriculture by less than 10% compared to existing conditions.
Increase the quantity of wildlife-friendly floodplain agriculture by a net increase of between 10% and 50% compared to existing conditions.
Increase the quantity of wildlife-friendly floodplain agriculture by a net increase of greater than 50% compared to existing conditions.
Improved Conditions for T&E Target Species – Aquatic (Steelhead, Chinook Fall Run, Chinook Spring Run, Sturgeon)
Minor improvements to critical habitat for identified aquatic T&E species for the San Joaquin Basin.
Moderate improvements to critical habitat for identified aquatic T&E species for the San Joaquin Basin.
Significant improvements to critical habitat for identified aquatic T&E species for the San Joaquin Basin.
Upper San Joaquin River Regional Flood Management Plan 6-7

EVALUATION OF SYSTEM IMPROVEMENTS
Table 6-3. Environmental Stewardship System Improvement Subcriteria Definitions
Feature/Benefit Low=0 Medium=5 High=10
Improved Conditions for T&E Target Species – Wetlands and Seasonally Flooded (Delta Button Celery, Slough Thistle, Giant Garter Snake, California Black Rail, Greater Sandhill Crane)
Minor improvements to critical habitat for identified aquatic T&E species for the San Joaquin Basin.
Moderate improvements to critical habitat for identified aquatic T&E species for the San Joaquin Basin.
Significant improvements to critical habitat for identified aquatic T&E species for the San Joaquin Basin.
Improved Conditions for T&E Target Species – Riparian (Valley Elderberry Longhorn Beetle, Bank Swallow, Least Bell's Vireo, Swainson's Hawk, Yellow-Billed Cuckoo, Brush Rabbit, Riparian Woodrat)
Minor improvements to critical habitat for identified aquatic T&E species for the San Joaquin Basin.
Moderate improvements to critical habitat for identified aquatic T&E species for the San Joaquin Basin.
Significant improvements to critical habitat for identified aquatic T&E species for the San Joaquin Basin.
Improved Fish Passage No change to fish passage. New facility that improves or incorporates fish passage.
Implement solution for barriers needing remediation at one SPFC facility.
Invasive Plant Management and Prevention Reduce by less than 10% the area of vegetation dominated by invasive plants on DWR-managed land by integrating BMPs into maintenance practices and implementing invasive plant management actions.
Reduce between 10% and 50% the area of vegetation dominated by invasive plants on DWR-managed land by integrating BMPs into maintenance practices and implementing invasive plant management actions.
Reduce by more than 50% the area of vegetation dominated by invasive plants on DWR-managed land by integrating BMPs into maintenance practices and implementing invasive plant management actions.
Revetment Removal or Improvement Remove or improve revetment along channel bank to increase river meander potential and natural bank by less than 10% compared to existing length of revetment.
Remove or improve revetment along channel bank to increase river meander potential and natural bank between 10% and 50% compared to existing length of revetment.
Remove or improve revetment along channel bank to increase river meander potential and natural bank by greater than 50% compared to existing length of revetment.
Levee Relocation or Removal Remove or relocate levees by less than 10% compared to existing length of levees.
Remove or relocate levees between 10% and 50% compared to existing length of levees.
Remove or relocate levees by greater than 50% compared to existing length of levees.
6-8 Upper San Joaquin River Regional Flood Management Plan

EVALUATION OF SYSTEM IMPROVEMENTS
Table 6-4. Economic Stability System Improvement Subcriteria Definitions
Feature/Benefit Low = 0 Medium = 5 High = 10
Compliance with PL 84-99 No change in PL 84-99 compliance. Partially addresses PL 84-99 compliance. Addresses PL 84-99 compliance.
Reduced Liability No change in liability. Incremental reduction in liability. SI reduces liability by meeting State or Federal legislative requirements, compliance with court decisions, and improves system beyond existing standards.
Protect Critical Infrastructure or Resource No change in protection of critical infrastructure.
The SI protects at least one piece of critical infrastructure (i.e., hospital, school, major highway, or evacuation routes).
The SI protects more than one piece of critical infrastructure (i.e., hospital, school, major highway, or evacuation routes).
Protection of Farmlands of Statewide Significance
No change in protection of farmland of local or Statewide significance.
Provides incremental protection to the acreage of farmland of local or Statewide significance.
Protects significant acreage of farmland of local or Statewide significance.
Groundwater Recharge Provides no water recharge benefits. Provides Incremental water recharge benefits.
Provides significant water recharge benefits.
Improved O&M No change in O&M cost per mile. Provides incremental reduction in O&M costs per mile.
Significantly reduces O&M costs per mile.
Agency Funding No change in agency revenue base. Incremental increases in agency revenue base.
Significantly increases in agency revenue base.
IWM System Improvement (Multibenefit) Single-purpose SI. Multiple purposes or sponsors SI. SI has multiple sponsors and multiple purposes.
Upper San Joaquin River Regional Flood Management Plan 6-9

EVALUATION OF SYSTEM IMPROVEMENTS
Table 6-5. Regional Issues System Improvement Subcriteria Definitions
Feature/Benefit Low = 0 Medium = 5 High = 10
Within the SPFC Boundaries Outside SPFC boundary and does not protect areas within SPFC boundary.
Outside SPFC boundary but protect areas within SPFC boundary.
Inside SPFC boundary and protects areas within SPFC boundary.
Services or Protects Small Communities or DACs
Either not a DAC or SI maintains existing level of flood protection for small communities or DACs.
Provides increased flood protection for small communities or DACs.
Provides increased flood protection for small communities or meets SB 5 requirements for DACs.
Provides Recreational Benefit Results in no change in recreational benefit. Results in incremental change in recreational benefits.
Results in recreational benefits.
Services or Protects Tribes Either no tribal lands exist or SI does not change existing level of flood protection for tribes.
Increases level of flood protection to design capacity for tribes.
Provides increased flood protection for tribes.
Improved Governance No change in governance. Develops framework toward agreements and/or funding, coordination, or planning efforts.
Formalizes existing agreements and/or improves funding, coordination, or planning efforts.
Systemwide Benefits No change in system benefits. Only protects or provides benefit within USJR region.
Provides systemwide benefits.
SPFC Facility Not an SPFC facility. Provides benefit to a SPFC facility. Provides benefits to more than one SPFC facility.
Compatibility with SJRRP No benefit to SJRRP goals. Compatible with at least one SJRRP goal. Compatible with multiple SJRRP goals.
Public Awareness No public awareness component. Investment in new tools, datasets, or websites for information sharing.
Outreach component developed to increase public awareness of flood risk, emergency preparedness, and safety.
Self-Mitigating System Improvement (Capital and O&M)
Needs mitigation credits. Minimal to no mitigation is required. Self-mitigating or provides mitigation credits.
6-10 Upper San Joaquin River Regional Flood Management Plan

EVALUATION OF SYSTEM IMPROVEMENTS
6.4 System Improvement Evaluation The scoring criteria presented above were used to evaluate each SI described in the previous chapter. Evaluating such a wide range of different types of projects was challenging. The level of information available for each SI varied considerably, which influenced the ability to assess and score the projects based on the perceived benefits. SIs with clearly defined flood reduction or ecosystem benefits were much easier to score than conceptual ideas with no defined footprint or geographic location.
The SIs were evaluated for each of the four high-level criteria, including public safety, environmental stewardship, economic stability, and regional issues. In addition, each SI was ranked based on the total weighting developed utilizing the importance factors described previously. The importance factors emphasize the extra weighting given to public safety because flood management and damage reduction are key focal points of the USJR RFMP.
Evaluation of specific costs and benefits of the SIs was beyond the scope of this planning effort. Therefore, the rough planning-level costs developed for the RFMP were not used as a basis for evaluation and ranking of the SIs.
6.5 System Improvement Prioritization Results The prioritization results are presented in two ways—by each high-level criterion and by overall weighted results. Providing the results for each high-level criterion enables the RFMP evaluation results to be used to align with different potential grant or funding program criteria. Due to the qualitative nature of most of the project descriptions and lack of detail to differentiate many of the projects, the prioritization results were grouped into three tiers based on natural break points among the ranked scores. Tiers were used to present the final evaluation for each of the high-level criteria and for the overall weighted results.
The SIs for each high-level criterion are divided into short-term and long-term improvements based on the potential construction timeframe. Short-term SIs are those whose construction is feasible within the next 5 years (i.e., groundbreaking occurs within 5 years). Long-term SIs are those whose construction will take place more than 5 years hence. Tables 6-6 through 6-9 provide summary results for each high-level criterion, plus the estimated cost and designated SI category. The overall weighted evaluation results are shown in Table 6-10. Conceptual ideas are listed at the bottom of each table because they are very general in nature and do not have a geographic location or defined benefit area. Appendix I contains a full summary of the results for each SI.
The SI evaluation can be updated in the future as additional information becomes available. The existing scoring is based on the information obtained from the SI proponents and is documented in their project descriptions and supporting reference information.
Upper San Joaquin River Regional Flood Management Plan 6-11

EVALUATION OF SYSTEM IMPROVEMENTS
This page intentionally left blank.
6-12 Upper San Joaquin River Regional Flood Management Plan

EVALUATION OF SYSTEM IMPROVEMENTS
Table 6-6. Public Safety Evaluation Results
ID System Improvement Estimated Cost System Improvement Time-frame
Short-term <5 years Long-term >5 years
System Improvement Category Tier
1 Bear Creek Diversion Structure $ 260,000 Short-term Rural 1
2 Levee Breaches Unit 1, LM 9.90; Unit 5, LM 0.25 $ 535,000 Short-term Rural 1
4 Modernize Electrical Controls, Level Sensors and SCADA for Control Structures $ 1,885,000 Short-term Rural 1
5A Rehabilitation of San Joaquin River Control Structure $ 340,000 Short-term Rural 1
6 Sediment Removal Chowchilla Canal Bypass Control Structure $ 175,000 Short-term Rural 1
7 Levee Improvements in Subsidence Area $ - Short-term Rural 1
8 Sediment Removal in the Eastside Bypass $ 12,850,000 Short-term Rural 1
12 Great Valley Grasslands State Park Levee Deauthorization $ 4,930,000 Short-term Environmental 1
13 Bridge Enlargement over Eastside Bypass at Sandy Mush Road $ 1,610,000 Short-term Rural 1
14 Install New Gaging Stations $ 330,000 Short-term Rural 1
15 Western Madera and Merced County Subsidence Solution $ 19,600,000 Short-term Groundwater Recharge/Conjunctive Use/Water Supply 1
17 Update San Joaquin River Flood Control Project O&M Manual $ 500,000 Short-term O&M 1
19 Fresno Slough South Levee Repair and Floodplain Enhancement Project $ 1,340,000 Short-term Rural 1
20 Fresno Slough Sediment Removal $ 720,000 Short-term O&M 1
21 Upper San Joaquin Sediment Study $ 100,000 Short-term Rural 1
22 Bear Creek Diversion Channel Feasibility Study $ 100,000 Short-term Urban 1
23 Le Grand/Planada Flood Control/Conjunctive Use Expansion Study $ 240,000 Short-term Urban 1
24 Le Grand Canal Flood Control Structure at Black Rascal Creek $ 490,000 Short-term Urban 1
44 San Joaquin River Levee at Firebaugh Waste Water Treatment Plant $ 1,280,000 Short-term Small Community/DAC 1
45 San Joaquin River Bank Stabilization at Firebaugh $ 1,800,000 Short-term Small Community/DAC 1
46 San Joaquin River Levee at Firebaugh Rodeo Grounds $ 1,450,000 Short-term Small Community/DAC 1
10 Gravelly Ford Madera Ranch Recharge Project $ 1,970,000 Short-term Groundwater Recharge/Conjunctive Use/Water Supply 2
16 Los Banos Creek Recharge and Recovery $ 5,000,000 Short-term Groundwater Recharge/Conjunctive Use/Water Supply 2
33 Channel Dredging or Vegetation Removal $ 2,200,000 Short-term O&M 2
38 Develop Emergency Response Plans $ 100,000 Short-term Emergency Management 2
42 Windmill Ditch Drainage $ 1,900,000 Short-term Small Community/DAC 2
43 McCullough Road Drainage Project $ 2,700,000 Short-term Small Community/DAC 2
47 Three Rivers Ranch Study $ 100,000 Short-term Environmental 2
48 Cinnamon Slough Study (Merced Wildlife Refuge) $ 100,000 Short-term Environmental 2
49 Sunrise Ranch Study $ 100,000 Short-term Environmental 2
50 SJRRP Seepage Management Projects $ 185,000,000 Short-term, Long-term SJRRP 2
52 Levee Improvements in Reaches 2A, 3, 4A; Eastside Bypass; Mariposa Bypass; and Reach 5 $ 235,000,000 Short-term, Long-term SJRRP 2
60 Modify water intake structures at selected refuge units $ 1,540,000 Short-term Environmental 2
61 San Luis NWR East Bear Creek Unit – Install lift pumps to divert water onto 1,000 acres of wetland basins during flood flows $ 1,260,000 Short-term Environmental 2
62 San Luis NWR East Bear Creek Unit – Restore a wetland swale to divert floodwaters onto 1,000 acres of wetland basins during flood flows $ 340,000 Short-term Environmental 2
63 San Luis NWR East Bear Creek Unit – Enhance existing wetland depth and configuration to provide additional habitat and floodwater storage on approximately 500 acres of wetland basins
$ 1,150,000 Short-term Environmental 2
64 San Luis NWR Freitas Unit – Restore anabranches of Salt Slough $ 50,000 Short-term Environmental 2
65 San Luis NWR West Bear Creek Unit – Restore wetland slough channel connectivity with the San Joaquin River to accommodate flood flows $ 354,000 Short-term Environmental 2
66 Merced NWR Merced Unit – Enhance infrastructure to divert flood flows onto 1,200 acres of existing wetlands and other refuge lands $ 235,000 Short-term Environmental 2
Upper San Joaquin River Regional Flood Management Plan 6-13

EVALUATION OF SYSTEM IMPROVEMENTS
Table 6-6. Public Safety Evaluation Results
ID System Improvement Estimated Cost System Improvement Time-frame
Short-term <5 years Long-term >5 years
System Improvement Category Tier
67 Merced NWR – Modify water intake structures at selected refuge units $ 580,000 Short-term Environmental 2
68 Merced NWR Sno-Bird Unit – Construct diversions off Eastside Canal $ 263,000 Short-term Environmental 2
79 Siphon Extension near Chamberlain Road $ 700,000 Short-term Rural 2
29 Merced Region Programmatic Environmental Impact Report for Stream Bed and Vegetation Control $ 300,000 Short-term Urban 3
40 Monitor Creek Water Quality and Storm Drainage Discharges $ 100,000 Short-term O&M 3
53 Sediment Removal in Reach 4A and Eastside Bypass $ - Short-term SJRRP 3
69 Ash Slough Arundo and Channel Clearing $ 1,500,000 Short-term O&M 3
70 Berenda Slough Arundo and Channel Clearing $ 1,300,000 Short-term O&M 3
71 Erosion Repair Project $ 1,500,000 Short-term O&M 3
72 Levee Patrol Road Repair $ 500,000 Short-term O&M 3
73 Berenda Creek Arundo Removal and Channel Clearing $ 500,000 Short-term O&M 3
74 Dry Creek Arundo and Channel Clearing $ 500,000 Short-term O&M 3
75 Cottonwood Creek Arundo and Channel Clearing $ 500,000 Short-term O&M 3
81 San Joaquin River Invasive Species Management $ 2,800,000 Short-term, Long-term Environmental 3
37 Modify Land Use Designations $ - Short-term Recommended Action 2
41 Update Stormwater Design Standards for the City and Region $ 80,000 Short-term Recommended Action 2
30 Merced County Flood Control District $ 100,000 Short-term Recommended Action 3
39 Increase Public Awareness of Flooding $ 50,000 Short-term Recommended Action 3
3 Raise Part of Left Bank Levee Unit 6 $ 4,250,000 Long-term Rural 1
5 Enlarge Chowchilla Canal Bypass Control Structure $ 3,380,000 Long-term Rural 1
18 Eastside Acres San Joaquin River Levee Project $ 1,210,000 Long-Term Small Community/DAC 1
25 Bear Reservoir Enlargement and Downstream Levee and Channel Improvements $ 202,940,000 Long-term Urban 1
26 Mariposa Reservoir Enlargement and Downstream Levee and Channel Improvements $ 112,500,000 Long-term Urban 1
27 Owens Reservoir Enlargement and Downstream Levee and Channel Improvements $ 8,850,000 Long-term Urban 1
28 Burns Reservoir Enlargement and Downstream Levee and Channel Improvement $ 39,180,000 Long-term Urban 1
31 Black Rascal Creek Flood Control Project $ 32,980,000 Long-term Urban 1
76 Madera Irrigation District Water Bank Facility $ 124,000,000 Long-term Groundwater Recharge/Conjunctive Use/Water Supply 1
78 Madera Lake Regulating and Recharge Project $ 3,500,000 Long-term Groundwater Recharge/Conjunctive Use/Water Supply 1
51 Firebaugh Habitat Projects $ - Long-term SJRRP 2
54 Reach 2B/Mendota Pool Bypass $ 295,000,000 Long-term SJRRP 2
55 Reach 4B Improvements $ 234,199,000 Long-term SJRRP 2
58 Arroyo Canal Screening and Sack Dam Passage $ 25,000,000 Long-term SJRRP 2
77 Madera Canal/Hidden Dam Pump Storage Project $ 11,500,000 Long-term Groundwater Recharge/Conjunctive Use/Water Supply 2
82A Municipal Well Relocation/Flood-Proofing in City of Mendota $ 6,431,782 Long-term Small Community/DAC 2
82B Municipal Well Relocation/Flood-Proofing in City of Mendota $ 23,110,603 Long-term Small Community/DAC 2
83 Wastewater Treatment Plant Flood Levee in City of Mendota $ 10,885,000 Long-term Small Community/DAC 2
84 Mendota Pool Park Flood Protection $ 1,737,000 Long-term Small Community/DAC 2
9 Sand Slough Control Structure Removal $ 290,000 Long-term Rural 3
56 Reach 2B Project/San Mateo Road Crossing $ 9,600,000 Long-term SJRRP 3
6-14 Upper San Joaquin River Regional Flood Management Plan

EVALUATION OF SYSTEM IMPROVEMENTS
Table 6-6. Public Safety Evaluation Results
ID System Improvement Estimated Cost System Improvement Time-frame
Short-term <5 years Long-term >5 years
System Improvement Category Tier
57 Fish Passage Improvement at Flood Control Structures $ - Long-term SJRRP 3
59 Salt Slough Barrier and Mud Slough Barrier $ - Long-term SJRRP 3
80 Ingomar Reservoir Surface Storage $ 18,300,000 Long-term Groundwater Recharge/Conjunctive Use/Water Supply 3
85 Camp 13 Area Surface Storage $ 44,000,000 Long-term Groundwater Recharge/Conjunctive Use/Water Supply 3
86 Orestimba Creek Recharge and Recovery Project $ 8,200,000 Long-term Groundwater Recharge/Conjunctive Use/Water Supply 3
32 Construct Ring Levees around Flood-Prone Areas $ - Long-term Conceptual 1
34 Construct Levees or Channel Widening Projects along Creeks/Streams in the Region $ - Long-term Conceptual 1
35 Divert Flood Flows to Agricultural Lands $ - Long-term Conceptual 1
11 Flooding Existing Pasture Lands $ - Long-term Conceptual 2
36 Ecosystem Restoration along Waterways $ - Long-term Conceptual 3
Note: - = 0 dollars
Upper San Joaquin River Regional Flood Management Plan 6-15

EVALUATION OF SYSTEM IMPROVEMENTS
This page intentionally left blank.
6-16 Upper San Joaquin River Regional Flood Management Plan

EVALUATION OF SYSTEM IMPROVEMENTS
Table 6-7. Environmental Stewardship Evaluation Results
ID System Improvement Estimated Cost System Improvement Time-frame
Short-term <5 years Long-term >5 years)
System Improvement Category Tier
12 Great Valley Grasslands State Park Levee Deauthorization $ 4,930,000 Short-term Environmental 1
19 Fresno Slough South Levee Repair and Floodplain Enhancement Project $ 1,340,000 Short-term Rural 1
44 San Joaquin River Levee at Firebaugh Waste Water Treatment Plant $ 1,280,000 Short-term Small Community/DAC 1
45 San Joaquin River Bank Stabilization at Firebaugh $ 1,800,000 Short-term Small Community/DAC 1
46 San Joaquin River Levee at Firebaugh Rodeo Grounds $ 1,450,000 Short-term Small Community/DAC 1
47 Three Rivers Ranch Study $ 100,000 Short-term Environmental 1
48 Cinnamon Slough Study (Merced Wildlife Refuge) $ 100,000 Short-term Environmental 1
49 Sunrise Ranch Study $ 100,000 Short-term Environmental 1
50 SJRRP Seepage Management Projects $ 185,000,000 Short-term, Long-term SJRRP 1
60 Modify water intake structures at selected refuge units $ 1,540,000 Short-term Environmental 1
61 San Luis NWR East Bear Creek Unit – Install lift pumps to divert water onto 1000 acres of wetland basins during flood flows $ 1,260,000 Short-term Environmental 1
62 San Luis NWR East Bear Creek Unit – Restore a wetland swale to divert floodwaters onto 1000 acres of wetland basins during flood flows $ 340,000 Short-term Environmental 1
63 San Luis NWR East Bear Creek Unit – Enhance existing wetland depth and configuration to provide additional habitat and floodwater storage on approximately 500 acres of wetland basins
$ 1,150,000 Short-term Environmental 1
64 San Luis NWR Freitas Unit – Restore anabranches of Salt Slough $ 50,000 Short-term Environmental 1
65 San Luis NWR West Bear Creek Unit – Restore wetland slough channel connectivity with the San Joaquin River to accommodate flood flows $ 354,000 Short-term Environmental 1
66 Merced NWR Merced Unit – Enhance infrastructure to divert flood flows onto 1200 acres of existing wetlands and other refuge lands $ 235,000 Short-term Environmental 1
67 Merced NWR – Modify water intake structures at selected refuge units $ 580,000 Short-term Environmental 1
68 Merced NWR Sno-Bird Unit – Construct diversions off Eastside Canal $ 263,000 Short-term Environmental 1
6 Sediment Removal Chowchilla Canal Bypass Control Structure $ 175,000 Short-term Rural 2
8 Sediment Removal in the Eastside Bypass $ 12,850,000 Short-term Rural 2
15 Western Madera and Merced County Subsidence Solution $ 19,600,000 Short-term Groundwater Recharge/Conjunctive Use/Water Supply 2
20 Fresno Slough Sediment Removal $ 720,000 Short-term O&M 2
21 Upper San Joaquin Sediment Study $ 100,000 Short-term Rural 2
22 Bear Creek Diversion Channel Feasibility Study $ 100,000 Short-term Urban 2
52 Levee Improvements in Reach 2A, 3, 4A, Eastside Bypass, Mariposa Bypass, and Reach 5 $ 235,000,000 Short-term, Long-term SJRRP 2
69 Ash Slough Arundo and Channel Cleaning $ 1,500,000 Short-term O&M 2
70 Berenda Slough Arundo and Channel Clearing $ 1,300,000 Short-term O&M 2
72 Levee Patrol Road Repair $ 500,000 Short-term O&M 2
73 Berenda Creek Arundo Removal and Channel Clearing $ 500,000 Short-term O&M 2
74 Dry Creek Arundo and Channel Clearing $ 500,000 Short-term O&M 2
75 Cottonwood Creek Arundo and Channel Clearing $ 500,000 Short-term O&M 2
81 San Joaquin River Invasive Species Management $ 2,800,000 Short-term, Long-term Environmental 2
1 Bear Creek Diversion Structure $ 260,000 Short-term Rural 3
2 Levee Breaches Unit 1, LM 9.90; Unit 5, LM 0.25 $ 535,000 Short-term Rural 3
4 Modernize Electrical Controls, Level Sensors and SCADA for Control Structures $ 1,885,000 Short-term Rural 3
5A Rehabilitation of San Joaquin River Control Structure $ 340,000 Short-term Rural 3
7 Levee Improvements in Subsidence Area $ - Short-term Rural 3
10 Gravelly Ford Madera Ranch Recharge Project $ 1,970,000 Short-term Groundwater Recharge/Conjunctive Use/Water Supply 3
13 Bridge Enlargement over Eastside Bypass at Sandy Mush Road $ 1,610,000 Short-term Rural 3
Upper San Joaquin River Regional Flood Management Plan 6-17

EVALUATION OF SYSTEM IMPROVEMENTS
Table 6-7. Environmental Stewardship Evaluation Results
ID System Improvement Estimated Cost System Improvement Time-frame
Short-term <5 years Long-term >5 years)
System Improvement Category Tier
14 Install New Gaging Stations $ 330,000 Short-term Rural 3
16 Los Banos Creek Recharge and Recovery $ 5,000,000 Short-term Groundwater Recharge/Conjunctive Use/Water Supply 3
17 Update San Joaquin River Flood Control Project O&M Manual $ 500,000 Short-term O&M 3
23 Le Grand/Planada Flood Control/Conjunctive Use Expansion Study $ 240,000 Short-term Urban 3
24 Le Grand Canal Flood Control Structure at Black Rascal Creek $ 490,000 Short-term Urban 3
29 Merced Region Programmatic Environmental Impact Report for Stream Bed and Vegetation Control $ 300,000 Short-term Urban 3
33 Channel Dredging or Vegetation Removal $ 2,200,000 Short-term O&M 3
38 Develop Emergency Response Plans $ 100,000 Short-term Emergency Management 3
40 Monitor Creek Water Quality and Storm Drainage Discharges $ 100,000 Short-term O&M 3
42 Windmill Ditch Drainage $ 1,900,000 Short-term Small Community/DAC 3
43 McCullough Road Drainage Project $ 2,700,000 Short-term Small Community/DAC 3
53 Sediment Removal in Reach 4A and Eastside Bypass $ - Short-term SJRRP 3
71 Erosion Repair Project $ 1,500,000 Short-term O&M 3
79 Siphon Extension near Chamberlain Road $ 700,000 Short-term Rural 3
30 Merced County Flood Control District $ 100,000 Short-term Recommended Action 3
37 Modify Land Use Designations $ - Short-term Recommended Action 3
39 Increase Public Awareness of Flooding $ 50,000 Short-term Recommended Action 3
41 Update Stormwater Design Standards for the City and Region $ 80,000 Short-term Recommended Action 3
51 Firebaugh Habitat Projects $ - Long-term SJRRP 1
54 Reach 2B/Mendota Pool Bypass $ 295,000,000 Long-term SJRRP 1
5 Enlarge Chowchilla Canal Bypass Control Structure $ 3,380,000 Long-term Rural 2
9 Sand Slough Control Structure Removal $ 290,000 Long-term Rural 2
31 Black Rascal Creek Flood Control Project $ 32,980,000 Long-term Urban 2
55 Reach 4B Improvements $ 234,199,000 Long-term SJRRP 2
56 Reach 2B Project/San Mateo Road Crossing $ 9,600,000 Long-term SJRRP 2
57 Fish Passage Improvement at Flood Control Structures $ - Long-term SJRRP 2
58 Arroyo Canal Screening and Sack Dam Passage $ 25,000,000 Long-term SJRRP 2
59 Salt Slough Barrier and Mud Slough Barrier $ - Long-term SJRRP 2
76 Madera Irrigation District Water Bank Facility $ 124,000,000 Long-term Groundwater Recharge/Conjunctive Use/Water Supply 2
78 Madera Lake Regulating and Recharge Project $ 3,500,000 Long-term Groundwater Recharge/Conjunctive Use/Water Supply 2
3 Raise Part of Left Bank Levee Unit 6 $ 4,250,000 Long-term Rural 3
18 Eastside Acres San Joaquin River Levee Project $ 1,210,000 Long-Term Small Community/DAC 3
25 Bear Reservoir Enlargement and Downstream Levee and Channel Improvements $ 202,940,000 Long-term Urban 3
26 Mariposa Reservoir Enlargement and Downstream Levee and Channel Improvements $ 112,500,000 Long-term Urban 3
27 Owens Reservoir Enlargement and Downstream Levee and Channel Improvements $ 8,850,000 Long-term Urban 3
28 Burns Reservoir Enlargement and Downstream Levee and Channel Improvement $ 39,180,000 Long-term Urban 3
77 Madera Canal/Hidden Dam Pump Storage Project $ 11,500,000 Long-term Groundwater Recharge/Conjunctive Use/Water Supply 3
80 Ingomar Reservoir Surface Storage $ 18,300,000 Long-term Groundwater Recharge/Conjunctive Use/Water Supply 3
82A Municipal Well Relocation/Flood-Proofing in City of Mendota $ 6,431,782 Long-term Small Community/DAC 3
6-18 Upper San Joaquin River Regional Flood Management Plan

EVALUATION OF SYSTEM IMPROVEMENTS
Table 6-7. Environmental Stewardship Evaluation Results
ID System Improvement Estimated Cost System Improvement Time-frame
Short-term <5 years Long-term >5 years)
System Improvement Category Tier
82B Municipal Well Relocation/Flood-Proofing in City of Mendota $ 23,110,603 Long-term Small Community/DAC 3
83 Wastewater Treatment Plant Flood Levee in City of Mendota $ 10,885,000 Long-term Small Community/DAC 3
84 Mendota Pool Park Flood Protection $ 1,737,000 Long-term Small Community/DAC 3
85 Camp 13 Area Surface Storage $ 44,000,000 Long-term Groundwater Recharge/Conjunctive Use/Water Supply 3
86 Orestimba Creek Recharge and Recovery Project $ 8,200,000 Long-term Groundwater Recharge/Conjunctive Use/Water Supply 3
35 Divert Flood Flows to Agricultural Lands $ - Long-term Conceptual 2
36 Ecosystem Restoration along Waterways $ - Long-term Conceptual 2
11 Flooding Existing Pasture Lands $ - Long-term Conceptual 3
32 Construct Ring Levees around Flood-Prone Areas $ - Long-term Conceptual 3
34 Construct Levees or Channel Widening Projects along Creeks/Streams in the Region $ - Long-term Conceptual 3
Note: - = 0 dollars
Upper San Joaquin River Regional Flood Management Plan 6-19

EVALUATION OF SYSTEM IMPROVEMENTS
This page intentionally left blank.
6-20 Upper San Joaquin River Regional Flood Management Plan

EVALUATION OF SYSTEM IMPROVEMENTS
Table 6-8. Economic Stability Evaluation Results
ID System Improvement Estimated Cost System Improvement Time-frame
Short-term <5 years Long-term >5 years)
System Improvement Category Tier
1 Bear Creek Diversion Structure $ 260,000 Short-term Rural 1
2 Levee Breaches Unit 1, LM 9.90; Unit 5, LM 0.25 $ 535,000 Short-term Rural 1
4 Modernize Electrical Controls, Level Sensors and SCADA for Control Structures $ 1,885,000 Short-term Rural 1
5A Rehabilitation of San Joaquin River Control Structure $ 340,000 Short-term Rural 1
6 Sediment Removal Chowchilla Canal Bypass Control Structure $ 175,000 Short-term Rural 1
7 Levee Improvements in Subsidence Area $ - Short-term Rural 1
8 Sediment Removal in the Eastside Bypass $ 12,850,000 Short-term Rural 1
12 Great Valley Grasslands State Park Levee Deauthorization $ 4,930,000 Short-term Environmental 1
13 Bridge Enlargement over Eastside Bypass at Sandy Mush Road $ 1,610,000 Short-term Rural 1
14 Install New Gaging Stations $ 330,000 Short-term Rural 1
15 Western Madera and Merced County Subsidence Solution $ 19,600,000 Short-term Groundwater Recharge/Conjunctive Use/Water Supply 1
17 Update San Joaquin River Flood Control Project O&M Manual $ 500,000 Short-term O&M 1
19 Fresno Slough South Levee Repair and Floodplain Enhancement Project $ 1,340,000 Short-term Rural 1
21 Upper San Joaquin Sediment Study $ 100,000 Short-term Rural 1
22 Bear Creek Diversion Channel Feasibility Study $ 100,000 Short-term Urban 1
23 Le Grand/Planada Flood Control/Conjunctive Use Expansion Study $ 240,000 Short-term Urban 1
24 Le Grand Canal Flood Control Structure at Black Rascal Creek $ 490,000 Short-term Urban 1
44 San Joaquin River Levee at Firebaugh Waste Water Treatment Plant $ 1,280,000 Short-term Small Community/DAC 1
45 San Joaquin River Bank Stabilization at Firebaugh $ 1,800,000 Short-term Small Community/DAC 1
46 San Joaquin River Levee at Firebaugh Rodeo Grounds $ 1,450,000 Short-term Small Community/DAC 1
52 Levee Improvements in Reach 2A, 3, 4A, Eastside Bypass, Mariposa Bypass, and Reach 5 $ 235,000,000 Short-term, Long-term SJRRP 1
16 Los Banos Creek Recharge and Recovery $ 5,000,000 Short-term Groundwater Recharge/Conjunctive Use/Water Supply 2
20 Fresno Slough Sediment Removal $ 720,000 Short-term O&M 2
33 Channel Dredging and/or Vegetation Removal $ 2,200,000 Short-term O&M 2
38 Develop Emergency Response Plans $ 100,000 Short-term Emergency Management 2
43 McCullough Road Drainage Project $ 2,700,000 Short-term Small Community/DAC 2
47 Three Rivers Ranch Study $ 100,000 Short-term Environmental 2
48 Cinnamon Slough Study (Merced Wildlife Refuge) $ 100,000 Short-term Environmental 2
49 Sunrise Ranch Study $ 100,000 Short-term Environmental 2
50 SJRRP Seepage Management Projects $ 185,000,000 Short-term, Long-term SJRRP 2
60 Modify water intake structures at selected refuge units $ 1,540,000 Short-term Environmental 2
61 San Luis NWR East Bear Creek Unit – Install lift pumps to divert water onto 1000 acres of wetland basins during flood flows $ 1,260,000 Short-term Environmental 2
62 San Luis NWR East Bear Creek Unit – Restore a wetland swale to divert floodwaters onto 1000 acres of wetland basins during flood flows $ 340,000 Short-term Environmental 2
63 San Luis NWR East Bear Creek Unit – Enhance existing wetland depth and configuration to provide additional habitat and floodwater storage on approximately 500 acres of wetland basins
$ 1,150,000 Short-term Environmental 2
64 San Luis NWR Freitas Unit – Restore anabranches of Salt Slough $ 50,000 Short-term Environmental 2
65 San Luis NWR West Bear Creek Unit – Restore wetland slough channel connectivity with the San Joaquin River to accommodate flood flows $ 354,000 Short-term Environmental 2
66 Merced NWR Merced Unit – Enhance infrastructure to divert flood flows onto 1200 acres of existing wetlands and other refuge lands $ 235,000 Short-term Environmental 2
67 Merced NWR – Modify water intake structures at selected refuge units $ 580,000 Short-term Environmental 2
68 Merced NWR Sno-Bird Unit – Construct diversions off Eastside Canal $ 263,000 Short-term Environmental 2
Upper San Joaquin River Regional Flood Management Plan 6-21

EVALUATION OF SYSTEM IMPROVEMENTS
Table 6-8. Economic Stability Evaluation Results
ID System Improvement Estimated Cost System Improvement Time-frame
Short-term <5 years Long-term >5 years)
System Improvement Category Tier
69 Ash Slough Arundo and Channel Cleaning $ 1,500,000 Short-term O&M 2
70 Berenda Slough Arundo and Channel Clearing $ 1,300,000 Short-term O&M 2
71 Erosion Repair Project $ 1,500,000 Short-term O&M 2
72 Levee Patrol Road Repair $ 500,000 Short-term O&M 2
73 Berenda Creek Arundo Removal and Channel Clearing $ 500,000 Short-term O&M 2
74 Dry Creek Arundo and Channel Clearing $ 500,000 Short-term O&M 2
75 Cottonwood Creek Arundo and Channel Clearing $ 500,000 Short-term O&M 2
81 San Joaquin River Invasive Species Management $ 2,800,000 Short-term, Long-term Environmental 2
10 Gravelly Ford Madera Ranch Recharge Project $ 1,970,000 Short-term Groundwater Recharge/Conjunctive Use/Water Supply 3
29 Merced Region Programmatic Environmental Impact Report for Stream Bed and Vegetation Control $ 300,000 Short-term Urban 3
40 Monitor Creek Water Quality and Storm Drainage Discharges $ 100,000 Short-term O&M 3
42 Windmill Ditch Drainage $ 1,900,000 Short-term Small Community/DAC 3
53 Sediment Removal in Reach 4A and Eastside Bypass $ - Short-term SJRRP 3
79 Siphon Extension near Chamberlain Road $ 700,000 Short-term Rural 3
37 Modify Land Use Designations $ - Short-term Recommended Action 2
30 Merced County Flood Control District $ 100,000 Short-term Recommended Action 3
39 Increase Public Awareness of Flooding $ 50,000 Short-term Recommended Action 3
41 Update Stormwater Design Standards for the City and Region $ 80,000 Short-term Recommended Action 3
3 Raise Part of Left Bank Levee Unit 6 $ 4,250,000 Long-term Rural 1
5 Enlarge Chowchilla Canal Bypass Control Structure $ 3,380,000 Long-term Rural 1
25 Bear Reservoir Enlargement and Downstream Levee and Channel Improvements $ 202,940,000 Long-term Urban 1
26 Mariposa Reservoir Enlargement and Downstream Levee and Channel Improvements $ 112,500,000 Long-term Urban 1
27 Owens Reservoir Enlargement and Downstream Levee and Channel Improvements $ 8,850,000 Long-term Urban 1
28 Burns Reservoir Enlargement and Downstream Levee and Channel Improvement $ 39,180,000 Long-term Urban 1
31 Black Rascal Creek Flood Control Project $ 32,980,000 Long-term Urban 1
76 Madera Irrigation District Water Bank Facility $ 124,000,000 Long-term Groundwater Recharge/Conjunctive Use/Water Supply 1
78 Madera Lake Regulating and Recharge Project $ 3,500,000 Long-term Groundwater Recharge/Conjunctive Use/Water Supply 1
80 Ingomar Reservoir Surface Storage $ 18,300,000 Long-term Groundwater Recharge/Conjunctive Use/Water Supply 2
82A Municipal Well Relocation/Flood-Proofing in City of Mendota $ 6,431,782 Long-term Small Community/DAC 2
82B Municipal Well Relocation/Flood-Proofing in City of Mendota $ 23,110,603 Long-term Small Community/DAC 2
83 Wastewater Treatment Plant Flood Levee in City of Mendota $ 10,885,000 Long-term Small Community/DAC 2
84 Mendota Pool Park Flood Protection $ 1,737,000 Long-term Small Community/DAC 2
85 Camp 13 Area Surface Storage $ 44,000,000 Long-term Groundwater Recharge/Conjunctive Use/Water Supply 2
86 Orestimba Creek Recharge and Recovery Project $ 8,200,000 Long-term Groundwater Recharge/Conjunctive Use/Water Supply 2
9 Sand Slough Control Structure Removal $ 290,000 Long-term Rural 3
18 Eastside Acres San Joaquin River Levee Project $ 1,210,000 Long-Term Small Community/DAC 3
51 Firebaugh Habitat Projects $ - Long-term SJRRP 3
54 Reach 2B/Mendota Pool Bypass $ 295,000,000 Long-term SJRRP 3
55 Reach 4B Improvements $ 234,199,000 Long-term SJRRP 3
6-22 Upper San Joaquin River Regional Flood Management Plan

EVALUATION OF SYSTEM IMPROVEMENTS
Table 6-8. Economic Stability Evaluation Results
ID System Improvement Estimated Cost System Improvement Time-frame
Short-term <5 years Long-term >5 years)
System Improvement Category Tier
56 Reach 2B Project/San Mateo Road Crossing $ 9,600,000 Long-term SJRRP 3
57 Fish Passage Improvement at Flood Control Structures $ - Long-term SJRRP 3
58 Arroyo Canal Screening and Sack Dam Passage $ 25,000,000 Long-term SJRRP 3
59 Salt Slough Barrier and Mud Slough Barrier $ - Long-term SJRRP 3
77 Madera Canal/Hidden Dam Pump Storage Project $ 11,500,000 Long-term Groundwater Recharge/Conjunctive Use/Water Supply 3
32 Construct Ring Levees around Flood-Prone Areas $ - Long-term Conceptual 1
34 Construct Levees or Channel Widening Projects along Creeks/Streams in the Region $ - Long-term Conceptual 1
35 Divert Flood Flows to Agricultural Lands $ - Long-term Conceptual 1
11 Flooding Existing Pasture Lands $ - Long-term Conceptual 3
36 Ecosystem Restoration along Waterways $ - Long-term Conceptual 3
Note: - = 0 dollars
Upper San Joaquin River Regional Flood Management Plan 6-23

EVALUATION OF SYSTEM IMPROVEMENTS
This page intentionally left blank.
6-24 Upper San Joaquin River Regional Flood Management Plan

EVALUATION OF SYSTEM IMPROVEMENTS
Table 6-9. Regional Issues Evaluation Results
ID System Improvement Estimated Cost System Improvement Time-frame
Short-term <5 years Long-term >5 years)
System Improvement Category Tier
4 Modernize Electrical Controls, Level Sensors and SCADA for Control Structures $ 1,885,000 Short-term Rural 1
5A Rehabilitation of San Joaquin River Control Structure $ 340,000 Short-term Rural 1
6 Sediment Removal Chowchilla Canal Bypass Control Structure $ 175,000 Short-term Rural 1
7 Levee Improvements in Subsidence Area $ - Short-term Rural 1
12 Great Valley Grasslands State Park Levee Deauthorization $ 4,930,000 Short-term Environmental 1
13 Bridge Enlargement over Eastside Bypass at Sandy Mush Road $ 1,610,000 Short-term Rural 1
14 Install New Gaging Stations $ 330,000 Short-term Rural 1
15 Western Madera and Merced County Subsidence Solution $ 19,600,000 Short-term Groundwater Recharge/Conjunctive Use/Water Supply 1
17 Update San Joaquin River Flood Control Project O&M Manual $ 500,000 Short-term O&M 1
21 Upper San Joaquin Sediment Study $ 100,000 Short-term Rural 1
22 Bear Creek Diversion Channel Feasibility Study $ 100,000 Short-term Urban 1
23 Le Grand/Planada Flood Control/Conjunctive Use Expansion Study $ 240,000 Short-term Urban 1
24 Le Grand Canal Flood Control Structure at Black Rascal Creek $ 490,000 Short-term Urban 1
38 Develop Emergency Response Plans $ 100,000 Short-term Emergency Management 1
44 San Joaquin River Levee at Firebaugh Waste Water Treatment Plant $ 1,280,000 Short-term Small Community/DAC 1
45 San Joaquin River Bank Stabilization at Firebaugh $ 1,800,000 Short-term Small Community/DAC 1
46 San Joaquin River Levee at Firebaugh Rodeo Grounds $ 1,450,000 Short-term Small Community/DAC 1
52 Levee Improvements in Reach 2A, 3, 4A, Eastside Bypass, Mariposa Bypass, and Reach 5 $ 235,000,000 Short-term, Long-term SJRRP 1
1 Bear Creek Diversion Structure $ 260,000 Short-term Rural 2
2 Levee Breaches Unit 1, LM 9.90; Unit 5, LM 0.25 $ 535,000 Short-term Rural 2
8 Sediment Removal in the Eastside Bypass $ 12,850,000 Short-term Rural 2
19 Fresno Slough South Levee Repair and Floodplain Enhancement Project $ 1,340,000 Short-term Rural 2
33 Channel Dredging and/or Vegetation Removal $ 2,200,000 Short-term O&M 2
47 Three Rivers Ranch Study $ 100,000 Short-term Environmental 2
48 Cinnamon Slough Study (Merced Wildlife Refuge) $ 100,000 Short-term Environmental 2
49 Sunrise Ranch Study $ 100,000 Short-term Environmental 2
50 SJRRP Seepage Management Projects $ 185,000,000 Short-term, Long-term SJRRP 2
53 Sediment Removal in Reach 4A and Eastside Bypass $ - Short-term SJRRP 2
60 Modify water intake structures at selected refuge units $ 1,540,000 Short-term Environmental 2
61 San Luis NWR East Bear Creek Unit – Install lift pumps to divert water onto 1000 acres of wetland basins during flood flows $ 1,260,000 Short-term Environmental 2
62 San Luis NWR East Bear Creek Unit – Restore a wetland swale to divert floodwaters onto 1000 acres of wetland basins during flood flows $ 340,000 Short-term Environmental 2
63 San Luis NWR East Bear Creek Unit – Enhance existing wetland depth and configuration to provide additional habitat and floodwater storage on approximately 500 acres of wetland basins
$ 1,150,000 Short-term Environmental 2
64 San Luis NWR Freitas Unit – Restore anabranches of Salt Slough $ 50,000 Short-term Environmental 2
65 San Luis NWR West Bear Creek Unit – Restore wetland slough channel connectivity with the San Joaquin River to accommodate flood flows $ 354,000 Short-term Environmental 2
66 Merced NWR Merced Unit – Enhance infrastructure to divert flood flows onto 1200 acres of existing wetlands and other refuge lands $ 235,000 Short-term Environmental 2
67 Merced NWR – Modify water intake structures at selected refuge units $ 580,000 Short-term Environmental 2
68 Merced NWR Sno-Bird Unit – Construct diversions off Eastside Canal $ 263,000 Short-term Environmental 2
81 San Joaquin River Invasive Species Management $ 2,800,000 Short-term, Long-term Environmental 2
10 Gravelly Ford Madera Ranch Recharge Project $ 1,970,000 Short-term Groundwater Recharge/Conjunctive Use/Water Supply 3
Upper San Joaquin River Regional Flood Management Plan 6-25

EVALUATION OF SYSTEM IMPROVEMENTS
Table 6-9. Regional Issues Evaluation Results
ID System Improvement Estimated Cost System Improvement Time-frame
Short-term <5 years Long-term >5 years)
System Improvement Category Tier
16 Los Banos Creek Recharge and Recovery $ 5,000,000 Short-term Groundwater Recharge/Conjunctive Use/Water Supply 3
20 Fresno Slough Sediment Removal $ 720,000 Short-term O&M 3
29 Merced Region Programmatic Environmental Impact Report for Stream Bed and Vegetation Control $ 300,000 Short-term Urban 3
40 Monitor Creek Water Quality and Storm Drainage Discharges $ 100,000 Short-term O&M 3
42 Windmill Ditch Drainage $ 1,900,000 Short-term Small Community/DAC 3
43 McCullough Road Drainage Project $ 2,700,000 Short-term Small Community/DAC 3
69 Ash Slough Arundo and Channel Cleaning $ 1,500,000 Short-term O&M 3
70 Berenda Slough Arundo and Channel Clearing $ 1,300,000 Short-term O&M 3
71 Erosion Repair Project $ 1,500,000 Short-term O&M 3
72 Levee Patrol Road Repair $ 500,000 Short-term O&M 3
73 Berenda Creek Arundo Removal and Channel Clearing $ 500,000 Short-term O&M 3
74 Dry Creek Arundo and Channel Clearing $ 500,000 Short-term O&M 3
75 Cottonwood Creek Arundo and Channel Clearing $ 500,000 Short-term O&M 3
79 Siphon Extension near Chamberlain Road $ 700,000 Short-term Rural 3
30 Merced County Flood Control District $ 100,000 Short-term Recommended Action 1
37 Modify Land Use Designations $ - Short-term Recommended Action 2
39 Increase Public Awareness of Flooding $ 50,000 Short-term Recommended Action 2
41 Update Stormwater Design Standards for the City and Region $ 80,000 Short-term Recommended Action 2
5 Enlarge Chowchilla Canal Bypass Control Structure $ 3,380,000 Long-term Rural 1
25 Bear Reservoir Enlargement and Downstream Levee and Channel Improvements $ 202,940,000 Long-term Urban 1
26 Mariposa Reservoir Enlargement and Downstream Levee and Channel Improvements $ 112,500,000 Long-term Urban 1
27 Owens Reservoir Enlargement and Downstream Levee and Channel Improvements $ 8,850,000 Long-term Urban 1
28 Burns Reservoir Enlargement and Downstream Levee and Channel Improvement $ 39,180,000 Long-term Urban 1
31 Black Rascal Creek Flood Control Project $ 32,980,000 Long-term Urban 1
51 Firebaugh Habitat Projects $ - Long-term SJRRP 1
3 Raise Part of Left Bank Levee Unit 6 $ 4,250,000 Long-term Rural 2
18 Eastside Acres San Joaquin River Levee Project $ 1,210,000 Long-Term Small Community/DAC 2
54 Reach 2B/Mendota Pool Bypass $ 295,000,000 Long-term SJRRP 2
55 Reach 4B Improvements $ 234,199,000 Long-term SJRRP 2
56 Reach 2B Project/San Mateo Road Crossing $ 9,600,000 Long-term SJRRP 2
57 Fish Passage Improvement at Flood Control Structures $ - Long-term SJRRP 2
58 Arroyo Canal Screening and Sack Dam Passage $ 25,000,000 Long-term SJRRP 2
84 Mendota Pool Park Flood Protection $ 1,737,000 Long-term Small Community/DAC 2
9 Sand Slough Control Structure Removal $ 290,000 Long-term Rural 3
59 Salt Slough Barrier and Mud Slough Barrier $ - Long-term SJRRP 3
76 Madera Irrigation District Water Bank Facility $ 124,000,000 Long-term Groundwater Recharge/Conjunctive Use/Water Supply 3
77 Madera Canal/Hidden Dam Pump Storage Project $ 11,500,000 Long-term Groundwater Recharge/Conjunctive Use/Water Supply 3
78 Madera Lake Regulating and Recharge Project $ 3,500,000 Long-term Groundwater Recharge/Conjunctive Use/Water Supply 3
80 Ingomar Reservoir Surface Storage $ 18,300,000 Long-term Groundwater Recharge/Conjunctive Use/Water Supply 3
6-26 Upper San Joaquin River Regional Flood Management Plan

EVALUATION OF SYSTEM IMPROVEMENTS
Table 6-9. Regional Issues Evaluation Results
ID System Improvement Estimated Cost System Improvement Time-frame
Short-term <5 years Long-term >5 years)
System Improvement Category Tier
82A Municipal Well Relocation/Flood-Proofing in City of Mendota $ 6,431,782 Long-term Small Community/DAC 3
82B Municipal Well Relocation/Flood-Proofing in City of Mendota $ 23,110,603 Long-term Small Community/DAC 3
83 Wastewater Treatment Plant Flood Levee in City of Mendota $ 10,885,000 Long-term Small Community/DAC 3
85 Camp 13 Area Surface Storage $ 44,000,000 Long-term Groundwater Recharge/Conjunctive Use/Water Supply 3
86 Orestimba Creek Recharge and Recovery Project $ 8,200,000 Long-term Groundwater Recharge/Conjunctive Use/Water Supply 3
11 Flooding Existing Pasture Lands $ - Long-term Conceptual 2
34 Construct Levees or Channel Widening Projects along Creeks/Streams in the Region $ - Long-term Conceptual 2
35 Divert Flood Flows to Agricultural Lands $ - Long-term Conceptual 2
36 Ecosystem Restoration along Waterways $ - Long-term Conceptual 2
32 Construct Ring Levees around Flood-Prone Areas $ - Long-term Conceptual 3
Note: - = 0 dollars
Upper San Joaquin River Regional Flood Management Plan 6-27

EVALUATION OF SYSTEM IMPROVEMENTS
This page intentionally left blank.
6-28 Upper San Joaquin River Regional Flood Management Plan
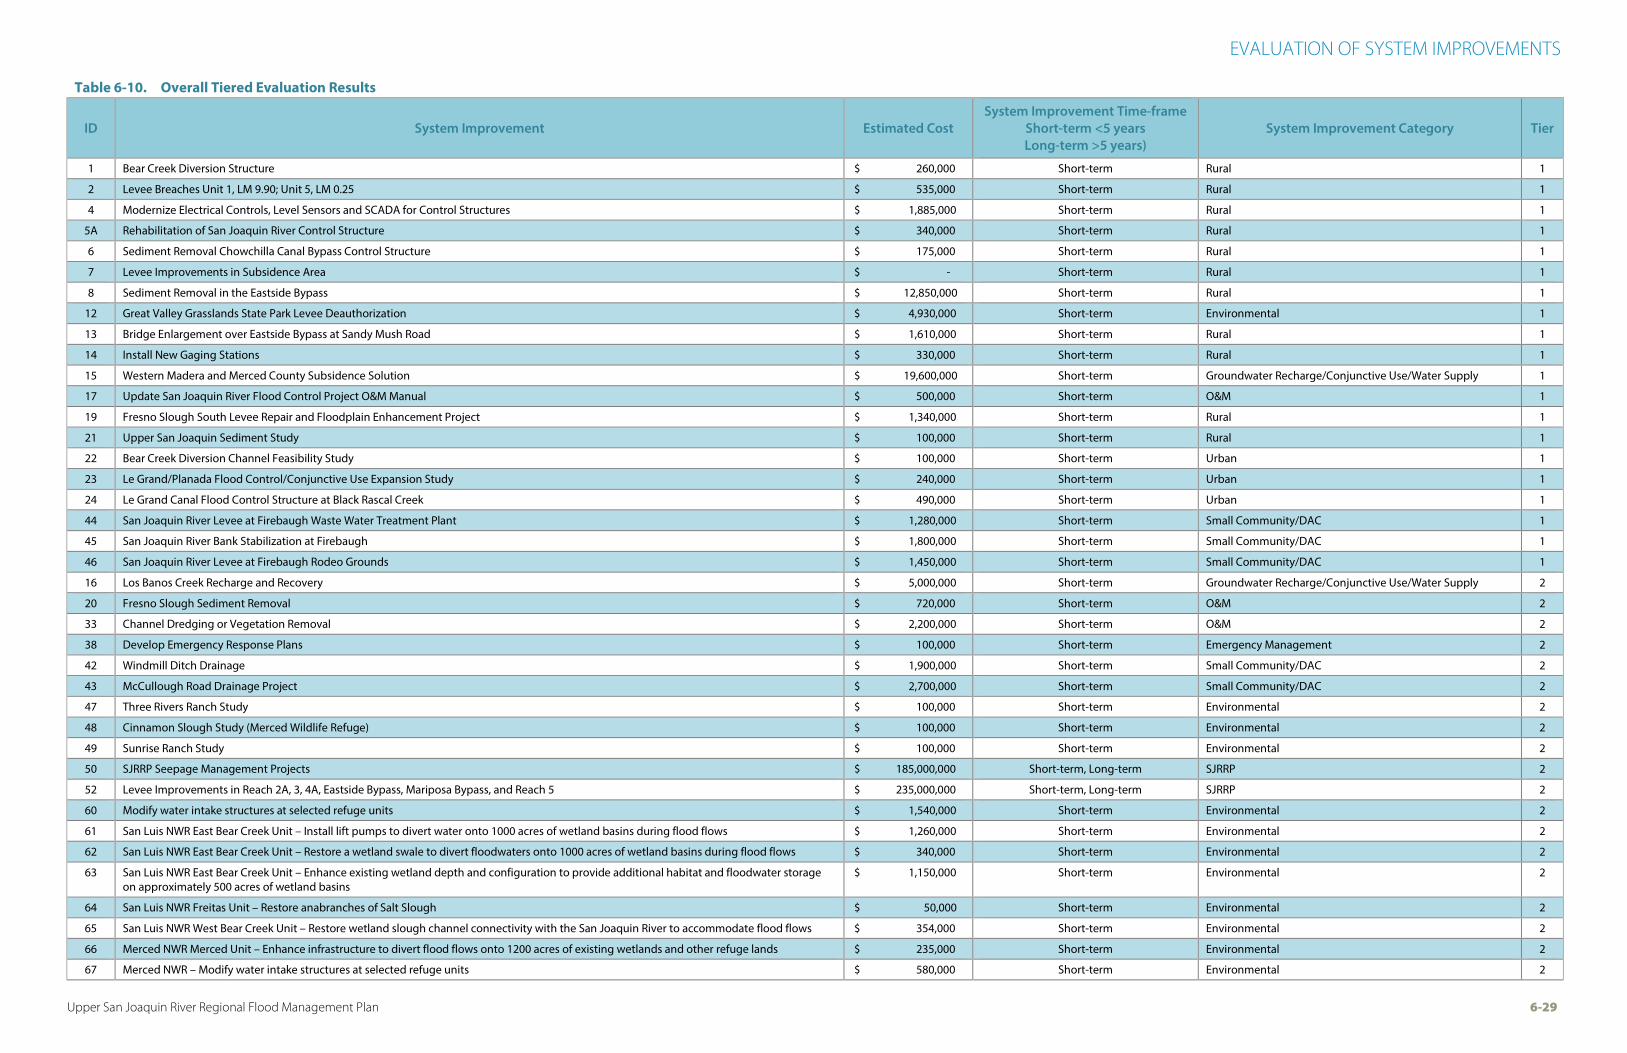
EVALUATION OF SYSTEM IMPROVEMENTS
Table 6-10. Overall Tiered Evaluation Results
ID System Improvement Estimated Cost System Improvement Time-frame
Short-term <5 years Long-term >5 years)
System Improvement Category Tier
1 Bear Creek Diversion Structure $ 260,000 Short-term Rural 1
2 Levee Breaches Unit 1, LM 9.90; Unit 5, LM 0.25 $ 535,000 Short-term Rural 1
4 Modernize Electrical Controls, Level Sensors and SCADA for Control Structures $ 1,885,000 Short-term Rural 1
5A Rehabilitation of San Joaquin River Control Structure $ 340,000 Short-term Rural 1
6 Sediment Removal Chowchilla Canal Bypass Control Structure $ 175,000 Short-term Rural 1
7 Levee Improvements in Subsidence Area $ - Short-term Rural 1
8 Sediment Removal in the Eastside Bypass $ 12,850,000 Short-term Rural 1
12 Great Valley Grasslands State Park Levee Deauthorization $ 4,930,000 Short-term Environmental 1
13 Bridge Enlargement over Eastside Bypass at Sandy Mush Road $ 1,610,000 Short-term Rural 1
14 Install New Gaging Stations $ 330,000 Short-term Rural 1
15 Western Madera and Merced County Subsidence Solution $ 19,600,000 Short-term Groundwater Recharge/Conjunctive Use/Water Supply 1
17 Update San Joaquin River Flood Control Project O&M Manual $ 500,000 Short-term O&M 1
19 Fresno Slough South Levee Repair and Floodplain Enhancement Project $ 1,340,000 Short-term Rural 1
21 Upper San Joaquin Sediment Study $ 100,000 Short-term Rural 1
22 Bear Creek Diversion Channel Feasibility Study $ 100,000 Short-term Urban 1
23 Le Grand/Planada Flood Control/Conjunctive Use Expansion Study $ 240,000 Short-term Urban 1
24 Le Grand Canal Flood Control Structure at Black Rascal Creek $ 490,000 Short-term Urban 1
44 San Joaquin River Levee at Firebaugh Waste Water Treatment Plant $ 1,280,000 Short-term Small Community/DAC 1
45 San Joaquin River Bank Stabilization at Firebaugh $ 1,800,000 Short-term Small Community/DAC 1
46 San Joaquin River Levee at Firebaugh Rodeo Grounds $ 1,450,000 Short-term Small Community/DAC 1
16 Los Banos Creek Recharge and Recovery $ 5,000,000 Short-term Groundwater Recharge/Conjunctive Use/Water Supply 2
20 Fresno Slough Sediment Removal $ 720,000 Short-term O&M 2
33 Channel Dredging or Vegetation Removal $ 2,200,000 Short-term O&M 2
38 Develop Emergency Response Plans $ 100,000 Short-term Emergency Management 2
42 Windmill Ditch Drainage $ 1,900,000 Short-term Small Community/DAC 2
43 McCullough Road Drainage Project $ 2,700,000 Short-term Small Community/DAC 2
47 Three Rivers Ranch Study $ 100,000 Short-term Environmental 2
48 Cinnamon Slough Study (Merced Wildlife Refuge) $ 100,000 Short-term Environmental 2
49 Sunrise Ranch Study $ 100,000 Short-term Environmental 2
50 SJRRP Seepage Management Projects $ 185,000,000 Short-term, Long-term SJRRP 2
52 Levee Improvements in Reach 2A, 3, 4A, Eastside Bypass, Mariposa Bypass, and Reach 5 $ 235,000,000 Short-term, Long-term SJRRP 2
60 Modify water intake structures at selected refuge units $ 1,540,000 Short-term Environmental 2
61 San Luis NWR East Bear Creek Unit – Install lift pumps to divert water onto 1000 acres of wetland basins during flood flows $ 1,260,000 Short-term Environmental 2
62 San Luis NWR East Bear Creek Unit – Restore a wetland swale to divert floodwaters onto 1000 acres of wetland basins during flood flows $ 340,000 Short-term Environmental 2
63 San Luis NWR East Bear Creek Unit – Enhance existing wetland depth and configuration to provide additional habitat and floodwater storage on approximately 500 acres of wetland basins
$ 1,150,000 Short-term Environmental 2
64 San Luis NWR Freitas Unit – Restore anabranches of Salt Slough $ 50,000 Short-term Environmental 2
65 San Luis NWR West Bear Creek Unit – Restore wetland slough channel connectivity with the San Joaquin River to accommodate flood flows $ 354,000 Short-term Environmental 2
66 Merced NWR Merced Unit – Enhance infrastructure to divert flood flows onto 1200 acres of existing wetlands and other refuge lands $ 235,000 Short-term Environmental 2
67 Merced NWR – Modify water intake structures at selected refuge units $ 580,000 Short-term Environmental 2
Upper San Joaquin River Regional Flood Management Plan 6-29

EVALUATION OF SYSTEM IMPROVEMENTS
Table 6-10. Overall Tiered Evaluation Results
ID System Improvement Estimated Cost System Improvement Time-frame
Short-term <5 years Long-term >5 years)
System Improvement Category Tier
68 Merced NWR Sno-Bird Unit – Construct diversions off Eastside Canal $ 263,000 Short-term Environmental 2
81 San Joaquin River Invasive Species Management $ 2,800,000 Short-term, Long-term Environmental 2
10 Gravelly Ford Madera Ranch Recharge Project $ 1,970,000 Short-term Groundwater Recharge/Conjunctive Use/Water Supply 3
29 Merced Region Programmatic Environmental Impact Report for Stream Bed and Vegetation Control $ 300,000 Short-term Urban 3
40 Monitor Creek Water Quality and Storm Drainage Discharges $ 100,000 Short-term O&M 3
53 Sediment Removal in Reach 4A and Eastside Bypass $ - Short-term SJRRP 3
69 Ash Slough Arundo and Channel Cleaning $ 1,500,000 Short-term O&M 3
70 Berenda Slough Arundo and Channel Clearing $ 1,300,000 Short-term O&M 3
71 Erosion Repair Project $ 1,500,000 Short-term O&M 3
72 Levee Patrol Road Repair $ 500,000 Short-term O&M 3
73 Berenda Creek Arundo Removal and Channel Clearing $ 500,000 Short-term O&M 3
74 Dry Creek Arundo and Channel Clearing $ 500,000 Short-term O&M 3
75 Cottonwood Creek Arundo and Channel Clearing $ 500,000 Short-term O&M 3
79 Siphon Extension near Chamberlain Road $ 700,000 Short-term Rural 3
37 Modify Land Use Designations $ - Short-term Recommended Action 2
30 Merced County Flood Control District $ 100,000 Short-term Recommended Action 3
39 Increase Public Awareness of Flooding $ 50,000 Short-term Recommended Action 3
41 Update Stormwater Design Standards for the City and Region $ 80,000 Short-term Recommended Action 3
3 Raise Part of Left Bank Levee Unit 6 $ 4,250,000 Long-term Rural 1
5 Enlarge Chowchilla Canal Bypass Control Structure $ 3,380,000 Long-term Rural 1
25 Bear Reservoir Enlargement and Downstream Levee and Channel Improvements $ 202,940,000 Long-term Urban 1
26 Mariposa Reservoir Enlargement and Downstream Levee and Channel Improvements $ 112,500,000 Long-term Urban 1
27 Owens Reservoir Enlargement and Downstream Levee and Channel Improvements $ 8,850,000 Long-term Urban 1
28 Burns Reservoir Enlargement and Downstream Levee and Channel Improvement $ 39,180,000 Long-term Urban 1
31 Black Rascal Creek Flood Control Project $ 32,980,000 Long-term Urban 1
18 Eastside Acres San Joaquin River Levee Project $ 1,210,000 Long-Term Small Community/DAC 2
51 Firebaugh Habitat Projects $ - Long-term SJRRP 2
54 Reach 2B/Mendota Pool Bypass $ 295,000,000 Long-term SJRRP 2
55 Reach 4B Improvements $ 234,199,000 Long-term SJRRP 2
56 Reach 2B Project/San Mateo Road Crossing $ 9,600,000 Long-term SJRRP 2
58 Arroyo Canal Screening and Sack Dam Passage $ 25,000,000 Long-term SJRRP 2
76 Madera Irrigation District Water Bank Facility $ 124,000,000 Long-term Groundwater Recharge/Conjunctive Use/Water Supply 2
78 Madera Lake Regulating and Recharge Project $ 3,500,000 Long-term Groundwater Recharge/Conjunctive Use/Water Supply 2
82A Municipal Well Relocation/Flood-Proofing in City of Mendota $ 6,431,782 Long-term Small Community/DAC 2
82B Municipal Well Relocation/Flood-Proofing in City of Mendota $ 23,110,603 Long-term Small Community/DAC 2
83 Wastewater Treatment Plant Flood Levee in City of Mendota $ 10,885,000 Long-term Small Community/DAC 2
84 Mendota Pool Park Flood Protection $ 1,737,000 Long-term Small Community/DAC 2
9 Sand Slough Control Structure Removal $ 290,000 Long-term Rural 3
57 Fish Passage Improvement at Flood Control Structures $ - Long-term SJRRP 3
6-30 Upper San Joaquin River Regional Flood Management Plan

EVALUATION OF SYSTEM IMPROVEMENTS
Table 6-10. Overall Tiered Evaluation Results
ID System Improvement Estimated Cost System Improvement Time-frame
Short-term <5 years Long-term >5 years)
System Improvement Category Tier
59 Salt Slough Barrier and Mud Slough Barrier $ - Long-term SJRRP 3
77 Madera Canal/Hidden Dam Pump Storage Project $ 11,500,000 Long-term Groundwater Recharge/Conjunctive Use/Water Supply 3
80 Ingomar Reservoir Surface Storage $ 18,300,000 Long-term Groundwater Recharge/Conjunctive Use/Water Supply 3
85 Camp 13 Area Surface Storage $ 44,000,000 Long-term Groundwater Recharge/Conjunctive Use/Water Supply 3
86 Orestimba Creek Recharge and Recovery Project $ 8,200,000 Long-term Groundwater Recharge/Conjunctive Use/Water Supply 3
34 Construct Levees or Channel Widening Projects along Creeks/Streams in the Region $ - Long-term Conceptual 1
35 Divert Flood Flows to Agricultural Lands $ - Long-term Conceptual 1
32 Construct Ring Levees around Flood-Prone Areas $ - Long-term Conceptual 2
36 Ecosystem Restoration along Waterways $ - Long-term Conceptual 2
11 Flooding Existing Pasture Lands $ - Long-term Conceptual 3
Note: - = 0 dollars
Upper San Joaquin River Regional Flood Management Plan 6-31

EVALUATION OF SYSTEM IMPROVEMENTS
This page intentionally left blank.
6-32 Upper San Joaquin River Regional Flood Management Plan

7.0 Regional Finance Plan
7.1 Introduction This chapter provides an overview of the economic outlook for the region and the challenging financial setting for local implementing agencies. It explores State and Federal funding options and describes recommendations for financing proposed regional SIs.
More than 88 proposed SIs went through the RFMP evaluation and prioritization process and were grouped into three tiers based on the benefits provided in the categories of public safety, environmental stewardship, economic reliability, and regional issues. The SIs included in this financial analysis are the Tier 1 SIs identified in the previous chapter.
Three hypothetical financing scenarios were developed to evaluate a range of potential cost shares for local agencies, State, and Federal programs. Many of the funding sources described in this chapter are competitive in nature and have limited funds, so awards are not guaranteed even if all qualifying criteria are met.
This financial analysis was prepared for planning purposes only. Detailed financial plans will need to be prepared for each project as more information becomes available and as projects are considered for specific funding opportunities.
7.2 Regional Economic Outlook The USJR region has an economic profile that is unique amongst the other RFMP regions. The USJR region lies within three counties with 54 percent of the flood region in Merced County, 31 percent in Madera County, and 15 percent in Fresno County. Section 2.3 of this USJR RFMP details the demographics and land use of these counties. Some economic indicators inform the finance plan of the types of funding for which the regional SIs are eligible. In addition, cross-county comparisons can help the implementing agencies understand their future revenue streams. This information helps better gauge the opportunities with local revenue raising, as well as qualifying for certain State and Federal grants. The defining economic characteristic of the USJR region includes counties that contain most, if not all, DACs.
7.2.1 Disadvantaged Communities Although this region has a thriving agricultural economy, most of the populations affected by the SIs discussed in this Regional Finance Plan are considered DACs. DWR identifies DACs as having an annual MHI below 80 percent of the statewide annual MHI in 2010 ($61,632). This demographic classification is important to financing SIs because DACs will be held to a lower cost-sharing responsibility when working with State funding sources. Federal funding sources also adjust the cost-sharing percentages when working with DACs; however, different definitions apply for this classification on a Federal level. Almost all of the cities in this area are considered DACs. Chapter 2, Regional Setting, contains information on population, household income, and education in the USJR region.
In Merced County, the cities of Dos Palos, Los Banos, and Merced and the CDPs of Planada and Le Grand are considered DACs. Table 2-4 (Demographics and Income Levels in the USJR Region) shows the city of Dos Palos with a population of 4,950 and an annual MHI of $34,522; the city of Los Banos has a population
Upper San Joaquin River Regional Flood Management Plan 7-1

REGIONAL FINANCE PLAN
of 35,972 and an annual MHI of $49,131; and the city of Merced has a population of 78,950 with an annual MHI of $38,253. The CDP of Planada has a population of 4,584 and an annual MHI of $32,266, and the CDP of Le Grand has a population of 1,659 and an annual MHI of $37,095. These cities and CDPs are not entirely within the USJR boundaries, but they will potentially benefit from USJR SIs.
Two DACs—the cities of Madera and Chowchilla—in Madera County may benefit from multiple USJR SIs. The city of Chowchilla has a population of 18,720 and an annual MHI of $41,373; Madera has a population of 61,416 and an annual MHI of $43,240. The Tier 1 SIs that focus on subsidence in western Madera County can benefit from the cost-sharing considerations for DACs. Table 2-4 provides more demographic information.
Firebaugh and Mendota are the only cities in Fresno County that are either located partially within the USJR region or are affected by USJR SIs. The city of Firebaugh has a population of 7,561 and an annual MHI of $32,875, and the city of Mendota has a population of 11,014 and an annual MHI of $26,061. At least 4 SIs directly affect Firebaugh, and more than 10 SIs directly affect the DAC of Mendota.
7.2.2 Counties The USJR county demographics and economic conditions characterize the difficulties for major local fundraising. In most of these metrics, the USJR is experiencing a worse economic situation than the rest of California. When seeking Federal and State money for SIs, the USJR region will be competing with the other RFMP regions in the Central Valley. It is important to recognize the relative importance that State and Federal assistance plays in flood management across the region.
Comparing the MHI and households below the poverty line in Merced County to the State and other RFMP regions frames the local fundraising capacity. Merced County has the lowest MHI of counties in the USJR region, and 23 percent of the households are below or at the poverty line. Many of the region’s SIs reside in this county with 54 percent of the USJR region in Merced County. Merced County has an expected population growth of 89 percent by 2050. The high expected population growth is promising for new fundraising capacity as a county with a high volume of SIs. Financial planning for long-term projects must consider where the new development is occurring. Newcomers can contribute to flood management financing through impact fees if they are classified as beneficiaries.
One-third of the USJR region resides in Madera County with multiple SIs on the local Fresno River, Berenda Slough, and the Ash Slough. Madera County’s MHI is $47,937, the highest of USJR region counties, but still less than 80 percent of the State’s annual MHI. The households below or at the poverty line in Madera County are the lowest of the USJR region at 20 percent. Madera County has the lowest population of all USJR counties, but the county has the highest expected population growth. Despite the low population within the USJR region, the SIs affect the major cities in Madera County, Chowchilla and Madera. The combined population of these two cities is similar to the cities in Merced County, just slightly lower.
Fresno County represents the smallest portion of the flood management area consisting of only 15 percent of the USJR region. The demographic statistics for Fresno County are highly reflective of the demographics in Fresno due to its relative size. The cities largely affected by the USJR SIs in Fresno County are Firebaugh and Mendota, although the SIs might provide benefits to the city of Fresno. Fresno County has the highest population and lowest expected population growth in the region.
7-2 Upper San Joaquin River Regional Flood Management Plan

REGIONAL FINANCE PLAN
7.2.3 Local Implementing Agencies Local fundraising for flood management in the USJR region has unique challenges but is also subject to problems encountered across the State. Three of the eight agencies implementing Tier 1 SIs have flood management expenditures that compete with other water management or emergency services funds. The City of Firebaugh, MSG, and Merced County must allocate funds across many services, which may lead to inconsistent funding for flood management. Flood management expenditures are often competing for funding with water supply and water quality projects. Water supply and wastewater treatment are typically supported by user’s fees and have more favorable requirements under Proposition 218. This results in flood management expenditures being lower than water supply and wastewater expenditures, which is a common issue across the State. In addition, Propositions 13, 218, and 26 have severely restricted the ability for these local entities to raise money for flood protection. The Public Policy Institute of California (PPIC) report, Paying for Water in California (2014), details the issues and solutions to the hindrances with local fundraising for flood management in California.
Some of the LMAs in the USJR region are, at this initial stage of the planning process, in charge of identifying and potentially implementing large capital SIs for the first time. Furthermore, some LMAs were created strictly to perform O&M through an agreement with the State in return for the State’s funding the initial capital construction outlay. These agencies, such as the LSJLD, are now being asked by the State to consider financing capital improvements, for which their budgets are not designed. Even if some of these LMAs were to have their assets increased, the portion that would be available for new capital improvements is uncertain. The RFMP process has identified a significant amount of deferred O&M within the region that might limit the funding to support capital improvements. With the potential implementation of SIs will come additional O&M costs that will also need to be considered.
Historically, DWR has undertaken flood fighting in the city of Firebaugh because the City does not have adequate resources for flood fighting along the nonproject levees adjacent to Firebaugh on the San Joaquin River. The City of Firebaugh is considering extending the scope of its submitted SIs to include environmental and recreation benefits. Incorporating these additional benefits will help expand its outside funding opportunities. The City of Firebaugh’s fiscal year (FY) 2014-15 budget expects $8,018,246 in revenue and $7,864,027 in expenses. Capital outlay for FY 2014-15 is $29,056 (City of Firebaugh, 2014). Firebaugh’s classification as a DAC demonstrates its need for financial assistance with flood SIs.
Merced County, Merced ID, and the City of Merced comprise the MSG. Each agency has unique revenue sources and contributes to flood management financially, or with in-kind services. Merced County financially contributes to the MSG with revenues from its general fund and from Floodplain Administration Fees. Merced County revenues from the Floodplain Administration Fee are about $8,000 per year, but annual expenditures for flood O&M are about $150,000 per year. County budgets for FY 2012-13 and FY 2013-14 contained no allocation for capital improvements. Proposed expenditures for FY 2014-15 include $1,000,000 for completion of the environmental studies to support the Black Rascal Flood Control Project. The proposed budget for FY 2014-15 for O&M expenditures is $300,000 (Merced County, 2014).
The City of Merced contributes in-kind services by maintaining 18 miles of creek banks (levees). The area of maintenance is along Bear Creek, Black Rascal Creek, Fahrens Creek, and Cottonwood Creek. In-kind labor comes from the City of Merced Wastewater Collection Department. The department budgets the labor through its Storm Drains account, which in FY 2014-15 has an estimated budget of $1.5 million and covers 1.3 full-time positions. The Storm Drains budget for FY 2014-15 is split roughly in half between O&M and capital improvements (City of Merced, 2014).
Upper San Joaquin River Regional Flood Management Plan 7-3

REGIONAL FINANCE PLAN
Revenue for Merced ID is largely from electricity and water sales to irrigated acreage. Changes in availability of surface water and electricity costs can impact the district’s revenues. Merced County Department of Public Works employee time is contributed to flood management as in-kind contributions. Other agencies that contribute in-kind labor include Merced ID and the City of Merced (Merced County, 2014). For each of the agencies in the MSG, funding for flood management competes with other services, such as emergency services, which has resulted in an inability to implement some projects. In the past, MSG has worked with USACE on some SIs. Currently, future involvement with USACE and DWR is in process, and additional assistance from State and Federal programs is needed.
The current list of Tier 1 SIs for the LSJLD totals over $25 million. The LSJLD is funded by property tax assessments on lands within the LSJLD boundaries that receive flood control benefits. As a result of conversion of lands to State and Federal ownership (primarily for wildlife areas), the LSJLD is facing a disappearing tax base at a time when O&M costs are rising. O&M needed to maintain the channels, levees, and related flood management facilities is increasing due to rising permitting costs and restrictive maintenance requirements. The SJRRP also poses potential challenging O&M issues that may exceed the LSJLD’s current operating budget. FY 2011-12 revenues for LSJLD were $1,174,251 and expenditures were $963,632, leaving a surplus of $210,619.
Several miles of nonproject levees along Fresno Slough, south of Highway 180, are within the USJR region. A group of eight agencies has formed the Fresno Slough Improvement Group to make flood-associated upgrades in this area. The group includes KRCD, Kings River Water Association, Tranquillity ID, Fresno Slough WD, James ID, Reclamation District 1606, San Luis & Delta-Mendota Water Authority, and the San Joaquin River Exchange Contractors. Currently, no formal agreement exists among the member agencies; however, several meetings have been conducted with discussions among members about improving the levees and reducing flood risks along this section of Fresno Slough.
Madera County and the Madera County FCWCA are responsible for flood planning in Madera County. The Madera County FCWCA is responsible not only for levees along Ash and Berenda sloughs and the Fresno River, but also for the Fresno River Diversion Weir. Madera County FCWCA has many authorized functions and authorities, including the ability to tax and issue certain bonds for SI work and enforcement powers. In FY 2012-13, less than half of Madera County FCWCA revenues were generated locally. Property tax made up most of the $176,291 locally raised revenue, while State grant monies provided $286,708. This proportion is expected to increase with FY 2013-2014 State grant monies contributing $970,000 and in FY 2014-15, $1,810,000. This increase in State grant money from the IRWM program and the Flood System Repair Program are not matched with increases in locally raised money. Property tax revenues for Madera County FCWCA in FY 2013-2014 and FY 2014-2015 are both expected to be $160,000 (Madera County, 2014). Madera County FCWCA currently does not have enough local funding to adequately address flood management in the county.
Subsidence in Merced County and Western Madera County continues to financially impact farm operations, water conveyance facilities, and water storage facilities. Local landowners in the Red Top and Washington Avenue areas are investigating forming water/irrigation districts or potentially joining neighboring water/irrigation districts to reduce dependence on groundwater from deep wells that is causing subsidence problems. Landowners will then be evaluating options to develop and adopt a finance plan and cost allocation.
7-4 Upper San Joaquin River Regional Flood Management Plan

REGIONAL FINANCE PLAN
Reclamation, through the SJRRP, has access to its own sources of funding; therefore, the proposed SJRRP SIs are not included in this USJR Finance Plan. The SJRRP, however, could create the potential for multibenefit opportunities with SIs implemented by other local agencies.
7.3 Funding Sources The following sections describe the Federal, State, and local funding sources that might be available for USJR SIs. Federal and State funding sources are grouped into two categories—grant programs with a focus on public safety or with a focus on environmental stewardship. Many of the Federal and State grant programs fund projects that provide both benefits, but the financial analysis classified each source by its main objective. The SFMP Phase 1 Flood Future Report, Attachment I: Finance Strategies, provides an overview and history of flood management financing in California.
Local funding sources available to implementing agencies vary, depending if the agency is a city, county, or special district. Special districts include irrigation districts, flood control districts, and levee improvement districts. Revenue sources for special districts include property assessments, ad valorem taxes, rates, and fees. Cities and counties have similar revenue sources and include property taxes, impact fees, and sales taxes. Both types of agencies must follow the guidelines of Propositions 13, 218, and 26 when changing fees. Federal and State grant programs may also be available to local agencies and are discussed in this finance plan. Because of the current financial situation of the LMAs and local DACs, these Federal and State revenue sources are critical to the region in advancing SIs.
The financial analysis also makes special note of funding sources that provide money for planning documents and studies, and potentially for grant writing. Every SI will have to go through this type of process. Without quantified benefits, it will be difficult, or impossible to secure additional Federal or State money to implement the project. As part of the planning process, it is also important to identify the additional O&M costs that will be required of the implementing agency. Federal and State sources that provide funds specifically for these needs include:
• FEMA Flood Mitigation Assistance Program grants give up to $50,000
• FEMA Pre-Disaster Mitigation Program grant gives up to an $800,000 Federal share for planning or developing a hazard mitigation plan
• USACE Planning grants
• DWR Urban Flood Risk Reduction Program
• IRWM Grants Program
7.3.1 Federal Programs
Public Safety Focus Federal expenditures on flood management with a public safety focus in California have largely been administered through the USACE. Historical USACE assistance in this region is not as prevalent as other parts of the Central Valley, State, and nation. Getting the USACE involved, or re-involved in the financing of USJR SIs is one finance strategy. The MSG has previous experience working with the USACE. Five of its SIs are prioritized as Tier 1, and future collaboration with USACE is planned. These SIs include the Bear Creek Diversion Channel Feasibility Study, the Bear Reservoir, the Mariposa Reservoir, the Owens Reservoir, and the Burns Reservoir Enlargement with downstream levee improvements.
Upper San Joaquin River Regional Flood Management Plan 7-5

REGIONAL FINANCE PLAN
FEMA administers the Flood Mitigation Assistance Program and the Pre-Disaster Mitigation Program as part of the Disaster Mitigation Act of 2000. FEMA grants make cost-share adjustments for small impoverished communities similar to the DAC classification by DWR. FEMA defines these communities as smaller than 3,000 people with a per capita income of less than 80 percent of the national per capita income and with an unemployment rate that is at least 1 percent greater than the national average. This classification by FEMA raises the Federal cost-share from FEMA grants up to 90 percent of the total cost.
Two other Federal agencies administer grant programs that can contribute to the financing of USJR SIs. Reclamation and the USDA provide Federal assistance for programs that improve water efficiency or increase water supply in rural communities. At this time, one Tier 1 SI is eligible for the Reclamation grant and four SIs are eligible for USDA grants. Table 7-1 describes the available Federal public safety grant programs.
Table 7-1. Federal Public Safety Grant Programs
Agency Program Scope Cost Share
FEMA Flood Mitigation Assistance Program
This program provides funds for projects to reduce or eliminate risk of flood damage to buildings that are insured under the NFIP on an annual basis.
75%-90%
Pre-Disaster Mitigation Program
The program provides funds for hazard mitigation planning and projects on an annual basis. The Pre-Disaster Mitigation Program was set in place to reduce overall risk to people and structures, and at the same time to reduce reliance on Federal funding if an actual disaster were to occur.
75%-90%
Reclamation WaterSMART Grants This program provides funds for projects that seek to improve water efficiency, protect endangered and threatened species, and address climate-related impacts.
50%
USACE USACE Projects and Studies Funding
Cost-share with USACE on SPFC USACE projects and studies. Varies
USDA Emergency Community Water Assistance Grants
The Emergency Community Water Assistance Grants provide money to rural communities that have experienced a significant decline in water quantity or quality.
100%
Environmental Stewardship Focus Of the many Federal grant programs that provide funds for projects promoting environmental benefits, USJR SIs are eligible for some. Finding the mutual ground between public safety and environmental stewardship can be difficult. Many of the nine Federal grant programs that seek to support projects promoting environmental benefits have the desired outcome of putting farmland into easement. Although not all of the programs have the goal of easements, it is important to identify if stakeholders are interested in this type of change in land designation. Of the Federal programs included in the Finance Plan, the largest program in the easement category is the Natural Resources Conservation Service (NRCS) Agricultural Conservation Easement Program (ACEP). The ACEP replaced the Wetlands Reserve Program, the Grassland Reserve Program, and the Farm and Ranch Land Protection Program. NRCS also administers the Emergency Floodplain Easement Program and the Environmental Quality Incentives Program.
The other Federal agencies that administer grant programs focusing on environmental stewardship are the USFWS, the National Park Service (NPS), and Reclamation. The NPS administers the North American Land and Conservation Fund that is interested in cost sharing when recreational and additional environmental benefits are involved. Reclamation has two programs that apply to the whole Central Valley, and one program that is specific to the San Joaquin River. The CVPIA Habitat Restoration Program and the water
7-6 Upper San Joaquin River Regional Flood Management Plan

REGIONAL FINANCE PLAN
use efficiency program are available to any implementing agency in the Central Valley. Reclamation is the lead agency for the SJRRP, which has SIs that could provide some flood benefits depending on how they are implemented, but none that are Tier 1 SIs. The USFWS has three programs that deal with endangered species, waterfowl, and anadromous fish – all relevant to this region. The USFWS is also an implementing agency for some of the NWR SIs in the USJR RFMP. These programs are not Tier 1, nor does their financing ability apply to this phase of the USJR RFMP. Table 7-2 describes the available Federal environmental stewardship grant programs.
Table 7-2. Federal Environmental Stewardship Grant Program
Agency Program Scope Cost Share
NRCS Agricultural Conservation Easement Program
This program provides financial and technical assistance to help conserve agricultural lands and wetlands, and their related benefits.
Varies
Emergency Watershed Protection Program – Floodplain Easement
Floodplain easements restore, protect, maintain, and enhance the functions of floodplains while conserving their natural values such as fish and wildlife habitat, water quality, floodwater retention, and ground water recharge. Structures, including buildings, within the floodplain easement must be demolished and removed, or relocated outside the 100-year floodplain or dam breach inundation area.
Up to 100%
Environmental Quality Incentives Program
This program provides financial and technical assistance to agricultural producers in order to address natural resource concerns and deliver environmental benefits such as improved water and air quality, conserved ground and surface water, reduced soil erosion and sedimentation, or improved or created wildlife habitat.
50%
USFWS Anadromous Fish Restoration Program
The goal of this programs is to expand the accessible range of habitat and improve the quality of fish habitat in an effort to restore natural stocks of anadromous fish.
Varies
Endangered Species Act Section 6 Grant Program
The goal of this program is to work cooperatively with landowners, communities, and tribes to foster voluntary stewardship efforts on private lands for the recovery of endangered species.
75%-90%
North American Wetland Conservation Act
This program provides matching grants to organizations and individuals who have developed partnerships to carry out wetlands conservation projects in the United States, Canada, and Mexico for the benefit of migratory birds and other wildlife associated with wetlands.
50%
NPS Land and Water Conservation Fund
This program provides matching grants to states and local governments for the acquisition and development of public outdoor recreation areas and facilities (as well as funding for conservation strategies).
50%
Reclamation CVPIA Habitat Restoration Program and Conservation Program
These two programs seek projects that protect and restore native habitats, and that stabilize and improve populations of native species in California’s Central Valley.
N/A
Bay-Delta Restoration Water Use Efficiency
This program seeks programs that improve water use efficiency and reduce the demand for Bay-Delta water to result in significant benefits to water quality, water supply reliability, and in-stream flows.
50%
Upper San Joaquin River Regional Flood Management Plan 7-7

REGIONAL FINANCE PLAN
7.3.2 State Programs The trend in flood management financing at the State level is through bonds. Propositions 84 and 1E have been the most recent authorizations of flood management funding. The Flood Future Report details the history of State water bonds and their issues. The PPIC report, Paying for Water in California (2014), details past State General Obligation Bond expenditures on flood management. Other trends in State flood management financing is the shift in focus to IWM. Funding for IWM has risen from 10 percent of total bond funding in 1999 to 18 percent in 2011 (DWR and USACE, 2013). This reflects the State’s interest in promoting multibenefit approaches to water management. DWR’s commitment to the IWM and the IRWM approach will likely lead to future funding focused on these types of projects.
Public Safety Focus The State’s ability to provide financial assistance for flood management projects is almost entirely dependent on the passing of water bonds. DWR is the implementing agency behind all of the State grant programs that focus on public safety benefits. The list of programs varies from structural to nonstructural outcomes, and many have specific eligibility requirements. Because some of these programs are tied to water bonds, there are limited to no funds available for certain areas of the State or type of projects. For example, the DWR Statewide Flood Emergency Response Grants have spent all of the funds for eligible projects across the State; the remaining funds available are specifically for projects in the legal Delta. The water bond on the November 2014 ballot passed and may provide some funding for flood management in the State. Table 7-3 describes the available State public safety grant programs.
State IRWM grants will be important to financing USJR SIs and to supporting a multibenefit approach. Securing funds to support coordination with the IRWM groups in Madera, Merced, and Fresno areas is the next step toward the implementation phase. Most of the existing IRWM plans touch on flood issues, and the integration of USJR SIs into the IRWM process is necessary. The next water bond will likely favor projects that provide multiple benefits. Preparing for the new grant cycle will require the grouping and packaging of SIs that will satisfy the more stringent eligibility requirements.
Table 7-3. State Public Safety Grants Program
Agency Program Scope Cost Share
DWR Flood Control Subventions Program
This program provides a cost-share with local agencies toward capital cost of non-SPFC USACE projects construction (acquisition of land, easement, right-of-way, relocation, and disposal).
50%-70%
Flood Corridor Program Funding under this program is intended to be used for acquisition, restoration, enhancement, and protection of real property while preserving sustainable agriculture and enhancing wildlife habitat in and near flood corridors throughout the State.
-
Local Levee Assistance Program
The Local Levee Assistance Program provides funding for projects to immediately repair and improve critically damaged local levees; evaluate levee stability, seepage, and under-seepage; and perform design or alternatives analysis. Local levees are not part of the SPFC for the Central Valley and are not located within the Sacramento-San Joaquin Delta.
-
Small Community Flood Risk Reduction
This program seeks to repair small community levees to 100-year level of protection (FloodSAFE, 2013d).
50%-90%
7-8 Upper San Joaquin River Regional Flood Management Plan

REGIONAL FINANCE PLAN
Table 7-3. State Public Safety Grants Program
Agency Program Scope Cost Share
Urban Flood Risk Reduction This program will assist Urban Local Agencies to plan, design, and construct flood risk reduction projects. The projects must rehabilitate, reconstruct, replace, or improve SPFC facilities in ways that improve flood protection. Projects may include feasibility studies, design projects, or construction projects.
50%-90%
Flood System Repair Project This program supports SIs that evaluate (feasibility), design, and construct repairs of non-urban SPFC facility (such as levees, channels, structures) deficiencies.
50%-90%
Statewide Flood Emergency Response Grants
Provide support for local EAPs and fund communications equipment to further interoperability.
-
IRWM Grants Program IRWM grants focus on multiple benefits such as flood risk reduction, water supply, and protection of water quality and the environment.
Up to 75%
Environmental Stewardship Focus Multiple State agencies administer grant programs that focus on environmental benefits. Table 7-4 provides descriptions of the State grant programs that support environmental stewardship. The grant program with the highest number of eligible SIs is the California Natural Resources Agency (CNRA) California River Parkways Program with 17 Tier 1 eligibilities. This program provides implementing agencies with State funds that also support flood management projects. The CSP’s largest grant program focuses on environmental benefits in seven types of habitats across California. Each habitat has a separate grant program, and USJR SIs are eligible for programs in Wetlands, Anadromous Salmonids and Trout Habitat, Riparian Habitat, and Endangered Species Habitat. The California Wildlife Conservation Board (WCB) grant program is similar with grants for specific types of habitat. DWR and the SWRCB each administer programs to support projects that restore, enhance, or protect riverine systems.
Table 7-4. State Environmental Stewardship Grants Programs
Agency Program Scope Cost Share CSP Habitat Conservation Fund This program seeks to protect and restore sensitive
habitats in California. Habitat improvement categories include Wetlands, Anadromous Salmonids and Trout Habitat, Riparian Habitat, and wildlife area activities.
50%
WCB California WCB Programs • Riparian Habitat • Inland Wetlands • Agricultural Lands • Rangeland • Habitat Enhancement • Monitoring
The primary responsibilities of WCB are to select, authorize, and allocate funds for the purchase of land and waters suitable for recreation purposes and the preservation, protection, and restoration of wildlife habitat.
Varies
CNRA California River Parkways Program
Eligible SIs must promote recreation and one other condition—land conversion, enhancement, provide habitat, or flood management.
-
Urban Greening for Sustainable Communities – Projects/Planning
This program grants funds for urban greening plans and projects in urban areas that provide multiple benefits, including a decrease in air and water pollution, a reduction in the consumption of natural resources and energy, an increase in the reliability of local water supplies, or an increased adaptability to climate change.
-
Upper San Joaquin River Regional Flood Management Plan 7-9

REGIONAL FINANCE PLAN
Table 7-4. State Environmental Stewardship Grants Programs
Agency Program Scope Cost Share DWR Urban Streams Restoration
Program Projects funded must be designed for a creek, stream, or river that crosses residential, commercial, or industrial property, or which crosses land that will be in the near future. Outcomes must include protection, restoration, or enhancing of ecosystems, and must provide flood control benefits.
-
SWRCB 319(h) Nonpoint Source Grant Program
This program is interested in funding projects that control nonpoint source pollution.
-
7.4 System Improvements
7.4.1 Tier 1 System Improvements The USJR prioritization effort ranked the SIs based upon a weighted scoring of the goals and outcomes. The SI descriptions allowed for matching with outside funding sources. Four SI goal categories sort benefits of USJR regional SIs into public safety, environmental stewardship, economic stability, and regional issues. Forty-two SI benefits were evaluated for each SI. The prioritization effort ranked each SI within the four goal categories based on the level of benefits. Each category was given a relative level of importance when aggregating total benefits for each SI. Benefits from public safety account for 40 percent of total score, Environmental Stewardship 25 percent, Economic Stability 25 percent, and Regional Issues 10 percent.
This Finance Plan concentrates on the Tier 1 SIs identified through the prioritization process described in Chapter 6. The funding scenario analysis focuses on 26 of the 27 Tier 1 SIs. The other Tier 1 SI has its own sources of Federal funding. The 26 Tier 1 SIs included in the funding scenarios have LMAs that could be eligible for listed Federal and State assistance programs. Of the 26 projects in the funding scenario analysis, 17 are classified as non-urban and 9 are classified as urban.
7.4.2 Potential System Improvement Funding SIs were matched with Federal and State funding sources based upon SI benefits and funding source eligibility requirements. Figure 7-1 shows the iterative process of matching funding sources with SIs. This process will be continually applied as new funding sources are identified or SIs are further developed to refine potential benefits. Tables 7-5 and 7-6 show the complete list of all proposed SIs matched with potential funding sources. Tables 7-7 and 7-8 contain detailed information on each of the State and Federal funding sources.
7-10 Upper San Joaquin River Regional Flood Management Plan

REGIONAL FINANCE PLAN
Figure 7-1. Matching System Improvements with Outside Funding Sources
Upper San Joaquin River Regional Flood Management Plan 7-11

REGIONAL FINANCE PLAN
This page intentionally left blank.
7-12 Upper San Joaquin River Regional Flood Management Plan

REGIONAL FINANCE PLAN
Table 7-5. System Improvements Matched with Public Safety Funding Sources
#
Tier
Public Safety Funding Sources
Federal State
System Improvement
FEM
A -
Floo
d M
itiga
tion
Assi
stan
ce
FEM
A -
Pre-
Dis
aste
r Miti
gatio
n
USA
CE –
Pro
ject
s an
d St
udie
s
Recl
amat
ion
- Wat
erSM
ART
Gra
nts
USD
A -
Emer
genc
y W
ater
Gra
nts
DW
R - F
lood
Con
trol
Sub
vent
ions
DW
R - F
lood
Cor
ridor
Pro
gram
DW
R - L
ocal
Lev
ee A
ssis
tanc
e
DW
R - S
mal
l Com
mun
ity G
rant
s
DW
R - U
rban
Flo
od R
isk
Redu
ctio
n
DW
R - F
lood
Sys
tem
Rep
air P
roje
ct
DW
R - S
tate
wid
e Fl
ood
ER G
rant
s
DW
R –
IRW
M G
rant
s
1 Bear Creek Diversion Structure 1 X X X 2 Levee Breaches Unit 1, LM 9.90; Unit 5, LM 0.25 1 X X X X X 3 Raise Part of Left Bank Levee Unit 6 1 X X X X 4 Modernize Electrical Controls, Level Sensors, and
SCADA for Control Structures 1 X X
5 Enlarge Chowchilla Canal Bypass Control Structure 1 X X X X 5A Rehabilitation of San Joaquin River Control
Structure 1 X X X
6 Sediment Removal Chowchilla Canal Bypass Control Structure
1 X X
7 Levee Improvements in Subsidence Area 1 X X 8 Sediment Removal in the Eastside Bypass 1 X X 13 Bridge Enlargement over Eastside Bypass at Sandy
Mush Road 1 X X
14 Install New Gaging Stations 1 X 12 Great Valley Grasslands State Park Levee
Deauthorization 1 X X X X X X
15 Western Madera County Subsidence Solution 1 X X X X 19 Fresno Slough South Levee Repair 1 X X X X 22 Bear Creek Diversion Channel Feasibility Study 1 X X 23 Le Grand/Planada Flood Control/Conjunctive Use
Expansion Study 1 X X X
24 Le Grand Canal Flood Control Structure at Black Rascal Creek
1 X X X X X
25 Bear Reservoir Enlargement, and Downstream Levee and Channel Improvements
1 X X X X
26 Mariposa Reservoir Enlargement, and Downstream Levee and Channel Improvements
1 X X X X
27 Owens Reservoir Enlargement, and Downstream Levee and Channel Improvements
1 X X X X
28 Burns Reservoir Enlargement, and Downstream Levee and Channel Improvement
1 X X X X
31 Black Rascal Creek Flood Control Project 1 X X X X X X X 44 San Joaquin River Levee at Firebaugh Wastewater
Treatment Plant 1 X X X X X
45 San Joaquin River Bank Stabilization at Firebaugh 1 X X 46 San Joaquin River Levee at Firebaugh Rodeo
Grounds 1 X X X X
9 Sand Slough Control Structure Removal X X
10 Gravelly Ford Madera Ranch Recharge Project X X X X X X
11 Flooding Existing Pasture Lands X X X
Upper San Joaquin River Regional Flood Management Plan 7-13

REGIONAL FINANCE PLAN
Table 7-5. System Improvements Matched with Public Safety Funding Sources
#
Tier
Public Safety Funding Sources
Federal State
System Improvement
FEM
A -
Floo
d M
itiga
tion
Assi
stan
ce
FEM
A -
Pre-
Dis
aste
r Miti
gatio
n
USA
CE –
Pro
ject
s an
d St
udie
s
Recl
amat
ion
- Wat
erSM
ART
Gra
nts
USD
A -
Emer
genc
y W
ater
Gra
nts
DW
R - F
lood
Con
trol
Sub
vent
ions
DW
R - F
lood
Cor
ridor
Pro
gram
DW
R - L
ocal
Lev
ee A
ssis
tanc
e
DW
R - S
mal
l Com
mun
ity G
rant
s
DW
R - U
rban
Flo
od R
isk
Redu
ctio
n
DW
R - F
lood
Sys
tem
Rep
air P
roje
ct
DW
R - S
tate
wid
e Fl
ood
ER G
rant
s
DW
R –
IRW
M G
rant
s
16 Los Banos Creek Conjunctive Use Project X X X
18 Westside Surface Storage Reservoir Project X X
20 Fresno Slough Sediment Removal X
21 Fresno Slough Floodplain Enhancement X X
29 Merced Region Programmatic Environmental Impact Report for Streambed and Vegetation Control
X
30 Merced County Flood Control District X
32 Construct Ring Levees around Flood-Prone Areas X
33 Channel Dredging and/or Vegetation Removal X
34 Construct Levees or Channel Widening Projects along Creeks/Streams in the Region
X X X
35 Divert Flood Flows to Agricultural Lands X X X X X
36 Ecosystem Restoration along Waterways X
37 Modify Land Use Designations X X X
38 Develop Emergency Response Plans X X X X X
39 Increase Public Awareness of Flooding X X X
40 Monitor Creek Water Quality and Storm Drainage Discharges
X X
41 Update Stormwater Design Standards for the City and Region
X X X
42 Windmill Ditch Drainage X X
43 McCullough Road Drainage Project X X X
47 Three Rivers Ranch Study X X X
48 Cinnamon Slough Study (Merced NWR) X X X
49 Sunrise Ranch Study X X X
60 Modify water intake structures at selected NWR units
61 San Luis NWR East Bear Creek Unit – Install lift pumps to divert water onto 1,000 acres of wetland basins during flood flows
62 San Luis NWR East Bear Creek Unit – Restore a wetland swale to divert floodwaters onto 1,000 acres of wetland basins during flood flows
63 San Luis NWR East Bear Creek Unit – Enhance existing wetland depth and configuration to provide additional habitat and floodwater storage on approximately 500 acres of wetland basins
64 San Luis NWR Freitas Unit – restore anabranches of Salt Slough
65 San Luis NWR West Bear Creek Unit
66 Merced NWR Merced Unit – Enhance infrastructure to divert flood flows onto 1,200 acres of existing wetlands and other NWR lands
67 Merced NWR – Modify water intake structures at selected NWR units
7-14 Upper San Joaquin River Regional Flood Management Plan

REGIONAL FINANCE PLAN
Table 7-5. System Improvements Matched with Public Safety Funding Sources
#
Tier
Public Safety Funding Sources
Federal State
System Improvement
FEM
A -
Floo
d M
itiga
tion
Assi
stan
ce
FEM
A -
Pre-
Dis
aste
r Miti
gatio
n
USA
CE –
Pro
ject
s an
d St
udie
s
Recl
amat
ion
- Wat
erSM
ART
Gra
nts
USD
A -
Emer
genc
y W
ater
Gra
nts
DW
R - F
lood
Con
trol
Sub
vent
ions
DW
R - F
lood
Cor
ridor
Pro
gram
DW
R - L
ocal
Lev
ee A
ssis
tanc
e
DW
R - S
mal
l Com
mun
ity G
rant
s
DW
R - U
rban
Flo
od R
isk
Redu
ctio
n
DW
R - F
lood
Sys
tem
Rep
air P
roje
ct
DW
R - S
tate
wid
e Fl
ood
ER G
rant
s
DW
R –
IRW
M G
rant
s
68 Merced NWR Sno-Bird Unit – Construct diversions off Eastside Canal
69 Ash Slough Arundo and Channel Cleaning
70 Berenda Slough Arundo and Channel Clearing
71 Erosion Repair Project X X
72 Levee Patrol Road Repair X
73 Berenda Creek Arundo Removal and Channel Clearing X
74 Dry Creek Arundo Removal and Channel Clearing X
75 Cottonwood Creek Arundo Removal and Channel Clearing
X
76 Madera Irrigation District Water Bank Facility X X
77 Madera Canal/Hidden Dam Pump Storage Project X X
78 Madera Lake Regulating and Recharge Project X X
79 Ave 16/Road 20 Regulating and Recharge Basin X X X X X
80 Berenda Canal Regulating and Recharge Basin X X X X X
81 San Joaquin River Invasive Species Management X X
82 Upper San Joaquin Sediment Study X X X
84 Wastewater Treatment Plant Flood Levee in City of Mendota
X X X X
85 Mendota Pool Park Flood Protection X X
86 Siphon Extension near Chamberlain Road X
83A Municipal Well Relocation/ Floodproofing in City of Mendota
X X
83B Municipal Well Relocation/ Floodproofing in City of Mendota
X X
Upper San Joaquin River Regional Flood Management Plan 7-15

REGIONAL FINANCE PLAN
This page intentionally left blank.
7-16 Upper San Joaquin River Regional Flood Management Plan

REGIONAL FINANCE PLAN
Table 7-6. System Improvements Matched with Environmental Stewardship Funding Sources
# System Improvement
Tier
Environmental Stewardship Funding Sources
Federal State
NRC
S –
Agric
ultu
ral C
onse
rvat
ion
Ea
sem
ent P
rogr
am
NRC
S - F
lood
plai
n Ea
sem
ent
Prog
ram
NRC
S - E
QIP
USF
WS
- NAW
CA
NPS
- La
nd a
nd W
ater
Co
nser
vatio
n Fu
nd
USF
WS
- Ana
drom
ous F
ish
Pro
gram
s
USF
WS
- ESA
Sec
tion
6
Gra
nt P
rogr
am
CSP
- Hab
itat C
onse
rvat
ion
Fund
WCB
- Ca
lifor
nia
WCB
Pro
gram
s
CNRA
- Ca
lifor
nia
Rive
r Par
kway
s Pr
ogra
m
CNRA
- U
rban
Gre
enin
g Pr
ojec
ts/
Plan
ning
SWRC
B - 3
19(h
) Non
poin
t Sou
rce
Gra
nt P
rogr
am
0 Bear Creek Diversion Structure 1 X X X X X X X
2 Levee Breaches Unit 1, LM 9.90; Unit 5, LM 0.25 1 X X X X X X X X X
3 Raise Part of Left Bank Levee Unit 6 1 X X X X X X X X X
4 Modernize Electrical Controls, Level Sensors, and SCADA for Control Structures
1
5 Enlarge Chowchilla Canal Bypass Control Structure
1 X X X X X X X
5A Rehabilitation of San Joaquin River Control Structure
1 X X X X
6 Sediment Removal Chowchilla Canal Bypass Control Structure
1 X
7 Levee Improvements in Subsidence Area 1 X
8 Sediment Removal in the Eastside Bypass
13 Bridge Enlargement over Eastside Bypass at Sandy Mush Road
1 X
14 Install New Gaging Stations 1 X
12 Great Valley Grasslands State Park Levee Deauthorization
1 X X
15 Western Madera County Subsidence Solution 1
19 Fresno Slough South Levee Repair
22 Bear Creek Diversion Channel Feasibility Study 1 X
23 Le Grand/Planada Flood Control/Conjunctive Use Expansion Study
1
24 Le Grand Canal Flood Control Structure at Black Rascal Creek
1
25 Bear Reservoir Enlargement, and Downstream Levee and Channel Improvements
1 X
26 Mariposa Reservoir Enlargement, and Downstream Levee and Channel Improvements
X
27 Owens Reservoir Enlargement, and Downstream Levee and Channel Improvements
1 X
28 Burns Reservoir Enlargement, and Downstream Levee and Channel Improvement
1 X
31 Black Rascal Creek Flood Control Project 1 X
44 San Joaquin River Levee at Firebaugh Wastewater Treatment Plant
1 X X X X X
45 San Joaquin River Bank Stabilization at Firebaugh 1 X X
46 San Joaquin River Levee at Firebaugh Rodeo Grounds
1 X X
9 Sand Slough Control Structure Removal X X X X X X X 10 Gravelly Ford Madera Ranch Recharge Project X X X X X X X X X 11 Flooding Existing Pasture Lands X X X X X X X X X 16 Los Banos Creek Conjunctive Use Project 17 Re-regulation of Kings River flood flows (and X X X X X X X
Upper San Joaquin River Regional Flood Management Plan 7-17

REGIONAL FINANCE PLAN
Table 7-6. System Improvements Matched with Environmental Stewardship Funding Sources
# System Improvement
Tier
Environmental Stewardship Funding Sources
Federal State
NRC
S –
Agric
ultu
ral C
onse
rvat
ion
Ea
sem
ent P
rogr
am
NRC
S - F
lood
plai
n Ea
sem
ent
Prog
ram
NRC
S - E
QIP
USF
WS
- NAW
CA
NPS
- La
nd a
nd W
ater
Co
nser
vatio
n Fu
nd
USF
WS
- Ana
drom
ous F
ish
Pro
gram
s
USF
WS
- ESA
Sec
tion
6
Gra
nt P
rogr
am
CSP
- Hab
itat C
onse
rvat
ion
Fund
WCB
- Ca
lifor
nia
WCB
Pro
gram
s
CNRA
- Ca
lifor
nia
Rive
r Par
kway
s Pr
ogra
m
CNRA
- U
rban
Gre
enin
g Pr
ojec
ts/
Plan
ning
SWRC
B - 3
19(h
) Non
poin
t Sou
rce
Gra
nt P
rogr
am
possible San Joaquin River flood flows) through CCID and DMC facilities for storage in San Luis and Los Banos reservoirs
18 Westside Surface Storage Reservoir Project X X X X 20 Fresno Slough Sediment Removal X 21 Fresno Slough Floodplain Enhancement X 29 Merced Region Programmatic Environmental
Impact Report for Streambed and Vegetation Control
30 Merced County Flood Control District X 32 Construct Ring Levees around Flood-Prone Areas X 33 Channel Dredging and/or Vegetation Removal X X 34 Construct Levees or Channel Widening Projects
along Creeks/Streams in the Region
35 Divert Flood Flows to Agricultural Lands 36 Ecosystem Restoration along Waterways X 37 Modify Land Use Designations 38 Develop Emergency Response Plans 39 Increase Public Awareness of Flooding X 40 Monitor Creek Water Quality and Storm Drainage
Discharges X
41 Update Stormwater Design Standards for the City and Region
X
42 Windmill Ditch Drainage X 43 McCullough Road Drainage Project X 47 Three Rivers Ranch Study X X X X X 48 Cinnamon Slough Study (Merced NWR) X X 49 Sunrise Ranch Study X X 60 Modify water intake structures at selected NWR
units X
61 San Luis NWR East Bear Creek Unit – Install lift pumps to divert water onto 1000 acres of wetland basins during flood flows
X
62 San Luis NWR East Bear Creek Unit – Restore a wetland swale to divert floodwaters onto 1,000 acres of wetland basins during flood flows
X
63 San Luis NWR East Bear Creek Unit – Enhance existing wetland depth and configuration to provide additional habitat and floodwater storage on approximately 500 acres of wetland basins
X
64 San Luis NWR Freitas Unit – restore anabranches of Salt Slough
X
65 San Luis NWR West Bear Creek Unit X 66 Merced NWR Merced Unit – Enhance
infrastructure to divert flood flows onto 1,200 acres of existing wetlands and other NWR lands
X
7-18 Upper San Joaquin River Regional Flood Management Plan

REGIONAL FINANCE PLAN
Table 7-6. System Improvements Matched with Environmental Stewardship Funding Sources
# System Improvement
Tier
Environmental Stewardship Funding Sources
Federal State
NRC
S –
Agric
ultu
ral C
onse
rvat
ion
Ea
sem
ent P
rogr
am
NRC
S - F
lood
plai
n Ea
sem
ent
Prog
ram
NRC
S - E
QIP
USF
WS
- NAW
CA
NPS
- La
nd a
nd W
ater
Co
nser
vatio
n Fu
nd
USF
WS
- Ana
drom
ous F
ish
Pro
gram
s
USF
WS
- ESA
Sec
tion
6
Gra
nt P
rogr
am
CSP
- Hab
itat C
onse
rvat
ion
Fund
WCB
- Ca
lifor
nia
WCB
Pro
gram
s
CNRA
- Ca
lifor
nia
Rive
r Par
kway
s Pr
ogra
m
CNRA
- U
rban
Gre
enin
g Pr
ojec
ts/
Plan
ning
SWRC
B - 3
19(h
) Non
poin
t Sou
rce
Gra
nt P
rogr
am
67 Merced NWR – Modify water intake structures at selected NWR units
X
68 Merced NWR Sno-Bird Unit – Construct diversions off Eastside Canal
X
69 Ash Slough Arundo and Channel Cleaning 70 Berenda Slough Arundo and Channel Clearing 71 Erosion Repair Project 72 Levee Patrol Road Repair 73 Berenda Creek Arundo Removal and Channel
Clearing
74 Dry Creek Arundo Removal and Channel Clearing 75 Cottonwood Creek Arundo Removal and
Channel Clearing
76 Madera Irrigation District Water Bank Facility 77 Madera Canal/Hidden Dam Pump Storage
Project
78 Madera Lake Regulating and Recharge Project 79 Ave 16/Road 20 Regulating and Recharge Basin 80 Berenda Canal Regulating and Recharge Basin 81 San Joaquin River Invasive Species Management X X X 82 Upper San Joaquin Sediment Study 84 Wastewater Treatment Plant Flood Levee in City
of Mendota
85 Mendota Pool Park Flood Protection 86 Siphon Extension near Chamberlain Road 83A Municipal Well Relocation/Floodproofing in City
of Mendota
83B Municipal Well Relocation/Floodproofing in City of Mendota
Notes: EQIP = Environmental Quality Incentives Program NAWCA = North American Wetlands Conservation Act
Upper San Joaquin River Regional Flood Management Plan 7-19

REGIONAL FINANCE PLAN
This page intentionally left blank.
7-20 Upper San Joaquin River Regional Flood Management Plan

REGIONAL FINANCE PLAN
Table 7-7. Detailed Public Safety Funding Source Descriptions
Public Safety Funding Sources
Programs Scope
Goals Elements Grant Size
Publ
ic S
afet
y
Envi
ronm
enta
l
Econ
omic
Regi
onal
Issu
es
Stud
y
Land
Acq
uisi
tion
Des
ign
Cons
truc
tion
Mat
eria
l Acq
uisi
tion
Recr
eatio
n
Low
er B
ound
Upp
er B
ound
Contact
FEMA – Flood Mitigation Assistance
This program provides funds for projects to reduce or eliminate risk of flood damage to buildings that are insured under the NFIP on an annual basis.
X
X X X X X
- $89,000,000 http://www.fema.gov/flood-mitigation-assistance-program
FEMA – Pre-Disaster Mitigation
The Pre-Disaster Mitigation program provides funds for hazard mitigation planning and projects on an annual basis. The Pre-Disaster Mitigation program was set in place to reduce overall risk to people and structures, while at the same time reducing reliance on Federal funding if an actual disaster were to occur.
X
X X X X X
- $3,000,000 http://www.fema.gov/pre-disaster-mitigation-grant-program
USACE – Projects and Studies Funding
Cost share with USACE on SPFC USACE projects X
X X X
- - -
Reclamation – WaterSMART Grants
This program provides funds for projects that seek to improve water efficiency, protect endangered and threatened species, address climate related impacts.
X X X X X X X X X X
- $1,500,000 http://www.usbr.gov/waterSMART
USDA – Emergency Water Grants
The Emergency Community Water Assistance Grants provide money to rural communities that have experienced a significant decline in water quantity or quality.
X X X X
X X X
$150,000 $500,000 http://www.rurdev.usda.gov/UWP-ecwag.htm
DWR – Flood Control Subventions
This program provides a cost share with locals toward capital cost of non-SPFC USACE project construction (acquisition of land, easement, right-of-way, relocation, and disposal).
X
X X
- - http://www.water.ca.gov/floodmgmt/fpo/sgb/fcs/
Upper San Joaquin River Regional Flood Management Plan 7-21

REGIONAL FINANCE PLAN
Table 7-7. Detailed Public Safety Funding Source Descriptions
Public Safety Funding Sources
Programs Scope
Goals Elements Grant Size
Publ
ic S
afet
y
Envi
ronm
enta
l
Econ
omic
Regi
onal
Issu
es
Stud
y
Land
Acq
uisi
tion
Des
ign
Cons
truc
tion
Mat
eria
l Acq
uisi
tion
Recr
eatio
n
Low
er B
ound
Upp
er B
ound
Contact
DWR – Flood Corridor Program
Funding under this program is intended to be used for acquisition, restoration, enhancement, and protection of real property while preserving sustainable agriculture and enhancing wildlife habitat in and near flood corridors throughout the State.
X X
X X X
- $5,000,000 http://www.water.ca.gov/floodmgmt/fpo/sgb/fpcp/
DWR – Local Levee Assistance
The Local Levee Assistance Program provides funding for projects to immediately repair and improve critically damaged local levees, evaluate levee stability, and levee seepage and underseepage, and to perform design or alternatives analysis. Local levees are not part of the SPFC for the Central Valley and are not located within the Sacramento-San Joaquin Delta.
X
X
X X
$2,000,000 $5,000,000 http://www.water.ca.gov/floodmgmt/fpo/sgb/llap/
DWR – Small Community Grants
This program seeks to repair small community levees to 100-year level of protection. X
X
X X
$2,000,000 $5,000,000 http://rfmpcc.com/wordpress/wp-content/uploads/2013/06/Contacts_FloodSAFEImplementationPrograms_6.20.13.pdf
7-22 Upper San Joaquin River Regional Flood Management Plan

REGIONAL FINANCE PLAN
Table 7-7. Detailed Public Safety Funding Source Descriptions
Public Safety Funding Sources
Programs Scope
Goals Elements Grant Size
Publ
ic S
afet
y
Envi
ronm
enta
l
Econ
omic
Regi
onal
Issu
es
Stud
y
Land
Acq
uisi
tion
Des
ign
Cons
truc
tion
Mat
eria
l Acq
uisi
tion
Recr
eatio
n
Low
er B
ound
Upp
er B
ound
Contact
DWR – Urban Flood Risk Reduction
This program will assist Urban Local Agencies to plan, design, and construct flood risk reduction projects. The projects must rehabilitate, reconstruct, replace, or improve facilities to the SPFC in ways that improve flood protection. Projects may include feasibility studies, design projects, or construction projects.
X
X X X X
- $200,000,000 http://www.water.ca.gov/floodmgmt/fpo/guidelines/
DWR – Flood System Repair Project
This program supports SIs that evaluate feasibility, design, and construct repairs of non-urban SPFC facility (e.g., levees, channels, structures) deficiencies.
X
X X
- $5,000,000 http://www.water.ca.gov/floodmgmt/fmo/fsrp/
DWR – Statewide Flood Emergency Response Grants
To further participation of reservoir operators (affecting CV) in the program for Forecast-Coordinated Operations, especially in obtaining necessary decision support system tools/ and field measuring equipment. Provide support for local EAPs, and fund communications equipment to further interoperability.
X
X X X X X X
- $6,000,000 http://www.water.ca.gov/floodmgmt/hafoo/fob/floodER/
DWR – IRWM Grants Flood risk reduction, protection of water quality and the environment X X
X X
- $57,000,000 http://www.water.ca.gov/IRWMP/grants/docs/Guidelines/P84_IRWMP_GL_Drought2014_PublicReviewDraft.pdf
Note: - = 0 dollars
Upper San Joaquin River Regional Flood Management Plan 7-23

REGIONAL FINANCE PLAN
This page intentionally left blank.
7-24 Upper San Joaquin River Regional Flood Management Plan

REGIONAL FINANCE PLAN
Table 7-8. Detailed Environmental Funding Source Descriptions
Environmental Stewardship Funding Sources
Federal Programs Scope
Goals Elements Grant Size
Publ
ic S
afet
y
Envi
ronm
enta
l
Econ
omic
Regi
onal
Issu
es
Stud
y
Land
Acq
uisit
ion
Desig
n
Cons
truc
tion
Mat
eria
l Acq
uisit
ion
Recr
eatio
n
Low
er B
ound
Upp
er B
ound
Contact NRCS – Agricultural Conservation Easement Program
This program provides financial and technical assistance to help conserve agricultural lands and wetlands and their related benefits
X
X
X
$10,000 $5,000,000 http://www.nrcs.usda.gov/wps/portal/nrcs/detail/national/programs/easements/acep/?cid=stelprdb1242695
NRCS – Floodplain Easement Program
Floodplain easements restore, protect, maintain, and enhance the functions of floodplains while conserving their natural values such as fish and wildlife habitat, water quality, floodwater retention, and ground water recharge. Structures, including buildings, within the floodplain easement must be demolished and removed, or relocated outside the 100-year floodplain or dam breach inundation area.
X
X X X X X
$10,000 $5,000,000 http://www.nrcs.usda.gov/wps/portal/nrcs/detail/national/programs/financial/ewp/?cid=nrcs143_008225
NRCS – Environmental Quality Incentives Program
EQIP provides financial and technical assistance to agricultural producers in order to address natural resource concerns and deliver environmental benefits such as improved water and air quality, conserved ground and surface water, reduced soil erosion and sedimentation, or improved or created wildlife habitat.
X
X X X
$10,000 $5,000,000 http://www.nrcs.usda.gov/wps/portal/nrcs/main/national/programs/financial/eqip/
Upper San Joaquin River Regional Flood Management Plan 7-25

REGIONAL FINANCE PLAN
Table 7-8. Detailed Environmental Funding Source Descriptions
Environmental Stewardship Funding Sources
Federal Programs Scope
Goals Elements Grant Size
Publ
ic S
afet
y
Envi
ronm
enta
l
Econ
omic
Regi
onal
Issu
es
Stud
y
Land
Acq
uisit
ion
Desig
n
Cons
truc
tion
Mat
eria
l Acq
uisit
ion
Recr
eatio
n
Low
er B
ound
Upp
er B
ound
Contact USFWS – Anadromous Fish Restoration Program
This programs goal is to expand the accessible range of habitat and improve the quality of fish habitat in an effort to restore natural stocks of anadromous fish.
X
X
X X X
X
$10,000 $2,000,000 http://www.fws.gov/stockton/afrp/overview.cfm#overview
USFWS – ESA Section 6 Grants Program
This programs goal is to work cooperatively with landowners, communities, and tribes to foster voluntary stewardship efforts on private lands for the recovery of endangered species.
X
X X X
$10,000 $1,000,000 http://www.fws.gov/endangered/grants/
USFWS – North American Wetlands Conservation Act of 1989
This program provides matching grants to organizations and individuals who have developed partnerships to carry out wetlands conservation projects in the United States, Canada, and Mexico for the benefit of wetlands-associated migratory birds and other wildlife.
X
X X X X X X
$10,000 $5,000,000 http://www.fws.gov/birdhabitat/Grants/NAWCA/index.shtm
NPS – Land and Water Conservation Fund
This program provides matching grants to States and local governments for the acquisition and development of public outdoor recreation areas and facilities (as well as funding for conservation strategies).
X
X X X X X X
$50,000 $5,000,000 http://www.nps.gov/lwcf/
7-26 Upper San Joaquin River Regional Flood Management Plan

REGIONAL FINANCE PLAN
Table 7-8. Detailed Environmental Funding Source Descriptions
Environmental Stewardship Funding Sources
Federal Programs Scope
Goals Elements Grant Size
Publ
ic S
afet
y
Envi
ronm
enta
l
Econ
omic
Regi
onal
Issu
es
Stud
y
Land
Acq
uisit
ion
Desig
n
Cons
truc
tion
Mat
eria
l Acq
uisit
ion
Recr
eatio
n
Low
er B
ound
Upp
er B
ound
Contact CVPIA – Habitat Restoration Program and Conservation Program
These two programs seek projects that protect and restore native habitats, and stabilizing and improving populations of native species in California’s Central Valley.
X
X X X X
$10,000 $5,000,000 http://www.usbr.gov/mp/cvpcp/
Reclamation – Bay-Delta Restoration Water Use Efficiency
This program seeks programs that improve water use efficiency and reduce the demand for Bay-Delta water to result in significant benefits to water quality, water supply reliability, and in stream flows.
X X X X X X X X X X
$1,500,000 http://www.usbr.gov/mp/watershare/grants/index.html
CSP – Habitat Conservation Fund
This program seeks to protect and restore sensitive habitats in California. Habitat improvement categories include Wetlands, Anadromous Salmonids and Trout Habitat, Riparian Habitat, and wildlife area activities.
X
X X X X
$50,000 $1,000,000 http://www.parks.ca.gov/?page_id=21361
WCB – California WCB Programs
The primary responsibilities of WCB are to select, authorize and allocate funds for the purchase of land and waters suitable for recreation purposes and the preservation, protection and restoration of wildlife habitat.
X
X X X X
$10,000 $1,000,000 http://rlch.org/funding/california-riparian-habitat-conservation-program http://www.privatelandownernetwork.org/yellowpages/resource.aspx?id=14402 https://www.wcb.ca.gov/Programs/Riparian.aspx
Upper San Joaquin River Regional Flood Management Plan 7-27

REGIONAL FINANCE PLAN
Table 7-8. Detailed Environmental Funding Source Descriptions
Environmental Stewardship Funding Sources
Federal Programs Scope
Goals Elements Grant Size
Publ
ic S
afet
y
Envi
ronm
enta
l
Econ
omic
Regi
onal
Issu
es
Stud
y
Land
Acq
uisit
ion
Desig
n
Cons
truc
tion
Mat
eria
l Acq
uisit
ion
Recr
eatio
n
Low
er B
ound
Upp
er B
ound
Contact CNRA – California River Parkways Program
Eligible SIs must promote recreation and one other condition: land conversion, enhancement, provide habitat, or flood management.
X X X X X X X X X X
http://bondaccountability.resources.ca.gov/plevel1.aspx?id=22&pid4 http://resources.ca.gov/bonds_prop50riverparkway.htL
CNRA – Urban Greening Projects/Planning
This program grants funds for urban greening plans and projects in urban areas that provide multiple benefits, including a decrease in air and water pollution, a reduction in the consumption of natural resources and energy, an increase in the reliability of local water supplies, or an increased adaptability to climate change.
X
X X X
$10,000 $200,000 http://resources.ca.gov/bond/Urban_Greening_PROJECT_Guidelines_October_2012.pdf http://resources.ca.gov/bond/Urban_Greening_PLANNING_Guidelines_October_2012.pdf
DWR – Urban Streams Restoration Program
Projects funded must be designed for a creek, stream, or river that crosses residential, commercial, or industrial property, or that will cross land in the near future. Outcomes must include protection, restoration, or enhancing of ecosystems, and provide flood control benefits.
X X
X X X
$250,000 http://resources.ca.gov/grant_programs.html
SWRCB – 319(h) Nonpoint Source Grant Program
Projects to control nonpoint source pollution
X X X X X X X X
$300,000 www.water.ca.gov/drainage
7-28 Upper San Joaquin River Regional Flood Management Plan

REGIONAL FINANCE PLAN
Three hypothetical funding scenarios were developed to demonstrate the range of potential cost shares for Federal, State, and local agencies. These scenarios are intended for planning purposes only. The three scenarios include Continuation of Past Practices, Decreased Federal Funding, and Increased Local Participation. The Continuation of Past Practices scenario assumes a near equal cost-share between State and Federal sources with some local funding. The Decreased Federal Funding scenario reflects how much the State and locals would have to cover if the Federal sources were not available. The Increased Local Participation scenario shows how much local agencies would be responsible for with little to no Federal or State assistance.
These scenarios are intended for demonstration purposes only, and it is recognized that the implementing agencies in the region do not have the ability to fund the large estimated cost for the local share. Given the current financial conditions of the local agencies, local cost shares will need to come from in-kind services and other mechanisms other than tapping into general funds and taking on additional debt.
The highest local contribution scenario, Increase Local Participation, demonstrates the “worst-case” scenario. This scenario assumes Federal and State budgets are so limited that they can provide only the lowest cost share defined in their funding sources. The uncertainty in Federal and State budgets is emphasized in this scenario, despite the inability for local agencies to meet obligations. The Decreased Federal Funding scenario assumes a future condition where the Federal government or Federal budget for public safety has downsized. The State obligation in this scenario may be infeasible, but it allows the State to understand what its “worst-case” obligations could be. The Continuation of Past Practices scenario is based on historical experiences in the State of California.
The cost-share scenarios that rely on local agencies to contribute a larger share provide an upper-bound of cost-share potential for use in planning. One outcome of this information is to engage the conversation of implementation priorities. If a high local cost-share scenario were to become a reality, only certain very limited SIs could be implemented with the more limited budget. An additional outcome is to use this information to further promote cost-reducing collaboration of local agencies and combining SIs to create multibenefit projects. The value of expanding the scope of SIs and grouping multiple improvements can be measured by the resulting change in local cost-share obligations.
Table 7-9 shows the non-urban Tier 1 SI costs grouped by implementing agency. Table 7-10 shows the urban Tier 1 SI costs grouped by implementing agency. USJR Tier 1 SIs classified as urban provide benefit to the City of Merced, or are located near other urban areas. These SIs are more expensive, protect greater populations, and therefore, are contained in a separate table (Table 7-10). The USJR Tier 1 SIs classified as rural are generally located where population density is low and are lower-cost smaller SIs that together provide a great benefit. The tables provide the list of proposed SIs, estimated costs, and the implementing agency’s estimated potential share beyond Federal and State funding. The three columns on the right of the table show the range of potential cost share. The range of values is based upon the assumption that only one or two grants are awarded by the State or Federal agencies to be conservative. In reality, there may be opportunities to receive assistance from more than two Federal or State sources, which would lower the local implementing agency obligation.
Upper San Joaquin River Regional Flood Management Plan 7-29

REGIONAL FINANCE PLAN
Table 7-9. Tier 1 Non-Urban System Improvement Funding Information
# Tier 1 System Improvements
Cost Share Scenarios
Federal Contribution
State Contribution
Agency Contribution
Lower San Joaquin Levee District 1 Bear Creek Diversion Structure
System Improvement Cost: $260,000 Past Practices Public Safety
FEMA: $234,000 Public Safety DWR: $26,000
$0
Decreased Federal Funding
Environmental USFWS: $10,000
Public Safety DWR: $234,000
$16,000
Increased Local Participation
Public Safety DWR: $220,000 Environmental WCB: $10,000
$30,000
Local Contribution Range $0-$30,000 2 Levee Breaches Unit 1, LM 9.90; Unit 5,
LM 0.25 System Improvement Cost: $535,000
Past Practices Public Safety FEMA: $401,250
Public Safety DWR: $133,750
$0
Decreased Federal Funding
Environmental USFWS: $10,000
Public Safety DWR: $481,500
$43,500
Increased Local Participation
Public Safety DWR: $465,000 Environmental WCB: $10,000
$60,000
Local Contribution Range $0-$60,000 3 Raise Part of Left Bank Levee Unit 6,
System Improvement Cost: $4,250,000 Past Practices Public Safety
FEMA: $3,000,000 Public Safety DWR: $1,250,000
$0
Decreased Federal Funding
Public Safety DWR: $3,825,000
$425,000
Increased Local Participation
Public Safety DWR: $3,400,000 Environmental SWRCB: $300,000
$550,000
Local Contribution Range $0-$550,000 4 Modernize Electrical Controls, Level Sensors
and SCADA for Control Structures, System Improvement Cost: $1,885,000 (currently being considered for funding under the DWR FSRP program)
Past Practices Public Safety FEMA: $1,696,500
Public Safety DWR: $188,500
$0
Decreased Federal Funding
Public Safety DWR: $1,696,500
$188,500
Increased Local Participation
Public Safety DWR: $1,635,000
$250,000
Local Contribution Range $0-$250,000 5 Enlarge Chowchilla Canal Bypass Control
Structure, System Improvement Cost: $3,380,000
Past Practices Public Safety FEMA: $3,000,000
Public Safety DWR: $380,000
$0
Decreased Federal Funding
Environmental NRCS: $45,000
Public Safety DWR: $2,535,000
$800,000
Increased Local Participation
Public Safety DWR: $2,380,000
$1,000,000
Local Contribution Range $0-$1,000,000
7-30 Upper San Joaquin River Regional Flood Management Plan

REGIONAL FINANCE PLAN
Table 7-9. Tier 1 Non-Urban System Improvement Funding Information
# Tier 1 System Improvements
Cost Share Scenarios
Federal Contribution
State Contribution
Agency Contribution
5A Rehabilitation of San Joaquin River Control Structure, System Improvement Cost: $340,000
Past Practices Public Safety FEMA: $170,000
Public Safety DWR: $170,000
$0
Decreased Federal Funding
Public Safety DWR: $306,000
$34,000
Increased Local Participation
Public Safety DWR: $240,000 Environmental CSP:$50,000
$50,000
Local Contribution Range $0-$50,000 6 Sediment Removal Chowchilla Canal Bypass
Control Structure, System Improvement Cost: $175,000
Past Practices Public Safety FEMA: $175,000
$0
Decreased Federal Funding
Public Safety DWR: $175,000
$0
Increased Local Participation
Public Safety DWR: $234,000
$17,500
Local Contribution Range $0-$17,500 8 Sediment Removal in the Eastside Bypass,
System Improvement Cost: $12,850,000 Past Practices Public Safety
FEMA: 3,000,000 Public Safety DWR: $9,850,000
$0
Decreased Federal Funding
Public Safety FEMA: 2,000,000
Public Safety DWR: $10,850,000
$0
Increased Local Participation
Public Safety DWR: $9,850,000
$1,000,000
Local Contribution Range $0-$1,000,000 13 Bridge Enlargement over Eastside Bypass at
Sandy Mush Road, System Improvement Cost: $1,610,000
Past Practices Public Safety FEMA: $1,460,000 USDA: $150,000
$0
Decreased Federal Funding
Public Safety USDA: $145,000
Public Safety DWR: $1,460,000
$5,000
Increased Local Participation
Public Safety DWR: $1,465,000
$10,000
Local Contribution Range $0-$10,000 14 New Gaging Stations,
System Improvement Cost: $330,000 Past Practices Public Safety
FEMA: $297,000
Public Safety DWR: $33,000
$0
Decreased Federal Funding
Public Safety FEMA: $247,500
Public Safety DWR: $50,000
$32,500
Increased Local Participation
$330,000
Local Contribution Range $0-$330,000 17 Update San Joaquin River Flood Control
Project Operations and Maintenance Manual, System Improvement Cost: $500,000
Past Practices Public Safety FEMA: $250,000
Public Safety DWR: $250,000
$0
Decreased Federal Funding
Public Safety DWR: $500,000
$0
Increased Local Participation
Public Safety DWR: $450,000
$50,000
Local Contribution Range $0-$50,000
Upper San Joaquin River Regional Flood Management Plan 7-31

REGIONAL FINANCE PLAN
Table 7-9. Tier 1 Non-Urban System Improvement Funding Information
# Tier 1 System Improvements
Cost Share Scenarios
Federal Contribution
State Contribution
Agency Contribution
21 Upper San Joaquin Sediment Study, System Improvement Cost: $100,000
Past Practices Public Safety FEMA: $50,000
Public Safety DWR: $50,000
$0
Decreased Federal Funding
Public Safety DWR: $100,000
$0
Increased Local Participation
Public Safety DWR: $90,000
$10,000
Local Contribution Range $0-$10,000 Total Lower San Joaquin Levee District System Improvements: 12
Total Lower San Joaquin Levee District Costs: $26,215,000 Total Obligations $0- $3,357,500
Great Valley Grasslands State Park 12 Great Valley Grasslands State Park Levee
Deauthorization, System Improvement Cost: $4,930,000
Past Practices Public Safety FEMA: $3,000,000
Public Safety DWR: $1,930,000
$0
Decreased Federal Funding
Environmental NPS: $50,000
Public Safety DWR: $434,000 Environmental CNRA: $4,437,000
$43,000
Increased Local Participation
Public Safety DWR: $434,000 Environmental CNRA: $4,437,000
$143,000
Local Contribution Range $0-$143,000 Total Great Valley Grasslands State Park System Improvements:
Total Great Valley Grasslands State Park Costs: $4,930,000 Total Obligations $0-$143,000
Red Top and Washington Avenue Area Growers 15 Western Madera County Subsidence
Solution, System Improvement Cost: $19,600,000
Past Practices Public Safety USDA: $3,000,000
Public Safety DWR: $16,000,000 $600,000
Decreased Federal Funding
Public Safety USDA: $2,000,000
Public Safety DWR: $17,000,000
$600,000 Increased Local Participation
Public Safety DWR: $17,000,000 $2,600,000
Local Contribution Range $600,000-$2,600,000 Total Red Top and Washington Avenue Area Growers System Improvements: 1
Total Central California Irrigation District Costs: $19,600,000 Total Obligations $600,000-$2,600,000
Fresno Slough Improvement Group 19 Fresno Slough South Levee Repair,
System Improvement Cost: $1,340,000 Past Practices Environmental
NRCS: $114,000 Public Safety DWR: $1,226,000
$0
Decreased Federal Funding
Environmental NRCS: $10,000
Public Safety DWR: $770,000
$560,000
Increased Local Participation
Public Safety DWR: $700,000
$640,000
Local Contribution Range $0-$640,000 Total Fresno Slough Improvement Group System Improvements: 1
Total Fresno Slough Improvement Group Costs: $1,340,000 Total Obligations $0-$640,000
7-32 Upper San Joaquin River Regional Flood Management Plan

REGIONAL FINANCE PLAN
Table 7-9. Tier 1 Non-Urban System Improvement Funding Information
# Tier 1 System Improvements
Cost Share Scenarios
Federal Contribution
State Contribution
Agency Contribution
Merced ID 23 Le Grand/Planada Flood
Control/Conjunctive Use Expansion Study, System Improvement Cost: $240,000
Past Practices Public Safety FEMA: $240,000
$0
Decreased Federal Funding
Public Safety DWR: $180,000
$60,000
Increased Local Participation
Public Safety DWR: $150,000
$90,000
Local Contribution Range $0-$90,000 24 Le Grand Canal Flood Control Structure at
Black Rascal Creek, System Improvement Cost: $490,000
Past Practices Public Safety FEMA: $367,500
Public Safety DWR: $112,500
$0
Decreased Federal Funding
Environmental NRCS: $10,000
Public Safety DWR: $441,000
$39,000
Increased Local Participation
Environmental NRCS: $10,000
Public Safety DWR: $420,000 Environmental NRCS: $10,000
$50,000
Local Contribution Range $0-$50,000 Total Merced ID System Improvements: 1
Total Merced ID Costs: $730,000 Total Obligations $0-$140,000
City of Firebaugh 44 San Joaquin River Levee at Firebaugh Waste
Water Treatment Plant, System Improvement Cost: $1,280,000
Past Practices Environmental USFWS: $640,000
Public Safety DWR: $640,000
$0
Decreased Federal Funding
Environmental USFWS: $320,000
Public Safety DWR: $640,000
$320,000
Increased Local Participation
Environmental USFWS: $320,000
Public Safety DWR: $560,000 Environmental CSP:$40,000
$400,000
Local Contribution Range $0-$400,000 45 San Joaquin River Bank Stabilization at
Firebaugh, System Improvement Cost: $1,800,000
Past Practices Public Safety FEMA: $1,550,000
Environmental DWR:$250,000
$0
Decreased Federal Funding
Public Safety FEMA: $1,000,000 Public Safety USDA: $500,000
Environmental DWR:$250,000
$50,000
Increased Local Participation
Public Safety FEMA: $900,000 Public Safety USDA: $500,000
Environmental DWR:$250,000
$150,000
Local Contribution Range $0-$150,000
Upper San Joaquin River Regional Flood Management Plan 7-33

REGIONAL FINANCE PLAN
Table 7-9. Tier 1 Non-Urban System Improvement Funding Information
# Tier 1 System Improvements
Cost Share Scenarios
Federal Contribution
State Contribution
Agency Contribution
46 San Joaquin River Levee at Firebaugh Rodeo Grounds, System Improvement Cost: $1,450,000
Past Practices Public Safety FEMA: $565,000 Environmental USFWS: $320,000
Public Safety DWR: $565,000
$0
Decreased Federal Funding
Environmental USFWS: $10,000
Public Safety DWR: $1,305,000
$135,000
Increased Local Participation
Environmental USFWS: $10,000
Public Safety DWR: $1,005,000
$435,000
Local Contribution Range $0-$435,000 Total City of Firebaugh System Improvements: 3
Total City of Firebaugh Costs: $4,530,000 Total Obligations $0-$985,000
7-34 Upper San Joaquin River Regional Flood Management Plan

REGIONAL FINANCE PLAN
Table 7-10. Tier 1 Urban System Improvements Funding Information
#
System Improvements Cost Share Scenarios
Federal Contribution
State Contribution
Agency Contribution
Merced Streams Group 22 Bear Creek Diversion Channel Feasibility
Study, System Improvement Cost: $100,000
Past Practices Public Safety FEMA: $100,000
$0
Decreased Federal Funding
Public Safety DWR: $75,000 $25,000
Increased Local Participation
$100,000
Local Contribution Range $0 to $100,000 25 Bear Reservoir Enlargement and
Downstream Levee and Channel Improvements, System Improvement Cost: $202,940,000
Past Practices Public Safety FEMA: $96,470,000
Public Safety DWR: $5,000,000 Environmental CNRA: $101,470,000 $0
Decreased Federal Funding
Public Safety USDA: $500,000
Public Safety DWR: $5,000,000 Environmental CNRA: $182,646,000 $14,794,000
Increased Local Participation
Public Safety DWR: $2,000,000 $200,940,000
Local Contribution Range $0 to $200,940,000 26 Mariposa Reservoir Enlargement and
Downstream Levee and Channel Improvements, System Improvement Cost: $112,500,000
Past Practices Public Safety FEMA: $51,250,000
Public Safety DWR: $5,000,000 Environmental CNRA: $56,250,000 $0
Decreased Federal Funding
Public Safety USDA: $500,000
Public Safety DWR: $5,000,000 Environmental CNRA: $101,250,000 $5,750,000
Increased Local Participation
Public Safety DWR: $2,000,000 $110,500,000
Local Contribution Range $5,750,000 to $110,500,000 27 Owens Reservoir Enlargement and
Downstream Levee and Channel Improvements, System Improvement Cost: $8,850,000
Past Practices Public Safety FEMA: $3,000,000
Public Safety DWR: $5,000,000 Environmental CNRA: $850,000 $0
Decreased Federal Funding
Public Safety USDA: $500,000
Public Safety DWR: $5,000,000 Environmental CNRA: $3,350,000 $0
Increased Local Participation
Public Safety DWR: $2,000,000 $6,850,000
Local Contribution Range $0 to $6,850,000
Upper San Joaquin River Regional Flood Management Plan 7-35

REGIONAL FINANCE PLAN
Table 7-10. Tier 1 Urban System Improvements Funding Information
#
System Improvements Cost Share Scenarios
Federal Contribution
State Contribution
Agency Contribution
28 Burns Reservoir Enlargement and Downstream Levee and Channel Improvement, System Improvement Cost: $39,180,000
Past Practices Public Safety FEMA: $3,000,000
Public Safety DWR: $5,000,000 $31,180,000
Decreased Federal Funding
Public Safety USDA: $500,000
Public Safety DWR: $5,000,000 $33,680,000
Increased Local Participation
Public Safety DWR: $2,000,000 $37,180,000
Local Contribution Range $30,330,000 to $37,180,000 Total Merced Streams Group System Improvements: 5
Total Merced Streams Group Costs: $363,570,000 Total Obligations $31,180,000 to $355,570,000
Merced County 31 Black Rascal Creek Flood Control Project,
System Improvement Cost: $32,980,000 (Currently in discussions with USACE and DWR for project funding)
Past Practices Public Safety USACE: $24,735,000 Environmental NRCS:$5,000,000
Public Safety DWR: $3,245,000
$0 Decreased Federal Funding
Public Safety USACE: $16,490,000
Public Safety DWR: $16,490,000 $0
Increased Local Participation
Public Safety USACE: $1,500,000
Public Safety DWR: $16,490,000 $14,990,000
Local Contribution Range $0 to $14,990,000 Total Merced County System Improvements: 1
Total Merced County Costs: $32,980,000 Total Obligations $0 to $14,990,000
7-36 Upper San Joaquin River Regional Flood Management Plan

REGIONAL FINANCE PLAN
7.4.3 Summary of Tier 1 Funding Scenarios The three hypothetical Tier 1 funding scenarios provide a range of potential cost shares for Federal, State, and local agencies. Table 7-11 shows a summary breakdown of the potential costs and the total cost of $57.345 million to implement all the Tier 1 non-urban SIs. Figure 7-2 illustrates the potential cost-shares across the three scenarios. The local obligation for these improvements ranges from $600,000 in the Continuation of Past Practices scenario to $7.8 million in the Increased Local Participation scenario. The highest Federal share is $23 million in the Continuation of Past Practices scenario. The State contribution ranges from $33 million in the Continuation of Past Practices scenario to $45 million in the Increased Local Participation scenario. The State has the highest cost share in each scenario with DWR responsible for most of the State funding.
Table 7-12 shows a summary breakdown of the potential costs and the total cost of $396 million to implement all the Tier 1 urban SIs. Figure 7-3 illustrates the variation in the cost shares across the three scenarios. The local obligation for these improvements ranges from $31 million in the Continuation of Past Practices scenario to $370 million in the Increased Local Participation scenario. The highest Federal share is $184 million in the Continuation of Past Practices scenario. The State contribution ranges from $24 million in the Increased Local Participation scenario to $324 million in the Decreased Federal Funding scenario.
7.4.4 Tier 2 and Tier 3 System Improvements The prioritization effort focuses the financial analysis on the higher benefit SIs in the region. Sorting the SIs into three tiers does not determine an order of SI implementation. Future implementation will consider which types of funding sources may be available throughout the planning horizon and which SIs or groups of SIs are potentially eligible. The Tier 2 and 3 SIs could change to Tier 1 as project descriptions are refined and better information on the multibenefit nature of the projects becomes available. Combining individual SIs to create larger multibenefit projects may also increase scores and ranking. Tables 7-5 and 7-6 show the alignment of Tier 2 and 3 SIs with potential State and Federal assistance programs.
Upper San Joaquin River Regional Flood Management Plan 7-37

REGIONAL FINANCE PLAN
Table 7-11. Tier 1 Non-Urban System Improvements Funding Scenarios Summary USJR Tier 1 Non-Urban Scenario Summary
Total USJR Tier 1 Non-Urban System Improvement Costs: $57,345,000
Total Local Obligation $600,000-$7,865,500
Scenario Total Federal Contribution Total State Contribution Total Local Contribution
Past Practices $23,692,000 $33,053,000 $600,000
Decreased Federal Funding $6,357,500 $47,670,000 $3,317,500
Increased Local Participation $3,674,500 $45,805,000 $7,865,500
Figure 7-2. Cost Allocation for Different Funding Scenarios for Tier 1 Non-Urban Improvements
7-38 Upper San Joaquin River Regional Flood Management Plan

REGIONAL FINANCE PLAN
Table 7-12. Tier 1 Urban System Improvements Funding Scenarios Summary USJR Tier 1 Urban Scenario Summary
Total USJR Tier 1 Urban System Improvement Costs: $396,550,000
Total Local Obligation $31,180,000 - $370,560,000
Scenario Total Federal Contribution Total State Contribution Total Local Contribution
Past Practices $183,555,000 $181,815,000 $31,180,000
Decreased Federal Funding $18,490,000 $323,811,000 $54,249,000
Increased Local Participation $1,500,000 $24,490,000 $370,560,000
Figure 7-3. Cost Allocation for Different Funding Scenarios for Tier 1 Urban Improvements
Upper San Joaquin River Regional Flood Management Plan 7-39

REGIONAL FINANCE PLAN
7.5 Findings The USJR faces many financial challenges and is characterized by implementing agencies and DACs with limited local fundraising capacity. Fundraising and financial strategies vary across these agencies depending on their identification as a special flood district, city, county, or irrigation district. Over 20 agencies submitted SIs as part of the USJR RFMP planning process. Eight of these agencies are responsible for 26 of the SIs prioritized as Tier 1, which are the focus of this financial analysis.
There are no large SIs in this region; rather, many small SIs collectively protect this region. Many of the SIs in this RFMP have not had any extensive or long-term studies completed. These attributes make it more difficult to develop and finance regional SIs.
Funding sources are divided into two primary categories, those related to public safety and those for environmental stewardship. Federal funding programs for public safety come primarily from FEMA and USACE. Federal funding for environmental stewardship includes the NRCS, USFWS, NPS, and Reclamation programs. DWR programs dominate the State funding sources for public safety. State environmental stewardship funding sources include CSP, WCB, the SWRCB, and the CNRA.
The LSJLD is the implementing agency for 12 of the non-urban SIs. The total costs of these SIs sum to $26,215,000, with an estimated total obligation of $0 to $3,357,500 based on the three finance scenarios. The LSJLD FY 2011-12 budget surplus was $210,619, leaving LSJLD with little ability to fund SIs even after accounting for State and Federal assistance. As noted previously, the LSJLD is responsible for O&M activities and is not set up to fund capital improvements.
The City of Firebaugh has similar challenges funding new capital or O&M expenditures for proposed SIs. The City of Firebaugh has three SIs that amount to $4,530,000 and an estimated obligation of $0 to $985,000. With a FY 2014-15 capital outlay budget of $29,056, State and Federal assistance is needed as shown in the Continuation of Past Practices scenario.
The cost to implement the Tier 1 flood SIs totals over $450 million. Depending on the scenarios examined, State and Federal assistance programs may cover over half of these costs, and that leaves local implementing agencies responsible for $32 million to $370 million. Of the 26 Tier 1 SIs, 15 were estimated to cost less than $2 million.
7.6 Recommendations Recommendation 1: Securing State and Federal funds is critical to advance the regional SIs. All of the communities in the USJR region are considered DACs by the State. Therefore, the provision of State funds to help support implementing agencies with grant writing for Federal and State assistance programs is necessary.
Recommendation 2: The State should use this Finance Plan to gauge the level of support needed by the USJR region. The Finance Plan provides an estimate of the range of total funds needed from each funding source to achieve the multibenefit outcomes of public safety and environmental stewardship from the prioritized SIs. Recommendation 3: Implementing agencies should improve coordination within the region to promote SI financing. Seeking mutually beneficial financing strategies will minimize the total cost of providing public safety and environmental stewardship in the region.
7-40 Upper San Joaquin River Regional Flood Management Plan

REGIONAL FINANCE PLAN
Recommendation 4: The State needs to consider O&M support when providing assistance for capital projects. Some agencies already have insufficient funds for current O&M and new projects may only increase the burden. Environmental stewardship grant programs in particular need to consider the higher costs of O&M associated with restoration and habitat enhancement projects.
Recommendation 5: The current descriptions of most SIs include qualitative explanations of the potential benefits. Most grant programs require quantification of the benefits to the beneficiaries. Implementing agencies should develop 1) a detailed description of the spatial distribution of benefits, 2) quantified benefits, and 3) identification of specific beneficiaries. Benefits of a SI may include agriculture, urban, small communities, recreation, and flood protection.
Recommendation 6: Certain State or Federal grant programs have monies available specifically for conducting planning/feasibility studies for SIs. Implementing agencies should apply for these grants to perform comprehensive studies to better promote SIs for future design/construction funding. The critical information that must be contained in a SI study includes:
• Quantification of benefits for better understanding of SI outcomes and for justifying increases in local assessments or rates.
• Capital vs. O&M costs for timing of financial needs. Knowing when the money is needed and how long the financing is planned will help match SIs with funding sources.
• Promoting benefits outside of region. Identify downstream and upstream benefits such as flood, recreation, and environmental enhancement.
Recommendation 7: The USJR region needs to explore opportunities to expand the geographic scope of SIs and grouping improvements together to increase chances for obtaining State and Federal funding. Expanding the scope of these SIs through collaboration, incorporating IWM and environmental stewardship benefits, and involving new stakeholders may create more fundable comprehensive regional SIs. It must be noted, that although expanding the scope of SIs may improve chances of getting State or Federal funding, it may also lower chances of getting local support if there is concern that the local benefits may be of lesser significance.
Upper San Joaquin River Regional Flood Management Plan 7-41

REGIONAL FINANCE PLAN
This page intentionally left blank.
7-42 Upper San Joaquin River Regional Flood Management Plan

8.0 Recommendations and Future Implementation
The USJR region is an agricultural area that has historically experienced major losses as a result of flooding events. Significant improvements are needed to reduce the risk of flooding to appropriate levels, and substantial funding sources are needed to support these investments. The USJR region has made significant progress reaching out to local stakeholders through the RFMP process to identify needed flood improvements and evaluate opportunities for developing potential multibenefit projects. Because the USJR region has minimal capacity to generate local funding for flood SIs, the region will need to seek Federal and State sources to fund structural and nonstructural improvements to reduce residual flood risk.
Agriculture provides the foundation for the regional economy, and development of a flood management plan that supports sustainable agriculture is critical to the long-term economic viability of the region. Loss of highly productive agricultural lands would have an impact on the long-term economy of the region and would degrade the capabilities of LMAs to maintain existing facilities. The principle of promoting environmental and agricultural stewardship requires that benefits provided by the natural environment and agriculture be recognized and considered when evaluating potential improvements to the flood management system.
The USJR RFMP does not include any mega-projects that will solve the regional public safety, environmental, and flood management issues; instead, the plan identifies a series of smaller structural and nonstructural SIs and actions that address a range of critical flood-related problems. Only through careful evaluation of these identified SIs can a mix of single-purpose flood and multibenefit SIs be developed to significantly improve flood infrastructure, flood system resiliency, O&M, emergency management, and environmental enhancement. Making commitments regarding how specific SIs will be bundled or combined to create multibenefit projects is not feasible or reasonable at this time; however, the RFMP identifies potential linkages between SIs so that integration opportunities can be evaluated in future planning and implementation phases when cost-sharing and financing capabilities are more fully understood. This RFMP identifies a number of example multibenefit SIs that provide broad USJR region potential benefits and have the support of local stakeholders.
This section provides recommendations and ideas for future steps to promote implementation of the critical SIs identified through the RFMP process.
8.1 Recommendations
8.1.1 Prioritization of System Improvements The short-term and long-term Tier 1 SIs identified in the RFMP are recommended for inclusion in the basinwide feasibility studies and funding through State and Federal grant programs. These SIs were developed through extensive coordination with local stakeholders and were prioritized as Tier 1 SIs through an evaluation process that included consideration of 42 subcriteria in four broad categories, including public safety, environmental stewardship, economic stability, and regional issues. These high-level categories mirror the FloodSAFE vision objectives. The SIs that were classified as Tier 1 tended to score well across all categories.
Upper San Joaquin River Regional Flood Management Plan 8-1

RECOMMENDATIONS AND FUTURE IMPLEMENTATION
Current Tier 2 or Tier 3 SIs will be reevaluated as more information becomes available. Based on further evaluation, some Tier 2 and 3 projects could be raised to a higher tier. The prioritization process used in the RFMP was developed so that this reevaluation can take place.
8.1.2 Multibenefit Projects The USJR RFMP has identified a suite of SIs that could be developed to achieve multiple benefits such as reducing flood risk, enhancing fish and wildlife habitats, improving water supply reliability, addressing subsidence, and providing recreational opportunities. The primary multibenefit opportunities in the USJR region involve diversion of flood flows onto adjacent lands through levee deauthorization or removal, levee breaching, operable gates, pumps, and improved conveyance between the floodplains and the main river channel or bypass system. This provides flood attenuation, transitory storage of floodwaters, and localized reductions in flood stage and velocities. The ecosystem benefits of these improvements include:
• Increases in the extent and frequency of floodplain inundation
• Removal of hard bank protection
• Restoration/enhancement of native wetland, riparian, and floodplain vegetation communities and associated benefits for many species of wildlife
• Restoration of hydrologic connectivity between the channel corridor and adjacent floodplain terraces and removal of barriers to fish migration
• Recharge of groundwater basins
Additional benefits that could be realized by many of these SIs include enhanced water supplies for agriculture and managed wetlands, improvement of water conveyance infrastructure, and enhanced recreational opportunities.
These groupings of SIs are drawn from multiple SI tiers and categories that, when combined, could provide a range of increased benefits that include enhanced water supplies for agriculture and managed wetlands, improvement of water conveyance infrastructure, and enhanced recreational opportunities. Additional work, beyond the scope of this planning effort, will be needed to fully assess the potential benefits of these opportunities.
Examples of proposed multibenefit SIs that could be evaluated in more detail are provided in the following descriptions:
• Great Valley Grasslands State Park (GVGSP) Levee Deauthorization. Adjacent to the San Luis NWR, the GVGSP project would involve breaching and decommissioning levees to allow transitory storage of floodwaters, localized increases in channel capacity through this reach, improvements to optimize floodplain inundation, and invasive species control. Implementation of this project would enhance native wetland and riparian vegetation and wildlife communities, shaded riverine aquatic habitat, and rearing habitats for native fish populations. It would also remove the GVGSP levees from the maintenance burden currently assumed by LSJLD, resulting in cost savings and reduced liability. Finally, although CSP does not currently maintain public recreation facilities at this site, a levee deauthorization and ecosystem restoration project at GVGSP could include additional or enhanced recreational facilities.
CSP staff is actively participating in the USJR RFMP process and is the lead implementing agency, along with LSJLD, for the GVGSP project. It is proposed that project-funding opportunities be more
8-2 Upper San Joaquin River Regional Flood Management Plan

RECOMMENDATIONS AND FUTURE IMPLEMENTATION
fully explored in the next phase of the RFMP process and evaluate the steps in the 408 permitting process for levee deauthorization, which will likely be a complex and potentially costly process.
• City of Firebaugh. The city of Firebaugh has a history of flooding. Small community 100-year flood protection for Firebaugh could combine structural flood protection (levee improvements) with potential levee setbacks and ecosystem restoration. DWR is also evaluating these SIs as part of the San Joaquin River basinwide feasibility studies. The projects would involve a combination of levee improvements to provide further protection of vulnerable areas and critical facilities in the city of Firebaugh with levee setbacks on parcels adjacent to and in the proximity of Firebaugh, which would provide expanded channel capacity and decreased velocities in high-risk areas, as well as opportunities for ecosystem restoration and recreation. This multibenefit approach could provide reduced residual flood risks and improved system resiliency in Firebaugh, while also restoring natural processes such as channel meander, floodplain inundation, and restoration of critical wildlife habitat. The comprehensive vision also provides many opportunities for adding trails and enhancing recreation within and adjacent to the city of Firebaugh.
There are many different paths to implement this SI, based on funding opportunities and local interest in partnering with USACE and DWR. It is proposed that project-funding opportunities be more fully explored in the next phase of the RFMP process. DWR should continue to coordinate with the City of Firebaugh on an implementation approach for this multibenefit SI that diversifies funding opportunities while recognizing the regional sensitivities of partnering with Federal entities that may have divergent interests.
• Merced and Western Madera County Subsidence. Multibenefit flood attenuation and groundwater recharge SIs that involve diversion of flood flows into recharge basins, providing not only localized flood attenuation but also augmentation of regional groundwater basins and improved reliability of the regional water supply, while addressing subsidence issues. The Red Top Area Joint Banking SI consists of a combined banking and overdraft correction program in the Red Top/El Nido (Washington Avenue) areas east of the San Joaquin River in an effort to reduce pumping groundwater from below the Corcoran Clay. This SI is focused on addressing significant subsidence, which has been observed in this area. Additional turnouts from the Eastside Bypass would be constructed to divert floodwater into 720 acres of groundwater recharge ponds. The recharge areas could be expanded if flood flows occur before vine or tree budding, allowing larger cropped areas to be flooded. It is proposed that SI-funding opportunities be more fully explored in the next phase of the RFMP process and that IRWM and multibenefit opportunities, which would enhance flood attenuation and provide groundwater recharge, be evaluated.
• USFWS Transitory Storage. The USFWS manages a number of projects on Federal refuge lands that could provide transitory storage of floodwaters. In addition to floodwater storage, the projects would enhance existing habitats by improving the extent and frequency of floodplain inundation, improve water supply infrastructure and conveyance for managed wetlands, and would provide additional water supply for managed wetlands complexes on the refuge. These projects would also contribute toward improving recreational opportunities on and near refuge lands due to enhancement of habitats in a region where outdoor education, wildlife viewing, fishing, and hunting occur.
The USFWS is an active partner in the formulation of the USJR RFMP and would be the implementing agency for these SIs on Federal lands. The USFWS and partners would be
Upper San Joaquin River Regional Flood Management Plan 8-3

RECOMMENDATIONS AND FUTURE IMPLEMENTATION
responsible for design and permitting, whereas the USFWS alone would be responsible for O&M. Preliminary cost estimates for these projects have been developed as part of the USJR RFMP formulation process. It is proposed that funding opportunities for these SIs be further explored in the next phase of the RFMP process.
• Enhancement of Connectivity between the Eastside Bypass and Floodplain. Three SIs along the Eastside Bypass could divert floodwater into adjacent parcels to provide flood attenuation during high flows, which would enhance wetland, riparian, and floodplain habitats. The 3FX Group (Trout Unlimited, Ducks Unlimited, and American Rivers), in collaboration with private landowners and the USFWS, is advancing these projects. Although the specific improvements vary by site, each involves enhancing existing facilities by improving existing pumping stations or breaching levees to allow additional flow into and out of the USFWS refuge units, and by enhancing connectivity between the floodplain and the bypass system.
The 3FX Group is already advancing these SIs independently. The USJR RFMP could provide additional funding resources and regional support for these SIs, thereby gaining the opportunity to advance the projects as “pilot” examples of how to develop multibenefit flood projects on public and private lands in the USJR region. These projects are compatible with existing land uses and promote recreational potential and habitat restoration objectives.
• Invasive Vegetation Monitoring and Treatment. In many sections of the USJR region, dense communities of invasive vegetation have established in the floodway, including the mainstem San Joaquin River, the flood bypass system, and many of the tributaries. This vegetation has compromised the hydraulic performance of the flood management system and has displaced the establishment of native riparian vegetation that serves as critical habitat for fish and wildlife communities. As a component of the SJRRP, Reclamation is currently implementing an Invasive Species Monitoring and Treatment Project in the mainstem San Joaquin River from Friant Dam to the Merced River confluence, to monitor and treat the spread of invasive species that may result from increased river flows. Additional regional coordination could help expand and improve this invasive vegetation monitoring and treatment effort, thus enhancing the performance of flood infrastructure and regional habitats.
These suites of projects represent promising multibenefit opportunities identified by the stakeholders in the USJR region, and although many of them do not currently rank yet as Tier 1 SIs, they are recommended for more detailed analyses.
8.1.3 Proposed Studies Local stakeholders identified many proposed studies as part of the planning process that deserve evaluation; however, such evaluation was not possible due to the limited resources and schedule for the RFMP planning process. Brief descriptions of a few studies recommended for further evaluation follow:
• Forecast-Coordinated Operations. Update and improve upstream reservoir operations through enhancements to coordination among operating entities; use of additional information, including forecasting; broader communications with others, including local communities; improved and accessible gauging; and updated flood management manuals. Analyze and implement actions to modify upstream reservoir operations to improve flood management; aquatic, riparian, and floodplain habitat; water quality; and recreation. This involves careful coordination of releases from
8-4 Upper San Joaquin River Regional Flood Management Plan

RECOMMENDATIONS AND FUTURE IMPLEMENTATION
different reservoirs to reduce downstream flood peaks, thus improving the overall system reliability.
• Forecast-Based Operations. Involves relying more heavily on hydrologic forecasts as the ability to forecast anticipated runoff becomes more reliable. This could allow greater reservoir releases prior to big storms (more than is allowed under current operational criteria) and encroaching on flood storage space to save water if forecasts anticipate minimal runoff for the forecast period. It might be possible to make anticipatory releases in advance of major flood peaks, which would take maximum advantage of downstream channel capacities, thus reducing the risks of floods downstream. Such anticipatory releases are not without risk because they may cause loss of water supply and electrical generation benefits in the event that the anticipated flood inflows do not materialize as forecasted. There may be a need to alter existing reservoir operating rules and regulations to take into consideration anticipated storm inflows.
• Evaluation of Upstream Storage. Development of additional upstream reservoir storage could provide potential flood protection and water supply benefits to the USJR region. For example, a dam at Temperance Flat could have a capacity of 1.3 million AF and, depending on the carryover storage target, would produce an additional 61,000 to 76,000 AF per year on a long-term average, according to the draft feasibility report (Reclamation, 2014a). The dam's benefits could include improved regional water supply reliability for both agricultural and urban water users, increased emergency water supply, reduced residual flood risk, and increased flood system resiliency, as well as hydropower and recreation benefits. Ecosystem benefits could include a larger cold-water pool, increased flows for restoration, and potential benefits for spring-run chinook salmon (Reclamation, 2014a).
• Regional Sediment Study. Conduct a basinwide study of sediment management for the entire San Joaquin River basin to analyze transport processes and develop a sediment management strategy for the whole basin. The USJR region has a significant sediment management problem due to the transport of large volumes of sediment into the area from upstream sources. Moreover, subsidence along portions of the Eastside Bypass is causing extreme scour and incision in the channel, which results in sediment mobilization and subsequent settlement in downstream reaches. In addition, the SJRRP will have a significant impact on river flows and sediment transport within the region. A geomorphic understanding of the river is needed to develop a sediment budget and identify the long-term trends of aggradation, erosion, and stability in different reaches of the river.
• Regional O&M Permitting. Regional coordination with all permitting agencies to develop a streamlined cost reimbursable permitting program that will reduce the time and cost required to permit routine maintenance actions. Maintenance activities often require permits from resource management agencies, including the CDFW, USFWS, RWQCB, CVFPB, NMFS, and USACE. The LMAs have limited staff and budgets to address the legal requirements that protect endangered species during the execution of maintenance and construction in the flood system. The process to obtain the required permits can be lengthy and expensive. If permits cannot be obtained for levee maintenance, levees often fall into disrepair and fail to meet criteria established by USACE, which results in a rating of “Unacceptable” in periodic inspections. An Unacceptable rating makes those levees ineligible for rehabilitation assistance from USACE under PL 84-99 following a flood event. In addition, this maintenance can result in liability issues for the flood management agencies. A
Upper San Joaquin River Regional Flood Management Plan 8-5

RECOMMENDATIONS AND FUTURE IMPLEMENTATION
program that allows for habitat protection and timely, cost-effective, flood system maintenance needs to be developed and implemented.
• Improved Governance and Sustainable Funding. A number of governance issues exist in the USJR region, including the need to formalize current agreements for the MSG and the need for a flood management agency in Merced County. Also, all the LMAs in the region need formalized emergency management plans and improved funding sources to implement capital projects and O&M.
8.2 Future Implementation The RFMP is envisioned to be an ongoing regional planning process that will continue to be updated as new information becomes available. To the extent that DWR provides funding for regional planning through adoption of the 2017 update to the CVFPP, the RFMP process will continue to provide regional support and coordination to promote better flood management in the USJR region. In addition, it is envisioned that the RFMP process will work to facilitate and acquire funding to implement the recommendations in the RFMP, including the following specific actions:
• Participate in the development of the San Joaquin River Basinwide Feasibility Study, including planning assumptions, hydrologic and hydraulic modeling analyses, ecosystem restoration opportunities, benefits, peer review, and financing capabilities.
• Monitor future funding opportunities from potential State and Federal sources, such as the Urban Flood Risk Reduction and Small Communities Programs, to identify recommended regional improvements that may be eligible for direct or competitive funding.
• Conduct continuing stakeholder outreach and coordination to promote better flood management in the region, including emergency management, O&M, environmental enhancement, and flood risk reduction.
• Conduct further planning activities to develop more refined descriptions of SIs, detailed costs, and schedules, and to identify potential multibenefit opportunities and permit requirements.
• Work with SI proponents to investigate potential funding opportunities for multibenefit and IRWM projects.
• Continue coordination with the Mid- and Lower San Joaquin River RFMP planning teams to ensure that regional and SIs are not in conflict and can be integrated with plans of adjacent planning regions to promote greater benefit.
• Continue coordination with the SJRRP to ensure that integrated restoration efforts along with flood management improvements are consistent with regional flood management priorities. The SJRRP has the opportunity to advance potential multibenefit flood projects in the USJR region. The SJRRP is a large program with uncertainty regarding future funding. The SJRRP is working with many stakeholders to develop a plan for future implementation of the SJRRP, including schedule and budget. DWR and the CVFPB are also included in these discussions. The SJRRP may be able to provide funding and permitting support to flood projects where overlap between SJRRP and flood projects exists.
8-6 Upper San Joaquin River Regional Flood Management Plan

9.0 References California Department of Finance (DOF). 2013. California State Data Center. Census 2010. Website:
http://www.dof.ca.gov/research/demographic/state_census_data_center/census_2010/view.php. Accessed on January 15, 2013.
California Department of Fish and Wildlife (CDFW). 1990. Status and Management of Spring-Run Chinook Salmon. Prepared by Inland Fisheries Division for California Fish and Game Commission. Sacramento (CA). 33 p.
California Department of Fish and Wildlife (CDFW). 2013. Quagga/Zebra Mussels Fact Sheet.
California Department of Water Resources (DWR) and United States Army Corps of Engineers (USACE). 2013. California’s Flood Future: Recommendations for Managing the State’s Flood Risk (Flood Future Report). Inclusive of Technical Attachments A through J. November.
California Department of Water Resources (DWR). 1968. Bulletin 69-67: California High Water 1966-1967. June.
California Department of Water Resources (DWR). 1999. Water Resources Engineering Memorandum No. 63 (WREM 63). Memorandum establishing policy and procedures for interdivisional cooperation and assignment of tasks in responding to emergency levee-endangering incidents in the Sacramento-San Joaquin Delta. January 19.
California Department of Water Resources (DWR). 2002. Riparian Vegetation of the San Joaquin River. Technical Information Record SJD-02-1. Prepared for San Joaquin River Riparian Habitat Restoration Program, U.S. Bureau of Reclamation, Fresno, CA. May.
California Department of Water Resources (DWR). 2009. Bulletin 160-09. California Water Plan Update 2009.
California Department of Water Resources (DWR). 2010. Central Valley Flood Protection Plan SPFC Descriptive Document.
California Department of Water Resources (DWR). 2011a. Flood Control System Status Report.
California Department of Water Resources (DWR). 2011b. Sample Flood Safety Plan. June.
California Department of Water Resources (DWR). 2012a. Public Draft 2012 Central Valley Flood Protection Plan. FloodSAFE California. June.
California Department of Water Resources (DWR). 2012b. Public Draft 2012 Central Valley Flood Protection Plan, Attachment 2: Conservation Framework. FloodSAFE California. January.
California Department of Water Resources (DWR). 2012c. Public Draft 2012 Central Valley Flood Protection Plan, Attachment 9G: Regional Permitting Options. FloodSAFE California. January.
California Department of Water Resources (DWR). 2012d. Informational Sheet -State-Federal Flood Operations Center. January.
California Department of Water Resources (DWR). 2013a. Land use survey data. Website: http://www.water.ca.gov/landwateruse/lusrvymain.cfm. Accessed August 2013.
California Department of Water Resources (DWR). 2013b. Regional Atlas for the Upper San Joaquin River Region (Atlas). Prepared in conjunction with FloodSAFE California. May. Website: http://www.water.ca.gov/cvfmp/regionalplan/regionalatlas.cfm. Accessed August 2013.
California Department of Water Resources (DWR). 2013c. Hydraulic Evaluation of the Effect of Subsidence on Levee Freeboard in the Chowchilla and Eastside Bypasses. January 25.
Upper San Joaquin River Regional Flood Management Plan 9-1

REFERENCES
California Department of Water Resources (DWR). 2013d. FloodSAFE Implementation Funding Programs. Website: http://rfmpcc.com/wordpress/wp-content/uploads/2013/06/Contacts_FloodSAFEImplementationPrograms_6.20.13.pdf. Accessed August 13, 2014.
California Department of Water Resources (DWR). 2014. Draft Conservation Strategy. July.
California Energy Commission, Climate Change Center (CEC). 2012. Our Changing Climate 2012 Vulnerability & Adaptation to the Increasing Risks from Climate Change in California. Brochure. Publication # CEC-500-2012-007.
California Farm Bureau Federation. 2013. Website: http://www.cfbf.com/CFBF/CountyFarmBureaus/CFBF/CountyFarmBureaus/County_Farm_Bureau_Details.aspx?id=1000010. Accessed on June 5, 2013.
California State Parks (CSP) Planning Division. 2009. Central Valley Vision Implementation Plan.
Cayan, Dan, Mary Tyree, David Pierce, Tapash Das (Scripps Institution of Oceanography). 2012. Climate Change and Sea Level Rise Scenarios for California Vulnerability and Adaptation Assessment. California Energy Commission. Publication number: CEC‐500‐2012‐008.
City of Firebaugh. 2009. City of Firebaugh General Plan.
City of Firebaugh. 2014. Fiscal Year 2014-2015 Budget. Website: http://www.ci.firebaugh.ca.us/pdf/budget_fy14-15.pdf. Accessed September 29, 2014.
City of Los Banos. 2009. City of Los Banos 2030 General Plan Update. July.
City of Merced. 2011. Local Hazard Mitigation Plan.
City of Merced. 2013. Draft Merced Local Hazard Mitigation Plan.
City of Merced. 2014. City of Merced, California 2014-2015 Annual Budget. Website: http://www.cityofmerced.org/depts/city_budget/city_budget_14_15/default.asp. Accessed October 7, 2014.
Federal Emergency Management Agency (FEMA). 2013. National Incident Management System (NIMS) Fact Sheet. Website: http://www.fema.gov/national-incident-management-system. Accessed September 10, 2013.
Fresno County. 2009. Fresno County Multi-Hazard Mitigation Plan. January.
Fresno County. 2013. Fresno County General Plan, Revised Public Review Draft. January.
Fry, D.H., Jr. 1961. “King Salmon Spawning Stocks of the California Central Valley, 1940–1959.” California Fish and Game. 47(1):55–71.
Gaines, D. 1974. “A New Look at the Nesting Riparian Avifauna of the Sacramento Valley, California.” Western Birds. Issue 5: 61–80.
Governor’s Office of Planning and Research (OPR). 2003. State of California General Plan Guidelines.
Holland, R.F. 1986. Preliminary Descriptions of the Terrestrial Natural Communities of California. Prepared for California Department of Fish and Game, Sacramento, CA.
Kapnick, S., and A. Hall. 2009. Observed Changes in the Sierra Nevada Snowpack: Potential Causes and Concerns. Prepared for California Environmental Protection Agency and California Energy Commission. Report CEC-500-2009-016-F.
9-2 Upper San Joaquin River Regional Flood Management Plan

REFERENCES
Lindley, S.T., R.S. Schick, A. Agrawal, M. Goslin, T.E. Pearson, E. Mora, J.J. Anderson, B. May, S. Greene, C. Hanson, A. Low, D. McEwan, R.B. MacFarlane, C. Swanson, and J.G. Williams. 2006. “Historical Population Structure of Central Valley Steelhead and its Alteration by Dams.” San Francisco Estuary and Watershed Science. 4(1): 1-19.
Madera County. 1995. Madera County General Plan Policy Document. October.
Madera County. 2008. Integrated Regional Water Management Plan Volume 1. April.
Madera County. 2011. Hazard Mitigation Plan Madera County. February.
Madera County. 2014. Recommended Proposed Budget for the Fiscal Year Ending June 30, 2015. Website: http://www.madera-county.com/index.php/forms-and-documents/category/607-2014-2015-county-budget. Accessed September 29, 2014.
McBain & Trush, Inc. (eds.). 2002. San Joaquin River Restoration Study Background Report. Prepared for Friant Water Users Authority, Lindsay, California, and Natural Resources Defense Council, San Francisco, California.
McEwan, D. 2001. “Central Valley Steelhead.” Fish Bulletin No. 179: Contributions to the Biology of Central Valley Salmonids. (R.L. Brown, ed.). Pages 1-44. California Department of Fish and Game. Sacramento, California.
Merced County. 2011a. Merced County General Plan Background Report. June.
Merced County. 2011b. Merced County General Plan, Public Review Draft. February.
Merced County. 2014. Proposed Budget Fiscal Year July 2014-June 2015. Website: http://www.co.merced.ca.us/ArchiveCenter/ViewFile/Item/458. Accessed September 30, 2014.
Moore, S.B., J. Winckel, S.J. Detwiler, S.A. Klasing, P.A. Gaul, N.R. Kanim, B. Kesser, A.B. DeBevec, K. Beardsley, and L.L. Puckett. 1990. Fish and Wildlife Resources and Agricultural Drainage in the San Joaquin Valley, California. Volumes I and II. San Joaquin Valley Drainage Program. Sacramento, CA.
Moyle, P.B. 2002. Inland Fishes of California. Revised and expanded. Berkeley: University of California Press.
Natural Resources Defense Council (NRDC) (Counsel for NRDC, Plaintiff) versus Kirk Rodgers (as Regional Director of United States Bureau of Reclamation, “Federal Defendants”) and Orange Cove Irrigation District (“Friant Defendants”). 2006. United States District Court, Eastern District of California (Sacramento Division). Notice of Lodgment of Stipulation of Settlement. Case 2:88cv01658LKKGGH. Document 13411. Filed 09/13/2006. Website: http://www.usbr.gov/mp/nepa/documentShow.cfm?Doc_ID=4374. Accessed April 2013.
Null, S.E., and J.H. Viers (Center for Watershed Sciences, University of California, Davis). 2012. Water and Energy Sector Vulnerability to Climate Warming in the Sierra Nevada: Water Year Classification in Non-Stationary Climates. Prepared for California Energy Commission. Publication number: CEC-500-2012-015.
Public Policy Institute of California (PPIC). 2014. Paying for Water in California.
Reclamation Board. 1978. Lower San Joaquin River Flood Control Project Operations and Maintenance Manual for Levees, Irrigation and Drainage Structures, Channels and Miscellaneous Facilities.
San Joaquin County Resource Conservation District. 2002. Lower Mokelumne River Watershed Stewardship Plan.
Upper San Joaquin River Regional Flood Management Plan 9-3

REFERENCES
San Joaquin River Conservancy (SJRC). 2013. Notice of Preparation (NOP) of the Draft Environmental Impact Report (EIR) for the San Joaquin River Parkway Master Plan Update. June 17.
San Joaquin River Exchange Contractors Water Authority (SJRECWA). 2012. Western Madera County Subsidence Study. November 29.
San Joaquin River Parkway and Conservation Trust. 2012. San Joaquin River Restoration Program Invasive Vegetation Monitoring and Management Annual Report 2012. Prepared for US Bureau of Reclamation. San Joaquin River Restoration Program.
San Joaquin River Parkway and Conservation Trust. 2013. Mission and History. Website: http://riverparkway.org/index.php. Accessed on July 2014.
San Joaquin River Partnership (SJRP). 2011. San Joaquin River Blueway: A Vision for Public Enjoyment and Stewardship of the San Joaquin River.
San Luis & Delta-Mendota Water Authority. 2006. Westside Integrated Water Resources Plan. May.
San Luis & Delta-Mendota Water Authority. 2013. Floodwater Utilization Project Pre-feasibility and Fatal Flaw Analysis. December 12.
United States Army Corps of Engineers (USACE). 1965. Friant Dam Ops Manual: Reservoir Regulation Manual for Flood Control Friant Dam and Reservoir (Millerton Lake), San Joaquin River, California: Appendix I to Master Manual of Reservoir Regulation San Joaquin River Basin, California.
United States Army Corps of Engineers (USACE). 1967. Report on Floods, Central Valley of California: 1966-67 Flood Season. December.
United States Army Corps of Engineers (USACE). 1969. After Action Report: Operation Foresight 1969 Snowmelt Floods.
United States Army Corps of Engineers (USACE). 1984. Operation and Maintenance Manual for Channels and Levees of the Merced County Streams Group. March.
United States Army Corps of Engineers (USACE). 1999. Sacramento and San Joaquin River Basins, California Post-Flood Assessment, Sacramento, CA. 150 p.
United States Army Corps of Engineers (USACE). 2012. USACE Flood Emergency Management Brochure.
United States Bureau of Reclamation (Reclamation) and California Department of Water Resources (DWR). 2011. San Joaquin River Restoration Program. Draft Program Environmental Impact Statement/Environmental Impact Report. April.
United States Bureau of Reclamation (Reclamation) and California Department of Water Resources (DWR). 2012. San Joaquin River Restoration Program. Program Environmental Impact Statement/Environmental Impact Report. June 19.
United States Bureau of Reclamation (Reclamation). 1998. Historical Riparian Habitat Conditions of the San Joaquin River – Friant Dam to the Merced River. Prepared by Jones & Stokes Associates, Sacramento, CA. April.
United States Bureau of Reclamation (Reclamation). 2009. Water Year 2010 Interim Flows Project Final Environmental Assessment/Initial Study: Appendix F, Invasive Species Monitoring and Management Plan for Water Year 2010 Interim Flows. San Joaquin River Restoration Program. September.
9-4 Upper San Joaquin River Regional Flood Management Plan

REFERENCES
United States Bureau of Reclamation (Reclamation). 2012a. San Joaquin River Restoration Program Programmatic Environmental Impact Study.
United States Bureau of Reclamation (Reclamation). 2012b. San Joaquin River Restoration Program. Third Party Working Draft Framework for Implementation. June 19.
United States Bureau of Reclamation (Reclamation). 2012c. San Joaquin River Restoration Program. Mendota Pool Bypass and Reach 2B Channel Capacity Improvements Project. Project Description Technical Memorandum. October.
United States Bureau of Reclamation (Reclamation). 2013. San Joaquin River Restoration Program. Appendix F Evaluation of the Effects of Subsidence on Flow Capacity in the Chowchilla and Eastside Bypasses. November
United States Bureau of Reclamation (Reclamation). 2014a. Upper San Joaquin River Basin Storage Investigation Feasibility Report. Draft. January.
United States Bureau of Reclamation (Reclamation). 2014b. San Joaquin River Restoration Program, Subsidence Monitoring Technical Memorandum. Draft. June 20.
United States Census Bureau (Census). 2000. Demographic Profiles. Website: http://censtats.census.gov/pub/Profiles.shtml. Accessed June 3, 2013.
United States Census Bureau (Census). 2010. California Quick Facts from the U.S. Census Bureau, State and County Quick Facts. Website: http://quickfacts.census.gov/qfd/states/06000.html. Accessed June 3, 2013.
United States Department of Agriculture (USDA). 2002. Agricultural Census 2002 United States Summary and State Data Volume 1, Geographic Area Series Part 51. Website: http://www.agcensus.usda.gov/Publications/2002/index.php. Accessed September 2013.
United States Department of Agriculture (USDA). 2007. Agricultural Census 2007 United States Summary and State Data Volume 1, Geographic Area Series Part 51. Website: http://www.agcensus.usda.gov/Publications/2007/Full_Report/. Accessed September 2013.
United States Environmental Protection Agency (USEPA). 2013. Vernal Pools. Website: http://water.epa.gov/type/wetlands/vernal.cfm. Accessed June 5, 2013.
United States Fish and Wildlife Service, 2009. Modoc National Wildlife Comprehensive Conservation Plan and Environmental Assessment. USFWS, Region 8.
United States Geological Survey (USGS). 2006. Storms and Flooding in California in December 2005 and January 2006–a Preliminary Assessment.
United States Geological Survey (USGS). 2012. Quagga and Zebra Mussel Sightings Distribution in California, 2007-2012. Map produced December 10, 2012. Website: http://nas.er.usgs.gov/taxgroup/mollusks/zebramussel/. Accessed July 24, 2013.
United States Geological Survey (USGS). 2013. New Zealand Mudsnail Sightings Distribution. Website: http://nas.er.usgs.gov/newzealandmudsnaildistribution.aspx. Accessed July 24, 2013.
Water Resources Institute at California State University and Alluvial Fan Task Force. 2001. Study Area Flood History. July.
Western Regional Climate Center (WRCC). 2013. Climate data for Los Banos, California, March 1906 through March 2013. Website: http://www.wrcc.dri.edu/cgi-bin/cliMAIN.pl?ca5118. Accessed July 25.
Upper San Joaquin River Regional Flood Management Plan 9-5

REFERENCES
Woolington, Dennis, Supervisory Wildlife Biologist at San Luis National Wildlife Refuge. 2013. USJR Region Team Meeting Minutes. December 13.
Yoshiyama, R.M., E.R. Gerstung, F.W. Fisher, and P.B. Moyle. 2001. “Historic and Present Distribution of Chinook Salmon in the Central Valley Drainage of California.” Fish Bulletin 179: Contributions to the Biology of Central Valley Salmonids, Volume 1. (R.L. Brown, ed.). Pages 71–176. California Department of Fish and Game, Sacramento, CA.
9-6 Upper San Joaquin River Regional Flood Management Plan