River Yamuna: Deteriorating Water Quality & its Socio ...
95
River Yamuna: Deteriorating Water Quality & its Socio-economic Impact JULY 2020
-
Upload
khangminh22 -
Category
Documents
-
view
1 -
download
0
Transcript of River Yamuna: Deteriorating Water Quality & its Socio ...

River Yamuna: Deteriorating Water Quality & its Socio-economic Impact
JULY 2020
Tata Centre for Development
The Tata Centre for Development (TCD) at the University of Chicago works to identify novel solutions to India’s most pressing development challenges and to ensure that these ideas are translated into outcomes that improve people’s lives. Launched in 2016 with generous support from the Tata Trusts, TCD follows a unique approach that harnesses evidence-based insights from UChicago’s rigorous economics research.
An affi liated Centre of the Becker Friedman Institute for Economics at UChicago, TCD upholds the university’s tradition of applying economic thinking to a wide range of social challenges and advancing important research on India through a convergence of scholars from across disciplines.
To translate research insights into policy action, TCD engages with policymakers at all levels of government and policy entrepreneurs across sectors and launches pilot projects to demonstrate success. Representing the joint work of the Tata Trusts and the University of Chicago, TCD asks diffi cult questions, challenges conventional thinking, and creates a new model for impact in India.
Water-to-Cloud (W2C)
Water-to-Cloud is an initiative housed under Tata Centre for Development to map water quality over large water bodies using in-situ cyber-physical systems. It aims to create a repository of reliable water quality data from rivers across India with the belief that putting out such comprehensive and actionable data in the public domain can lead to positive action to improve the health of our water bodies. So far over 300,000 water quality data points have been collected across 11 sites on the 4 major Indian rivers and some lakes since 2016. Learn more at http://thoreau.uchicago.edu
Disclaimer
This document has been prepared by the Water-to-Cloud (hereinafter referred to as “W2C”) team at the University of Chicago. This document shares the experience
of this team in real time water quality monitoring solutions and interviews with the riverine community. The status presented in this report is based on information
collated through interactions and regular follow-up with stakeholders, civil society, government-recognized laboratories and sensor-based data collected by the W2C
team. Due care has been taken to validate the authenticity and correctness of the information, however, no representations or warranty, expressed or implied, is given
by W2C or any of its respective partners, offi cers, employees or agents as to the accuracy or completeness of the information, data or opinions provided by various
parties.

Nutan Maurya, PhDResearch Collaborator, Tata Centre for Development at UChicago
Nutan Maurya is an Environmental Anthropologist with interests in exploring the water dynamics in an urban setting, pollution risk to public health and livelihood, urbanization and cultural politics of environmental crisis, and the anthropology of development.
After studying Biology and Anthropology at the University of Allahabad, she received her Ph.D. in Anthropology, with a specialization in Environmental Anthropology from the University of Delhi. Over the past ten years, she has worked with organizations such as Auburn University, Alabama, South Asian Institute at Harvard University, and Ashoka Trust for Research in Ecology and the Environment (ATREE) in Banga-lore, on various projects at the intersection of environment and socio-economy. She has also taught courses on Gender and Society, Political Sociology and Environmen-tal Anthropology at South Asian University (Delhi), Delhi University, ATREE and Al-lahabad University. Her works have been published in the Journal of Indian Politics and Policy and Economic & Political Weekly.
Contributors at Water-to-Cloud
Lead Author
Himank SharmaProject Lead
Saba MundlayData Analyst
Ritambhara ChauhanTech Lead
Supratik GuhaPrincipal Investigator(Professor at Pritzker School of MolecularEngineering, The University of Chicago)
Anand KumarWater Research Lead
Prashant PandeyProject Associate
Priyank Hirani Program Director
Ashu BalharaWater Researcher

Table of ContentsContents
Table of Contents 3
Foreword 4
Abbreviation 5
Units of Measurement 6
List of Figures 7
List of Tables 11
Acknowledgement 12
Executive Summary 13
1. Introduction 16
1.1. Setting the Context 18
2.Methodology 27
2.1. The Span of Study 27
2.2. Water Quality Measurements 27
2.3. Socio-economic study of the Riverine Communities 29
2.4. Land Use Land Cover (LULC) Data 32
2.5. Limitations of the Study 32
3.Findings 33
3.1. LULC change in the last ten years (2008 vs 2018) 33
3.2. River Water Quality 36
3.3. Socio-economic profi le of the Riverine communities 50
3.4. Riverine Communities of Yamuna: Voices From The Ground 58
4. Discussion and Conclusion 72
5. Recommendation 75
References 77
Appendices 81

ForewordIt is my pleasure to present our report on water quality in Yamuna and its socio-economic impact, which demonstrates perceptions of the riverine community about the effect of pollution on their livelihood and health. The report, which is an outcome of months-long diligence by the Water-to-Cloud team of the Tata Centre for Development (TCD) at UChicago, also includes researchers’ insights on water quality based on rigorous scientifi c measurements.
You will fi nd information on a variety of social and behavioural issues pertaining to community consciousness about environment, faith and decision-making. It also refl ects that river water quality, which is often considered a technical issue, has deep-rooted socio-political aspects that infl uence the lives of the riverine communities.
The report also attempts to bring to centre stage the voices of the vulnerable communities who bear the biggest brunt of pollution, but fi nd very limited space in the development discourse. The section on recommendations for an integrated governance of Yamuna river is a signifi cant development in that direction. The insights that have emerged from this report could guide policy makers to design a more effective intervention.
I would request you to review the report and share it with people who take special interest in it, both at a personal and professional level.
Dr. Leni ChaudhuriCountry DirectorTata Centre for Development at University of Chicago Trust

AbbreviationBIS
BOD
CEPT
CFRI
COD
CPCB
DO
DPCC
EC
FC
FGD
GAP
IIT
LULC
LEK
NGT
SPSS
STP
TC
UNEP
W2C
WASH
WHO
YAP
Bureau of Indian Standards
Bio-Chemical Oxygen Demand
Common E uent Treatment Plant
Central Fisheries Research Institute
Chemical Oxygen Demand
Central Pollution Control Board
Dissolve Oxygen
Delhi Pollution Control Committee
Electrical Conductivity
Fecal Coliform
Focused Group Discussion
Ganga Action Plan
Indian Institute of Technology
Land Use Land Cover
Local Ecological Knowledge
National Green Tribunal
Statistical Package for Social Sciences
Sewage Treatment Plant
Total coliform
United Nation Environmental Program
Water to Cloud
Water Sanitation and Hygiene
World Health Organisation
Yamuna Action Plan

Units of MeasurementDO, BOD, COD - in milligram per litre (mg/l) or parts per million (ppm).
Electrical Conductivity - micro (mhos/cm).
Turbidity - Nephelometric Turbidity Units (NTU).
Trace Elements - parts per billion (ppb).
FC & TC - Most Probable Number (MPN).

List of FiguresFigure 1: Map showing the study area on River Yamuna in Delhi 17
Figure 2: Illustration of drains and the quantity of waste water fl owing in Yamuna using T-Map 18
Figure 3: Plots showing changes in different water quality parameter (DO,BOD and Total coliform) for last 30
years for River Yamuna(Comparing with outdoor bathing5 standards of CPCB) 19
Figure 4: Map showing different segments of River Yamuna in the urban stretch (Delhi): Wazirabad Barrage
to Okhla Barrage 20
Figure 5: Picture showing discharge of Najafgarh drain in the River Yamuna near Wazirabad Barrage 21
Figure 6: Satellite image showing the Najafgarh drain discharge point & point sampling sites 22
Figure 7: Plots of different River water quality parameters at various sites in Upper urban stretch of River
Yamuna(Delhi): Before and after Najafgarh drain discharge (Sampling date: 19/03/2019) 23
Figure 8: Picture of fi shermen at Wazirabad Barrage 24
Figure 9: Picture of a Farmer packing produce to sell in market near Majanu Ka Tila 24
Figure 10: Picture of Washer-folks at Work in Yamuna Khadar East Bank 25
Figure 11: Picture of Yamuna Ghat Area 25
Figure 12: Illustration of Water-to-cloud methodology 26
Figure 14: Schematic Diagram describing the socio-economic study process 28
Figure 13: Picture of water quality data and sample collection in the River Yamuna 28
Figure 15: Picture of fi eld Exploration, Establishing Rapport and Data Collection at different sites 31
Figure 16: Satellite image pointing out the survey sites and LULC study area (For LULC study 5 km radius of
river area was considered that includes the survey sites as well) 32
Figure 17: Plot showing LULC pattern change in a decade (2008 V/s 2018) 33
Figure 18: Satellite images showing change in LULC Pattern & Number of Wastewater Drains- 2008 vs 2018
(along the Segment-I & II stretch of the river Yamuna),two images in fi rst row shows change in numbers of
drains and the second rows images shows changes in different land use over a decade 34
Figure 19: Box plots showing segment-wise variation in Dissolve Oxygen values in River Yamuna (Delhi) along
with box plot description (April 2018 - October 2019) 35

Figure 20: Box plots showing segment-wise variation in pH values for River Yamuna in Delhi (April 2018 -
October 2019) 36
Figure 21: Box plots showing segment-wise variation in Electrical Conductivity values for River Yamuna in
Delhi (April 2018 - October 2019) 36
Figure 22: Box plots showing segment-wise variation in Turbidity values for River Yamuna in Delhi
(April 2018 - October 2019) 36
Figure 23: Plot showing segment-wise seasonal variation of Dissolved Oxygen (Median values) of River
Yamuna in Delhi (April 2018 - Oct 2019) 37
Figure 24: Plot showing segment-wise seasonal variation in Electrical Conductivity (median values)
of River Yamuna in Delhi (April 2018 - Oct 2019) 38
Figure 25: Plot showing segment-wise seasonal variation in Turbidity (Median values) of River Yamuna
in Delhi (April 2018 - Oct 2019) 39
Figure 26: Maps showing hotspots where Trace Elements is violating long-term irrigation standard
(All segments) 41
Figure 27: Plot showing different COD values throughout fi ve Segment of River Yamuna in Delhi
(April 2018-October 2019) 42
Figure 28: Plot showing different BOD values throughout fi ve Segment of River Yamuna in Delhi
(April 2018-October 2019) 43
Figure 29: Plot showing BOD/COD Ratio in different zones of River Yamuna in study area, Zone A & E
have high ratio suggesting presence of non bio-degradable waste 44
Figure 30: Plot showing variation in TC &FC values across different segment, the red line shows the
permissible limit for the pramaeter set by CPCB 45
Figure 31: Plots showing monthly/ year wise variation of median values for DO,E.C. and Turbidity in
Segments I & II (April 2018 - October 2019) 46
Figure 32: Heatmaps tracing monthly and yearly wise variation of DO in Segment I & II along the stretch
of River Yamuna in Delhi segment (For month of April, August and October for 2018 & 2019) 47

Figure 33: Heatmaps tracing monthly and yearly wise variation of Electrical Conductivity in Segment I & II
along the stretch of River Yamuna in Delhi segment (For month of April, August and October for 2018 &
2019) 48
Figure 34: Heatmaps tracing monthly and yearly wise variation of Turbidity in Segment I & II along the stretch
of River Yamuna in Delhi segment (For month of April, August and October for 2018 & 2019) 48
Figure 35: Plot showing the distribution of Respondents by age and study site ;(n=90) 49
Figure 36: Plot showing the distribution of Responses on educational status by sites and overall (in percent);
(n=90) 50
Figure 37: Plot showing distribution of respondents by occupation (in percent) ;(n=90) 52
Figure 38: Plot showing distribution of respondents by monthly income categories (in percent) ;(n=90) 52
Figure 39: Plot showing distribution of respondents’ HH population by monthly income category (in percent)
;(n=385) 52
Figure 40: Site-wise distribution plot of responses for access to potable water source (in percent) ;(n=90) 54
Figure 41: Site-wise distribution plot of responses for access to latrine facility (in percent) ;(n=90) 54
Figure 42: Site-wise distribution plot of responses for awareness about Household wastewater discharge 54
(in percent) ;(n=90) 54
Figure 43: Box showing distribution of responses for access to the sewage connection ;(n=90) 55
Figure 44: Pictures showing glimpse of Sanitiaion nearby Yamuna area. 56
Figure 45: Plot showing distribution of responses on change in river water quality in last ten years (n=90), &
opinion on type of change (n=56) (in percent) 57
Figure 46: Wordcloud - Respondents word usage for describing water quality of river. 58
Figure 47: Plot showing distribution of responses on periods of the best and worst water quality (in percent)
;(n=90) 59
Figure 48: Plot showing distribution of responses on divine quality of river (in percent) ;(n=90) 60
Figure 49: Plot showing distribution of responses on impact of pollution on divinity of the river (in percent)
;(n=90) 60
Figure 50: Pie chart showing distribution of responses on value of river for community (in percent)
;(n=90) 61

Figure 51: Wordcloud-Solidwaste pollution described by Respondents 62
Figure 52: Plot showing distribution of response on reason of river pollution (in percent) ;(n=90) 62
Figure 53: Pie chart showing distribution of response on impact of pollution on household income
;(n=90) 64
Figure 54: Plot showing income-wise perception on impact of pollution on household income 64
Figure 55: Plot showing occupation-wise distribution of response on impact of pollution on Household
income (in numbers) 64
Figure 56: Plots showing waterborne disease cases reported in Delhi in the last three years(based on Lok-
Sabha reply ) 66
Figure 57: Plot comparing perception on impact of polluted water in general and of river Yamuna water on
health problem(in percent) ;(n=90) 68
Figure 58: Wordcloud-Perception of respondents on Yamuna water related diseases (in last fi ve years) 68

List of Tables
Table 1: Site-wise distribution of respondents (N=90) 29
Table 2: Methodology used to collect primary data for the social study (Feb to April 2019) 30
Table 3: Data for LULC changes in study site (2008 to 2018) 33
Table 4: Zones-wise classifi cation of the sample sites 44
Table 5: Perception of impact of pollution on divinity (Reason) 60
Table 6: Plans to mitigate Yamuna River Pollution ( Yamuna Action Plan (YAP) Launch time and budget
estimates (Kansal n.d.)) 69
Table 7: Communities’ Perception on what should government do to improve the water quality 70
Table 8: Timeline of legal provisions to mitigate water pollution 70

AcknowledgementThis report is an outcome of the study conducted by the Water-to-Cloud project supported by Tata Centre for Development at UChicago. We take this opportunity to thank everyone involved in completion of this study.
This study would not have been possible without the support of Tanvi Mittal, Ankur Kansal, Amit Kumar, Krishnaraj T. and Ardra A. who, as student interns at the Young India Fellowship of Ashoka University, painstakingly conducted the on-ground survey with the riverine community of Yamuna in hot summers of Delhi.
We are grateful for the funding support from Tata Centre for Development (TCD) to carry out the study. We sincerely thank Professor Surajit Sarkar and his research scholars Kartikeya Jain and Nishant Kumar from the Centre for Community Knowledge (CCK) at Ambedkar University for the support provided in identifying the sites for social study and aiding us with lessons from their own experience in conducting the studies around River Yamuna. Additionally, Subhojit Goswami from the Tata Centre for Development has been extremely supportive in editing this report.
We would like to thank Sarala Devi and her son Shyam Bhaiya, residents of Yamuna Ghat who really supported us in connecting with the local residents and conducting interviews. Our sincere gratitude to residents of Yamuna Ghat area, washer-men of Yamuna Khadar East-bank area, farmers of Majanu ka Tila and fi shermen of Wazirabad barrage for their enthusiastic participation in the study. We are happy to have been supported by various laboratories, including Vimta Labs (Hyderabad), Andhra University Labs (Visakhapatnam) and Ecosteps Labs (Noida).

Executive SummaryDeclining water quality has become a global concern as human populations grow, industrial and agricultural activities expand, and climate change threatens to cause major alterations to the hydrological cycle. While much is known about the quality of water in our rivers and the possible sources of pollution, there is little understanding of the socio-economic impact of this pollution, especially on the riverine communities. The limited studies available on this topic miss out on capturing the voices of the local communities who are most affected by river pollution. Keeping this in mind, we undertook a focused social study with 90 members of the riverine communities of River Yamuna in Delhi, which contributes nearly 76 per cent of the pollution load in the River Yamuna.
The study explores local ideas that riverine communities express about river Yamuna, its pollution, and impact on their livelihood and health. It focuses on two ethnographic themes: their perception of the divine quality of the river and causes and impacts of environmental degradation; their perception of impact of this pollution on their health and livelihood and scope of intervention in river-related decision making. Furthermore, we assessed water quality on River Yamuna through lab analysis and sensor-based measurements to correlate it to the socio-economic conditions and seasonal pollution and water quality -related perceptions of the riverine communities. The report attempts to demonstrate the interwoven nature of river water quality, health and livelihood, revealing the way each aspect is related to one another. It also attempts to make a case for a more integrated governance of the river Yamuna.
From February to April 2019, we interviewed 90 respondents through a structured survey questionnaire, semi-structured interviews, and focus group discussions. They represent community of boatmen, fi shermen, washerfolk, divers, priests and farmers. Most of our respondents belonged to the lower strata of society with most of them illiterate or educated only up to senior secondary level, having a household income of less that INR 10,000 and limited access to water and sanitation facilities.
Despite their weak socio-economic backgrounds, most respondents were aware of the negative health impacts of polluted water, but only three out of 10 believed that Yamuna pollution could have such an impact. This discrepancy possibly stems from a belief in the divinity of the river Yamuna for the majority of respondents. Moreover, about half of those who believe that the river has divine quality stated that religious rituals on the whole have decreased over the years due to waning faith and/or increasing pollution.
About one-third of respondents reported a negative impact of river pollution

on their total household income . These respondents were primarily washermen, fi shermen, boatmen and priests. The fi shermen complained that their catch was reduced from what it was 10 years ago and the washermen reported reduction in business from hotels and rich households because of deteriorating water quality in Yamuna. Due to reduction in earnings, the family members of the respondents had to fi nd work as daily wage labour or domestic help in some cases. Most respondents did not want their next generation to be involved in their respective traditional occupations.
On the health front, more than half of our respondents reported that they suffered from some type of gastro-related disease and/or diarrhoea, which are water-borne illnesses, in the last fi ve years. A small percentage of people also reported skin-related diseases possibly due to pollution in River Yamuna. For some respondents, the occasional stink of the polluted river resulted in a feeling of breathlessness. Though this smell doesn’t correlate with any specifi c ailment, it does impact the well-being of riverine communities. Little evidence of any widespread water-borne disease related to water pollution was found, primarily, due to the fact that our studied riverine communities were not dependent on the river for their potable water needs.
Throughout our study area and time period, wastewater drains were identifi ed as a major source of river pollution. A majority of respondents believed that the river had become more polluted. Furthermore, most of them believed that water quality improved in the monsoons and some found summers to be the worst season for river water quality. Interestingly, the water quality data affi rmed people’s perception about the seasonal variation of water quality. It suggests that Delhi’s stretch of the Yamuna is not fi t for drinking or outdoor bathing purposes and rarely meets permissible Sewage Treatment Plant discharge standards. Despite this, some respondents used the river for their daily bath.

Interestingly, our study found that occupation, education, sex, age, and income seem to have little to no impact on how respondents felt about the river, its innate divinity, nor its current pollution levels and scope of their involvement in river cleansing drives. Through focussed group discussions, we observed that participants were eager to be part of river cleaning drives but didn’t know what to do nor how to start. Most of the respondents felt that, as a community, they did nothing or could not do anything to reduce the infl ow of pollution into the Yamuna. They expressed that their options were limited. They could either make a collective complaint to a governing body about drain discharge or ask devotees to reduce the dumping of ritual waste into the river. The key suggestions put forth were to stop the fl ow of drains into the river, increase freshwater fl ow and treat the effl uents/wastewater discharging into the river.
These study helped us draw certain recommendations for the Government based on our interaction with the local communities. Riverine communities are an integral part of the river and they should be contextualised within the river’s ecosystem, especially those who are still involved in traditional occupations. We propose that they should have access to decision-making and policy programmes for an integrated governance of river Yamuna. The riverine community should have easy access to data on water quality and water fl ow of River Yamuna to help them make everyday decisions about their interaction with the River. Making this data available through, for example, digital display boards can help them understand the risks. Further conducting studies to build a deep understanding of health and economic costs of river pollution can help prioritise the need to solve the issue of river water quality which mostly remains neglected.

1. IntroductionRivers have been at the centre of society’s progress. All ancient civilizations of the world fl ourished on the banks of one river or another. As cities developed, rivers, which once were the most important sources of freshwater, became carriers of wastewater. Damming and pollution suggest how, rivers have incurred the cost of hasty economic and technological progress. Most rivers today are suffering from severe organic, inorganic and / or pathogenic pollution along with the low water volume.
A UNEP Report, released in 2016, titled ‘A Snapshot of the World’s Water Quality: Towards a Global Assessment’ estimates that severe pathogenic pollution affects one-third of all river stretches in Latin America, Africa, and Asia. Moreover, severe organic pollution affects one-seventh of these river stretches, and one-tenth are affected by salinity pollution. Increased discharge of wastewater into rivers has been identifi ed as an immediate cause of increasing water pollution (UNEP 2016). In developing countries, about 80 per cent of wastewater gets discharged untreated, ultimately polluting freshwater sources such as rivers, lakes, and ponds (UNESCO n.d.).
In India, only 38 per cent of urban sewage is treated (CPCB, 2015). Moreover, 80 per cent of freshwater sources are polluted (Dey 2015). The two most revered rivers of India— the Ganga and the Yamuna– are no exceptions, despite being considered goddesses by the Hindus (Haberman 2006, Alley 2002). In both 2007 and 2017, the Ganga was listed as one of the world’s top 10 ‘rivers at risk’ (Wong 2007, Sawe 2017).
One of the most polluted tributaries of the river Ganga is the river Yamuna. The pollution of this river has led researchers to declare that
the Yamuna is ‘about to die’ (Misra 2010). Delhi-NCR, the national capital region, generates approximately 76 per cent of the total pollution load in the Yamuna (PTI 2018), effectively turning the river into a ‘sewage drain’ (Datta 1992). Delhi treats about 66 per cent of total sewage generated by its urban area and the untreated sewage mostly fi nds its way into the rivers or other surface water bodies.
Nevertheless, there are many communities for whom the Yamuna remains pivotal to their livelihood and socio-cultural life. On this ‘about to die’ (Misra 2010) river all forms of livelihood continue to depend: farmers still cultivate on the banks, fi sher-folk fi sh, washer-folk wash, boatmen ply their boats and devotees take ritual baths in the waters of Yamuna. There is no dearth of work focusing on the Yamuna’s deteriorating water quality and its negative impact both on biodiversity of the river, and on crops grown by the riverbanks. These studies predominantly deal with the severity of pollution due to wastewater discharge and the occurrence of heavy metals in crops and the adverse impact on human health (Ramachandran 2016, Toxic Link 2014, Malik 2014 , CPCB 2019).
Further, rivers connect diverse aspects of socio-economic life to one-another and the intricacy of this connectivity is the result of complexity in the social organizations (Hannerz 1992 ).
That is why rivers are shaped not only by hydrological cycle, but are also de-shaped and reshaped by socio-cultural and political interventions and become a part of hydro-social cycle contesting the idea of nature- culture dichotomy. Thus, deteriorating water quality of rivers has not only posed a threat to the river biota but has also affected river-dependent communities. However, most of the conformist

version of environmentalism has put onus of river water pollution largely on the people who are dependent on it, subsequently has led to coercive socio-economic change along the river (Jain 2009, Baviskar 2011).
While there are studies that discuss the livelihood, challenges faced by the fi sher community because of river water pollution or the introduction of invasive species (Singh 2014), other riverine communities such as boatmen, fl orists, divers, farmers, washer-folks and priests have not garnered much attention of the researchers. This study attempts to contribute in the understanding of diversity of riverine communities and challenges faced by them due to river water pollution by correlating river water quality with the socio-economic factors that affect these riverine communities.
The study is centred around Delhi’s urban stretch of the river Yamuna. Under the Water-to-Cloud (W2C) project, a series of water quality measurement experiments are being conducted on Yamuna since April 2018 to collect data using multiple sensors to assess the water quality of the river1. In conjunction with spatially mapping water quality and identifying pollution hotspots, social research to estimate the impact of pollution on the livelihoods and health of various riverine communities is needed. Thus, a pilot study was designed and conducted from February to April, 2019. Riverine communities have been defi ned as those living within 500 metres of the riverbanks, and/or people who are directly or indirectly interacting with the river water on a regular basis.
Objectives:
The following objectives were defi ned to understand what the Yamuna means for riverine communities and how they are impacted because of river pollution.
a. To spatially map the Yamuna’s water quality in real-time using sensor technology.
b. To study the impact of river water quality on the livelihoods and traditional occupations of riverine communities.
c. To study the impact of river water quality on the health of riverine communities.
d. To study the scope of ‘riverine communities’ participation as decision-makers in public policy processes, given that they are key stakeholders.
The fi rst part of this study assesses river water quality by analysing quantitative data collected from the W2C project. The second part of this study assesses the impact of river water quality on livelihood and health of various riverine communities through a social survey and ethnographic study at specifi c sites along the nine km of the Yamuna’s upper urban stretch in Delhi.
The fi rst section of this report deals with objectives and study areas. The second section discusses the methodology used to collect data on water quality of the Yamuna, as well as the methodology used to conduct the socio-economic study of the riverine communities. In the third section, fi ndings of the water quality experiment and socio-economic study have been discussed. The fourth, and the last, section of the report refl ects upon key learnings and suggests policy recommendations.

1.1. Setting the Context
Yamuna meanders through Palla village in Delhi. The total stretch of the river in Delhi is about 48 km (from Palla to Okhla barrage), however, it is the 22 km-long urban stretch from Wazirabad
barrage (15 Km D/S to Palla) to Okhla barrage that has been identifi ed as one of the most polluted stretches of the river (PTI 2018).
Figure 1: Map showing the study area on River Yamuna in Delhi

1.1.1. The River and the City: Woes of Yamuna
In the last 10 years, various studies have reported the presence of heavy metals in crops and vegetables that are grown on the banks of Yamuna or have been irrigated with water of Yamuna (Toxic Link 2014, CPCB 2019).
High pollution loads have resulted in critically low levels of dissolved oxygen at certain places in the Yamuna, making it diffi cult for native
species of fl ora and fauna to survive (Sharma 2014). Moreover, invasive species create further competition for survival (Singh 2014). Analysis of secondary data shows that in spite of two Yamuna cleaning programmes in the last 25 years, Yamuna Action Plans I & II, there has been no signifi cant change in the quality of the river’s water.
Sl. No.Wastewater Generation
and TreatmentStatus
1 Un-sewerage area2 50per cent
2 Total wastewater generated 3268 MLD
3Total available Treatment capacity3 2756 MLD
4 Wastewater being treated 2083 MLD
5 Untreated sewage discharge 1185 MLD
6 No. of STP installed3 41
7 No. of STP operational3 34
8. Unauthorised colonies4 1797
9 Unauthorised colonies with no sewer network4 1413
T-MAP of drains along YamunaStudy area2
Figure 2: Illustration of drains and the quantity of waste water owing in Yamuna using T-Map

Figure 3: Plots showing changes in di erent water quality parameter (DO,BOD and Total coliform) for last 30 years for River Yamuna(Comparing with outdoor bathing5 standards of CPCB)
0
1
2
3
4
5
Years
Change in Dissolved oxygen (Outdoor Bathing limit >5 ppm)
DO Minimum Permissible Value (CPCB)
0
5
10
15
20
25
30
Years
Change in BOD (Outdoor Bathing limit < 3 ppm)
BOD Permissible Range (CPCB)
0200000000400000000600000000800000000
1E+091.2E+091.4E+09
Years
Change in Total Coliform (Outdoor Bathing limit < / = 500 MPN)
Total Coliform Maximum Permissible value

1.1.2. The Study Area
For the purposes of this analysis, Delhi’s urban stretch of the river Yamuna has been divided into seven segments, from Wazirabad Barrage to Okhla Barrage.
Segment 0 starts at Wazirabad Barrage and ends at Signature bridge. This stretch has been excluded from W2C fi eld experiments due to logistical constraints of reaching this area. However, it is a crucial area for the purpose of
Figure 4: Map showing di erent segments of River Yamuna in the urban stretch (Delhi): Wazirabad Barrage to Okhla Barrage
Segment-0 Wazirabad Barrage to Signature Bridge
Segment-I Signature Bridge to Yudhister Bridge
Segment-II Yudhister Bridge to Old Iron Bridge
Segment-III Old Iron Bridge to ITO Barrage
Segment-IV ITO Barrage to Nizamuddin Bridge
Segment-V Nizamuddin Bridge to Okhla Bird Sanctuary
Segment-VI Okhla Bird Sanctuary to Okhla Barrage
socio-economic study as fi shermen communities in this area regularly interact with the Yamuna.
Segment I start at Signature bridge and ends at Yudhister bridge. This segment captures the opening of Najafgarh drain into the west side of the Yamuna. Satellite images show murky black water where the drain enters. Along the west bank, downstream of Najafgarh drain, there is some agricultural land use.

Photo Credit: Nutan Maurya
Figure 5: Picture showing discharge of Najafgarh drain in the River Yamuna near Wazirabad Barrage
Segment II starts at Yudhister Setu and ends at the Old Iron Bridge. The east bank of the river in this stretch is under cultivation.Along the west bank, there are 32 ghats (built-up areas for the ritual purpose) in this stretch. These ghats are numbered from 1 to 32, and are key places to gather during festivals, especially when believers of Hinduism congregate at these ghats to access bathing points in the Yamuna. Underneath Ghat No. 1, the Chandni Chowk drain falls directly into the Yamuna.Just downstream of Yudhister Setu, there is a Hindu cremation site where ritual waste related to last rites is discharged into the river.
Segment III starts at Old Iron Bridge and ends at ITO barrage. On both east and west banks of the river along this stretch, agriculture fi elds can be seen with intermittent fallow lands. We found that whenever the Wazirabad barrage gates remained closed, water levels in this stretch of river went too low for W2C team to collect data.
Segments IV and V are from ITO barrage to
Nizamuddin Bridge and from Nizamuddin Bridge to Okhla Bird Sanctuary, respectively. These two stretches have important drains opening into the river such as Indraprastha Power Station drain and Barapullah drain. However, due to the low levels of water, it was diffi cult for W2C team to collect data in these stretches.
Segment VI is the last stretch taken into consideration, from Okhla Bird Sanctuary to just downstream of Okhla Barrage, after which the river enters Uttar Pradesh. Due to logistical challenges, the W2C team did not conduct any experiments in this stretch.
The socio-economic and public health study was conducted at four sites: Wazirabad barrage, Majanu ka Tila (New Aruna Nagar), Yamuna Khadar East Bank (Usmanpur), and the Yamuna Ghat Area along the lower segment of the upper stretches, Segment 0 to Segment II.These sites were selected primarily for three reasons. Firstly, extensive data had already been collected by the W2C team in these stretches.

Figure 6: Satellite image showing the Najafgarh drain discharge point & point sampling sites
Secondly, potential respondents of the riverine communities live and work in these stretches and lastly, there is a major source of pollution - Najafgarh Drain - at the end of Segment 0. Najafgarh drain contributes about 40% of the total pollution to the river.
Najafgarh drain’s discharge point marks the difference between upstream and downstream sites of social study. Wazirabad Barrage (WB)
area, a site in the ‘clean’ river stretch, is located upstream of the drain. Majanu ka Tila (MKT), Yamuna Khadar East Bank (YKEB) of Usmanpur, and Yamuna Ghat Area (YGA) of Kashmiri Gate, the sites in the ‘polluted’ river stretch, are situated downstream of the drain.
The water samples collected from upstream and downstream of Najafgarh drain showed stark difference in the water quality of the river.

Figure 7: Plots of di erent River water quality parameters at various sites in Upper urban stretch of River Yamuna(Delhi): Before and a er Najafgarh drain discharge (Sampling date: 19/03/2019)
0 00
2
4
6
8
10
12
River(Wazirabad Barrage)
Sonia Vihar Drain (Wazirabad Barrage)
Waste water Drain (Majanu ka Tilla)
River(Majanu ka Tilla)
SAMPLE SITES
Variation of Dissolved Oxygen (DO) level at different sites
AfterBefore
0.00
0.50
1.00
1.50
2.00
River(Wazirabad Barrage)
Sonia Vihar Drain (Wazirabad
Barrage)
Waste water Drain (Majanu ka Tilla)
River(Majanu ka Tilla)
SAMPLE SITES
Variation of Electrical Conductivity (EC) level at Different Sites
AfterBefore
0200400600800
10001200
River(Wazirabad Barrage)
Sonia Vihar Drain (Wazirabad
Barrage)
Waste water Drain (Majanu ka Tilla)
River(Majanu ka Tilla)
SAMPLE SITES
Variation of Chemical Oxygen Demand (COD) level at different sites
AfterBefore
0500
1000150020002500
River(Wazirabad Barrage)
Sonia Vihar Drain (Wazirabad
Barrage)
Waste water Drain (Majanu ka Tilla)
River(Majanu ka Tilla)
SAMPLE SITES
Variation of Biochemical Oxygen Demand(BOD) level at different sites
6
AfterBefore

This site is located upstream of Najafgarh drain and lies in Segment 0. Surya Ghat, adjacent to Wazirabad Barrage, is the site of a Shiva temple where we observed devotees performing rituals for relatives who had passed away.This area was selected to identify respondents from the fi shing
community. However, since the barrage gates were open during the entire study period, it was diffi cult to fi nd fi shermen who were fi shing in such fast-fl owing waters. Most of the fi shermen had found alternative employment as labourers in the construction and agricultural sectors.
A. Wazirabad Barrage (WB)
B. Majanu Ka Tila (MKT)
The site is located downstream of Najafgarh drain, in Segment I. This area, also known as New Aruna Nagar, is popular for the resettlement of the Tibetan refugees. The Yamuna fl ows through the backside of the colony. In the river’s fl oodplains, farmers are involved in agricultural activities.We were told that the cultivated land
was disputed land between the farmers, the Delhi Development Authority and the Forest department.Upon further enquiry, we found that the land was owned by the farmers of Jagatpur and that other farmers from various districts in eastern Uttar Pradesh had migrated there around 1982, taking the disputed land on lease for cultivation. All 15 households of the farmers living in the area were surveyed.
Figure 8: Picture of shermen at Wazirabad Barrage
Figure 9: Picture of a Farmer packing produce to sell in market near Majanu Ka Tila
Photo Credit: Nutan Maurya
Photo Credit: T. Krishnaraj

The site is situated further downstream of Majanu Ka Tila and under the Yudhister Setu on the east bank of the river. This area in Segment I is one of that places at the bank of river Yamuna where washer-folks do their laundries.This site was selected to procure responses from the
C. Yamuna Khadar East Bank (YKEB)
Usmanpur
D. Yamuna Ghat Area
This site in Segment II is situated on the west side of the river further downstream of YKEB. There are 32 bathing ghats in this area, separated from the rest of the city by a wall running parallel to the river, at a distance of approximately 500 metres. The access to the ghat area is through built-in staircases at various points. At ghat no. 30, we noticed a storm drain carrying wastewater running parallel to the ghat walls, discharging into Chandni Chowk drain, which eventually infl ows
washer-folk community, who come from various places to do laundry. None of the washer-folks interviewed lived in surrounding areas. All washer-folks previously worked in the Dhobi Ghat area and lived in the Yamuna Pushta slums, only moving post the demolition of the area in 2004.
Figure 10: Picture of Washer-folks at Work in Yamuna Khadar East Bank
Photo Credit: Nutan Maurya
into the Yamuna by ghat no. 1.Ghats, and the surrounding areas, are owned and maintained by the families who assist devotees with rituals and charge them for the same.Approximately 68 per cent of the total respondents were residents of the Yamuna Ghat area. We surveyed boatmen, priests, swimmers, fl orists, vendors, rag pickers and others who reside in the nearby areas stretching from ghat no. 1 to 32 as well as the Nigambodh Ghat (Hindu cremation site).
Figure 11: Picture of Yamuna Ghat Area
Photo Credit: Amit Kumar

2.MethodologySites for the socio-economic study were identifi ed based on the availability of regular data collection via the ongoing W2C project, as well as the availability of potential respondents engaged in riverine activities and occupations.
2.1. The Span of Study
2.2. Water Quality Measurements
2.2.1. Water-to-Cloud Methodology
To examine the impact of river water quality on health and livelihood of the riverine community, the research team conducted a study for a period of three months (Feb-April 2019).For this study, water experiment data from April 2018 to October 2019 has been selected. The rationale behind selecting this period is the availability of water experiment data for all the months.After selecting the sites for socio-economic study, the last 10 years’ (2008-2019) data on the change in land cover and land use was collected for the said sites.
The Water-to-Cloud approach involves collecting water quality data at high geospatial resolution using automated, real-time, non-stationary, state-of-the-art cyber physical sensor networks. These sensors can collect GPS-tagged and time/ date-stamped data every few seconds on various water quality parameters. These sensors are deployed on a boat which navigates a pre-defi ned route in the water body and collect hundreds of data points over space and time. This high-resolution data is superimposed on geospatial maps using a color-coded scale to form visualizations which are easy to interpret and assess various aspects of river water health. In particular, they can be used to pinpoint pollution sources, analyze temporal and spatial variations in contaminant levels and identify trends in water quality.
Figure 12: Illustration of Water-to-cloud methodology
For this study, we have used data collected with sensor technology on real-time basis, what we
call the Water-to-Cloud approach, along with the conventional method of lab-based water quality measurements.

A. Site and Route selection
B. Parameter Selection
The Delhi stretch on river Yamuna is chosen to be studied since it is the most polluted. The specifi c route chosen for data collection using sensors is marked to include all point and nonpoint sources of pollution entering the river including domestic wastewater drain outlets, industrial outlet points, solid waste dumping sites and centres of domestic or religious activities such as cremation sites, washing clothes, offering fl owers, fruits and grains. This provides an overall picture of total waste and wastewater being discharged into the river.
Under W2C, parameters are selected as per the CPCB guidelines for major pollutants6.
• General pollutants - temperature, pH, electrical conductivity (EC), dissolved oxygen (DO), turbidity, and total dissolved solid (TDS).
• Demand based Parameters: Biochemical Oxygen demand and Chemical oxygen demand.
• Inorganic ions including heavy metals.
• Microbiological parameters: Total coliform and faecal coliform.
2.2.1. Data Collection Methodology
Real-time sensors such as Hanna HI9829 and C3 -turner are used to collect data for physico-chemical parameters such as, pH, Turbidity, Electrical Conductivity (EC), and Dissolved Oxygen (DO). These sensors are GPS enabled, collecting data at an interval of 10 seconds. Organic parameters such as Chlorophyll-a, Tryptophan, and Colour Dissolved Organic
C. Monitoring Frequency
D. Scope of the Study
From April 2018 to October 2019, two boat ride experiments were conducted per month in the upper stretches of the Yamuna (Segment I & Segment II). On the second boat ride of the month, a set of water samples was also collected for lab testing. Included in this lab testing was a screening for trace metals6.
Segments I & II, from Signature Bridge to Yudhister Setu and from there further down to Old Iron Bridge had adequate water levels throughout the year and sensor data was available. From the Old Iron Bridge to ITO Barrage, in Segment III, the W2C team conducted experiments only when the volume of water was adequate. This region has drastic variations in slope and elevation due to sedimentation undulation, which has led to non-uniform sinkhole development. This is why uniform fl ow velocity can be observed at the surface.
In Segment IV and Segment V, from ITO barrage to Nizamuddin bridge and from Nizamuddin bridge to Okhla bird sanctuary area, we had to rely on the water’s volume when deciding on experiment days. Thus, it was only possible to collect data in the post-monsoon months, from September to November.
Matter (CDOM) are also measured via these sensors6.
All the data collected via sensors is curated and consolidated in CSV fi les, which are uploaded onto the website, where the data is visualized using various colour-mapping techniques.

2.2.2. Grab Sampling
2.2.3. Data Analysis
Additionally, laboratory-based point sampling was also done in April 2018 and October 2019, to measure parameters that cannot be measured using sensors such as Bio-chemical Oxygen Demand (BOD), Chemical Oxygen Demand (COD), Total Coliform (TC) and Faecal Coliform (FC). Trace element testing is also done for certain trace elements.
After retrieving data from both the sensors, a consolidated fi le of the same is created. After correcting sensor errors, a combination of various software and programming languages including Excel, R, Python and SPSS (Statistical Package for Social Science) are used to implement various analysis techniques such as: predictive modelling, colour-mapping, clustering, and descriptive statistical summaries.
Data collected through point sampling is also analysed using same software and programming languages.
Figure 13: Picture of water quality data and sample collection in the River Yamuna
Photo Credit: Nutan Maurya
2.3. Socio-economic study of the Riverine Communities
To study the impact of water quality on livelihoods and health of riverine communities, a team of six researchers used primary and
Figure 14: Schematic Diagram describing the socio-economic study process
secondary social research methods to collect relevant qualitative and quantitative data.

2.3.1. Primary method of data collection
We undertook fi eldwork from February to April 2019 at the aforementioned, selected sites. The primary research was conducted through fi eld observations, a structured survey questionnaire, semi-structured in-depth interview schedules, and focus group discussions with key stakeholders from the riverine communities.
Post data collection, responses were mapped to build a thorough understanding of the demographic profi les of our respondents, with a focus on access to housing and water, sanitation and hygiene (WASH).
Sample Selection
Respondents were those who were either working or living within 500 metres of the riverbank. The Stratifi ed Snowball sampling method was applied to select respondents7.With the help of key informants, 90 responses were collected. Oral consent from respondents was taken prior to administering the survey, and participation was voluntary.
Site Male Female Total
Wazirabad Barrage (WB) 7 1 8
Majnu ka Tila (MKT) 12 5 17
Yamuna Khadar East Bank (YKEB) 4 0 4
Yamuna Ghat Area (YGA) 45 16 61
Grand Total 68 22 90
Table 1: Site-wise distribution of respondents (N=90)
B. In-depth Interview Schedules
In-depth interviews were conducted with informal representatives of various occupational groups and one environmental activist to fi ll any gaps in the information collected through the survey questionnaire, as well as to better understand challenges faced by these riverine communities.
Tools for Data collection
A. Survey Questionnaire
A detailed survey questionnaire was designed after conducting a thorough literature review. The structured survey questionnaire was orally administered to the selected respondents
C. Focus Group Discussions (FGDs)
The FGDs explored people’s awareness of existing water pollution mitigation programmes and opportunities for people directly dependent on the river for their livelihoods, their understanding of river pollution and its causes, and their agency in addressing river pollution. In total three FGDs were conducted; we could not conduct FGD at Yamuna Khadar East Bank area.
to collect socio-economic and health related information of boatmen, washer-folks, fi shermen, fl orists, farmers, priests, street vendors, and residents living or working in the vicinity of the river (within 500 metres). Along with demographic information, the survey questionnaire also captured respondents’ perception of current water quality, its impact on their livelihood and health and their role in mitigating pollution in the river (see appendix I).

2.3.2. Secondary method of data collection
Available relevant literature was reviewed to understand the major debates and concerns related to the river water pollution. While there is no dearth of literature on assessment of pollution in river Yamuna, very few studies are available that investigate the impact of this pollution on the livelihoods and health of the riverine communities. Works related to socio-economic impact of the river pollution have been reviewed to understand how various discourses related to polluted water bodies have constructed and de-constructed the opportunity and challenges for people in general and for the riverine communities in particular.
Reports and other works related to the river pollution and invasive species and their impact on native fl ora and fauna have also been reviewed. Reports released by government bodies, such as CPCB, CFRI, NGT monitoring committee, etc and non-government organisations, such as Toxics link, were reviewed.
Method RespondentsN
(Responses)
SurveyRiverine communities: boatmen, priests, fl orists, farmers, fi sh-er-folks, washer-folks etc.
90
In-depth Interviews Priest, boatman, fi sherman, washer-folks and environmentalist. 5
Focus Group Discus-sions (FGDs)
Farmers (at Majanu ka Tila), fi shermen (at Wazirabad barrage) and residents (at Yamuna Ghat) directly interacting with the river.
15 (from 3 FGDs)
Table 2: Methodology used to collect primary data for the social study (Feb to April 2019)
2.3.3. Data analysis
After collecting data via survey questionnaire, a consolidated fi le was created. All the in-depth interviews and FGDs were transcribed and fi eld observations were reported. After the curation and correction of the data, analysis is performed. A combination of various software and programming languages including Excel, R, JMP (Statistical Analysis Software) and SPSS (Statistical Package for Social Science) were used to calculate odds ratios and descriptive statistics for the survey responses.

Secondary data- Landsat 4-5 (TM) and Landsat 8 data, which has a resolution of 30 metres from USGS Earth Explorer has been used for LULC. Landsat data was used as it is freely available and is updated at regular intervals. Yearly data for the month of September, from 2008 to 2018 was used, granted there was < 10 per cent cloud cover, to capture the hydrological variability of the Yamuna and change in LULC pattern in the last 10 years.
2.4. Land Use Land Cover (LULC) Data
2.5. Limitations of the Study
• Given the limited time and resources, the study results are based on responses of 90 members of various riverine communities at four fi eld sites within Delhi, which pose a limitation in making any bold claims as part of result outcomes.
• Due to the constantly open barrage gates throughout the fi eldwork period, responses from the fi shing community are fewer than
Figure 15: Picture of eld Exploration, Establishing Rapport and Data Collection at di erent sites
Photo Credit: Nutan Maurya & Tanvi
initially designed for, as in high fl ow it is diffi cult to catch fi shes.
• There is a lack of systematic data related to river water pollution and its impact on the livelihoods and health of the riverine communities of Delhi. Some datasets are available but for different time spans, making it diffi cult to temporally compare and contrast the socio-economic status of riverine communities.
• Reduced water volume in lower stretches led to shorter boat rides and lesser sensor data.
• Due to weather conditions and other logistical challenges, we were not able to conduct boat rides throughout all segments for every month. The frequency of data collection was not systemized due to dependency on external factors such as boat availability and fl exibility in boatman’s schedule, resulting in different data points per season.

3.Findings3.1. LULC change in the last 10 years (2008 vs 2018)
Our sites for social study are situated along the upper segments of the river from Wazirabad Barrage to Old Iron bridge. All the four sites are part of Central Delhi district (Figure 16).
In their study on district-wise changes in land use and land cover in Delhi during 2008 - 2012, Pattanayak and Diwakar (2016), have found that Central Delhi district8 has experienced maximum decrease (24.9 per cent) in agriculture land cover and maximum increase in built-up area cover (16.6 per cent), and water body cover (5.4 per
cent) in comparison to other districts of Delhi.
To understand the change in the landscape of survey sites, we analysed change in land use and land cover for the last 10 years. For this purpose Digital Elevation Model (DEM) fi les describing land cover and land use patterns from 2008-2018, and within a 5-km radius of the survey sites, were collected from the United States Geological Survey (USGS) Earth Explorer, and analysed. We used Supervised Classifi cation method to classify the images.
Figure 16: Satellite image pointing out the survey sites and LULC study area (For LULC study 5 km radius of river area was considered that includes the survey sites as well)
Pattanayak and Diwakar have identifi ed the district as North Delhi District

In 10 years (2008 -2018) the number of drains in the study area has increased and Land Use and Land Cover pattern has changed.
The river’s water body (coverage area in terms of width) has shrunk by 24.4 per cent. The built-up area has expanded by 6.62 percent. In the last 10 years the green area around the riverbed has decreased by 54.27 per cent whereas the bare-land has increased by 50.4 per cent.
This could be associated with the decrease in forest area and agricultural activities along this stretch of the river.The pressure of urbanisation on the Yamuna can be seen in terms of increased urban built-up area. This has resulted in the greater number of wastewater drains discharging into the Yamuna.
Figure 17: Plot showing LULC pattern change in a decade (2008 V/s 2018)
Water Bare land Vegetation Urban/Built-up area
2008 (area in Sq.Km) 18.05 159.25 323.13 233.01
2018 (area in Sq .Km) 14.50 321.15 147.75 249.54
Change (percent) -24.4 50.4 -54.27 6.62
Table 3: Data for LULC changes in study site (2008 to 2018)

Figure 18: Satellite images showing change in LULC Pattern & Number of Wastewater Drains- 2008 vs 2018 (along the Segment-I & II stretch of the river Yamuna),two images in rst row shows change in numbers of drains and the second rows
images shows changes in di erent land use over a decade
A. Satellite Image showing major drains back in 2008
C. LULC status in 2008 D. LULC status in 2018
B. Satellite Image showing major drains in 2018
Water
Bareland
Vegetation
Urban/Built-up area
Water
Bareland
Vegetation
Urban/Built-up area

3.2. River Water Quality
3.2.1. Findings of the Real time experiments As mentioned above in methodology chapter, we are using sensor technology to measure the pH, DO, EC, turbidity and temperature in the river Yamuna. Analysis of our real-time experiment data helps us infer that river does not have steady ecosystem to support various kinds of aquatic organisms. Throughout the study period, average dissolved oxygen (mean value) was below 3 ppm, which is much lower than the CPCB standard limits for outdoor bathing (more than 5 ppm) and for survival of the aquatic life (more than 4 ppm)9. We did record exceptionally high DO values (8-10 ppm) at certain point in some of the experiment rides, but that was because of two reasons- clean water, at the east-bank side of the river in the upper-stretch of segment I; second, sometimes due to shallow water area
sensor came-out of the water and took readings of the air, for instance, in segment II, IV and V. Similarly, pH was recorded within the range of 6.5 to 8.5 throughout the river. However, exceptionally higher values were recorded in the segment V, showing much higher alkalinity at certain points. Electrical conductivity was recorded within the limits, in terms of prescribed standard for irrigation (Max 2250 µS/cm). Though there is no defi ned standard limit for Turbidity for outdoor bathing or survival of aquatic organism, but its value shows the extent of dissolved and suspended matter in the water. Mean turbidity values were recorded in the range of 50 to 100 FNU.
The four charts (Figure 19-22) capture the variations in dissolved oxygen, pH, electrical conductivity and turbidity across 5 segments of river Yamuna.
Figure 19: Box plots showing segment-wise variation in Dissolved Oxygen values in the river Yamuna (Delhi) along with box plot description (April 2018 - October 2019)

Figure 20: Box plots showing segment-wise variation in pH values for the river Yamuna in Delhi (April 2018 - October 2019)
Figure 21: Box plots showing segment-wise variation in Electrical Conductivity values for the river Yamuna in Delhi (April 2018 - October 2019)
Figure 22: Box plots showing segment-wise variation in Turbidity values for the river Yamuna in Delhi (April 2018 - October 2019)

Seasonal variation in fi ve segments
A. Dissolved Oxygen (DO)
Dissolved oxygen refers to the level of free, non-compound oxygen present in water or other liquids. This free oxygen is necessary for aquatic fl ora and fauna. It is an important parameter for assessing water quality because it is essential for the survival of aquatic organisms.Microorganisms use DO to decompose organic matter and contribute to nutrient recycling. If there is an excess of decaying organic matter in the system, oxygen demand will increase, creating anoxic conditions in the water system.
For the water experiment period (April 2018 to October 2019), it is observed that most of the time the median DO value for the studied stretches of Yamuna remained in the range of 0.0 ppm to 3.75 ppm.
The data shows that DO values slightly improved during the monsoon and post-monsoon periods of 2018 in comparison to that of summer, in all segments. In the summer season of 2019, the DO in segment I was recorded as 3.75 ppm, which was far better than that of 2018. However, a drop in DO is recorded in the post-monsoon
period of 2019, unlike that of 2018 (Figure 23).
We have observed that when barrage gates were open, the river has increased freshwater fl ow and the concentration of DO improves marginally near the east bank of the river for Segment I, near the signature bridge only (as Najafgarh drain discharge gate is just opposite, on the west-bank of the river). We have also observed and measured that when gates are closed, fl ow velocity reduces to 0 m/s at the surface. The resultant stagnant river records very low or no DO.
The water quality data shows that despite the freshwater release, the river system fails to revive or improve its dissolved oxygen concentration because of intermixing of the wastewater coming from Najafgarh, Majnu Ka Tila, Gurudwara, and Chandni Chowk drains. These drains discharge directly into the Yamuna. Their impact on the river is observed in terms of a sudden drop in DO values near the drains.
The graph (Figure 23), also indicates how
Figure 23: Plot showing segment-wise seasonal variation of Dissolved Oxygen (Median values) of the river Yamuna in Delhi (April 2018 - Oct 2019)

DO levels are lower than CPCB standards for outdoor bathing and aquatic system survival. A DO defi cit also results in slower decaying of organic matter, leading to the development of sludgy masses and a rotten smell (W2C team observation). Prolonged exposure to low dissolved oxygen levels (<5–6 ppm) may not directly kill an organism, but it would increase its susceptibility to other environmental stresses. Exposure to <30 per cent DO saturation (<2 ppm) for one to four days can kill most of the biota in a system (Gower 1980).
B. Electrical conductivity (EC)
Electrical conductivity is used to measure the concentration of ions present in water. It measures the mineral salt content of water. A slight change in water quality due to natural fl ooding, evaporation or man-made pollution is refl ected in its values.In case of Delhi, it is observed that most of the time electrical conductivity lies in the range of 500-1500 µS/cm. These values get diluted when fl oodgates are open at Wazirabad Barrage (Figure 24).
In early months of 2019, the Wazirabad barrage gates were opened on a regular basis, effectively reducing EC values and diluting pollution in segment-I and II. The graph (Figure 24) above indicates that Segment II, had higher EC concentration in comparison to Segment I. EC values in Segment I (primarily towards the east-bank side) were diluted due to freshwater released from Wazirabad barrage.However, the wastewater discharged from the Najafgarh drain, which opens at the western side of the river, gets intermixed with this freshwater and increases the EC values in segment -II.
W2C team reported that they could still smell something rotten while traveling close to the river, and associated it with the probable production of hydrogen sulphide gas from slow decaying of organic matter in the river system.
Figure 24: Plot showing segment-wise seasonal variation in Electrical Conductivity (median values) of River Yamuna in Delhi (April 2018 - Oct 2019)

C. Turbidity
Turbidity indicates presence of suspended particulates and dissolved coloured material because of which water loses its transparency an opaque, hazy or muddy appearance.Turbidity and water fl ow are causally related (G. Gö ransson 2013). As turbulent fl ow increases, so does turbidity because particles remain suspended or are stirred up from the waterbed. Weather, particularly heavy rainfall, runoff from the catchment area with high suspended solids, affects water fl ow, which in turn affects turbidity.
From 2018 to 2019 (Figure 25), we noticed high variation in Turbidity values, especially during the monsoon. Moreover, segments I
& II consistently show variation in Turbidity values, almost 3-4 times higher turbidity in 2018 compare to 2019, most likely due to the effect of construction debris of the Signature bridge, which was lying there in 2018.
All the parameters measured with sensor technology indicate that water quality of the studied stretch of river was worse in summer 2018 than that of 2019. However, EC and DO indicate improvement in values in monsoon of both the years. It could be related to the rain and subsequent increase in water volume and fl ow in the river.
Figure 25: Plot showing segment-wise seasonal variation in Turbidity (Median values) of River Yamuna in Delhi(April 2018 - Oct 2019)
3.2.2. Findings from Point Sample Analysis
Trace element analysis was performed for the months of April 2018 and October 2019 for different stretches. During our socio-economic study, we observed that river water is being used in the agriculture fi elds for irrigation purpose.
A. Trace element Analysis:
Heavy metal toxicityHowever, none of our respondents claimed to drink river water. Some did maintain that they regularly took bath in the river; also, there are boatmen, washer-folks and fi shermen regularly interacting with the river. Thus, to estimate the risk of illness in these communities we have analysed the heavy metal toxicity in the river water.

Studies have shown that there is always a chance of ingestions of river water by the people interacting with the river. In their research study on ‘Water ingestion during water recreation’ Dorevitch et al. (2011) have shown that varying level of water ingestion occurs during recreational and other water related activities. In a review article, Russo et al. (2020) have shown that recreational activities, such as swimming and other water sports, in the surface water may pose risk of illness.
The long- term exposure to these trace metals may pose a risk to human health— such as carcinogenic As and Cr, chronic kidney disease (CKD) causing Cd and Pb (Orr et al., 2017). Though some metals, such as Fe, Cu, Ca, Mn, Mg and Al are crucial for normal body growth, an overdose could have an adverse effect on health, such as renal failure, adverse effect on the central nervous system and deformity of bones, etc (Orr et al., 2017).
The analysis of April 2018 shows highly concentrated values for trace elements in Yamuna water during its lowest water quantum as compared to the analysis of October 2019. During October 2019, barrage gates were regularly opened.
Lab results of trace elements have shown that
Cr, As, Ni, Pb, Cd, Mn, Fe, Cu and Al were violating the permissible drinking standards limit prescribed by the Bureau of Indian Standards (BIS, 2015). Iron levels were consistently high (449-2485 ppb) throughout the study as compared to BIS permissible limit for drinking water (300 ppb). Within the infl uence zones of Najafgarh and Chandni Chowk drains, trace elements were in complete violation of the BIS permissible drinking water limits. Only copper and zinc levels were within permissible limits (For values please refer to Appendix III).
As mentioned earlier, no one was found using river water for drinking purpose. We observed water lifting pump installed with a long pipe immersed in the river for the irrigation purpose. Lab results indicate that Cadmium, Manganese, and Copper violates long-term irrigation standards (Figure 26), while only Cadmium violates short-term irrigation standards, as prescribed by the BIS (for values see Appendix III).
Higher values for Cadmium and Copper were reported in October 2019, mainly near the Najafgarh drain, i.e. in segment I and II, whereas higher traces of Manganese could be seen all through the river and in both the sampling months. Najafgarh drain discharge could be a source of these heavy metals in the river water.

Figure 26: Maps showing hotspots where Trace Elements are violating long-term irrigation standard (All segments)

B. Biochemical Oxygen Demand (BOD) &
Chemical Oxygen Demand (COD) toxicity
Requirement of oxygen for degradation of the organic matter by organisms is measured as Bio-chemical Oxygen Demand (BOD). The amount of oxygen required biologically to stabilise the organic waste aerobically at a stated temperature and in a specifi ed period is measured as BOD. Essentially, BOD is the consumption of oxygen by organic matter. The degradation of BOD releases nutrients (NH4-N) that can be further oxidized, giving rise to additional oxygen consumption (Radwan et. al, 2010).
Similarly, oxygen required to break down inorganic waste at a particular temperature, and during a given time period, is measured as Chemical Oxygen Demand (COD). COD and chemical / inorganic pollution are positively correlated, meaning higher levels of COD indicate the presence of higher amounts of chemical or inorganic pollution.
Throughout the river, a complete violation of BOD & COD standards was observed. The Yamuna is clearly not up to the CPCB standards for outdoor bathing.
The following graphs (Figure 27 & 28) show that COD values are higher than BOD in all the fi ve segments, meaning, there is relatively more chemical / inorganic pollution than organic pollution. Despite the fact that most of the drains are under the category of domestic wastewater drains, hey still seems to carry higher chemical / inorganic pollution, as indicated by the relatively higher COD values. For instance, Chandni Chowk drain (in segment II), which not only carries domestic wastewater, but also the market wastewater, which might have various non-point sources of harmful chemicals from the different segments of the area.
Figure 27: Plot showing di erent COD values throughout ve Segment of River Yamuna in Delhi(April 2018-October 2019)

Throughout the river, COD levels are mostly under the permissible limit of 250 ppm, while BOD more frequently violates the standard limits prescribed by the Ministry of Environment, Forests and Climate Change (MoEF&CC)’s
effl uent discharge standards10.However, as per CPCB protocol of polluted river stretches, segments I, II and III fall under the priority 1 category as BOD values are more than 30 ppm 11.
Figure 28: Plot showing di erent BOD values throughout ve Segment of River Yamuna in Delhi(April 2018-October 2019)
C. BOD-COD Ratio Analysis
The BOD/COD ratio helps to identify waste as organic / inorganic and categorizes it into levels of biodegradability. For further benchmarking as per the effl uent discharge standard under the MoEF &CC-for BOD is 30 ppm and COD is 250 ppm. As per MOEF guidelines the respective BOD/COD ratio is 0.12 12 .
For the ease of understanding of BOD & COD at the various sampling points in the river, the sampling sites are divided into eight zones. To assess the association between BOD and COD for the given dataset, correlation analysis was performed. BOD/COD ratio in the level of
signifi cant correlation of 0.05 was obtained for the given dataset, indicating that 95 per cent of data shows that BOD and COD are associated with each other.
The BOD / COD ratio throughout the river is above 0.12. However, the impact of dilution could also be seen in zone A where even a small quantum of freshwater from river Yamuna had been able to dilute the chemical concentration. Near Signature Bridge (A) and Chandni Chowk (E), there seems to be intermixing of wastewater indicated by higher BOD / COD ratios suggesting the presence of non-biodegradable waste (Appendix II).

Sl. No. Zones Station Name
1 A
Under the signature bridge (east-side)
Signature bridge (east-side)
2 B
Tibetan Colony (west-side)
Gurudwara_Majnu ka Tila
3 C Water Treatment plant
4 D Cremation site
5 E Chandni Chowk drain
6 F
Below the old iron bridge
Old iron bridge
Below Geeta colony
7 G ITO
8 H Okhla
Table 4: Zones-wise classi cation of the sample sites
Figure 29: Plot showing BOD/COD Ratio in di erent zones of River Yamuna in study area, Zone A & E
have high ratio suggesting presence of non bio-degradable waste
0.65
0.18
0.35
0.23
0.57
0.270.21
0.3
0
0.1
0.2
0.3
0.4
0.5
0.6
0.7
A B C D E F G H
Classification zones in Yamuna for the study area
BOD/COD Ratio

D. Total Coliform (TC) and
Faecal Coliform (FC) Analysis
The TC and FC counts are measured to assess microbial contamination in a water body. Faecal Coliform indicates pollution due to human or animal excreta. It also helps in understanding the pathogenicity of the pollution.
The lab data confi rms the presence of TC and FC in all the segments of the river. However, their
concentration was within the CPCB’s permissible limit for outdoor bathing (TC permissible limit <500 MPN / 100ml), except at segment II. Yamuna ghat area, as well as Hindu cremation site (Nigambodh ghat), comes under Segment II. Comparatively higher human interaction with river is reported here. One can observe various small points of domestic wastewater discharge in this area from the houses built along the ghats.
0
100
200
300
400
500
600
700
Segment-I Segment-II Segment-III Segment-IV Segment-V
Total Coliform Fecal Coliform Total Coliform permissible limit
Figure 30: Plot showing variation in TC &FC values across di erent segment, the red line shows the permissible limit for the pramaeter set by CPCB
3.2.3. River Water Quality in Segments I and II
As the purpose of our social study was to assess the impact of water pollution on health and livelihoods of riverine communities, a detailed discussion on water quality data around the selected social sites provides necessary context for our structured survey responses. All four selected sites for the survey were in Segments I and II.
The analysis of the sensor data shows that the median values for Dissolved Oxygen across
several months are always below the required CPCB minimum for outdoor bathing of 5ppm. We also notice that in April 2019 the median DO value is higher than that of April 2018. However, when we compare the post monsoon periods (September, October and November) of 2018 and 2019, we notice that the median DO values are lower in the month of September and October in 2019, suggesting that an infl ux of freshwater does not always result in improved DO values (Figure 31).

Figure 31: Plots showing monthly/ year wise variation of median values for DO,EC and Turbidity in Segments I & II (April 2018 - October 2019)

We also noticed that an infl ux of freshwater can also affect turbidity values. The graphs (Figure 31) show that turbidity values in Segments I & II post September 2018 remained low throughout. Our conversations with fi shermen in the area revealed that water was regularly released from Wazirabad barrage post October 2018.
Heat maps of sensor data for the segment-I and II shows the variation at various point in the river(Figure 32-34). Heat map shows how water quality deteriorates after the infl ow of Najafgarh drain. Near signature bridge, at the east-bank side of the river ,parameters show better values, the are especially noticeable in the heat maps of 15 Oct, 2019. At this site, DO is reported in the range of 8-10 ppm, The level, immediately started dropping after it, becomng zero. Throughout the study period, pH was recorded in the permissible range of 6.5 to 8.5 in these two segments of the river .
3.2.4. River water quality at ghat areas
The ghat areas, in Segment II, are places where most human interactions with the river occur, especially in the form of ritual bathing and worship.
Throughout the year, lab data shows that mean DO values did not meet the required minimum level. Similarly, mean BOD level also exceeded maximum permissible limit for outdoor bathing. Data from September to October 2019 shows that FC count for the area is also higher than the permissible limits, Whereas pH and temperature levels were within the permissible ranges. Lab data from the ghat areas shows that water quality was not fi t for outdoor bathing activity, as per the outdoor bathing standard prescribed by the CPCB.
April 2018
April 2019 August 2019
August 2018 October 2018
October 2019
Figure 32: Heatmaps tracing monthly and yearly wise variation of DO in Segment I & II along the stretch of the river Yamuna in Delhi segment (For month of April, August and October for 2018 & 2019)

April 2018
April 2019
August 2018
August 2019
October 2018
October 2019
Figure 33: Heatmaps tracing monthly and yearly wise variation of Electrical Conductivity in Segment I & II along the stretch of the river Yamuna in Delhi segment (For month of April, August and October for 2018 & 2019)
Figure 34: Heatmaps tracing monthly and yearly wise variation of Turbidity in Segment I & II along the stretch of the river Yamuna in Delhi segment (For month of April, August and October for 2018 & 2019)
April 2018
April 2019
August 2018
August 2019
October 2018
October 2019

3.3. Socio-economic profi le of the Riverine communities
To study the impact of river water pollution on the livelihoods and health of riverine communities, we collected 90 responses through a structured survey, conducted fi ve in-depth interviews with community representatives, and held three focus group discussions at selected sites.
The focus of the study was to capture responses from those who, in all likelihood, interact with the river on a daily basis to earn their livelihoods, and those who live within 500 metres of the river. Our respondents included priests, fi sherman, washer-men, boatmen, farmers, fl ower and coconut sellers, and those who interact recreationally with the Yamuna. These are all people for whom the Yamuna remains integral.
3.3.1. Socio-economic status.
Our respondents were all above 21 years of age and had been residing or working in the selected sites for a minimum of fi ve years. This criterion was set to map the respondents’ perception on seasonal variability in river water quantity and quality, its impact on their occupation and health, and their role in the mitigation of river pollution.
As mentioned in methodology, stratifi ed snowball sampling method was applied to get representation of the people from all the relevant occupational categories. Distribution of respondents across the sites was not uniform.
Majority of our respondents (85 percent) belonged to the ‘working age’ of 21-60 years. The conscious selection of the working age respondents was made to map the variation in the perception about the river water pollution and its impact on different types of river-centric occupations. Women, mostly housewives, garland makers and agricultural workers, made up 24 percent of respondents.
The survey data reveals that most of the interviewed people, had come from other states in search of better livelihood options. We found that six in every 10 respondents, either themselves or their parents, had come from other states, such as Odisha, Assam, Uttarakhand, Uttar Pradesh and Bihar. All, but one, farmer respondents from Majanu ka Tila area claimed that they have come from other states. Also, we
0
5
10
15
20
25
30
WazirabadBarrage
Majnu Ka Tila Yamuna KhadarEast bank
Yamuna GhatArea
Total
21-30 years 31-40 years 41-50 years 51-60 years above 60 years
Figure 35: Plot showing the distribution of Respondents by age and study site ;(n=90)

Figure 36: Plot showing the distribution of Responses on educational status by sites and overall (in percent); (n=90)
found that nearly every second respondents had come in the search of better earning options. Whereas 3 per cent, mostly women, said that they had come after marriage.
About 30 per cent of respondents had been living in their current homes near the river since birth, mainly of the Yamuna ghat area, so have memories of their childhood revolving around the Yamuna. About 37 per cent of respondents had been working or residing at the selected sites for more than 15 years.
The survey data reveals (Figure 36) poor educational status of most of the respondents. About 35 per cent of respondents were illiterate and 48 per cent of them were educated up to senior secondary level (till 10th standard). Interestingly, most of the illiterate respondents (12 out of 31) were in the age category of 31-40. Out of the 90 respondents, only four respondents, from the Yamuna Ghat area, had received education up to graduation level or above. 13 per cent of respondents did not answer this question.
Out of the 90 people interviewed, we found that about 46 per cent respondents were involve in river related occupation, such as fi shing, boat rowing, farming, washing, ritual specialists (priests at the ghat), and selling offerings—coconut, fl owers and sweets,etc. About 19 per cent of respondents were farmers and 18 per cent were shopkeepers. 8 per cent were washer-folks, only 3 per cent were boatmen and, 3 per cent were fi shermen. The remaining were housewives, working in private organizations, as marginal workers, having small shops or were unemployed (Figure 37).
During our fi eldwork, we found that there were only three Boatmen residing in Yamuna ghat area. These boatmen told us that there used to be many boatmen at every ghat in earlier years, but due to river pollution, number of visitors had gradually decreased and many boatmen changed their means of earning. Though, initially , survey was designed to capture responses from a good number of fi sherfolk, yet due to regular opening of Wazirabad barrage gates we could not fi nd
0
10
20
30
40
50
60
70
80
WazirabadBarrage
Majnu Ka Tila Yamuna KhadarEast Bank
Yamuna Ghat Total
Graduation and above High School Illiterate NA

suffi cient representation. However, these three fi shermen did inform us that whenever gates are closed, about 15 to 20 fi shermen come to catch fi shes regularly, otherwise they prefer to work on daily wage as construction or agriculture labour.
The economic status of most of the respondents were found to be very grim. Forty respondents (approximately 44.4per cent) said that their total household income is less than Rs.10,000 per month (Figure 38). Interestingly, all the boatmen and fi shermen respondents mentioned different total household income ranging from Rs. 5000 to Rs. 25000 per month. Two rag pickers, who were earning from the pollution of the river, claimed to earn between Rs 5000 and 10000 per month.
In total, these 40 respondents have 190 people in their households, who make up 49 per cent of the total household population represented by 90 respondents. That is to say, 49 per cent of the survey population subsist on less than Rs. 10,000s per month. Similarly, 17 per cent of the survey population (of Households of 19 percent respondents) survive on less that Rs 5,000 per month (Figure 39). On average, each household has fi ve members. The urban poverty line in Delhi’s Economic Survey (2018-19) is Rs. 1,134 per capita, per month.
It means, these households earning less than Rs.5,000 are at the edge of the poverty line.Most of the respondents had at least one or more members of their family working as manual labour at agricultural fi elds and construction sites or as domestic help to supplement household.
Only 44 per cent of respondents had their own houses, while 24per cent lived in rented ones 45per cent of respondents had pukka (concrete)houses (29per cent owned and 16per cent rented). The remaining respondents, save for the 14 per cent that did not respond, lived in jhuggis (make-shift arrangements), in temples, at night shelters, or on encroached land, especially the farmers of Majnu Ka Tila.
Poor economic status makes social and public services increasingly diffi cult to access. Approximately 17 per cent of respondents said that their school-aged children did not go to school due to either a lack of schools in the area or a lack of funds to send their children to school and adequately support their learning needs. There is little to no safety net for these respondents, which mean any hindrance to their livelihoods has a drastic impact on their socio-economic status.

Figure 37: Plot showing distribution of respondents by occupation (in percent) ;(n=90)
Figure 38: Plot showing distribution of respondents by monthly income categories (in percent) ;(n=90)
Figure 39: Plot showing distribution of respondents HH population by monthly income category (in percent) ;(n=385)
0
5
10
15
20
25
30
35
Occupation
0
5
10
15
20
25
30
1000-5000 5000-10000 10000-15000 15000-20000 20000-25000 NA
Monthly Income (₹)
0
5
10
15
20
25
30
35
1000-5000 5000-10000 10000-15000 15000-20000 20000-25000 NA
Monthly Household Income (₹)
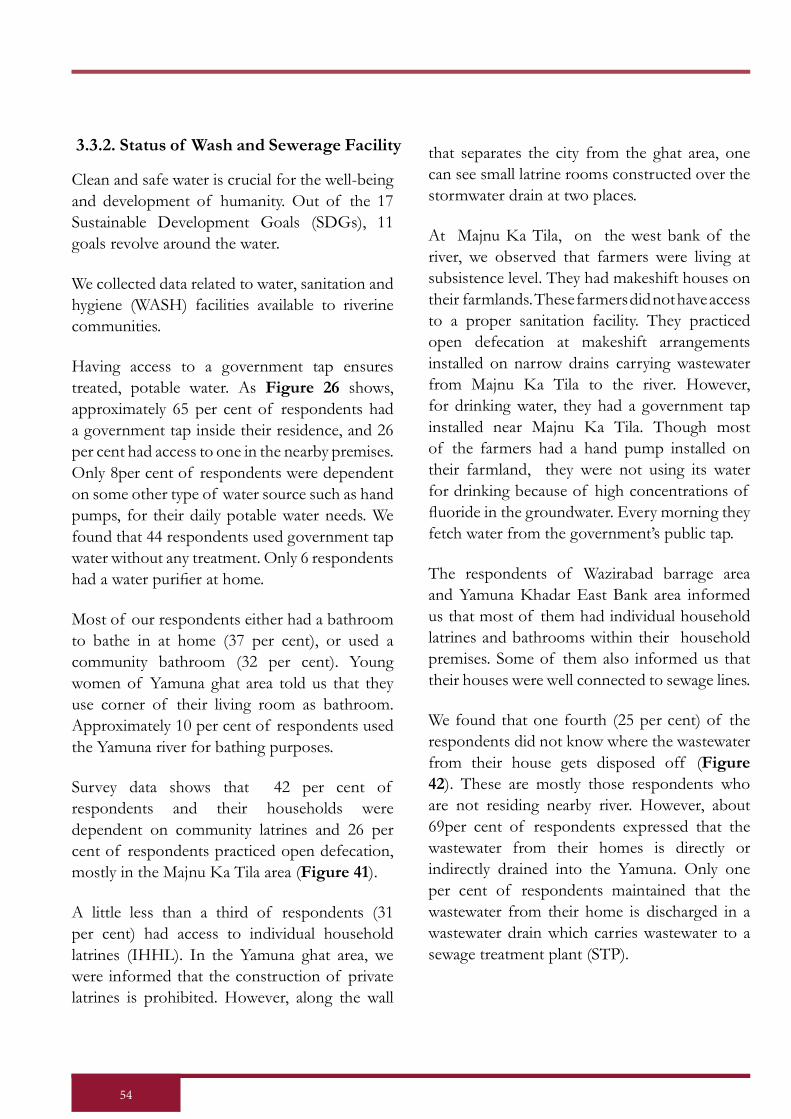
3.3.2. Status of Wash and Sewerage Facility
Clean and safe water is crucial for the well-being and development of humanity. Out of the 17 Sustainable Development Goals (SDGs), 11 goals revolve around the water.
We collected data related to water, sanitation and hygiene (WASH) facilities available to riverine communities.
Having access to a government tap ensures treated, potable water. As Figure 26 shows, approximately 65 per cent of respondents had a government tap inside their residence, and 26 per cent had access to one in the nearby premises. Only 8per cent of respondents were dependent on some other type of water source such as hand pumps, for their daily potable water needs. We found that 44 respondents used government tap water without any treatment. Only 6 respondents had a water purifi er at home.
Most of our respondents either had a bathroom to bathe in at home (37 per cent), or used a community bathroom (32 per cent). Young women of Yamuna ghat area told us that they use corner of their living room as bathroom. Approximately 10 per cent of respondents used the Yamuna river for bathing purposes.
Survey data shows that 42 per cent of respondents and their households were dependent on community latrines and 26 per cent of respondents practiced open defecation, mostly in the Majnu Ka Tila area (Figure 41).
A little less than a third of respondents (31 per cent) had access to individual household latrines (IHHL). In the Yamuna ghat area, we were informed that the construction of private latrines is prohibited. However, along the wall
that separates the city from the ghat area, one can see small latrine rooms constructed over the stormwater drain at two places.
At Majnu Ka Tila, on the west bank of the river, we observed that farmers were living at subsistence level. They had makeshift houses on their farmlands. These farmers did not have access to a proper sanitation facility. They practiced open defecation at makeshift arrangements installed on narrow drains carrying wastewater from Majnu Ka Tila to the river. However, for drinking water, they had a government tap installed near Majnu Ka Tila. Though most of the farmers had a hand pump installed on their farmland, they were not using its water for drinking because of high concentrations of fl uoride in the groundwater. Every morning they fetch water from the government’s public tap.
The respondents of Wazirabad barrage area and Yamuna Khadar East Bank area informed us that most of them had individual household latrines and bathrooms within their household premises. Some of them also informed us that their houses were well connected to sewage lines.
We found that one fourth (25 per cent) of the respondents did not know where the wastewater from their house gets disposed off (Figure 42). These are mostly those respondents who are not residing nearby river. However, about 69per cent of respondents expressed that the wastewater from their homes is directly or indirectly drained into the Yamuna. Only one per cent of respondents maintained that the wastewater from their home is discharged in a wastewater drain which carries wastewater to a sewage treatment plant (STP).

Figure 40: Site-wise distribution plot of responses for access to potable water source (in percent) ;(n=90)
Figure 41: Site-wise distribution plot of responses for access to latrine facility (in percent) ;(n=90)
Figure 42: Site-wise distribution plot of responses for awareness about Household wastewater discharge (in percent) ;(n=90)
0%10%20%30%40%50%60%70%80%90%
100%
WazirabadBarrage
Majnu Ka Tila Yamuna KhadarEast Bank
Yamuna Ghatarea
Total
Survey sites
in-house premise outside house premise NA
0%
10%
20%
30%
40%
50%
60%
70%
80%
WazirabadBarrage
Majnu Ka Tila Yamuna KhadarEast Bank
Yamuna GhatArea
Total
Survey sites
Community Toilets Individual Household Latrine (IHHL) Open Defication NA
0%
10%
20%
30%
40%
50%
60%
70%
80%
90%
100%
WazirabadBarrage
Majnu Ka Tila Yamuna KhadarEast Bank
Yamuna BazarArea
Total
Survey sites
Drains Yamuna Don't know NA
Out of the 90 people interviewed, only 32per cent said that they had a sewage connection, whereas 63 per cent maintained that they do not have one. About 5per cent of respondents did not respond to this question (Figure 43).
Respondents in Majnu ka Tila did not have a sewage connection. All their wastewater was fl owing into the Yamuna through drains. We noticed open drains carrying wastewater, fl owing through the narrow channels of furrows on the
agriculture fi elds and ultimately into the river. Most of the farmers interviewed told us that they use this water for irrigation as they do not have an electricity connection to lift groundwater or Yamuna water and use of diesel would be costly for them. Thus, wastewater drain was their perennial source of water for irrigation. Only one farmer maintained that he used Yamuna water for irrigation.
Figure 43: Box showing distribution of responses for access to the sewage connection ;(n=90)

Figure 44: Pictures showing glimpse of Sanitiaion nearby Yamuna area.
A. Makeshift toilet at Majnu ka Tila
C. Community tiolet at Yamuna ghat D.Chadnni Chowk drain being discharge in River Yamuna
B. Condition of waste-water drain at Yamuna Ghat

3.4. Riverine Communities of Yamuna: Voices From The Ground
The survey data analysis shows that very few respondents have sewer connection (nearly three in ten). Nearly 7 in 10 respondents said that their domestic wastewater is directly or indirectly getting discharged in the river Yamuna. This led us to ask the question related to seasonal variation in water quality of the river Yamuna and cause of its pollution. We also probed into the perception of the value of the river for these communities and their view on river possessing divine quality and impact of pollution on divinity of the river. Further, the respondent’s view of impact of pollution on livelihood and health was also sought. This led to the question of public participation in terms of what role they see for themselves in mitigation of river pollution.
On enquiring about the change in water quality in the last 10 years, 26 per cent of respondents said they didn’t see any change in the water quality. They maintained that water was just as dirty 10 years ago. About 65 per cent of respondents said that the river water quality has changed. Of those respondents, 85 per cent believed that it had become more polluted, while 15 per cent of this lot said water quality had improved in the last 10 years.
3.4.1. Perception about seasonal variation in Water quality
Those who said that water quality had improved in recent years sighted open barrage gate and fl ow in the river as a main reason.Of all the respondents, regardless whether they believed the river water had improved or deteriorated, 69per cent were aware that their waste is eventually disposed of into the river. Of those respondents who believed the river water quality had deteriorated, 69.64per cent of them were aware that their waste eventually gets disposed of into the river. Of those respondents who believed the river water quality had remained same, 80per cent were aware that their waste is eventually disposed of into the river. This shows that awareness of disposing of waste into the river has no impact on the perception of change in water quality in the last 10 years.
Thus, it is evident that respondents were aware that their waste fi nds a way into the river regardless of whether they have observed a change in the water quality or not. However, of the few respondents who were not aware that their waste is eventually disposed of into the river, all of them had occupations that had low interaction with the river (housewife, commercial stalls, hawkers, etc).
Figure 45: Plot showing distribution of responses on change in river water quality in last ten years (n=90), & opinion on type of change (n=56) (in percent)
85%
15%
0%
20%
40%
60%
80%
100%Yes 65%
No 26%NA 9%
Deteriorated
Improved

Popularly clean water properties are defi ned as colourless, tasteless and odourless. If any of these properties are absent, that indicates presence of pollution in that water. When asked how they assess the quality of the river water, 50 per cent of the respondents mentioned “colour”, and about 36.67 per cent “smell” along with other qualities such as viscosity (chipchipa, Bhari- stickiness and heaviness) and turbidity (Figure 46). Of the people that responded to this question, 91.49 per cent listed “black” or “yellow” (Peela, Kala)” as the colour of the river. When asked about the viscosity of the river, respondents used phrases such as “slimy”, “heavy”, and “sticky”. When asked about the smell, respondents said “Naale ki tarah badaboo aari hait,bahut gandi (It smells like sewer drain, very dirty)”.
Respondents were asked to identify which months they believed the water had the best quality. 61 per cent of respondents maintained that the monsoon period is the time when water quality improves and 30 per cent did not identify any period as the best(Figure 47).
Whereas when asked about the worst season for water quality, 58 per cent of respondents did not identify any period as the worst. It could be because they could not see improvement in water quality in any season. Whereas, 38 percent of respondents identifi ed summer as the period of bad water quality. Those who found summer to be the worst season for river water quality complained that during summer, the water quality deteriorates to its worst level and the river stinks. Sometimes they suffer breathlessness because of the stink, as one female (28) respondent noted 11
‘ Dhire dhire ye pani kala ho jeyega aur sade ande ki tarah mahakane lagega. Yamuna ji ke pas in sidhiyo par baithana bhi mushkil ho jata hai’.
i.e. “(Over a time Yamuna water starts appearing black with rotten egg smell. It becomes diffi cult to sit near the Yamuna on these stairs)”.
During the focus group discussions at the Yamuna ghat area, participants also mentioned a foul smell and complained that during the summer, due to the release of gases from the river, their electronic devices would break down. They also claimed that their iron equipment corroded fast and silver jewellery turned black.
W2C project data on water quality shows the difference in water quality of the river in various seasons (Figure 19-22). Our water experiments indicate that river water quality was very bad during the summer season of 2018, with a mean DO value of 0.03 ppm and high EC value of 1569muS/cm. During the post-monsoon season however, water quality improves slightly with an increased mean DO value of 2. 37ppm and a reduced EC mean value of 661.85 muS/cm..
Figure 46: Wordcloud - Respondents word usage for de-scribing water quality of river.

Figure 47: Plot showing distribution of responses on periods of the best and worst water quality (in percent) ;(n=90)
3.4.2. Riverine communities and river: The sacred and profane relation
Yamuna is considered a sacred river, like the river Ganga, by believers of Hinduism. People across the city come to perform rituals.This faith is strongly refl ected in our respondents. 77.8 per cent of respondents believed that the river has a divine quality (Figure 48). Of those respondents who believed in the divinity of the river, 54.44per cent of them stated that religious rituals have decreased over the years. Of those 54.55per cent of respondents, almost all of them (48.98per cent) cited bad water quality and/or pollution as the reason, while the rest gave lack of faith as a reason.
A small number of respondents (4 per cent) were sceptical about the divinity of the river. One respondent told us
“Yahan nadi kahan hai, jo behe raha hai vo to keval nala hai” (there is no river any-more and what is fl owing is drain water only).
On the question of whether or not pollution has an impact on the divinity of the river, 36 per cent of respondents opined that pollution does have an impact on the divinity of the river(Figure 49). Whereas 28 per cent claimed that pollution does not have an impact. 36 per cent respondents said they don’t know whether or not pollution has any impact on the river’s divinity.
30%
61%
8%
58%
2%
38%
2%0%
10%
20%
30%
40%
50%
60%
70%
Can't say Monsoon Summer Throughout theYear
Others
Seasons-wise water quality
Best Worst

Figure 48: Plot showing distribution of responses on divine quality of river (in percent) ;(n=90)
Figure 49: Plot showing distribution of responses on impact of pollution on divinity of the river (in percent) ;(n=90)
Divinity is essence-
• is is the mother goddess
• Divinity never gets a ected. Never got any
serious ailment
• It s all about faith; Faith is powerful
• Religious power is power; pollution doesn t have
any impact on divinity of river
• Water Quality doesn t have any impact on
River s divine power
Divinity gets a ected from material conditions-
• If its purity deteriorates, so will its value/divinity
.
• People don t have the same faith in Yamuna as
they used to have before
• It s a question of faith and when we see the
current state of the river, the bhakts (believers) are
not able to o er their bhakti completely
• Pollution reduces faith
Table 5: Perception of impact of pollution on divinity (Reason)
0%10%20%30%40%50%60%70%80%90%
100%
WazirabadBarrage
Majnu Ka Tila Yamuna KhadarEast Bank
Yamuna Ghatarea
Total
Survey sites
Yes No Don't know NA
0%
10%
20%
30%
40%
50%
60%
70%
80%
WazirabadBarrage
Majnu Ka Tila Yamuna KhadarEast Bank
Yamuna Ghatarea
Total
Impact of Pollution on Divinity of River
Yes No Don't know

Forty seven per cent of total respondents— mainly priests, farmers, boatmen, washer folks, fi sherfolks, ghat cleaner and fl orists— claimed that they regularly interact with the river to fulfi l their occupational or ritualistic requirements. Given that a respondent was regularly interacting with the river for occupational or recreational purposes, they were 28per cent more likely to believe that there are community benefi ts from the river.
When looking at overall respondents, we found that 79 per cent of respondents believed that the river has value for the community, whereas 20 per cent said that the river has no value for the community.
We asked respondents to further discuss what types of benefi ts the river provides to the community. 64 per cent of the respondents believed that the river has some benefi ts - cultural, economic, or water-related. Out of this 64.6 per cent, 24.4 per cent listed only cultural
benefi ts, whilst 46.67per cent listed cultural benefi ts in combination with water-usage and / or livelihood benefi ts.
We found that regardless of occupation, education, age, household income, and sex - the majority of the respondents believed that the river has community benefi ts, and that it has a divine quality. Most of the respondents maintained that the river was a central element in their lives. As one garland maker put it,
‘Humara to sara din yahi gujarata hai, agar hum kahin our jate hain to Yamuna ji ki badi yaad aati hai. Bachpan se inhi ke sath rahe hain, inhi ghato par khele hain. Yahi tairna seekhen hai’ (we use to spend our day here only. If we go somewhere else we miss Yamuna ji a lot. Since childhood have been with her, have played on its banks. Learnt swimming here.)
Figure 50: Pie chart showing distribution of responses on value of river for community (in percent) ;(n=90)
79%
20%
1%
Yes
No
Can't say

Figure 52: Plot showing distribution of response on reason of river pollution (in percent) ;(n=90)
Figure 51: Wordcloud-Solidwaste pollution described by Respondents
3.4.3. Perception of cause and effect of the river pollution
To assess the awareness about the cause of pollution, we asked respondents to pinpoint the reason of water pollution. All those respondents who answered identifi ed plastics, chemicals organic and domestic waste as common form of solid waste pollution in the river. Some of them also maintained that dead bodies of animals are also a frequent sight. On the
question of pollution due to wastewater, 71 per cent of the respondents pointed out the infl ux of wastewater drains at certain points, such as Najafgarh and Chandni Chowk. Though almost one-third (28per cent) maintained they didn’t know any causes of river pollution. Out of 90 respondents, only one respondent from Wazirabad barrage said that stopping the fl ow of the river is main reason of river pollution.
0%
20%
40%
60%
80%
100%
120%
WazirabadBarrage
Majnu Ka Tila Yamuna KhadarEast Bank
Yamuna Ghatarea
Total
Survey sites vs reason of river pollutionUntreated Wastewater Drains Stopping the flow Don't know

Impact of pollution on occupation and livelihood
After divine quality of river and problem of pollution in the river our survey had questions on the impact of pollution on occupation and livelihood of the riverine communities. 36.7per cent of respondents did not see any adverse impact from pollution on their income. These respondents are engaged in a wide range of occupations. Florists, shopkeepers and respondents working in offi ces and other private organizations primarily formed this category. These respondents reported a household income from Rs. 5,000 / month to Rs. 20,000+ / month. The number of respondents who earned less than Rs.5,000 in this group, was almost the same as those who earned between Rs.10,000 - 15,000.
Though 3.3 per cent respondents said that they didn’t know the actual cause of their low income, they mentioned population growth as one of a potential factor .
Only 34.4 per cent (31 respondents) reported a negative impact on their total household income because of pollution. These respondents were primarily washer folk, fi sher folks, boatmen, priests, and swimming coaches. The reported household income of these 34.4 per cent respondents ranges from less than Rs.5,000 / month to more than Rs.20,000. 16 out of these 31 respondents (51.6per cent) reported a household income of less than Rs.10,000 per month.
All the washer-folks surveyed were from Azad Market, Daryaganj and Seemapuri areas. It cost a signifi cant portion of each respondent’s daily income to carry their laundry load to the Yamuna Khadar East Bank area. They also complained that due to polluted river water, they do not get business from hotels and rich households. They
only get laundry from transporters and used-cloth sellers. They maintained that they use only caustic-soda and bleach to clean their laundry.
The fi sherman come to fi sh at Wazirabad Barrage from nearby areas such as Timarpur and Wazirabad village. We were informed that to fi sh in the river one needs to get a license from the Irrigation and Flood Control Department of Delhi. The license is issued for a duration of 10 months (@ Rs 300) as in July and August fi shing is banned in this stretch of the river Yamuna14.
Fisherman said that their total catch had also reduced compared to what it used to be 10 years ago. Now they hardly get Rohu (Labeo Rohita) and mostly catch catfi sh and China fi sh (a hybrid species). These fi shes have less commercial value in comparison to Rohu. During a focused group discussion, some fi shermen maintained that they cannot earn enough by fi shing, so other family members need to work as daily wage labour or domestic help to subsist. One fi sherman claimed that during his parents’ time, they used to have enough income from fi shing, but now he prefers to ride a cycle-rickshaw and come for fi shing only occasionally.
According to a report of IIT consortium
(Jun, 2012), 49 species of shes belonging to 33 genus
and 19 families has been reported in Wazirabad to Okhla
barrage (22 Km) stretch of the river (IIT Report, 2012).
According to the Basic Animal Husbandry and Fisheries
Statistics, (BAHFS-2014), in Delhi, sh production was
690 tonnes during 2012-13, whereas, BAHFS-2019
reported a reduced amount of 680 tonnes during 2017-18.

Figure 53: Pie chart showing distribution of response on impact of pollution on household income ;(n=90)
Figure 54: Plot showing income-wise perception on impact of pollution on household income
Figure 55: Plot showing occupation-wise distribution of response on impact of pollution on Household income (in numbers)
34%
37%
3%
26%Yes
No
Don'tKnow
NA
-2
0
2
4
6
8
10
12
14
Occupations
Yes No Don't Know NA
0
2
4
6
8
10
12
14
16
18
<10000 >20000 10000-15000 15000-20000 Not Answered
Monthly income categories (₹)Yes No Don't Know NA

When asked about whether pollution is impacting their catch, the fi shermen explained that during the summer season, when no water is discharged from the barrage, the dirty water from Najafgarh drain fl ows towards Wazirabad Barrage. Because of this, the fi shermen sometimes fi nd fl oating dead fi sh. They claim that polluted water has suffocated and killed the fi sh. The last such incident that they could recall was in April / May, 2017.
Similarly, priests and boatmen at the Yamuna Bazar Area also claimed that, along with other reasons, river pollution was a main reason for the decrease in number of visitors and devotees. It has adversely affected their businesses. One respondent, who had abandoned his previous profession of prasad (offering) making to drive an auto, said that he used to sell kilos of Prasad but could not do it now as there were hardly any buyers due to a dip in the number of devotees.
We found that farmers of Majnu Ka Tila had taken land on lease from farmers of Jagatpur. They had to pay Rs 6,000 to 35,000 per year, depending upon the area. Farmers were using wastewater, discharged from drains, for irrigation purposes. The major fi eld produce of this area is seasonal vegetables like cucumber, pumpkin, bottle gourd, and ridge gourd in the summers and caulifl ower, spinach, fenugreek leaves, radish, and carrot in the winters.
Some of the farmers cultivate on the sand belt (reti) of the riverbed as well. They use waste material to build their boats (thermocol- Expanded Polystyrene and other waste material fi lled in a sack) to cross the river to visit the sand-belt fi eld. On the sand mound they dig a small well (called Kuinya) and use groundwater (which is
Yamuna water) to irrigate their crops. We came to know that due to the polluted river water, farmers are no longer able to grow watermelon. These farmers told us that it’s been more than 10 years since their last watermelon harvest.
They claimed that crops irrigated by the Yamuna river spoil sooner than crops irrigated through other means. Those who were not using Yamuna water, maintained that water pollution had no impact on their income.
All the boatmen, fi shermen and washer-folk that were interviewed said that they do not want the next generation to be involved in their respective traditional occupations. They said that it had become very diffi cult for them to run their households from the income of their respective traditional occupation. Those who have managed to send their children to school said that they wanted their kids to get a white-collar job, such as teacher, clerk, assistant, nurse, and doctor, etc. Most of the respondents recognised that low education levels lead to reduced employment opportunities. Those who were not able to send their kids to school said that it would be better for their kids to work as private drivers, auto-rickshaw drivers, construction workers and domestic help rather than be involved in their traditional occupations. This way they would at least be able to earn their daily bread.
Shashi Sharma (age 63)
I used to be a great swimmer, and the ghat no. 17 used to
be women-only ghat at that time. e ghats were divided on
the basis of caste which is no longer the case now, especially
because of immigration. Now we have to rent out our rooms to
compensate for the reduced income from work of pandit ji (priest)
and had to look for the other income opportunities elsewhere.and had to look for the other income opportunities elsewhere.
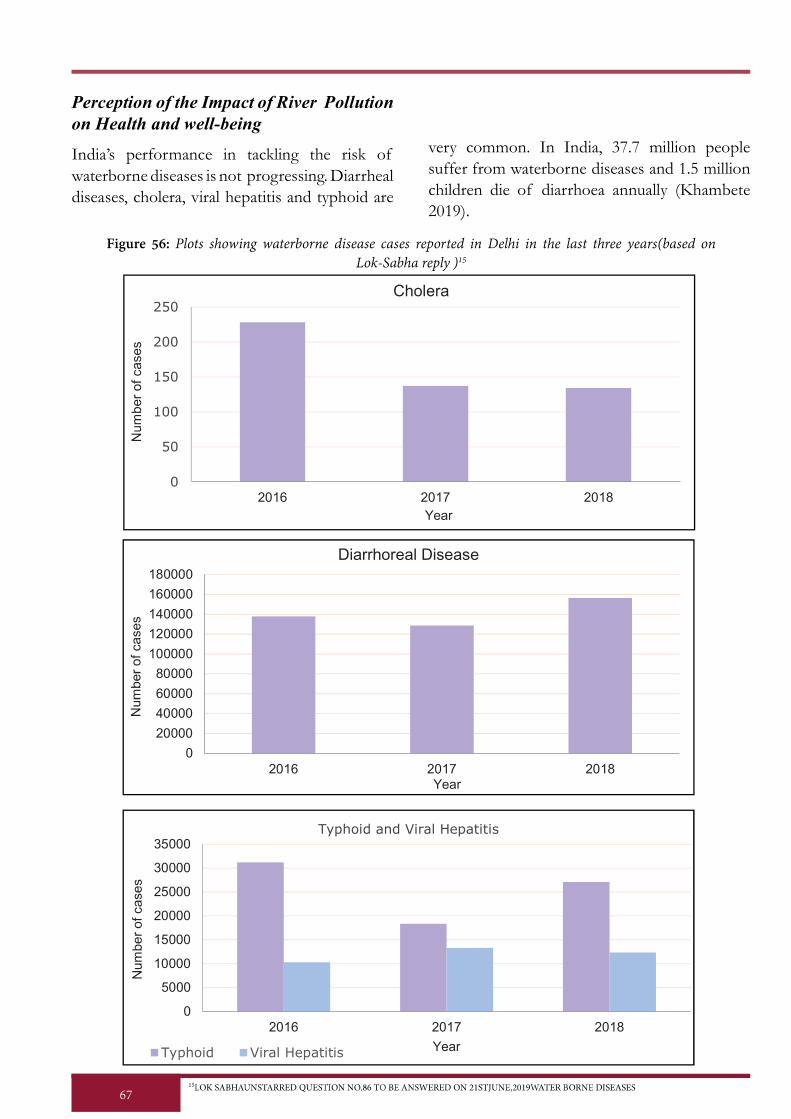
Perception of the Impact of River Pollution on Health and well-being
India’s performance in tackling the risk of waterborne diseases is not progressing. Diarrheal diseases, cholera, viral hepatitis and typhoid are
very common. In India, 37.7 million people suffer from waterborne diseases and 1.5 million children die of diarrhoea annually (Khambete 2019).
Figure 56: Plots showing waterborne disease cases reported in Delhi in the last three years(based on Lok-Sabha reply )15
0
50
100
150
200
250
2016 2017 2018Year
Cholera
0
20000
40000
60000
80000
100000
120000
140000
160000
180000
2016 2017 2018Year
Diarrhoreal Disease
0
5000
10000
15000
20000
25000
30000
35000
2016 2017 2018
Year
Typhoid and Viral Hepatitis
Typhoid Viral Hepatitis

Water-borne diseases are contracted via contact with contaminated water through bathing, drinking, washing dishes or clothes, and so forth. (Birmingham et al. 1997).
None of the 90 respondents were using the Yamuna river’s water for drinking, and only 10 per cent of respondents were using the water to bathe in. However, 21 per cent of respondents were using the river’s water for domestic purposes such as utensil cleaning and washing of clothes. On several occasions, we noticed people at the ghats cleaning their utensils and doing their laundry. Moreover, kids were running around and playing in the river’s water.
We found that majority of respondents perceive that polluted water in general has negative impact on health, comparatively few think so about the polluted water of the river Yamuna (Figure 57).
About 63 per cent of the respondents stated that polluted water can cause health problems In general, more than half (55.56 per cent) of our respondents reported some gastro diseases and/ or diarrhoea-related when asked what ailments their families had suffered in the last fi ve years.
When asked whether they think polluted waters of the Yamuna river specifi cally has had an impact on their health, half of our respondents
did not answer whether polluted river water causes disease or not. 16 per cent of respondents said river pollution does not have an impact on health. Only 28 per cent of respondents said that the Yamuna’s water quality had an impact on their health. Of these respondents, 59.09per cent listed some mosquito-related disease, 15.91per cent listed some stomach-related disease, and 50per cent listed some skin-related disease. While visiting the study sites, we also experienced frequent throat infections, colds, and fevers.
Most of the respondents who believed in the divinity of the river were hesitant to accept that river pollution could be a cause of any kind of ailment.
As one washerman explained, the river has been a mother to them and has never let them sleep hungry, so they cannot say that her waters can cause any kind of disease. However, that same washerman contended that during summer his community does face itching and rashes on their skin. He maintained that it is because water levels in the summer are so low that the river that fl ows, has only the wastewater coming from the Najafgarh drain.

Figure 57: Plot comparing perception on impact of polluted water in general and of river Yamuna water on health problem(in percent) ;(n=90)
Figure 58: Wordcloud-Perception of respondents on Yamuna water related diseases (in last ve years)
63%
16%
4%
17%
28%
16%
4%
52%
0%
10%
20%
30%
40%
50%
60%
70%
Yes No Don't know NAImpact of polluted water on health Impact of Yamuna river pollution on health

3.4.4. Perception on Role of Communities in River Cleaning Drive
All the plans and programmes launched by the government for river cleaning, like the Ganga Action Plans I &II and the Yamuna Action Plans I & II, include public awareness campaigns and participation as an essential component. However, evaluations of these plans and programmes have shown that governments have not been successful on this front (CAG report, 2010). This raises two questions—Are citizens themselves not willing to participate? Or, has policy been framed in an exclusionary way that deters participation?.
During the focus group discussions, we observed that participants were eager to be part of river cleaning drives but they really didn’t know what to do nor how to start.
Out of the respondents who answered when asked about government and community action, 76.47per cent felt that as a community they did nothing or could not do anything. They expressed their limited power in terms of ‘making a collective complaint to the government about drain discharge’ or ‘asking devotees to not to throw ritual waste in the river ’. Of those same respondents, 49.02per cent suggested that the government has to stop the fl ow of drains into the river. 9.8per cent suggested that freshwater fl ow has to be increased, and 15.68per cent suggested that the river /or drains have to be treated and cleaned.
At the Yamuna Ghat Area, we were informed that every month the Residents Welfare Association (RWA) organized a ghat and river cleaning drive called the “Clean Yamuna Campaign.” Despite this, when asked what kind of role respondents see themselves playing in the river cleaning drive, they generally said “what can we [even] do?” As Babban (64) from Yamuna khaddar East put it,“This all is only talk, no action! what can we do? Only government can. First of all they don’t come here, and if they do they (Govt.), eat up all the money. We can only ask people to not to throw garbage in the river, but we do not have any authority to stop polluting drains. Have you not seen (pointing in the direction of Najafgarh drain) the drain discharging and turning this river black!”
A washer-man, washing clothes at Surya Ghat area of Wazirabad barrage complained,
‘sare rules kewal ham garibo ko satane ke liye hain. Pahale hamain yahan se bhaga diya aur phir hamar ghat tod diya. Apni rozi roti kamane hum kaahan jaye? Sab gandgi humhi karte hain, ye nale to jaise saf-pani late hain Yamuan ji main.’(“All rules are there only to trouble the poor people like me. First they removed us from here and then dismantled our ghats. Where should we go to earn our daily bread and butter? All the pollution is because of us, as if these drains (pointing towards Najafgarh drain) are pouring in clean water in Yamuna ji”).
Yamuna Action Plan Year Budget Estimates (INR)
YAP-I (1993) INR.7.32billion
YAP-II (2003) INR. 6.24 billion
YAP-III (2018) INR 16.56 billion (for Delhi) (PTI 2013)
Table 6: Plans to mitigate Yamuna River Pollution
( Yamuna Action Plan (YAP) Launch time and budget estimates (Kansal n.d.))

On the question of what government should be doing to clean the river, Mr Sharma, a swimming coach, said, “Someone from the authorities should come and talk to people on ghats and discuss with them how they want to deal with the situation”.
•Stop the drains discharge in river
•Clean the river, strict implementation of law, and let the river ow
•Stop the in ux of people, remove the dwelling here (Yamuan Ghat area) and clean the river and ghats: Separate sewer lines for waste, put a cap on the number of people who can live on the ghats
•Clean the drained e uents through treatment plant and construct separate sewer lines
•Proper use of funds, increase the ow of the river, treatment of the waste before disposal in rivers
•Recycle drainage water, Use that water for nurseries, make government schemes e ective, make a plan for utilizing wastewater
He further maintained that without involving people actively in the Yamuna cleaning drive, the river cannot be cleaned.
Table 7: Communities Perception on what should government do to improve the water quality
Year Passed-Rules,Act & Regulations
1957 The Delhi Municipal Corporation Act
1974 Water (prevention and control of pollution) act,
1986 Environment (Protection) Act
1998 Bio-Medical Waste (Management and Handling) Rules
1998 Delhi Jal Board Act
2000 The Delhi Common Effl uent Treatment Plants Act
2001 The Delhi Common Effl uent Treatment Plants Rules
2010 National Green Tribunal Act
2016 Bio-Medical Waste Management Rules
2016 Construction and Demolition Waste Management Rules
2016 Solid Waste Management Rule
2017 Wetlands (Conservation and Management) Rules
2017 New Delhi Municipal Council Solid Waste Management Bye-Laws
2018 Delhi Water Board Septage Management Regulations
Table 8: Timeline of legal provisions to mitigate water pollution16

4. Discussion and ConclusionYamuna is one of the most polluted rivers of India and Delhi is one of the biggest polluters of the river. Yamuna, occasionally becomes the centre of attraction when devotees and believers come to take bath in its waters during festivals, such as Chhatt puja and Navami (ninth day of idol worship ). But for most of the riverine communities it is always in the centre of their daily life. Previous chapters of this report have dealt with the fi ndings of our water experiments and socio-economic study. In this section we would like to summarise our fi nding and proposed some recommendations.
We have found that rapid urbanization has resulted in the reduction of vegetation area around the Yamuna. Simultaneously, the amount of built-up area in Segments I & II have increased in the past 10 years. This type of urban sprawl negatively impacts the quality of the river because more drains are built alongside these urban areas which outfl ow into the river.
The analysis of sensor and lab data shows that Delhi’s stretch of river Yamuna is not fi t for outdoor bathing purposes. At most points, the quality of water does not even meet permissible STP discharge standards. W2C team found that the ghat areas in segment-II had presence of trace elements, such as Iron, Cadmium, Chromium and Lead much more than the permissible level for drinking water. Though not a single respondent was using river water for drinking purpose, but some of them were daily bathers. However, the water quality of the ghat area was not up to the outdoor bathing standard, as prescribed by the CPCB.
In the case of the Yamuna, most of the studies on pollution of river engaged in a ‘degradation discourse’. Those who have been less studied and marginalised are the people in traditional occupation, urban poor, and residents of the informal settlements. Riverine communities have not been seen by policy makers as the part of the river ecosystem. Rather, narratives around the urban river pollution have mostly ignored the riverine communities’ livelihood and health concerns.
We have used perception-based methods to assess the centrality of Yamuna in the daily lives of riverine communities, their attitude towards the river, and their assessment of the status of river pollution and indicators of pollution, as well as, mitigation strategies. To map the people’s perception about river pollution and its impact on their health and livelihood we conducted surveys, in-depth interviews, and focus group discussions at the pre-selected sites.
The perception based study often helps in bringing out the ‘local ecological knowledge’ (Huntington 2000). as knowledge is highly related to level of dependence on, and personal experience with, particular natural resources in an ecosystem (Ingold 2000). However, as it is not always necessary that every individual has similar experiences, life circumstances, or dependency level, individual perceptions may also vary. However, this study found that occupation, education, sex, age, and income seem to have little to no correlation with how respondents feel about the river, its innate divinity and its current status of pollution nor suggested actions the government should take.

Our study results indicate that the majority of respondents considered the river Yamuna to be divine and polluted at the same time. They could assess even a slight change in the already polluted water of the river. But, they believed that this pollution had no impact on the divinity of the river.For the communities who are either living near the Yamuna or are dependent on it, the deteriorating condition of the river is a lived reality. Thus their perceptions are well-informed. The river quality data collected by the team also supported it.
We found that respondents who are directly related to river water enterprises did see potent interrelationship between the quality of the river water and the impact it had on socio-economic aspects of the communities. But, others were not necessarily sure that it has a negative impact on their income. This variation in perception may be attributed partially to their experience, use and dependence on the natural resource (Ingold 2000), in this case on the river Yamuna.
Traditional occupations of the riverine communities have been adversely affected by the pollution of the river water. Most of the respondents, who are dependent on the river for their livelihood and having their household monthly income less than Rs 10000, believe that pollution has a negative impact on their income. These people, already living in economic stress, did not want their next generation to pursue their respective traditional occupations, such as fi shing, washing, etc. However, the poor economic condition reduces the chances of higher education. As a result, their opportunity of upward inter-generational economic mobility is limited and they end-up working as construction or agriculture labour.
Most of the respondents were aware of the fact that, in general, polluted water causes health problem, but most of them could not accept it for the river water. However, some of them accepted that polluted river has a negative impact on their health. As riverine communities were not dependent upon the river for their potable water uses, it was found that there was no widespread occurrence of water-borne diseases that can be related with river water pollution. While complaints about skin allergy because of coming in contact to the river water was reported, there is no suffi cient data to support this. Further, bad smell in summer was reported to an extent that it creates breathlessness for some people. It will not be considered an ailment, but certainly not a healthy environmental needed for well being. Thus, it cannot be said that polluted water of the river has increased the chances of waterborne diseases among the riverine communities, as no widespread waterborne diseases were reported.
Further, on the pretext of understanding and examining the impact of river water pollution on the health of the riverine community, a need is felt to deal with the concept of health in terms of well-being, as defi ned by the WHO Constitution, (1948), “A state of complete physical, mental and social well-being and not merely the absence of disease or infi rmity”. Studies have shown a negative correlation between perception of pollution and well-being (MacKerron 2009, Smyth 2008). However, such studies are not widely available in Indian context. We would like to suggest that a study is needed to examine how river water pollution infl uenced the riverine communities’ lives in terms of their psychological and physical well-being (Vaske and Kobrin 2001).

We found that people were aware of the major cause of river pollution. Majority of respondents pointed out discharge of untreated wastewater from the drains as a major cause of river pollution and suggested treating of and reducing the fl ow of drain water into the river to check the river pollution. Most of them blamed government for not regulating wastewater discharge into the river from identifi ed drains. Some of the people could locate pollution problem in the non-compliance and loose implementation of environmental laws. Stopping of the fl ow of river was also identifi ed as one of the reasons of river pollution and fl ow of incessant stream of fresh water was recognised by some.
However, people could not see an agency in themselves or means available to them to play a role in the pollution mitigation. We were informed that occasionally some programmes had been organised by government, non-government agencies and local body, such as resident welfare association, at a local level in Yamuna ghat and Wazirabad barrage area , but were not on consistent or regular basis. So, in the study area we found that mass-participation has not been organised on a regular basis. Those who are less educated and have no agency of intervention get further marginalised. However, majority of the respondents expressed their willingness to participate in the governments’ river cleaning programmes.
For nearly 30 years, cleaning the Yamuna and Ganga rivers has been a priority for the central government. Despite this, no signifi cant change in water quality has been reported. Awareness and community participation have been identifi ed as key components in all the river cleaning programmes, but wider public participation has not been garnered so far (PAC 2004,
MoWRRDGR 2016). It has been recognised that participation of local communities in natural resource management and conservation is essential for sustainability of that resource and well-being of the local community (Otto 2013). There are evidences of successful public participation in restoring, monitoring and management of common natural resources, such as forest areas, lake, and local water bodies etc.( (Gibson 2000. , Sen and Nagendra 2018).
This study has clearly shown, though water quality of rive Yamuna is not up to the standard of a healthy river, yet it is pivot of many people’s lives. The river is mirror of childhood memories for most of the people. Majority of respondents relate to the river as a waterscape polluted yet possessing divine quality. They believe in innate sanctity of river despite the fl ow of polluted water through it. This long-term interaction of people with the river contributes in generation of local ecological knowledge, such as variation in native fi sh species, seasonal variation in water quality, peak timing of pollution discharge, impact of pollution on aquatic fl ora and fauna and change in topography and hydrology of river over the years, etc. The management of the urban stretch of the river is more prone to develop grey infrastructure and recreational spots in and around the river. However, the incessant wastewater drains discharge in the river still has not been managed fully. Involving riverine communities in the river cleaning programme may help in foster wider environmental concerns among general public subsequently creating pressure for compliance with the environmental laws and regulations.

5. RecommendationBased on our study fi ndings we would like to suggest that
Treat pollution at the source
● The main source of pollution identifi ed for the river is a drain carrying domestic wastewater and industrial effl uent, such as Chandni Chowk and Najafgarh drains, as well as rubbish thrown along and in the river, such as ritual waste, polythene bags and plastics. To effectively clean the river Yamuna, we recommend to stop the pollution at it source. For this, wastewater generated from household areas and industries could be treated and recycled at its generation point and recycled water could be used to meet non-potable needs, such as for irrigating the parks, lawns, sidewalks green belt on the roads etc.
Improve community participation
● Our study has found that unlike popular perception, many people still have a vital relationship with the urban stretch of the river Yamuna. Thus they should be looked at as a component of the larger riverine ecosystem. These riverine communities, who are still involved in the traditional occupations and spend signifi cant amount of time interacting with river, have rich local knowledge about the river. They should be considered as one of the stakeholders and could be given preference to take part in monitoring and implementation of river cleaning programme on local level. For the wider participation of riverine communities in such programmes, incentives can be given for keeping their river-stretch clean and for being stewards of the river.
● We found that river clean-up activities, seeking public participation, were organised at short notice and more on an ad-hoc basis, consequently failed to attract wider public participation. To spread awareness and to amplify public participation river clean-up activities need to be organised on a more regular basis. Under this pretext, we would like to suggest setting up of a platform as a localised governance mechanism at small scale, for instance, limited to a particular river stretch only, to create a more conducive environment to facilitate voluntary active participation of the riverine communities. NGOs and civil society groups can help in setting-up such platforms.
● A reliable, transparent and participative Water Quality Monitoring System (WQMS) is the bedrock of a healthy river and riverine community. We used the Water-to-Cloud approach, which measures water quality in real time and displays it near real-time on publicly available portal http://thoreau.uchicago.edu. As the cost of sensors is dipping, similar sensor based real-time monitoring approach can be deployed at critical segments of Yamuna and the data can be shared with the local community and wider stakeholders through either LCD display boards or mobile applications. This naturally invites participation of the community, which is dependent on the river for livelihood and other ritual purposes such as Chhatt puja, in better understanding the river quality before engaging with it. Sharing the data publicly also acts as a feedback loop for the authorities to validate the robustness and reliability of the system.

● For voluntary participation awareness / knowledge of the extent of river water pollution is necessary, and to have well informed awareness, easy access to river water quality data, in intelligible form, is required. For this, a user friendly water quality index could be created along the lines of air quality index, which may consider various parameters with specifi c weightages to provide a layperson a single number or colour to comprehend if the water quality is safe to use. The localized governance platform could also facilitate bridging the communication gap between the local ecological knowledge and scientifi c knowledge by bringing researchers, scientist, policy makers and local people on one table. This may help educate riverine communities on river conservation, and researchers and scientist to frame their work in such a way that it could be intelligible to common people. This will help riverine communities take informed decision and contribute substantially in planning and implementation of pollution mitigation programm-s.
Build a deep understanding of economic and heath costs of river pollution
● To better understand impact of river pollution on livelihood, it is important to collect data regarding economic cost of pollution being borne by these riverine communities in the form
of change in income in a given period of time and also change in occupation due to poor water quality. An understanding of economic cost of river pollution can help prioritise the need to solve the issue of river water quality which mostly remains neglected.
● Further, we could fi nd only little connection between river water pollution and water-borne diseases reported by riverine communities. However, our respondents did relate river water pollution with the condition of breathlessness and with the rusting of their electronic appliances, too. Riverine communities do not have uniform socio-economic status and we have seen in other studies that condition of natural environment has an impact on the people’s perception of their health and socio-economic well-being. Therefore, for better understanding of the impact of river water pollution on their health and socio-economic status, a study based on the concept of well-being is recommended.

References1. UNEP. 2016. A Snapshot of the World’s Water Quality: Towards a global assessment. United
Nations Environment Programme, Nairobi, Kenya. Accessed Jun 04, 2019. http://wedocs.unep.org/bitstream/handle/20.500.11822/19524/UNEP_WWQA_report_03052016.pd-f ?sequence=1&isAllowed=y.
2. UNESCO. n.d. World Water Assessment Programme (UNESCO WWAP): Facts and Fig-ures Water pollution is on the rise globally. Accessed Jan 04, 2019. http://www.unesco.org/new/en/natural-sciences/environment/water/wwap/facts-and-fi gures/all-facts-wwdr3/fact-15-water-pollution/.
3. CPCB. 2015. Inventorization of sewage treatment plants. March. Accessed June 2016. https://nrcd.nic.in/writereaddata/FileUpload/NewItem_210_Inventorization_of_Sew-age-Treatment_Plant.pdf.
4. Dey, Sushmi. 2015. 80% of India’s surface water may be polluted, report by internation-al body says. 28 Jun. Accessed September 2, 2019. https://timesofi ndia.indiatimes.com/home/environment/pollution/80-of-Indias-surface-water-may-be-polluted-report-by-in-ternational-body-says/articleshow/47848532.cms.
5. Haberman, D. L. 2006. River of love in an age of pollution: The Yamuna River of northern India. Berkeley, Calif: University of California Press.
6. Alley, K. D. 2002. On the banks of the Ganga: When wastewater meets a sacred river. . Ann Arbor: University of Michigan Press.
7. Wong, CM, Williams, CE, Pittock, J, Collier, U and P Schelle. 2007. World’s top10 rivers at risk. WWF International. Gland, Switzerland. 19 March. Accessed June 14, 2019. https://d2ouvy59p0dg6k.cloudfront.net/downloads/worldstop10riversatriskfi nalmarch13.pdf.
8. Sawe, Benjamin Elisha. 2017. The Most Polluted Rivers In the World. . World Atlas. 25 April. Accessed June 14, 2019. https://www.worldatlas.com/articles/the-most-polluted-rivers-in-the-world.html.
9. Malik D, Singh S, Thakur J, Kishore R, Kapur A, Nijhawan S. 2014. “Microbial Fuel Cell: Harnessing Bioenergy from Yamuna Water.” Int. J. Sci. Res. 3(6): 1076-1081.
10. Misra, Anil Kumar. 2010. “A River about to Die: Yamuna.” J. Water Resource and Protec-tion 489-500 .
11. Datta, Chandan. 1992. “Yamuna River Turned Sewer.” Economic and Political Weekly, 27, 2633-2636.
12. PTI. 2018. 2% Yamuna Stretch Accounts For 76% Of Pollution In River: Report. 22 Sep-tember. Accessed Jan 6, 2019. https://www.ndtv.com/india-news/2-yamuna-stretch-ac-counts-for-76-of-pollution-in-river-report-1960038.

13. Ramachandran, Smriti Kak. 2016. The Yamuna is poisoned and so are your vegetables. 25, 2016 JULY. Accessed September 4, 2019. https://www.thehindu.com/news/cities/Delhi/the-yamuna-is-poisoned-and-so-are-your-vegetables/article2891778.ece.
14. Link, Toxics. 2014. A report on Toxicity Load of Yamuna River in Delhi. http://toxicslink.org/docs/Yamuna-Report-Toxics-Link_12-12-2014.pdf.
15. Darshan Malik, Sunita Singh, Jayita Thakur, Raj Kishore Singh , Amarjeet Kaur, Shashi Ni-jhawan. 2014 . “ Heavy metal pollution of the Yamuna River: An introspection.” Int. J. Curr. Microbiol. App. Sci 3.10 856-863.
16. CPCB. 2019. Report on Testing of Vegetable / Edible Products, Soil & Water on the Bank of River Yamuna in Delhi. August. https://yamuna-revival.nic.in/wp-content/up-loads/2020/02/CPCB-Report-on-Testing-of-Vegetable-Edible-Products-Soil-Water-on-the-Bank-of-River-Yamuna-in-Delhi.27.08.2019.pdf.
17. Singh, A.K., Ansari, A., Srivastava, S.C., Verma, P. Pathak, A.K. 2014. Impacts of Invasive Fishes on Fishery Dynamics of the Yamuna River,. https://www.cabi.org/ISC/FullText-PDF/2014/20143319021.pdf .
18. G. Gö ransson, M. Larson, & D. Bendz. 2013. Variation in turbidity with precipitation and fl ow in a regulated river system. River Gö ta Ä lv, SW Sweden: G. Gö ransson, M. Larson, & D. Bendz. (2013). Variation in turbidity with precipitation and fl ow in a regulated river sys-tem – River Gö ta Ä lv, SW Sweden. Copernicus Publications.
19. Dorevitch, S., Panthi, S., Huang, Y., Li, H., Michalek, A. M., Pratap, P., Wroblewski, M., Li, A. 2011. “Water ingestion during water recreation.” Water Research, 45, 5, 2020-2028.
20. Russo, G. S., Eftim, S. E., Goldstone, A. E., Dufour, A. P., Nappier, S. P., & Wade, T. J. (January 01, 2020). Evaluating health risks associated with exposure to ambient surface wa-ters during recreational activities: A systematic review and meta-analysis. 2020. “Evaluating health risks associated with exposure to ambient surface waters during recreational activi-ties: A systematic review and meta-analysis.” Water Research, 176.
21. Orr, S. E., Bridges, C. C., & Parrish, A. 2017. Chronic Kidney Disease and Exposure to Nephrotoxic Metals. International Journal of Molecular Sciences, 18, 5. 12 May . Accessed 12 2019. https://www.ncbi.nlm.nih.gov/pmc/articles/PMC5454951/ .
22. Baviskar, Amita. 10 Dec, 2011. “What the Eye Does Not See: The Yamuna in the Imagina-tion of Delhi.” Economic and Political Weekly, Vol. 46, Issue No. 50, .
23. Jain, A. K. 2009. River pollution: regeneration and cleaning. New Delhi: A.P.H. Pub. Corp.
24. Hannerz, Ulf. 1992 . Cultural complexity: Studies in the social organization of meaning. New York: Columbia University Press.

25. P. Sharma, M. K. Das, S. Samanta, S.K. Paul, S. Bhowmik, and A P Sharma. February, 2014. The Ecology and Fishery Status of River Yamuna. Indian Council of Agricultural Research, Barrackpore, Kolkata: Central Inland Fisheries Research Institute.
26. Bureau Of Indian Standards.(BIS,2015). Indian Standard drinking water — specifi cation ( Second Revision ). June. Accessed Dec 2019. https://cpcb.nic.in/wqm/BIS_Drinking_Wa-ter_Specifi cation.pdf.
27. Gower, A.M. 1980. Water Quality in Catchment Ecosystems. , John Wiley & Sons, New York.
28. Radwan, M., Willems, P., El Sadek, A., & Berlamont, J. 2003. “Modelling of dissolved oxy-gen and biochemical oxygen demand in river water using a detailed and a simplifi ed model.” International Journal Of River Basin Management, 1(2), (International Journal Of River Basin Management, 1(2),) 97-103.
29. MOEFCC. dated 13/10/2017. MoEF > Environment > Pollution--Sewage Treatment Plants (STPPs) Effl uent discharge Standards Gazette Notifi cation G.S.R. 1265(E). Accessed Feb 2020. http://moef.gov.in/environment/pollution/.
30. Diwakar, Surya Prakash Pattanayak and Sumant Kumar. 2016. “District-wise change analy-sis of land use-land cover in delhi territory using remote sensing & gis.” Journal of Urban and Environmental Engineering , Vol. 10, No. 2 201-213.
31. Kansa, Deepshikha Sharma and Arun. n.d. The status and effects of the Yamuna Action Plan (YAP). Accessed March 4, 2019. http://fore.yale.edu/fi les/Sharma_and_Kansal-Yamuna_Action_Plan.pdf .
32. IIT. 2012. “Floral and Faunal Diversity in Yamuna River Yamnotri – Allahabad-GRBMP : Ganga River Basin Management Plan.” Indian Institutes of Technology. http://cganga.org/wp-content/uploads/sites/3/2018/11/034_enb_yamuna.pdf.
33. Khambete, Aarti Kelkar. 2019. India Water Portal. 1 9. Accessed Oct 15, 2019. https://www.indiawaterportal.org/articles/when-water-kills.
34. A., Sharma Deepshikha and Kansal. n.d. The status and effects of the Yamuna Action Plan (YAP). Accessed March 4, 2019. https://fore.yale.edu/fi les/sharma_and_kansal-yamuna_action_plan.pdf.
35. PTI. 2013. Phase three of Yamuna Action Plan approved for Delhi. 10 December. Accessed November 2019. https://www.ndtv.com/delhi-news/phase-three-of-yamuna-action-plan-approved-for-delhi-544037.

36. Bahfs. 2014. Basic animal husbandry & fi sheries statistics. New delhi: ministry of agricul-ture department of animal husbandry, dairying and fi sheries krishi bhawan, . http://dadf.gov.in/sites/default/fi less/Final%20BAHS%202014%2011.03.2015%20%202.pdf.
37. 2018. Basic animal husbandary and fi sheries statistics. Accessed Decembeer 2019. http://dadf.gov.in/sites/default/fi less/BAH%20%26%20Fisheries%20Statistics%20Book%20engl.%20%282%29.pdf.
38. WHO. 1948. Constitution. 7 April. Accessed October 10, 2019. https://www.who.int/about/who-we-are/constitution.

AppendicesAppendix-I
1. Socio-economic Survey questionnaire
Socio-economic Survey questionnaire
Socio-Economic study of the Communities residing near Yamuna River system under the 'Water-To-Cloud' project
of Uchicago University
Schedule No: Enumerator Name: Date & Location:
Objective: To understand the impact of river water quality on the socio-economic condition of the communities living
along the Yamuna river system in Delhi.
For primary data collection, a questionnaire survey along with the observation and unstructured interview scheduled
will be used.
Consent
We are students of Ashoka University working on the project to understand the socio-economic analysis of river
pollution on the indicators of livelihood and health of the communities living around the river Yamuna. Your answers
will be of great signi cance for us in conducting this study to understand the impact of the river. Will you be able to
answer the questions in this survey (Yes/No)
I, __________________(participant s name), understand that I am being asked to participate in a survey which has
been designed to gather information on the topic of river pollution. I have been given some general information about
this project and the types of questions I can expect to answer. I understand that my participation in this project is
completely voluntary and that I am free to decline to participate, without consequence, at any time prior to or at
any point during the activity. I understand that any information I provide will be kept con dential, used only for the
purposes of completing this assignment, and will not be used in any way that can identify me. All survey/questionnaire
responses, notes, and records will be kept in a secured environment. I also understand that there are no risks involved
in participating in this activity.
By signing below and returning this form, I am consenting to participate in this survey:
Signature: _______________________________________________
Date: ______________________________________________

Personal (demographic) information -
Name of Respondent: Age & Sex: /M/F/O
Category: Gen/OBC/SC/ST/ Other Education:
Main Occupation: Total Household income(per
month)
15-20 K
<5000
5000-10,000
10,000-15,000
15000-20000
Position of respondent in
household:
(In relation to the Head of the
Household)
House Type:
Pucca house
owned/Rented/Other
Owned
Members in household:
Male:
Female:
(0-5)
(5-18)
(18-25)
(25-60)
(60+)
Quality of House & general
description of the homestead:
(Type of House)
Sanitation Facility(bathroom)
Personal
IHHB /Community Bathroom/
Makeshi /
Sanitation Facilities (toilet) IHHL/Community toilet/ OD
(I) Questions related to habitation
1. How long have you been living / working here
a. 5 - 10 Yrs. b. 11-15 Yrs C. 15-20 D. Since Birth
2. Have you come from another place Yes/ No
3. If yes, when, from where _______________/________________/___________
4. If yes, why did you select this place to settle down
(a) Married and settled here (B) To earn (C) for livelihood (D) others
(II) Questions related to basic facility in household
1. Drinking water available in your house or do you need to fetch it from somewhere
a) In-house premise b) outside house premise
2. If in-house premise, main source of potable water supply in your house
Govt.Tap / Hand pump /Tanker / water bottle / Other

3. If buying water bottles, How many bottles per month
a . < 5 b. >5 C. Do not buy water bottles
4. If outside house premise, from where you fetch drinking water
Public tap / Tube well/Bore well/Hand pump/Government Water tanker / Private water Tanker/ Others(specify)
5. How do you use water for drinking
a) boiled b) Have water puri er c) None d)Other methods
6. Do you use the same source mentioned above for potable and non potable purposes
a.Yes b. No
7. If No, Main source of non-potable water supply in your house
Personal Govt. Tap /. Government Water tanker/ Public tap / Private water Tanker/ Tube well/Bore well/Hand
pump / Others (specify)
8 Water availability
a. 24 hours b. < 5 hrs a day c. > 5 hrs a day
9. Do you pay water bill a. yes b. no
10. Do you have electricity connection a. yes b.no
11. If yes, how much is your bill amount
a.Summer- b. Winter -
12. Do you have sewer connection a. yes b. no
13. Do you know where your wastewater is being disposed o a. yes b. no
14 If yes, where-
15. Do you think quality of water in our surroundings has an impact on our health
a.yes b. no
16. If yes, what/ how-
3. Questions related to Socio-economic status of household
3.1 Do all the school-age children in your household attend school a.Yes b. No
3.2 If yes, type of school, the class they study Private/Public/ other class: ____________
3.3 If no, why not
a.Cannot a ord school fee and other school requirements
b. Children do not want to go to school
c. Lack of school in the area
d. Other_________

3.4 Do you have enough food throughout the year a. Yes b. No
4. Livelihoods and Income: Questions related to Household Economy
1. What are the main sources of income for this household
1. Myself working as ------
2. Family Business -------
3. Others -----
2. How long have you been in this profession/vocation/occupation
a. <5 years b. 5-10 years c. 10-15 years d. all my life
3. Have you ever changed your occupation- a. Yes b. No
4. If yes, to what and why
5. How much you were earning in that occupation (Monthly income)
6. Do other members of family sell their labour for cash/ or food a. Yes b.No
7. If yes, what kind of work do they do
a. Agricultural labour b. Household work c. Shop keeping d. Nothing
8. Does this household own any of the following
a. Agriculture Land b. Buildings for rent c. Nothing
9. Do the household has any Livestock
a. Yes b. NO
5. Perception of river water /Awareness and opinion about river water quality
5.1 Does the river has any value to the community a.yes b. no
5.2. What bene t does the community derive from the river
a.Water for domestic use b. Washing (washermen/women) c. Water for irrigation d. Water for livestock
e. Cultural activities/Rituals f. Nothing
5.3. Do you see any change in river water quality for last ten years a) Yes b) No
5.4 . If yes, What- a) Water quality improved b) water quality deteriorated c) Other
5.5 If deteriorated, do you think its pollution has an impact on your household income
a) Yes b) No c) Don t know

5.6. How do you assess the quality of water in river (list the local term for the same)
a. What kind of Smell -
b. Colour of water -
c. Taste of water
d. How does it feel to. Touch water
e. any other (specify)
5. 7. According to you what is the reason for the said assessment-
a. Industrial waste b.Domestic Waste
c. Agricultural waste c. other (Specify)
5. 8. Do you think river yamuna has divine quality -- a. yes b. no c. don't know
5.9. Do you think quality of water in the river has an impact on the river's divine power-
a. yes b. no c. don't know
5.10. State reason for your answer-
5.11. Do you think, now people perform less rituals related to river Yamuna
5.12 if yes, according to you what would be the reason
5.13 is there any period in the year, when the river is clean and smells normal
a. Yes b. No
5.14. Which Period
a. Monsoon b. Summer C. Winter
5.15. Do you think any period in year where river condition is really bad
a. Monsoon b. Winter C. Summer d. all around the year
5.16. Have you ever observed that river water has a ected the lives of animals and birds around
a. Yes b. No
5. 17. If Yes, State the Incident
5.18. What does you and your community doing to minimize the negative e ects
a. Puri cation plant b. Reduce domestic waste c. We just keep talking, but don't do anything
d. Nothing
5.19. What can be done to ensure sustainable use of river system
5. 20 . What is your suggestion to government regarding Yamuna Pollution
a. Close the Drains b. Strict law implementation c. others

5.21. Could you remember some of the extreme events related to river water pollution and the time of their
occurrence
5. 22. What are the evident oating objects in yamuna
a. Plastic b. Domestic waste c. dead bodies d. Organic waste e. Chemicals. f. Others
5. 23. Long before, say 15 years, when yamuna was clean, as you said, what are the main events that
were happening
a. Swimming b. Daily Pooja c. bathing d. washing e. more tourists f. others
5. 24 . What happens to your utensils when the tap water is stored for a long time
5.25. What happens to your utensils when river water is stored for a long time
6. Questions related to health
6.1 Do you think quality of water in general has an impact on human health-
a. yes b. no c. Don't know
6.2 If yes, name some disease, you know, caused by the use of polluted water
6.3 Do you think quality of water has an impact on livestock health-
a. yes b. no c. Don't know
6.4 If yes, name some disease, you know, caused by the use of polluted water
6.5. In last ve years what are the major diseases your family members have been su ering form
a. loose motions (stomach upset)
b. Fever
c. Skin infections
d. Colera
e. Kidney/ Liver failure
f. Cancer (write the a ected organ)
g. Death of any kid less than 5 years
h. Other
6.6 Do you think you get ailments because of the river water quality
a) Yes b) No c) Don t know

6.7 List the diseases you think you and people of your community have su ered in last ve years (Jan, 2014) because
of the river water quality
6.8 What type of medicines do you use for the ailments
a) Home remedies b) consult a doctor c) other
6.9 How frequent have you visited doctor for medicine in last one year
6.10 How much pressure did it pose on your monthly expenditure
6.11. How far the hospital is_
PHC Sub (Mohalla Clinic)-
PHC-
Hospital-
7. Questions for Farmers
7.1 How long have you been farming here
7.2. How many crop cycle do you have
7.3 What do you grow here
7.4 Is it your- ancestral land/ have you bought it/ on rent/lease
7.5 if on rent/ lease- how much you pay for that -(amount annually)
7.6 What is the amount of harvest are you able to get in a season
7.6.1 How much have you earn in a season (last one year)-
7.7 Have you observed any change in the size or the quality of the produce If yes, how much
7.8 What are the sources of water do you use for irrigation
a. ground water b. river water c. other
7.9 How much do you need to pay annually for water for irrigation
(electricity/ diesel/ other )
7.10 Do you need to use pesticides and fertilizers yes/No
7.11 If yes, the amount and cost (annually) of -
Fertilizers-
Pesticide-
7.12. How much pressure does spending on them pose on your income from farming
7.13 If No, why do you need not to use

7.14 Do you think frequency and amount of use of pesticide and fertilizers have changed for a particular crop, in
the last 5 to 10 years
7.15 If yes, give detail (for which crop and why)
7.16 Is there any di erence of quality in use of river water and groundwater for irrigation
7.17 If yes, what and why
7.18 How long do you leave water standing on the eld do you think there is any di erence of time for river water
and groundwater
7.19 Have you ever used river water for irrigation
7.20 if yes, did you notice any major change in the eld when you started or discontinued the use of river water
7.21. If yes, what kind of changes
7.22. Where do you sell your produce
8. Questions for Boatmen
8.1. How long have you been in this occupation
8.2. Do you - own/ rent/ other -this boat
8.3. if own, How many boats do you have
8.4. Do you lend your boat if yes, how much do you charge
8.5. If rent, how much you pay for rent
8.6 How many riders do you get on a daily/weekly basis
8.7.Has the number of riders a ected with time Yes/No
8.8.If yes. what are the reasons according to you
8.9 Is there any peak season for boat ride yes/ no
8.10. If yes, when and how much you earn during that period
8.11. Who are your main clients/customers
8.12. Do you think river water quality has an impact on your earning yes/ no
8.13. If yes, in what ways please give detail-
8.14. What are you doing to increase your income
9.1. What suggestions would you like to give to authorities/government regarding what can be done to make the
situation better
----------------------------------------------------------END-----------------------------------------

Appendix-II
1. CPCB Water Quality Criteria for Designated Best Use
Class A : Drinking Water Source without conventional treatment
Class B : Outdoor bathing
Class C : Drinking Water Source with conventional treatment
Class D : Wildlife, Fisheries
Class E : Recreation and Aesthetics, Irrigation, Industrial cooling.
Criteria Class A Class B Class C Class D Class E
DO ( mg/l) Min. 6 5 4 4 ‐
BOD (mg/l) Max. 2 3 3 ‐‐ ‐
Total Coliform Organism
(MPN/100 ml)
50 500 5,000 ‐‐ ‐
pH 6.5‐8.5 6.5‐8.5 6‐9 6.5‐8.5 6.5‐8.5
Electrical Conductivity --
at 25 °C micro
mhos/cm
maximum 2250
2. STP discharge Criteria as per NGT order, (Nitin Shankar Deshpande Vs Union of India & Ors; Original Application No. 1069/2018 (M.A. No.
1792/2018, M.A. No. 1793/2018, I.A. No. 150/2019 & I.A. No. 151/2019))
Sl. No. Parameter Standards
1 Bio-Chemical oxygen Demand (BOD) mg/l 10
2 Total Suspended Solids mg/l 20
3 Chemical Oxygen Demand (COD) mg/l 50
4 Faecal Coliform (FC) MPN/100ml Desireable-100, Permissble-230
5. Nitrogen-total mg/l 10
6. pH 5.5-9.0

Appendix-III1. Table of Trace Elements detected in river water samples
Segment Location MonthAluminium
(ppb)
Chromium
(ppb)
Manganese
(ppb)
Iron
(ppb)
Cobalt
(ppb
Nickel
(ppb)
Copper
(ppb)
Zinc
(ppb)
Arsenic
(ppb)
Cadmium
(ppb)
Lead
(ppb)
BIS Standard for Drinking
water (mg/l- ppb)200 50 300 300 -- 20 1500 15000 10 3 10
Segment-I
[Signature
bridge-
Yudhister
Bridge]
Tibeten Colony April,18 51.85 27.71 330.84 970.03 1.10 25.36 10.30 21.05 1.26 0.06 2.72
Pontoon Bridge -
Majnu ka TilaOctober,19 385 280 359 690 BDL 30 390 490 14 200 30
[Signature
bridge-Yudhister
Bridge]
October,19 433 174 463 2485 BDL 55 13 135 41 13 18
Water Treatment
Plant October,19 396 93 457 1139 BDL 45 17 57 11 12 20
Water
Treatment Plant
-Downstream
October,19 94 34 217 581 BDL 30 11 110 18 12 13
Segment-
II
[Yudhister
Bridge-
Old Iron
Bridge]
Nigambodh Ghat
April,18 118.51 40.69 173.40 1217.84 0.69 19.25 16.70 38.28 0.80 0.13 5.02
Chandni Chowk
DrainOctober,19 431 76 290 1604 BDL 41 6 192 23 13 18
Old Iron Bridge October,19 164 34 276 514 BDL 30 8 8 23 13 15
Segment-
III
[Old iron
bridge
-ITO]
ITO April,18 23.88 13.27 418.58 886.21 0.69 16.31 5.44 13.31 1.43 0.11 1.10
Old Iron Bridge October,19 164 34 276 514 BDL 30 8 8 23 13 15
Geeta Colony October,19 239 43 349 900 BDL 34 8 60 26 12 18
ITO October,19 147 36 293 692 BDL 39 13 1523 21 13 16
Segment-IV
[ITO
-Nizamuddin
Bridge]
Yamuna Bank October,19 408 29 291 999 BDL 30 13 187 16 13 21
Nizamuddin
BridgeOctober,19 132 33 323 662 BDL 29 12.4 20 10 13.2 15
[ITO
-Nizamuddin
Bridge]
October,19 116 26 229 449 BDL 30 14 36 24 13 15
Segment-v
[Nizamuddin
Bridge-
okhla]
Ohkla April,18 37.98 4.33 134.81 553.52 0.40 7.32 5.31 15.50 2.20 0.08 0.98
Ganga Vihar,Sarai
Ali Khan
October,19 107 30 270 514 BDL 30.8 10 9 28 13 13
Okhla Bird
Sanctuary
October,19 120 30 441 494 BDL 33 11 12 27 12.7 8

2. Table of Trace Metals in the River water samples and comparison with BIS standards
Parameter
"Acceptable"
Drinking Standard
Limits (ppb)
per cent Violation
"Acceptable"
Drinking
Standards
"Permissible"
Drinking Standard
Limits (ppb)
per cent Violating
"Permissible"
Drinking Standards
Aluminum (Al) 30 77.27 200 27.27
Barium (Ba) 700 0 700 0
Calcium (Ca) 75000 0 200000 0
Copper (Cu) 50 4.5 1500 0
Iron (Fe) 300 81.81 300 81.81
Magnesium (Mg) 30000 0 100000 0
Manganese (Mn) 100 81.81 300 36.36
Selenium (Se) 10 0 10 0
Silver (Ag) 100 not measured no standard not measured
Zinc (Zn) 5000 0 15000 0
Cadmium (Cd) 3 63.64 3 63.64
Lead (Pb) 10 59.09 10 59.09
Mercury (Hg) 1 not measured 1 not measured
Molybdenum (Mo) 70 not measured 70 not measured
Nickel (Ni) 20 68.18 20 68.18
Arsenic (As) 10 54.5 50 0
Chromium (Cr) 50 18.18 50 18.18
Beryllium (Be), Cobalt
(Co) and Vanadium (V)No drinking water standards given for these parameters

Parameter "Short-term"
Irrigation Standard
Limits (ppb)
Per cent Violating
"Short-term"
Irrigation Standards
"Long-term"
Irrigation Standards
Limits (ppb)
Per cent Violating
"Long-term"
Irrigation Standards
Aluminum (Al) 20000 0 5000 0
Barium (Ba) No irrigation standards given for this parameter
Calcium (Ca) No irrigation standards given for this parameter
Copper (Cu) 5000 0 200 4.55
Iron (Fe) 20000 0 5000 0
Magnesium (Mg) No irrigation standards given for this parameter
Manganese (Mn) 10000 0 200 72.7
Seleneium (Se) 20 0 20 0
Silver (Ag) no standard
Zinc (Zn) 10000 0 2000 0
Cadmium (Cd) 50 4.55 10 63.64
Lead (Pb) 10000 0 5000 0
Mercury (Hg) No irrigation standards given for this parameter
Molybdenum (Mo) 50 not measured 10 not measured
Nickel (Ni) 2000 0 200 0
Arsenic (As) no standard no standard
Chromium (Cr) 1000 0 100 9
Beryllium (Be) 5000 0 100 0
Cobalt (Co) 5000 0 50 0
Vanadium (V) 1000 0 100 0

3.Table of Lab Parameter results
Segment Location Year Month COD ppm BOD ppm TC
MPN/100ml
FC
MPN/100ml
MOEFCC STP discharge,2017 50 10 - 100
CPCB outdoor bathing Standard, 2019 - 3 500 -
Signature Bridge- Yudhister Bridge
Tibetan Colony
2018
April 500 90 920 4
Tibetan Colony September 11.8 1 2 2
Water Treatment plant September 4 1 2 2
Opposite direction of Water
Treatment plant_East
September 4 1 2 0
Tibetan Colony
2019
January 200 12.1
Gurudwara_Majnu ka tila January 200 10.9
Water Treatment plant January 60 11.2
Signature Bridge_east side February 36.2 7.8 46
Under the Signature Bridge_
east
April 15.9 170
Signature bridge September 44 21 940 690
Water Treatment Plant September 110 46 250 210
Water Treatment Plant-
Downstream
September 188 66 820 480
Downstream of Signature bridge – East
(Usmanpur)
October 48 13 280 170
Water Treatment Plant October 52 16 220 130
Water Treatment Plant-
Downstream
October 32 8.6 350 220
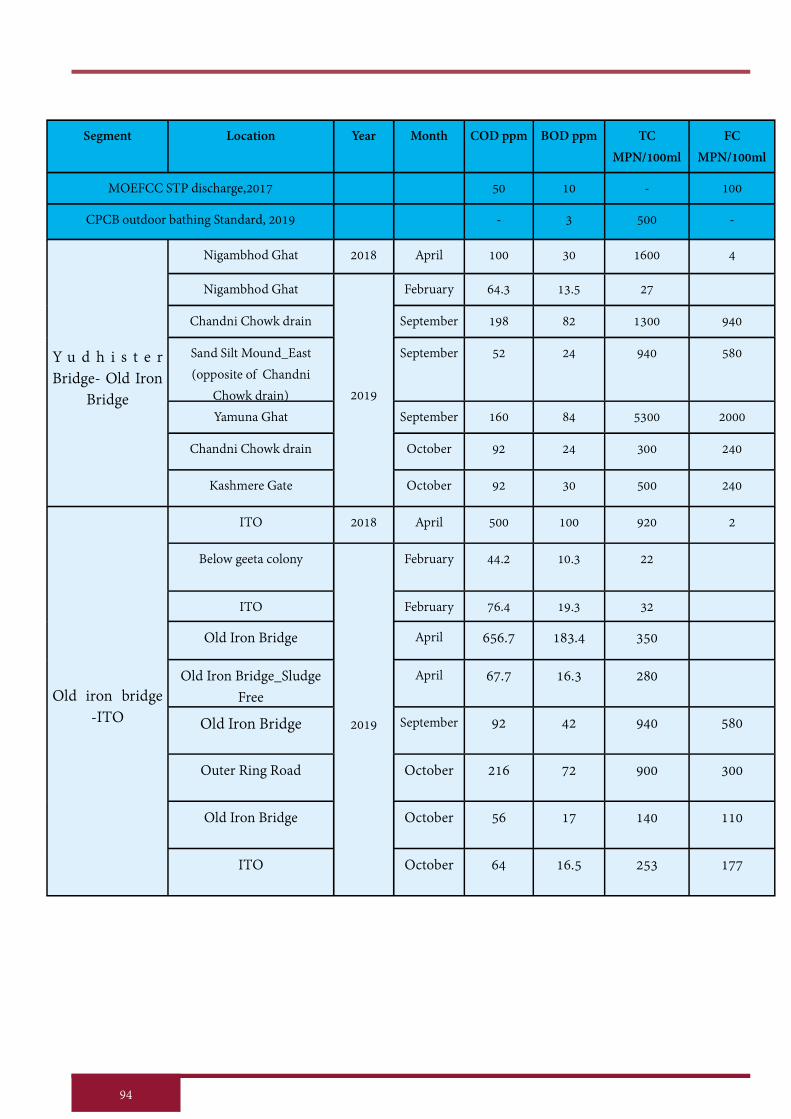
Segment Location Year Month COD ppm BOD ppm TC
MPN/100ml
FC
MPN/100ml
MOEFCC STP discharge,2017 50 10 - 100
CPCB outdoor bathing Standard, 2019 - 3 500 -
Y u d h i s t e r Bridge- Old Iron
Bridge
Nigambhod Ghat 2018 April 100 30 1600 4
Nigambhod Ghat
2019
February 64.3 13.5 27
Chandni Chowk drain September 198 82 1300 940
Sand Silt Mound_East
(opposite of Chandni
Chowk drain)
September 52 24 940 580
Yamuna Ghat September 160 84 5300 2000
Chandni Chowk drain October 92 24 300 240
Kashmere Gate October 92 30 500 240
Old iron bridge -ITO
ITO 2018 April 500 100 920 2
Below geeta colony
2019
February 44.2 10.3 22
ITO February 76.4 19.3 32
Old Iron Bridge April 656.7 183.4 350
Old Iron Bridge_Sludge
Free
April 67.7 16.3 280
Old Iron Bridge September 92 42 940 580
Outer Ring Road October 216 72 900 300
Old Iron Bridge October 56 17 140 110
ITO October 64 16.5 253 177

![Complexitat i fenomen (socio)lingüístic [Complexity and (socio)linguistic phenomenon]](https://static.fdokumen.com/doc/165x107/63130623c32ab5e46f0c3b37/complexitat-i-fenomen-sociolingueistic-complexity-and-sociolinguistic-phenomenon.jpg)