Water Quality Parameters and Monitoring Soft Surface Water ...
16
Chapter Water Quality Parameters and Monitoring Soft Surface Water Quality Using Statistical Approaches Romana Drasovean and Gabriel Murariu Abstract Water is the matrix of life and is indispensable on Earth. Water has a multitude of applications and all known life forms depend on it. Therefore, water quality is important for all of us. Water quality can be represented by a set of physical, chemical, biological and bacteriological characteristics. These parameters allow water to be classified in multiple categories leading to its use for a specific purpose. This chapter establishes the connections between external causes and their effect on water quality parameters. In order to provide information on water quality, differ- ent Water Quality Index (WQI) models can be used. In order to study the associa- tion between water quality parameters, several correlation coefficients have been developed. For a coherent statistical approach, we have used Pearson and Spearman correlations. In order to exemplify the manner in which WQI can be calculated and interpreted, we used a series of data from our previous work, consisting of 13 parameters measured for water samples taken from the Danube River, from Galati City area, Romania. Keywords: water quality, correlation coefficient, quality index 1. Introduction Water is a common “good” of the whole society and is essential for human, animal and plant life and has a multitude of uses. 1.1 Water classification Water can be classified according to its source into [1, 2]: 1. Surface water (water located at the surface of the soil) - Surface water sources are represented by running waters, water seas, oceans, rivers, lakes, icebergs; 2. Groundwater water below the surface in the saturated area and in direct contact with soil or subsoil. Groundwater sources are represented by groundwater aquifers, deep aquifers, springs; and, 1
-
Upload
khangminh22 -
Category
Documents
-
view
3 -
download
0
Transcript of Water Quality Parameters and Monitoring Soft Surface Water ...
Chapter
Water Quality Parameters andMonitoring Soft Surface WaterQuality Using StatisticalApproachesRomana Drasovean and Gabriel Murariu
Abstract
Water is the matrix of life and is indispensable on Earth. Water has a multitudeof applications and all known life forms depend on it. Therefore, water quality isimportant for all of us. Water quality can be represented by a set of physical,chemical, biological and bacteriological characteristics. These parameters allowwater to be classified in multiple categories leading to its use for a specific purpose.This chapter establishes the connections between external causes and their effect onwater quality parameters. In order to provide information on water quality, differ-ent Water Quality Index (WQI) models can be used. In order to study the associa-tion between water quality parameters, several correlation coefficients have beendeveloped. For a coherent statistical approach, we have used Pearson and Spearmancorrelations. In order to exemplify the manner in which WQI can be calculated andinterpreted, we used a series of data from our previous work, consisting of 13parameters measured for water samples taken from the Danube River, from GalatiCity area, Romania.
Keywords: water quality, correlation coefficient, quality index
1. Introduction
Water is a common “good” of the whole society and is essential for human,animal and plant life and has a multitude of uses.
1.1 Water classification
Water can be classified according to its source into [1, 2]:
1.Surface water (water located at the surface of the soil) - Surface water sourcesare represented by running waters, water seas, oceans, rivers, lakes, icebergs;
2.Groundwater water below the surface in the saturated area and in directcontact with soil or subsoil. Groundwater sources are represented bygroundwater aquifers, deep aquifers, springs; and,
1

3.Atmospheric water.
According to the field of use, the water is classified as:
1.Drinking water: for domestic consumption and for agriculture; and,
2.Industrial water: auxiliary in manufacturing processes, raw material forvarious industries, power generator, coolant agent, heating agent, etc.
Wastewater is water that has changed its original properties through use, inother words has been contaminated by human beings [2].
1.2 Water quality
Water quality is represented by a set of physical, chemical, biological andbacteriological characteristics. These characteristics are also called parametersor indicators. Physical, chemical, biological and bacteriological parametersallow water to be classified in some categories, leading to its utilization for aspecific use.
Water quality requirements depend on the purposes for which the water will beused. Thus, drinking water must not contain chemicals or micro-organisms whichcan affect the human health. Water used in agriculture must not contain largeamounts of sodium ions, high concentrations of nitrates or high concentrations ofother contaminants. Requirements for water use in industry are less rigorous thandrinking water [3].
Water quality also depends on the type of water source and changes withgeological, meteorological and land use conditions. The World Health Organization(WHO) has established regulations and standards for water safety in support ofpublic health [3]. The European Union has, also, established a legal framework forwater protection [4]. Water quality criteria in all countries have been established inaccordance with the WHO guidelines [3]. In European countries, the frameworkdirectives of the European Union are closely followed [4].
The EU Framework Directive requires that operational monitoring should bespecific and based on monitoring relevant biological, hydro-morphological andphysic-chemical parameters. These world environmental monitoring systems pro-vide for water quality measurements in three categories of parameters:
1.Basic parameters: Temperature, pH, Conductivity, Dissolved Oxygen (DO),Total Dissolved Solids (TDS), Coli bacilli, Biochemical Oxygen Consumption(CBO5), Turbidity, Nitrites and Phosphates concentration;
2.Indicators of persistent pollution: Cadmium, Mercury, Organo-halogencompounds and Mineral oils; and,
3.Optional parameters: Total Organic Carbon (TOC), Anionic detergents, Heavymetals, Arsenic, Boron, Sodium, Cyanides, Total oils, Streptococci [3].
Water quality monitoring indicators established by the European Union rulesare grouped according to their common characteristics as it follows [4, 5]:
1. Indicators that give information about oxygen condition: Dissolved Oxygen,Biochemical Oxygen Consumption (CBO5), Chemical Oxygen Consumptionwith chromium, Chemical Oxygen Consumption with manganese;
2
Promising Techniques for Wastewater Treatment and Water Quality Assessment

2.Indicators that give information about the presence of nutrients thatcontribute to eutrophication: Ammonium (NH4
+), Nitrates (NO2�), Nitrites
(NO3�), Total nitrogen (N), Orthophosphates (PO4
3�), Total phosphorus (P);
3.Salinity indicators: Chlorides (Cl�), Sulphates (SO42�), Ca2+, Mg2+, Na+;
4.Heavy metals (e.g. Fe, Cu, Cd, Pb, Hg); and,
5.Other relevant indicators: Phenols, Anionic surfactants, Absorbed organichalides [4, 5].
To understand the overall health of an ecosystem and the condition of water, anumber of water quality parameters or indicators must be analyzed and monitored.In 1998, Sene and Farquharson [6] stated that monitoring of the surface waterquality is necessary to assess spatial and temporal regional variations. The process ofmonitoring the quality of ambient water has led to the development of waterstandards and the periodic assessments of the environment.
The monitoring program and the parameters to be measured for the study ofwater quality should be chosen specifically for each locality and each type of water.Although many parameters of water are important for human health or the healthof an ecosystem, the analysis of all parameters is not feasible. The standards rec-ommend the analysis of specific parameters for both drinking water and non-drinking water [6, 7].
Chemical and physical parameters are important in the rapid determination ofwater quality while biological parameters provide a detailed and complex analysis ofthe environment [8].
1.2.1 General physico-chemical parameters
Temperature is an important parameter that influences the chemical properties ofwater. Temperature affects the density and stratification of water, the density andviscosity of transported sediments, solubility of dissolved gases, vapor pressure [9].
pH is determined only at the place where the sample was collected, directly fromthe water source while also determining the air temperature. Due to the presence ofcarbon dioxide, bicarbonates, and carbonates, the pH of the water varies very littlefrom the neutral pH. The pH of natural water is usually in the range 6.5–8. The pH ofthewastewater can be alkaline if pH is higher than 7 or acidic if pH is lower than 7 [10].
The conductivity of water is given by the presence of ions in the solution, ionsthat have the property of transmitting electric current. The higher the ionic con-centration of the solution is, the higher the conductivity gets. The conductivityvalue depends on the amount of substances dissolved in the water. As a rule, highturbidity value also implies a high conductivity [10].
Turbidity expresses the amount of light reflected or absorbed by particlessuspended in a water sample and is a measure of its relative clarity. Turbidity is dueto solid particles in the form of suspensions or in a colloidal state [10].
1.2.2 Chemical parameters
1.2.2.1 Oxygen regime indicators
Dissolved Oxygen is an indicator of water quality whose values are dependent on thetype of the water. The amount of oxygen dissolved in water depends on water temper-ature, air pressure and the quantity of acidic substances and microorganisms.
3
Water Quality Parameters and Monitoring Soft Surface Water Quality Using Statistical…DOI: http://dx.doi.org/10.5772/intechopen.97372

Oxygen is necessary for aquatic life. A series of aerobic chemical processes takeplace through dissolved oxygen: the oxidation processes of organic matter, oxida-tion of mineral substances, and bio-chemical decomposition of the dead bodies inwater [9]. With the decrease of oxygen, the self-purification capacity of naturalwater is reduced, favoring the persistence of pollution with its undesirable conse-quences. Other indicators of oxygen regime are Biochemical Oxygen Consumption(CBO5) and Chemical Oxygen Consumption (CCO). Biochemical Oxygen Consump-tion (CBO5) is the amount of oxygen consumed by microorganisms, during a 5 dayperiod, for the biochemical decomposition of organic substances contained inwater, at a temperature of 20°C. Chemical Oxygen Consumption with chromium(CCOCr) is an integral index of the existence of difficult degradable organic sub-stances. Chemical Oxygen Consumption with manganese (CCOMn) is a comprehen-sive index of the existence of easily degradable organic substances [11].
1.2.2.2 Biogenic indicators
Nitrites in water represent the incomplete oxidation of organic nitrogen. Theirpresence in the water indicates an old pollution, because the transformation oforganic substances containing nitrogen under the action of microorganisms firstconvert into ammonia then ammonia converts into nitrites. Therefore, the concen-tration of nitrites in the water may indicate an old pollution because all these trans-formations take time. Under normal oxygenation of natural water, nitrogen appearsin the form of nitrates. The chemical forms of nitrite and ammonium are presentwhen water pollution occurs and are toxic to living organisms [10].
Nitrates represent the final stage of oxidation of organic nitrogen. If ammonia,nitrites and nitrates are present simultaneously in the water, this indicates a con-tinuous pollution. The simultaneous presence of ammonia and nitrates in the waterindicates an intermittent pollution [11].
The phosphate content in natural water is relatively low. High amounts ofphosphorus in water can come from excessive use of nitrogen and phosphorusfertilizers. Higher concentrations of phosphorus in surface water can result ineutrophication.
1.2.2.3 Salinity indicators
Salinity is the content of mineral salts in water, mainly metal salts such assodium, magnesium and calcium. The salts present in natural water are formed bythe following cations Ca2+, Mg2+, Na+, K+ and anions HCO3
�, SO42�, Cl�.
The chlorides in the water come either from natural soil layers, pollution oranimal origin. The amount of chlorides that are released from the soil is relativelyconstant and varies slightly over time. A significant increase in chloride content isusually an index of organic pollution [11].
Hardness is an indirect indicator of the degree of mineralization of water.
1.2.2.4 Heavy metals
Heavy metals are those metals that have a high density (i.e. 5 g/cm3) [10]. In lowconcentrations, heavy metal ions are essential for the development of metabolicprocesses in plants and animals. These metals (e.g., cadmium, chromium, cobalt,lead, nickel, mercury, selenium) can come from natural or anthropogenic processes.If certain concentrations are exceeded, then they become toxic substances for theliving organisms.
4
Promising Techniques for Wastewater Treatment and Water Quality Assessment
1.2.3 Biological and bacteriological indicators
Water quality and its changes due to various forms of pollution may influencethe composition of aquatic biocenoses. Biological analysis consists of an inventoryof phytoplankton, zooplankton, benthic organisms or periphyton from watersamples.
The microbial flora found in the water can be classified into two categories:water-specific microbial flora and microbial impurity flora. Water-specific micro-bial flora consists of microorganisms that commonly inhabit water and soil: coccibacilli, different fungi and bacterial species which play a role in the natural degra-dation processes of organic substances. Microbial impurity flora consists of speciesof microorganisms of human or animal origin. This category can include pathogenicsaprophytes. These microbes are generally accompanied by high concentrations oforganic matter which provide their nutritional support [11].
In bacteriological analysis of water, the total number of germs and the determi-nation of the bacillus coli have been adopted as bacteriological indicators.
2. Statistical analyses for assessing the surface water quality parameters
Water quality is determined by the biological, chemical and physical parametersof the water. Most often, it is not enough to measure these water quality indicators.In order to draw some solid conclusions, it is necessary to apply adequate statisticalmethod to the measurements. These statistical methods can provide useful infor-mation that can lead to actionable advice regarding water management. There are alarge number of statistical methods for examining water quality.
The main differences between these methods are the statistical techniques usedand the significance of the values determined for each parameter. Statistical indicesdeveloped using water quality parameters can be linear, non-linear, segmentedlinear or segmented non-linear [12]. In order to have a global vision of the changesof the water quality in space and in time, various indices have been developed [13].
The water quality index (WQI) is represented by a number that expresses thegeneral water quality in a particular location, over time, based on several waterquality parameters. The aim of this index is to transform a large number of complexwater quality measurements into information that is easy for water managers andthe public to understand and to use. Are a multitude of methods for calculatingwater quality indices (WQI). In the following, we present the weighted averagemethod. This method was proposed by Horton in 1965 and developed by Brownet al. in the year 1970 [14].
For the calculation of the WQI, the following expression was used [15–19]:
WQI ¼P
qnWnPWn
(1)
where:n is the number of the water quality parameters.Wn is the Unit Weight:
Wn ¼ KSn
(2)
qn is the Quality rating:
5
Water Quality Parameters and Monitoring Soft Surface Water Quality Using Statistical…DOI: http://dx.doi.org/10.5772/intechopen.97372

qn ¼ Vn � Vid
Sn � Vid� 100 (3)
where:Vn represents the measured value for the nth parameter of the water
corresponding to a given sample;Vid is the ideal value for the n
th parameter corresponding to pure water; Vid
values are zero for most parameters except for pH and dissolved oxygen. Vid for thepH is 7 and for dissolved oxygen (DO) is 14.6 mg/l [20].
Sn represents the standard value allowed for the nth parameter;K it is a constant of proportionality calculated with the formula:
K ¼ 1P 1Sn
: (4)
Water quality is Excellent if the WQI index score is between 0 and 25; Good forvalues of 26–50; Poor for WQI = 51–75; and, Very Poor for values between 76 and100. If the value of the WQI index exceeds the value of 100, then the water isunsuitable for drinking and cannot be transformed into drinking water by anyprocess [19, 21].
To study the relationship between two parameters of water samples, severalcorrelation coefficients can be used. The statistics used most often are Pearson andSpearman coefficients. Linear correlation can be determined using the Pearsoncorrelation coefficient while non-linear correlation can be determined usingthe Spearman coefficient. The Pearson correlation coefficient is a statistical tech-nique that measures and describes the degree of linear association between twonormally distributed continuous quantitative variables [21]. Let x and y be twovariables, in our case two indicators of water quality. The Pearson coefficient, r, iscalculated using the expression:
r ¼ SxySx ∙ Sy
; r ¼P
x� xð Þ y� yð ÞffiffiffiffiffiffiffiffiffiffiffiffiffiffiffiffiffiffiffiffiffiffiffiffiffiffiffiffiffiffiffiffiffiffiffiffiffiffiPx� xð Þ2 y� yð Þ2
q (5)
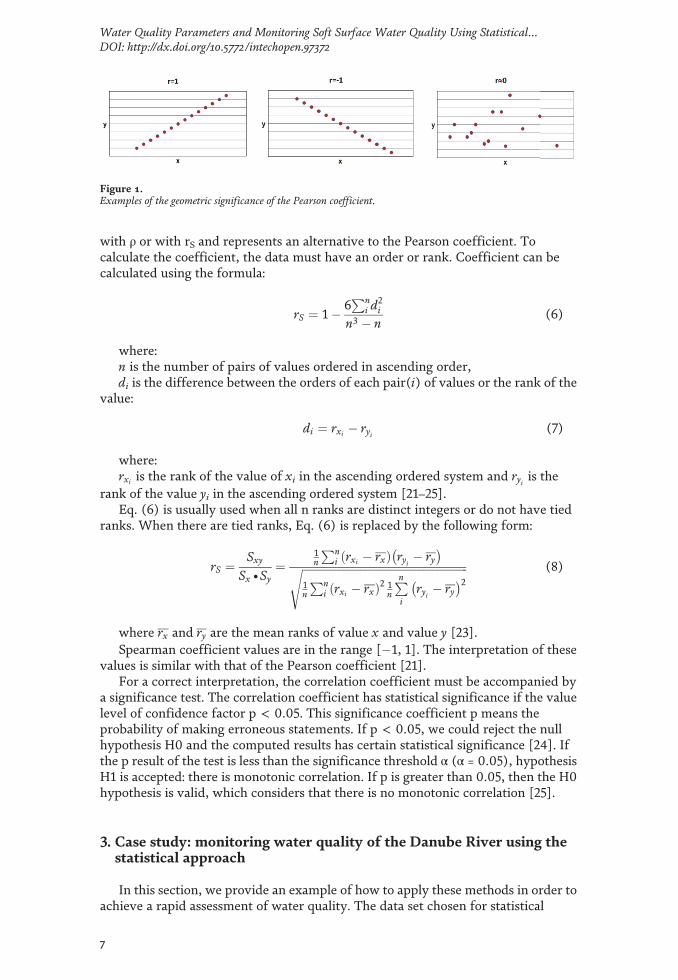
where Sxy represents the covariance, Sx and Sy are the standard deviations of thetwo variables x and y; x and y and are the mean values of the two variables x and y[21]. The Pearson coefficient takes values between �1 and + 1. The value of thecoefficient indicates the strength of the relationship between parameters while thesign of the coefficient indicates the direction of the linear association. If the sign ispositive, the two variables are directly correlated and, if the sign is negative, the twovariables are inversely correlated. The closer of the Pearson correlation coefficient isto the value of 1, the stronger the “intensity” of the linear relationship between thetwo variables [21]. The variables x and y are independent if r has the value 0(Figure 1).
The minimum value of the Pearson coefficient (r = 0) is not an indicator ofindependence of the two characteristics (variables), but only of their non-correlation. The coefficient of determination (r2) is the square of the Pearsoncoefficient. The coefficient of determination indicates the percentage of the totalvariation of the dependent variable (y) which is explained by the independentvariable (x).
Spearman method is a non-parametric method used when the relationshipbetween two variables is not linear (monotonic correlation) [23–25]. The Spearmancoefficient addresses some limitations of the Pearson coefficient. It is denoted either
6
Promising Techniques for Wastewater Treatment and Water Quality Assessment
with ρ or with rS and represents an alternative to the Pearson coefficient. Tocalculate the coefficient, the data must have an order or rank. Coefficient can becalculated using the formula:
rS ¼ 1� 6Pn
i d2i
n3 � n(6)
where:n is the number of pairs of values ordered in ascending order,di is the difference between the orders of each pair(i) of values or the rank of the
value:
di ¼ rxi � ryi (7)
where:rxi is the rank of the value of xi in the ascending ordered system and ryi is the
rank of the value yi in the ascending ordered system [21–25].Eq. (6) is usually used when all n ranks are distinct integers or do not have tied
ranks. When there are tied ranks, Eq. (6) is replaced by the following form:
rS ¼Sxy
Sx ∙ Sy¼
1n
Pni rxi � rxð Þ ryi � ry
� �ffiffiffiffiffiffiffiffiffiffiffiffiffiffiffiffiffiffiffiffiffiffiffiffiffiffiffiffiffiffiffiffiffiffiffiffiffiffiffiffiffiffiffiffiffiffiffiffiffiffiffiffiffiffiffiffiffiffiffiffi1n
Pni rxi � rxð Þ2 1
n
Pni
ryi � ry� �2s (8)
where rx and ry are the mean ranks of value x and value y [23].Spearman coefficient values are in the range [�1, 1]. The interpretation of these
values is similar with that of the Pearson coefficient [21].For a correct interpretation, the correlation coefficient must be accompanied by
a significance test. The correlation coefficient has statistical significance if the valuelevel of confidence factor p < 0.05. This significance coefficient p means theprobability of making erroneous statements. If p < 0.05, we could reject the nullhypothesis H0 and the computed results has certain statistical significance [24]. Ifthe p result of the test is less than the significance threshold α (α = 0.05), hypothesisH1 is accepted: there is monotonic correlation. If p is greater than 0.05, then the H0hypothesis is valid, which considers that there is no monotonic correlation [25].
3. Case study: monitoring water quality of the Danube River using thestatistical approach
In this section, we provide an example of how to apply these methods in order toachieve a rapid assessment of water quality. The data set chosen for statistical
Figure 1.Examples of the geometric significance of the Pearson coefficient.
7
Water Quality Parameters and Monitoring Soft Surface Water Quality Using Statistical…DOI: http://dx.doi.org/10.5772/intechopen.97372
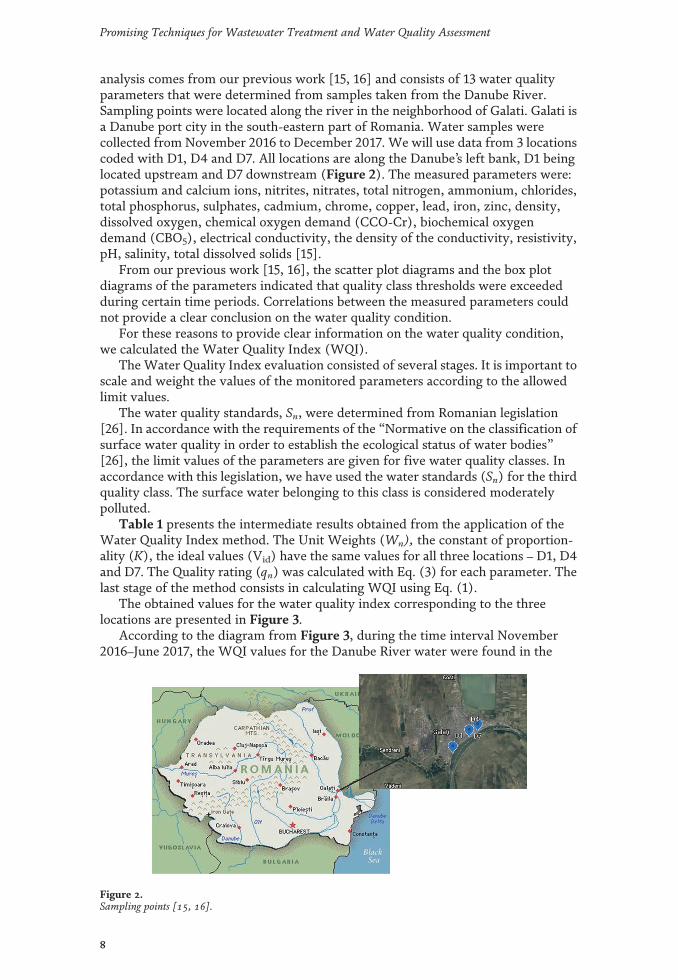
analysis comes from our previous work [15, 16] and consists of 13 water qualityparameters that were determined from samples taken from the Danube River.Sampling points were located along the river in the neighborhood of Galati. Galati isa Danube port city in the south-eastern part of Romania. Water samples werecollected from November 2016 to December 2017. We will use data from 3 locationscoded with D1, D4 and D7. All locations are along the Danube’s left bank, D1 beinglocated upstream and D7 downstream (Figure 2). The measured parameters were:potassium and calcium ions, nitrites, nitrates, total nitrogen, ammonium, chlorides,total phosphorus, sulphates, cadmium, chrome, copper, lead, iron, zinc, density,dissolved oxygen, chemical oxygen demand (CCO-Cr), biochemical oxygendemand (CBO5), electrical conductivity, the density of the conductivity, resistivity,pH, salinity, total dissolved solids [15].
From our previous work [15, 16], the scatter plot diagrams and the box plotdiagrams of the parameters indicated that quality class thresholds were exceededduring certain time periods. Correlations between the measured parameters couldnot provide a clear conclusion on the water quality condition.
For these reasons to provide clear information on the water quality condition,we calculated the Water Quality Index (WQI).
TheWater Quality Index evaluation consisted of several stages. It is important toscale and weight the values of the monitored parameters according to the allowedlimit values.
The water quality standards, Sn, were determined from Romanian legislation[26]. In accordance with the requirements of the “Normative on the classification ofsurface water quality in order to establish the ecological status of water bodies”[26], the limit values of the parameters are given for five water quality classes. Inaccordance with this legislation, we have used the water standards (Sn) for the thirdquality class. The surface water belonging to this class is considered moderatelypolluted.
Table 1 presents the intermediate results obtained from the application of theWater Quality Index method. The Unit Weights (Wn), the constant of proportion-ality (K), the ideal values (Vid) have the same values for all three locations – D1, D4and D7. The Quality rating (qn) was calculated with Eq. (3) for each parameter. Thelast stage of the method consists in calculating WQI using Eq. (1).
The obtained values for the water quality index corresponding to the threelocations are presented in Figure 3.
According to the diagram from Figure 3, during the time interval November2016–June 2017, the WQI values for the Danube River water were found in the
Figure 2.Sampling points [15, 16].
8
Promising Techniques for Wastewater Treatment and Water Quality Assessment
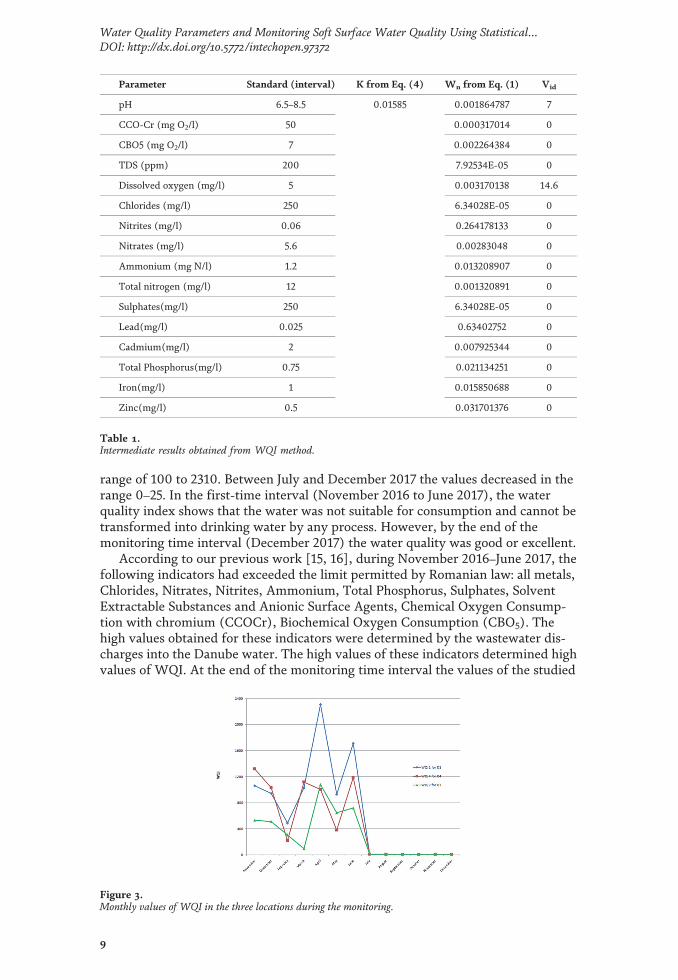
range of 100 to 2310. Between July and December 2017 the values decreased in therange 0–25. In the first-time interval (November 2016 to June 2017), the waterquality index shows that the water was not suitable for consumption and cannot betransformed into drinking water by any process. However, by the end of themonitoring time interval (December 2017) the water quality was good or excellent.
According to our previous work [15, 16], during November 2016–June 2017, thefollowing indicators had exceeded the limit permitted by Romanian law: all metals,Chlorides, Nitrates, Nitrites, Ammonium, Total Phosphorus, Sulphates, SolventExtractable Substances and Anionic Surface Agents, Chemical Oxygen Consump-tion with chromium (CCOCr), Biochemical Oxygen Consumption (CBO5). Thehigh values obtained for these indicators were determined by the wastewater dis-charges into the Danube water. The high values of these indicators determined highvalues of WQI. At the end of the monitoring time interval the values of the studied
Parameter Standard (interval) K from Eq. (4) Wn from Eq. (1) Vid
pH 6.5–8.5 0.01585 0.001864787 7
CCO-Cr (mg O2/l) 50 0.000317014 0
CBO5 (mg O2/l) 7 0.002264384 0
TDS (ppm) 200 7.92534E-05 0
Dissolved oxygen (mg/l) 5 0.003170138 14.6
Chlorides (mg/l) 250 6.34028E-05 0
Nitrites (mg/l) 0.06 0.264178133 0
Nitrates (mg/l) 5.6 0.00283048 0
Ammonium (mg N/l) 1.2 0.013208907 0
Total nitrogen (mg/l) 12 0.001320891 0
Sulphates(mg/l) 250 6.34028E-05 0
Lead(mg/l) 0.025 0.63402752 0
Cadmium(mg/l) 2 0.007925344 0
Total Phosphorus(mg/l) 0.75 0.021134251 0
Iron(mg/l) 1 0.015850688 0
Zinc(mg/l) 0.5 0.031701376 0
Table 1.Intermediate results obtained from WQI method.
Figure 3.Monthly values of WQI in the three locations during the monitoring.
9
Water Quality Parameters and Monitoring Soft Surface Water Quality Using Statistical…DOI: http://dx.doi.org/10.5772/intechopen.97372

indicators have improved. This improvement is found in the low values of WQI.The substantial improvement in water quality that occurred is due to the actionstaken by the organizations responsible for environmental protection.
Figure 4 shows the boxplot diagram representing the main values of WQI in the3 chosen locations. The average values of WQI are influenced by the extremevalues. According to the 3rd quartile (Q3) and the median of the upper half of thedata set, 75% of the values in the data set lie below Q3. The high average and medianvalues, the values of the 3rd quartile frame depict waters as having severe pollution.
The value of the third quartile indicates that 75% of the determined values ofWQI fall into the category of highly polluted waters. Based on Figure 3, only 25%(the 1st quartile - Q1) of the values of the WQI lie below low values that wouldclassify the studied water into the category of unpolluted waters. The informationobtained from the WQI calculation was particularly useful in order to analyze howthe overall water quality has evolved over time.
An easy method to identify possible sources of pollution is to calculate thecorrelations between the measured parameters. Using a Pearson Correlation Matrix[15] there was a strong positive linear correlation between TDS and Salinity(r = 0.9394) and TDS and Electrical Conductivity EC (r = 0.9174). Significantcorrelations also existed between the nitrites concentration and pH and between thenitrates concentration and pH there was a moderate negative corelation (r = �0.65and � 0.68 respectively).
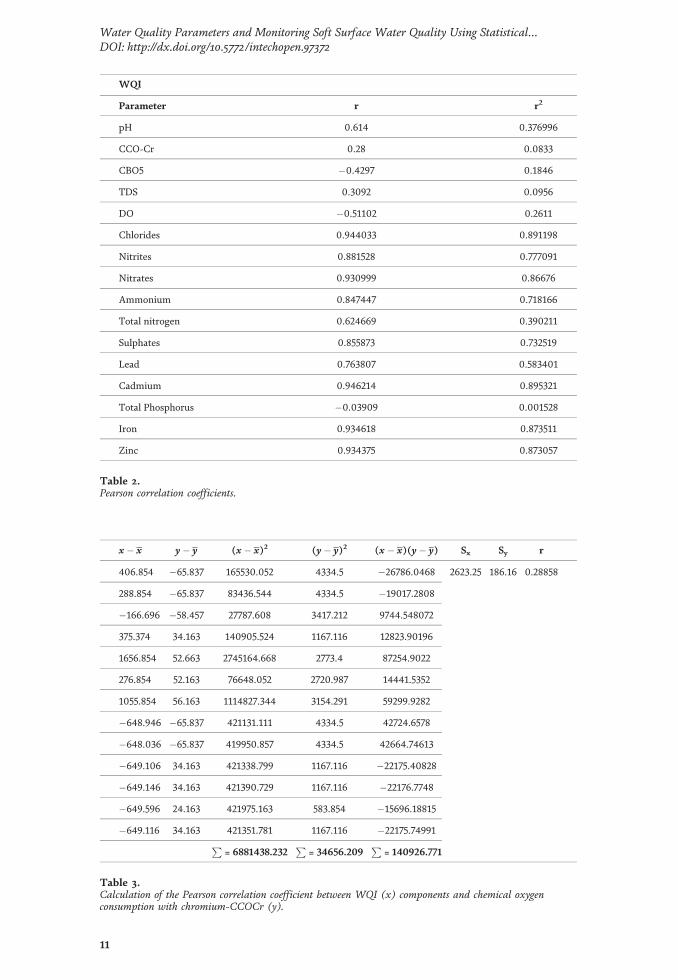
To identify possible sources of pollution, the Pearson correlation matrix wascomputed between WQI and a series of measured parameters (Table 2).
In the absence of dedicated statistical software, the correlation coefficients canalso be determined using free tabular software tool. We could exemplify quite easilythis technique, for the Pearson coefficient between WQI and CCOCr, for the firstlocation D1 (Table 3).
Table 3 shows the values of Pearson Correlation Coefficient (r) and coefficientof determination (r2) for the water quality data set. The major influence of severalparameters on the high values of WQI is due to strong positive correlation values.Therefore, excessive pollution was likely due to the presence of high concentrationsof chlorides, nitrates, nitrites, ammonium, sulphates, lead, cadmium, iron, zinc.
The values of coefficient of determination (r2) indicate that 89% of the varianceof WQI is explained by the chlorides and cadmium concentrations while 87% is dueto effect of iron and zinc. Nitrates concentration in the Danube River water explains86% variation of the WQI. The high levels of covariance explained by the threegroupings suggest significant co-linearity among the nutrient groups.
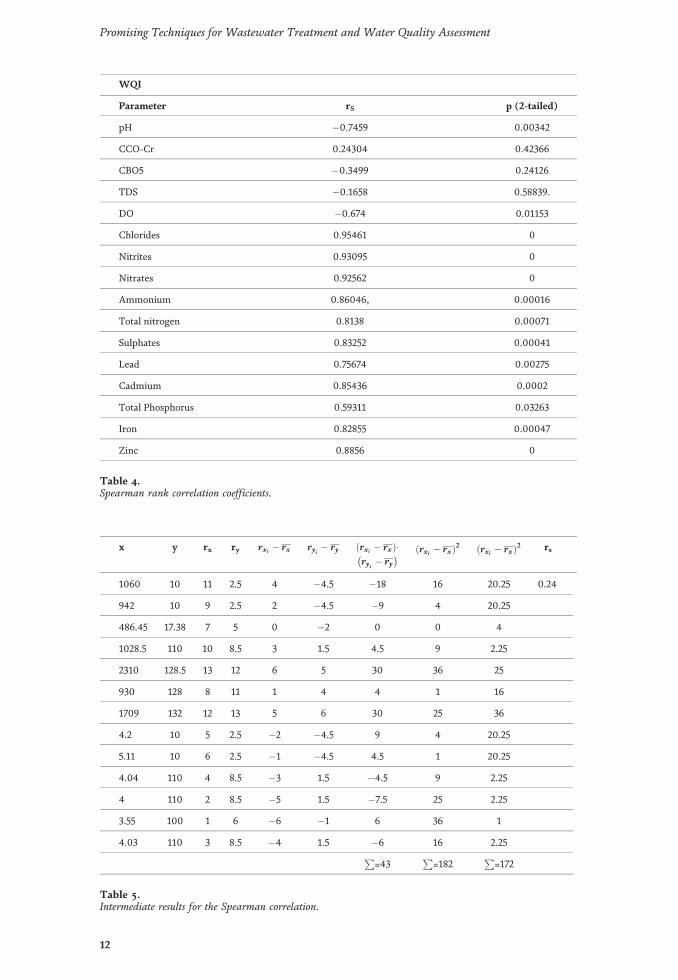
The strength and direction of monotonic association between water qualityvariables can be highlighted by the Spearman correlation. Table 4 shows the
Figure 4.Boxplot diagram of WQI in the locations D1, D3, D7.
10
Promising Techniques for Wastewater Treatment and Water Quality Assessment
WQI
Parameter r r2
pH 0.614 0.376996
CCO-Cr 0.28 0.0833
CBO5 �0.4297 0.1846
TDS 0.3092 0.0956
DO �0.51102 0.2611
Chlorides 0.944033 0.891198
Nitrites 0.881528 0.777091
Nitrates 0.930999 0.86676
Ammonium 0.847447 0.718166
Total nitrogen 0.624669 0.390211
Sulphates 0.855873 0.732519
Lead 0.763807 0.583401
Cadmium 0.946214 0.895321
Total Phosphorus �0.03909 0.001528
Iron 0.934618 0.873511
Zinc 0.934375 0.873057
Table 2.Pearson correlation coefficients.
x� x y� y (x� x)2 (y� y)2 (x� x)(y� y) Sx Sy r
406.854 �65.837 165530.052 4334.5 �26786.0468 2623.25 186.16 0.28858
288.854 �65.837 83436.544 4334.5 �19017.2808
�166.696 �58.457 27787.608 3417.212 9744.548072
375.374 34.163 140905.524 1167.116 12823.90196
1656.854 52.663 2745164.668 2773.4 87254.9022
276.854 52.163 76648.052 2720.987 14441.5352
1055.854 56.163 1114827.344 3154.291 59299.9282
�648.946 �65.837 421131.111 4334.5 42724.6578
�648.036 �65.837 419950.857 4334.5 42664.74613
�649.106 34.163 421338.799 1167.116 �22175.40828
�649.146 34.163 421390.729 1167.116 �22176.7748
�649.596 24.163 421975.163 583.854 �15696.18815
�649.116 34.163 421351.781 1167.116 �22175.74991P= 6881438.232
P= 34656.209
P= 140926.771
Table 3.Calculation of the Pearson correlation coefficient between WQI (x) components and chemical oxygenconsumption with chromium-CCOCr (y).
11
Water Quality Parameters and Monitoring Soft Surface Water Quality Using Statistical…DOI: http://dx.doi.org/10.5772/intechopen.97372
WQI
Parameter rS p (2-tailed)
pH �0.7459 0.00342
CCO-Cr 0.24304 0.42366
CBO5 �0.3499 0.24126
TDS �0.1658 0.58839.
DO �0.674 0.01153
Chlorides 0.95461 0
Nitrites 0.93095 0
Nitrates 0.92562 0
Ammonium 0.86046, 0.00016
Total nitrogen 0.8138 0.00071
Sulphates 0.83252 0.00041
Lead 0.75674 0.00275
Cadmium 0.85436 0.0002
Total Phosphorus 0.59311 0.03263
Iron 0.82855 0.00047
Zinc 0.8856 0
Table 4.Spearman rank correlation coefficients.
x y rx ry rxi � rx ryi � ry rxi � rxð Þ�ryi � ry� � rxi � rxð Þ2 rxi � rxð Þ2 rs
1060 10 11 2.5 4 �4.5 �18 16 20.25 0.24
942 10 9 2.5 2 �4.5 �9 4 20.25
486.45 17.38 7 5 0 �2 0 0 4
1028.5 110 10 8.5 3 1.5 4.5 9 2.25
2310 128.5 13 12 6 5 30 36 25
930 128 8 11 1 4 4 1 16
1709 132 12 13 5 6 30 25 36
4.2 10 5 2.5 �2 �4.5 9 4 20.25
5.11 10 6 2.5 �1 �4.5 4.5 1 20.25
4.04 110 4 8.5 �3 1.5 �4.5 9 2.25
4 110 2 8.5 �5 1.5 �7.5 25 2.25
3.55 100 1 6 �6 �1 6 36 1
4.03 110 3 8.5 �4 1.5 �6 16 2.25P=43
P=182
P=172
Table 5.Intermediate results for the Spearman correlation.
12
Promising Techniques for Wastewater Treatment and Water Quality Assessment
Spearman coefficients between the WQI and the water quality indicators that weremeasured.
Table 4 shows the high values obtained for WQI are associated with the highvalues obtained for chlorides, nitrates, nitrites, ammonium, total nitrogen, sul-phates, lead, cadmium, iron, zinc. The association between these variables would beconsidered statistically significant.
Table 5 exemplifies such a calculation for the correlation coefficient betweenWQI and CCO-Cr.
For chlorides, nitrates, nitrites, ammonium, sulphates, lead, cadmium, iron,zinc, total nitrogen, the values of p coefficient are less than 0.001 (i.e., highlysignificant with confidence greater than 99.99%). For pH and DO, p < 0.01 meansthe statistical links are significant and the confidence is 99%.
Once the correlations between pollutants and WQI are identified, the sources ofpollution can be established or the related process.
4. Conclusions
This chapter highlighted the importance of using statistical methods to displaythe water quality condition, using WQI evaluation and Pearson and Spearmancorrelations.
In order to exemplify the statistical methods, we have used a series of data fromour previous work, consisting of 13 parameters measured for water samples takenfrom the Danube River, from Galati City area, Romania. Statistical correlationswere made between quality parameters and Water Quality Index; thus, it waspossible to identify which are the pollutants that determined an advanced degree ofwater pollution. The excessive pollution which occurred during the time intervalNovember 2016–June 2017 is due to the presence of high concentrations of chlo-rides, nitrates, nitrites, ammonium, sulphates, lead, cadmium, iron and zinc. Inrecent times there are many statistical software for water quality analysis. If we donot have, for various reasons such programs, the statistical approach can be doneclassically. Water Quality Index (WQI) provides information on the overall qualityof the water, while the correlation coefficients may indicate the parameters thatinfluenced the changes in water quality.
Acknowledgements
This study was funded by the main author’s personal resources.
13
Water Quality Parameters and Monitoring Soft Surface Water Quality Using Statistical…DOI: http://dx.doi.org/10.5772/intechopen.97372
Author details
Romana Drasovean* and Gabriel MurariuDepartment of Chemistry, Physics and Environment, “Dunarea de Jos” University,Galati, Romania
*Address all correspondence to: [email protected]
© 2021 TheAuthor(s). Licensee IntechOpen. This chapter is distributed under the termsof theCreativeCommonsAttribution License (http://creativecommons.org/licenses/by/3.0),which permits unrestricted use, distribution, and reproduction in anymedium,provided the original work is properly cited.
14
Promising Techniques for Wastewater Treatment and Water Quality Assessment
References
[1] Schneider S.H. (editor). WaterResources. Encyclopedia of Climate andWeather. Vol 2. New York: OxfordUniversity Press 2011. 823 p. DOI:10.1093/acref/9780199765324.001.0001
[2] Newman P.J. Classification of surfacewater quality management. Oxford:Heinemen Professional Publishing;1988.189p.
[3] Water Quality Monitoring - APractical Guide to the Design andImplementation of Freshwater QualityStudies and Monitoring Programs,United Nations Environment Programand the World Health Organization[Internet].1996. Available from:https://apps.who.int/iris/bitstream/handle/10665/41851/0419217304_eng.pdf?sequence=1&isAllowed=y
[4] Directive 2000/60/EC establishing aframework for Community action in thefield of water policy [Internet].2000.Available from:https://eur-lex.europa.eu/legal-content/EN/TXT/?uri=celex%3A32000L0060
[5] Directive 2009/90/CE establishingthe technical specifications for chemicalanalysis and monitoring of water status[Internet].2009. Available from:https://eur-lex.europa.eu/LexUriServ/LexUriServ.do?uri=OJ:L:2009:201:0036:0038:EN:PDF
[6] Sene K.J, Farquharson F.A.K,Sampling Errors for Water ResourcesDesign: The Need for ImprovedHydrometry in Developing Countries.Water Resources Management. 1998:12(2): 121–138.
[7] Murariu G, Iticescu C, Murariu A,Rosu B, Munteanu D, Buruiana D.L,Assessment of Water Quality StateDynamics Using Adaptive FilteringMethods and Neural NetworksApproaching Case study-Danube Riverin Galati area. Revista de Chimie. 2019;
70 (6):1914–1919. DOI :10.37358/RC.19.6.7246
[8] Savan B, Morgan A, Gore C,Volunteer environmental monitoringand the role of the universities: The caseof Citizens' Environment Watch.Environmental Management. 2003; 31(5): 561–568. DOI:org/10.1007/s00267-002-2897-y
[9] Quagliano J.V, Vallarino L.M.Chemistry. 3rded Florida StateUniversity: Prentice Hall, Inc.,Englewood Cliffs; 1969. 844p.
[10] Petropol Serb G,D, Surse de apa siIngineria apelor reziduale. Note de Curs.Craiova: Universitatea din Craiova;2010. 173p.
[11] Bumbu I, Bumbu I, Virlan L.Controlul si Monitoringul Mediului.Curs de lucrari practice si laborator.Chisinau: Universitatea Tehnică aMoldovei; 2006. 55p.
[12] Abbasi T, Abbasi S.A. Water qualityindices. Amsterdam, Netherland:Elsevier; 2012. 361p.
[13] United States EnvironmentalProtection Agency (EPA),ENVIRONMENTAL QUALITY INDEXOverview Report [Internet]. 2014.Available from:https://edg.epa.gov/EPADataCommons/public/ORD/NHEERL/EQI/EQI%20Overview%20Report__Final.pdf
[14] Popa P, Murariu G, Timofti M,Georgescu L.P, Multivariate StatisticalAnalyses of Danube River Water Qualityat Galati, Romania. EnvironmentalEngineering and Management Journal.2018; 17(5):1249–1266.
[15] Drasovean R, Murariu G,Constantinescu G, Circiumaru A,Assessment of surface water quality ofDanube in terms of usual parameters
15
Water Quality Parameters and Monitoring Soft Surface Water Quality Using Statistical…DOI: http://dx.doi.org/10.5772/intechopen.97372

and correlation analyses. Revista deChimie.2019; 70(2): 398–406. DOI:10.37358/RC.19.2.6924
[16] Drasovean R, Murariu G,Condurache-Bota S, Constantinescu G,Studies on the water quality of the Siretriver, near Galati city. In: Proceedings of18th International MultidisciplinaryScientific Geoconference SGEM 2018;2–8 July 2018; Albena; 18 (3.1) p.687–695. DOI: 10.5593/sgem2018/3.1/S12.
[17] Iticescu C, Georgescu L.P, Topa C,Assessing the Danube Water QualityIndex in the City of Galati, Romania.Carpathian Journal of Earth andEnvironmental Sciences. 2013; 8(4):155–164.
[18] Shweta T, Bhavtosh S, Prashant S,Rajendra D, Water Quality Assessmentin Terms of Water Quality Index.American Journal of Water Resources.2013; 1(3): 34–38. DOI:10.12691/ajwr-1-3-3
[19] Iticescu C, Georgescu L. P,Murariu G, Potential Effects of pHVariation Depending on theTemperature in the Drinking WaterSupply System. Journal ofEnvironmental Protection and Ecology.2012;13(3) : 1324–1332.
[20] Malviya N, DeoS , Inam F,Determination of water quality index toassess water quality for drinking andagricultural purposes. InternationalJournal of Basic and Applied ChemicalSciences. 2011; 1 (1) :79–88. DOI: http://www.cibtech.org/jcs.htm
[21] Iticescu C, Georgescu L. P,Murariu G, Topa C, Timofti M,Pintilie V, Arseni M, Lower Danubewater quality quantified through WQIand multivariate analysis. Water, 2019;11 (6):1305. DOI:10.3390/w11061305
[22] Scradeanu D. Modele CantitativeStatistice. Bucuresti: EdituraUniversitatii Bucuresti; 2013.103p.
[23] Clef T. Exploratory Data Analysis inBusiness and Economics. SpringerInternational Publishing; 2014.215p.DOI: 10.1007/978-3-319-01517-0
[24] Mundry R, Fischer J, Use ofstatistical programs for nonparametrictests of small samples often leads toincorrect P values: examples fromAnimal Behaviour.AnimalBehaviour.1998; Volume 56, Issue 1: 256–259. DOI: org/10.1006/anbe.1998.0756
[25] Opariuc C.D. Statistica Aplicata inStiintele Socio-Umane. Notiuni debazaă- Statistici univariate. Constanta:Editura Asociatia de Stinte; 2009. p330.
[26] Decree 161/2006 from RomanianLegislation on environmentalprotection.
16
Promising Techniques for Wastewater Treatment and Water Quality Assessment