Novel Measurement of Relative Aortic Size Predicts Rupture of Thoracic Aortic Aneurysms
Upload
independentCategory
view
2download
0
Schaller, Karl-Olof Lovblad and Rafik OuaredVitor Mendes Pereira, Olivier Brina, Philippe Bijlenga, Pierre Bouillot, Ana Paula Narata, Karl
StudyControl−Wall Shear Stress Distribution of Small Aneurysms Prone to Rupture: A Case
Print ISSN: 0039-2499. Online ISSN: 1524-4628 Copyright © 2013 American Heart Association, Inc. All rights reserved.
is published by the American Heart Association, 7272 Greenville Avenue, Dallas, TX 75231Stroke doi: 10.1161/STROKEAHA.113.003247
2014;45:261-264; originally published online November 19, 2013;Stroke.
http://stroke.ahajournals.org/content/45/1/261World Wide Web at:
The online version of this article, along with updated information and services, is located on the
http://stroke.ahajournals.org/content/suppl/2013/11/19/STROKEAHA.113.003247.DC1.htmlData Supplement (unedited) at:
http://stroke.ahajournals.org//subscriptions/
is online at: Stroke Information about subscribing to Subscriptions:
http://www.lww.com/reprints Information about reprints can be found online at: Reprints:
document. Permissions and Rights Question and Answer process is available in the
Request Permissions in the middle column of the Web page under Services. Further information about thisOnce the online version of the published article for which permission is being requested is located, click
can be obtained via RightsLink, a service of the Copyright Clearance Center, not the Editorial Office.Strokein Requests for permissions to reproduce figures, tables, or portions of articles originally publishedPermissions:
at Bibliotheque Faculte Medecine Geneve on March 7, 2014http://stroke.ahajournals.org/Downloaded from at Bibliotheque Faculte Medecine Geneve on March 7, 2014http://stroke.ahajournals.org/Downloaded from at Bibliotheque Faculte Medecine Geneve on March 7, 2014http://stroke.ahajournals.org/Downloaded from at Bibliotheque Faculte Medecine Geneve on March 7, 2014http://stroke.ahajournals.org/Downloaded from at Bibliotheque Faculte Medecine Geneve on March 7, 2014http://stroke.ahajournals.org/Downloaded from at Bibliotheque Faculte Medecine Geneve on March 7, 2014http://stroke.ahajournals.org/Downloaded from at Bibliotheque Faculte Medecine Geneve on March 7, 2014http://stroke.ahajournals.org/Downloaded from at Bibliotheque Faculte Medecine Geneve on March 7, 2014http://stroke.ahajournals.org/Downloaded from at Bibliotheque Faculte Medecine Geneve on March 7, 2014http://stroke.ahajournals.org/Downloaded from
261
Intracranial aneurysms are prevalent in 2% to 5% of the pop-ulation and the frequency of bleeding varies with aneurysm
location, size, and specific populations.1 Attempts to study the correlations between aneurysm rupture and patient-specific hemodynamic factors have been performed simultaneously during past decades.2,3 Unfortunately, computational fluid dynamics have not sufficiently evolved to be used in daily clini-cal routine, possibly because studies were based on postrupture aneurysm shapes.1 Out of the all studies based on prerupture geometries, few were analyzing the hemodynamic features.4–6 Alternatively, there are few clinical studies collecting unrup-tured cases prospectively, particularly small aneurysms, which were imaged before rupture.7–9 The present study analyzes the hemodynamic features of unexpected small ruptured aneu-rysms based on prerupture imaged shapes.
MethodsWe designed a computational fluid dynamics case–control study to evaluate the rupture odds of such small aneurysms using prerupture geometries and explored a novel predictor related to wall shear stress
(WSS) percentile function. Cases were 4 patients with small sac-cular intracranial aneurysms that were not initially designated for treatment and who presented with subarachnoid hemorrhage during follow-up. Ruptures were located in different arterial segments: M1 segment of the middle cerebral artery; basilar tip; posterior infe-rior cerebellar artery; and anterior communicating artery. Controls included patients with unruptured saccular intracranial aneurysms matched by location and size from the same database (Figure 1). Data collected included patient age, sex, aneurysm dimensions, an-eurysm neck size, location, rupture status, and medical history. The primary end point of this study was to determine whether some of the significant geometry and hemodynamic predictors were appli-cable to our small-sized aneurysm sample. We evaluated these fac-tors in the prerupture state for cases and controls. We collected the following geometric parameters: aspect ratio (aneurysm apex/neck size) and both aneurysm and neck sizes, size ratio and inflow angle: inclination of aneurysm with regard to the direction of flow in the parent artery. We evaluated the hemodynamic parameters related to WSS averaged over a cycle (mean, maximum, minimum)10 and other relevant calculated parameters. In addition to scalar hemodynamic factors, we evaluated a novel empirical hemodynamic function, that is, the WSS cumulative distribution function (WSScdf), with val-ues between 0 and 1 characterizing the aneurysm WSS percentiles (Methods in the online-only Data Supplement).
Background and Purpose—Subarachnoid hemorrhage after intracranial aneurysm rupture remains a serious condition. We performed a case–control study to evaluate the use of computed hemodynamics to detect cerebral aneurysms prone to rupture.
Methods—Four patients with incidental aneurysms that ultimately ruptured (cases) were studied after initially being included in a prospective database including their 3-dimensional imaging before rupture. Ruptures were located in different arterial segments: M1 segment of the middle cerebral artery; basilar tip; posterior inferior cerebellar artery; and anterior communicating artery. For each case, 5 controls matched by location and size were randomly selected. An empirical cumulative distribution function of aneurysm wall shear stress percentiles was evaluated for every case and used to define a critical prone-to-rupture range. Univariate logistic regression analysis was then used to assess the individual risk of rupture.
Results—A cumulative wall shear stress distribution characterizing a hemodynamic prone-to-rupture range for small-sized aneurysms was identified and fitted independent of the location. Sensitivity and specificity of the preliminary tests were 90% and 93%, respectively.
Conclusions—The wall shear stress cumulative probability function may be a potential predictor of small-sized aneurysm rupture. (Stroke. 2014;45:261-264.)
Key Words: aneurysm ◼ computer simulation ◼ hemodynamics ◼ rupture
Wall Shear Stress Distribution of Small Aneurysms Prone to RuptureA Case–Control Study
Vitor Mendes Pereira, MD, MSc; Olivier Brina, TRM; Philippe Bijlenga, MD; Pierre Bouillot, PhD; Ana Paula Narata, MD; Karl Schaller, MD, PhD; Karl-Olof Lovblad, MD;
Rafik Ouared, PhD
Received August 21, 2013; accepted September 30, 2013.From the Interventional Neuroradiology Unit, Service of Neuroradiology (V.M.P., O.B., P.B., A.P.N., K.-O.L., R.O.) and Service of Neurosurgery (P.B.,
K.S.), Faculty of Medicine, University of Geneva Hospitals, Geneva, Switzerland.The online-only Data Supplement is available with this article at http://stroke.ahajournals.org/lookup/suppl/doi:10.1161/STROKEAHA.
113.003247/-/DC1.Correspondence to Vitor Mendes Pereira, MD, MSc, Interventional Neuroradiology Unit, University of Geneva Hospitals, 4 Rue Gabrielle Perret-Gentil,
1211 Geneva 14, Switzerland. E-mail [email protected]© 2013 American Heart Association, Inc.
Stroke is available at http://stroke.ahajournals.org DOI: 10.1161/STROKEAHA.113.003247
at Bibliotheque Faculte Medecine Geneve on March 7, 2014http://stroke.ahajournals.org/Downloaded from

262 Stroke January 2014
ResultsThe changes in the likelihood of rupture between cases and controls in univariate conditional logistic regression analysis were not statistically significant (P>0.05) for all geometry and hemodynamic variables (Table I in the online-only Data Supplement). However, the WSS percentile distribution spe-cific to prone-to-rupture, small-sized aneurysms is charac-terized by the following WSS percentile figure (Figure 2A). Figure 2 shows the WSScdf for the 4 cases and 20 controls. Figure 3A shows the average WSScdf for the control groups.
Figure 3B shows the univariate logistic regression fit based on variable Np (the fraction of the WSScdf curve intersect-ing with the prone-to-rupture range) for which the log odds ratio was found equal to b0=−8.13±1.95 and b1=0.62±0.16 (mean±SD), respectively; statistical significance of likeli-hood of rupture was P=0.047. Because the outcome of rupture is boolean (rupture versus no rupture issues), every varia-tion below the median risk would be zero. The Np threshold suggests that rupture becomes certain if ≈70% of the entire WSScdf curve intersects with the prone-to-rupture range. The
Figure 1. Qualitative representa-tion of wall shear stress (WSS) averaged over a cycle for cases and controls. The 4 aneurysm locations from top to bottom are row 1: middle cerebral artery (MCA) aneurysm; row 2: basilar artery (BAT) aneurysm; row 3: posterior inferior cerebellar artery (PICA) aneurysm; row 4: anterior communicating artery (AcomA) aneurysm. The mean WSS magnitude averaged over a cycle between 1.0 and 10 Pa is represented by a logarithmic color scale: blue, for WSS <1.0 Pa, and red for WSS >10 Pa. Columns show a comparison of overall cases with controls: cases present similar mean WSS magnitudes independent of the location, but with different spatial distributions; controls have wider WSS distributions and different magnitudes. Rows: controls have similar WSS levels at each location, but these dif-fer from their respective case that ruptured. Moreover, WSS in MCA and AcomA aneurysms have both higher WSS com-pared with BAT and PICA aneu-rysms. BAT is the only location where controls and cases have a similar mean WSS magnitude.
Figure 2. Wall shear stress cumulative distribution function (WSScdf) of cases (A) and for controls (B). The red crosses superimposed in B represent cases. AcomA indicates anterior communicating artery; BAT, basilar artery; CI, confidence interval; MCA, middle cerebral artery; and PICA, posterior inferior cerebellar artery.
at Bibliotheque Faculte Medecine Geneve on March 7, 2014http://stroke.ahajournals.org/Downloaded from

Pereira et al Wall Shear Stress and Small Aneurysm Rupture 263
contingency table associated with the threshold (Np=13.9) indicated that cases and 1 control tested positive, whereas the remaining controls tested negative. Using Yates correction, the performance of the prone-to-rupture range method associated with our small case–control sample was characterized by sen-sitivity=0.90 (63.7%, 100%); specificity=0.93 (81.8%,100%).
DiscussionThis study was based on the prerupture imaging of 4 small aneurysms (cases) in different locations that were compared with 20 unruptured controls selected from a prospective data-base and matched by location and size. We observed the exis-tence of a narrow WSScdf hemodynamic prone-to-rupture range common to all cases, independent of their location. Because most controls were not included in this range, we proposed a novel rupture risk assessment method based on a new potential predictor. The definition of the predictor was simplified by counting the number of WSS cutoff values (out of 18) included in the prone-to-rupture range for each indi-vidual aneurysm. The case–control odds ratio corresponding to the threshold (Np=13.9) was then significantly estimated to be 24. The results demonstrated that a small-sized aneurysm is likely to rupture if ≈70% of its associated WSScdf curve is contained in the risk zone (positive predictive value, 75%), and would not otherwise (negative predictive value, 97%). It is also interesting to note that on average, the WSScdf of basilar tip aneurysm controls largely intersects with the prone-to-rupture zone. This basilar tip location trend most likely cor-responds to epidemiological observations (ie, the rupture odds of the associated aneurysms are larger than in other locations).9
Because it is generally admitted that WSS is involved in both the fatigue preceding aneurysm tear and remodeling of wall tissue, extensive studies of its magnitude, direction, and distribution have been performed by several authors with divergent opinions on the correlation of low and high WSS with rupture.11 It seems rather that a more balanced WSS
percentile distribution (50%; <0.4 Pa) was required to trigger the biological response specific to rupture, which could lead to faster endothelial cell turnover compared with other regions of the vessel, hence modifying the morphological remodeling.4
It is foreseeable that the challenge for computational fluid dynamics in the coming years would be to detect an increas-ing number of potentially dangerous small-size lesions that may rupture despite being presumably of low risk according to epidemiological studies.1,5,12–14 Indeed, large aneurysms are rarely followed conservatively because their estimated rupture risk is not questionable, and the therapeutic decision can be taken without any ambiguity.7,9,15
ConclusionsWSScdf prone-to-rupture ranges exist and may potentially highlight small-sized aneurysm tears with high positive and negative predictive values.
AcknowledgmentsWe thank Rosemary Sudan for the English review.
Sources of FundingThis study was supported by Swiss National Science Foundation grant (SNF 32003B_141192).
DisclosuresNone.
References 1. Pereira VM, Brina O, Gonzalez AM, Narata AP, Ouared R, Lovblad
K-O. Biology and hemodynamics of aneurismal vasculopathies. Eur J Radiol. 2013;82:1606–1617.
2. Chien A, Tateshima S, Sayre J, Castro M, Cebral J, Viñuela F. Patient-specific hemodynamic analysis of small internal carotid artery-ophthal-mic artery aneurysms. Surg Neurol. 2009;72:444–450, discussion 450.
3. Tanoue T, Tateshima S, Villablanca JP, Viñuela F, Tanishita K. Wall shear stress distribution inside growing cerebral aneurysm. AJNR Am J Neuroradiol. 2011;32:1732–1737.
Figure 3. A, Group-averaged wall shear stress cumulative distribution function (WSScdf). B, Univariate logistic regression representation of rupture odds based on the number of points Np (max number of points=18) in the prone-to-rupture range. The risk of falling into the rupture zone is represented on the vertical axis, and the number of points Np of ruptured cases are shown on the horizontal axis. The risk median line (y=0.5) is superposed with the corresponding threshold Np=13.9 on the horizontal axis. AcomA indicates anterior communi-cating artery; BAT, basilar artery; MCA, middle cerebral artery; NPV, negative predictive value; PICA, posterior inferior cerebellar artery; and PPV, positive predictive value.
at Bibliotheque Faculte Medecine Geneve on March 7, 2014http://stroke.ahajournals.org/Downloaded from

264 Stroke January 2014
4. Shojima M, Oshima M, Takagi K, Torii R, Hayakawa M, Katada K, et al. Magnitude and role of wall shear stress on cerebral aneurysm: compu-tational fluid dynamic study of 20 middle cerebral artery aneurysms. Stroke. 2004;35:2500–2505.
5. Takao H, Murayama Y, Otsuka S, Qian Y, Mohamed A, Masuda S, et al. Hemodynamic differences between unruptured and ruptured intracranial aneurysms during observation. Stroke. 2012;43:1436–1439.
6. Qian Y, Takao H, Umezu M, Murayama Y. Risk analysis of unruptured aneurysms using computational fluid dynamics technology: preliminary results. AJNR Am J Neuroradiol. 2011;32:1948–1955.
7. Villablanca JP, Duckwiler GR, Jahan R, Tateshima S, Martin NA, Frazee J, et al. Natural history of asymptomatic unruptured cerebral aneurysms evaluated at CT angiography: growth and rupture incidence and correla-tion with epidemiologic risk factors. Radiology. 2013;269:258–265.
8. Morita A, Kimura T, Shojima M, Sameshima T, Nishihara T. Unruptured intracranial aneurysms: current perspectives on the origin and natural course, and quest for standards in the management strategy. Neurol Med Chir (Tokyo). 2010;50:777–787.
9. Wiebers DO, Whisnant JP, Huston J III, Meissner I, Brown RD Jr, Piepgras DG, et al; International Study of Unruptured Intracranial Aneurysms Investigators. Unruptured intracranial aneurysms: natural
history, clinical outcome, and risks of surgical and endovascular treat-ment. Lancet. 2003;362:103–110.
10. Lu G, Huang L, Zhang XL, Wang SZ, Hong Y, Hu Z, et al. Influence of hemodynamic factors on rupture of intracranial aneurysms: patient- specific 3D mirror aneurysms model computational fluid dynamics sim-ulation. AJNR Am J Neuroradiol. 2011;32:1255–1261.
11. Cebral JR, Mut F, Weir J, Putman CM. Association of hemodynamic characteristics and cerebral aneurysm rupture. AJNR Am J Neuroradiol. 2011;32:264–270.
12. Cebral JR, Mut F, Weir J, Putman C. Quantitative characterization of the hemodynamic environment in ruptured and unruptured brain aneurysms. AJNR Am J Neuroradiol. 2011;32:145–151.
13. Goubergrits L, Schaller J, Kertzscher U, van den Bruck N, Poethkow K, Petz Ch, et al. Statistical wall shear stress maps of ruptured and unruptured middle cerebral artery aneurysms. J R Soc Interface. 2012;9:677–688.
14. Xiang J, Natarajan SK, Tremmel M, Ma D, Mocco J, Hopkins LN, et al. Hemodynamic-morphologic discriminants for intracranial aneurysm rupture. Stroke. 2011;42:144–152.
15. Morita A, Kirino T, Hashi K, Aoki N, Fukuhara S, Hashimoto N, et al. The natural course of unruptured cerebral aneurysms in a Japanese cohort. N Engl J Med. 2012;366:2474–2482.
at Bibliotheque Faculte Medecine Geneve on March 7, 2014http://stroke.ahajournals.org/Downloaded from
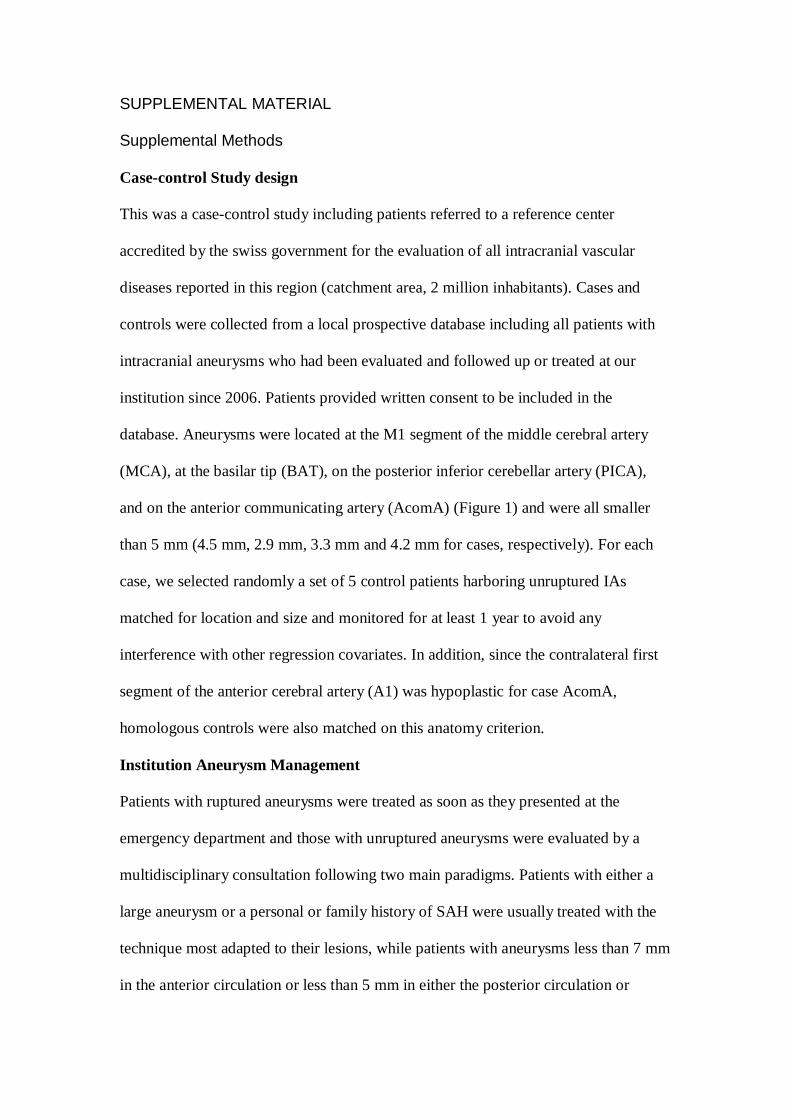
SUPPLEMENTAL MATERIAL Supplemental Methods Case-control Study design
This was a case-control study including patients referred to a reference center
accredited by the swiss government for the evaluation of all intracranial vascular
diseases reported in this region (catchment area, 2 million inhabitants). Cases and
controls were collected from a local prospective database including all patients with
intracranial aneurysms who had been evaluated and followed up or treated at our
institution since 2006. Patients provided written consent to be included in the
database. Aneurysms were located at the M1 segment of the middle cerebral artery
(MCA), at the basilar tip (BAT), on the posterior inferior cerebellar artery (PICA),
and on the anterior communicating artery (AcomA) (Figure 1) and were all smaller
than 5 mm (4.5 mm, 2.9 mm, 3.3 mm and 4.2 mm for cases, respectively). For each
case, we selected randomly a set of 5 control patients harboring unruptured IAs
matched for location and size and monitored for at least 1 year to avoid any
interference with other regression covariates. In addition, since the contralateral first
segment of the anterior cerebral artery (A1) was hypoplastic for case AcomA,
homologous controls were also matched on this anatomy criterion.
Institution Aneurysm Management
Patients with ruptured aneurysms were treated as soon as they presented at the
emergency department and those with unruptured aneurysms were evaluated by a
multidisciplinary consultation following two main paradigms. Patients with either a
large aneurysm or a personal or family history of SAH were usually treated with the
technique most adapted to their lesions, while patients with aneurysms less than 7 mm
in the anterior circulation or less than 5 mm in either the posterior circulation or

AcomA aneurysms.1 were managed conservatively. Risk factors were controlled at 6
months, 1 year, 2 years, and every 5 years thereafter, together with regular clinical
and imaging follow-up. Conservative management was halted when the lesion was
observed to have changed morphologically.
Geometry and Hemodynamic Modeling
The triangulated surfaces of the patient-specific vessels were reconstructed from the
3D rotational angiography images (Allura FD20, Philips Healthcare, Best, The
Netherlands) through the segmentation steps documented and provided in the
Aneufuse toolkit.2 A commercial software (ICEM CFD 12.1, ANSYS Inc,
Canonsburg, PA) was then used to produce a high-resolution, computational,
unstructured mesh composed of tetrahedrons in the bulk flow and prism elements
delineating three boundary layers near the wall to increase the precision of WSS
measurement. The mesh element number ranged between 3.3 and 5.6 million, with
mesh density larger than 2000 elements/mm3. The ANSYS CFX commercial Navier-
Stokes equation solver was used to simulate blood flow as a Newtonian fluid on the
computational mesh. We used generic boundary conditions measured on healthy
subjects to impose inlet pulsatile flow and outlets’ pressure curves together with rigid
wall boundary conditions according to Reymond et al.3 and Pereira et al. 4. The mean
volumetric flow rates applied to inlets were 4.19 cc/s for internal carotid artery
(MCA, AcomA) , 2.43 cc/s for basilar artery (BAT) and 1.19 cc/s for vertebral artery
(PICA), respectively. The modeling parameters were the following: a) density: 1066
kg/m3; b) viscosity: 0.0035 Pa.s; c) Reynolds number: 350-520; d) Womersley
number: 1.8-2.6; e) cycle: 0.8s; f) number of cycles: 2. Analysis of results was
performed using ANSYS CFX and Matlab (Mathworks, Natick, MA) customized
scripts.

Geometric Parameters
In addition to the aspect ratio (aneurysm apex/neck size) and both aneurysm and neck
sizes, we routinely evaluated additional geometry parameters reported by some
authors as being potentially related to rupture: a) size ratio: defined for sidewall
aneurysms as aneurysm apex/diameter of inlet vessel, and for bifurcation aneurysms
as aneurysm apex/average diameter of all the feeding and branching vessels5; and b)
inflow angle: inclination of aneurysm with regard to the direction of flow in the
parent artery.6 These parameters were used to check the homogeneity of the different
locations and their potential impact on the rupture.
Hemodynamic Parameters
We evaluated the parameters related to WSS averaged over a cycle (mean [MWSS],
maximum [MAXWSS], minimum [MINWSS])7 and those identified by several
authors for their potential correlation with rupture: a) power loss (mW) measuring
power dissipation in the region of interest centered around the aneurysm8; b) pressure
loss coefficient (PLC) defined as the relative total pressure difference in the region of
interest, normalized to incoming dynamic pressure8; and c) viscous dissipation ratio
(VDR), and inflow concentration index (ICI).9 All hemodynamic factors were
registered at every time step together with their average over the entire cycle.
Wall Shear Stress Cumulative Distribution Function
In addition to scalar hemodynamic factors, we evaluated a novel empirical
hemodynamic function, i.e., the WSS cumulative distribution function (WSScdf),
with values between 0 and 1 characterizing the aneurysm WSS percentiles. WSScdf

evaluates the fraction of the aneurysm surface undergoing mean WSS (averaged over
a cycle) up to the local maximum value. We defined a set of 18 cut-off values in this
WSS range to reliably describe the fast growing edge of WSScdf for low-WSS regime
cases, 10 points between 0 and 2 Pa, and 8 equally-spaced points above 2 Pa.
Mathematically, WSScdf is a well-ordered set of ordinal WSS percentiles expressed
as:
where Wi represents each of the 18 WSS cut-offs defined above and taken in
ascending order, and SWi represents the WSS percentile up to Wi.
Statistical Analysis
We generated descriptive statistics from all listed geometry and hemodynamic scalar
variables and performed a matched case-control analysis with univariate conditional
logistic regression. For each variable, we evaluated the increased likelihood of rupture
with statistical significance set at P≤0.05 and the associated odds ratio when the null
hypothesis was rejected. In addition, we observed that the WSScdf for cases were all
aligned within a narrow range (WSScdf vs WSS) unlike controls where it spanned a
wider range. We then determined the “prone-to-rupture” range by fitting the optimal
empirical WSScdf for cases with their related 95% confidence interval (CI) using the
following power function model:

where x represents the WSS variable averaged over a cycle and ranges between 0 and
the local maximum value (18 discrete values were selected to represent the function
f), and f(x) is the optimum WSS percentile function (WSScdf) associated with
variable x. The three parameters a, b, and c are required to take into account the
saturation, the raising edge, and the median level of the function, respectively. The
non-linear least squares residuals and covariance matrix were estimated using a
Matlab (Mathworks v2011a) non-linear regression utility based on the Levenberg-
Marquardt algorithm.10 By contrast to controls, cases are expected to have their
WSScdf representation curve largely within the prone-to-rupture zone. Since the
fraction of the WSScdf curve in the risk zone is directly correlated to rupture odds, a
variable Np was set to take into account the number of WSScdf cut-off points
intersecting with this zone. Case-control rupture odds were evaluated by univariate
logistic regression analysis based on variable Np. The Np threshold associated with
the median risk of rupture (r=0.5) fixes the level of the rupture odds ratio between
case and control groups and allows to evaluate the performance of the test. All
analyses were performed with SPSS statistical package (IBM SPSS statistics, v21)
Supplemental Results and Tables
Table I shows that the change in the likelihood of rupture between cases and controls
in univariate conditional logistic regression analysis was not statistically significant
(P>0.05) for all listed geometry and hemodynamic variables. Consequently, no odds
ratio related to the listed variables was statistically significant (P>0.05).
Table I. Results of univariate conditional logistic regression analysis. Average values
(mean) and standard deviations (SD) are summarized for each variable and for cases
and controls. P-values represent a summary of likelihood change of rupture.

Variables Cases (mean±SD)
Controls (mean±SD)
P- values
AR 1.10±0.40 1.20± 0.40 0.767
Necksize (mm)
3.20±0.80 3.90± 1.50 0.255
Aneurysm size (mm)
3.70±0.70 4.70±1.80 0.275
IA ° 56.1±21.0 38.8± 16.9 0.079
SR 2.20±0.30 1.90± 0.40 0.252
MWSS, Pa 1.20±0.50 2.20+-1.00 0.372
MAXWSS, Pa 12.20± 10.10
15.10±13.50 0.627
MINWSS, Pa 0.030± 0.020
0.10± 0.20 0.422
ICI 1.10±0.80 2.00± 1.40 0.300
VDR 0.24±0.14 0.35± 0.30 0.483
PL, mW 0.23±0.42 0.27± 0.54 0.892
PLC 1.17±0.88 3.38± 3.56 0.287
AR – aspect ratio; IA – aneurysm inclination angle (degree); SR – aneurysm to vessel
size ratio; MWSS – mean WSS; maxWSS – maximum WSS; MINWSS – minimum
WSS; ICI - inflow concentration index; VDR - viscous dissipation ratio; PL - power
loss; PLC - pressure loss coefficient

Supplemental References 1. Morita A, Kirino T, Hashi K, Aoki N, Fukuhara S, Hashimoto N et al. The
natural course of unruptured cerebral aneurysms in a japanese cohort. The New England journal of medicine. 2012;366:2474-2482
2. Villa-Uriol MC, Berti G, Hose DR, Marzo A, Chiarini A, Penrose Jet al. @neurist complex information processing toolchain for the integrated management of cerebral aneurysms. Interface focus. 2011;1:308-319
3. Reymond P, Merenda F, Perren F, Rufenacht D, Stergiopulos N. Validation of a one-dimensional model of the systemic arterial tree. American journal of physiology. Heart and circulatory physiology. 2009;297:H208-222
4. Pereira VM, Brina O, Marcos Gonzales A, Narata AP, Bijlenga P, Schaller K, et al. Evaluation of the influence of inlet boundary conditions on computational fluid dynamics for intracranial aneurysms: A virtual experiment. Journal of biomechanics. 2013;46:1531-1539
5. Xiang J, Natarajan SK, Tremmel M, Ma D, Mocco J, Hopkins LN et al. Hemodynamic-morphologic discriminants for intracranial aneurysm rupture. Stroke; a journal of cerebral circulation. 2011;42:144-152
6. Baharoglu MI, Schirmer CM, Hoit DA, Gao BL, Malek AM. Aneurysm inflow-angle as a discriminant for rupture in sidewall cerebral aneurysms: Morphometric and computational fluid dynamic analysis. Stroke 2010;41:1423-1430
7. Lu G, Huang L, Zhang XL, Wang SZ, Hong Y, Hu Z, et al. Influence of hemodynamic factors on rupture of intracranial aneurysms: Patient-specific 3d mirror aneurysms model computational fluid dynamics simulation. AJNR. American journal of neuroradiology. 2011;32:1255-1261
8. Takao H, Murayama Y, Otsuka S, Qian Y, Mohamed A, Masuda S et al. Hemodynamic differences between unruptured and ruptured intracranial aneurysms during observation. Stroke 2012;43:1436-1439
9. Cebral JR, Mut F, Weir J, Putman C. Quantitative characterization of the hemodynamic environment in ruptured and unruptured brain aneurysms. AJNR. American journal of neuroradiology. 2011;32:145-151
10. Marquardt DW. An algorithm for least-squares estimation of nonlinear parameters. Journal of the Society for Industrial and Applied Mathematics. 1963;11:431-441
Copyright © 2022 FDOKUMEN