
Undesirable Haemodynamics in Aneurysms
10
ANEURYSM HAEMODYNAMICS Undesirable Haemodynamics in Aneurysms Gregory J. SHEARD, 1,3,† Roger G. EVANS, 1,2 Kate M. DENTON 1,2 and Kerry HOURIGAN 1,3 1 Monash University Biomedical Engineering Technology Alliance (MuBeta), Monash University, VIC 3800, Australia. 2 Department of Physiology, Faculty of Medicine, Nursing and Health Sciences, Monash Univer- sity, VIC 3800, Australia. 3 Fluids Laboratory for Aeronautical and Industrial Research (FLAIR), Department of Mechanical Engineering, Monash University, VIC 3800, Australia. † Corresponding author: [email protected] Abstract. A computational fluid dynamics study is employed to investigate the flow within an idealized fusiform aneurysm. The model includes sections of the arteries upstream and downstream of the aneurysm, which is modeled as an elliptical bulge of a shape consistent with both previous experimental studies, and accepted values for aneurysms located on the human abdominal aorta. Flow is assumed axisymmetric and Newtonian, allowing efficient computation in cylindrical coor- dinates. Results are reported for both a steady-state inflow, as well as time-varying inputs with frequencies selected to represent heart rates ranging from rest to strenuous exercise. The effects of these parameters on the dynamics of the flow within the aneurysm are reported, as is variation in the resistance to flow when compared with an undeformed artery of the same length. The rate at which fluid is flushed from an aneurysm is found to be strongly dependent on the frequency of the pulsatile flow, but independent of geometrical features such as the radius of curvature at the junction between the artery and the aneurysmal bulge. Wall shear stress and pressure drop across the aneurysm are found to be sensitive to these geometrical alterations, although in the case of the pressure drop the changes are insignificant as the resistance to flow is predicted to be lower in the aneurysm than in an undamaged artery of the same length. Key words: Aneurysm, blood flow, fusiform, haemodynamics, particle tracking, direct numerical simulation, spectral element method. 1. Introduction Aneurysms are localized dilations of arteries, and typically develop in the aorta, carotid artery, and cerebral vessels. They arise from a weakness in the vessel wall, usually in regions of high wall shear stress (hereafter WSS). High-shear regions are usually encountered near a branch point or other regions of non-uniformity [7]. The development of aneurysms follows a vicious cycle whereby increased peak wall stress within the developing aneurysm weakens the vessel wall, so causing enlargement of the aneurysm and further increases in peak wall stress. Simultaneously, shear stress appears to increase in proportion to the growth of the aneurysm, and is thought to drive the molecular mechanisms underlying aneurysm progression [7, 8]. Aneurysms of the abdominal aorta typically widen at a rate of approximately 4 mm per year [11]. Rupture of aneurysms is believed to occur when the mechanical stress acting on the wall exceeds the strength of the wall tissue. Degeneration of the vascular wall, and 1
Transcript of Undesirable Haemodynamics in Aneurysms
ANEURYSM HAEMODYNAMICS
Undesirable Haemodynamics in Aneurysms
Gregory J. SHEARD,1,3,† Roger G. EVANS,1,2 Kate M. DENTON1,2 and
Kerry HOURIGAN1,3
1 Monash University Biomedical Engineering Technology Alliance (MuBeta), Monash University,
VIC 3800, Australia.2 Department of Physiology, Faculty of Medicine, Nursing and Health Sciences, Monash Univer-
sity, VIC 3800, Australia.3 Fluids Laboratory for Aeronautical and Industrial Research (FLAIR), Department of Mechanical
Engineering, Monash University, VIC 3800, Australia.† Corresponding author: [email protected]
Abstract. A computational fluid dynamics study is employed to investigate the flow within anidealized fusiform aneurysm. The model includes sections of the arteries upstream and downstreamof the aneurysm, which is modeled as an elliptical bulge of a shape consistent with both previousexperimental studies, and accepted values for aneurysms located on the human abdominal aorta.Flow is assumed axisymmetric and Newtonian, allowing efficient computation in cylindrical coor-dinates. Results are reported for both a steady-state inflow, as well as time-varying inputs withfrequencies selected to represent heart rates ranging from rest to strenuous exercise. The effects ofthese parameters on the dynamics of the flow within the aneurysm are reported, as is variation inthe resistance to flow when compared with an undeformed artery of the same length.The rate at which fluid is flushed from an aneurysm is found to be strongly dependent on thefrequency of the pulsatile flow, but independent of geometrical features such as the radius ofcurvature at the junction between the artery and the aneurysmal bulge. Wall shear stress andpressure drop across the aneurysm are found to be sensitive to these geometrical alterations,although in the case of the pressure drop the changes are insignificant as the resistance to flow ispredicted to be lower in the aneurysm than in an undamaged artery of the same length.
Key words: Aneurysm, blood flow, fusiform, haemodynamics, particle tracking, direct numericalsimulation, spectral element method.
1. Introduction
Aneurysms are localized dilations of arteries, and typically develop in the aorta,carotid artery, and cerebral vessels. They arise from a weakness in the vessel wall,usually in regions of high wall shear stress (hereafter WSS). High-shear regions areusually encountered near a branch point or other regions of non-uniformity [7]. Thedevelopment of aneurysms follows a vicious cycle whereby increased peak wall stresswithin the developing aneurysm weakens the vessel wall, so causing enlargement ofthe aneurysm and further increases in peak wall stress. Simultaneously, shear stressappears to increase in proportion to the growth of the aneurysm, and is thought todrive the molecular mechanisms underlying aneurysm progression [7, 8]. Aneurysmsof the abdominal aorta typically widen at a rate of approximately 4 mm per year [11].Rupture of aneurysms is believed to occur when the mechanical stress acting on thewall exceeds the strength of the wall tissue. Degeneration of the vascular wall, and
1
G. J. SHEARD ET AL.
so reduced wall strength, is evidenced by the observation that ruptured aneurysmscontain fewer smooth muscle cells and more irregular layers of collagen IV thanthe walls of unruptured aneurysms [6]. Endothelial damage and inflammatory cellinvasion of the vascular wall are also hallmarks of ruptured aneurysms [6]. Recentinterest has surrounded the wall stress distribution within aneurysms with a view todevelopment of a predictive model to quantify their growth and eventual rupture.This would be a major development in the clinical management of aneurysms, butthis field is presently in its infancy. Blood flow dynamics likely also make a majorcontribution to the pathogenesis, progression, and possible rupture of aneurysms.For example, recent reports support the hypothesis that WSS contributes to thegenesis of aneurysms [7]. The presence of foci of high WSS is likely a major factorleading to aneurysm formation in previously healthy arteries. Animal models ofaneurysm formation suggest that increased WSS can lead to degenerative changesin the vascular endothelium that progress to the underlying vascular smooth muscle.The present computations will demonstrate that aneurysms with a gradual contrac-tion at the distal end expose healthy artery wall tissue to adverse WSS conditions,as the peak WSS location occurs further downstream in those cases.Another issue that must be considered is the appearance of areas of stagnation ofblood flow, which occurs particularly in large aneurysms such as those that developin the abdominal aorta [9]. Stagnation of blood flow results in aggregation of redblood cells and the accumulation and adhesion of platelets and leucocytes along theintimal surface of the vasculature. This is likely exacerbated by evolving endothe-lial injury. In turn, these factors can lead to the development of intra-aneurysmalthromboses, and subsequent infarction of downstream vascular beds if a thrombusdetaches, or if the thrombus remains in situ, inflammatory changes in the aneurysmwall that will further weaken it and increase the risk of rupture. There is alsoevidence that abdominal aortic aneurysms can induce a state of systemic hyperco-agulopathy, the severity of which is proportional to the aspect ratio of the aneurysms[9].The structure and dynamics of flow within aneurysms has been measured in numer-ous in vitro and in vivo studies. In a rabbit model, Doppler ultrasound was used[19] to obtain the velocity field within aneurysms of various sizes. The Reynoldsnumber and Womersley number of this model mimicked human cerebral arteries.Tagged image velocimetry has been applied to study the flow in a replica intracra-nial aneurysm [4]. The study produced velocity vectors, vorticity and shear strainsthroughout the model at 9 ms intervals. Digital particle image velocimetry has beenused to calculate wall shear stress and fluid shear rate in fusiform aneurysm models[8]. The measured flow fields comprised a fast flow through the core of the aneurysm,following the vessel axis, and a slowly rotating ring of fluid between the core andthe aneurysm wall.Studies of wall stresses in abdominal aortic aneurysms show these to be greatlyelevated within the aneurysm [12], with peak wall stress located in the vicinityof the posterior wall. Some attempts have been made to use computational fluiddynamics to determine a predictive model of aortic aneurysm rupture [11], based onrealistic aneurysm morphology derived from clinical imaging. Steinman et al.[17, 18]recently described a case report of such an analysis.Computational fluid dynamics presents an increasingly valuable tool for the studyand risk assessment of aneurysmal blood flow. This literature review has identi-
2
ANEURYSM HAEMODYNAMICS
fied that regions of high wall shear stress act to weaken vessel walls and thereforepromote the growth of an aneurysm, and that stagnant regions resulting from incom-plete fluid replacement within aneurysms can lead to clot formation and subsequentinfarction of a downstream vascular bed. There is speculation that blood flow withinaneurysms is highly dependent on the precise geometry of the aneurysm and the na-ture of the input haemodynamics [17, 18], and thus idealized models are thoughtto provide a poor approximation to the flow in anatomically realistic vessels [10].The primary hypothesis of this study is: The wall shear stress and rate of fluidreplacement within an aneurysm are sensitive to geometry modifications consistentwith an idealization of a realistic aneurysm geometry.This study will investigate the flow in a model fusiform aneurysm with dimensionsconsistent with earlier experimental studies (e.g., [2]). The computational domainconsists of straight circular arteries, which are joined to the proximal (upstream) anddistal (downstream) ends of an elliptical bulge with length-to-width ratio 1.76 andlength 4D. This model is shown schematically in figure 1. This idealized geometryis modified to better represent realistic aneurysms by systematically smoothing thejunction points between the healthy arterial segments and the aneurysm. The effectof this modification on the flow properties is the focus of this study.
2. Methodology
Numerical simulations are performed using a high-order spectral-element techniqueformulated in cylindrical coordinates [15, 16]. For computational convenience, flowquantities are normalized: i.e., velocity by mean inlet velocity U and length by arterycalibre D. Combining these with the kinematic viscosity of blood, ν, a Reynoldsnumber is defined
Re =UD
ν.
This study will investigate a physiologically significant range of Reynolds numbers100 ≤ Re ≤ 2000.Due to the azimuthal symmetry of the geometry, the flow is computed on the merid-ional half-plane. An example of the meshes used is shown in figure 2. At the inlet,a parabolic velocity profile is employed for steady and unsteady simulations. Theaneurysm and vessel walls are treated as rigid, impermeable boundaries where azero-velocity no-slip condition is prescribed. At the outlet, a reference pressure isprescribed, and a zero normal gradient of velocity is naturally enforced as a resultof the numerical formulation [5].Numerical flow visualization is employed by seeding the flow with passive tracerparticles. The trajectory of these particles is computed using an approximately 4th-order Runge–Kutta hybrid parametric/physical space integration scheme (e.g., see[1]). The particle concentration is recorded at each interpolation point, subject toa local two-dimensional Gaussian filter with a standard deviation chosen to scalewith local mesh density. Plotting contours of particle concentration achieves similarresults to experimental dye visualization techniques [14, 13].To examine the results in a physiological context, dimensional results are also pre-sented, based on reference conditions for the human abdominal aorta [3]; i.e., calibre
3

G. J. SHEARD ET AL.
Figure 1. Schematic diagram showing the aneurysm model under investigation. In thisstudy L/W is maintained at 1.76, and L = 4D. The proximal and distal artery segmentsare each 3D in length, and the radius of curvature (Rc) of the idealized junction betweenthe artery and aneurysm is shown.
Figure 2. A mesh employed in this study. Top: Spectral elements are shown. Bottom:Interpolation points within elements are also shown. Due to symmetry, only the meridionalhalf-plane is required to be discretized.
D = 20 mm, density ρ = 1060 kg/m3, kinematic viscosity ν = 2.547 × 10⁻⁶ m2/s.The heart rate frequency f is described by the non-dimensional Womersley number
α =1
2D
√
2πf/ν.
A range 12 ≤ α ≤ 25.2 is investigated, corresponding to heart rates between 35 and154 beats per minute. This study employed a sinusoidal function of velocity, thefluctuating component of which had an amplitude of U/2.
3. Validation
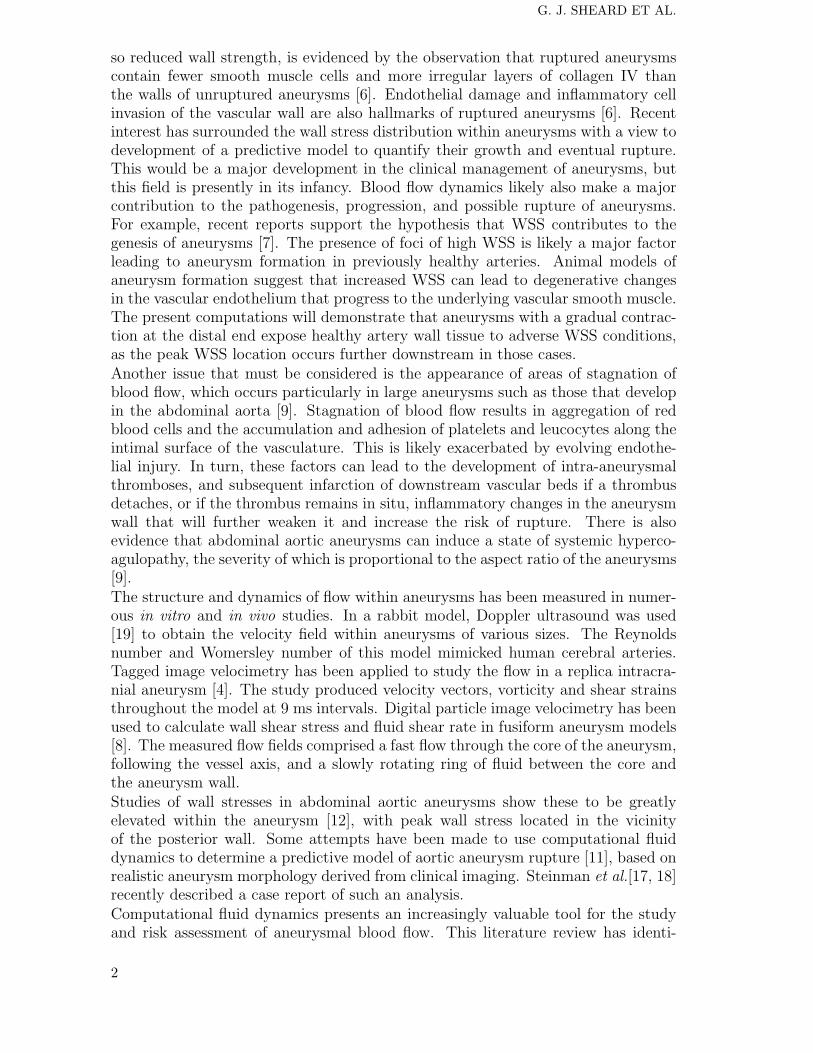
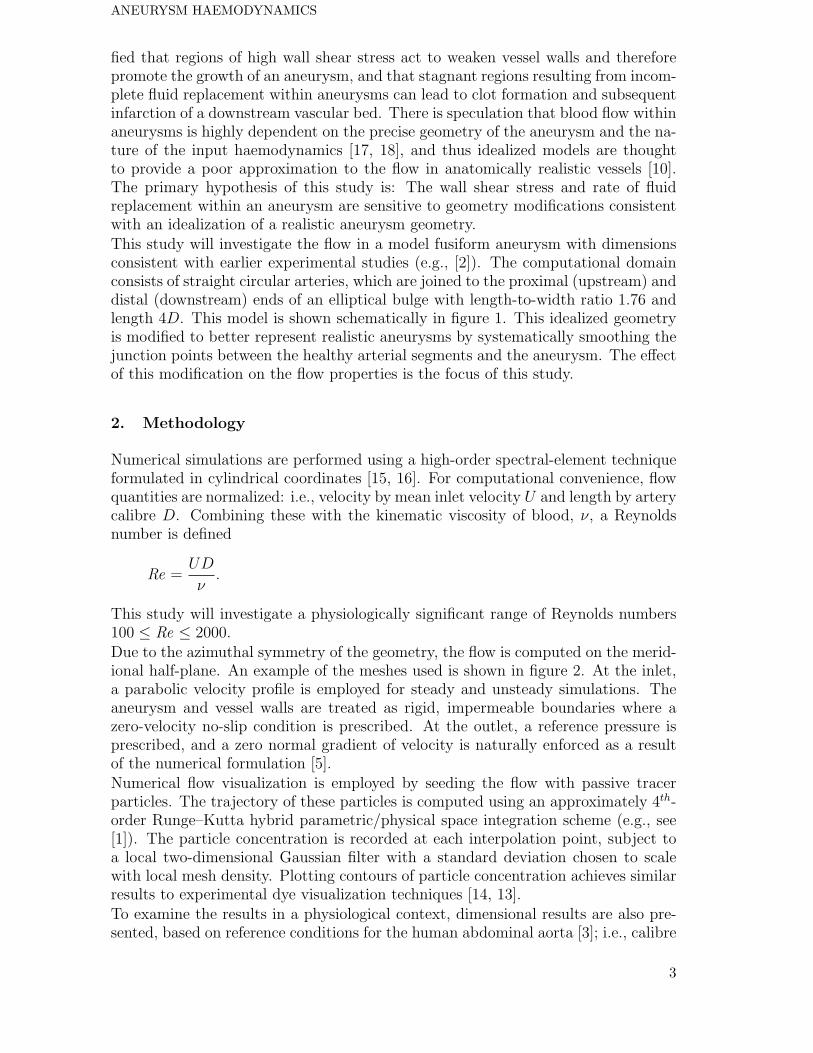
To verify the accuracy of the simulations, a grid-independence study was performed,and further comparisons were made with limited available experimental data on asimilar aneurysm model. A test case was simulated over a range of element polyno-mial degrees at Re = 2000 with a steady-state inlet flow. An L2 norm of the velocityfield was recorded when the simulations reached a steady state, and a percentageerror was taken from the difference between each case and the highest-resolutioncase. The results are plotted in figure 3, which shows a rapid spatial convergence.From these results, it was decided to perform the computations in this study at theefficient element polynomial degree N = 5.An experimental dye-visualization study [2] has presented images of flow in a modelabdominal aortic aneurysm consistent with the present model. Simulated-particlecomputations were performed under matching flow conditions, and visualizationsof the flow at a corresponding point in the pulse cycle is shown in figure 4. The
4
ANEURYSM HAEMODYNAMICS
NL
2no
rm-
%er
ror
3 5 7 9 11 1310-5
10-4
10-3
10-2
10-1
Figure 3. Percentage error in L2 norm (=∫
V|u|dV, where V is the computational domain
volume) of velocity plotted against element polynomial degree N . A steady inflow atRe = 2000 was employed as a test case. Rapid spatial convergence is demonstrated.
Figure 4. Comparison between (left) experimental dye visualization and (right) simula-tions at Re = 2000 and α = 22.5. Flow is from left to right in each frame. Lighter shadesindicate regions of high particle/dye concentration.
comparison shows that dynamical flow features are correctly reproduced. Theseinclude the large vortex ring moving along the axis just downstream of the centreof the aneurysm, the entrainment of particles in the recirculating fluid within thebulge, and the smaller vortical perturbation to the particle thread half way betweenthe large vortex ring and the proximal end of the aneurysm.
4. Results: Steady Inflow
The steady-state flow in the model aneurysm was computed at a range of Reynoldsnumbers, with pressure drop and maximum WSS recorded for each case. To as-certain the sensitivity of flow to changes relating to the level of idealization in thegeometry, the model was modified to incorporate rounded junctions between theartery and the proximal and distal ends of the aneurysm bulge. The radius of cur-vature of this smoothing was systematically varied over 0 ≤ Rc/D ≤ 3, with zerocorresponding to the sharp corners visible in figure 2. For these computations aconstant Reynolds number Re = 2000 was employed, and again the pressure dropand maximum WSS were recorded.
5

G. J. SHEARD ET AL.
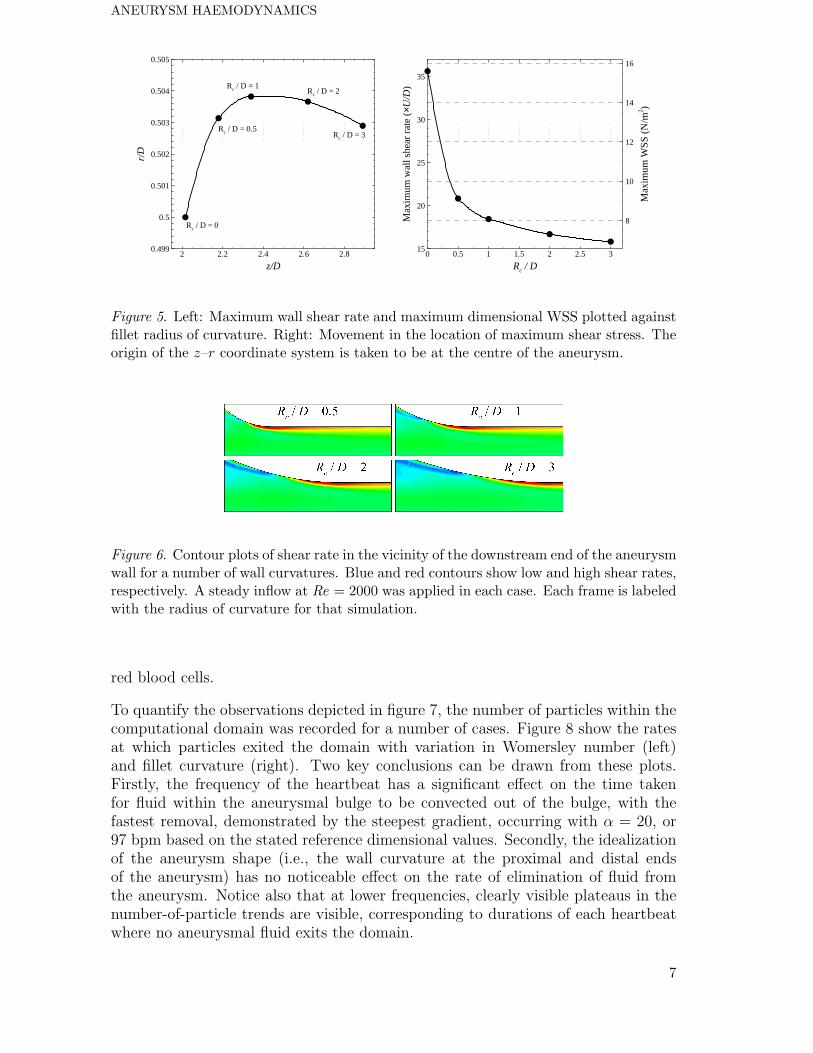
With variation in Reynolds number, the location of maximum wall shear rate con-sistently occurred at the distal intersection between the artery and aneurysm bulge,due to the rapid deflection of attached flow from the contraction into the straightpipe section. Poiseuille’s law dictates that the wall shear rate in a straight pipeshould equal 8U/D, which indeed was found in the straight pipe sections. However,at the distal corner, local values some 5 times higher than this value were obtained,varying from 42.8U/D at Re = 100 down to 35.6U/D at Re = 100. At other loca-tions around the aneurysm wall, shear rates much lower than 8U/D were recorded,in support of earlier observations that abnormal levels of shear are associated withaneurysmal blood flow. Converting to a dimensional WSS, the values increased withmean inflow velocity from 4.68×10⁻² Nm−2 with U = 1.27 cm/s to 15.6 Nm−2 withU = 25.5 cm/s, consistently in the order of 5 times greater than the values expectedin a uniform artery.The aneurysm presents the flow with an expansion followed by a contraction, andin this region mean flow velocities, wall velocity gradients, and hence friction, arelower. It was therefore unsurprising that the pressure drops computed across ananeurysm were lower than expected from a healthy artery of the same length.Consistently, the actual pressure drop was found to be between 75% and 80%of the corresponding drop expected from Poiseuille’s law. For velocities rangingover 1.27 ≤ U ≤ 25.5 cm/s, this corresponds to pressure drops ranging from0.0032 ≤ ∆p ≤ 0.062 mmHg.With variation in fillet radius of curvature, some interesting effects were observed.The smoothly varying wall curvature meant that the location of maximum WSSwas no longer confined to the sharp corner at the distal end of the bulge. Withincreasing radius of curvature, the location of maximum WSS migrated downstream
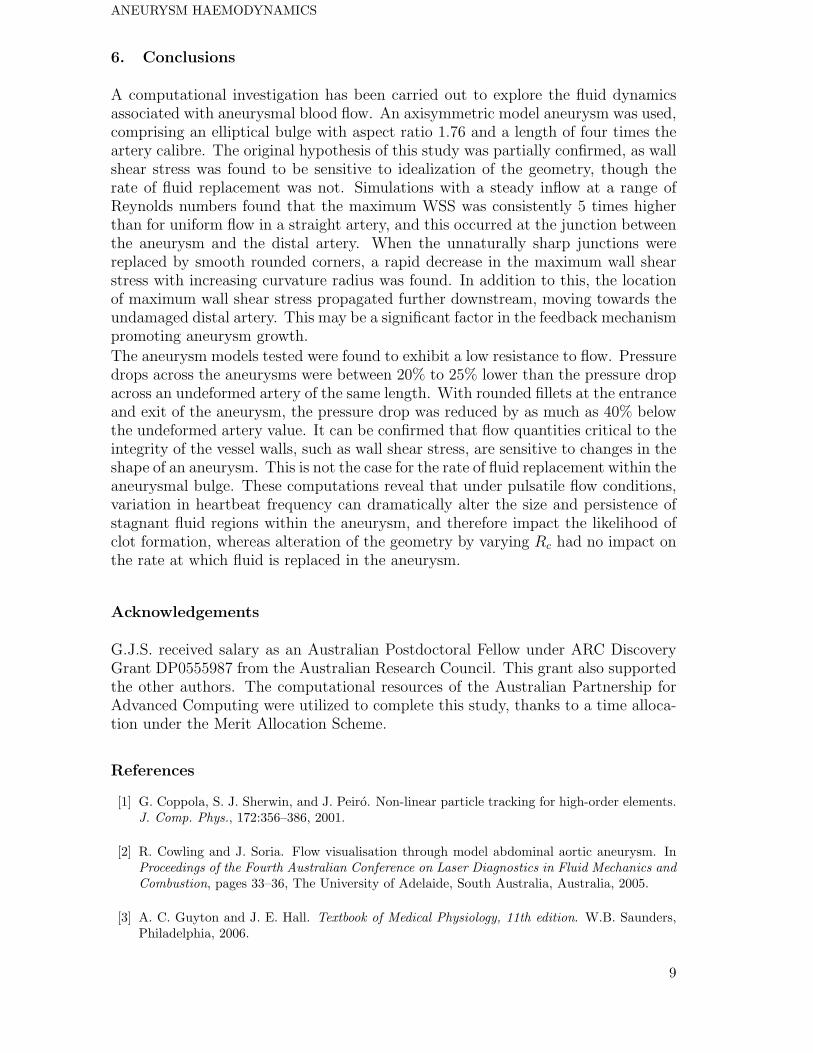
by 0.87D as Rc/D increased from 0 to 3. This was coupled with a large decreasein the maximum wall shear rate from 35.6U/D to 15.8D (here less than twice thevalue for a straight pipe from Poiseuille’s law) over this range. Dimensionally, WSSdecreased from 15.6 to 6.93 Nm−2 as Rc increased from 0 to 6 cm. These trends areplotted in figure 5.Plots of the shear rate in the vicinity of the distal end of the aneurysm models areshown in figure 6. Regions of high shear rate at a wall correspond to regions of highWSS. These images show that elevated levels of WSS extend downstream into thehealthy distal artery, which may lead to further weakening of the artery wall, and asubsequent lengthening and widening of the aneurysm, as reported by Lasheras [8].
5. Results: Pulsatile Inflow
An interesting feature of pulsatile flows was the development of nearly-stagnantrecirculation zones located on the proximal wall of the aneurysm. These zones were,for some Womersley numbers, bounded by a closed streamline throughout the entirepulse cycle. This meant that the fluid retained within those zones never washed outof the aneurysm. Simulations were conducted at Re = 2000 for α = 16.9 and 22.5 fora periodic flow uniformly seeded with particles at the beginning of the computation.Over a number of periods, these particles were progressively washed out of thecomputational domain. However, as can be seen in figure 7, the case with α = 16.9exhibited a closed stagnant region on the proximal wall, which could indicate apropensity for the development of clots through the stagnation and coagulation of
6
ANEURYSM HAEMODYNAMICS
z/D
r/D
2 2.2 2.4 2.6 2.80.499
0.5
0.501
0.502
0.503
0.504
0.505
Rc / D = 0
Rc / D = 3
Rc / D = 2Rc / D = 1
Rc / D = 0.5
Rc / D
Max
imum
wal
lshe
arra
te(×U
/D)
Max
imum
WS
S(N
/m2 )
0 0.5 1 1.5 2 2.5 315
20
25
30
35
8
10
12
14
16
Figure 5. Left: Maximum wall shear rate and maximum dimensional WSS plotted againstfillet radius of curvature. Right: Movement in the location of maximum shear stress. Theorigin of the z–r coordinate system is taken to be at the centre of the aneurysm.
Figure 6. Contour plots of shear rate in the vicinity of the downstream end of the aneurysmwall for a number of wall curvatures. Blue and red contours show low and high shear rates,respectively. A steady inflow at Re = 2000 was applied in each case. Each frame is labeledwith the radius of curvature for that simulation.
red blood cells.
To quantify the observations depicted in figure 7, the number of particles within thecomputational domain was recorded for a number of cases. Figure 8 show the ratesat which particles exited the domain with variation in Womersley number (left)and fillet curvature (right). Two key conclusions can be drawn from these plots.Firstly, the frequency of the heartbeat has a significant effect on the time takenfor fluid within the aneurysmal bulge to be convected out of the bulge, with thefastest removal, demonstrated by the steepest gradient, occurring with α = 20, or97 bpm based on the stated reference dimensional values. Secondly, the idealizationof the aneurysm shape (i.e., the wall curvature at the proximal and distal endsof the aneurysm) has no noticeable effect on the rate of elimination of fluid fromthe aneurysm. Notice also that at lower frequencies, clearly visible plateaus in thenumber-of-particle trends are visible, corresponding to durations of each heartbeatwhere no aneurysmal fluid exits the domain.
7

G. J. SHEARD ET AL.
Figure 7. Particle concentration within an aneurysm over several periods. Time increasesfrom top to bottom. Womersley numbers α = 16.9 (left) and 22.5 (right) are compared,corresponding to heart rates of 70 and 123 beats per minute, respectively, if D = 20 mmand ν = 2.547 × 10⁻⁶ m2/s. Flow is left to right, and light shaded regions show concen-tration of tracer particles.
t U/d
Num
ber
ofpa
rtic
les
20 40 60 80 100 120 140
2000
3000
4000
5000
6000
t U/d
Num
ber
ofpa
rtic
les
0 20 40 60 80 100 120
10000
15000
20000
25000
30000
35000
40000
Figure 8. Number of particles in the computational domain plotted against non-dimensional time tU/D. A faster decrease corresponds to more rapid elimination of bloodfrom the aneurysmal bulge, and pulsatile simulations were performed at Re = 2000. Left:Trends show Womersley numbers α = 12 (black), 16.9 (red), 20 (blue), and 25.2 (green).Right: With a constant α = 16.9, trends show Rc/D = 0.5 (black), 1 (red), 2 (blue), and3 (green).
8
ANEURYSM HAEMODYNAMICS
6. Conclusions
A computational investigation has been carried out to explore the fluid dynamicsassociated with aneurysmal blood flow. An axisymmetric model aneurysm was used,comprising an elliptical bulge with aspect ratio 1.76 and a length of four times theartery calibre. The original hypothesis of this study was partially confirmed, as wallshear stress was found to be sensitive to idealization of the geometry, though therate of fluid replacement was not. Simulations with a steady inflow at a range ofReynolds numbers found that the maximum WSS was consistently 5 times higherthan for uniform flow in a straight artery, and this occurred at the junction betweenthe aneurysm and the distal artery. When the unnaturally sharp junctions werereplaced by smooth rounded corners, a rapid decrease in the maximum wall shearstress with increasing curvature radius was found. In addition to this, the locationof maximum wall shear stress propagated further downstream, moving towards theundamaged distal artery. This may be a significant factor in the feedback mechanismpromoting aneurysm growth.
The aneurysm models tested were found to exhibit a low resistance to flow. Pressuredrops across the aneurysms were between 20% to 25% lower than the pressure dropacross an undeformed artery of the same length. With rounded fillets at the entranceand exit of the aneurysm, the pressure drop was reduced by as much as 40% belowthe undeformed artery value. It can be confirmed that flow quantities critical to theintegrity of the vessel walls, such as wall shear stress, are sensitive to changes in theshape of an aneurysm. This is not the case for the rate of fluid replacement within theaneurysmal bulge. These computations reveal that under pulsatile flow conditions,variation in heartbeat frequency can dramatically alter the size and persistence ofstagnant fluid regions within the aneurysm, and therefore impact the likelihood ofclot formation, whereas alteration of the geometry by varying Rc had no impact onthe rate at which fluid is replaced in the aneurysm.
Acknowledgements
G.J.S. received salary as an Australian Postdoctoral Fellow under ARC DiscoveryGrant DP0555987 from the Australian Research Council. This grant also supportedthe other authors. The computational resources of the Australian Partnership forAdvanced Computing were utilized to complete this study, thanks to a time alloca-tion under the Merit Allocation Scheme.
References
[1] G. Coppola, S. J. Sherwin, and J. Peiro. Non-linear particle tracking for high-order elements.J. Comp. Phys., 172:356–386, 2001.
[2] R. Cowling and J. Soria. Flow visualisation through model abdominal aortic aneurysm. InProceedings of the Fourth Australian Conference on Laser Diagnostics in Fluid Mechanics andCombustion, pages 33–36, The University of Adelaide, South Australia, Australia, 2005.
[3] A. C. Guyton and J. E. Hall. Textbook of Medical Physiology, 11th edition. W.B. Saunders,Philadelphia, 2006.
9

G. J. SHEARD ET AL.
[4] H. Isoda, S. Inagawa, H. Takeda, S. Isogai, Y. Takehara, and H. Sakahara. Preliminary studyof tagged MR image velocimetry in a replica of an intracranial aneurysm. AJNR Am. J.Neuroradiol., 24(4):604–607, 2003.
[5] G. E. Karniadakis and S. J. Sherwin. Spectral/hp Element Methods for Computational FluidDynamics. Oxford University Press, 2005.
[6] K. Kataoka, M. Taneda, T. Asai, A. Kinoshita, M. Ito, and R. Kuroda. Structural fragilityand inflammatory response of ruptured cerebral aneurysms. A comparative study betweenruptured and unruptured cerebral aneurysms. Stroke, 30(7):1396–1401, 1999.
[7] S. Kondo, N. Hashimoto, H. Kikuchi, F. Hazama, I. Nagata, and H. Kataoka. Cerebralaneurysms arising at nonbranching sites. an experimental study. Stroke, 28(2):398–403, 1997.
[8] J. C. Lasheras. The biomechanics of arterial aneurysms. Ann. Rev. Fluid Mech., 39:293–319,2007.
[9] H. Mitsuoka, N. Unno, Y. Takei, T. Saito, K. Ishimaru, K. Miki, and S. Nakamura. Videoden-sitometric blood flow analysis of abdominal aortic aneurysm and intravascular coagulation.J. Vasc. Surg., 38(2):340–345, 2003.
[10] L. Morris, P. Delassus, P. Grace, F. Wallis, M. Walsh, and T. McGloughlin. Effects offlat, parabolic and realistic steady flow inlet profiles on idealised and realistic stent graft fitsthrough Abdominal Aortic Aneurysms (AAA). Med. Eng. Phys., 28(1):19–26, 2006.
[11] M. L. Raghavan and D. A. Vorp. Toward a biomechanical tool to evaluate rupture potential ofabdominal aortic aneurysm: Identification of a finite strain constitutive model and evaluationof its applicability. J. Biomech., 33(4):475–482, 2000.
[12] M. L. Raghavan, D. A. Vorp, M. P. Federle, M. S. Makaroun, and M. W. Webster. Wallstress distribution on three-dimensionally reconstructed models of human abdominal aorticaneurysm. J. Vasc. Surg., 31(4):760–769, 2000.
[13] G. J. Sheard, K. Hourigan, M. C. Thompson, and T. Leweke. Flow around an impulsivelyarrested circular cylinder. Under consideration for publication in Phys. Fluids, 2007.
[14] G. J. Sheard, T. Leweke, and K. Hourigan. The vortex trajectories invoked by an arrestingcylinder. In P. J. Witt & P. Schwarz, editor, Proceedings of the Fifth International Conferenceon CFD in the Process Industries, Hilton on the Park, Melbourne, Australia, 2006. Publishedby CSIRO Australia. ISBN: 0-643-09423-7 CD-ROM.
[15] G. J. Sheard and K. Ryan. The flow past particles driven by a pressure gradient in smalltubes. In P. J. Witt & P. Schwarz, editor, Proceedings of the Fifth International Conferenceon CFD in the Process Industries, Hilton on the Park, Melbourne, Australia, 2006. Publishedby CSIRO Australia. ISBN: 0-643-09423-7 CD-ROM.
[16] G. J. Sheard and K. Ryan. Pressure-driven flow past spheres moving in a narrow tube. Underconsideration for publication in J. Fluid Mech., 2007.
[17] D. A. Steinman, J. S. Milner, C. J. Norley S. P. Lownie, and D. W. Holdsworth. Image-basedcomputational simulation of flow dynamics in a giant intracranial aneurysm. J. Neuroradiol.,24(4):559–566, 2003.
[18] D. A. Steinman, D. A. Vorp, and C. R. Ethier. Computational modeling of arterial bio-mechanics: Insights into pathogenesis and treatment of vascular disease. J. Vasc. Surg.,37(5):1118–1128, 2003.
[19] H. Ujiie, H. Tachibana, O. Hiramatsu, A. L. Hazel, T. Matsumoto, Y. Ogasawara, H. Naka-jima, T. Hori, K. Takakura, and F. Kajiya. Effects of size and shape (aspect ratio) on thehemodynamics of saccular aneurysms: A possible index for surgical treatment of intracranialaneurysms. Neurosurgery, 45(1):119–129; discussion 129–130, 1999.
10