Rupture of central-force lattices
12
733 Rupture of central-force lattices A. Hansen (1), S. Roux (2) and H. J. Herrmann (3) (1) Institut fur Theoretische Physik, Universität zu Köln, D-5000 Köln 41 F.R.G. (2) Laboratoire de Physique de la Matière Hétérogène, URA 857, Ecole Supérieure de Physique et Chimie Industrielles, 10 rue Vauquelin, F-75231 Paris Cedex 05, France (3) Service de Physique Théorique, C.E.N. Saclay, F-91191 Gif-sur-Yvette Cedex, France (Reçu le 10 juin 1988, revisé le 5 décembre 1988, accepté le 7 décembre 1988) Résumé. 2014 Nous étudions numériquement la rupture de treillis réticulés élastiques dont les liens sont élastiques-fragiles. Tous les liens ont une même raideur, mais une force critique de rupture distribuée aléatoirement de façon uniforme entre 0 et 1. Nous analysons la caractéristique globale moyenne force-déplacement ainsi que d’autres paramètres physiques en fonction de la taille du système. Nous présentons des relations d’échelle liant ces quantités. Finalement, nous montrons que la distribution des forces est multifractale au seuil ultime de rupture du réseau. Abstract. We study numerically the rupture of elastic lattices consisting of fragile elastic springs which can freely rotate around nodes. All bonds are given an identical force constant but the threshold force for which they break is randomly attributed to each bond according to a uniform probability distribution between 0 and 1. We analyse the overall force-displacement characteristics of the lattices and other physical parameters as function of lattice size. Various scaling relations are found. Finally, we found evidence for a multifractal distribution of forces at the ultimate stage of the rupture. J. Phys. France 50 (1989) 733-744 ler AVRIL 1989, Classification Physics Abstracts 05 .20. -y - 62.60Mk - 77. 50. +p - 72.90. +y Introduction. An old subject in engineering sciences has been the study of fracture processes in heterogeneous materials [1]. However, due to the complex interplay of the « quenched » disorder (of the élastic failure characteristics of the medium) and of the increasingly large distribution of local stresses as the rupture proceeds through the medium, very few theoretical results have been obtained. In addition to this, numerical simulations of this problem are in general very « heavy ». For these reasons, a natural strategy is to simplify the complex realistic cases in order to capture first the essential properties of fracture which are independent or at least only weakly dependent - on the underlying microscopic (if the rupture proceeds on an atomic scale) or mesoscopic scale (when the heterogenities are large compared to the atomic scale, such as in the rupture of concrete). To an increasing degree, the methods of statistical mechanics have been found useful in the study of the scaling properties of real phenomena such as aggregation processes, etc. We attempt here such an approach to the problem of rupture. Article published online by EDP Sciences and available at http://dx.doi.org/10.1051/jphys:01989005007073300
-
Upload
independent -
Category
Documents
-
view
0 -
download
0
Transcript of Rupture of central-force lattices

733
Rupture of central-force lattices
A. Hansen (1), S. Roux (2) and H. J. Herrmann (3)
(1) Institut fur Theoretische Physik, Universität zu Köln, D-5000 Köln 41 F.R.G.(2) Laboratoire de Physique de la Matière Hétérogène, URA 857, Ecole Supérieure de Physiqueet Chimie Industrielles, 10 rue Vauquelin, F-75231 Paris Cedex 05, France(3) Service de Physique Théorique, C.E.N. Saclay, F-91191 Gif-sur-Yvette Cedex, France
(Reçu le 10 juin 1988, revisé le 5 décembre 1988, accepté le 7 décembre 1988)
Résumé. 2014 Nous étudions numériquement la rupture de treillis réticulés élastiques dont les lienssont élastiques-fragiles. Tous les liens ont une même raideur, mais une force critique de rupturedistribuée aléatoirement de façon uniforme entre 0 et 1. Nous analysons la caractéristique globalemoyenne force-déplacement ainsi que d’autres paramètres physiques en fonction de la taille dusystème. Nous présentons des relations d’échelle liant ces quantités. Finalement, nous montronsque la distribution des forces est multifractale au seuil ultime de rupture du réseau.
Abstract. 2014 We study numerically the rupture of elastic lattices consisting of fragile elastic springswhich can freely rotate around nodes. All bonds are given an identical force constant but thethreshold force for which they break is randomly attributed to each bond according to a uniformprobability distribution between 0 and 1. We analyse the overall force-displacement characteristicsof the lattices and other physical parameters as function of lattice size. Various scaling relationsare found. Finally, we found evidence for a multifractal distribution of forces at the ultimate stageof the rupture.
J. Phys. France 50 (1989) 733-744 ler AVRIL 1989,
Classification
Physics Abstracts05 .20. -y - 62.60Mk - 77. 50. +p - 72.90. +y
Introduction.
An old subject in engineering sciences has been the study of fracture processes in
heterogeneous materials [1]. However, due to the complex interplay of the « quenched »disorder (of the élastic failure characteristics of the medium) and of the increasingly largedistribution of local stresses as the rupture proceeds through the medium, very few theoreticalresults have been obtained. In addition to this, numerical simulations of this problem are ingeneral very « heavy ».
For these reasons, a natural strategy is to simplify the complex realistic cases in order tocapture first the essential properties of fracture which are independent - or at least onlyweakly dependent - on the underlying microscopic (if the rupture proceeds on an atomicscale) or mesoscopic scale (when the heterogenities are large compared to the atomic scale,such as in the rupture of concrete). To an increasing degree, the methods of statisticalmechanics have been found useful in the study of the scaling properties of real phenomenasuch as aggregation processes, etc. We attempt here such an approach to the problem ofrupture.
Article published online by EDP Sciences and available at http://dx.doi.org/10.1051/jphys:01989005007073300

734
We considered specifically a two-dimensional lattice model, where the local elastic moduliare uniform and, finally, where disorder is introduced once at the beginning in the distributionof failure thresholds. In this way, all the heterogenities of the material are captured in onlyone quantity, thus making it possible to investigate which features of the heterogenities areimportant during various stages of the rupture process.The fuse problem [2-5] is one obvious simplification which has very often been studied since
it is the scalar equivalent of elastic rupture. It is now well-known that, in some respect, vectorand scalar problems differ significantly even in the scaling relations they obey, for instance, inpercolation [6]. From a practical point of view it is very important to understand whichfeatures of the real rupture processes can be captured by using a scalar model only, for theobvious reason that scalar problems are eomputerwise much less time consuming than vectorones - besides being much simpler to work with theoretically. For this reason, we followedthe very same procedure and gathered the same information for three parallel cases [7] :- an elastic central-force lattice which will be described in this article ;- a beam lattice where each bond has a non-zero rigidity for axial and transverse force,
and for bending [8] ;- a fuse lattice defining the corresponding scalar problem [9].
The reason for treating separately the central-force model and an angular elasticity modelas the beam model, is that the concept of rigidity in the central-force model is non-local [10],making it possibly very different from the other models where the local elastic rigidity is
determined solely by the local connectivity properties of the lattice. On the other hand, in thecentral-force model there are no free parameters since all the disorder is in the breakingstrengths as opposed to the angular elasticity case.Within the framework of our model, there are still many possibilities to introduce disorder.
One natural way is to consider a percolation-type disorder, i.e. a finite fraction of bonds areremoved at random, whereas the remaining ones have identical elastic properties, and thesame failure threshold. This latter case has been considered in the past both for the fuse
problem [3] and the central-force case [11]. We consider here a different kind of disorder, byintroducing a continuous distribution of failure strength. This lead to very different resultsthan previously reported ones. We discuss the comparison of these two types of disorder laterin this paper.
Model.
We consider a triangular lattice where each bond consists of a linear Hookean spring free torotate around its endpoints at the nodes of the lattice. The elastic constant of these springs isfixed to be unity by definition. Each bond is ideally brittle and breaks (i.e. its elastic constantbecomes zero) whenever the force f it is subjected to exceeds a positive limit 1 + (if the bond isstetched) or a negative limit 1 - (if the bond is compressed). We consider here the case of asymmetric rupture criterion f + = f _ = f c. Contrary to the elastic modulus, the thresholdfc for each bond is randomly picked, according to a probability density that we choose to beuniform between 0 and 1. We assume that the bonds are very brittle, i.e. their deformation at
rupture is small compared to their length at rest. This allow us to treat the problem within thelimit of small deformation, i.e. to deal with a linear problem. This linearity property will beused all along the paper. Since in the linearized equations there does not exist any lengthscale, we will use a scale for force given by the distribution of breaking threshold, and a scalefor displacement given by the previous in setting arbitrarily the elastic modulus to unity. This
length scale with which we measure the deformation of the lattice has no direct relation with

735
the lattice size. (Our small deformation assumption means that the lattice spacing expressedin our length units is large compared to 1.)The boundary conditions are periodic in the horizontal direction, and the top and bottom
rows are attached to two rigid bars at which we impose a given displacement : either a shear ora compression.The numerical procedure used is the following :- we start with a regular lattice. For an imposed unit displacement of the rigid bars, we
know the force distribution in the lattice. Let fi be the force to which the i-th bond is
subjected to. Let us now imagine that the displacement of the rigid bars is A instead of 1, thenthe force at bond j is Afj. If the displacement A is increased from 0, the bond
j will break when
We thus compute for each bond j :
and break the bond for which Aj has the smallest value 1B = minj (Aj) which corresponds tothe overall lattice displacement for which a first bond will break. After the bond j is broken,the new force distribution is computed. The new value of Acis found, and the computation isrepeated until the entire lattice has a zero elastic modulus.The complete « history » of the rupture of the lattice is given by the sequence of the
displacements A,(n), of the total extemal forces F(n), of the elastic modulus Y(n) =F (n )/ Ac (n ), of local forces f (n ) for a unit extemal displacement of the bond that willbreak... indexed by n, the number of already broken bonds.Now, in order to obtain an average behavior, one has to take a mean over many samples. In
each sample, some controllable quantity has to be kept constant in order to be able, in ameaningful way, to compare the samples. In the language of statistical mechanics, an« ensemble » has to be chosen [12]. This question is not unimportant since it might very wellturn out that the resulting average behaviors differ, according to which quantity is keptconstant in comparing the different samples.
In this article (and in its companions [7-9]), we choose an « history » average. Any quantityX (n ) is averaged over different lattices keeping n constant, and therefore, restricting theaverage to the lattices that are not yet torn apart at this stage of the rupture. One should notethat the number of samples the quantity is averaged over will decrease with increasingn. We generated 10 000 4 x 4, 1 000 8 x 8, 300 16 x 16 and 30 24 x 24 lattices.The algorithm we used to solve the force distribution on the lattices was a conjugate
gradient relaxation method without Fourier acceleration [13] - for the lattice sizes we
considered, Fourier acceleration turned out to be unefficient.
Results.
Figure 1 shows the total displacement, 1B (n ) , (elongation) at rupture as a function of thenumber, n, of bonds broken for different lattice sizes L. A striking feature of these graphs, isthat they clearly reveal a linear relation between these two quantities for n up to 100 forL=16and n = 200 for L = 24. After this linear regime, the displacement increases drastically. Onthese graphs, we also draw the straight line given by :
that fits the first regime very nicely.

736
Fig. 1. - Evolution of the overall lattice displacement per unit length AL - at rupture as a function ofnL-2, the number of bonds already broken divided by L 2. This displacement is averaged over differentlattices with the same n. The four curves refer to four different lattice size 4, 8, 1 and 24. The straightline is the linear relation of equation (3) in the text.
We can understand this relation by the following crude, mean-field type, argument : let usassume that the strain is uniformly distributed in the lattice (as if it where intact). Since theimposed displacement is an elongation, each bond parallel to the top and bottom rigid barswill carry no force, due to the periodic boundary conditions. On the contrary, the bonds in theother two directions will be elongated by an amount E = (B/3/2) A/L. For a givenA, the bonds that have been broken are those whose strain rupture threshold is less than
e. In the case of a uniform distribution of rupture thresholds between 0 and 1, the number ofthese bonds carrying a strain less than E is given by the equation
resulting in equation (3).The basic assumption of this argument is certainly very rough ; however, it gives an
unexpectedly good result (see Fig. 1). Let us note that the mean-field prediction of the elasticmodulus of the randomly depleted central-force triangular lattice [14] also works remarkablywell, almost up to the percolation threshold.
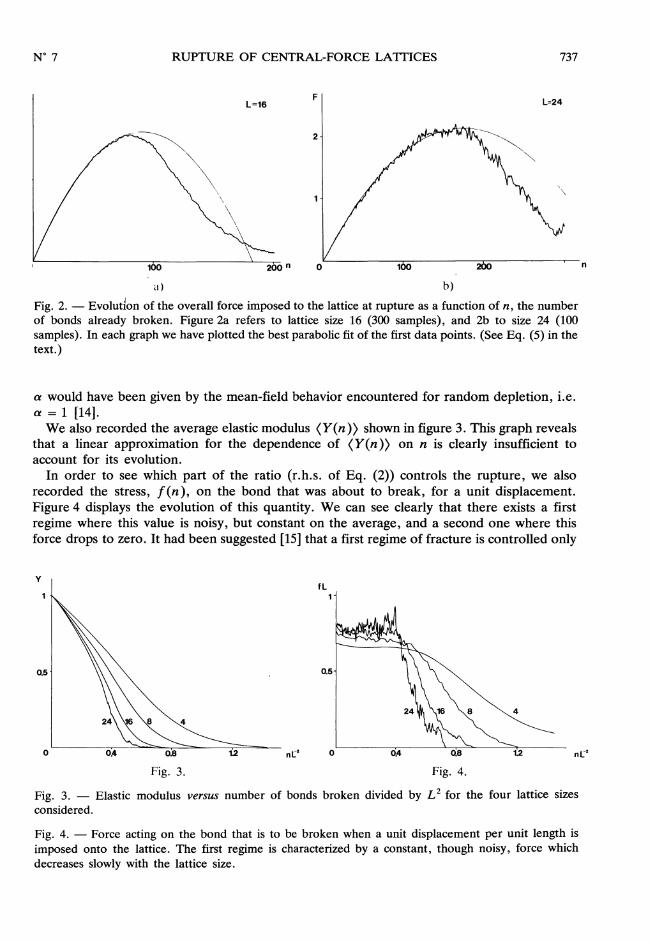
Figure 2 gives the force needed to break n bonds for the L = 16 and 24 lattices. In this case,we performed a parabolic fit of the data according to :
or, equivalently, we searched for the first linear correction to the elastic modulus,y (n) = F (n ) > / LB (n ). Figure 2 displays these best fits which are quite good up to theapex of the parabola (nu 90 for L = 16 and n = 160 for L = 24). They were obtained fora = 1.0, a = 1.25, a = 1.5 and a = 1.65, respectively for L = 4, 8, 16 and 24. It turned outthat it was not possible to find a constant value of the parameter a that could fit all sizesequally well. On the contrary, a tends to increase with L. We will come back to this pointlater. We also note that if the rupture of bonds would be done completely at random (forinstance if the rupture thresholds would dominate the ratios of Eq. (2)), then the parameter
737
Fig. 2. - Evolution of the overall force imposed to the lattice at rupture as a function of n, the numberof bonds already broken. Figure 2a refers to lattice size 16 (300 samples), and 2b to size 24 (100samples). In each graph we have plotted the best parabolic fit of the first data points. (See Eq. (5) in thetext.)
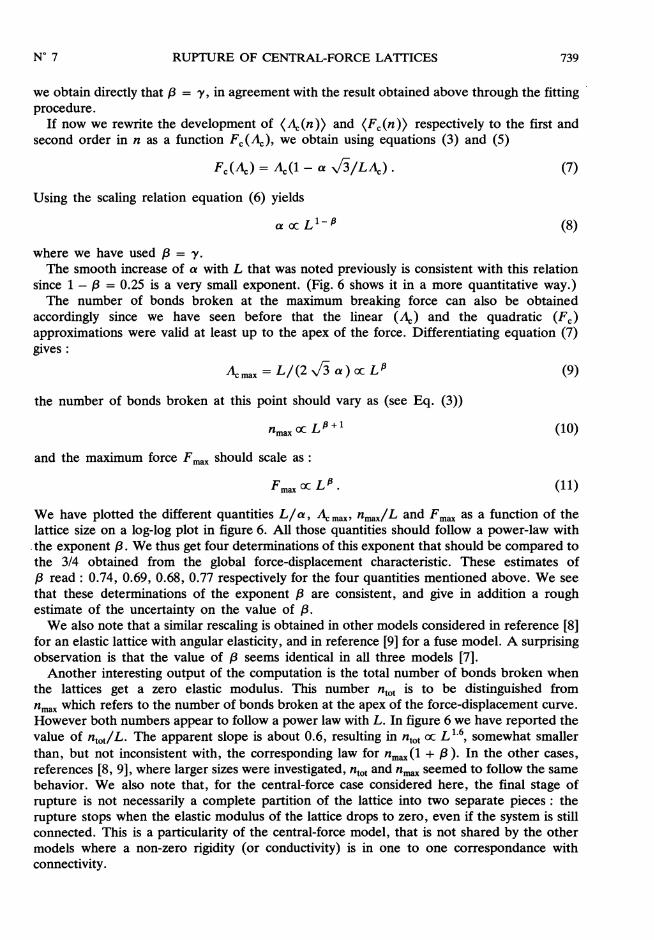
a would have been given by the mean-field behavior encountered for random depletion, i.e.a = 1 [14].We also recorded the average elastic modulus (Y(n» shown in figure 3. This graph reveals
that a linear approximation for the dependence of (Y(n» on n is clearly insufficient toaccount for its evolution.
In order to see which part of the ratio (r.h.s. of Eq. (2)) controls the rupture, we alsorecorded the stress, f (n ), on the bond that was about to break, for a unit displacement.Figure 4 displays the evolution of this quantity. We can see clearly that there exists a firstregime where this value is noisy, but constant on the average, and a second one where thisforce drops to zero. It had been suggested [15] that a first regime of fracture is controlled only
Fig. 3. Fig. 4.
Fig. 3. - Elastic modulus versus number of bonds broken divided by L2 for the four lattice sizesconsidered.
Fig. 4. - Force acting on the bond that is to be broken when a unit displacement per unit length is
imposed onto the lattice. The first regime is characterized by a constant, though noisy, force whichdecreases slowly with the lattice size.

738
by the disorder of thresholds. In other words, at the beginning of the rupture process wewould expect that the stresses onto the bonds of the lattice are more or less the same, whereasthe strengths of the bonds are widely distributed, therefore, through equation (2), thebreaking of bonds and the force f (n ) should be uncorrelated. This expectation is in
agreement with the fact that f (n ) is independent of n. We also notice that f (n ) decreaseswhen the lattice size increases and from the previous analysis, we get a 1 IL dependence whichis approximately verified (Fig. 4).The approach followed up to now, i.e. relating the evolution of the observed quantities with
the number of bonds broken, is clearly unable to give a general description of the process,independent of lattice sizes. Increasing the order of the expansion in n, would certainly givebetter firts for a given size, however, without any knowledge of the evolution of thecoefficients of the expansion (e.g. like a) this procedure is useless. We thus turn to anotherapproach that takes into account these size effects more properly.
Rescaling.
We now try to find a simple relation between the different quantities reported up to now onthe lattice size. In this spirit, we propose the following Anzatz :
where /3 and y are unknown exponents and 0 is a universal function independent of thesystem size. In physical terms, this scaling relation defines some reduced variables, here(Fc(n»L -/3 and (Ac(n»L - ’Y, which are related through a function which is independent oflattice size. The values of /3 and y are determined through the best collapse of the dataobtained for different sizes. Such a fit is shown in figure 5 for f3 = y = 3/4. Other trial
functions were also used, but the simple form of equation (6) fitted the data remarkably wellin the first part of the curve (a little after the apex of the breaking force) if we disregard the
. data of size 4 which is obviously too small to give any reliable estimates.Using the property (seen previously) that the slope in the force-displacement relation in the
immediate vicinity of 0 is 1 (the elastic modulus is close to 1 at the beginning of the rupture),
Fig. 5. - Rescaled force-displacement relation according to equation (6) with {3 = y = 3/4, for
different sizes 4, 8, 16 and 24.
739
we obtain directly that /3 = y, in agreement with the result obtained above through the fitting *
procedure.If now we rewrite the development of ( Ac (n ) ) and (Fc(n» respectively to the first and
second order in n as a function Fc(Ac), we obtain using equations (3) and (5)
Using the scaling relation equation (6) yields
where we have used f3 = y.The smooth increase of a with L that was noted previously is consistent with this relation
since 1 - p = 0.25 is a very small exponent. (Fig. 6 shows it in a more quantitative way.)The number of bonds broken at the maximum breaking force can also be obtained
accordingly since we have seen before that the linear ( Ac ) and the quadratic (Fc )approximations were valid at least up to the apex of the force. Differentiating equation (7)gives :
the number of bonds broken at this point should vary as (see Eq. (3))
and the maximum force F.a. should scale as :
We have plotted the different quantities LI a, Ac max, nmaxlL and Fmax as a function of thelattice size on a log-log plot in figure 6. All those quantities should follow a power-law with. the exponent 8. We thus get four determinations of this exponent that should be compared tothe 3/4 obtained from the global force-displacement characteristic. These estimates of
J3 read : 0.74, 0.69, 0.68, 0.77 respectively for the four quantities mentioned above. We seethat these determinations of the exponent J3 are consistent, and give in addition a roughestimate of the uncertainty on the value of J3.We also note that a similar rescaling is obtained in other models considered in reference [8]
for an elastic lattice with angular elasticity, and in reference [9] for a fuse model. A surprisingobservation is that the value of J3 seems identical in all three models [7].Another interesting output of the computation is the total number of bonds broken when
the lattices get a zero elastic modulus. This number ntot is to be distinguished fromnmax which refers to the number of bonds broken at the apex of the force-displacement curve.However both numbers appear to follow a power law with L. In figure 6 we have reported thevalue of nt,/L. The apparent slope is about 0.6, resulting in ntot oc L 1.6, somewhat smallerthan, but not inconsistent with, the corresponding law for nmax (1 + J3). In the other cases,references [8, 9], where larger sizes were investigated, ntot and nmax seemed to follow the samebehavior. We also note that, for the central-force case considered here, the final stage ofrupture is not necessarily a complete partition of the lattice into two separate pieces : therupture stops when the elastic modulus of the lattice drops to zero, even if the system is stillconnected. This is a particularity of the central-force model, that is not shared by the othermodels where a non-zero rigidity (or conductivity) is in one to one correspondance withconnectivity.

740
Fig. 6. - Log-log plot of LIOT, 4 max, nmaxl L, ntotl Land FmaX as a function of the lattice size L. Allthose quantities should scale with the same exponent {3. The slope that would result from
{3 = 3/4 is shown as a straight line on the graph.
We would like to emphasize the fact that one parameter of the rescaling, e.g.03B2, has been determined exclusively from numerical data. It certainly deserves an explanationthat we do not have at present. Theoretical approaches of this problem as references [3, 5]would rather suggest an estimate of j6 of order 0 (logarithmic term) or 1, which are bothincompatible with our data. As a result of the strong generality of the results obtained for ourmodels of rupture, a conjecture has been made [7] that relates the exponent of the scaling ofnmax and ntot versus L with the fractal dimension of « diffusion-limited aggregation ». Thisconjecture however deserves further studies that are being performed.
Finally, we also record the complete histogram N ( f , L ) of the logarithm of the forcedistribution, just before the last bond breaks. In order to check the eventual « multifractal »[16] nature of this distribution we plot in figure 7, log (N ( f , L ) )/log (L ) versus log ( f )/log (L ). If the distribution is multifractal, this plot should tend to be size-independent forlarge enough lattice and converge to the so-called « f (x ) » spectrum (we use this notation asthe « standard » one, however a has nothing to do with the coefficient discussed previously),thus containing all available information on the scaling behavior of the average force
distribution inside the lattices at the breaking point. Indeed figure 7 seems to suggest thisproperty, although certainly the sizes considered here are too small to lead to a definitiveconclusion in this regard.Another equivalent way of obtaining the multifractal spectrum f ( a ), is through the scaling
of the moments of the force distribution. Let us define Mq fi 1q where the sum runs overi
all bonds carrying a non-zero force. These moments scale with L according to Mq ocL-p(q). In particular, Mo is the mass of the force-carrying part of the lattice. Since the densityof broken bonds ntot/ L 2 represents a vanishingly small fraction of the whole lattice, we expectp (0) = - 2. This is indeed what we observed (p(0) = 2.01 from the direct measurement).Figure 8 shows the evolution of the reduced moments mq = (Mq/Mo)l/q as a function of

741
Fig. 7. - Rescaled log-histogram of the force distribution in the lattices just before the last bond breaks,for an imposed displacement of unity for three different sizes L = 8, 16 and 24. This histogram shouldtend toward the multifractal spectrum « f (a) » when the lattice size increases (note that the « quotedhere has nothing to do with the coefficient appearing in Eq. (5)). We observe a good collapse of thedata, besides a small hump on the left of the apex of the curve that comes from the largest lattice size,where the statistics is poor.
Fig. 8. - Evolution of the reduced moments mq of the force distribution just before the last bondbreaks, versus the lattice size in a log-log scale. The slope y(q) of these moments from
q = 1 to 5 varies, and thus reveals a multifractal behavior.
L for q = 1 to 5. The fact that these moments do not fall onto parallel lines in a log-log plotimplies a multifractal distribution of forces, or a non constant gap scaling. From these plots,we can extract the difference slopes y (q ) and thus the corresponding exponent p (q ) =p (0) - qy (q ). Figure 9 gives the estimates of p (q ) that are also reported in table I. For highorder of the moments we can approximate p (q ) by a linear relation : p (q ) = aq - b. The

742
Table 1. - We report here the exponent p (q ) of the scaling of the moments of the forcedistribution : p (0 ) is the negative o f the fiactal dimension o f the force carrying part o f the latticethus - 2. p(q) tends approximately to an asymptote p(q) = 0.8 q - 0.1 for high ordermoments, revealing a localised zone of high stresses (of fiactal dimension of order 0.1,eventually 0).
Fig. 9. - Evolution of the exponents p (q ) of the raw moments of the force distribution versus q. Thiscurve shows again the multifractal distribution of forces.
physical meaning of the quantity b is thé fractal dimension of the subset of bonds that carrythe highest forces. The numerical estimate of b is 0.1 is consistent with the picture that justbefore the last bond breaks, the highest stresses are concentrated in a local zone, independentof the lattice size. Indeed, in this latter case, the dimension b would be zero. To connect theseries p (q ) to the multifractal spectrum « f (a) », we recall the relations [16] :
The occurrence of multifractality has been seen clearly in the fuse case of rupture [7, 8] atthe final rupture point. However, the numerical values of p (q ) seem to be different in thesetwo cases.
We now turn to the comparison of our results with those already reported [11] for the caseof percolation-type disorder. This case can be cast in the same language as our model byrecognizing that the percolation case can be viewed as a breaking strength distributionconsisting in two Dirac functions, one situated at unity which a weight p and the other at zero(i.e. the bonds break immediately) with a weight (1- p ) (see Fig. 10). Such a distributionleads to the following main results :

743
Fig. 10. - Distribution of failure strength te used in our study (a) and in a percolation type disorder (b).
- the average initial breakdown force behaves as
where g is an exponint between 1 and 2 ;- the global rupture force distribution has the following form :
from this last expression, Beale and Srolovitz deduced the average failure force as :
The first scaling relation (13) has no meaningful equivalent in the case of a continuousdistribution of failure strength, such as the one studied in the present work. We did not studythe global breakdown force distribution, but rather its average as discussed previously. Thepower-law dependence over the lattice size we have observed (Eq. (11)), is not consistentwith the percolation type disorder results (Eq. (15)). The discrepancy between the results maybe attributed to the existence of two peaks in the distribution of failure strength, separated bya gap for the percolation type disorder. Therefore in this case, the breaking is solelydetermined by the force distribution in the lattice. For the continuous distribution of localfailure thresholds we considered, the rupture process proceeds continuously as a competitionbetween the force and the failure strength distributions. This difference is the only possibleorigin of the different scaling laws observed.
Conclusion.
Let us summarize the main points obtained in this study.- The relation between the breaking displacement and the number of bonds broken is
remarkably linear over a substantial range (even beyond the apex of the breaking force).- The relation between the breaking force and the number of bonds broken can be very
well approximated by a parabolic law, in the first stages of the breaking process.- The beginning of the force-displacement characteristics can be rescaled through a
power-law dependence with an exponent of about 3/4 on the lattice size, which seems verygeneral, and non-trivial.- The distribution of forces, just before the final completion of the rupture, is
multifractal.

744
These numerical observations certainly deserve confrontation with experimental data, aswell as new theoretical approaches in order to understand, at least, the unexpected power-lawdependence with size of most observable physical quantities on the system size.
Acknowledgments.
It is a pleasure to acknowledge useful discussions with L. de Arcangelis, E. Guyon and E.Hinrichsen. We are indebted to M. Novotny, and IBM Bergen Scientific Centre, for theirhospitality in Bergen where most of the computations were performed. A.H. is supported bySFB 125 of the DFG, and S.R. by an ATP contract of the CNRS.
References
[1] See e.g. Fracture Vol. I-VII, Ed. H. Liebowitz (Acad. Press, N.Y.) 1984.[2] DE ARCANGELIS L., REDNER S. and HERRMANN H. J., J. Phys. Lett. France 46 (1985) L585.[3] DUXBURY P. M., BEALE P. D. and LEATH P. L., Phys. Rev. Lett. 57 (1986) 1052 ;
DUXBURY P. M., LEATH P. L. and BEALE P. D., Phys. Rev. B 36 (1987) 1701.[4] SAHIMI M. and GODDARD J., Phys. Rev. B 33 (1986) 7848 ;
GILABERT A., VANNESTE C., SORNETTE D. and GUYON E., J. Phys. France 48 (1987) 763.[5] KHANG B., BATROUNI G. G., REDNER S., DE ARCANGELIS L. and HERRMANN H. J., Phys. Rev. B
37 (1988) 7625.[6] KANTOR Y. and WEBMAN I., Phys. Rev. Lett. 52 (1984) 1891.[7] DE ARCANGELIS L., HANSEN A., HERRMANN H. J. and ROUX S., preprint.[8] HERRMANN H. J., HANSEN and ROUX S., preprint.[9] DE ARCANGELIS L. and HERRMANN H. J., preprint.
[10] DAY A. R., TREMBLAY R. R., TREMBLAY A.-M. S., Phys. Rev. Lett. 56 (1986) 2501.[11] BEALE P. D. and SROLOVITZ D. J., Phys. Rev. B 37 (1988) 5500.[12] BATROUNI G. G., HANSEN A. and Roux S., Phys. Rev. A 38 (1988) 3820.[13] BATROUNI G. G., HANSEN A. and NELKIN M., Phys. Rev. Lett. 57 (1986) 1336 ;
BATROUNI G. G. and HANSEN A., J. Stat. Phys. 52 (1988) 747.[14] FENG S., THORPE M. F. and GARBOCZI E., Phys. Rev. B 31 (1985) 276.[15] Roux S., HANSEN A., HERRMANN H. J. and GUYON E., J. Stat. Phys. 52 (1988) 237.[16] PALADIN G. and VULPIANI A., Phys. Rep. 156 (1987) 147 ;
DE ARCANGELIS L., Disorder and Mixing, Proc. of the Summer School Cargèse (June 14-27,1987).