Plaster cast versus functional bracing for Achilles tendon rupture
114
Journals Library DOI 10.3310/hta24080 Plaster cast versus functional bracing for Achilles tendon rupture: the UKSTAR RCT Matthew L Costa, Juul Achten, Susan Wagland, Ioana R Marian, Mandy Maredza, Michael Maia Schlüssel, Anna S Liew, Nick R Parsons, Susan J Dutton, Rebecca S Kearney, Sarah E Lamb, Benjamin Ollivere and Stavros Petrou on behalf of the UKSTAR Trial Management Group Health Technology Assessment Volume 24 • Issue 8 • February 2020 ISSN 1366-5278
-
Upload
khangminh22 -
Category
Documents
-
view
3 -
download
0
Transcript of Plaster cast versus functional bracing for Achilles tendon rupture
Journals Library
DOI 10.3310/hta24080
Plaster cast versus functional bracing for Achilles tendon rupture: the UKSTAR RCT Matthew L Costa, Juul Achten, Susan Wagland, Ioana R Marian, Mandy Maredza, Michael Maia Schlüssel, Anna S Liew, Nick R Parsons, Susan J Dutton, Rebecca S Kearney, Sarah E Lamb, Benjamin Ollivere and Stavros Petrou on behalf of the UKSTAR Trial Management Group
Health Technology AssessmentVolume 24 • Issue 8 • February 2020
ISSN 1366-5278


Plaster cast versus functional bracing forAchilles tendon rupture: the UKSTAR RCT
Matthew L Costao ,1* Juul Achteno ,1
Susan Waglando ,1 Ioana R Mariano ,1
Mandy Maredzao ,2 Michael Maia Schlüsselo ,1
Anna S Liewo ,1 Nick R Parsonso ,3
Susan J Duttono ,1 Rebecca S Kearneyo ,2
Sarah E Lambo ,1,4 Benjamin Ollivereo 5
and Stavros Petrouo2,6 on behalf of the UKSTARTrial Management Group
1Nuffield Department of Orthopaedics, Rheumatology and Musculoskeletal Sciences,University of Oxford, Oxford, UK
2Warwick Clinical Trials Unit, Warwick Medical School, University of Warwick,Coventry, UK
3Statistics and Epidemiology Unit, Warwick Medical School, University of Warwick,Coventry, UK
4College of Medicine and Health, University of Exeter, Exeter, UK5Division of Rheumatology, Orthopaedics and Dermatology, School of Medicine,Queen’s Medical Centre Nottingham, University of Nottingham, Nottingham, UK
6Nuffield Department of Primary Care Health Sciences, University of Oxford, Oxford, UK
*Corresponding author
Declared competing interests of authors: Matthew L Costa is a National Institute for Health Research(NIHR) Senior Investigator and a member of the NIHR Health Technology Assessment (HTA) GeneralBoard (1 November 2016 to present). Rebecca S Kearney is a member of the NIHR HTA ClinicalEvaluation and Trials Board (8 November 2018–present) and the NIHR Integrated Clinical AcademicDoctoral Panel (29 November 2017–present) and was a member of NIHR Research for Patient BenefitBoard (28 January 2016–24 January 2019). Sarah E Lamb reports that she was a member of thefollowing boards: HTA Additional Capacity Funding Board (2012–15); HTA Clinical Trials Board(2010–15); HTA End of Life Care and Add on Studies (2015); HTA Funding Boards Policy Group(formerly Clinical Specialty Group) (2010–15); HTA Maternal, Neonatal, Child Health Methods Group(2013–15); HTA Post-board funding teleconference (2010–15); HTA Primary Care Themed Call Board(2013–14); HTA Prioritisation Group (2012–15); and the NIHR Clinical Trials Unit Standing AdvisoryCommittee (2012–16). Stavros Petrou is a NIHR Senior Investigator.
Published February 2020DOI: 10.3310/hta24080


This report should be referenced as follows:
Costa ML, Achten J, Wagland S, Marian IR, Maredza M, Schlüssel MM, et al. Plaster cast versus
functional bracing for Achilles tendon rupture: the UKSTAR RCT. Health Technol Assess
2020;24(8).
Health Technology Assessment is indexed and abstracted in Index Medicus/MEDLINE, Excerpta
Medica/EMBASE, Science Citation Index Expanded (SciSearch®) and Current Contents®/
Clinical Medicine.


Health Technology Assessment HTA/HTA TAR
ISSN 1366-5278 (Print)
ISSN 2046-4924 (Online)
Impact factor: 3.819
Health Technology Assessment is indexed in MEDLINE, CINAHL, EMBASE, The Cochrane Library and the Clarivate AnalyticsScience Citation Index.
This journal is a member of and subscribes to the principles of the Committee on Publication Ethics (COPE)(www.publicationethics.org/).
Editorial contact: [email protected]
The full HTA archive is freely available to view online at www.journalslibrary.nihr.ac.uk/hta. Print-on-demand copies can bepurchased from the report pages of the NIHR Journals Library website: www.journalslibrary.nihr.ac.uk
Criteria for inclusion in the Health Technology Assessment journalReports are published in Health Technology Assessment (HTA) if (1) they have resulted from work for the HTA programme,and (2) they are of a sufficiently high scientific quality as assessed by the reviewers and editors.
Reviews in Health Technology Assessment are termed ‘systematic’ when the account of the search appraisal and synthesismethods (to minimise biases and random errors) would, in theory, permit the replication of the review by others.
HTA programmeHealth Technology Assessment (HTA) research is undertaken where some evidence already exists to show that a technology canbe effective and this needs to be compared to the current standard intervention to see which works best. Research can evaluateany intervention used in the treatment, prevention or diagnosis of disease, provided the study outcomes lead to findings thathave the potential to be of direct benefit to NHS patients. Technologies in this context mean any method used to promotehealth; prevent and treat disease; and improve rehabilitation or long-term care. They are not confined to new drugs and includeany intervention used in the treatment, prevention or diagnosis of disease.
The journal is indexed in NHS Evidence via its abstracts included in MEDLINE and its Technology Assessment Reports informNational Institute for Health and Care Excellence (NICE) guidance. HTA research is also an important source of evidence forNational Screening Committee (NSC) policy decisions.
This reportThe research reported in this issue of the journal was funded by the HTA programme as project number 13/115/62. Thecontractual start date was in April 2016. The draft report began editorial review in June 2019 and was accepted for publicationin October 2019. The authors have been wholly responsible for all data collection, analysis and interpretation, and for writing uptheir work. The HTA editors and publisher have tried to ensure the accuracy of the authors’ report and would like to thank thereviewers for their constructive comments on the draft document. However, they do not accept liability for damages or lossesarising from material published in this report.
This report presents independent research funded by the National Institute for Health Research (NIHR). The views and opinionsexpressed by authors in this publication are those of the authors and do not necessarily reflect those of the NHS, the NIHR,NETSCC, the HTA programme or the Department of Health and Social Care. If there are verbatim quotations included in thispublication the views and opinions expressed by the interviewees are those of the interviewees and do not necessarily reflectthose of the authors, those of the NHS, the NIHR, NETSCC, the HTA programme or the Department of Health and Social Care.
© Queen’s Printer and Controller of HMSO 2020. This work was produced by Costa et al. under the terms of a commissioningcontract issued by the Secretary of State for Health and Social Care. This issue may be freely reproduced for the purposes ofprivate research and study and extracts (or indeed, the full report) may be included in professional journals provided thatsuitable acknowledgement is made and the reproduction is not associated with any form of advertising. Applications forcommercial reproduction should be addressed to: NIHR Journals Library, National Institute for Health Research, Evaluation,Trials and Studies Coordinating Centre, Alpha House, University of Southampton Science Park, Southampton SO16 7NS, UK.
Published by the NIHR Journals Library (www.journalslibrary.nihr.ac.uk), produced by Prepress Projects Ltd, Perth, Scotland(www.prepress-projects.co.uk).

Editor-in-Chief of Health Technology Assessment and NIHR Journals Library
Professor Ken Stein Professor of Public Health, University of Exeter Medical School, UK
NIHR Journals Library Editors
Professor John Powell Chair of HTA and EME Editorial Board and Editor-in-Chief of HTA and EME journals. Consultant Clinical Adviser, National Institute for Health and Care Excellence (NICE), UK, and Senior Clinical
Professor Andrée Le May
Professor Matthias Beck
Dr Tessa Crilly
Dr Eugenia Cronin Senior Scientific Advisor, Wessex Institute, UK
Dr Peter Davidson
Ms Tara Lamont
Dr Catriona McDaid
Professor William McGuire
Professor Geoffrey Meads Professor of Wellbeing Research, University of Winchester, UK
Professor John Norrie Chair in Medical Statistics, University of Edinburgh, UK
Professor James Raftery
Dr Rob Riemsma
Professor Helen Roberts
Professor Jonathan Ross
Professor Helen Snooks Professor of Health Services Research, Institute of Life Science, College of Medicine, Swansea University, UK
Professor Ken Stein Professor of Public Health, University of Exeter Medical School, UK
Professor Jim Thornton
Professor Martin Underwood
Please visit the website for a list of editors:
Editorial contact:
NIHR Journals Library www.journalslibrary.nihr.ac.uk
Abstract
Plaster cast versus functional bracing for Achilles tendonrupture: the UKSTAR RCT
Matthew L Costao ,1* Juul Achteno ,1 Susan Waglando ,1
Ioana R Mariano ,1 Mandy Maredzao ,2 Michael Maia Schlüsselo ,1
Anna S Liewo ,1 Nick R Parsonso ,3 Susan J Duttono ,1
Rebecca S Kearneyo ,2 Sarah E Lambo ,1,4 Benjamin Ollivereo 5
and Stavros Petrouo 2,6 on behalf of the UKSTAR Trial ManagementGroup
1Nuffield Department of Orthopaedics, Rheumatology and Musculoskeletal Sciences,University of Oxford, Oxford, UK
2Warwick Clinical Trials Unit, Warwick Medical School, University of Warwick, Coventry, UK3Statistics and Epidemiology Unit, Warwick Medical School, University of Warwick, Coventry, UK4College of Medicine and Health, University of Exeter, Exeter, UK5Division of Rheumatology, Orthopaedics and Dermatology, School of Medicine, Queen’s MedicalCentre Nottingham, University of Nottingham, Nottingham, UK
6Nuffield Department of Primary Care Health Sciences, University of Oxford, Oxford, UK
*Corresponding author [email protected]
Background: Achilles tendon rupture affects > 11,000 people each year in the UK, leading toprolonged periods away from work, sports and social activities. Traditionally, the ruptured tendon isheld still in a plaster cast for ≥ 8 weeks. Functional bracing is an alternative treatment that allowspatients to mobilise earlier, but there is little evidence about how bracing affects patients’ recovery.
Objectives: To measure the Achilles Tendon Rupture Score, quality of life, complications and resourceuse of patients receiving non-operative treatment for an Achilles tendon rupture treated with plastercast compared with those treated with functional bracing.
Design: This was a multicentre, randomised, pragmatic, two-group superiority trial.
Setting: The setting was 39 NHS hospitals.
Participants: A total of 540 adult patients treated non-operatively for Achilles tendon rupture wererandomised from July 2016 to May 2018. Exclusion criteria included presenting after 14 days, havinghad previous rupture and being unable to complete questionnaires.
Interventions: A total of 266 participants had a plaster cast applied, with their toes initially pointingto the floor. The cast was changed over 8 weeks to bring the foot into a walking position. A total of274 patients had a functional brace that facilitated immediate weight-bearing. The foot position wasadjusted within the brace over the same 8-week period.
Main outcome measures: Achilles Tendon Rupture Score is patient reported and assesses symptoms andphysical activity related to the Achilles tendon (score 0–100, with 100 being the best possible outcome).The secondary outcomes were quality of life, complications and resource use at 8 weeks and at 3, 6 and9 months.
DOI: 10.3310/hta24080 Health Technology Assessment 2020 Vol. 24 No. 8
© Queen’s Printer and Controller of HMSO 2020. This work was produced by Costa et al. under the terms of a commissioning contract issued by the Secretary of State forHealth and Social Care. This issue may be freely reproduced for the purposes of private research and study and extracts (or indeed, the full report) may be included inprofessional journals provided that suitable acknowledgement is made and the reproduction is not associated with any form of advertising. Applications for commercialreproduction should be addressed to: NIHR Journals Library, National Institute for Health Research, Evaluation, Trials and Studies Coordinating Centre, Alpha House,University of Southampton Science Park, Southampton SO16 7NS, UK.
vii

Results: Participants had a mean age of 48.7 years, were predominantly male (79%) and had rupturedtheir tendon during sports (70%). Over 93% of participants completed follow-up. There was nostatistically significant difference in Achilles Tendon Rupture Score at 9 months post injury (–1.38,95% confidence interval –4.9 to 2.1). There was a statistically significant difference in Achilles TendonRupture Score at 8 weeks post injury in favour of the functional brace group (5.53, 95% confidenceinterval 2.0 to 9.1), but not at 3 or 6 months post injury. Quality of life showed the same pattern, witha statistically significant difference at 8 weeks post injury but not at later time points. Complicationprofiles were similar in both groups. Re-rupture of the tendon occurred 17 times in the plaster castgroup and 13 times in the functional brace group. There was no difference in resource use.
Conclusions: This trial provides strong evidence that early weight-bearing in a functional brace providessimilar outcomes to traditional plaster casting and is safe for patients receiving non-operative treatmentof Achilles tendon rupture. The probability that functional bracing is cost-effective exceeds 95% for thebase-case imputed analysis, assuming a cost-effectiveness threshold of £20,000 per quality-adjustedlife-year. On average, functional brace is associated with lower costs (–£103, 95% confidence interval–£290 to £84) and more quality-adjusted life-years (0.015, 95% confidence interval –0.0013 to 0.030)than plaster cast.
Limitations: Some patients declined to participate in the trial, but only a small proportion of thesedeclined because they had a preference for one treatment or another. Overall, 58% of eligible patientsagreed to participate, so the participants are broadly representative of the population under investigation.
Future work: Although the UK Study of Tendo Achilles Rehabilitation provides guidance with regard toearly management, rehabilitation following Achilles tendon rupture is prolonged and further research isrequired to define the optimal mode of rehabilitation after the initial cast/brace has been removed.
Trial registration: Current Controlled Trials ISRCTN62639639.
Funding: This project was funded by the National Institute for Health Research (NIHR) HealthTechnology Assessment programme and will be published in full in Health Technology Assessment;Vol. 24, No. 8. See the NIHR Journals Library website for further project information.
ABSTRACT
NIHR Journals Library www.journalslibrary.nihr.ac.uk
viii
Contents
List of tables xiii
List of figures xv
List of abbreviations xvii
Plain English summary xix
Scientific summary xxi
Chapter 1 Introduction 1Background 1
What about patients managed non-operatively? 2Pre-pilot data 2
External pilot study 3Defining the functional brace intervention 3
Research objectives 3Patient and public involvement 3
Chapter 2 Clinical trial methods 5Summary of study design 5Settings and locations 5Participants 6
Participant screening 6Participant eligibility 6
Baseline assessment 6Randomisation 7Post-randomisation withdrawals 8Interventions 8
Plaster cast 8Functional brace 8Monitoring intervention delivery and compliance 9
Rehabilitation 9Outcome measures 9
Primary outcome measure 9Secondary outcome measures 10
Adverse events 10Blinding 11Follow-up 11Sample size 11Statistical analysis 12
Software used 12Blinded analysis 12Data validation 12Study populations 12Descriptive analysis 12Analysis of primary outcome 13Analysis of secondary outcomes 14
DOI: 10.3310/hta24080 Health Technology Assessment 2020 Vol. 24 No. 8
© Queen’s Printer and Controller of HMSO 2020. This work was produced by Costa et al. under the terms of a commissioning contract issued by the Secretary of State forHealth and Social Care. This issue may be freely reproduced for the purposes of private research and study and extracts (or indeed, the full report) may be included inprofessional journals provided that suitable acknowledgement is made and the reproduction is not associated with any form of advertising. Applications for commercialreproduction should be addressed to: NIHR Journals Library, National Institute for Health Research, Evaluation, Trials and Studies Coordinating Centre, Alpha House,University of Southampton Science Park, Southampton SO16 7NS, UK.
ix

Health economics methods 14Overview 14Measuring resource use and costs 15Measuring broader resource use 16Valuing of resource use 16Measuring outcomes 17Cost-effectiveness analysis methods 17
Data management 19Patient and public involvement 20Ethics approval and monitoring 20
Ethics approval 20Data and Safety Monitoring Committee 20Trial Steering Committee 20Trial Management Group 20
Summary of changes to the trial protocol 21
Chapter 3 Clinical trial results 23Study participants 23Recruitment 23Baseline characteristics 23Compliance 23Numbers analysed 30Withdrawals 31Analyses to address primary outcome 31
Sensitivity analyses 33Analyses to address secondary outcomes 34
EuroQol-5 Dimensions, five-level version 34Sensitivity analyses 35Complications 35
Ancillary analyses 37Adverse events 38
Chapter 4 Health economics 39Results of economic analysis 39
Health and social care resource use 40Economic costs 40Health outcomes 42Cost-effectiveness results 42Long-term economic modelling 45
Chapter 5 Discussion 49Recruitment 49Participants and interventions 50Results 51
Primary outcome 51Secondary outcomes 51
Health economics evaluation 52Limitations 52
Chapter 6 Conclusions 55
Acknowledgements 57
CONTENTS
NIHR Journals Library www.journalslibrary.nihr.ac.uk
x
References 61
Appendix 1 Health economics 65
Appendix 2 Recruitment centre names by NHS trust 73
Appendix 3 EuroQol-5 Dimensions individual-level items 75
Appendix 4 Distribution of EuroQol-5 Dimensions, five-level version, responses bytreatment group 77
Appendix 5 Trial management 81
Appendix 6 Statistical analysis model 85
DOI: 10.3310/hta24080 Health Technology Assessment 2020 Vol. 24 No. 8
© Queen’s Printer and Controller of HMSO 2020. This work was produced by Costa et al. under the terms of a commissioning contract issued by the Secretary of State forHealth and Social Care. This issue may be freely reproduced for the purposes of private research and study and extracts (or indeed, the full report) may be included inprofessional journals provided that suitable acknowledgement is made and the reproduction is not associated with any form of advertising. Applications for commercialreproduction should be addressed to: NIHR Journals Library, National Institute for Health Research, Evaluation, Trials and Studies Coordinating Centre, Alpha House,University of Southampton Science Park, Southampton SO16 7NS, UK.
xi


List of tables
TABLE 1 Sample size 12
TABLE 2 Unit costs associated with direct intervention costs for plaster cast andfunctional brace 15
TABLE 3 Alternative MNAR scenarios used to explore sensitivity of cost-effectivenessresults to the MAR assumption 19
TABLE 4 Changes to the protocol during the study by version number 21
TABLE 5 Stratification factor (recruitment centre) by treatment group and overall 25
TABLE 6 Descriptive characteristics of ITT population by treatment group at baseline 26
TABLE 7 Patient-reported outcome measures by treatment group for ITT populationat baseline 28
TABLE 8 Number of participants compliant with treatment 28
TABLE 9 Details of the intervention received by treatment group 28
TABLE 10 Reasons for changing allocated treatment in each treatment group 29
TABLE 11 Details of treatment received for each treatment group 29
TABLE 12 Available data at each follow-up time point 31
TABLE 13 Number of withdrawals and reasons for withdrawal at follow-up time points 32
TABLE 14 Achilles Tendon Rupture Score analysis at each time point (ITT population)based on a mixed-effects model 32
TABLE 15 Achilles Tendon Rupture Score sensitivity analyses 33
TABLE 16 EuroQol-5 Dimensions utility and EQ-5D VAS mixed-effects model resultsat 8 weeks and at 3, 6 and 9 months post injury (ITT population) 34
TABLE 17 EuroQol-5 Dimensions, five-level version, sensitivity analyses 36
TABLE 18 Analysis of secondary outcome complications from baseline to 9 months(ITT population) 36
TABLE 19 Complications recorded at the 8-week and 3-, 6- and 9-month follow-ups(ITT population) 36
TABLE 20 Number and proportion of individuals with missing health economic databy treatment group 39
DOI: 10.3310/hta24080 Health Technology Assessment 2020 Vol. 24 No. 8
© Queen’s Printer and Controller of HMSO 2020. This work was produced by Costa et al. under the terms of a commissioning contract issued by the Secretary of State forHealth and Social Care. This issue may be freely reproduced for the purposes of private research and study and extracts (or indeed, the full report) may be included inprofessional journals provided that suitable acknowledgement is made and the reproduction is not associated with any form of advertising. Applications for commercialreproduction should be addressed to: NIHR Journals Library, National Institute for Health Research, Evaluation, Trials and Studies Coordinating Centre, Alpha House,University of Southampton Science Park, Southampton SO16 7NS, UK.
xiii

TABLE 21 The NHS and PSS costs for participants with complete resource use databy treatment group, study period and cost category (2017–18 prices) 40
TABLE 22 Cost-effectiveness: cost per QALY (2017 prices) – functional bracecompared with plaster cast 43
TABLE 23 Principal investigators by recruitment centre 57
TABLE 24 Summary of unit cost data and data sources 65
TABLE 25 Use of health and social care resources related to two non-surgicaltreatment options for patients with a primary (first-time) rupture of the Achillestendon by follow-up period and treatment group (complete cases) 66
TABLE 26 Recruitment centre names by NHS trust 73
TABLE 27 Distribution of EQ-5D-5L responses by treatment group for eachfollow-up-time point 78
TABLE 28 Progress against milestones in project management plan 83
LIST OF TABLES
NIHR Journals Library www.journalslibrary.nihr.ac.uk
xiv
List of figures
FIGURE 1 The UKSTAR CONSORT flow diagram 24
FIGURE 2 Participant age (years) at randomisation by sex 27
FIGURE 3 Marginal mean ATRS values from the mixed-effects model and associated95% CIs for the two treatment groups pre injury to 9 months post injury 33
FIGURE 4 Marginal mean EQ-5D utility values from the mixed-effects model andassociated 95% CIs for the two treatment groups from baseline (post injury) to 9 months 35
FIGURE 5 Marginal mean EQ-5D VAS values from the mixed-effects model andassociated 95% CIs for the two treatment groups from baseline (post injury) to 9 months 35
FIGURE 6 Cost-effectiveness scatterplot at 9 months for base-case analysis(NHS and PSS perspective, imputed, additionally controlled for pre-injury utility,ITT analysis) 45
FIGURE 7 Cost-effectiveness acceptability curve at 9 months for base-case analysis(NHS and PSS perspective, imputed, additionally controlled for pre-injury utility,ITT analysis) 45
FIGURE 8 Cost-effectiveness scatterplot at 9 months for complete cases (NHS andPSS perspective, ITT analysis) 46
FIGURE 9 Cost-effectiveness acceptability curve for complete cases (NHS and PSSperspective, ITT analysis) 46
FIGURE 10 Cost-effectiveness scatterplot for societal perspective (imputed, ITT analysis) 46
FIGURE 11 Cost-effectiveness acceptability curve for societal perspective(imputed, ITT analysis) 47
FIGURE 12 Cost-effectiveness scatterplot for CACE population (imputed, NHS andPSS perspective) 47
FIGURE 13 Cost-effectiveness acceptability curve for CACE population(imputed, NHS and PSS perspective, covariate adjusted) 47
FIGURE 14 Dot plot showing distribution of total NHS and PSS costs for participantswith complete data for the entire follow-up period by treatment group 70
FIGURE 15 Cost-effectiveness planes under different MNAR assumptions 71
FIGURE 16 Cost-effectiveness acceptability curves under different MNAR assumptions 72
FIGURE 17 Incremental NMB of functional brace compared with plaster cast(at £20,000/QALY) for different values of the MNAR rescaling parameter 72
DOI: 10.3310/hta24080 Health Technology Assessment 2020 Vol. 24 No. 8
© Queen’s Printer and Controller of HMSO 2020. This work was produced by Costa et al. under the terms of a commissioning contract issued by the Secretary of State forHealth and Social Care. This issue may be freely reproduced for the purposes of private research and study and extracts (or indeed, the full report) may be included inprofessional journals provided that suitable acknowledgement is made and the reproduction is not associated with any form of advertising. Applications for commercialreproduction should be addressed to: NIHR Journals Library, National Institute for Health Research, Evaluation, Trials and Studies Coordinating Centre, Alpha House,University of Southampton Science Park, Southampton SO16 7NS, UK.
xv
FIGURE 18 EuroQol-5 Dimensions: mobility from baseline pre injury to 9 months 75
FIGURE 19 EuroQol-5 Dimensions: self-care from baseline pre injury to 9 months 75
FIGURE 20 EuroQol-5 Dimensions: usual activities from baseline pre injury to 9 months 76
FIGURE 21 EuroQol-5 Dimensions: pain or discomfort from baseline pre injury to9 months 76
FIGURE 22 EuroQol-5 Dimensions: anxiety or depression from baseline pre injury to9 months 76
FIGURE 23 UKSTAR actual and predicted recruitment 82
LIST OF FIGURES
NIHR Journals Library www.journalslibrary.nihr.ac.uk
xvi
List of abbreviations
AE adverse event
ATRS Achilles Tendon Rupture Score
AUC area under the curve
CACE complier-average causal effect
CI confidence interval
CONSORT Consolidated Standards ofReporting Trials
CRF case report form
DSMC Data and Safety MonitoringCommittee
DVT deep-vein thrombosis
EQ-5D EuroQol-5 Dimensions
EQ-5D-5L EuroQol-5 Dimensions, five-levelversion
GP general practitioner
HRG Healthcare Resource Group
HRQoL health-related quality of life
ICER incremental cost-effectivenessratio
IQR interquartile range
ITT intention to treat
MAR missing at random
MCID minimum clinically importantdifference
MNAR missing not at random
NICE National Institute for Health andCare Excellence
NMB net monetary benefit
OCTRU Oxford Clinical Trials ResearchUnit
PE pulmonary embolism
PPI patient and public involvement
PRO patient-reported outcome
PROM patient-reported outcomemeasure
PSS Personal Social Services
PSSRU Personal Social Services ResearchUnit
QALY quality-adjusted life-year
QoL quality of life
RCT randomised controlled trial
SAE serious adverse event
SD standard deviation
SMS short message service
TMG Trial Management Group
TSC Trial Steering Committee
UKSTAR UK Study of Tendo AchillesRehabilitation
VAS visual analogue scale
VTE venous thromboembolism
DOI: 10.3310/hta24080 Health Technology Assessment 2020 Vol. 24 No. 8
© Queen’s Printer and Controller of HMSO 2020. This work was produced by Costa et al. under the terms of a commissioning contract issued by the Secretary of State forHealth and Social Care. This issue may be freely reproduced for the purposes of private research and study and extracts (or indeed, the full report) may be included inprofessional journals provided that suitable acknowledgement is made and the reproduction is not associated with any form of advertising. Applications for commercialreproduction should be addressed to: NIHR Journals Library, National Institute for Health Research, Evaluation, Trials and Studies Coordinating Centre, Alpha House,University of Southampton Science Park, Southampton SO16 7NS, UK.
xvii

Plain English summary
Achilles tendon rupture affects > 11,000 people each year in the UK, leading to prolonged periodsaway from work, sports and social activities. Traditionally, after a ruptured tendon, the foot and
ankle are held still in a plaster cast for ≥ 8 weeks. Functional bracing is an alternative treatment thatallows patients to mobilise earlier, but there is little evidence about how it affects later recovery.
This study aimed to compare traditional plaster casting with functional bracing for adult patients withAchilles tendon rupture. The participants reported their own recovery using the Achilles TendonRupture Score, which consists of 10 questions about symptoms and physical activity (in which a scoreof 100 is the best possible outcome).We also recorded quality of life, complications, including re-ruptureof the tendon, and costs from both the NHS and the patients’ perspective.
A total of 540 patients, treated at 39 hospitals, agreed to take part and were assigned by chance to eitherplaster cast or functional brace. Patients reported their recovery at 8 weeks and at 3, 6 and 9 months.
What did the trial find?
Patients recovered steadily after their injury but were still not back to normal at 9 months. The averageAchilles Tendon Rupture Score rose from 38 out of 100 at 8 weeks to 73 out of 100 at 9 months.
Patents who had the functional brace reported that their recovery was a little better at 8 weeks thandid the patients having the plaster cast, but there was no evidence of a difference after that. There were17 cases of re-rupture of the Achilles tendon in the plaster cast group and 13 cases in the functionalbrace group. There was no evidence of a difference in costs.
In conclusion, this study provides strong evidence that early weight-bearing in a functional braceprovides similar outcomes to traditional plaster casting and is safe for patients having treatment forAchilles tendon rupture.
DOI: 10.3310/hta24080 Health Technology Assessment 2020 Vol. 24 No. 8
© Queen’s Printer and Controller of HMSO 2020. This work was produced by Costa et al. under the terms of a commissioning contract issued by the Secretary of State forHealth and Social Care. This issue may be freely reproduced for the purposes of private research and study and extracts (or indeed, the full report) may be included inprofessional journals provided that suitable acknowledgement is made and the reproduction is not associated with any form of advertising. Applications for commercialreproduction should be addressed to: NIHR Journals Library, National Institute for Health Research, Evaluation, Trials and Studies Coordinating Centre, Alpha House,University of Southampton Science Park, Southampton SO16 7NS, UK.
xix


Scientific summary
Background
Achilles tendon rupture affects > 11,000 people each year in the UK, leading to prolonged periodsaway from work, sports and social activities. Traditionally, after a ruptured tendon, the foot and ankleare immobilised in a plaster cast for ≥ 8 weeks. Functional bracing is an alternative treatment thatallows patients to mobilise earlier, but there is little evidence about how it affects overall recovery.
Objectives
To measure the Achilles Tendon Rupture Score, quality of life, complications, including re-rupture, andresource use of patients receiving non-operative treatment for acute Achilles tendon rupture, treatedwith plaster cast compared with functional brace.
Design
This was a pragmatic, multicentre randomised controlled trial.
Setting
The setting was 39 hospitals in the UK NHS.
Participants
A total of 540 adult patients treated non-operatively for Achilles tendon rupture were randomisedfrom July 2016 to May 2018 (266 patients in the plaster cast group and 274 patients in the functionalbrace group). Patients were excluded if they presented more 14 days after their injury, had suffered aprevious rupture of the same Achilles tendon or were unable to complete questionnaires.
Interventions
A total of 266 participants were randomised to receive a below-knee plaster cast applied in the ‘gravityequinus’ position (i.e. the position that the foot naturally adopts when unsupported). In this position, withthe toes pointing down towards the floor, the ends of the ruptured tendon are roughly approximated. Theparticipants were permitted to mobilise with crutches immediately using their toes for balance (toe-touch),but were not able to bear weight on the injured hindfoot. Over the first 8 weeks, as the tendon was healing,the participants returned to hospital and the position of the plaster cast was changed gradually until thefoot achieved plantigrade (i.e. the foot was flat on the floor). At this point the patient was permitted to startto bear weight in the plaster cast. The number of changes of plaster cast and the time to weight-bearingwere left to the discretion of the treating clinician, as per their usual practice. The cast was removed at8 weeks. The plaster cast provided maximum protection for the healing tendon, specifically restrictingupwards movement (dorsiflexion) of the ankle, which may stretch the healing tendon, but it did not allowthe patient to bear weight on the foot immediately or to move their ankle.
DOI: 10.3310/hta24080 Health Technology Assessment 2020 Vol. 24 No. 8
© Queen’s Printer and Controller of HMSO 2020. This work was produced by Costa et al. under the terms of a commissioning contract issued by the Secretary of State forHealth and Social Care. This issue may be freely reproduced for the purposes of private research and study and extracts (or indeed, the full report) may be included inprofessional journals provided that suitable acknowledgement is made and the reproduction is not associated with any form of advertising. Applications for commercialreproduction should be addressed to: NIHR Journals Library, National Institute for Health Research, Evaluation, Trials and Studies Coordinating Centre, Alpha House,University of Southampton Science Park, Southampton SO16 7NS, UK.
xxi

A total of 274 patients were randomised to the functional brace group. Initially, two solid heel wedges(or equivalent) were inserted inside the brace to replicate the ‘gravity equinus’ position of the foot.However, because the bottom of the brace was flat to the floor, the participant was able to mobilise withimmediate full weight-bearing within the functional brace. The brace also permitted some movement atthe ankle joint. The number of wedges and the foot position were changed over 8 weeks until the patientreached plantigrade. Again, the timing of the removal of wedges and the change in foot position wereleft to the discretion of the treating clinician, as per their usual practice. The brace was removed at8 weeks, as per routine clinical care.
Outcome measures
The primary outcome measure was the Achilles Tendon Rupture Score. The Achilles Tendon RuptureScore is patient reported and consists of 10 items assessing symptoms and physical activity relatedto the Achilles tendon that give a score between 0 and 100 (100 being the best possible outcome).Secondary outcomes were health-related quality of life (EuroQol-5 Dimensions) and complications,including re-rupture. Outcomes were collected at 8 weeks and 3, 6 and 9 months post injury.
We also collected data on resource use from the perspective of the NHS and Personal Social Services.A societal perspective for costs was adopted for the sensitivity analysis and this included private costsincurred by trial participants and their families, as well as productivity losses and loss of earnings as aresult of work absences.
Results
Participants had a mean age of 48.7 years, were predominantly male (79%) and had ruptured theirtendon during sports (70%). Over 93% of participants completed follow-up.
There was no statistically significant difference in Achilles Tendon Rupture Score at 9 months postinjury (–1.38, 95% confidence interval –4.9 to 2.1). There was a statistically significant difference in theAchilles Tendon Rupture Score at 8 weeks post injury in favour of the functional brace group (5.53,95% confidence interval 2.0 to 9.1), but not at 3 or 6 months post injury. Health-related quality of lifeshowed the same pattern, with a statistically significant difference at 8 weeks post injury but not atlater time points. Complication profiles were similar in both groups. There were 17 (6.4%) cases ofre-rupture of the tendon in the plaster cast group and 13 (4.7%) cases in the functional brace group.
The mean direct intervention costs were £36 for the plaster cast group and £109 for the functionalbrace group; the mean difference of £73 was statistically significant. However, by 8 weeks thisdifference had reversed, such that the mean total NHS and Personal Social Services costs weresignificantly lower in the functional brace group. The difference at 8 weeks post injury was mostlydriven by the cost of extra outpatient appointments in the plaster cast group.
The mean total NHS and Personal Social Services cost throughout the entire follow-up period was£1183 for the plaster cast group and £1018 for the functional brace group. Although functionalbracing was marginally cheaper, the mean between-group cost difference of £164 was notstatistically significant.
In terms of health-related quality of life, the mean quality-adjusted life-year value was, on average,marginally higher for the functional brace group among complete cases and in the sensitivity analyses,although this mean difference was not statistically significant.
SCIENTIFIC SUMMARY
NIHR Journals Library www.journalslibrary.nihr.ac.uk
xxii

Therefore, as the functional brace group incurred slightly lower costs and achieved slightly betterquality of life over the course of the study, in health economic terms, functional bracing is thedominant intervention.
Conclusions
This trial provides strong evidence that early weight-bearing in a functional brace provides similaroutcomes to those from traditional plaster casting and is safe for patients having non-operativetreatment of Achilles tendon rupture. On average, functional brace is associated with lower costs andhigher quality-adjusted life-years, but this finding was not replicated in sensitivity analysis conductedfrom the societal perspective.
Future work
Although the UK Study of Tendo Achilles Rehabilitation provides guidance with regard to the earlymanagement of patients, rehabilitation following Achilles tendon rupture is prolonged and furtherresearch is required to define the optimal mode of rehabilitation after the initial cast/brace is removed.
Trial registration
This trial is registered as ISRCTN62639639.
Funding
This project was funded by the National Institute for Health Research (NIHR) Health TechnologyAssessment programme and will be published in full in Health Technology Assessment; Vol. 24, No. 8.See the NIHR Journals Library website for further project information.
DOI: 10.3310/hta24080 Health Technology Assessment 2020 Vol. 24 No. 8
© Queen’s Printer and Controller of HMSO 2020. This work was produced by Costa et al. under the terms of a commissioning contract issued by the Secretary of State forHealth and Social Care. This issue may be freely reproduced for the purposes of private research and study and extracts (or indeed, the full report) may be included inprofessional journals provided that suitable acknowledgement is made and the reproduction is not associated with any form of advertising. Applications for commercialreproduction should be addressed to: NIHR Journals Library, National Institute for Health Research, Evaluation, Trials and Studies Coordinating Centre, Alpha House,University of Southampton Science Park, Southampton SO16 7NS, UK.
xxiii


Chapter 1 Introduction
Background
The Achilles tendon is the largest tendon in the human body and transmits the powerful contractions ofthe calf muscles that are required for walking and running. A rupture of this tendon is painful and hasan immediate and serious detrimental impact on daily activities of living.1 In the longer term, tendonrupture results in prolonged periods off work and time away from sporting activity (average time awayfrom work is between 4 and 8 weeks and time away from sport is between 26 and 39 weeks).1 Thisresults in lost income and restricted daily activities in the early phase and reduced physical activity,with associated negative health and social consequences, in the long term. For high-level sportsmen it isfrequently a ‘career-ending’ injury.
Achilles tendon rupture affects > 11,000 people each year in the UK, and the incidence is increasing asthe population remains more active into older age.2 It affects all age groups in a bimodal distribution,with the first peak in patients aged 30–40 years and the second in patients aged 60–80 years.2 Thefirst peak in incidence is often associated with participation in sport, such as football and racquetsports, whereas the second peak often occurs during normal daily activities, such as climbing stairs.2,3
However, all Achilles tendon ruptures are associated with a pre-existing ‘tendinopathy’, which is attributedto failures in the protective/regenerative functions that respond to repeated microscopic injury.4,5
Historically, the main question in relation to the management of patients with rupture of the Achillestendon has been whether or not to perform a surgical repair of the tendon. In 1981, Nistor6 designedand published the first randomised controlled trial (RCT) to address this clinical question. This study wasfollowed by a series of RCTs that were pooled in a meta-analysis by the Cochrane review group in 2004.7
The results suggested that surgical repair reduced the risk of re-rupture, but this came with an increasedcost and a greatly increased risk of other complications, most of which were associated with infectionand wound healing. There were few data on functional outcome at the time of this review. More recenttrials comparing surgical repair and non-operative treatment have found no difference in functionaloutcome.8,9 As surgery carries considerable costs, and carries considerable risks to the patient in termsof complications,7 there is an increasing trend towards non-operative treatment. However, somesurgeons have been reluctant to advocate non-operative treatment because of concerns about thelack of evidence to guide early rehabilitation for this group of patients,10 specifically whether or notfunctional bracing is safe and effective if the tendon has not been not surgically repaired.
Traditionally, patients have been treated in plaster casts after rupture of the Achilles tendon, with thecast immobilising the foot and ankle while the tendon heals.11 However, there are potential problemswith this approach. First, there is the immediate impact on mobility for a period of around 8 weeks,affecting activities of daily life. Second, there are the complications and risks associated with prolongedimmobilisation: muscle atrophy, deep-vein thrombosis (DVT) and joint stiffness.12,13 Finally, there arethe potential long-term consequences, which include prolonged gait abnormalities, persistent calfmuscle weakness and an inability to return to previous activity levels.14 Functional bracing, involvingimmediate, protected weight-bearing in a brace, was designed to address these issues.
In patients having a surgical repair, seven RCTs,1,15–20 directly comparing plaster casts with early movementand/or weight-bearing in a ‘functional brace’, had been conducted at the time that the protocol wasdeveloped for the UK Study of Tendo Achilles Rehabilitation (UKSTAR). The results favoured functionalbracing in terms of re-rupture rate, functional outcome and quality-of-life (QoL) measures. Therefore, inthe first guideline produced on this topic in 2009,21 the American Academy of Orthopaedic Surgeonsrecommended functional bracing for patients undergoing surgical repair of their tendon.
DOI: 10.3310/hta24080 Health Technology Assessment 2020 Vol. 24 No. 8
© Queen’s Printer and Controller of HMSO 2020. This work was produced by Costa et al. under the terms of a commissioning contract issued by the Secretary of State forHealth and Social Care. This issue may be freely reproduced for the purposes of private research and study and extracts (or indeed, the full report) may be included inprofessional journals provided that suitable acknowledgement is made and the reproduction is not associated with any form of advertising. Applications for commercialreproduction should be addressed to: NIHR Journals Library, National Institute for Health Research, Evaluation, Trials and Studies Coordinating Centre, Alpha House,University of Southampton Science Park, Southampton SO16 7NS, UK.
1
What about patients managed non-operatively?Although there are clear guidelines for rehabilitation of patients who have a surgical repair, there isno clarity about the use of functional bracing in non-operatively managed patients. Does functionalbracing provide improved function and QoL if the tendon is not surgically repaired? Or, in the contextof a tendon that has not been stitched together, does a plaster cast provide greater protection andtherefore improved healing? Does functional bracing facilitate faster return to work and is thiscost-effective? Or, is the tendon more vulnerable to re-rupture in a brace, with the subsequent risk andcost of reconstructive surgery?
At the time that UKSTAR was developed, we supplemented the 2004 Cochrane review7 with anupdated literature search and found that in total only two additional studies22,23 had been performedthat compared functional bracing with plaster cast for patients managed non-operatively followingrupture of the Achilles tendon. Both studies suggested potential benefits from bracing. However, thedata from the studies should be interpreted with caution because patient numbers were small (90 in total),patients received different functional bracing regimes and the reporting of outcomes was minimal.
This gap in the evidence was recognised by the American Academy of Orthopaedic Surgeons in their2009 guideline,21 which stated that they were unable to make a recommendation with regards the useof immediate functional bracing. With the incidence of Achilles tendon rupture on the rise, and in thelight of the high associated personal and societal cost, this evidence gap is a clear priority. A VersusArthritis (formerly known as Arthritis Research UK) multidisciplinary ‘Think Tank’ (Arthritis ResearchUK, Birmingham, 2013) on tendon injuries reported that rehabilitation following non-operativetreatment of acute Achilles tendon rupture was ‘the top research priority’ in this area.
Since the start of the UKSTAR, a number of small randomised trials have investigated both the mechanisticand the functional effects of early weight-bearing in a brace compared with cast immobilisation. A trial of56 patients indicated that tendon healing at a molecular level may be enhanced by early mobilisation, but,given the small number of participants, there was no difference in objective functional outcome (heel raisetesting in this study).24 A second trial investigated the biomechanical properties of the healing tendon inpatients randomised to early weight-bearing or delayed weight-bearing.25 The investigators noted thatthere was less tendon stiffness in the group treated with early weight-bearing. However, in terms offunctional outcomes, the authors reported no evidence of a difference in Achilles Tendon Rupture Score(ATRS), although they did report a statistically significant improvement in health-related quality of life(HRQoL) at 1 year in the group treated with early weight-bearing.25 Another trial included 47 patientstreated non-operatively for an acute Achilles tendon rupture. Half of the patients were treated with partialweight-bearing beginning on the first day of treatment and the other half were treated with non-weight-bearing for the first 4 weeks.26 The authors concluded that early weight-bearing was ‘safe’ in terms of theincidence of re-rupture, but there was no evidence of a difference in functional outcome (ATRS or PhysicalActivity Scale) in the first 12 months after the rupture. Finally, another trial compared two types of castimmobilisation of Achilles tendon rupture.27 Half of the patients wore a traditional cast, which restrictedweight-bearing, whereas the other group wore a modified cast, which included a heel ‘iron’ to facilitateweight-bearing. The authors found no evidence of a difference in functional outcome (Leppilahti Score), butthere were only 84 patients in the trial. One further study, published very recently, randomised patients tocast immobilisation or ‘early controlled motion’ and involved 130 patients at a single centre. The authorsfound no evidence that early controlled motion was of benefit compared with immobilisation in any of theinvestigated outcomes.28
Pre-pilot data
Before UKSTAR, we completed four phases of pilot and preparatory work to establish the following.
INTRODUCTION
NIHR Journals Library www.journalslibrary.nihr.ac.uk
2
External pilot studyWe randomised 48 patients receiving non-operative treatment for acute rupture of the Achilles tendonto either functional bracing or plaster cast. This trial1 showed that patients and clinicians had equipoisefor this question and were happy to take part. However, the trial identified that although plastercasting was a mature intervention, the important facets of the complex intervention, namelyfunctional bracing, were inadequately defined, and that this needed to be addressed before a largertrial was undertaken.
Defining the functional brace interventionIn keeping with the Medical Research Council framework for developing complex interventions, ourgroup and collaborators performed a UK survey of current practice, a systematic review of publishedrehabilitation methods, gait analysis experiments using different functional brace and heel wedgecombinations, and qualitative interviews to define the optimal functional bracing regime and refine thetrial design.29,30 The rehabilitation strategy proposed in UKSTAR was the summation of that work thatidentified the optimal type of orthosis (brace), the optimal foot position within the orthosis and theduration of application of the orthosis.
To investigate the number of patients potentially eligible for UKSTAR, we carried out a UK-widesurvey of orthopaedic trauma clinicians.10 This clearly showed that clinicians were enthusiastic aboutthe study and that the number of eligible patients was large enough for a full trial.
Research objectives
The primary objective was to quantify and draw inferences about observed differences in ATRSbetween the trial treatment groups at 9 months post injury.
The secondary objectives were to:
l quantify and draw inferences about observed differences in ATRS between the trial treatmentgroups at 8 weeks and 3 and 6 months post injury
l identify any differences in HRQoL between the trial treatment groups in the first 9 months post injuryl determine the complication rate of the trial treatment groups in the first 9 months post injuryl investigate, using appropriate statistical and economic analytical methods, the resource use, costs
and comparative cost-effectiveness of the trial treatment groups in the first 9 months post injury.
Patient and public involvement
We have been working with and listening to the views of patients with Achilles tendon injuries formany years. However, as well as this informal contribution, a series of formal qualitative interviewswith patients and clinicians were carried out in the development of the UKSTAR (ISRCTN68273773).11
The views of patients were used to inform and refine the trial interventions and processes, inparticular the development of the trial information and materials. The patient perspective was keyduring the development of the trail protocol to ensure that the interventions, and participation in thetrial, would be acceptable.
Two of the patients who contributed to our development work agreed to act as lay representatives onthe Trial Management Group (TMG) and as co-applicants on the research grant award. Mrs Richmondlater had to leave the research team for personal reasons, but Mr Grant attended TMG meetingsthroughout the trial and contributed to all trial process and paperwork, with particular input on patientinformation leaflets. Mr Grant will be crucially involved in the dissemination of the study findings to the
DOI: 10.3310/hta24080 Health Technology Assessment 2020 Vol. 24 No. 8
© Queen’s Printer and Controller of HMSO 2020. This work was produced by Costa et al. under the terms of a commissioning contract issued by the Secretary of State forHealth and Social Care. This issue may be freely reproduced for the purposes of private research and study and extracts (or indeed, the full report) may be included inprofessional journals provided that suitable acknowledgement is made and the reproduction is not associated with any form of advertising. Applications for commercialreproduction should be addressed to: NIHR Journals Library, National Institute for Health Research, Evaluation, Trials and Studies Coordinating Centre, Alpha House,University of Southampton Science Park, Southampton SO16 7NS, UK.
3
wider public. He will lead the development of any materials, leaflets and website information to be usedfor this purpose. Mr Grant has reviewed the Plain English summary of this report.
Mr Grant was supported by the chief investigator and the trial co-ordination team. He had peersupport from the UK musculoskeletal trauma patient and public involvement (PPI) group, hosted inOxford. He also had access to and support from the University/User Teaching and Research ActionPartnership network through University of Warwick, an organisation that promotes the engagementand involvement of service users and carers from the local community in research and teaching inhealth and social care.
INTRODUCTION
NIHR Journals Library www.journalslibrary.nihr.ac.uk
4
Chapter 2 Clinical trial methods
Summary of study design
UKSTAR was a multicentre, randomised, pragmatic, two-group superiority trial. Patients presentingat 39 NHS hospitals in England and Scotland with an acute primary Achilles tendon rupture fornon-surgical treatment were randomised 1 : 1 to receive either functional brace or plaster cast.
Settings and locations
The 39 NHS hospital orthopaedic or trauma clinics in England and Scotland that screened and recruitedparticipants for this trial were:
1. King’s College Hospital NHS Foundation Trust2. Nottingham University Hospitals NHS Trust3. Royal Berkshire Hospital, Royal Berkshire NHS Foundation Trust4. Aberdeen Royal Infirmary, NHS Grampian5. Ninewells Hospital and Medical School, NHS Tayside6. Glasgow Royal Infirmary, NHS Greater Glasgow and Clyde7. Pilgrim Hospital, United Lincolnshire Hospitals NHS Trust8. University Hospital of North Tees, North Tees and Hartlepool Hospitals NHS Foundation Trust9. Airedale NHS Foundation Trust
10. Salisbury District Hospital, Salisbury NHS Foundation Trust11. The Rotherham NHS Foundation Trust12. George Eliot Hospital NHS Trust13. James Paget University Hospitals NHS Foundation Trust, Great Yarmouth14. Southampton General Hospital, University Hospital Southampton NHS Foundation Trust15. Lister Hospital, East and North Hertfordshire NHS Trust16. Royal Cornwall Hospital, Royal Cornwall Hospitals NHS Trust17. Tunbridge Wells Hospital, Maidstone and Tunbridge Wells NHS Trust18. Addenbrooke’s Hospital, Cambridge University Hospitals NHS Foundation Trust19. Derriford Hospital, University Hospitals Plymouth NHS Trust20. Hull Royal Infirmary, Hull University Teaching Hospitals NHS Trust21. Luton and Dunstable University Hospital NHS Foundation Trust22. Salford Royal NHS Foundation Trust23. Scunthorpe General Hospital, Northern Lincolnshire and Goole NHS Foundation Trust24. Pinderfields Hospital, The Mid Yorkshire Hospitals NHS Trust25. Leeds General Infirmary, Leeds Teaching Hospitals NHS Trust26. Worcestershire Royal Hospital, Worcestershire Acute Hospitals NHS Trust27. Doncaster Royal Infirmary, Doncaster and Bassetlaw Teaching Hospitals NHS Foundation Trust28. St Helier Hospital, Epsom and St Helier University Hospitals NHS Trust29. St Mary’s Hospital, Imperial College Healthcare NHS Trust30. Raigmore Hospital, NHS Highland31. Whiston Hospital, St Helens and Knowsley Hospitals NHS Trust32. Milton Keynes University Hospital NHS Foundation Trust33. Warwick Hospital, South Warwickshire NHS Foundation Trust34. Queen’s Hospital, Burton Hospitals NHS Foundation Trust35. Hereford County Hospital, Wye Valley NHS Trust36. Queen Elizabeth Hospital, University Hospitals Birmingham NHS Foundation Trust
DOI: 10.3310/hta24080 Health Technology Assessment 2020 Vol. 24 No. 8
© Queen’s Printer and Controller of HMSO 2020. This work was produced by Costa et al. under the terms of a commissioning contract issued by the Secretary of State forHealth and Social Care. This issue may be freely reproduced for the purposes of private research and study and extracts (or indeed, the full report) may be included inprofessional journals provided that suitable acknowledgement is made and the reproduction is not associated with any form of advertising. Applications for commercialreproduction should be addressed to: NIHR Journals Library, National Institute for Health Research, Evaluation, Trials and Studies Coordinating Centre, Alpha House,University of Southampton Science Park, Southampton SO16 7NS, UK.
5
37. John Radcliffe Hospital, Oxford University Hospitals NHS Foundation Trust38. University Hospital of South Manchester NHS Foundation Trust39. Musgrove Park Hospital, Taunton and Somerset NHS Foundation Trust.
Participants
Participant screeningAll adult patients presenting at a trial centre with a primary (first-time) rupture of the Achilles tendonwere screened. The patient, in conjunction with their surgeon, decided whether or not non-surgicaltreatment was appropriate, as per normal clinical practice. If they decided not to have surgery, theywere potentially eligible to take part in the trial.
Participant eligibilityIn order that the trial findings would be generalisable to a UK-wide population, the eligibility criteriawere broad. Patients with acute rupture of the Achilles tendon were eligible if they met all of theinclusion criteria and none of the exclusion criteria.
The inclusion criteria were:
l being aged ≥ 16 yearsl having a primary rupture of the Achilles tendonl having decided to have non-operative treatment.
The exclusion criteria were:
l presenting to the treating hospital > 14 days after injuryl likely to be unable to adhere to trial procedures or complete questionnairesl having had a previous rupture of the Achilles tendon.
The first exclusion criterion related to patients with late presentation, which is not uncommon afterthis injury. Patients who present late may have problems with chronic tendon lengthening, irrespectiveof treatment, and are frequently offered surgical intervention. The limit of 14 days since injury hasbeen widely used to define ‘acute’ rupture.
If a patient taking part in the study sustained a contralateral rupture during the trial period, the secondrupture was not included in the study because the result of an intervention for the second injurywould not be independent from that of the first injury. However, the patient remained in the trial, withboth previous and future data related to the initial rupture included in the final analysis.
Screening logs were completed at recruiting centres and collected by the UKSTAR office throughoutthe trial to assess the main reasons for patient exclusion at each recruitment centre and the numberof patients who were unwilling to participate.
Members of the local research team informed the patient of the study and carried out the informedconsent process, baseline data collection and randomisation.
Baseline assessment
Potential participants were allowed as much time as they needed to consider the trial information andhad the opportunity to ask questions of the attending clinical team and a member of the research team.
CLINICAL TRIAL METHODS
NIHR Journals Library www.journalslibrary.nihr.ac.uk
6
The trial information was delivered verbally and in writing, detailing the exact nature of the study, theimplications and constraints of the protocol, what to expect as a participant and any risks involvedin taking part. It was stated clearly that the participant was free to withdraw from the study at anytime, for any reason, without prejudice to future care and with no obligation to give the reason forwithdrawal. If the patient was happy to participate, they were asked to sign and date a consent form,which was also signed and dated by the person who obtained consent. Consent was obtained by anappropriately trained member of the research team who had been delegated to do so by the localprincipal investigator.
A copy of the signed consent form was given to the participant and another copy was sent to the studyco-ordinating team in Oxford to facilitate central monitoring. The original signed consent form wasretained in the medical notes and a copy was held in the investigator site file. Consent forms were heldin a secure location separately from study data. Permission was obtained to inform the participant’sgeneral practitioner (GP) about study participation.
Participants were asked for their consent for their name and contact details (including address,telephone numbers and e-mail address) to be collected to facilitate follow-up, data collectionand reporting of results, and for a copy of their contact details to be sent to the UKSTAR centraloffice team in Oxford. The study team used these details to contact participants for follow-up at the3-, 6- and 9-month time points, to resolve queries and to send a thank-you letter when a participant’sinvolvement in the trial ended.
Permission was sought to allow members of the University of Oxford or the NHS trust who wereresponsible for monitoring or audit of the study to access participant data, to ensure compliance withregulations.
Following consent, baseline data were collected and the participant was randomised. The treatmenttook place at the same visit. A Good Clinical Practice-trained member of the local research teamoversaw the participant’s completion of the paper baseline questionnaire, which included:
l date, mechanism and side of injuryl baseline demographics – height, weight, smoking and alcohol status, employment statusl current medicationl medical history – diabetes mellitus, rheumatoid arthritis, lower limb fracture, ligament, tendon
or nerve injury to lower limb in last 12 months, arthritis, Achilles tendinopathy or otherrelevant conditions.
Randomisation
Participants were randomly allocated (1 : 1) to either functional bracing or plaster cast using acomputer-generated allocation sequence, stratified by recruitment centre, via a secure, centralisedweb-based randomisation service provided by the Oxford Clinical Trials Research Unit (OCTRU).The research associate informed the treating clinical team of the allocated treatment.
Stratification by recruitment centre helped to ensure that any cluster effect related to the recruitmentcentre itself was equally distributed between the trial groups. The catchment area was similar for all of therecruitment centres (each recruitment centre was a trauma unit dealing with these injuries on a daily basis).All of the recruitment centres were familiar with both techniques (i.e. the clinical staff used both plastercasts and functional bracing as part of their routine clinical practice).
DOI: 10.3310/hta24080 Health Technology Assessment 2020 Vol. 24 No. 8
© Queen’s Printer and Controller of HMSO 2020. This work was produced by Costa et al. under the terms of a commissioning contract issued by the Secretary of State forHealth and Social Care. This issue may be freely reproduced for the purposes of private research and study and extracts (or indeed, the full report) may be included inprofessional journals provided that suitable acknowledgement is made and the reproduction is not associated with any form of advertising. Applications for commercialreproduction should be addressed to: NIHR Journals Library, National Institute for Health Research, Evaluation, Trials and Studies Coordinating Centre, Alpha House,University of Southampton Science Park, Southampton SO16 7NS, UK.
7
Post-randomisation withdrawals
Participants were free to decline to take part in, consent to take part in or withdraw from the trial atany time without prejudice and without affecting the standard of care that they received. Participantshad two options for withdrawal:
1. to withdraw from completing further questionnaires, but allow the trial team to view and recordde-identified data are recorded as part of the normal standard of care
2. to withdraw wholly from the study and permit data obtained only up to the point of withdrawal tobe included in the final analysis.
Withdrawn participants were not replaced, as the target sample size allowed for losses to follow-up.
Interventions
Participants received their allocated treatment (plaster cast or functional brace) followingrandomisation.
Although the principles of application of both plaster casts and functional brace are inherent in thetechnique, there are different types of plaster cast material and functional brace design. Each patientunderwent the allocated intervention as specified below (see Table 9), but the details of application andmaterials used for the plaster and brace were left to the discretion of the treating clinician, as per theirusual practice. This was intended to ensure that the results could be generalised across the NHS.
Plaster castParticipants randomised to plaster cast received a cast in the ‘gravity equinus’ position (i.e. the positionthat the foot naturally adopts when unsupported). In this position, with the toes pointing downtowards the floor, the ends of the ruptured tendon are roughly approximated. Ultrasonography toassess the approximation of the tendon ends is not routine in the NHS10 and this was left to thediscretion of the treating clinician. The participant was permitted to mobilise with crutchesimmediately, using their toes for balance (toe-touch), but was advised not to bear weight on the injuredhindfoot. Over the first 8 weeks, as the tendon was healing, the position of the plaster cast waschanged until the foot achieved plantigrade (i.e. the foot flat to the floor). At this point the patient waspermitted to start to bear weight in the plaster cast. The number of changes of plaster cast and thetime to weight-bearing were left to the discretion of the treating clinician, as per their usual practice.The cast was removed at 8 weeks.
The plaster cast provided maximum protection for the healing tendon, specifically restricting upwardsmovement (dorsiflexion) of the ankle, which may stretch the healing tendon, but it did not allow thepatient to bear weight on the foot immediately or to move the ankle.
Functional braceParticipants randomised to functional brace received a rigid brace, as opposed to a flexible brace.29
Initially, two solid heel wedges (or equivalent) were inserted into the brace to replicate the ‘gravityequinus’ position of the foot.29 The patient was able to mobilise with immediate full weight-bearingwithin the functional brace. The brace also permitted some movement at the ankle joint. The numberof wedges and foot position were reduced over 8 weeks until the patient reached plantigrade. Again,the timing of the removal of wedges and change in foot position were left to the discretion of thetreating clinician, as per their usual practice. The brace was removed at 8 weeks, as per routineclinical care.
CLINICAL TRIAL METHODS
NIHR Journals Library www.journalslibrary.nihr.ac.uk
8
Monitoring intervention delivery and complianceClinic staff recorded the participant’s treatment in clinic records, as per usual practice. At the 8-weekfollow-up visit, research staff recorded on the 8-week trial case report form (CRF):
l the intervention to which the patient was randomisedl the intervention that they receivedl the date of the 8-week follow-up appointmentl for participants treated with a functional brace, irrespective of their randomisation allocation, the:
¢ number of heel wedges inserted into the heel of the functional brace at baseline(date of treatment), and at 2, 4, 6 and 8 weeks after treatment
¢ number of weeks after treatment when the patient was allowed to fully weight bear¢ number of weeks after treatment when the functional brace was removed¢ brand of functional bracing
l for participants treated with a plaster cast, irrespective of their randomisation allocation, thenumber of:
¢ plaster cast changes over the 8 weeks since treatment¢ weeks after treatment when the patient was allowed to fully weight bear¢ weeks after treatment when the plaster cast was removed
l whether or not the patient switched to another intervention during the 8 weeks after treatment,the date of switching and the reason for switching
l whether or not the participant received treatment with venous thromboembolism (VTE) prophylaxisand, if so, the type and duration.
Rehabilitation
At the patient’s 8-week clinic appointment, the plaster cast or functional brace was removed unless theclinical team directed otherwise. All participants were provided with the same standardised writtenphysiotherapy advice, detailing the exercises that they needed to perform for rehabilitation. This advicewas based on a published systematic review of current rehabilitation protocols.30 All of the participantswere advised to move their toes, ankle and knee joints fully, within the limits of their comfort, andwalking was encouraged. In this pragmatic trial, any other rehabilitation input beyond the writtenphysiotherapy advice (including a formal referral to physiotherapy) was left to the discretion of thetreating clinician. A record of any rehabilitation input (type and number of additional appointments),as well as other investigations or interventions, was collected as part of the 8-week and 3-, 6- and 9-monthfollow-up questionnaires.
Outcome measures
Primary outcome measureThe primary outcome measure for this study was the ATRS31 at 9 months post injury. The ATRS is avalidated questionnaire32 that is completed by the participant. It has 10 items, assessing symptoms andphysical activity specifically related to the Achilles tendon. It measures strength, fatigue, stiffness, pain,activities of daily living, walking on uneven surfaces, walking upstairs or uphill, running, jumping andphysical labour. Each ATRS item is rated on an 11-point scale from 0 (major limitations/symptoms) to10 (no limitations/symptoms). The final ATRS is derived from the sum of the 10 questions, with a totalpossible score ranging between 0 and 100 (100 being the best possible score).
DOI: 10.3310/hta24080 Health Technology Assessment 2020 Vol. 24 No. 8
© Queen’s Printer and Controller of HMSO 2020. This work was produced by Costa et al. under the terms of a commissioning contract issued by the Secretary of State forHealth and Social Care. This issue may be freely reproduced for the purposes of private research and study and extracts (or indeed, the full report) may be included inprofessional journals provided that suitable acknowledgement is made and the reproduction is not associated with any form of advertising. Applications for commercialreproduction should be addressed to: NIHR Journals Library, National Institute for Health Research, Evaluation, Trials and Studies Coordinating Centre, Alpha House,University of Southampton Science Park, Southampton SO16 7NS, UK.
9

Secondary outcome measuresThe secondary outcome measures were:
l The ATRS, collected at 8 weeks and 3 and 6 months post injury.l The EuroQol-5 Dimensions (EQ-5D)/EuroQol-5 Dimensions, five-level version (EQ-5D-5L), which is
a validated, generic HRQoL measure consisting of five dimensions, each with a five-level answerpossibility, and a visual analogue scale (VAS).33 The EQ-5D can be used to report HRQoL in each ofthe five dimensions and each combination of answers can be converted into a health utility score,with 1 representing perfect health and 0 indicating death. The EQ-5D VAS takes values between 0and 100, with 0 representing worst imaginable health and 100 representing best imaginable health.It has good test–retest reliability, is simple for patients to use and gives a single preference-basedindex value for health status that can be used for broader cost-effectiveness comparative purposes.
l Complications were recorded from medical notes at the 8-week review and were patient reportedat the 3-, 6- and 9-month follow-ups. The predefined complication categories were tendon re-rupture,DVT, pulmonary embolism (PE), non-injurious falls, injurious falls, pain under the heel, numbnessaround the foot and pressure sores. In addition, three categories were created based on therecorded text and included skin condition requiring medication, surgery related to Achilles ruptureand fractured toe.
Adverse events
An adverse event (AE) is defined as any untoward medical occurrence in a clinical trial subject anddoes not necessarily have a causal relationship with the treatment. All AEs were listed on the CRF forroutine return to the UKSTAR central office.
A serious adverse event (SAE) is defined as any untoward and unexpected medical occurrence that:
l results in deathl is life-threateningl requires hospitalisation or prolongation of existing hospitalisationl results in persistent or significant disability or incapacityl is a congenital anomaly or birth defectl is any other important medical condition that, although not included in the above, may require
medical or surgical intervention to prevent one of the outcomes listed.
All SAEs were recorded by recruitment centre staff on the trial SAE reporting form and e-mailed toa secure NHS.net account, which was accessed only by the research team within 24 hours of theinvestigator becoming aware of the SAE. Once the information was received, causality and expectednesswere confirmed by the chief investigator. SAEs deemed unexpected and related to the trial were notifiedto the Research Ethics Committee within 15 days. All such events were reported to the Trial SteeringCommittee (TSC) and Data and Safety Monitoring Committee (DSMC) at their next meetings.
Some AEs were foreseeable as part of the proposed treatment – including those that met the definitionof ‘serious’ as described above – and did not need to be reported immediately to the UKSTAR centraloffice, provided that they were recorded in the ‘complications’ section of the CRF or participantquestionnaire. These events were re-rupture, blood clots/emboli, pressure areas/hindfoot pain, falls andneurological symptoms in the foot.
All participants experiencing a SAE were followed up as per protocol until the end of the trial.
All unexpected SAEs or suspected unexpected SAEs that occurred between the date of consent andthe date of the 9-month follow-up time point were reported.
CLINICAL TRIAL METHODS
NIHR Journals Library www.journalslibrary.nihr.ac.uk
10

Blinding
As the type of rehabilitation used was clearly visible, participants could not be blinded to theirtreatment. In addition, the treating clinician was not blinded to the treatment but took no part in thepost-injury assessment of the participants. The outcome data were collected and entered onto the trialcentral database via questionnaire by a research assistant or a data entry clerk in the trial centraloffice, which reduced the risk of assessment bias.
Follow-up
The UKSTAR office staff contacted the participants directly for follow-up at 3, 6 and 9 months usingthe contact details that the participant had supplied. Participants were contacted by post, by e-mailor by short message service (SMS), according to their preference; if no response was received, theywere telephoned. All follow-up contacts and attempted contacts were logged without personalidentifying details.
Participants who had supplied an e-mail address were sent a link to an online questionnaire.Participants who had supplied a mobile phone number were sent the same link by SMS. Participantswho had supplied both an e-mail address and a mobile phone number were sent the link via bothmechanisms. If a participant did not respond to any of these initial approaches, they were sent areminder 1 week later. If there was still no response after another week, the participant was sent apaper questionnaire. If the paper questionnaire was not returned within 2 weeks, UKSTAR office stafftelephoned the participant. If the participant was uncontactable during working hours, attempts weremade to telephone them during the evening, as many participants were of working age.
Participants who had specified that they preferred to be contacted by post, or who had not supplied ane-mail address or mobile phone number, were sent a questionnaire in the post and sent a second postalquestionnaire if no response was received within 2 weeks. UKSTAR office staff attempted to telephonethe participant for follow-up if the second postal questionnaire was not returned within 2 weeks.
Deep-vein thrombosis, PE and re-rupture were reported by participants through completing aquestionnaire or directly to the study office, or by recruitment centre staff after participants hadreturned to the centre for further treatment. These reports underwent validation, as follows. In thecase of a patient-reported DVT or PE, recruitment centres were requested to complete a DVT/PEform, which detailed symptoms, results of any ultrasonography, results of any computerisedtomography pulmonary angiogram imaging, treatment received and treatment duration. In the case ofa patient-reported re-rupture, recruitment centres were requested to provide details of diagnosis andtreatment. If the patient underwent surgery for a re-rupture, an operation note was requested. Allinformation submitted in connection with a re-rupture was reviewed by the chief investigator, blinded tothe treatment allocation, to confirm the diagnosis.
Sample size
The minimum clinically important difference (MCID) for the primary outcome ATRS was 8 points.At an individual patient level, a difference of 8 points represents the ability to walk upstairs or run with‘some difficulty’ compared with ‘great difficulty’. At a population level, 8 points represents the differencebetween a ‘healthy patient’ and a ‘patient with a minor disability’.32
In previous work, the standard deviation (SD) of the ATRS at 9 months post injury was 20 points.34
Assuming a likely population variability of 20, MCID value of 8 and 90% power to detect the selectedMCID, 264 participants needed to be randomised. Allowing a margin of 20% loss of primary outcomedata to include patients who would cross over between interventions and those lost to follow-up led to a
DOI: 10.3310/hta24080 Health Technology Assessment 2020 Vol. 24 No. 8
© Queen’s Printer and Controller of HMSO 2020. This work was produced by Costa et al. under the terms of a commissioning contract issued by the Secretary of State forHealth and Social Care. This issue may be freely reproduced for the purposes of private research and study and extracts (or indeed, the full report) may be included inprofessional journals provided that suitable acknowledgement is made and the reproduction is not associated with any form of advertising. Applications for commercialreproduction should be addressed to: NIHR Journals Library, National Institute for Health Research, Evaluation, Trials and Studies Coordinating Centre, Alpha House,University of Southampton Science Park, Southampton SO16 7NS, UK.
11
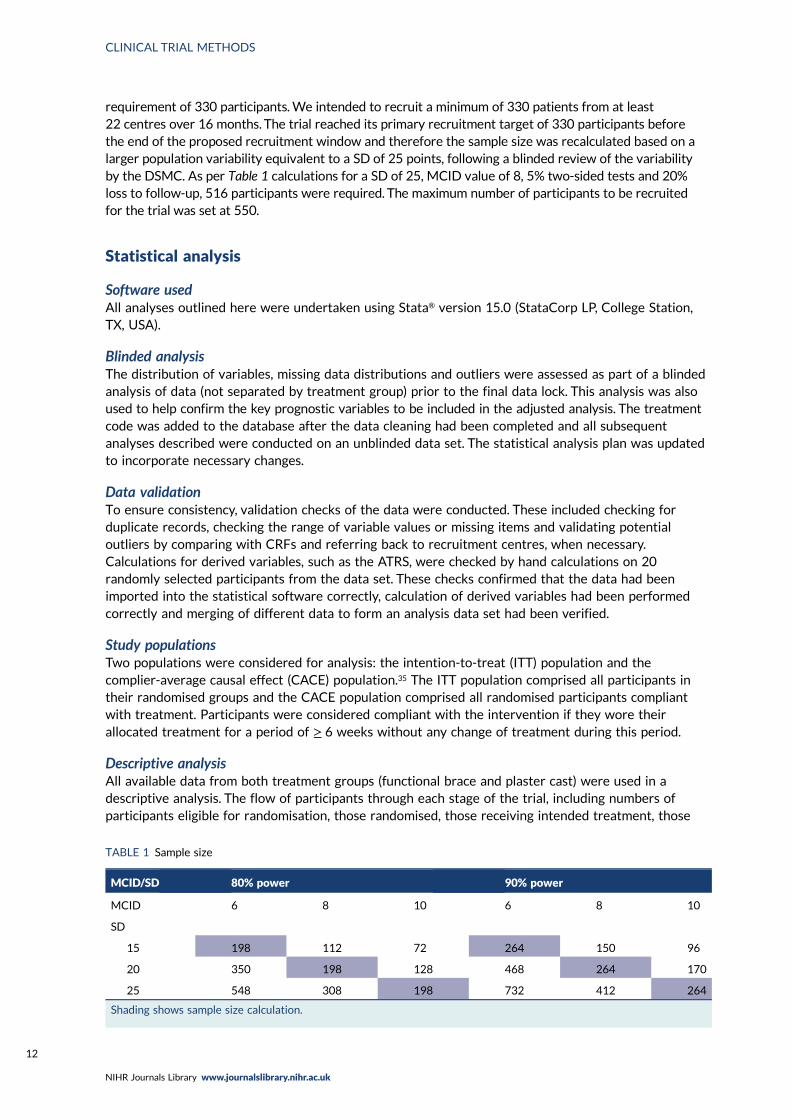
requirement of 330 participants.We intended to recruit a minimum of 330 patients from at least22 centres over 16 months. The trial reached its primary recruitment target of 330 participants beforethe end of the proposed recruitment window and therefore the sample size was recalculated based on alarger population variability equivalent to a SD of 25 points, following a blinded review of the variabilityby the DSMC. As per Table 1 calculations for a SD of 25, MCID value of 8, 5% two-sided tests and 20%loss to follow-up, 516 participants were required. The maximum number of participants to be recruitedfor the trial was set at 550.
Statistical analysis
Software usedAll analyses outlined here were undertaken using Stata® version 15.0 (StataCorp LP, College Station,TX, USA).
Blinded analysisThe distribution of variables, missing data distributions and outliers were assessed as part of a blindedanalysis of data (not separated by treatment group) prior to the final data lock. This analysis was alsoused to help confirm the key prognostic variables to be included in the adjusted analysis. The treatmentcode was added to the database after the data cleaning had been completed and all subsequentanalyses described were conducted on an unblinded data set. The statistical analysis plan was updatedto incorporate necessary changes.
Data validationTo ensure consistency, validation checks of the data were conducted. These included checking forduplicate records, checking the range of variable values or missing items and validating potentialoutliers by comparing with CRFs and referring back to recruitment centres, when necessary.Calculations for derived variables, such as the ATRS, were checked by hand calculations on 20randomly selected participants from the data set. These checks confirmed that the data had beenimported into the statistical software correctly, calculation of derived variables had been performedcorrectly and merging of different data to form an analysis data set had been verified.
Study populationsTwo populations were considered for analysis: the intention-to-treat (ITT) population and thecomplier-average causal effect (CACE) population.35 The ITT population comprised all participants intheir randomised groups and the CACE population comprised all randomised participants compliantwith treatment. Participants were considered compliant with the intervention if they wore theirallocated treatment for a period of ≥ 6 weeks without any change of treatment during this period.
Descriptive analysisAll available data from both treatment groups (functional brace and plaster cast) were used in adescriptive analysis. The flow of participants through each stage of the trial, including numbers ofparticipants eligible for randomisation, those randomised, those receiving intended treatment, those
TABLE 1 Sample size
MCID/SD 80% power 90% power
MCID 6 8 10 6 8 10
SD
15 198 112 72 264 150 96
20 350 198 128 468 264 170
25 548 308 198 732 412 264
Shading shows sample size calculation.
CLINICAL TRIAL METHODS
NIHR Journals Library www.journalslibrary.nihr.ac.uk
12

completing the study protocol and those analysed for the primary outcome, was assessed. Reporting ofthe results was in accordance with the Consolidated Standards of Reporting Trials (CONSORT) forpatient-reported outcomes (PROs) statement using the extension for non-pharmacologic treatmentinterventions and PROs.36 Any protocol deviations and violations were investigated.
Participant baseline characteristics were reported by treatment group and overall, and included recruitmentcentre stratification, demographic variables (age, sex, site of injury and mechanism of injury, body massindex, smoking status, alcohol consumption, medication, diagnoses, employment status) and baseline valuesfor ATRS and EQ-5D-5L before and after the injury. Numbers (with percentages) for categorical variablesand means (and SDs) or medians [and interquartile ranges (IQRs)] for continuous variables were presentedfor each treatment group and overall. There were no tests of statistical significance or confidence intervals(CIs) for differences between randomised groups on any baseline variable.
Data collected at the 8-week and 3-, 6- and 9-month post-injury follow-ups were summarised andthe proportion of missing items from completed questionnaires was examined. The patterns of dataavailability for primary and secondary outcomes from baseline to end of follow-up were summarisedfor the two treatment groups, as well as reasons for missingness, when known. The nature and patternof missing data [missing completely at random, missing at random (MAR) or missing not at random(MNAR)] were explored. Differentiation was made between partially completed and fully missingoutcome data. Validation rules for the primary outcome ATRS ensured that data were entered in thecorrect format, within valid ranges, minimising the chance of missing data. When ATRS item responseswere missing and at least half of the items were present, a pro rata estimation of the final ATRS scorewas imputed based on the average of the available ATRS item responses. No pre-injury ATRS values wereimputed, two ATRS scores were imputed at 8 weeks, five were imputed at 3 months, four were imputed at6 months and eight were imputed at 9 months.
Withdrawals and losses to follow-up were compared between the groups at each time point and thereasons were reported when known. Absolute risk differences (with 95% CIs) between the groups werecalculated, and the importance of differences was determined using chi-squared tests or Fisher’s exact test,if appropriate.When participants were identified as having tendon re-ruptures followed by surgery, theparticipant was not treated as lost to follow-up. Deaths and their causes were reported separately.
Quality assurance and compliance with treatment was assessed. The treatment received was reportedby group and summarised, with reasons for not receiving the assigned treatment given when possible.
For all analyses, tests were two sided and considered to provide evidence of a significant statisticaldifference if p-values to three decimal places were < 0.05 (5% significance level). In addition, anyreported treatment estimates will be presented with their associated 95% CI.
Analysis of primary outcomeThe primary outcome ATRS at 9 months post injury was reported for each of the treatment groups.The main findings of the trial show the difference in the ATRS between the two treatment groups,estimated with a linear mixed-effects regression model, including outcome information from all follow-uppoints and adjusting for age, sex and baseline ATRS as fixed effects, and centre and observations withinparticipants as random effects.
An additional fully adjusted model included age, sex, baseline ATRS, smoking status and diabetic conditionas prognostic variables, with random effects for centre and repeated measures within participants.Important clinician-specific effects were not expected as each clinician treated only a small numberof patients, but recruitment centre was included in the model as a random-effect factor to adjust forpotential cluster differences. Estimates of treatment effects were presented with 95% CIs. Histogramsand residual checks were used to assess an approximate normal distribution of the ATRS and, whenrelevant, the medians and IQRs reported for each treatment group.
DOI: 10.3310/hta24080 Health Technology Assessment 2020 Vol. 24 No. 8
© Queen’s Printer and Controller of HMSO 2020. This work was produced by Costa et al. under the terms of a commissioning contract issued by the Secretary of State forHealth and Social Care. This issue may be freely reproduced for the purposes of private research and study and extracts (or indeed, the full report) may be included inprofessional journals provided that suitable acknowledgement is made and the reproduction is not associated with any form of advertising. Applications for commercialreproduction should be addressed to: NIHR Journals Library, National Institute for Health Research, Evaluation, Trials and Studies Coordinating Centre, Alpha House,University of Southampton Science Park, Southampton SO16 7NS, UK.
13
An unadjusted analysis was also undertaken to assess the differences between treatment groups usingStudent’s t-test, based on a normal approximation of the ATRS score. Estimates of treatment effectswere presented with 95% CIs for both unadjusted and adjusted analyses. The ITT adjusted analysis ofthe primary outcome ATRS was used to determine the success, or otherwise, of the trial.
Sensitivity analyses to examine the robustness of conclusions to different assumptions were conductedfor the CACE population. Compliance was defined as using the allocated intervention for a minimumof 6 weeks, and further sensitivity analysis was undertaken using different definitions of compliance,namely minimum of 4 weeks and minimum of 2 weeks. Adherence to the allocated treatment canaffect the interpretation of the impact of what was offered to patients. This may be a particular issuein an ITT analysis, which includes all patients as they were expected to be treated and does not takeinto account if patients received or adhered to the intervention allocated to them.
Supplementary analysisTo explore recovery in the two treatment groups over time, a further analysis of the ATRS wasconducted. This summarised longitudinal data collected at all four time points to a single value, thearea under the curve (AUC),37 to facilitate a comparison of the ATRS between the treatment groupsover time. Parameter estimates from the mixed-effects models were used to calculate AUCs for eachtreatment group from baseline to the 9-month post-injury follow-up. This provided an overall estimateof recovery over time in each group. Higher ATRS scores were associated with fewer limitations anddifficulties related to the injured Achilles tendon, and therefore larger AUCs were suggestive ofimproved function. The AUC for each treatment group and their differences, calculated using a t-test,were presented, together with their associated 95% CIs. The lincom command in Stata was used tocalculate the AUC for each group. This analysis was also conducted for the EQ-5D utility score and theEQ-5D VAS.
Analysis of secondary outcomesThe continuous secondary outcomes ATRS at 8-week and 3- and 6-month post-injury follow-up andEQ-5D-5L were evaluated and analysed for the ITT population using the methodology described forthe primary outcome (see Analysis of primary outcome). Histograms and residual checks were used toassess whether or not these variables were approximately normally distributed. Means and SDs werereported at the 8-week and 3-, 6- and 9-month post-injury follow-up time points, and medians andIQRs were reported when appropriate. A linear mixed-effects regression model with random effectsfor recruitment centre and participant outcome information from all time points, and fixed effects forage, sex and baseline pre-injury outcome values, was used to examine the difference between thetreatment groups.
Complications in each of the treatment groups were reported as numbers (with percentages) andcompared over the 9-month study period using chi-squared tests or Fisher’s exact test. The resultswere reported with their associated 95% CI and p-values for comparison between the two treatmentgroups. The population for this analysis was ITT. Complications were further grouped to identify thenumber of patients with one or more complications at each time point.
Sensitivity analyses were also conducted for the secondary outcome EQ-5D-5L analysis using theCACE population.
Health economics methods
OverviewThe main objective of the health economic evaluation was to assess the comparative cost-effectivenessof the two non-surgical treatment options (plaster cast and functional brace) for patients with aprimary (first-time) rupture of the Achilles tendon. To achieve this, a systematic comparison of the cost
CLINICAL TRIAL METHODS
NIHR Journals Library www.journalslibrary.nihr.ac.uk
14
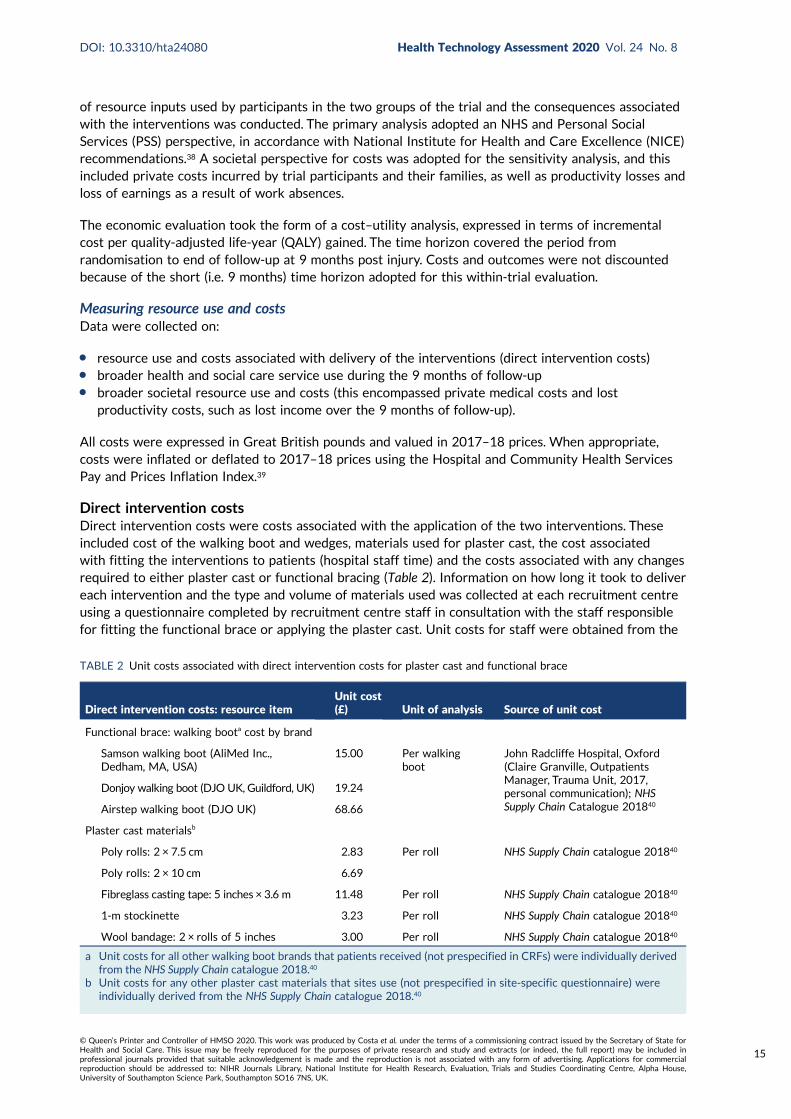
of resource inputs used by participants in the two groups of the trial and the consequences associatedwith the interventions was conducted. The primary analysis adopted an NHS and Personal SocialServices (PSS) perspective, in accordance with National Institute for Health and Care Excellence (NICE)recommendations.38 A societal perspective for costs was adopted for the sensitivity analysis, and thisincluded private costs incurred by trial participants and their families, as well as productivity losses andloss of earnings as a result of work absences.
The economic evaluation took the form of a cost–utility analysis, expressed in terms of incrementalcost per quality-adjusted life-year (QALY) gained. The time horizon covered the period fromrandomisation to end of follow-up at 9 months post injury. Costs and outcomes were not discountedbecause of the short (i.e. 9 months) time horizon adopted for this within-trial evaluation.
Measuring resource use and costsData were collected on:
l resource use and costs associated with delivery of the interventions (direct intervention costs)l broader health and social care service use during the 9 months of follow-upl broader societal resource use and costs (this encompassed private medical costs and lost
productivity costs, such as lost income over the 9 months of follow-up).
All costs were expressed in Great British pounds and valued in 2017–18 prices. When appropriate,costs were inflated or deflated to 2017–18 prices using the Hospital and Community Health ServicesPay and Prices Inflation Index.39
Direct intervention costsDirect intervention costs were costs associated with the application of the two interventions. Theseincluded cost of the walking boot and wedges, materials used for plaster cast, the cost associatedwith fitting the interventions to patients (hospital staff time) and the costs associated with any changesrequired to either plaster cast or functional bracing (Table 2). Information on how long it took to delivereach intervention and the type and volume of materials used was collected at each recruitment centreusing a questionnaire completed by recruitment centre staff in consultation with the staff responsiblefor fitting the functional brace or applying the plaster cast. Unit costs for staff were obtained from the
TABLE 2 Unit costs associated with direct intervention costs for plaster cast and functional brace
Direct intervention costs: resource itemUnit cost(£) Unit of analysis Source of unit cost
Functional brace: walking boota cost by brand
Samson walking boot (AliMed Inc.,Dedham, MA, USA)
15.00 Per walkingboot
John Radcliffe Hospital, Oxford(Claire Granville, OutpatientsManager, Trauma Unit, 2017,personal communication); NHSSupply Chain Catalogue 201840
Donjoy walking boot (DJO UK, Guildford, UK) 19.24
Airstep walking boot (DJO UK) 68.66
Plaster cast materialsb
Poly rolls: 2 × 7.5 cm 2.83 Per roll NHS Supply Chain catalogue 201840
Poly rolls: 2 × 10 cm 6.69
Fibreglass casting tape: 5 inches × 3.6 m 11.48 Per roll NHS Supply Chain catalogue 201840
1-m stockinette 3.23 Per roll NHS Supply Chain catalogue 201840
Wool bandage: 2 × rolls of 5 inches 3.00 Per roll NHS Supply Chain catalogue 201840
a Unit costs for all other walking boot brands that patients received (not prespecified in CRFs) were individually derivedfrom the NHS Supply Chain catalogue 2018.40
b Unit costs for any other plaster cast materials that sites use (not prespecified in site-specific questionnaire) wereindividually derived from the NHS Supply Chain catalogue 2018.40
DOI: 10.3310/hta24080 Health Technology Assessment 2020 Vol. 24 No. 8
© Queen’s Printer and Controller of HMSO 2020. This work was produced by Costa et al. under the terms of a commissioning contract issued by the Secretary of State forHealth and Social Care. This issue may be freely reproduced for the purposes of private research and study and extracts (or indeed, the full report) may be included inprofessional journals provided that suitable acknowledgement is made and the reproduction is not associated with any form of advertising. Applications for commercialreproduction should be addressed to: NIHR Journals Library, National Institute for Health Research, Evaluation, Trials and Studies Coordinating Centre, Alpha House,University of Southampton Science Park, Southampton SO16 7NS, UK.
15

Personal Social Services Research Unit (PSSRU) Unit Costs of Health and Social Care 2018 compendium39
and were multiplied by the median time it takes to deliver each intervention. The median time to fit afunctional brace was 10, 11 and 17.5 minutes for a plaster technician, nurse and other staff (includingphysiotherapists, orthotists and occupational therapists), respectively. The median time to changewedges was 5 minutes for a plaster technician and a nurse and 10 minutes for other staff. The mediantime to change a plaster cast was 15 minutes for a plaster technician and 17.5 minutes for a nurse.The base-case analysis assumed the costs of a plaster technician. Unit costs of plaster cast materials,walking boots and wedges were obtained from the 2018 NHS Supply Chain catalogue.40 The totaldirect intervention cost for each patient was calculated by combining the resource inputs with theirunit cost values.
Measuring broader resource useBroader resource use data were collected using follow-up questionnaires completed by trialparticipants at the four follow-up assessment points: 8 weeks and 3, 6 and 9 months post injury. Thequestionnaires captured details of inpatient and day-case admissions, outpatient and emergency careattendances, contacts with primary or community health and social care services, medication use andwalking aids provided/self-purchased, as well adaptations to home environments. In addition, thequestionnaires captured the direct non-medical costs (including travel expenses) incurred by patientsand their carers, as well as the number of days off work and gross loss of earnings attributable to theparticipant’s health state or contacts with care providers.
Valuing of resource useResource inputs were valued by attaching unit costs derived from national compendia in accordancewith NICE’s Guide to the Methods of Technology Appraisal.38 The key databases for deriving unit costdata included the Department of Health and Social Care’s Reference Costs 2017–18 schedules,41
the PSSRU’s Unit Costs of Health and Social Care 2018 compendium,39 the 2018 NHS Prescription CostAnalysis database for England,42 the 2016 volume of the British National Formulary43 and the NHS SupplyChain catalogue 2018.40 Table 24 (see Appendix 1) gives a summary of the unit costs values and datasources for broader resource use categories identified within the follow-up questionnaires.
Per diem costs for hospital inpatient admissions during the follow-up period were calculated individuallyas a weighted average of Healthcare Resource Group (HRG) codes of related procedures and/or clinicaldiagnoses. For example, the average cost per day of an inpatient stay in a medical ward to treat a PEwas calculated as the sum total of weighted average HRG codes (DZ09J–DZ09Q; PE with or withoutinterventions), divided by the average length of stay across elective and non-elective inpatient services.The individual HRG codes were derived using the NHS HRG4 2017/18 Reference Cost Grouper softwareversion RC1718 (NHS Digital, Leeds, UK). The Department of Health and Social Care’s Reference Costs2017–1841 schedule was used to assign the costs of each of the derived HRG codes.
Costs of community-based health and social care services were calculated by applying unit costs extractedfrom national tariffs, primarily the PSSRU Unit Costs of Health and Social Care 2018 compendium,39 toresource volumes. Costs of medications for individual participants were estimated based on their reporteddoses and frequencies, when these were available, or based on assumed daily doses using British NationalFormulary43 recommendations. When a dose range was reported as ‘as required’, or when the quantitieswere not recorded, we assumed a mean cost of that medication item based on the prescription costanalysis values (net ingredient cost per item).When medication dosages were missing, we conservativelyassumed that the patient received the same dosage as other trial participants who reported taking thesame medication.
The costs of walking aids and adaptations (equipment participants receive to manage their injury andmake daily lives easier) were derived by combining data on the number and type of items received withtheir unit cost values. Unit cost values were derived from the NHS Supply Chain catalogue40 if equipmentwas provided by a health provider during the trial follow-up period.When aids and adaptations wereself-financed, the costs were provided by participants.
CLINICAL TRIAL METHODS
NIHR Journals Library www.journalslibrary.nihr.ac.uk
16

We used data on sex- and employment status-specific median earnings from the UK national annualsurvey of hours and earnings44 to derive the costs of time taken off work. The employment status oftrial participants was derived from self-reported information. Broader societal costs were calculated bycombining the productivity losses and the income losses attributable to work absences.
Summary statistics were generated for resource use variables by treatment allocation and assessmentpoint. Between-group differences in resource use and costs at each assessment point were comparedusing the two-sample t-test. Statistical significance was assessed at the 5% significance level. Standarderrors are reported for treatment group means and bootstrap 95% CIs for the between-group differencesin mean resource use and cost estimates.
Measuring outcomesIn accordance with NICE guidelines, the primary health outcome of the health economic evaluationwas the QALY metric.38 The QALY is a measure that combines quantity of life and preference-basedHRQoL into a single metric. To calculate QALYs, it is imperative to obtain health state values forparticipants within the trial. The HRQoL of trial participants was assessed at baseline (both pre andpost injury) and at 8 weeks and 3, 6 and 9 months post injury using the EQ-5D-5L.38 The EQ-5D-5Ldefines HRQoL in terms of five dimensions: (1) mobility, (2) self-care, (3) usual activities, (4) pain/discomfort and (5) anxiety/depression. Responses in each dimension are divided into five ordinal levels,coded (1) no problems, (2) slight problems, (3) moderate problems, (4) severe problems and (5) extremeproblems. Responses to each health dimension were categorised as optimal or suboptimal with respectto function, where optimal function indicates no impairment (e.g. ‘no problems in walking about’ for themobility dimension) and suboptimal function refers to any functional (below level 1) impairment.Between-group differences in optimal compared with suboptimal function for each health dimensionwere compared at each time point using chi-squared tests.
Responses to the EQ-5D-5L instrument were converted into health utility scores using the EQ-5D-5LCrosswalk Index Value Calculator currently recommended by NICE,42 which maps the EQ-5D-5Ldescriptive system data onto the EQ-5D-3L valuation set. A detailed description of the mappingmethodology is described elsewhere.42 QALYs were generated for each patient using the area underthe baseline-adjusted utility curve, assuming linear interpolation between health utility measurementsacross assessment points.
The health utility values and QALYs accrued over the 9-month follow-up period were summarised bytreatment group and assessment point, and presented as means and associated standard errors.Between-group differences were compared using the two-sample t-test, in a similar way to thedescriptive analyses of resource inputs and costs.
Cost-effectiveness analysis methods
Missing dataMissing data are common in RCTs: participants may be lost to follow-up, questionnaires may be unreturnedor responses to individual questionnaire items may be missing.45 As costs and outcomes of individualswith missing data may differ systematically from those of individuals with fully observed data, it isimportant to handle missing data using a principled approach that is justified by, among other factors,the missing data mechanism. Missing costs and health utility data were imputed at each time pointusing fully conditional multiple imputation by chain equations, implemented through the MICE package(run within Stata version 15.0; http://fmwww.bc.edu/RePEc/bocode/m) under the MAR assumption.The appropriateness of the MAR assumption was assessed by (1) investigating the missing data patterns(monotonic vs. non-monotonic) and (2) comparing the attributes of participants with and those ofparticipants without missing costs and HRQoL data at each follow-up time point.
Regression models were used to generate multiple imputed data sets, in which missing values werepredicted drawing on predictive covariates (age, sex and baseline pre-injury HRQoL scores). Costs andEQ-5D utility scores at each time point contributed as both predictors and imputed variables. Imputations
DOI: 10.3310/hta24080 Health Technology Assessment 2020 Vol. 24 No. 8
© Queen’s Printer and Controller of HMSO 2020. This work was produced by Costa et al. under the terms of a commissioning contract issued by the Secretary of State forHealth and Social Care. This issue may be freely reproduced for the purposes of private research and study and extracts (or indeed, the full report) may be included inprofessional journals provided that suitable acknowledgement is made and the reproduction is not associated with any form of advertising. Applications for commercialreproduction should be addressed to: NIHR Journals Library, National Institute for Health Research, Evaluation, Trials and Studies Coordinating Centre, Alpha House,University of Southampton Science Park, Southampton SO16 7NS, UK.
17

were generated separately by treatment group using predictive mean matching drawn from the fiveknh-nearest-neighbours (knn = 5); predictive mean matching preserves distribution of the data and ismore robust to violations of the normality assumption. The multiple imputation was run 50 times,generating 50 complete data sets that reflected the distributions of and correlations between variables.
Bivariate regressions using a seemingly unrelated regression model (Sureg) were used to independentlyanalyse the multiply imputed data sets so as to estimate the costs and QALYs in each treatment groupover the 9-month trial horizon. Joint distributions of costs and outcomes from the original data set weregenerated through non-parametric bootstrapping and changes in costs and QALYs were calculated foreach sample. A total of 1000 bootstrap samples were drawn and means for both incremental costs andincremental QALYs (with associated 95% CIs) were calculated. Estimates from each imputed data setwere combined using Rubin’s rules38 to generate overall mean estimates of costs and QALYs and theirstandard errors. The standard errors reflect the variability within and across imputations. The imputationmodel was validated by assessing the distributions of imputed and observed values. A mixed model withadjustment made for baseline pre-injury EQ-5D health utility scores is also presented for comparison.
Presentation of cost-effectiveness resultsThe cost-effectiveness results are expressed in terms of the incremental cost-effectiveness ratio (ICER)and calculated as the difference between treatments in mean total costs divided by mean total QALYs.Given the pattern of results, plaster cast has been selected as the referent and functional brace as thecomparator (i.e. functional brace minus plaster cast) for the estimation of ICER values. The bootstrapreplicates generated by the non-parametric bootstrapping, described inMissing data, were used to populatecost-effectiveness scatterplots. Cost-effectiveness acceptability curves, which showed the probability thatfunctional brace is cost-effective relative to plaster cast across a range of cost-effectiveness thresholds,were also generated based on the proportion of bootstrap replicates with positive incremental netbenefits. The net monetary benefit (NMB) of using functional brace compared with plaster cast was alsocalculated across three prespecified cost-effectiveness thresholds, namely £15,000 per QALY,44 £20,000per QALY and £30,000 per QALY.46 A positive incremental NMB indicates that functional brace iscost-effective compared with plaster cast at the given cost-effectiveness threshold. For the secondaryanalysis that adopted the ATRS as the health outcome measure of interest, the NMB was estimatedat cost-effectiveness thresholds of £100–500 per unit change in ATRS score.We failed to identify anyexternal evidence on economic values for changes in ATRS score and therefore a range of arbitrarythreshold values had to be selected for this analysis.
Sensitivity and secondary outcomes analysesSeveral sensitivity analyses were conducted to test the robustness of the cost-effectiveness estimates.These involved re-estimating the main cost-effectiveness outcomes under the following scenarios:(1) restricting the analyses to complete cases (i.e. those participants with complete cost and outcomedata over the 9-month follow-up period); (2) adopting a wider societal perspective that included privatecosts incurred by trial participants and their families, as well as economic losses attributable to workabsences; (3) estimating incremental cost-effectiveness using a CACE population; and (4) evaluating theimpact on cost-effectiveness results of assuming that data may be MNAR, rather than MAR, as the testsfor exploring missing data mechanisms described above cannot rule out MNAR. Data are MNAR whenthe probability of missingness is directly linked to the unobserved value itself. To explore this assumptionin sensitivity analyses, we used pattern mixture models with multiple imputation, following the publishedtutorial by Leurent et al.47 Using this approach, missing values were first imputed using multiple imputationunder a MAR assumption. Second, the MAR-imputed data were modified by a scale parameter (c) to reflectthat HRQoL and cost data may be MNAR under a range of plausible scenarios. Specifically, we assumedthat participants with missing HRQoL were likely to be in poorer health, whereas those with missing costdata were likely to have used more resources. In the absence of expert data on what the likely reductioncould be, we assumed conservatively that a participant with missing HRQoL values would, on average, have a10% lower HRQoL than a trial participant with similar characteristics who had available data.We applied thesame reasoning for costs, but this time assuming a 10% higher cost. The combination of scenarios is shownin Table 3. The resulting multiply imputed data set was analysed as explained above for multiple imputation
CLINICAL TRIAL METHODS
NIHR Journals Library www.journalslibrary.nihr.ac.uk
18
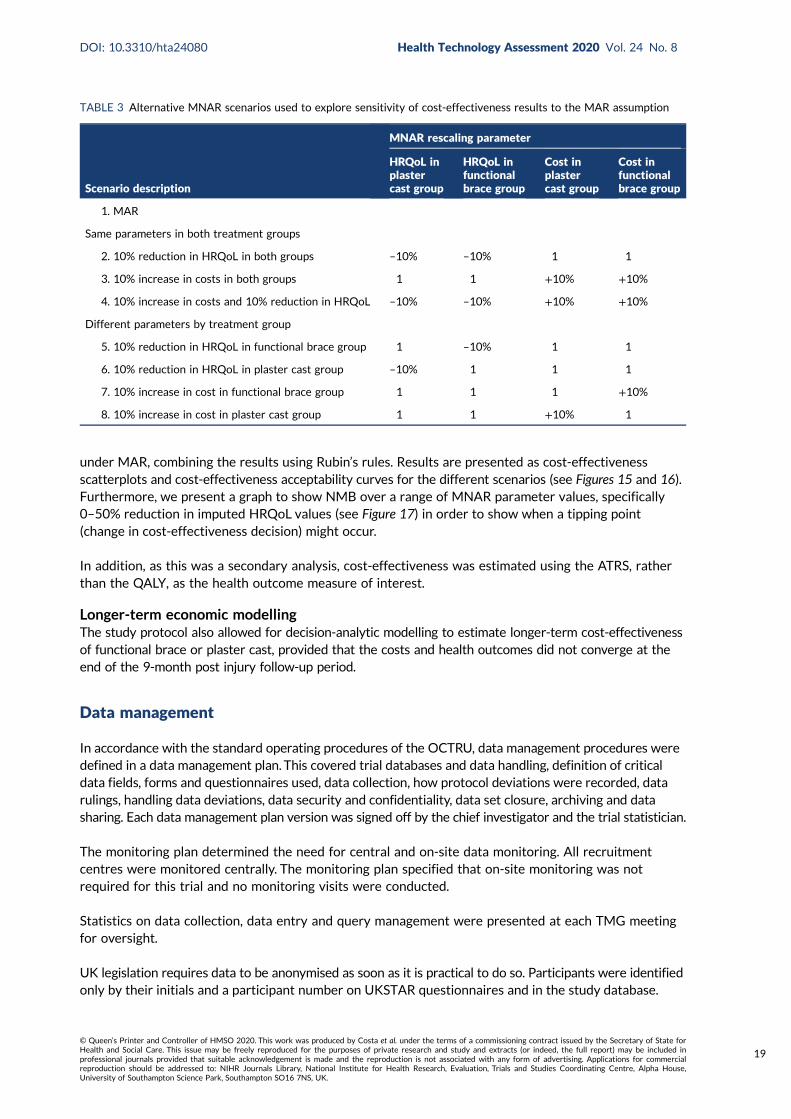
under MAR, combining the results using Rubin’s rules. Results are presented as cost-effectivenessscatterplots and cost-effectiveness acceptability curves for the different scenarios (see Figures 15 and 16).Furthermore, we present a graph to show NMB over a range of MNAR parameter values, specifically0–50% reduction in imputed HRQoL values (see Figure 17) in order to show when a tipping point(change in cost-effectiveness decision) might occur.
In addition, as this was a secondary analysis, cost-effectiveness was estimated using the ATRS, ratherthan the QALY, as the health outcome measure of interest.
Longer-term economic modellingThe study protocol also allowed for decision-analytic modelling to estimate longer-term cost-effectivenessof functional brace or plaster cast, provided that the costs and health outcomes did not converge at theend of the 9-month post injury follow-up period.
Data management
In accordance with the standard operating procedures of the OCTRU, data management procedures weredefined in a data management plan. This covered trial databases and data handling, definition of criticaldata fields, forms and questionnaires used, data collection, how protocol deviations were recorded, datarulings, handling data deviations, data security and confidentiality, data set closure, archiving and datasharing. Each data management plan version was signed off by the chief investigator and the trial statistician.
The monitoring plan determined the need for central and on-site data monitoring. All recruitmentcentres were monitored centrally. The monitoring plan specified that on-site monitoring was notrequired for this trial and no monitoring visits were conducted.
Statistics on data collection, data entry and query management were presented at each TMG meetingfor oversight.
UK legislation requires data to be anonymised as soon as it is practical to do so. Participants were identifiedonly by their initials and a participant number on UKSTAR questionnaires and in the study database.
TABLE 3 Alternative MNAR scenarios used to explore sensitivity of cost-effectiveness results to the MAR assumption
Scenario description
MNAR rescaling parameter
HRQoL inplastercast group
HRQoL infunctionalbrace group
Cost inplastercast group
Cost infunctionalbrace group
1. MAR
Same parameters in both treatment groups
2. 10% reduction in HRQoL in both groups –10% –10% 1 1
3. 10% increase in costs in both groups 1 1 +10% +10%
4. 10% increase in costs and 10% reduction in HRQoL –10% –10% +10% +10%
Different parameters by treatment group
5. 10% reduction in HRQoL in functional brace group 1 –10% 1 1
6. 10% reduction in HRQoL in plaster cast group –10% 1 1 1
7. 10% increase in cost in functional brace group 1 1 1 +10%
8. 10% increase in cost in plaster cast group 1 1 +10% 1
DOI: 10.3310/hta24080 Health Technology Assessment 2020 Vol. 24 No. 8
© Queen’s Printer and Controller of HMSO 2020. This work was produced by Costa et al. under the terms of a commissioning contract issued by the Secretary of State forHealth and Social Care. This issue may be freely reproduced for the purposes of private research and study and extracts (or indeed, the full report) may be included inprofessional journals provided that suitable acknowledgement is made and the reproduction is not associated with any form of advertising. Applications for commercialreproduction should be addressed to: NIHR Journals Library, National Institute for Health Research, Evaluation, Trials and Studies Coordinating Centre, Alpha House,University of Southampton Science Park, Southampton SO16 7NS, UK.
19
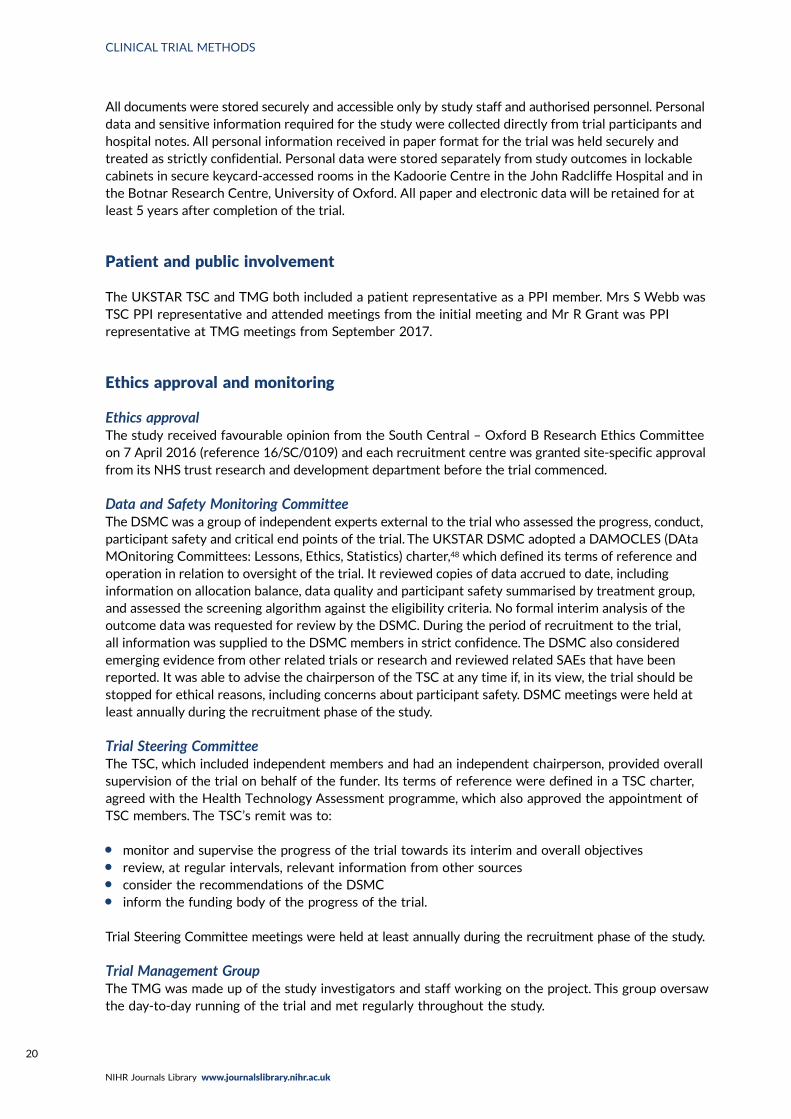
All documents were stored securely and accessible only by study staff and authorised personnel. Personaldata and sensitive information required for the study were collected directly from trial participants andhospital notes. All personal information received in paper format for the trial was held securely andtreated as strictly confidential. Personal data were stored separately from study outcomes in lockablecabinets in secure keycard-accessed rooms in the Kadoorie Centre in the John Radcliffe Hospital and inthe Botnar Research Centre, University of Oxford. All paper and electronic data will be retained for atleast 5 years after completion of the trial.
Patient and public involvement
The UKSTAR TSC and TMG both included a patient representative as a PPI member. Mrs S Webb wasTSC PPI representative and attended meetings from the initial meeting and Mr R Grant was PPIrepresentative at TMG meetings from September 2017.
Ethics approval and monitoring
Ethics approvalThe study received favourable opinion from the South Central – Oxford B Research Ethics Committeeon 7 April 2016 (reference 16/SC/0109) and each recruitment centre was granted site-specific approvalfrom its NHS trust research and development department before the trial commenced.
Data and Safety Monitoring CommitteeThe DSMC was a group of independent experts external to the trial who assessed the progress, conduct,participant safety and critical end points of the trial. The UKSTAR DSMC adopted a DAMOCLES (DAtaMOnitoring Committees: Lessons, Ethics, Statistics) charter,48 which defined its terms of reference andoperation in relation to oversight of the trial. It reviewed copies of data accrued to date, includinginformation on allocation balance, data quality and participant safety summarised by treatment group,and assessed the screening algorithm against the eligibility criteria. No formal interim analysis of theoutcome data was requested for review by the DSMC. During the period of recruitment to the trial,all information was supplied to the DSMC members in strict confidence. The DSMC also consideredemerging evidence from other related trials or research and reviewed related SAEs that have beenreported. It was able to advise the chairperson of the TSC at any time if, in its view, the trial should bestopped for ethical reasons, including concerns about participant safety. DSMC meetings were held atleast annually during the recruitment phase of the study.
Trial Steering CommitteeThe TSC, which included independent members and had an independent chairperson, provided overallsupervision of the trial on behalf of the funder. Its terms of reference were defined in a TSC charter,agreed with the Health Technology Assessment programme, which also approved the appointment ofTSC members. The TSC’s remit was to:
l monitor and supervise the progress of the trial towards its interim and overall objectivesl review, at regular intervals, relevant information from other sourcesl consider the recommendations of the DSMCl inform the funding body of the progress of the trial.
Trial Steering Committee meetings were held at least annually during the recruitment phase of the study.
Trial Management GroupThe TMG was made up of the study investigators and staff working on the project. This group oversawthe day-to-day running of the trial and met regularly throughout the study.
CLINICAL TRIAL METHODS
NIHR Journals Library www.journalslibrary.nihr.ac.uk
20

Summary of changes to the trial protocol
All protocol versions can be found on the NIHR Journals Library website at www.journalslibrary.nihr.ac.uk/programmes/hta/1311562/#/ (accessed 11 November 2019).
The changes to the project protocol are summarised in Table 4.
TABLE 4 Changes to the protocol during the study by version number
Protocol version number Date Details of changes made
1 27 January 2016 The first version
2 18 August 2016 References to fax removed; replaced with description of sendingconfidential documents to a secure nhs.net e-mail address
Addition of resource use questionnaire at 8 weeks
Clarification of data collection roles of recruitment centre staffand UKSTAR office staff
Update to the statistical analysis section of the protocol so that itreflects the statistical analysis plan for the trial
Clarification of the consent process
Correction of typographical errors and clarifications
3 10 July 2017 Clarification that questionnaires at the 3-, 6- or 9-month timepoints may be sent electronically to patients via e-mail or SMS,as an alternative to by post
4 19 September 2017(not issued)
Update of sample size to a maximum of 550 patients
5 23 October 2017 Correction of protocol version number from 4.1 to 5.0
6 16 May 2018 Addition of ‘study within a trial’ to assess the effect of thank-youe-mails on follow-up rates
Updates to study personnel, TSC membership and sponsor addressdetails
Correction of minor typographical errors
7 13 November 2018 Removal of ‘study within a trial’
Addition of thank-you letter to participants after final follow-up
DOI: 10.3310/hta24080 Health Technology Assessment 2020 Vol. 24 No. 8
© Queen’s Printer and Controller of HMSO 2020. This work was produced by Costa et al. under the terms of a commissioning contract issued by the Secretary of State forHealth and Social Care. This issue may be freely reproduced for the purposes of private research and study and extracts (or indeed, the full report) may be included inprofessional journals provided that suitable acknowledgement is made and the reproduction is not associated with any form of advertising. Applications for commercialreproduction should be addressed to: NIHR Journals Library, National Institute for Health Research, Evaluation, Trials and Studies Coordinating Centre, Alpha House,University of Southampton Science Park, Southampton SO16 7NS, UK.
21


Chapter 3 Clinical trial results
Study participants
Patients with an Achilles tendon rupture typically attend the emergency department at their localhospital and, following their diagnosis, are referred to the next available fracture/trauma clinic todiscuss the management of their injury.
The flow of participants through the study is summarised in Figure 1. This includes details on thetotal number of patients referred to the trauma clinic with an Achilles tendon rupture and thoserandomised. The availability of the primary outcome for analysis is also reported by treatment group,as is the total number of patients excluded from the primary outcome analysis.
Recruitment
A total of 1076 eligible participants were screened from July 2016 to May 2018 from 39 NHS hospitalsacross England and Scotland (see Figure 1). Of these, 540 participants consented to take part in the trial.Reasons why patients were not included in the trial are presented. Participants attended clinic visits atthe time of randomisation (baseline) and at the 8-week follow-up. Participants were also contacted bythe trial team by post, e-mail or telephone to complete follow-up questionnaires at 3, 6 and 9 monthspost injury. Two participants were randomised in error before consenting and are therefore not includedin the numbers allocated to each treatment group.
Baseline characteristics
The randomisation was stratified by centre, and the allocation of participants to the treatmentgroups in each centre and the overall numbers is given in Table 5. The descriptive characteristics ofthe participants included in the ITT population are summarised by treatment group and overall inTable 6. These values are presented as numbers and percentages for categorical factors and as meansand SD or medians and IQR, as appropriate, for continuous variables. These variables all appear wellbalanced between the two treatment groups. The distribution of participant ages by sex at enrolmentis shown in Figure 2. This distribution has a peak in male patients aged 30–40 years and in femalepatients aged 40–60 years. Baseline values of patient-reported outcome measures (PROMs), ATRSand EQ-5D-5L are summarised by group in Table 7. ATRS values range from 0 to 100, with lowerscores indicating more functional limitations; EQ-5D utility scores range from –0.511 to 1, with higherscores indicating better QoL and 0 being equivalent to death; and EQ-5D VAS scores range from0 to 100, with higher scores indicating better QoL. The values reported are similar in the twotreatment groups.
Compliance
Participant compliance with treatment is presented in Table 8. The population compliant withtreatment for ≥ 6 weeks was made up of 477 (88.2%) participants overall, 212 (79.7%) of whom werein the plaster cast group and 265 (96.7%) of whom were in the functional brace group. The numbers ofpatients compliant with treatment for ≥ 4 weeks and ≥ 2 weeks are also listed in Table 8.
DOI: 10.3310/hta24080 Health Technology Assessment 2020 Vol. 24 No. 8
© Queen’s Printer and Controller of HMSO 2020. This work was produced by Costa et al. under the terms of a commissioning contract issued by the Secretary of State forHealth and Social Care. This issue may be freely reproduced for the purposes of private research and study and extracts (or indeed, the full report) may be included inprofessional journals provided that suitable acknowledgement is made and the reproduction is not associated with any form of advertising. Applications for commercialreproduction should be addressed to: NIHR Journals Library, National Institute for Health Research, Evaluation, Trials and Studies Coordinating Centre, Alpha House,University of Southampton Science Park, Southampton SO16 7NS, UK.
23

Treatment received• Plaster cast, n = 247• Functional brace, n = 17 Reasons • Patient decision, n = 13 • Clinician decision, n = 3 • Incorrect diagnosis, n = 1• Unknown, n = 1
Patients referred to the trauma/orthopaedic clinicwith Achilles tendon rupture
(n = 1451)
• Aged < 16 years, n = 3• Had previous Achilles tendon rupture, n = 37• Having surgery, n = 120• Presented to the treating hospital > 14 days after injury, n = 155• Unable to adhere to trial procedures or complete questionnaire, n = 46• Other, n = 14a
Randomised(n = 540)a
Treatment received• Functional brace, n = 269• Plaster cast, n = 4 Reasons • Patient decision, n = 1 • Clinician decision, n = 1 • Medical resources unavailable, n = 2
Reasons for exclusion• Withdrew, n = 6• Missing data, n = 3
Reasons for exclusion• Withdrew, n = 2• Death, n = 1• Missing data, n = 1
Allocated to plaster cast(n = 266)
Allocated to functional brace(n = 274)
• No staff available to register patient/ patient missed in error, n = 97• Clinician’s choice, n = 50• Walking boot or plaster cast supplies unavailable, n = 2• Patient declined, n = 385
Eligible patients(n = 1076)
Withdrew(n = 1)
Withdrew(n = 1)
Patients not meeting eligibility criteria(n = 375)
Patients eligible but not randomised(n = 534)
Included in primary analysis(n = 257)
Excluded from primary analysis(n = 9)
Included in primary analysis(n = 270)
Excluded from primary analysis(n = 4)
Completed baseline(n = 273)
Completed baseline(n = 264)
FIGURE 1 The UKSTAR CONSORT flow diagram. a, Two additional patients were randomised in error without givingconsent to be in the study. These participants were excluded from all data analyses. Reproduced from Costa et al.49 © 2020The Author(s). Published by Elsevier Ltd. This is an Open Access article distributed in accordance with the terms of theCreative Commons Attribution (CC BY 4.0) license, which permits others to distribute, remix, adapt and build upon thiswork, for commercial use, provided the original work is properly cited. See: http://creativecommons.org/licenses/by/4.0/.
CLINICAL TRIAL RESULTS
NIHR Journals Library www.journalslibrary.nihr.ac.uk
24
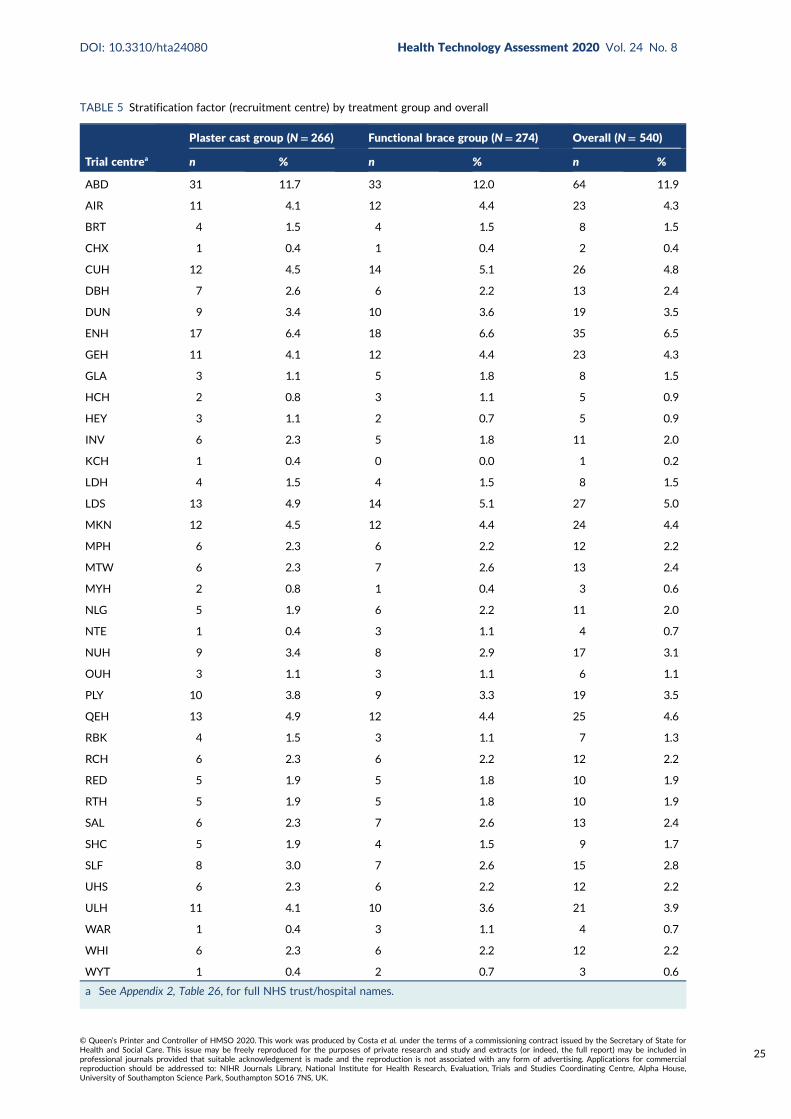
TABLE 5 Stratification factor (recruitment centre) by treatment group and overall
Trial centrea
Plaster cast group (N= 266) Functional brace group (N= 274) Overall (N= 540)
n % n % n %
ABD 31 11.7 33 12.0 64 11.9
AIR 11 4.1 12 4.4 23 4.3
BRT 4 1.5 4 1.5 8 1.5
CHX 1 0.4 1 0.4 2 0.4
CUH 12 4.5 14 5.1 26 4.8
DBH 7 2.6 6 2.2 13 2.4
DUN 9 3.4 10 3.6 19 3.5
ENH 17 6.4 18 6.6 35 6.5
GEH 11 4.1 12 4.4 23 4.3
GLA 3 1.1 5 1.8 8 1.5
HCH 2 0.8 3 1.1 5 0.9
HEY 3 1.1 2 0.7 5 0.9
INV 6 2.3 5 1.8 11 2.0
KCH 1 0.4 0 0.0 1 0.2
LDH 4 1.5 4 1.5 8 1.5
LDS 13 4.9 14 5.1 27 5.0
MKN 12 4.5 12 4.4 24 4.4
MPH 6 2.3 6 2.2 12 2.2
MTW 6 2.3 7 2.6 13 2.4
MYH 2 0.8 1 0.4 3 0.6
NLG 5 1.9 6 2.2 11 2.0
NTE 1 0.4 3 1.1 4 0.7
NUH 9 3.4 8 2.9 17 3.1
OUH 3 1.1 3 1.1 6 1.1
PLY 10 3.8 9 3.3 19 3.5
QEH 13 4.9 12 4.4 25 4.6
RBK 4 1.5 3 1.1 7 1.3
RCH 6 2.3 6 2.2 12 2.2
RED 5 1.9 5 1.8 10 1.9
RTH 5 1.9 5 1.8 10 1.9
SAL 6 2.3 7 2.6 13 2.4
SHC 5 1.9 4 1.5 9 1.7
SLF 8 3.0 7 2.6 15 2.8
UHS 6 2.3 6 2.2 12 2.2
ULH 11 4.1 10 3.6 21 3.9
WAR 1 0.4 3 1.1 4 0.7
WHI 6 2.3 6 2.2 12 2.2
WYT 1 0.4 2 0.7 3 0.6
a See Appendix 2, Table 26, for full NHS trust/hospital names.
DOI: 10.3310/hta24080 Health Technology Assessment 2020 Vol. 24 No. 8
© Queen’s Printer and Controller of HMSO 2020. This work was produced by Costa et al. under the terms of a commissioning contract issued by the Secretary of State forHealth and Social Care. This issue may be freely reproduced for the purposes of private research and study and extracts (or indeed, the full report) may be included inprofessional journals provided that suitable acknowledgement is made and the reproduction is not associated with any form of advertising. Applications for commercialreproduction should be addressed to: NIHR Journals Library, National Institute for Health Research, Evaluation, Trials and Studies Coordinating Centre, Alpha House,University of Southampton Science Park, Southampton SO16 7NS, UK.
25

TABLE 6 Descriptive characteristics of ITT population by treatment group at baseline
CharacteristicPlaster castgroup (N= 264)
Functional bracegroup (N= 274)
Overall(N= 538)
Sex, n (%)
Male 213 (80.7) 213 (77.7) 426 (79.2)
Female 51 (19.3) 61 (22.3) 112 (20.8)
Age (years), mean (SD) 49.0 (13.9) 48.3 (13.8) 48.7 (13.8)
Body mass index (kg/m2), mean (SD), n 27.5 (4.5), 255 27.8 (5), 265 27.7 (4.8), 520
Days since injury, median (IQR) 5.0 (2.5–8) 5.0 (2–8) 5.0 (2–8)
Mechanism of injury, n (%)
Fall from height 3 (1.2) 8 (3) 11 (2)
Fall on steps/stairs 22 (8.4) 14 (5.1) 36 (6.7)
Fall/trip from standing height 6 (2.4) 11 (3.9) 17 (3.2)
Sports 187 (70.8) 192 (70.2) 379 (70.4)
Walking 14 (5.4) 28 (10.2) 42 (7.8)
Other 14 (5.4) 6 (2.1) 20 (3.7)
Side of injury, n (%)
Right 122 (46.2) 138 (50.4) 260 (48.3)
Left 142 (53.7) 136 (49.5) 278 (51.7)
Regular smoker, n (%)
No 225 (85.2) 234 (85.5) 459 (85.2)
Yes 39 (14.7) 39 (14.1) 78 (14.4)
Missing 0 (0) 1 (0.3) 1 (0.2)
Cigarettes (per day), median (IQR), n 10.0 (5–15), 39 10.0 (5–15), 39 10.0 (5–15), 78
Smoking duration (years), median (IQR), n 20.0 (10–25), 38 20.5 (13–30), 38 20.0 (10–30), 76
Alcohol units (per week), n (%)
0–7 162 (61.5) 161 (58.8) 323 (60)
8–14 49 (18.6) 65 (23.7) 114 (21.3)
15–21 40 (15.3) 35 (12.9) 75 (13.8)
> 21 12 (4.5) 10 (3.6) 22 (4.2)
Missing 1 (0.3) 3 (1.2) 4 (0.6)
Taking the following medication, n (%)
Fluoroquinolone antibiotics 5 (1.9) 4 (1.5) 9 (1.7)
Steroids 7 (2.7) 14 (5.1) 21 (3.9)
DMARDs 2 (0.8) 1 (0.4) 3 (0.6)
Diabetic medication 5 (1.9) 14 (5.1) 19 (3.5)
Regular analgesia 23 (8.7) 14 (5.1) 37 (6.9)
Anticoagulant medication 66 (25) 78 (28.5) 144 (26.8)
Diagnosis prior to injury, n (%)
Diabetes mellitus 5 (1.9) 18 (6.6) 23 (4.3)
Rheumatoid arthritis 0 (0) 3 (1.1) 3 (0.6)
Lower limb fracture (last 12 months) 1 (0.4) 4 (1.5) 5 (0.9)
Ligament, tendon or nerve injury to lower limb(last 12 months)
5 (1.9) 8 (2.9) 13 (2.4)
CLINICAL TRIAL RESULTS
NIHR Journals Library www.journalslibrary.nihr.ac.uk
26
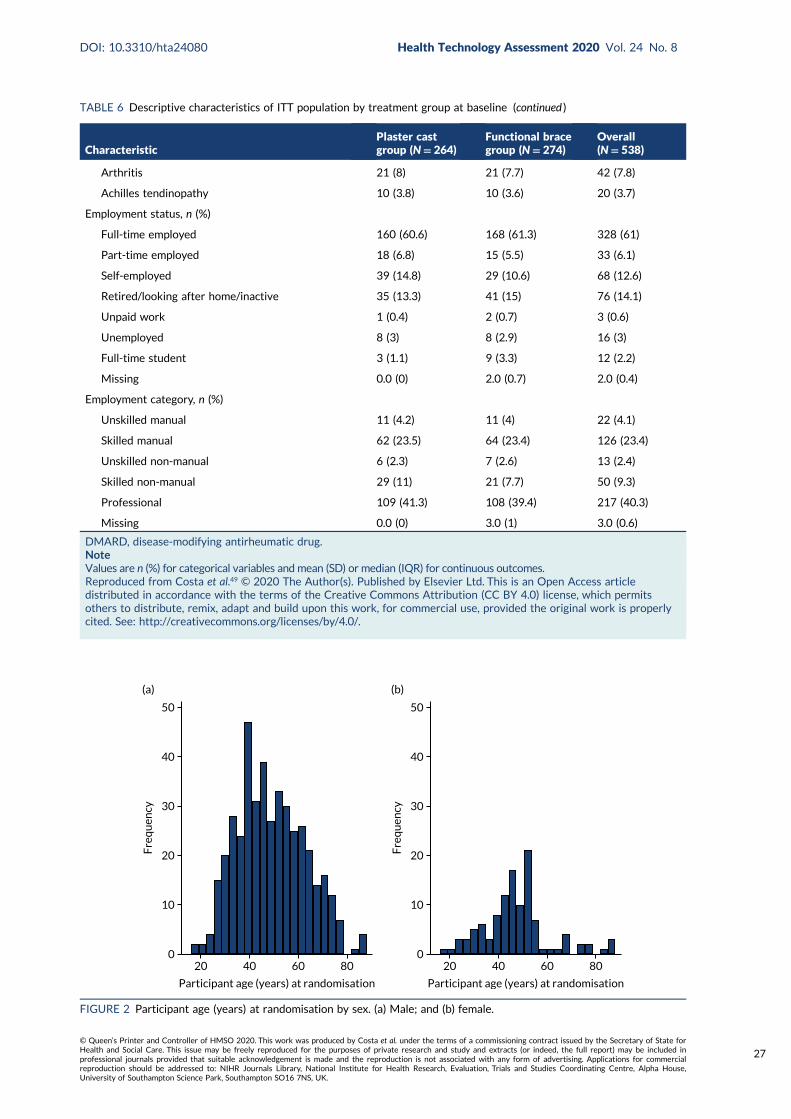
TABLE 6 Descriptive characteristics of ITT population by treatment group at baseline (continued )
CharacteristicPlaster castgroup (N= 264)
Functional bracegroup (N= 274)
Overall(N= 538)
Arthritis 21 (8) 21 (7.7) 42 (7.8)
Achilles tendinopathy 10 (3.8) 10 (3.6) 20 (3.7)
Employment status, n (%)
Full-time employed 160 (60.6) 168 (61.3) 328 (61)
Part-time employed 18 (6.8) 15 (5.5) 33 (6.1)
Self-employed 39 (14.8) 29 (10.6) 68 (12.6)
Retired/looking after home/inactive 35 (13.3) 41 (15) 76 (14.1)
Unpaid work 1 (0.4) 2 (0.7) 3 (0.6)
Unemployed 8 (3) 8 (2.9) 16 (3)
Full-time student 3 (1.1) 9 (3.3) 12 (2.2)
Missing 0.0 (0) 2.0 (0.7) 2.0 (0.4)
Employment category, n (%)
Unskilled manual 11 (4.2) 11 (4) 22 (4.1)
Skilled manual 62 (23.5) 64 (23.4) 126 (23.4)
Unskilled non-manual 6 (2.3) 7 (2.6) 13 (2.4)
Skilled non-manual 29 (11) 21 (7.7) 50 (9.3)
Professional 109 (41.3) 108 (39.4) 217 (40.3)
Missing 0.0 (0) 3.0 (1) 3.0 (0.6)
DMARD, disease-modifying antirheumatic drug.NoteValues are n (%) for categorical variables and mean (SD) or median (IQR) for continuous outcomes.Reproduced from Costa et al.49 © 2020 The Author(s). Published by Elsevier Ltd. This is an Open Access articledistributed in accordance with the terms of the Creative Commons Attribution (CC BY 4.0) license, which permitsothers to distribute, remix, adapt and build upon this work, for commercial use, provided the original work is properlycited. See: http://creativecommons.org/licenses/by/4.0/.
20 40 60 80
Fre
qu
ency
Participant age (years) at randomisation
0
10
20
30
40
50
(a)
20 40 60 80
Fre
qu
ency
Participant age (years) at randomisation
0
10
20
30
40
50
(b)
FIGURE 2 Participant age (years) at randomisation by sex. (a) Male; and (b) female.
DOI: 10.3310/hta24080 Health Technology Assessment 2020 Vol. 24 No. 8
© Queen’s Printer and Controller of HMSO 2020. This work was produced by Costa et al. under the terms of a commissioning contract issued by the Secretary of State forHealth and Social Care. This issue may be freely reproduced for the purposes of private research and study and extracts (or indeed, the full report) may be included inprofessional journals provided that suitable acknowledgement is made and the reproduction is not associated with any form of advertising. Applications for commercialreproduction should be addressed to: NIHR Journals Library, National Institute for Health Research, Evaluation, Trials and Studies Coordinating Centre, Alpha House,University of Southampton Science Park, Southampton SO16 7NS, UK.
27
Details of the treatment received following randomisation are listed in Table 9. There were 247(92.9%) participants in the plaster cast group and 269 (98.2%) who received their allocated treatmentimmediately at baseline. Those who did not receive the allocated treatment at baseline received theother treatment instead or withdrew. A further 35 participants (13.2%) in the plaster cast group and4 (1.5%) in the functional brace group changed from the treatment to which they were randomisedwithin the first 6 weeks and received the other treatment or surgery instead. The reasons why participantschanged from their allocated treatment are listed in Table 10 and include patient decision, clinician decision,medical resources unavailable, incorrect Achilles tendon rupture diagnosis, surgery and withdrawal.
TABLE 7 Patient-reported outcome measures by treatment group for ITT population at baseline
PROMaPlaster cast group(N= 264)
Functional bracegroup (N= 274) Overall (N= 538)
ATRS pre injury, median (IQR), n 100 (96.5–100), 264 100 (94–100), 273 100 (96–100), 537
EQ-5D VAS pre injury, median (IQR), n 90 (80–95), 263 90 (80–95), 273 90 (80–95), 536
EQ-5D VAS post injury, mean (SD), n 57.6 (21.1), 262 58.3 (21.5), 273 58.0 (21.3), 535
EQ-5D utility pre injury, median (IQR), n 1 (1–1), 262 1 (1–1), 273 1 (1–1), 535
EQ-5D utility post injury, mean (SD), n 0.2 (0.3), 262 0.3 (0.3), 273 0.3 (0.3), 535
a Two participants in the plaster cast group and one patient in the functional brace group did not provide baselineATRS and EQ-5D-5L outcomes.
TABLE 8 Number of participants compliant with treatment
Compliance with treatmenta
Plaster cast group (N= 266) Functional brace group (N= 274)
n % n %
≥ 6 weeks 212 79.7 265 96.7
≥ 4 weeks 223 83.8 268 97.8
≥ 2 weeks 240 90.2 268 97.8
a Compliance starts at randomisation. Each time point includes the period following the time point specified.
TABLE 9 Details of the intervention received by treatment group
Intervention
Plaster cast group (N= 266) Functional brace group (N= 274)
n % n %
Received allocated treatment at baseline 247 92.9 269 98.2
Changed treatment at baseline 19 7.1 5 1.8
Received the other treatment 17 6.4 4 1.5
Withdrew 1 0.4 1 0.4
Unknown 1 0.4 0 0.0
Changed treatment within 6 weeks,excluding changes at baseline
35 13.2 4 1.5
Received the other treatment 30 11.3 1 0.4
Received surgery 5 1.9 3 1.1
CLINICAL TRIAL RESULTS
NIHR Journals Library www.journalslibrary.nihr.ac.uk
28
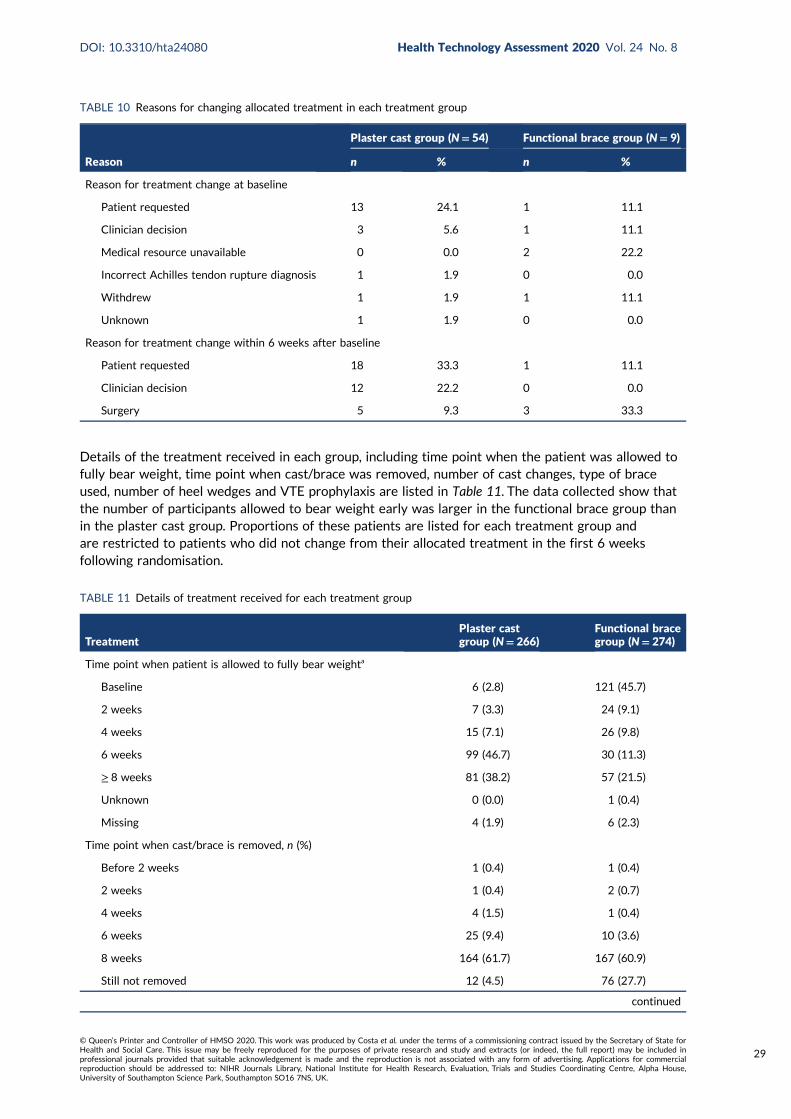
Details of the treatment received in each group, including time point when the patient was allowed tofully bear weight, time point when cast/brace was removed, number of cast changes, type of braceused, number of heel wedges and VTE prophylaxis are listed in Table 11. The data collected show thatthe number of participants allowed to bear weight early was larger in the functional brace group thanin the plaster cast group. Proportions of these patients are listed for each treatment group andare restricted to patients who did not change from their allocated treatment in the first 6 weeksfollowing randomisation.
TABLE 10 Reasons for changing allocated treatment in each treatment group
Reason
Plaster cast group (N= 54) Functional brace group (N= 9)
n % n %
Reason for treatment change at baseline
Patient requested 13 24.1 1 11.1
Clinician decision 3 5.6 1 11.1
Medical resource unavailable 0 0.0 2 22.2
Incorrect Achilles tendon rupture diagnosis 1 1.9 0 0.0
Withdrew 1 1.9 1 11.1
Unknown 1 1.9 0 0.0
Reason for treatment change within 6 weeks after baseline
Patient requested 18 33.3 1 11.1
Clinician decision 12 22.2 0 0.0
Surgery 5 9.3 3 33.3
TABLE 11 Details of treatment received for each treatment group
TreatmentPlaster castgroup (N= 266)
Functional bracegroup (N= 274)
Time point when patient is allowed to fully bear weighta
Baseline 6 (2.8) 121 (45.7)
2 weeks 7 (3.3) 24 (9.1)
4 weeks 15 (7.1) 26 (9.8)
6 weeks 99 (46.7) 30 (11.3)
≥ 8 weeks 81 (38.2) 57 (21.5)
Unknown 0 (0.0) 1 (0.4)
Missing 4 (1.9) 6 (2.3)
Time point when cast/brace is removed, n (%)
Before 2 weeks 1 (0.4) 1 (0.4)
2 weeks 1 (0.4) 2 (0.7)
4 weeks 4 (1.5) 1 (0.4)
6 weeks 25 (9.4) 10 (3.6)
8 weeks 164 (61.7) 167 (60.9)
Still not removed 12 (4.5) 76 (27.7)
continued
DOI: 10.3310/hta24080 Health Technology Assessment 2020 Vol. 24 No. 8
© Queen’s Printer and Controller of HMSO 2020. This work was produced by Costa et al. under the terms of a commissioning contract issued by the Secretary of State forHealth and Social Care. This issue may be freely reproduced for the purposes of private research and study and extracts (or indeed, the full report) may be included inprofessional journals provided that suitable acknowledgement is made and the reproduction is not associated with any form of advertising. Applications for commercialreproduction should be addressed to: NIHR Journals Library, National Institute for Health Research, Evaluation, Trials and Studies Coordinating Centre, Alpha House,University of Southampton Science Park, Southampton SO16 7NS, UK.
29
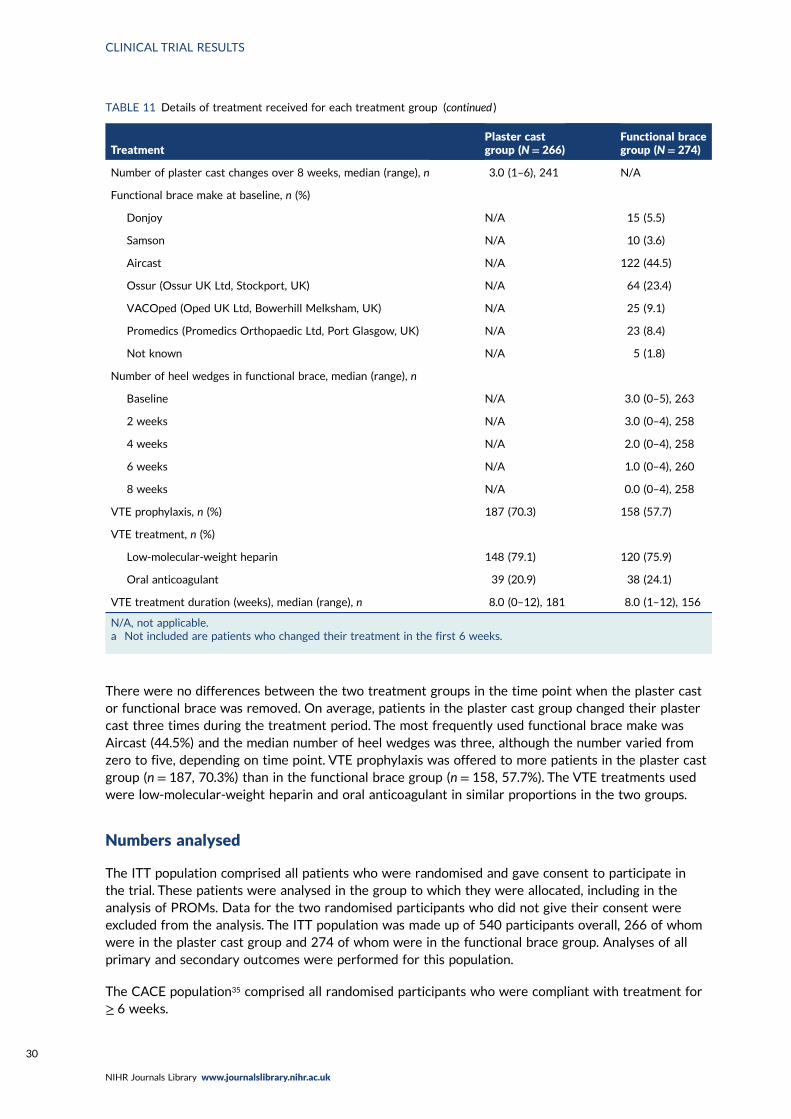
There were no differences between the two treatment groups in the time point when the plaster castor functional brace was removed. On average, patients in the plaster cast group changed their plastercast three times during the treatment period. The most frequently used functional brace make wasAircast (44.5%) and the median number of heel wedges was three, although the number varied fromzero to five, depending on time point. VTE prophylaxis was offered to more patients in the plaster castgroup (n = 187, 70.3%) than in the functional brace group (n = 158, 57.7%). The VTE treatments usedwere low-molecular-weight heparin and oral anticoagulant in similar proportions in the two groups.
Numbers analysed
The ITT population comprised all patients who were randomised and gave consent to participate inthe trial. These patients were analysed in the group to which they were allocated, including in theanalysis of PROMs. Data for the two randomised participants who did not give their consent wereexcluded from the analysis. The ITT population was made up of 540 participants overall, 266 of whomwere in the plaster cast group and 274 of whom were in the functional brace group. Analyses of allprimary and secondary outcomes were performed for this population.
The CACE population35 comprised all randomised participants who were compliant with treatment for≥ 6 weeks.
TABLE 11 Details of treatment received for each treatment group (continued )
TreatmentPlaster castgroup (N= 266)
Functional bracegroup (N= 274)
Number of plaster cast changes over 8 weeks, median (range), n 3.0 (1–6), 241 N/A
Functional brace make at baseline, n (%)
Donjoy N/A 15 (5.5)
Samson N/A 10 (3.6)
Aircast N/A 122 (44.5)
Ossur (Ossur UK Ltd, Stockport, UK) N/A 64 (23.4)
VACOped (Oped UK Ltd, Bowerhill Melksham, UK) N/A 25 (9.1)
Promedics (Promedics Orthopaedic Ltd, Port Glasgow, UK) N/A 23 (8.4)
Not known N/A 5 (1.8)
Number of heel wedges in functional brace, median (range), n
Baseline N/A 3.0 (0–5), 263
2 weeks N/A 3.0 (0–4), 258
4 weeks N/A 2.0 (0–4), 258
6 weeks N/A 1.0 (0–4), 260
8 weeks N/A 0.0 (0–4), 258
VTE prophylaxis, n (%) 187 (70.3) 158 (57.7)
VTE treatment, n (%)
Low-molecular-weight heparin 148 (79.1) 120 (75.9)
Oral anticoagulant 39 (20.9) 38 (24.1)
VTE treatment duration (weeks), median (range), n 8.0 (0–12), 181 8.0 (1–12), 156
N/A, not applicable.a Not included are patients who changed their treatment in the first 6 weeks.
CLINICAL TRIAL RESULTS
NIHR Journals Library www.journalslibrary.nihr.ac.uk
30

Withdrawals
Table 12 provides the available data at each follow-up time point, including the number of CRFs andPROs and the number of participants who withdrew or died, according to treatment group. There was agood completion rate of CRFs and PROs across both treatment groups throughout the study period.In total, 10 patients withdrew (seven from the plaster cast group and three from the functional bracegroup). There were two deaths, both in the functional brace group. Reasons for withdrawal are listed inTable 13; these include clinician decision, patient decision and private treatment.
Analyses to address primary outcome
The primary outcome in this study is the ATRS measured at 9 months post injury, as described in thestatistical analysis plan.
TABLE 12 Available data at each follow-up time point
Time point
Plaster cast group (N= 266) Functional brace group (N= 274) Total (N= 540)
n % n % n %
8 weeks
CRF completed 264 99.2 273 99.6 537 99.4
PRO completed 234 88.0 241 88.0 475 88.0
Withdrawna 6 2.3 2 0.7 8 1.5
Died 0 0.0 1 0.4 1 0.2
CRF not completed 1 0.4 0 0.0 1 0.2
PRO not completed 26 9.8 30 10.9 56 10.4
3 months
PRO completed 229 86.1 245 89.4 474 87.8
Withdrawna 7 2.6 3 1.1 10 1.9
Died 0 0.0 1 0.4 1 0.2
PRO not completed 30 11.3 25 9.1 55 10.2
6 months
PRO completed 225 84.6 238 86.9 463 85.7
Withdrawna 7 2.6 3 1.1 10 1.9
Died 0 0.0 2 0.7 2 0.4
PRO not completed 34 12.8 31 11.3 65 12.0
9 months
PRO completed 244 91.7 260 94.9 504 93.3
Withdrawna 7 2.6 3 1.1 10 1.9
Died 0 0.0 2 0.7 2 0.4
PRO not completed 15 5.6 9 3.3 24 4.4
a Withdrawn participants and participants who died are reported cumulatively and include the two participants whowithdrew before receiving their treatment at baseline (see Figure 1).
DOI: 10.3310/hta24080 Health Technology Assessment 2020 Vol. 24 No. 8
© Queen’s Printer and Controller of HMSO 2020. This work was produced by Costa et al. under the terms of a commissioning contract issued by the Secretary of State forHealth and Social Care. This issue may be freely reproduced for the purposes of private research and study and extracts (or indeed, the full report) may be included inprofessional journals provided that suitable acknowledgement is made and the reproduction is not associated with any form of advertising. Applications for commercialreproduction should be addressed to: NIHR Journals Library, National Institute for Health Research, Evaluation, Trials and Studies Coordinating Centre, Alpha House,University of Southampton Science Park, Southampton SO16 7NS, UK.
31
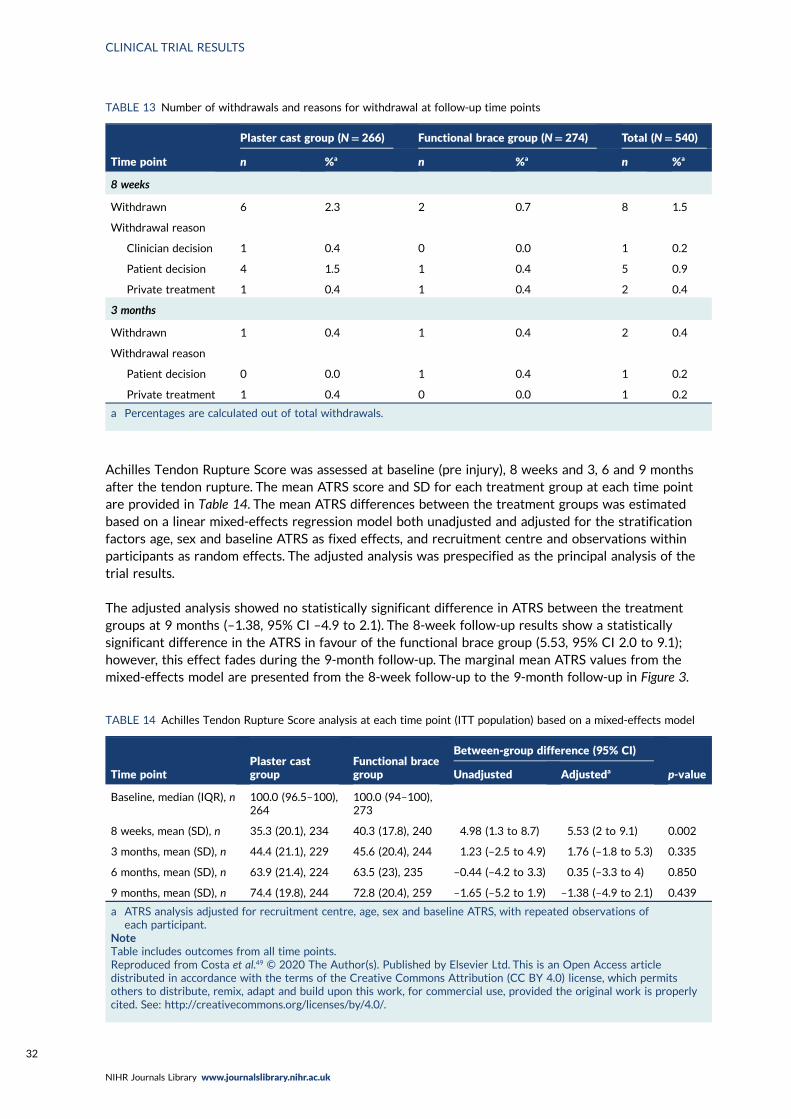
Achilles Tendon Rupture Score was assessed at baseline (pre injury), 8 weeks and 3, 6 and 9 monthsafter the tendon rupture. The mean ATRS score and SD for each treatment group at each time pointare provided in Table 14. The mean ATRS differences between the treatment groups was estimatedbased on a linear mixed-effects regression model both unadjusted and adjusted for the stratificationfactors age, sex and baseline ATRS as fixed effects, and recruitment centre and observations withinparticipants as random effects. The adjusted analysis was prespecified as the principal analysis of thetrial results.
The adjusted analysis showed no statistically significant difference in ATRS between the treatmentgroups at 9 months (–1.38, 95% CI –4.9 to 2.1). The 8-week follow-up results show a statisticallysignificant difference in the ATRS in favour of the functional brace group (5.53, 95% CI 2.0 to 9.1);however, this effect fades during the 9-month follow-up. The marginal mean ATRS values from themixed-effects model are presented from the 8-week follow-up to the 9-month follow-up in Figure 3.
TABLE 13 Number of withdrawals and reasons for withdrawal at follow-up time points
Time point
Plaster cast group (N= 266) Functional brace group (N= 274) Total (N= 540)
n %a n %a n %a
8 weeks
Withdrawn 6 2.3 2 0.7 8 1.5
Withdrawal reason
Clinician decision 1 0.4 0 0.0 1 0.2
Patient decision 4 1.5 1 0.4 5 0.9
Private treatment 1 0.4 1 0.4 2 0.4
3 months
Withdrawn 1 0.4 1 0.4 2 0.4
Withdrawal reason
Patient decision 0 0.0 1 0.4 1 0.2
Private treatment 1 0.4 0 0.0 1 0.2
a Percentages are calculated out of total withdrawals.
TABLE 14 Achilles Tendon Rupture Score analysis at each time point (ITT population) based on a mixed-effects model
Time pointPlaster castgroup
Functional bracegroup
Between-group difference (95% CI)
p-valueUnadjusted Adjusteda
Baseline, median (IQR), n 100.0 (96.5–100),264
100.0 (94–100),273
8 weeks, mean (SD), n 35.3 (20.1), 234 40.3 (17.8), 240 4.98 (1.3 to 8.7) 5.53 (2 to 9.1) 0.002
3 months, mean (SD), n 44.4 (21.1), 229 45.6 (20.4), 244 1.23 (–2.5 to 4.9) 1.76 (–1.8 to 5.3) 0.335
6 months, mean (SD), n 63.9 (21.4), 224 63.5 (23), 235 –0.44 (–4.2 to 3.3) 0.35 (–3.3 to 4) 0.850
9 months, mean (SD), n 74.4 (19.8), 244 72.8 (20.4), 259 –1.65 (–5.2 to 1.9) –1.38 (–4.9 to 2.1) 0.439
a ATRS analysis adjusted for recruitment centre, age, sex and baseline ATRS, with repeated observations ofeach participant.
NoteTable includes outcomes from all time points.Reproduced from Costa et al.49 © 2020 The Author(s). Published by Elsevier Ltd. This is an Open Access articledistributed in accordance with the terms of the Creative Commons Attribution (CC BY 4.0) license, which permitsothers to distribute, remix, adapt and build upon this work, for commercial use, provided the original work is properlycited. See: http://creativecommons.org/licenses/by/4.0/.
CLINICAL TRIAL RESULTS
NIHR Journals Library www.journalslibrary.nihr.ac.uk
32
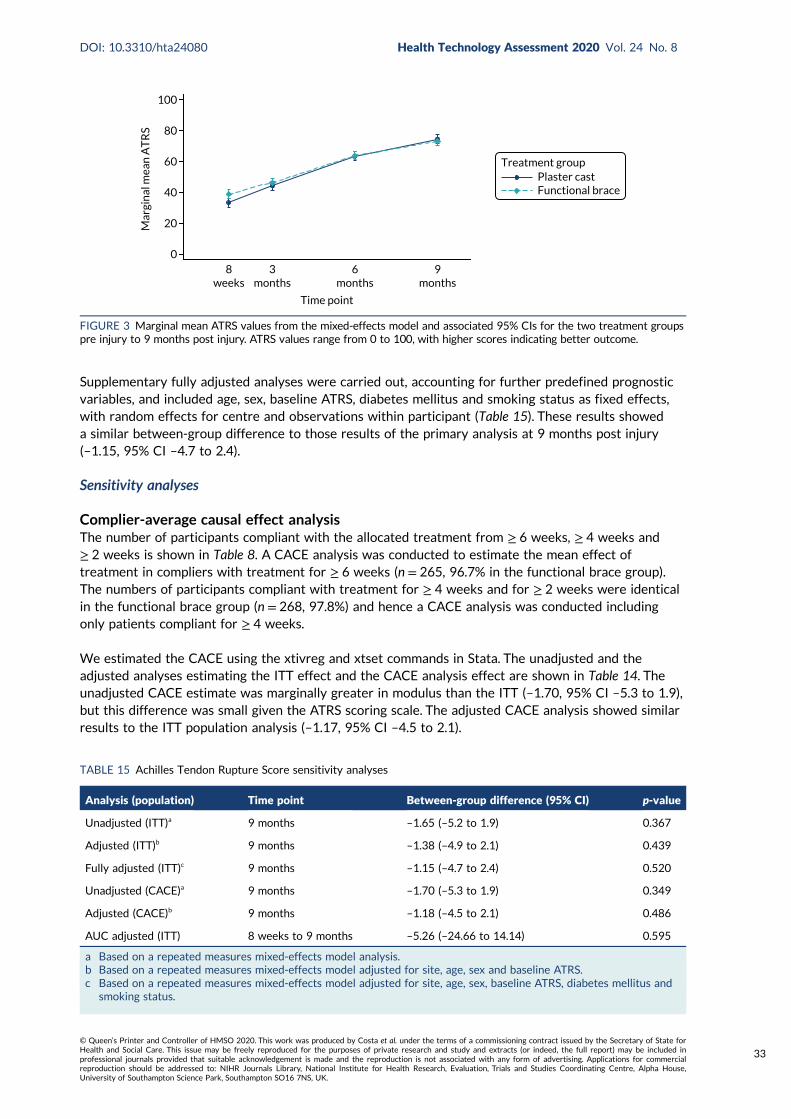
Supplementary fully adjusted analyses were carried out, accounting for further predefined prognosticvariables, and included age, sex, baseline ATRS, diabetes mellitus and smoking status as fixed effects,with random effects for centre and observations within participant (Table 15). These results showeda similar between-group difference to those results of the primary analysis at 9 months post injury(–1.15, 95% CI –4.7 to 2.4).
Sensitivity analyses
Complier-average causal effect analysisThe number of participants compliant with the allocated treatment from ≥ 6 weeks, ≥ 4 weeks and≥ 2 weeks is shown in Table 8. A CACE analysis was conducted to estimate the mean effect oftreatment in compliers with treatment for ≥ 6 weeks (n = 265, 96.7% in the functional brace group).The numbers of participants compliant with treatment for ≥ 4 weeks and for ≥ 2 weeks were identicalin the functional brace group (n = 268, 97.8%) and hence a CACE analysis was conducted includingonly patients compliant for ≥ 4 weeks.
We estimated the CACE using the xtivreg and xtset commands in Stata. The unadjusted and theadjusted analyses estimating the ITT effect and the CACE analysis effect are shown in Table 14. Theunadjusted CACE estimate was marginally greater in modulus than the ITT (–1.70, 95% CI –5.3 to 1.9),but this difference was small given the ATRS scoring scale. The adjusted CACE analysis showed similarresults to the ITT population analysis (–1.17, 95% CI –4.5 to 2.1).
Mar
gin
al m
ean
AT
RS
8weeks
3months
6months
Time point
9months
Plaster castTreatment group
Functional brace
100
80
60
40
20
0
FIGURE 3 Marginal mean ATRS values from the mixed-effects model and associated 95% CIs for the two treatment groupspre injury to 9 months post injury. ATRS values range from 0 to 100, with higher scores indicating better outcome.
TABLE 15 Achilles Tendon Rupture Score sensitivity analyses
Analysis (population) Time point Between-group difference (95% CI) p-value
Unadjusted (ITT)a 9 months –1.65 (–5.2 to 1.9) 0.367
Adjusted (ITT)b 9 months –1.38 (–4.9 to 2.1) 0.439
Fully adjusted (ITT)c 9 months –1.15 (–4.7 to 2.4) 0.520
Unadjusted (CACE)a 9 months –1.70 (–5.3 to 1.9) 0.349
Adjusted (CACE)b 9 months –1.18 (–4.5 to 2.1) 0.486
AUC adjusted (ITT) 8 weeks to 9 months –5.26 (–24.66 to 14.14) 0.595
a Based on a repeated measures mixed-effects model analysis.b Based on a repeated measures mixed-effects model adjusted for site, age, sex and baseline ATRS.c Based on a repeated measures mixed-effects model adjusted for site, age, sex, baseline ATRS, diabetes mellitus and
smoking status.
DOI: 10.3310/hta24080 Health Technology Assessment 2020 Vol. 24 No. 8
© Queen’s Printer and Controller of HMSO 2020. This work was produced by Costa et al. under the terms of a commissioning contract issued by the Secretary of State forHealth and Social Care. This issue may be freely reproduced for the purposes of private research and study and extracts (or indeed, the full report) may be included inprofessional journals provided that suitable acknowledgement is made and the reproduction is not associated with any form of advertising. Applications for commercialreproduction should be addressed to: NIHR Journals Library, National Institute for Health Research, Evaluation, Trials and Studies Coordinating Centre, Alpha House,University of Southampton Science Park, Southampton SO16 7NS, UK.
33

Area under the curveParameter estimates from the mixed-effects models were used to calculate the AUC from the 8-weekfollow-up to the 9-month follow-up for a male participant of a mean age of 48.65 years. Results showingan overall estimate of recovery over time and a t-test comparison of the two treatment groups arepresented in Table 15. Higher AUCs indicate better overall functionality. The functional brace groupshowed a better overall functionality than the plaster cast group; however, the difference (–5.26, 95% CI–24.66 to 14.14) was not statistically significant.
Prespecified subgroup analysisThere were no prespecified subgroups and therefore no subgroup analyses were conducted.
Analyses to address secondary outcomes
The secondary outcomes collected and analysed in the UKSTAR were EQ-5D-5L and complicationsevaluated at 8 weeks and 3, 6 and 9 months after the injury.
EuroQol-5 Dimensions, five-level versionThe EQ-5D-5L was analysed as a continuous outcome using the utility score values from the five-levelquestions and based on the reported EQ-5D VAS. Summary results for the EQ-5D utility score and EQ-5DVAS are reported for each treatment group at each time point in Table 16, together with the unadjusted
TABLE 16 EuroQol-5 Dimensions utility and EQ-5D VAS mixed-effects model results at 8 weeks and at 3, 6 and 9 monthspost injury (ITT population)
EQ-5DPlaster cast group(N= 266)
Functional bracegroup (N= 274)
Between-group difference (95% CI)
p-valueUnadjusted Adjusteda
EQ-5D utility
Baseline postinjury, median(IQR), n
0.242 (0.02–0.47), 264 0.282 (0.03–0.52), 273 0.042(0.01 to 0.08)
0.041(0.01 to 0.07)
0.017
8 weeks,mean (SD), n
0.588 (0.23), 234 0.7 (0.18), 241 0.066(0.03 to 0.1)
0.069(0.03 to 0.1)
0.000
3 months,mean (SD), n
0.638 (0.22), 229 0.669 (0.19), 245 0.031(–0.01 to 0.07)
0.035(0.0 to 0.07)
0.056
6 months,mean (SD), n
0.766 (0.15), 224 0.757 (0.18), 237 –0.009(–0.05 to 0.03)
–0.002(–0.04 to 0.03)
0.916
9 months,median (IQR), n
0.829 (0.72–0.91), 244 0.795 (0.72–0.88), 259 –0.010(–0.05 to 0.03)
–0.009(–0.04 to 0.03)
0.623
EQ-5D VAS, median (IQR), n
Baseline postinjury
90.0 (80–95), 263 90.0 (80–95), 273 0.77(–2.18 to 3.72)
1.28(–1.4 to 3.97)
0.349
8 weeks 75.0 (60–85), 234 75.0 (65–85), 240 1.08(–2.05 to 4.2)
1.61(–1.21 to 4.43)
0.264
3 months 80.0 (65–85), 229 80.0 (65–90), 245 1.29(–1.84 to 4.42)
1.66(–1.16 to 4.48)
0.249
6 months 81.5 (70–90), 224 80.0 (70–90), 236 0.49(–2.69 to 3.66)
1.08(–1.77 to 3.93)
0.458
9 months 86.0 (80–92), 242 85.0 (75–91), 259 –0.76(–3.8 to 2.28)
–0.56(–3.32 to 2.2)
0.693
a Analysis adjusted for site, age, sex and EQ-5D baseline pre injury, with repeated observations for each participant.Reproduced from Costa et al.49 © 2020 The Author(s). Published by Elsevier Ltd. This is an Open Access articledistributed in accordance with the terms of the Creative Commons Attribution (CC BY 4.0) license, which permitsothers to distribute, remix, adapt and build upon this work, for commercial use, provided the original work is properlycited. See: http://creativecommons.org/licenses/by/4.0/.
CLINICAL TRIAL RESULTS
NIHR Journals Library www.journalslibrary.nihr.ac.uk
34
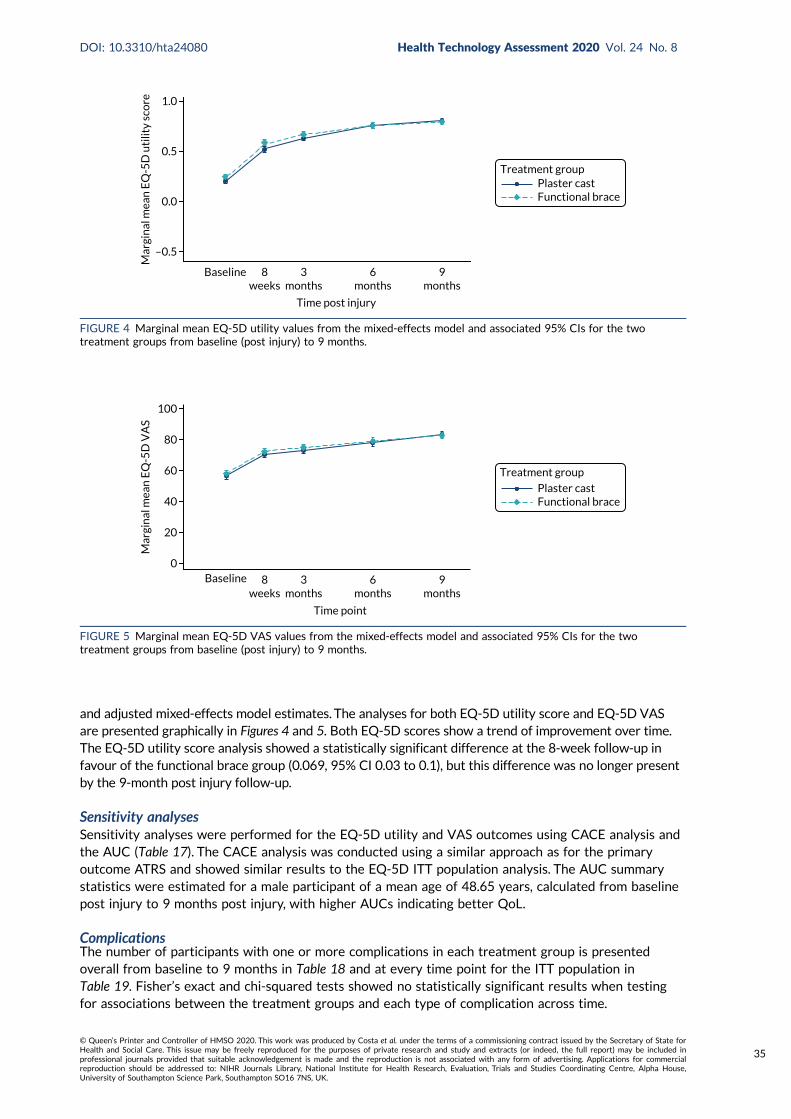
and adjusted mixed-effects model estimates. The analyses for both EQ-5D utility score and EQ-5D VASare presented graphically in Figures 4 and 5. Both EQ-5D scores show a trend of improvement over time.The EQ-5D utility score analysis showed a statistically significant difference at the 8-week follow-up infavour of the functional brace group (0.069, 95% CI 0.03 to 0.1), but this difference was no longer presentby the 9-month post injury follow-up.
Sensitivity analysesSensitivity analyses were performed for the EQ-5D utility and VAS outcomes using CACE analysis andthe AUC (Table 17). The CACE analysis was conducted using a similar approach as for the primaryoutcome ATRS and showed similar results to the EQ-5D ITT population analysis. The AUC summarystatistics were estimated for a male participant of a mean age of 48.65 years, calculated from baselinepost injury to 9 months post injury, with higher AUCs indicating better QoL.
ComplicationsThe number of participants with one or more complications in each treatment group is presentedoverall from baseline to 9 months in Table 18 and at every time point for the ITT population inTable 19. Fisher’s exact and chi-squared tests showed no statistically significant results when testingfor associations between the treatment groups and each type of complication across time.
Baseline
Time point
Mar
gin
al m
ean
EQ
-5D
VA
S
8weeks
3months
6months
9months
100
60
80
40
20
0
Plaster castFunctional brace
Treatment group
FIGURE 5 Marginal mean EQ-5D VAS values from the mixed-effects model and associated 95% CIs for the twotreatment groups from baseline (post injury) to 9 months.
Baseline
Mar
gin
al m
ean
EQ
-5D
uti
lity
sco
re
8weeks
3months
6months
Time post injury
9months
1.0
0.5
0.0
–0.5
Plaster castFunctional brace
Treatment group
FIGURE 4 Marginal mean EQ-5D utility values from the mixed-effects model and associated 95% CIs for the twotreatment groups from baseline (post injury) to 9 months.
DOI: 10.3310/hta24080 Health Technology Assessment 2020 Vol. 24 No. 8
© Queen’s Printer and Controller of HMSO 2020. This work was produced by Costa et al. under the terms of a commissioning contract issued by the Secretary of State forHealth and Social Care. This issue may be freely reproduced for the purposes of private research and study and extracts (or indeed, the full report) may be included inprofessional journals provided that suitable acknowledgement is made and the reproduction is not associated with any form of advertising. Applications for commercialreproduction should be addressed to: NIHR Journals Library, National Institute for Health Research, Evaluation, Trials and Studies Coordinating Centre, Alpha House,University of Southampton Science Park, Southampton SO16 7NS, UK.
35

TABLE 18 Analysis of secondary outcome complications from baseline to 9 months (ITT population)
Complication
Plaster cast group (N= 266) Functional brace group (N= 274)
p-valuena % na %
Tendon re-rupture 17 6.4 13 4.7 0.404
DVT 3 1.1 6 2.2 0.505
PE 0 0.0 2 0.7 0.499
Fall: no injury 60 22.6 53 19.3 0.359
Fall: injury sustained 21 7.9 24 8.8 0.716
Pain under the heel 158 59.4 180 65.7 0.131
Numbness around the foot 108 40.6 130 47.4 0.109
Pressure sores 39 14.0 51 18.6 0.218
a Numbers shown are complications reported at least once per participant.Reproduced from Costa et al.49 © 2020 The Author(s). Published by Elsevier Ltd. This is an Open Access articledistributed in accordance with the terms of the Creative Commons Attribution (CC BY 4.0) license, which permitsothers to distribute, remix, adapt and build upon this work, for commercial use, provided the original work is properlycited. See: http://creativecommons.org/licenses/by/4.0/.
TABLE 17 EuroQol-5 Dimensions, five-level version, sensitivity analyses
Analysis (population) Time point Between-group difference (95% CI) p-value
EQ-5D utility
Adjusted (ITT)a 9 months –0.009 (–0.04 to 0.03) 0.623
Adjusted (CACE)a 9 months –0.008 (–0.03 to 0.02) 0.502
AUC adjusted (ITT)a,b 8 weeks to 9 months –0.20 (–0.4 to 0.01) 0.056
EQ-5D VAS
Adjusted (ITT)a 9 months –0.56 (–3.3 to 2.2) 0.693
Adjusted (CACE)a 9 months –0.53 (–2.7 to 1.7) 0.637
AUC adjusted (ITT)a,b 8 weeks to 9 months –9.42 (–26.9 to 8.1) 0.292
a Based on a repeated measures mixed-effects model adjusted for site, age, sex and baseline ATRS.b AUC: higher AUC indicates better overall QoL.
TABLE 19 Complications recorded at the 8-week and 3-, 6- and 9-month follow-ups (ITT population)
Complication
Plaster cast group (N= 266) Functional brace group (N= 274)
n % n %
8 weeks
Tendon re-rupture 3 1.1 3 1.1
DVT 2 0.8 6 2.2
PE 0 0.0 2 0.7
Fall: no injury 26 9.8 12 4.4
Fall: injury 3 1.1 6 2.2
Pain under the heel 33 12.4 48 17.5
Numbness around the foot 24 9.0 32 11.7
Pressure sores 9 3.4 9 3.3
Skin condition requiring medication 0 0.0 4 1.5
Surgery related to Achilles rupture 0 0.0 3 1.1
Fractured toe 1 0.4 0 0.0
CLINICAL TRIAL RESULTS
NIHR Journals Library www.journalslibrary.nihr.ac.uk
36

Ancillary analyses
Following a presentation of the preliminary results, the TSC wanted to explore where the apparentdifferences at 8 weeks in EQ-5D utility score came from. The individual domains of the EQ-5D wereexplored using box plots in Figures 18–21 (see Appendix 3). The median score is marked with a triangle,whiskers are IQRs and the individual dots and crosses mark the outliers. The differences at 8 weeksappear to lie in the ability to self-care and usual activities only. Furthermore, in keeping with thehealth economics analysis plan, the distribution of the responses to the EQ-5D-5L questionnaires bytreatment group and assessment point is presented in Appendix 4. That analysis showed no significantdifferences in the proportions of individuals reporting suboptimal health [i.e. any functional (belowlevel 1) impairment] within dimensions between the two treatment groups at each time point.
TABLE 19 Complications recorded at the 8-week and 3-, 6- and 9-month follow-ups (ITT population) (continued )
Complication
Plaster cast group (N= 266) Functional brace group (N= 274)
n % n %
3 months
Tendon re-rupture 8 3.0 4 1.5
DVT 2 0.8 1 0.4
PE 0 0.0 2 0.7
Fall 20 7.5 15 5.5
Fall: injury 7 2.6 9 3.3
Pain under the heel 125 47.0 137 50.0
Numbness around the foot 59 22.2 79 28.8
Pressure sores 23 8.6 35 12.8
6 months
Tendon re-rupture 6 2.3 6 2.2
DVT 0 0.0 0 0.0
PE 0 0.0 2 0.7
Fall: no injury 19 7.1 23 8.4
Fall: injury 6 2.3 11 4.0
Pain under the heel 78 29.3 82 29.9
Numbness around the foot 54 20.3 66 24.1
Pressure sores 9 3.4 15 5.5
9 months
Tendon re-rupture 0 0.0 0 0.0
DVT 0 0.0 0 0.0
PE 0 0.0 0 0.0
Fall: no injury 16 6.0 11 4.0
Fall: injury 10 3.8 5 1.8
Pain under the heel 48 18.0 66 24.1
Numbness around the foot 51 19.2 50 18.2
Pressure sores 2 0.8 8 2.9
DOI: 10.3310/hta24080 Health Technology Assessment 2020 Vol. 24 No. 8
© Queen’s Printer and Controller of HMSO 2020. This work was produced by Costa et al. under the terms of a commissioning contract issued by the Secretary of State forHealth and Social Care. This issue may be freely reproduced for the purposes of private research and study and extracts (or indeed, the full report) may be included inprofessional journals provided that suitable acknowledgement is made and the reproduction is not associated with any form of advertising. Applications for commercialreproduction should be addressed to: NIHR Journals Library, National Institute for Health Research, Evaluation, Trials and Studies Coordinating Centre, Alpha House,University of Southampton Science Park, Southampton SO16 7NS, UK.
37
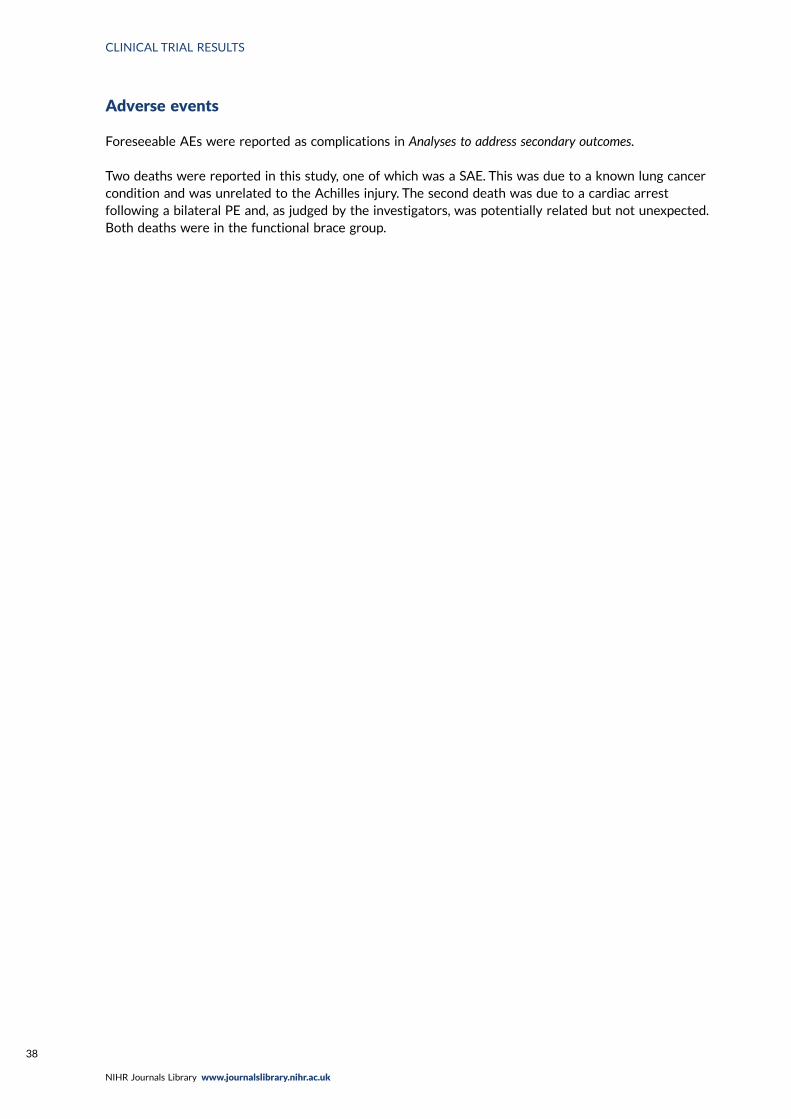
Adverse events
Foreseeable AEs were reported as complications in Analyses to address secondary outcomes.
Two deaths were reported in this study, one of which was a SAE. This was due to a known lung cancercondition and was unrelated to the Achilles injury. The second death was due to a cardiac arrestfollowing a bilateral PE and, as judged by the investigators, was potentially related but not unexpected.Both deaths were in the functional brace group.
CLINICAL TRIAL RESULTS
NIHR Journals Library www.journalslibrary.nihr.ac.uk
38
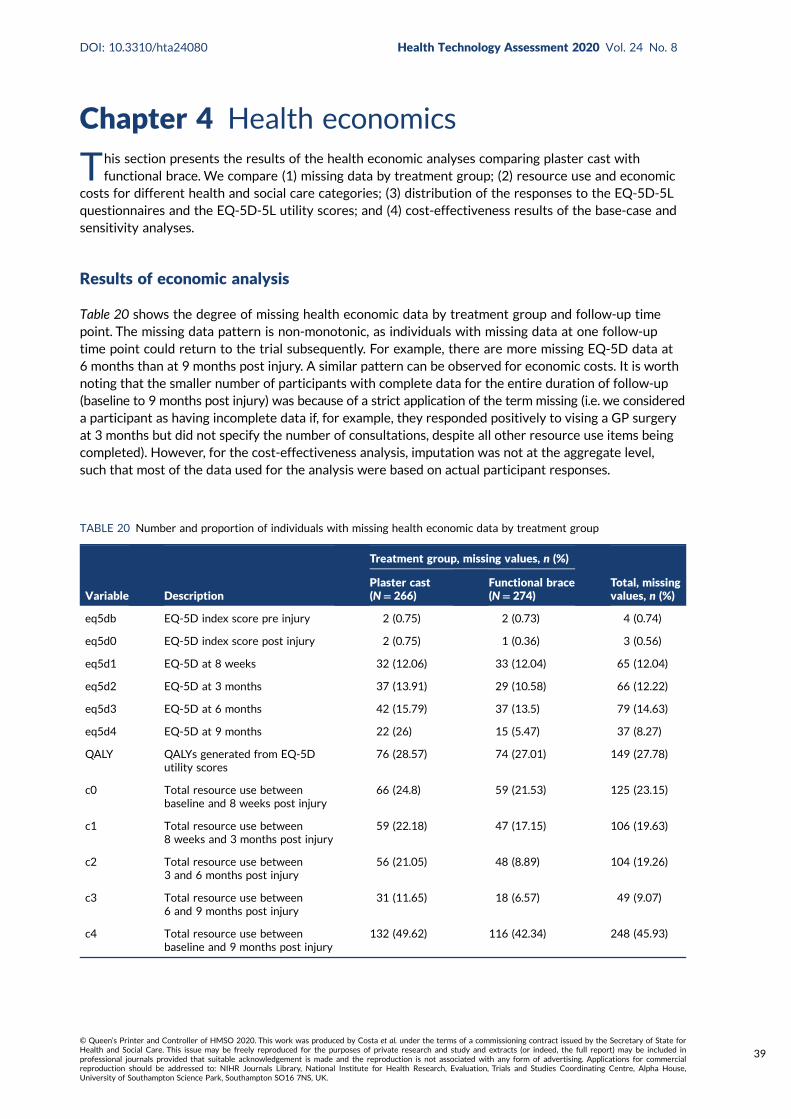
Chapter 4 Health economics
This section presents the results of the health economic analyses comparing plaster cast withfunctional brace. We compare (1) missing data by treatment group; (2) resource use and economic
costs for different health and social care categories; (3) distribution of the responses to the EQ-5D-5Lquestionnaires and the EQ-5D-5L utility scores; and (4) cost-effectiveness results of the base-case andsensitivity analyses.
Results of economic analysis
Table 20 shows the degree of missing health economic data by treatment group and follow-up timepoint. The missing data pattern is non-monotonic, as individuals with missing data at one follow-uptime point could return to the trial subsequently. For example, there are more missing EQ-5D data at6 months than at 9 months post injury. A similar pattern can be observed for economic costs. It is worthnoting that the smaller number of participants with complete data for the entire duration of follow-up(baseline to 9 months post injury) was because of a strict application of the term missing (i.e. we considereda participant as having incomplete data if, for example, they responded positively to vising a GP surgeryat 3 months but did not specify the number of consultations, despite all other resource use items beingcompleted). However, for the cost-effectiveness analysis, imputation was not at the aggregate level,such that most of the data used for the analysis were based on actual participant responses.
TABLE 20 Number and proportion of individuals with missing health economic data by treatment group
Variable Description
Treatment group, missing values, n (%)
Total, missingvalues, n (%)
Plaster cast(N= 266)
Functional brace(N= 274)
eq5db EQ-5D index score pre injury 2 (0.75) 2 (0.73) 4 (0.74)
eq5d0 EQ-5D index score post injury 2 (0.75) 1 (0.36) 3 (0.56)
eq5d1 EQ-5D at 8 weeks 32 (12.06) 33 (12.04) 65 (12.04)
eq5d2 EQ-5D at 3 months 37 (13.91) 29 (10.58) 66 (12.22)
eq5d3 EQ-5D at 6 months 42 (15.79) 37 (13.5) 79 (14.63)
eq5d4 EQ-5D at 9 months 22 (26) 15 (5.47) 37 (8.27)
QALY QALYs generated from EQ-5Dutility scores
76 (28.57) 74 (27.01) 149 (27.78)
c0 Total resource use betweenbaseline and 8 weeks post injury
66 (24.8) 59 (21.53) 125 (23.15)
c1 Total resource use between8 weeks and 3 months post injury
59 (22.18) 47 (17.15) 106 (19.63)
c2 Total resource use between3 and 6 months post injury
56 (21.05) 48 (8.89) 104 (19.26)
c3 Total resource use between6 and 9 months post injury
31 (11.65) 18 (6.57) 49 (9.07)
c4 Total resource use betweenbaseline and 9 months post injury
132 (49.62) 116 (42.34) 248 (45.93)
DOI: 10.3310/hta24080 Health Technology Assessment 2020 Vol. 24 No. 8
© Queen’s Printer and Controller of HMSO 2020. This work was produced by Costa et al. under the terms of a commissioning contract issued by the Secretary of State forHealth and Social Care. This issue may be freely reproduced for the purposes of private research and study and extracts (or indeed, the full report) may be included inprofessional journals provided that suitable acknowledgement is made and the reproduction is not associated with any form of advertising. Applications for commercialreproduction should be addressed to: NIHR Journals Library, National Institute for Health Research, Evaluation, Trials and Studies Coordinating Centre, Alpha House,University of Southampton Science Park, Southampton SO16 7NS, UK.
39
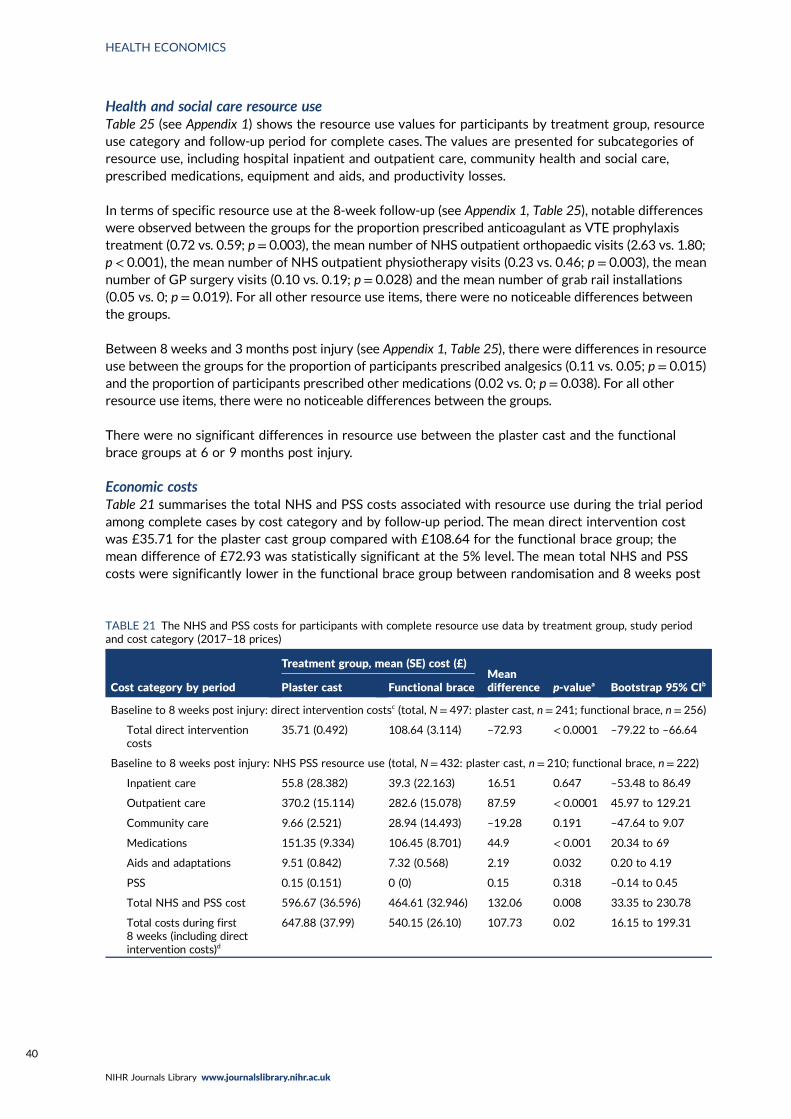
Health and social care resource useTable 25 (see Appendix 1) shows the resource use values for participants by treatment group, resourceuse category and follow-up period for complete cases. The values are presented for subcategories ofresource use, including hospital inpatient and outpatient care, community health and social care,prescribed medications, equipment and aids, and productivity losses.
In terms of specific resource use at the 8-week follow-up (see Appendix 1, Table 25), notable differenceswere observed between the groups for the proportion prescribed anticoagulant as VTE prophylaxistreatment (0.72 vs. 0.59; p = 0.003), the mean number of NHS outpatient orthopaedic visits (2.63 vs. 1.80;p < 0.001), the mean number of NHS outpatient physiotherapy visits (0.23 vs. 0.46; p = 0.003), the meannumber of GP surgery visits (0.10 vs. 0.19; p = 0.028) and the mean number of grab rail installations(0.05 vs. 0; p = 0.019). For all other resource use items, there were no noticeable differences betweenthe groups.
Between 8 weeks and 3 months post injury (see Appendix 1, Table 25), there were differences in resourceuse between the groups for the proportion of participants prescribed analgesics (0.11 vs. 0.05; p = 0.015)and the proportion of participants prescribed other medications (0.02 vs. 0; p = 0.038). For all otherresource use items, there were no noticeable differences between the groups.
There were no significant differences in resource use between the plaster cast and the functionalbrace groups at 6 or 9 months post injury.
Economic costsTable 21 summarises the total NHS and PSS costs associated with resource use during the trial periodamong complete cases by cost category and by follow-up period. The mean direct intervention costwas £35.71 for the plaster cast group compared with £108.64 for the functional brace group; themean difference of £72.93 was statistically significant at the 5% level. The mean total NHS and PSScosts were significantly lower in the functional brace group between randomisation and 8 weeks post
TABLE 21 The NHS and PSS costs for participants with complete resource use data by treatment group, study periodand cost category (2017–18 prices)
Cost category by period
Treatment group, mean (SE) cost (£)Meandifference p-valuea Bootstrap 95% CIbPlaster cast Functional brace
Baseline to 8 weeks post injury: direct intervention costsc (total, N = 497: plaster cast, n = 241; functional brace, n = 256)
Total direct interventioncosts
35.71 (0.492) 108.64 (3.114) –72.93 < 0.0001 –79.22 to –66.64
Baseline to 8 weeks post injury: NHS PSS resource use (total, N= 432: plaster cast, n = 210; functional brace, n= 222)
Inpatient care 55.8 (28.382) 39.3 (22.163) 16.51 0.647 –53.48 to 86.49
Outpatient care 370.2 (15.114) 282.6 (15.078) 87.59 < 0.0001 45.97 to 129.21
Community care 9.66 (2.521) 28.94 (14.493) –19.28 0.191 –47.64 to 9.07
Medications 151.35 (9.334) 106.45 (8.701) 44.9 < 0.001 20.34 to 69
Aids and adaptations 9.51 (0.842) 7.32 (0.568) 2.19 0.032 0.20 to 4.19
PSS 0.15 (0.151) 0 (0) 0.15 0.318 –0.14 to 0.45
Total NHS and PSS cost 596.67 (36.596) 464.61 (32.946) 132.06 0.008 33.35 to 230.78
Total costs during first8 weeks (including directintervention costs)d
647.88 (37.99) 540.15 (26.10) 107.73 0.02 16.15 to 199.31
HEALTH ECONOMICS
NIHR Journals Library www.journalslibrary.nihr.ac.uk
40
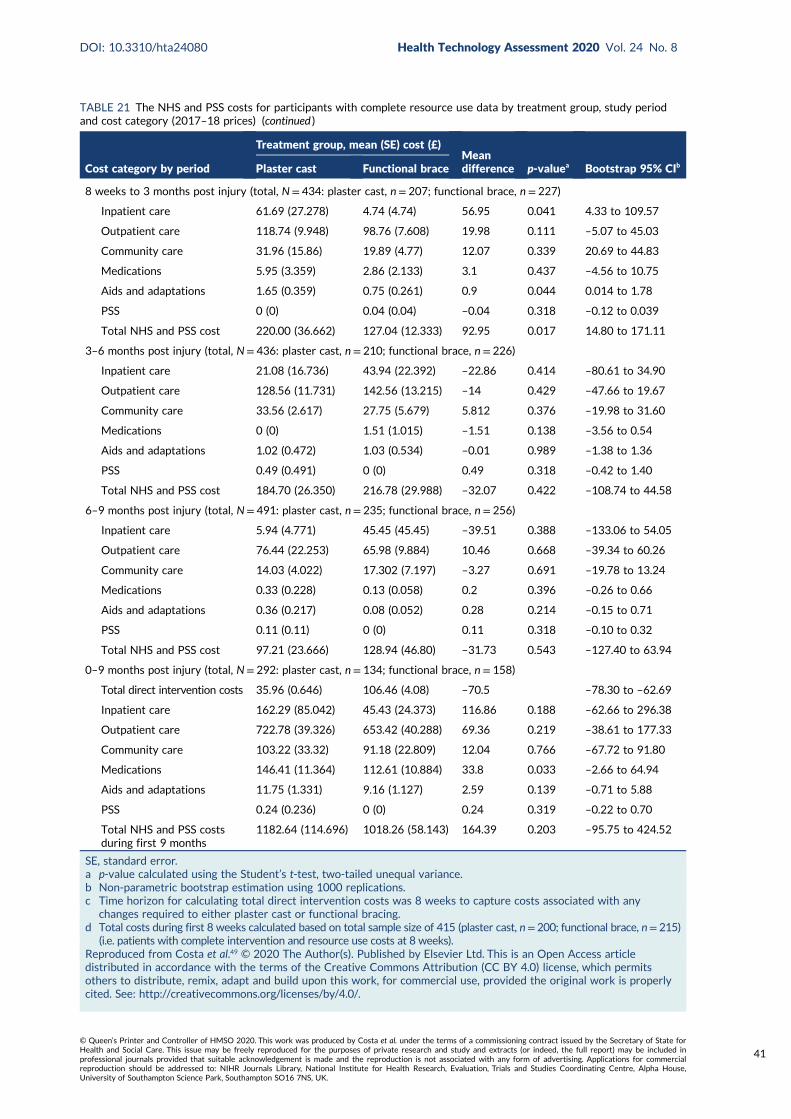
TABLE 21 The NHS and PSS costs for participants with complete resource use data by treatment group, study periodand cost category (2017–18 prices) (continued )
Cost category by period
Treatment group, mean (SE) cost (£)Meandifference p-valuea Bootstrap 95% CIbPlaster cast Functional brace
8 weeks to 3 months post injury (total, N = 434: plaster cast, n= 207; functional brace, n = 227)
Inpatient care 61.69 (27.278) 4.74 (4.74) 56.95 0.041 4.33 to 109.57
Outpatient care 118.74 (9.948) 98.76 (7.608) 19.98 0.111 –5.07 to 45.03
Community care 31.96 (15.86) 19.89 (4.77) 12.07 0.339 20.69 to 44.83
Medications 5.95 (3.359) 2.86 (2.133) 3.1 0.437 –4.56 to 10.75
Aids and adaptations 1.65 (0.359) 0.75 (0.261) 0.9 0.044 0.014 to 1.78
PSS 0 (0) 0.04 (0.04) –0.04 0.318 –0.12 to 0.039
Total NHS and PSS cost 220.00 (36.662) 127.04 (12.333) 92.95 0.017 14.80 to 171.11
3–6 months post injury (total, N= 436: plaster cast, n= 210; functional brace, n = 226)
Inpatient care 21.08 (16.736) 43.94 (22.392) –22.86 0.414 –80.61 to 34.90
Outpatient care 128.56 (11.731) 142.56 (13.215) –14 0.429 –47.66 to 19.67
Community care 33.56 (2.617) 27.75 (5.679) 5.812 0.376 –19.98 to 31.60
Medications 0 (0) 1.51 (1.015) –1.51 0.138 –3.56 to 0.54
Aids and adaptations 1.02 (0.472) 1.03 (0.534) –0.01 0.989 –1.38 to 1.36
PSS 0.49 (0.491) 0 (0) 0.49 0.318 –0.42 to 1.40
Total NHS and PSS cost 184.70 (26.350) 216.78 (29.988) –32.07 0.422 –108.74 to 44.58
6–9 months post injury (total, N= 491: plaster cast, n= 235; functional brace, n = 256)
Inpatient care 5.94 (4.771) 45.45 (45.45) –39.51 0.388 –133.06 to 54.05
Outpatient care 76.44 (22.253) 65.98 (9.884) 10.46 0.668 –39.34 to 60.26
Community care 14.03 (4.022) 17.302 (7.197) –3.27 0.691 –19.78 to 13.24
Medications 0.33 (0.228) 0.13 (0.058) 0.2 0.396 –0.26 to 0.66
Aids and adaptations 0.36 (0.217) 0.08 (0.052) 0.28 0.214 –0.15 to 0.71
PSS 0.11 (0.11) 0 (0) 0.11 0.318 –0.10 to 0.32
Total NHS and PSS cost 97.21 (23.666) 128.94 (46.80) –31.73 0.543 –127.40 to 63.94
0–9 months post injury (total, N= 292: plaster cast, n= 134; functional brace, n = 158)
Total direct intervention costs 35.96 (0.646) 106.46 (4.08) –70.5 –78.30 to –62.69
Inpatient care 162.29 (85.042) 45.43 (24.373) 116.86 0.188 –62.66 to 296.38
Outpatient care 722.78 (39.326) 653.42 (40.288) 69.36 0.219 –38.61 to 177.33
Community care 103.22 (33.32) 91.18 (22.809) 12.04 0.766 –67.72 to 91.80
Medications 146.41 (11.364) 112.61 (10.884) 33.8 0.033 –2.66 to 64.94
Aids and adaptations 11.75 (1.331) 9.16 (1.127) 2.59 0.139 –0.71 to 5.88
PSS 0.24 (0.236) 0 (0) 0.24 0.319 –0.22 to 0.70
Total NHS and PSS costsduring first 9 months
1182.64 (114.696) 1018.26 (58.143) 164.39 0.203 –95.75 to 424.52
SE, standard error.a p-value calculated using the Student’s t-test, two-tailed unequal variance.b Non-parametric bootstrap estimation using 1000 replications.c Time horizon for calculating total direct intervention costs was 8 weeks to capture costs associated with any
changes required to either plaster cast or functional bracing.d Total costs during first 8 weeks calculated based on total sample size of 415 (plaster cast, n= 200; functional brace, n= 215)
(i.e. patients with complete intervention and resource use costs at 8 weeks).Reproduced from Costa et al.49 © 2020 The Author(s). Published by Elsevier Ltd. This is an Open Access articledistributed in accordance with the terms of the Creative Commons Attribution (CC BY 4.0) license, which permitsothers to distribute, remix, adapt and build upon this work, for commercial use, provided the original work is properlycited. See: http://creativecommons.org/licenses/by/4.0/.
DOI: 10.3310/hta24080 Health Technology Assessment 2020 Vol. 24 No. 8
© Queen’s Printer and Controller of HMSO 2020. This work was produced by Costa et al. under the terms of a commissioning contract issued by the Secretary of State forHealth and Social Care. This issue may be freely reproduced for the purposes of private research and study and extracts (or indeed, the full report) may be included inprofessional journals provided that suitable acknowledgement is made and the reproduction is not associated with any form of advertising. Applications for commercialreproduction should be addressed to: NIHR Journals Library, National Institute for Health Research, Evaluation, Trials and Studies Coordinating Centre, Alpha House,University of Southampton Science Park, Southampton SO16 7NS, UK.
41
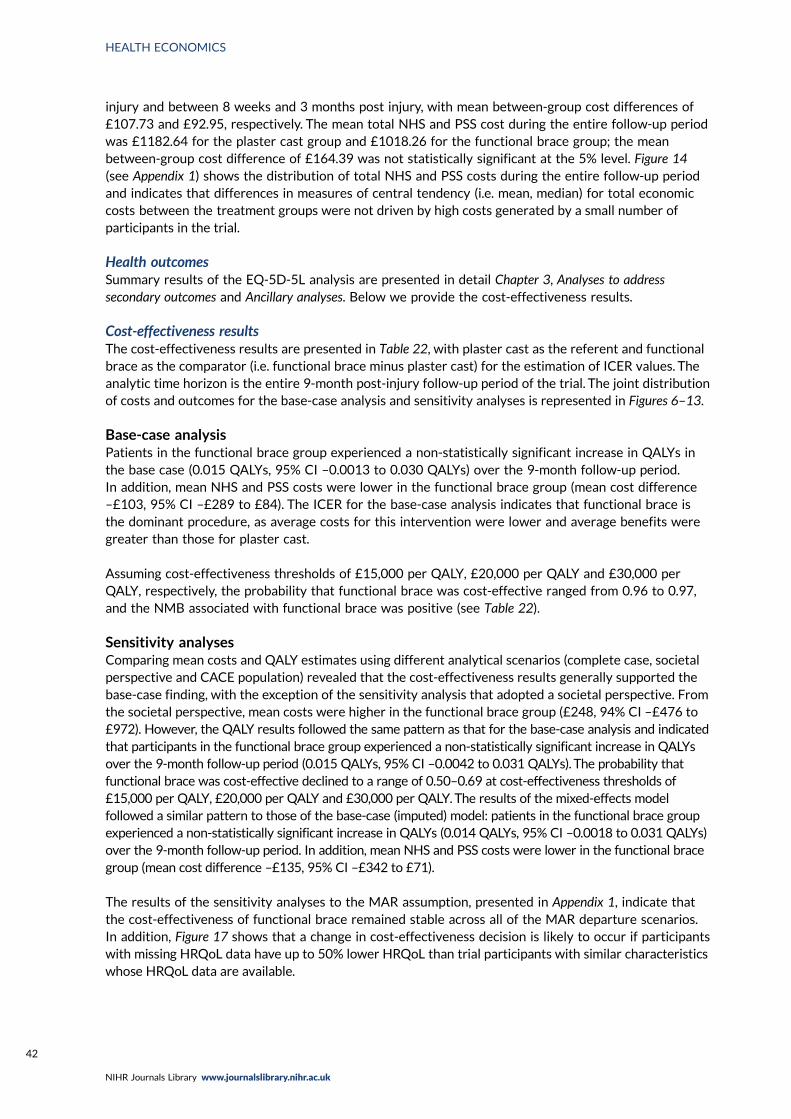
injury and between 8 weeks and 3 months post injury, with mean between-group cost differences of£107.73 and £92.95, respectively. The mean total NHS and PSS cost during the entire follow-up periodwas £1182.64 for the plaster cast group and £1018.26 for the functional brace group; the meanbetween-group cost difference of £164.39 was not statistically significant at the 5% level. Figure 14(see Appendix 1) shows the distribution of total NHS and PSS costs during the entire follow-up periodand indicates that differences in measures of central tendency (i.e. mean, median) for total economiccosts between the treatment groups were not driven by high costs generated by a small number ofparticipants in the trial.
Health outcomesSummary results of the EQ-5D-5L analysis are presented in detail Chapter 3, Analyses to addresssecondary outcomes and Ancillary analyses. Below we provide the cost-effectiveness results.
Cost-effectiveness resultsThe cost-effectiveness results are presented in Table 22, with plaster cast as the referent and functionalbrace as the comparator (i.e. functional brace minus plaster cast) for the estimation of ICER values. Theanalytic time horizon is the entire 9-month post-injury follow-up period of the trial. The joint distributionof costs and outcomes for the base-case analysis and sensitivity analyses is represented in Figures 6–13.
Base-case analysisPatients in the functional brace group experienced a non-statistically significant increase in QALYs inthe base case (0.015 QALYs, 95% CI –0.0013 to 0.030 QALYs) over the 9-month follow-up period.In addition, mean NHS and PSS costs were lower in the functional brace group (mean cost difference–£103, 95% CI –£289 to £84). The ICER for the base-case analysis indicates that functional brace isthe dominant procedure, as average costs for this intervention were lower and average benefits weregreater than those for plaster cast.
Assuming cost-effectiveness thresholds of £15,000 per QALY, £20,000 per QALY and £30,000 perQALY, respectively, the probability that functional brace was cost-effective ranged from 0.96 to 0.97,and the NMB associated with functional brace was positive (see Table 22).
Sensitivity analysesComparing mean costs and QALY estimates using different analytical scenarios (complete case, societalperspective and CACE population) revealed that the cost-effectiveness results generally supported thebase-case finding, with the exception of the sensitivity analysis that adopted a societal perspective. Fromthe societal perspective, mean costs were higher in the functional brace group (£248, 94% CI –£476 to£972). However, the QALY results followed the same pattern as that for the base-case analysis and indicatedthat participants in the functional brace group experienced a non-statistically significant increase in QALYsover the 9-month follow-up period (0.015 QALYs, 95% CI –0.0042 to 0.031 QALYs). The probability thatfunctional brace was cost-effective declined to a range of 0.50–0.69 at cost-effectiveness thresholds of£15,000 per QALY, £20,000 per QALY and £30,000 per QALY. The results of the mixed-effects modelfollowed a similar pattern to those of the base-case (imputed) model: patients in the functional brace groupexperienced a non-statistically significant increase in QALYs (0.014 QALYs, 95% CI –0.0018 to 0.031 QALYs)over the 9-month follow-up period. In addition, mean NHS and PSS costs were lower in the functional bracegroup (mean cost difference –£135, 95% CI –£342 to £71).
The results of the sensitivity analyses to the MAR assumption, presented in Appendix 1, indicate thatthe cost-effectiveness of functional brace remained stable across all of the MAR departure scenarios.In addition, Figure 17 shows that a change in cost-effectiveness decision is likely to occur if participantswith missing HRQoL data have up to 50% lower HRQoL than trial participants with similar characteristicswhose HRQoL data are available.
HEALTH ECONOMICS
NIHR Journals Library www.journalslibrary.nihr.ac.uk
42

TABLE 22 Cost-effectiveness: cost per QALY (2017 prices) – functional brace compared with plaster cast
Scenario
Treatment group,mean (SE) cost (£)
Incrementalcost(95% CI)
Treatment group,mean (SE) QALY
IncrementalQALYs(95% CI) ICERa (£)
Probability that functionalbrace is cost-effective NMBs
Functionalbrace
Plastercast
Functionalbrace
Plastercast p-valueb p-valuec p-valued
NMBe
(95% CI)NMBf
(95% CI)NMBg
(95% CI)
Base-case analysis
Imputed attributablecosts and QALYs;covariate adjusted
1078.16(83.42)
1180.72(89.63)
–102.56(–289.28 to84.16)
0.506(0.0064)
0.492(0.0066)
0.015(–0.0013 to0.030)
Dominant 0.963 0.965 0.966 312.28(–31.26 to655)
383.82(–32.67 to793.80)
526.90(–42.50 to1076.87)
Sensitivity analyses
Complete-caseattributable costsand QALYs;covariate adjusted
948.77(53.91)
1117.28(110.66)
–168.51(–458.01 to32.88)
0.513(0.00642)
0.497(0.0064)
0.017(–0.0035 to0.037)
Dominant 0.976 0.976 0.972 443.54(19.83 to933.22)
527.26(9.11 to1094.07)
694.70(–17.56 to1406.23)
Societal perspective 4362.15(348.71)
4114.54(292.18)
247.61(–476.44 to971.66)
0.506(0.0063)
0.502(0.007)
0.015(–0.0042 to0.031)
16,510 0.501 0.576 0.688 –29.65(–991.50 to874.93)
44.36(–964.19 to991.46)
192.39(–926.97 to1244.53)
CACE population 1038.6(62.89)
1169.44(78.48)
–130.84(–335.38 to90.36)
0.510(0.00609)
0.488(0.00688)
0.022(0.0051 to0.038)
Dominant 0.992 0.993 0.994 44.52(89.86 to852.63)
57.36(127.50 to1030.39)
818.02(199.26 to1434.03)
continued
DOI:10.3310/hta2
4080
Health
Tech
nology
Assessm
ent2020
Vol.2
4No.8
©Queen
’sPrin
teran
dContro
llerofHMSO
2020.T
hiswork
was
produced
byCosta
etal.u
nder
theterm
sofaco
mmissio
ningco
ntract
issued
bytheSecretary
ofState
for
Health
andSo
cialCare.T
his
issuemay
befreely
reproduced
forthepu
rposes
ofprivate
researchan
dstu
dyan
dextracts
(orindeed
,thefullrepo
rt)may
beinclu
ded
inpro
fessional
journals
provid
edthat
suitab
leackn
owled
gemen
tis
mad
ean
dtherepro
ductio
nis
notasso
ciatedwith
anyform
ofad
vertising.
Applicatio
nsforco
mmercial
reproductio
nshould
bead
dressed
to:NIH
RJournals
Library,
Natio
nal
Institu
teforHealth
Research
,Evalu
ation,Trials
and
Studies
Coordinatin
gCen
tre,Alph
aHouse,
University
ofSo
utham
ptonScien
cePark,So
utham
ptonSO
167NS,U
K.
43

TABLE 22 Cost-effectiveness: cost per QALY (2017 prices) – functional brace compared with plaster cast (continued )
Scenario
Treatment group,mean (SE) cost (£)
Incrementalcost(95% CI)
Treatment group,mean (SE) QALY
IncrementalQALYs(95% CI) ICERa (£)
Probability that functionalbrace is cost-effective NMBs
Functionalbrace
Plastercast
Functionalbrace
Plastercast p-valueb p-valuec p-valued
NMBe
(95% CI)NMBf
(95% CI)NMBg
(95% CI)
Secondarycost-effectivenessanalysis using ATRSh
as outcome measure
1057.22(71.91)
1149.44(79.25)
–92.21(–273.86to 89.44)
45.09(0.72)
44.30(0.73)
0.78(–1.12to 2.69)
Dominant 0.875 0.839 0.822 174.03(–117.37to 463.44)
328.84(–306to 970.91)
406.25(–403.75to 1218.76)
SE, standard error.a Given the pattern of results, plaster cast has been selected as the referent and functional brace as the comparator (i.e. functional brace minus plaster cast) for the estimation
of ICER values. Dominance indicates that average costs were lower and average benefits were greater for functional brace vs. plaster cast.b Probability cost-effective if cost-effectiveness threshold set at £15,000 per QALY, with the exception of the sensitivity analysis using ATRS as the health outcome measure
of interest. In the latter case, this refers to probability of cost-effectiveness if cost-effectiveness threshold is set arbitrarily at £100 per unit gain in ATRS score.c Probability cost-effective if cost-effectiveness threshold set at £20,000 per QALY, with the exception of the sensitivity analysis using ATRS as the health outcome measure
of interest. In the latter case, this refers to probability of cost-effectiveness if cost-effectiveness threshold is set arbitrarily at £300 per unit gain in ATRS score.d Probability cost-effective if cost-effectiveness threshold set at £30,000 per QALY, with the exception of the sensitivity analysis using ATRS as the health outcome measure
of interest. In the latter case, this refers to probability of cost-effectiveness if cost-effectiveness threshold is set arbitrarily at £500 per unit gain in ATRS score.e NMB if cost-effectiveness threshold set at £15,000 per QALY, with the exception of the sensitivity analysis using ATRS as the health outcome measure of interest. In the latter
case, this refers to NMB if cost-effectiveness threshold is set arbitrarily at £100 per unit gain in ATRS score.f NMB if cost-effectiveness threshold set at £20,000 per QALY, with the exception of the sensitivity analysis using ATRS as the health outcome measure of interest. In the latter
case, this refers to NMB if cost-effectiveness threshold is set arbitrarily at £300 per unit gain in ATRS score.g NMB if cost-effectiveness threshold set at £30,000 per QALY, with the exception of the sensitivity analysis using ATRS as the health outcome measure of interest. In the latter
case, this refers to NMB if cost-effectiveness threshold is set arbitrarily at £500 per unit gain in ATRS score.h Range from 0 to 100, with higher scores indicating better outcomes.Reproduced from Costa et al.49 © 2020 The Author(s). Published by Elsevier Ltd. This is an Open Access article distributed in accordance with the terms of the Creative CommonsAttribution (CC BY 4.0) license, which permits others to distribute, remix, adapt and build upon this work, for commercial use, provided the original work is properly cited.See: http://creativecommons.org/licenses/by/4.0/.
HEALT
HECONOMICS
NIH
RJournals
Library
www.jo
urnalslib
rary.nihr.ac.u
k
44
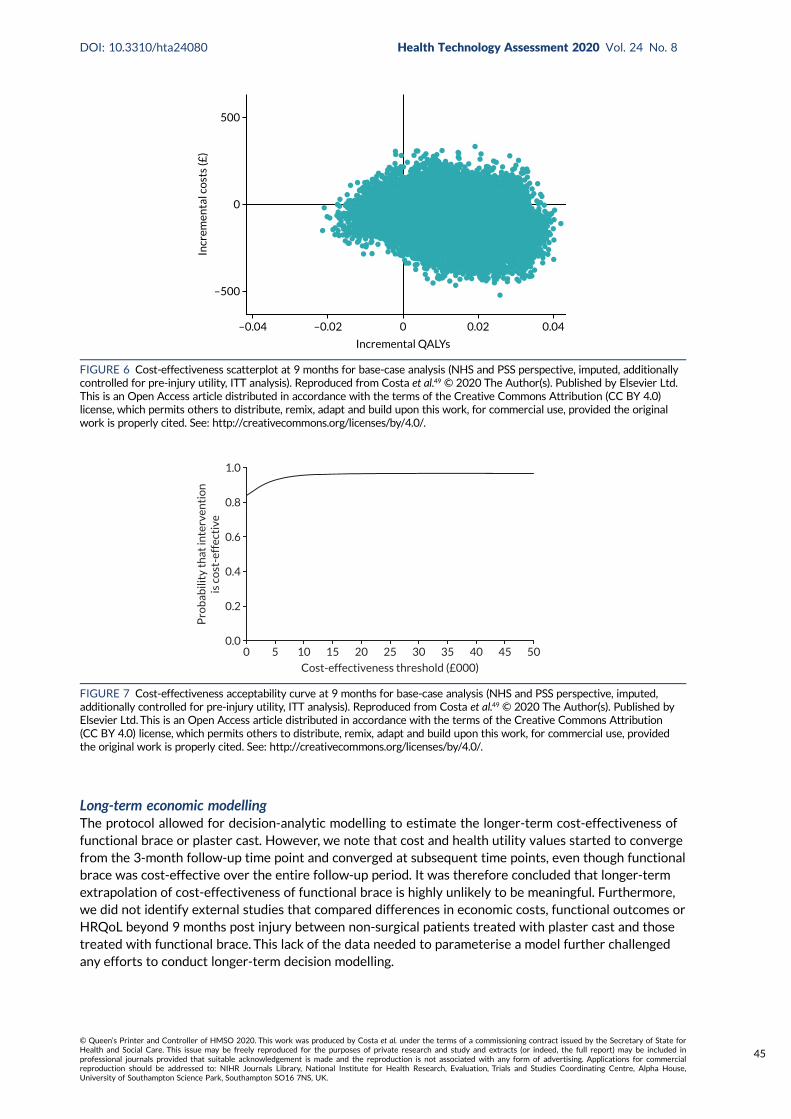
Long-term economic modellingThe protocol allowed for decision-analytic modelling to estimate the longer-term cost-effectiveness offunctional brace or plaster cast. However, we note that cost and health utility values started to convergefrom the 3-month follow-up time point and converged at subsequent time points, even though functionalbrace was cost-effective over the entire follow-up period. It was therefore concluded that longer-termextrapolation of cost-effectiveness of functional brace is highly unlikely to be meaningful. Furthermore,we did not identify external studies that compared differences in economic costs, functional outcomes orHRQoL beyond 9 months post injury between non-surgical patients treated with plaster cast and thosetreated with functional brace. This lack of the data needed to parameterise a model further challengedany efforts to conduct longer-term decision modelling.
–0.04
–500
0
500
–0.02 0.02 0.040
Incremental QALYs
Incr
emen
tal c
ost
s (£
)
FIGURE 6 Cost-effectiveness scatterplot at 9 months for base-case analysis (NHS and PSS perspective, imputed, additionallycontrolled for pre-injury utility, ITT analysis). Reproduced from Costa et al.49 © 2020 The Author(s). Published by Elsevier Ltd.This is an Open Access article distributed in accordance with the terms of the Creative Commons Attribution (CC BY 4.0)license, which permits others to distribute, remix, adapt and build upon this work, for commercial use, provided the originalwork is properly cited. See: http://creativecommons.org/licenses/by/4.0/.
0.0
0.2
0.4
0.6
0.8
1.0
Pro
bab
ility
th
at in
terv
enti
on
is c
ost
-eff
ecti
ve
Cost-effectiveness threshold (£000)
0 5 10 15 20 25 30 35 40 45 50
FIGURE 7 Cost-effectiveness acceptability curve at 9 months for base-case analysis (NHS and PSS perspective, imputed,additionally controlled for pre-injury utility, ITT analysis). Reproduced from Costa et al.49 © 2020 The Author(s). Published byElsevier Ltd. This is an Open Access article distributed in accordance with the terms of the Creative Commons Attribution(CC BY 4.0) license, which permits others to distribute, remix, adapt and build upon this work, for commercial use, providedthe original work is properly cited. See: http://creativecommons.org/licenses/by/4.0/.
DOI: 10.3310/hta24080 Health Technology Assessment 2020 Vol. 24 No. 8
© Queen’s Printer and Controller of HMSO 2020. This work was produced by Costa et al. under the terms of a commissioning contract issued by the Secretary of State forHealth and Social Care. This issue may be freely reproduced for the purposes of private research and study and extracts (or indeed, the full report) may be included inprofessional journals provided that suitable acknowledgement is made and the reproduction is not associated with any form of advertising. Applications for commercialreproduction should be addressed to: NIHR Journals Library, National Institute for Health Research, Evaluation, Trials and Studies Coordinating Centre, Alpha House,University of Southampton Science Park, Southampton SO16 7NS, UK.
45
0.0
0.2
0.4
0.6
0.8
1.0
Pro
bab
ility
th
at in
terv
enti
on
is c
ost
-eff
ecti
ve
Cost-effectiveness threshold (£000)
0 5 10 15 20 25 30 35 40 45 50
FIGURE 9 Cost-effectiveness acceptability curve for complete cases (NHS and PSS perspective, ITT analysis).
–0.04
–1000
–2000
0
1000
2000
–0.02 0.02 0.040
Incremental QALYs
Incr
emen
tal c
ost
s (£
)
FIGURE 10 Cost-effectiveness scatterplot for societal perspective (imputed, ITT analysis).
–0.06 –0.04
–500
–1000
0
500
1000
–0.02 0.02 0.060.040
Incremental QALYs
Incr
emen
tal c
ost
s (£
)
FIGURE 8 Cost-effectiveness scatterplot at 9 months for complete cases (NHS and PSS perspective, ITT analysis).
HEALTH ECONOMICS
NIHR Journals Library www.journalslibrary.nihr.ac.uk
46
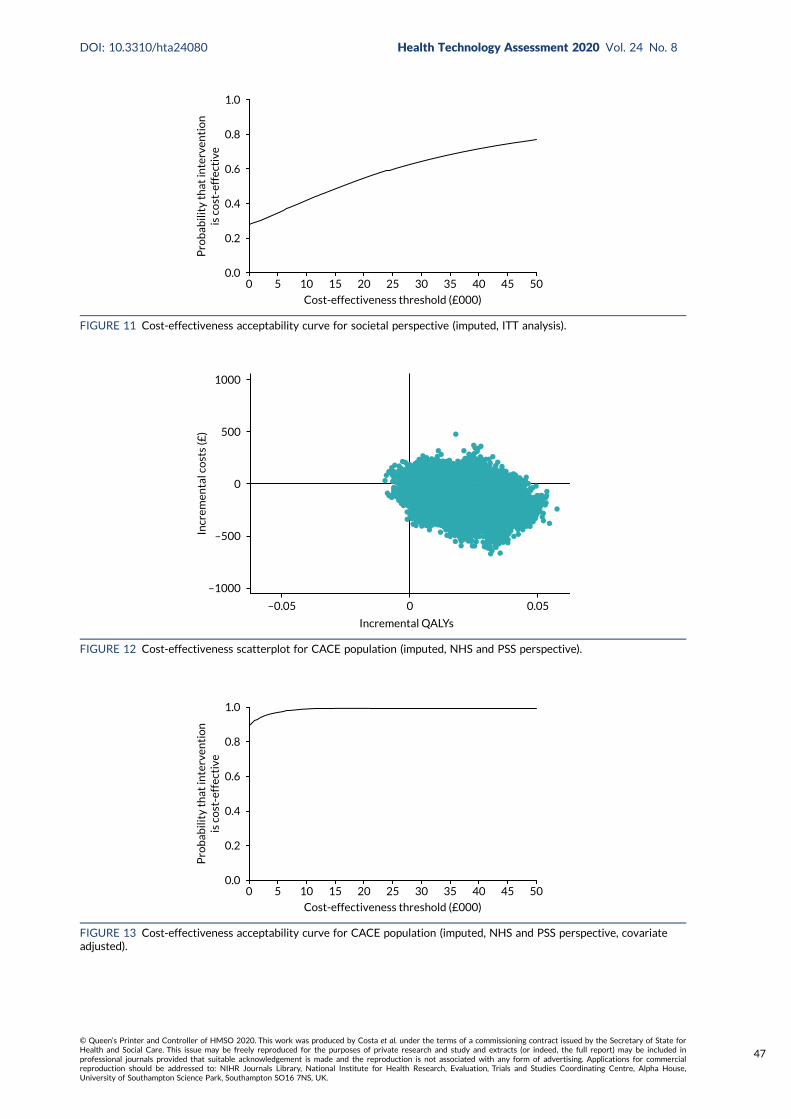
–0.05
–500
–1000
0
500
1000
0.050
Incremental QALYs
Incr
emen
tal c
ost
s (£
)
FIGURE 12 Cost-effectiveness scatterplot for CACE population (imputed, NHS and PSS perspective).
0.0
0.2
0.4
0.6
0.8
1.0
Pro
bab
ility
th
at in
terv
enti
on
is c
ost
-eff
ecti
ve
Cost-effectiveness threshold (£000)
0 5 10 15 20 25 30 35 40 45 50
FIGURE 13 Cost-effectiveness acceptability curve for CACE population (imputed, NHS and PSS perspective, covariateadjusted).
0.0
0.2
0.4
0.6
0.8
1.0
Pro
bab
ility
th
at in
terv
enti
on
is c
ost
-eff
ecti
ve
Cost-effectiveness threshold (£000)
0 5 10 15 20 25 30 35 40 45 50
FIGURE 11 Cost-effectiveness acceptability curve for societal perspective (imputed, ITT analysis).
DOI: 10.3310/hta24080 Health Technology Assessment 2020 Vol. 24 No. 8
© Queen’s Printer and Controller of HMSO 2020. This work was produced by Costa et al. under the terms of a commissioning contract issued by the Secretary of State forHealth and Social Care. This issue may be freely reproduced for the purposes of private research and study and extracts (or indeed, the full report) may be included inprofessional journals provided that suitable acknowledgement is made and the reproduction is not associated with any form of advertising. Applications for commercialreproduction should be addressed to: NIHR Journals Library, National Institute for Health Research, Evaluation, Trials and Studies Coordinating Centre, Alpha House,University of Southampton Science Park, Southampton SO16 7NS, UK.
47


Chapter 5 Discussion
Recruitment
A total of 375 patients screened were found to be ineligible for the trial. The most common reason forbeing ineligible (n = 155) was presenting > 14 days after the Achilles tendon injury. Late presentationafter an Achilles tendon rupture is not uncommon. Although a patient may have severe pain when thetendon ruptures, this acute pain usually settles quickly and the patient can often put weight throughtheir leg, albeit without being able to walk normally. Some patients feel that they would not be able towalk at all if they had suffered a ‘serious’ injury and therefore continue to try to mobilise on their legbefore eventually seeking treatment some time later, when their ability has not improved. The cut-offpoint of 14 days used to define an ‘acute’ rupture is somewhat arbitrary but in keeping with definitionsused in previous research into this injury. Patients presenting at later times may have partial or completehealing of the tendon but often with tendon lengthening, which restricts their function. As the treatmentof late presentation injuries is not straightforward and often requires surgical intervention, thesepatients were excluded from this trial of acute non-operative management.
The second common reason why patients were ineligible (n = 120) was that they chose to have surgery.This number is perhaps smaller than had been anticipated when UKSTAR was designed and, to somedegree, accounts for the faster than expected rate of recruitment. However, it is in keeping with theworldwide trend towards non-operative treatment of acute rupture of the Achilles tendon, as per therecent evidence base, which suggests little functional advantage of surgery.8,9
Only 46 patients were excluded because they were unable to adhere to trial procedures or completequestionnaires, most commonly because they could not read written English, which was used in thefollow-up questionnaires. Thirty-seven patients were excluded because they had suffered a previousAchilles tendon injury, which was likely to have affected their baseline, pre-injury function. Achillestendon rupture is very rare in children and hence it is not surprising that only three patients wereexcluded because they were aged < 16 years. The remaining 14 patients were excluded by recruitmentcentres under the heading ‘other’; we did not record details of these individual cases.
Of the 1076 potentially eligible patients screened across the 39 recruitment centres, 540 consented toenter the trial. Ninety-nine patients were not approached about the trial because no research associatewas available to discuss the trial (n = 97), usually because the patient had presented at the weekendor because no functional brace was available at the time of presentation (n = 2). A further 50 patientswere not offered the opportunity to take part in the trial because of a clinician decision. In some cases,specific reasons were given for this decision, for example ‘active treatment of a local skin lesionsprecluding the use of a cast’, but in other cases the clinician did not provide a reason. Therefore, a totalof 149 potentially eligible patients were never offered the opportunity to take part in the trial. Thisreduced the number of participants but is unlikely to have caused selection bias.
Of the 927 patients who had the opportunity to take part, 385 declined. Patients may decline to takepart in a trial for various reasons. Those who do not want to be part of any research – often becauseof the perception, or indeed the reality, of filling out extra, onerous questionnaires – are unlikely toadversely affect the trial in terms of the difference between treatment groups. However, those whodecline because they have a preference for one treatment over another do create selection bias.In this trial, it is reassuring that 540 out of the 927 patients who were offered the opportunity to takepart in the trial (58%) agreed to participate.
DOI: 10.3310/hta24080 Health Technology Assessment 2020 Vol. 24 No. 8
© Queen’s Printer and Controller of HMSO 2020. This work was produced by Costa et al. under the terms of a commissioning contract issued by the Secretary of State forHealth and Social Care. This issue may be freely reproduced for the purposes of private research and study and extracts (or indeed, the full report) may be included inprofessional journals provided that suitable acknowledgement is made and the reproduction is not associated with any form of advertising. Applications for commercialreproduction should be addressed to: NIHR Journals Library, National Institute for Health Research, Evaluation, Trials and Studies Coordinating Centre, Alpha House,University of Southampton Science Park, Southampton SO16 7NS, UK.
49
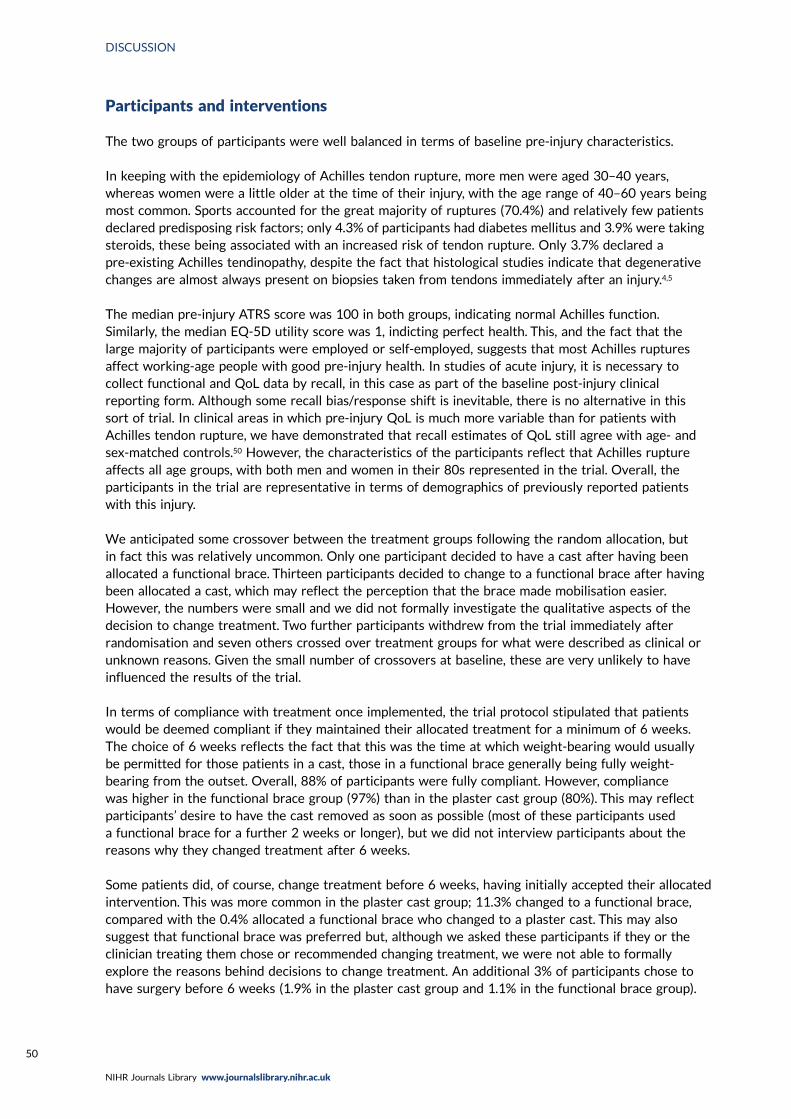
Participants and interventions
The two groups of participants were well balanced in terms of baseline pre-injury characteristics.
In keeping with the epidemiology of Achilles tendon rupture, more men were aged 30–40 years,whereas women were a little older at the time of their injury, with the age range of 40–60 years beingmost common. Sports accounted for the great majority of ruptures (70.4%) and relatively few patientsdeclared predisposing risk factors; only 4.3% of participants had diabetes mellitus and 3.9% were takingsteroids, these being associated with an increased risk of tendon rupture. Only 3.7% declared apre-existing Achilles tendinopathy, despite the fact that histological studies indicate that degenerativechanges are almost always present on biopsies taken from tendons immediately after an injury.4,5
The median pre-injury ATRS score was 100 in both groups, indicating normal Achilles function.Similarly, the median EQ-5D utility score was 1, indicting perfect health. This, and the fact that thelarge majority of participants were employed or self-employed, suggests that most Achilles rupturesaffect working-age people with good pre-injury health. In studies of acute injury, it is necessary tocollect functional and QoL data by recall, in this case as part of the baseline post-injury clinicalreporting form. Although some recall bias/response shift is inevitable, there is no alternative in thissort of trial. In clinical areas in which pre-injury QoL is much more variable than for patients withAchilles tendon rupture, we have demonstrated that recall estimates of QoL still agree with age- andsex-matched controls.50 However, the characteristics of the participants reflect that Achilles ruptureaffects all age groups, with both men and women in their 80s represented in the trial. Overall, theparticipants in the trial are representative in terms of demographics of previously reported patientswith this injury.
We anticipated some crossover between the treatment groups following the random allocation, butin fact this was relatively uncommon. Only one participant decided to have a cast after having beenallocated a functional brace. Thirteen participants decided to change to a functional brace after havingbeen allocated a cast, which may reflect the perception that the brace made mobilisation easier.However, the numbers were small and we did not formally investigate the qualitative aspects of thedecision to change treatment. Two further participants withdrew from the trial immediately afterrandomisation and seven others crossed over treatment groups for what were described as clinical orunknown reasons. Given the small number of crossovers at baseline, these are very unlikely to haveinfluenced the results of the trial.
In terms of compliance with treatment once implemented, the trial protocol stipulated that patientswould be deemed compliant if they maintained their allocated treatment for a minimum of 6 weeks.The choice of 6 weeks reflects the fact that this was the time at which weight-bearing would usuallybe permitted for those patients in a cast, those in a functional brace generally being fully weight-bearing from the outset. Overall, 88% of participants were fully compliant. However, compliancewas higher in the functional brace group (97%) than in the plaster cast group (80%). This may reflectparticipants’ desire to have the cast removed as soon as possible (most of these participants useda functional brace for a further 2 weeks or longer), but we did not interview participants about thereasons why they changed treatment after 6 weeks.
Some patients did, of course, change treatment before 6 weeks, having initially accepted their allocatedintervention. This was more common in the plaster cast group; 11.3% changed to a functional brace,compared with the 0.4% allocated a functional brace who changed to a plaster cast. This may alsosuggest that functional brace was preferred but, although we asked these participants if they or theclinician treating them chose or recommended changing treatment, we were not able to formallyexplore the reasons behind decisions to change treatment. An additional 3% of participants chose tohave surgery before 6 weeks (1.9% in the plaster cast group and 1.1% in the functional brace group).
DISCUSSION
NIHR Journals Library www.journalslibrary.nihr.ac.uk
50
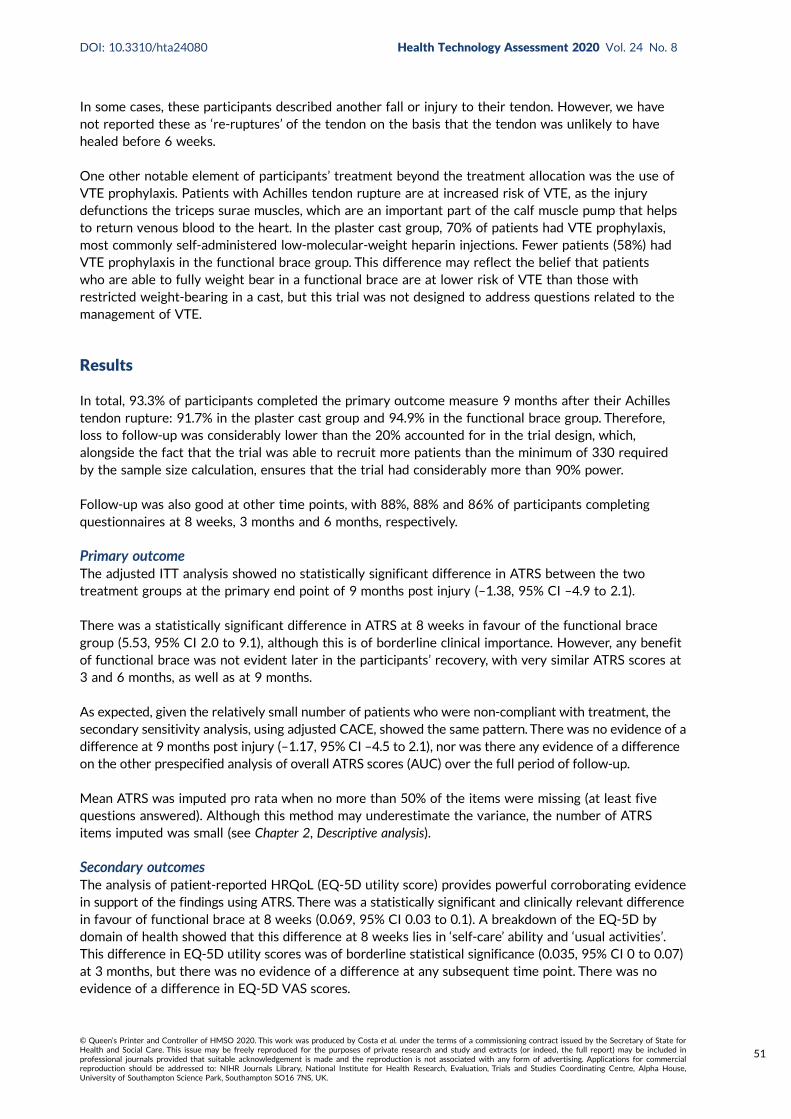
In some cases, these participants described another fall or injury to their tendon. However, we havenot reported these as ‘re-ruptures’ of the tendon on the basis that the tendon was unlikely to havehealed before 6 weeks.
One other notable element of participants’ treatment beyond the treatment allocation was the use ofVTE prophylaxis. Patients with Achilles tendon rupture are at increased risk of VTE, as the injurydefunctions the triceps surae muscles, which are an important part of the calf muscle pump that helpsto return venous blood to the heart. In the plaster cast group, 70% of patients had VTE prophylaxis,most commonly self-administered low-molecular-weight heparin injections. Fewer patients (58%) hadVTE prophylaxis in the functional brace group. This difference may reflect the belief that patientswho are able to fully weight bear in a functional brace are at lower risk of VTE than those withrestricted weight-bearing in a cast, but this trial was not designed to address questions related to themanagement of VTE.
Results
In total, 93.3% of participants completed the primary outcome measure 9 months after their Achillestendon rupture: 91.7% in the plaster cast group and 94.9% in the functional brace group. Therefore,loss to follow-up was considerably lower than the 20% accounted for in the trial design, which,alongside the fact that the trial was able to recruit more patients than the minimum of 330 requiredby the sample size calculation, ensures that the trial had considerably more than 90% power.
Follow-up was also good at other time points, with 88%, 88% and 86% of participants completingquestionnaires at 8 weeks, 3 months and 6 months, respectively.
Primary outcomeThe adjusted ITT analysis showed no statistically significant difference in ATRS between the twotreatment groups at the primary end point of 9 months post injury (–1.38, 95% CI –4.9 to 2.1).
There was a statistically significant difference in ATRS at 8 weeks in favour of the functional bracegroup (5.53, 95% CI 2.0 to 9.1), although this is of borderline clinical importance. However, any benefitof functional brace was not evident later in the participants’ recovery, with very similar ATRS scores at3 and 6 months, as well as at 9 months.
As expected, given the relatively small number of patients who were non-compliant with treatment, thesecondary sensitivity analysis, using adjusted CACE, showed the same pattern. There was no evidence of adifference at 9 months post injury (–1.17, 95% CI –4.5 to 2.1), nor was there any evidence of a differenceon the other prespecified analysis of overall ATRS scores (AUC) over the full period of follow-up.
Mean ATRS was imputed pro rata when no more than 50% of the items were missing (at least fivequestions answered). Although this method may underestimate the variance, the number of ATRSitems imputed was small (see Chapter 2, Descriptive analysis).
Secondary outcomesThe analysis of patient-reported HRQoL (EQ-5D utility score) provides powerful corroborating evidencein support of the findings using ATRS. There was a statistically significant and clinically relevant differencein favour of functional brace at 8 weeks (0.069, 95% CI 0.03 to 0.1). A breakdown of the EQ-5D bydomain of health showed that this difference at 8 weeks lies in ‘self-care’ ability and ‘usual activities’.This difference in EQ-5D utility scores was of borderline statistical significance (0.035, 95% CI 0 to 0.07)at 3 months, but there was no evidence of a difference at any subsequent time point. There was noevidence of a difference in EQ-5D VAS scores.
DOI: 10.3310/hta24080 Health Technology Assessment 2020 Vol. 24 No. 8
© Queen’s Printer and Controller of HMSO 2020. This work was produced by Costa et al. under the terms of a commissioning contract issued by the Secretary of State forHealth and Social Care. This issue may be freely reproduced for the purposes of private research and study and extracts (or indeed, the full report) may be included inprofessional journals provided that suitable acknowledgement is made and the reproduction is not associated with any form of advertising. Applications for commercialreproduction should be addressed to: NIHR Journals Library, National Institute for Health Research, Evaluation, Trials and Studies Coordinating Centre, Alpha House,University of Southampton Science Park, Southampton SO16 7NS, UK.
51
The trial was designed to compare patient-centred outcomes between participants randomly allocatedto a plaster cast and those allocated to a functional brace. However, the safety profile of the functionalbrace was another important consideration. Specifically, if the risk of re-rupture of the tendon was higherin those patients allowed to fully weight-bear in a functional brace, this would influence decision-makingin this area, even when PROs were similar. Interestingly, the risk of re-rupture was generally lower thanthat reported in the literature, with a total of 17 (6.4%) cases in the plaster cast group and 13 (4.7%)cases in the functional brace group. None of the re-ruptures occurred > 6 months after the injury.
There was no evidence of an association between the treatment group and any other type ofcomplication, with the exception of non-injurious falls, which were more common in the plaster castgroup (p = 0.015).
Health economics evaluation
The mean direct intervention costs were £36 for the plaster cast group and £109 for the functionalbrace group. The higher upfront cost of the functional brace (mean difference £73) was statisticallysignificant. However, by 8 weeks this difference had reversed, such that the mean total NHS and PSScosts were significantly lower in the functional brace group. The difference was driven mostly by thegreater number of outpatient appointments required in the plaster cast group.
This is an important finding, as it will reassure the finance teams in trauma and orthopaedicdepartments that, despite the extra initial cost of a functional brace, they will reduce their overall costswhen treating patients with an Achilles tendon rupture.
The mean total NHS and PSS costs during the entire follow-up period were £1183 for the plaster castgroup and £1018 for the functional brace group. Although functional brace was marginally cheaper, themean between-group cost difference of £164 was not statistically significant.
In terms of HRQoL, the mean QALY value was, on average, marginally higher for the functional bracegroup among complete cases and in the sensitivity analyses, although this mean QALY difference wasnot statistically significant.
Therefore, as the functional brace group incurred slightly lower costs and achieved slightly better QoLover the course of the study, in health economic terms, functional brace is the dominant intervention.
In summary, the health economic evaluation indicates that functional brace is very likely tobe cost-effective.
Limitations
A concern at the start of the study was that patients would not be willing to take part in a trialcomparing two interventions that needed to be worn for a prolonged period of time. Some of the385 patients who declined did so because they did not want to be part of a research project. Thesepatients, although undoubtedly affecting the external validity of the trial, are unlikely to create selectionbias when comparing the two interventions. By contrast, those who declined because they had apreference for one treatment over another do create selection bias. However, in total, 540 of the927 patients who were offered the opportunity to take part in the trial (58%) agreed to participate,so we can be confident that the participants in the trial are broadly representative of the population ofpatients having non-operative treatment for acute rupture of the Achilles tendon.
DISCUSSION
NIHR Journals Library www.journalslibrary.nihr.ac.uk
52
A further anticipated limitation was crossover from the allocated treatment and, indeed, 14 patientsdid not receive their allocated intervention after being randomised. There were also some cases ofincomplete compliance with treatment. The ability to bear weight immediately using a functional bracemay have triggered a desire to change treatment, given that the majority changed from the plaster castgroup to the functional brace group. However, the overall number is small for a trial of this size andthe CACE analysis, that is the analysis adjusted for incomplete compliance, confirmed the result of theprimary analysis (i.e. there was no evidence of a difference between the two groups of participants at9 months post injury).
Loss to follow-up is another potential limitation. However, > 93% of participants provided primaryoutcome data at 9 months, which is considerably higher than the 80% assumed in the trial design.Therefore, given that the trial also exceeded the minimum sample size by some margin, we can beconfident that the conclusions are robust and the risk of type II error is very low.
DOI: 10.3310/hta24080 Health Technology Assessment 2020 Vol. 24 No. 8
© Queen’s Printer and Controller of HMSO 2020. This work was produced by Costa et al. under the terms of a commissioning contract issued by the Secretary of State forHealth and Social Care. This issue may be freely reproduced for the purposes of private research and study and extracts (or indeed, the full report) may be included inprofessional journals provided that suitable acknowledgement is made and the reproduction is not associated with any form of advertising. Applications for commercialreproduction should be addressed to: NIHR Journals Library, National Institute for Health Research, Evaluation, Trials and Studies Coordinating Centre, Alpha House,University of Southampton Science Park, Southampton SO16 7NS, UK.
53

Chapter 6 Conclusions
This trial provides strong evidence that early weight-bearing in a functional brace provides similaroutcomes to traditional plaster casting and is safe for patients having non-operative treatment of
an Achilles tendon rupture. The probability that functional bracing is cost-effective exceeds 95% forthe base-case imputed analysis, assuming a cost-effectiveness threshold of £20,000 per QALY. Onaverage, functional brace is associated with lower costs (–£103, 95% CI –£290 to £84) and more QALYs(0.015, 95% CI –0.0013 to 0.030) than plaster cast.
Although UKSTAR provides guidance on the early management of patients, rehabilitation following anAchilles tendon rupture is prolonged and further research is required to define the optimal mode ofrehabilitation after the initial cast or brace is removed.
DOI: 10.3310/hta24080 Health Technology Assessment 2020 Vol. 24 No. 8
© Queen’s Printer and Controller of HMSO 2020. This work was produced by Costa et al. under the terms of a commissioning contract issued by the Secretary of State forHealth and Social Care. This issue may be freely reproduced for the purposes of private research and study and extracts (or indeed, the full report) may be included inprofessional journals provided that suitable acknowledgement is made and the reproduction is not associated with any form of advertising. Applications for commercialreproduction should be addressed to: NIHR Journals Library, National Institute for Health Research, Evaluation, Trials and Studies Coordinating Centre, Alpha House,University of Southampton Science Park, Southampton SO16 7NS, UK.
55


Acknowledgements
UKSTAR study team
Chief investigator: Matthew Costa.
Co-investigators: Matthew Costa, Juul Achten, Rebecca Kearney, Sarah Lamb, Nick Parsons,Stavros Petrou, Ben Ollivere, Malvenia Richmond and Richard Grant.
Study lead: Juul Achten.
Trial managers: Susan Wagland and Anna Liew.
Senior trial managers: Juul Achten and Damian Haywood.
Study co-ordinators and administrators: Catherine Thompsett, Ramona Barbu, Kylea Draper,Hugo Strachwitz, Hasina Mangal and Alice Brealy.
Health economists: Stavros Petrou and Mandy Maredza.
Study statisticians: Michael Maia Schlüssel, Ioana Marian and Susan Dutton.
Recruitment centres
TABLE 23 Principal investigators by recruitment centre
NHS trust Principal investigator
King’s College Hospital NHS Foundation Trust Ines Reichert
Nottingham University Hospitals NHS Foundation Trust Ben Ollivere
Royal Berkshire NHS Foundation Trust Andrew McAndrew
NHS Grampian – Aberdeen Royal Infirmary Alan Johnstone
NHS Tayside – Dundee Fraser Harrold
NHS Greater Glasgow and Clyde – Glasgow Royal Infirmary Jane Madeley
United Lincolnshire Hospitals NHS Trust Harish Kurup
North Tees and Hartlepool Hospitals NHS Foundation Trust –University Hospital of North Tees
Rajesh Nanda
Airedale NHS Foundation Trust Avijeet Ghosh
Salisbury NHS Foundation Trust Sridhar Sampalli
Rotherham NHS Foundation Trust Sandeep Kapoor
George Eliot Hospital NHS Trust Asterios Dramis
James Paget University Hospitals NHS Foundation Trust Nitin Modi
University Hospital Southampton NHS Foundation Trust Nicholas Hancock
East and North Hertsfordshire NHS Trust Rupe Deol
Royal Cornwall Hospitals NHS Trust Richard Walter
Maidstone and Tunbridge Wells NHS Trust Justin Forder
continued
DOI: 10.3310/hta24080 Health Technology Assessment 2020 Vol. 24 No. 8
© Queen’s Printer and Controller of HMSO 2020. This work was produced by Costa et al. under the terms of a commissioning contract issued by the Secretary of State forHealth and Social Care. This issue may be freely reproduced for the purposes of private research and study and extracts (or indeed, the full report) may be included inprofessional journals provided that suitable acknowledgement is made and the reproduction is not associated with any form of advertising. Applications for commercialreproduction should be addressed to: NIHR Journals Library, National Institute for Health Research, Evaluation, Trials and Studies Coordinating Centre, Alpha House,University of Southampton Science Park, Southampton SO16 7NS, UK.
57

Study Steering Committees
The TSC comprised:
l Independent members: Mr Paul Baker (Orthopaedic Surgeon), chairperson; Mrs Sarah Webb(Patient Representative); Dr Dylan Morrissey (Consultant Physiotherapist); and Dr Anne-MarieHutchison (Consultant Physiotherapist).
l Non-independent member: Professor Matthew Costa (Chief Investigator).
The DSMC comprised:
l Independent members: Professor Lee Shepstone (Statistician), chairperson; Professor Simon Donell(Orthopaedic Surgeon); and Dr Jean Craig (Reseach Advisor).
l Non-independent members: Ioana Marian (Trial Statistician) and Susan Dutton (OCTRU lead statistician).
Contributions of authors
Matthew L Costa (https://orcid.org/0000-0003-3644-1388) (Professor of Trauma Surgery, OxfordTrauma) was chief investigator. He led the funding application, study conception and design, developmentof interventions, provided overall study supervision, and wrote and reviewed the report.
TABLE 23 Principal investigators by recruitment centre (continued )
NHS trust Principal investigator
Cambridge University Hospitals NHS Foundation Trust Peter Hull
University Hospitals Plymouth NHS Trust Mark Westwood
Hull University Teaching Hospitals NHS Trust Viren Mishra
Luton and Dunstable University Hospital NHS Foundation Trust Simon Burtt
Salford Royal NHS Foundation Trust Victoria Lyle
Northern Lincolnshire and Goole NHS Foundation Trust Nikos Reissis
The Mid Yorkshire Hospitals NHS Trust Jason Eyre
Leeds Teaching Hospitals NHS Trust Paul Harwood
Worcestershire Acute Hospitals NHS Trust Abhijit Guha
Doncaster and Bassetlaw Teaching Hospitals NHS Foundation Trust Sanjeev Madan
Epsom and St Helier University Hospitals NHS Trust Andrea Sott
Imperial College Healthcare NHS Trust Rajarshi Bhattacharya
NHS Highland – Raigmore Hospital James Beastall
St Helens and Knowsley Hospitals NHS Trust Jordi Ballester
Milton Keynes University Hospital NHS Foundation Trust Atif Malik
South Warwickshire NHS Foundation Trust Sameh El-Kawy
Burton Hospitals NHS Foundation Trust Babis Karagkevrekis
Wye Valley NHS Trust Amr Abdallah
University Hospitals Birmingham NHS Foundation Trust Ansar Mahmood
Oxford University Hospitals NHS Foundation Trust Mark Deakin
University Hospital of South Manchester NHS Foundation Trust Moez Ballal, Nasser Kurdy
Taunton and Somerset NHS Foundation Trust Andrew Kelly
ACKNOWLEDGEMENTS
NIHR Journals Library www.journalslibrary.nihr.ac.uk
58

Juul Achten (https://orcid.org/0000-0002-8857-5743) (Research Manager, Oxford Trauma) preparedthe funding application, provided overall study supervision, developed the study, developed theintervention, designed the study, and wrote and reviewed the report.
Susan Wagland (https://orcid.org/0000-0002-5566-0925) (Clinical Trials Manager, Oxford Trauma)managed and supervised the study, and wrote and reviewed the report.
Ioana R Marian (https://orcid.org/0000-0002-0692-8112) (Medical Statistician) was trial statistician,conducted the statistical analysis and wrote the report.
Mandy Maredza (https://orcid.org/0000-0002-2030-3338) (Research Fellow, Health Economics) wastrial health economist. She designed the study, conducted the health economics analysis and wrotethe report.
Michael Maia Schlüssel (https://orcid.org/0000-0002-1711-9310) (Medical Statistician) was trialstatistician. He conducted the statistical analysis and wrote the report.
Anna S Liew (https://orcid.org/0000-0002-6568-1631) (Clinical Trials Manager, Oxford Trauma)managed and supervised the study, developed the study, developed the intervention, designed thestudy and reviewed the report.
Nick R Parsons (https://orcid.org/0000-0001-9975-888X) (Associate Professor of Medical Statistics)developed the study, developed the intervention, designed the study and reviewed the report.
Susan J Dutton (https://orcid.org/0000-0003-4573-5257) (OCTRU Lead Statistician) was leadstatistician. She designed the study, conducted the statistical analysis, and wrote and reviewed the report.
Rebecca S Kearney (https://orcid.org/0000-0002-8010-164X) [Associate (Clinical) Professor andAssociate Director of Warwick Clinical Trials Unit] developed the study, developed the intervention,designed the study and reviewed the report.
Sarah E Lamb (https://orcid.org/0000-0003-4349-7195) (Professor and Director of Centre forStatistics in Medicine) developed study conception, designed the study and reviewed the report.
Benjamin Ollivere (https://orcid.org/0000-0002-1410-1756) (Clinical Associate Professor andHonorary Consultant Orthopaedic and Major Trauma Surgeon) developed the study, developed theintervention, designed the study and reviewed the report.
Stavros Petrou (https://orcid.org/0000-0003-3121-6050) (Professor of Health Economics) oversawthe health economics analysis, and wrote and reviewed the report.
Publications
Achten J, Parsons NR, Kearney RL, Maia Schlüssel M, Liew AS, Dutton S, et al. Cast versus functionalbrace in the rehabilitation of patients treated non-operatively for a rupture of the Achilles tendon:protocol for the UK study of tendo achilles rehabilitation (UK STAR) multi-centre randomised trial.BMJ Open 2017;7:e019628.
Marian I, Costa ML, Dutton S. Cast versus functional brace in the rehabilitation of patients with arupture of the Achilles tendon: statistical analysis plan for the UK study of tendo Achilles rehabilitation(UK STAR) multi-centre randomised controlled trial. Trials 2019;20:311.
DOI: 10.3310/hta24080 Health Technology Assessment 2020 Vol. 24 No. 8
© Queen’s Printer and Controller of HMSO 2020. This work was produced by Costa et al. under the terms of a commissioning contract issued by the Secretary of State forHealth and Social Care. This issue may be freely reproduced for the purposes of private research and study and extracts (or indeed, the full report) may be included inprofessional journals provided that suitable acknowledgement is made and the reproduction is not associated with any form of advertising. Applications for commercialreproduction should be addressed to: NIHR Journals Library, National Institute for Health Research, Evaluation, Trials and Studies Coordinating Centre, Alpha House,University of Southampton Science Park, Southampton SO16 7NS, UK.
59

Costa ML, Achten J, Marian IR, Dutton SJ, Lamb SE, Ollivere B, et al. Plaster cast versus functionalbrace for non-surgical treatment of Achilles tendon rupture (UKSTAR): a multicentre randomisedcontrolled trial and economic evaluation. Lancet 2020;395:441–8.
Data-sharing statement
All data requests should be submitted to the corresponding author for consideration. Access toavailable anonymised data may be granted following review.
Patient data
This work uses data provided by patients and collected by the NHS as part of their care and support.Using patient data is vital to improve health and care for everyone. There is huge potential to makebetter use of information from people’s patient records, to understand more about disease, developnew treatments, monitor safety, and plan NHS services. Patient data should be kept safe and secure, toprotect everyone’s privacy, and it’s important that there are safeguards to make sure that it is stored andused responsibly. Everyone should be able to find out about how patient data are used. #datasaveslivesYou can find out more about the background to this citation here: https://understandingpatientdata.org.uk/data-citation.
ACKNOWLEDGEMENTS
NIHR Journals Library www.journalslibrary.nihr.ac.uk
60

References
1. Costa ML, MacMillan K, Halliday D, Chester R, Shepstone L, Robinson AH, Donell ST.Randomised controlled trials of immediate weight-bearing mobilisation for rupture of the tendoAchillis. J Bone Joint Surg Br 2006;88:69–77. https://doi.org/10.1302/0301-620X.88B1.16549
2. Maffulli N, Waterston SW, Squair J, Reaper J, Douglas AS. Changing incidence of Achillestendon rupture in Scotland: a 15-year study. Clin J Sport Med 1999;9:157–60. https://doi.org/10.1097/00042752-199907000-00007
3. Kearney RS, Costa ML. Current concepts in the rehabilitation of an acute rupture of the tendoAchillis. J Bone Joint Surg Br 2012;94:28–31. https://doi.org/10.1302/0301-620X.94B1.28008
4. Graham R. Tendinopathy – from basic science to treatment. Nat Clin Pract Rheumatol 2008;4:82.https://doi.org/10.1038/ncprheum0700
5. Tallon C, Maffulli N, Ewen SW. Ruptured Achilles tendons are significantly more degeneratedthan tendinopathic tendons. Med Sci Sports Exerc 2001;33:1983–90. https://doi.org/10.1097/00005768-200112000-00002
6. Nistor L. Surgical and non-surgical treatment of Achilles tendon rupture. A prospectiverandomized study. J Bone Joint Surg Am 1981;63:394–9. https://doi.org/10.2106/00004623-198163030-00012
7. Khan RJ, Carey Smith RL. Surgical interventions for treating acute Achilles tendon ruptures. CochraneDatabase Syst Rev 2010;9:CD003674. https://doi.org/10.1002/14651858.CD003674.pub4
8. Metz R, Verleisdonk EJ, van der Heijden GJ, Clevers GJ, Hammacher ER, Verhofstad MH,van der Werken C. Acute Achilles tendon rupture: minimally invasive surgery versus nonoperativetreatment with immediate full weightbearing – a randomized controlled trial. Am J Sports Med2008;36:1688–94. https://doi.org/10.1177/0363546508319312
9. Willits K, Amendola A, Bryant D, Mohtadi NG, Giffin JR, Fowler P, et al. Operative versusnonoperative treatment of acute Achilles tendon ruptures: a multicenter randomized trial usingaccelerated functional rehabilitation. J Bone Joint Surg Am 2010;92:2767–75. https://doi.org/10.2106/JBJS.I.01401
10. Kearney RS, Costa ML. UK National Survey – Rehabilitation for Achilles Tendon Rupture. Coventry:University of Warwick; 2013.
11. Kearney RS, Parsons N, Underwood M, Costa ML. Achilles tendon rupture rehabilitation:a mixed methods investigation of current practice among orthopaedic surgeons in theUnited Kingdom. Bone Joint Res 2015;4:65–9. https://doi.org/10.1302/2046-3758.44.2000400
12. Healy B, Beasley R, Weatherall M. Venous thromboembolism following prolonged castimmobilisation for injury to the tendo Achillis. J Bone Joint Surg Br 2010;92:646–50.https://doi.org/10.1302/0301-620X.92B5.23241
13. Suchak AA, Spooner C, Reid DC, Jomha NM. Postoperative rehabilitation protocols for Achillestendon ruptures: a meta-analysis. Clin Orthop Relat Res 2006;445:216–21. https://doi.org/10.1097/01.blo.0000203458.05135.74
14. Costa ML, Kay D, Donell ST. Gait abnormalities following rupture of the tendo Achillis:a pedobarographic assessment. J Bone Joint Surg Br 2005;87:1085–8. https://doi.org/10.1302/0301-620X.87B8.16540
DOI: 10.3310/hta24080 Health Technology Assessment 2020 Vol. 24 No. 8
© Queen’s Printer and Controller of HMSO 2020. This work was produced by Costa et al. under the terms of a commissioning contract issued by the Secretary of State forHealth and Social Care. This issue may be freely reproduced for the purposes of private research and study and extracts (or indeed, the full report) may be included inprofessional journals provided that suitable acknowledgement is made and the reproduction is not associated with any form of advertising. Applications for commercialreproduction should be addressed to: NIHR Journals Library, National Institute for Health Research, Evaluation, Trials and Studies Coordinating Centre, Alpha House,University of Southampton Science Park, Southampton SO16 7NS, UK.
61
15. Cetti R, Henriksen LO, Jacobsen KS. A new treatment of ruptured Achilles tendons. A prospectiverandomized study. Clin Orthop Relat Res 1994;308:155–65. https://doi.org/10.1097/00003086-199411000-00022
16. Kangas J, Pajala A, Siira P, Hämäläinen M, Leppilahti J. Early functional treatment versusearly immobilization in tension of the musculotendinous unit after Achilles rupture repair:a prospective, randomized, clinical study. J Trauma 2003;54:1171–80. https://doi.org/10.1097/01.TA.0000047945.20863.A2
17. Kerkhoffs GM, Struijs PA, Raaymakers EL, Marti RK. Functional treatment after surgicalrepair of acute Achilles tendon rupture: wrap vs walking cast. Arch Orthop Trauma Surg2002;122:102–5. https://doi.org/10.1007/s004020100312
18. Maffulli N, Tallon C, Wong J, Lim KP, Bleakney R. Early weightbearing and ankle mobilizationafter open repair of acute midsubstance tears of the achilles tendon. Am J Sports Med2003;31:692–700. https://doi.org/10.1177/03635465030310051001
19. Mortensen HM, Skov O, Jensen PE. Early motion of the ankle after operative treatment of arupture of the Achilles tendon. A prospective, randomized clinical and radiographic study.J Bone Joint Surg Am 1999;81:983–90. https://doi.org/10.2106/00004623-199907000-00011
20. Suchak AA, Bostick GP, Beaupré LA, Durand DC, Jomha NM. The influence of early weight-bearing compared with non-weight-bearing after surgical repair of the Achilles tendon. J BoneJoint Surg Am 2008;90:1876–83. https://doi.org/10.2106/JBJS.G.01242
21. American Academy of Orthopaedic Surgeons (AAOS). The Diagnosis and Treatment of AcuteAchilles Tendon Rupture: Guideline and Evidence Report. Rosemont, IL: AAOS; 2009.
22. Saleh M, Marshall PD, Senior R, MacFarlane A. The Sheffield splint for controlled earlymobilisation after rupture of the calcaneal tendon. A prospective, randomised comparison withplaster treatment. J Bone Joint Surg Br 1992;74:206–9. https://doi.org/10.1302/0301-620X.74B2.1544953
23. Petersen OF, Nielsen MB, Jensen KH, Solgaard S. [Randomized comparison of CAM walker andlight-weight plaster cast in the treatment of first-time Achilles tendon rupture.] Ugeskr Laeg2002;164:3852–5.
24. Valkering KP, Aufwerber S, Ranuccio F, Lunini E, Edman G, Ackermann PW. Functionalweight-bearing mobilization after Achilles tendon rupture enhances early healing response:a single-blinded randomized controlled trial. Knee Surg Sports Traumatol Arthrosc2017;25:1807–16. https://doi.org/10.1007/s00167-016-4270-3
25. Barfod KW, Bencke J, Lauridsen HB, Dippmann C, Ebskov L, Troelsen A. Nonoperative, dynamictreatment of acute achilles tendon rupture: influence of early weightbearing on biomechanicalproperties of the plantar flexor muscle-tendon complex-a blinded, randomized, controlled trial.J Foot Ankle Surg 2015;54:220–6. https://doi.org/10.1053/j.jfas.2014.11.018
26. Korkmaz M, Erkoc MF, Yolcu S, Balbaloglu O, Oztemur Z, Karaaslan F. Weight bearing thesame day versus non-weight bearing for 4 weeks in Achilles tendon rupture. J Orthop Sci2015;20:513–16. https://doi.org/10.1007/s00776-015-0710-z
27. Young SW, Patel A, Zhu M, van Dijck S, McNair P, Bevan WP, Tomlinson M. Weight-bearingin the nonoperative treatment of acute achilles tendon ruptures: a randomized controlled trial.J Bone Joint Surg Am 2014;96:1073–9. https://doi.org/10.2106/JBJS.M.00248
28. Barfod KW, Hansen MS, Hölmich P, Kristensen MT, Troelsen A. Efficacy of early controlled motionof the ankle compared with immobilisation in non-operative treatment of patients with an acuteAchilles tendon rupture: an assessor-blinded, randomised controlled trial [published online aheadof print October 9 2019]. Br J Sports Med 2019. https://doi.org/10.1136/bjsports-2019-100709
REFERENCES
NIHR Journals Library www.journalslibrary.nihr.ac.uk
62
29. Kearney RS, Lamb SE, Achten J, Parsons NR, Costa ML. In-shoe plantar pressures withinankle-foot orthoses: implications for the management of achilles tendon ruptures. Am J SportsMed 2011;39:2679–85. https://doi.org/10.1177/0363546511420809
30. Kearney RS, McGuinness KR, Achten J, Costa ML. A systematic review of early rehabilitationmethods following a rupture of the Achilles tendon. Physiotherapy 2012;98:24–32.https://doi.org/10.1016/j.physio.2011.04.349
31. Nilsson-Helander K, Thomeé R, Silbernagel KG, Grävare-Silbernagel K, Thomeé P, Faxén E, et al.The Achilles tendon Total Rupture Score (ATRS): development and validation. Am J Sports Med2007;35:421–6. https://doi.org/10.1177/0363546506294856
32. Kearney RS, Achten J, Lamb SE, Parsons N, Costa ML. The Achilles tendon total rupture score:a study of responsiveness, internal consistency and convergent validity on patients with acuteAchilles tendon ruptures. Health Qual Life Outcomes 2012;10:24. https://doi.org/10.1186/1477-7525-10-24
33. van Hout B, Janssen MF, Feng YS, Kohlmann T, Busschbach J, Golicki D, et al. Interimscoring for the EQ-5D-5L: mapping the EQ-5D-5L to EQ-5D-3L value sets. Value Health2012;15:708–15. https://doi.org/10.1016/j.jval.2012.02.008
34. Kearney RS, Achten J, Parsons NR, Costa ML. The comprehensive cohort model in a pilottrial in orthopaedic trauma. BMC Med Res Methodol 2011;11:39. https://doi.org/10.1186/1471-2288-11-39
35. Dunn G, Maracy M, Tomenson B. Estimating treatment effects from randomized clinical trialswith noncompliance and loss to follow-up: the role of instrumental variable methods. StatMethods Med Res 2005;14:369–95. https://doi.org/10.1191/0962280205sm403oa
36. Calvert M, Blazeby J, Altman DG, Revicki DA, Moher D, Brundage MD, CONSORT PRO Group.Reporting of patient-reported outcomes in randomized trials: the CONSORT PRO extension.JAMA 2013;309:814–22. https://doi.org/10.1001/jama.2013.879
37. Bell ML, King MT, Fairclough DL. Bias in area under the curve for longitudinal clinical trialswith missing patient reported outcome data: summary measures versus summary statistics.Sage Open 2014;4. https://doi.org/10.1177/2158244014534858
38. National Institute for Health and Care Excellence (NICE). Guide to the Methods of TechnologyAppraisal. London: NICE; 2013.
39. Curtis L, Burns A. Unit Costs of Health and Social Care 2018. Canterbury: Personal SocialServices Research Unit, University of Kent; 2018.
40. NHS. NHS Supply Chain. 2018. URL: https://my.supplychain.nhs.uk/catalogue (accessed18 July 2018).
41. NHS Improvement. Reference Costs 2017/18. Leeds: NHS Digital; 2018.
42. NHS Digital. Prescription Cost Analysis – England, 2018. Leeds: NHS Digital; 2019.
43. Joint Formulary Committee. British National Formulary. (online). London: BMJ Groupand Pharmaceutical Press. URL: www.evidence.nhs.uk/formulary/bnf/current (accessed6 May 2019).
44. Office for National Statistics. Employee Earnings in the UK: 2018. Newport: Office for NationalStatistics; 2018.
45. NHS Improvement. NHS Reference Costs 2016–17. Leeds: NHS Digital; 2018.
DOI: 10.3310/hta24080 Health Technology Assessment 2020 Vol. 24 No. 8
© Queen’s Printer and Controller of HMSO 2020. This work was produced by Costa et al. under the terms of a commissioning contract issued by the Secretary of State forHealth and Social Care. This issue may be freely reproduced for the purposes of private research and study and extracts (or indeed, the full report) may be included inprofessional journals provided that suitable acknowledgement is made and the reproduction is not associated with any form of advertising. Applications for commercialreproduction should be addressed to: NIHR Journals Library, National Institute for Health Research, Evaluation, Trials and Studies Coordinating Centre, Alpha House,University of Southampton Science Park, Southampton SO16 7NS, UK.
63
46. Claxton K, Martin S, Soares M, Rice N, Spackman E, Hinde S, et al. Methods for the estimationof the National Institute for Health and Care Excellence cost-effectiveness threshold. HealthTechnol Assess 2015;19(14). https://doi.org/10.3310/hta19140
47. Leurent B, Gomes M, Faria R, Morris S, Grieve R, Carpenter JR. Sensitivity analysis fornot-at-random missing data in trial-based cost-effectiveness analysis: a tutorial. PharmacoEconomics2018;36:889–901. https://doi.org/10.1007/s40273-018-0650-5
48. DAMOCLES Study Group. A proposed charter for clinical trial data monitoring committees:helping them to do their job well. Lancet 2005;365:711–22. https://doi.org/10.1016/S0140-6736(05)17965-3
49. Costa ML, Achten J, Marian IR, Dutton SJ, Lamb SE, Ollivere B, et al. Plaster cast versusfunctional brace for non-surgical treatment of Achilles tendon rupture (UKSTAR): a multicentrerandomised controlled trial and economic evaluation. Lancet 2020;395:441–8. https://doi.org/10.1016/S0140-6736(19)32942-3
50. Parsons N, Griffin XL, Achten J, Costa ML. Outcome assessment after hip fracture: is EQ-5Dthe answer? Bone Joint Res 2014;3:69–75. https://doi.org/10.1302/2046-3758.33.2000250
51. Capital Physio. Physiotherapy Prices. 2019. URL: www.capitalphysio.com/fees-and-payment/(accessed 30 September 2019).
52. Curtis LA, Burns A. Unit Costs of Health and Social Care 2015. Canterbury: Personal SocialServices Research Unit, University of Kent; 2015.
53. Turner J, O’Cathain A, Knowles E, Nichol J, Sampson F, Coleman P, et al. Evaluation of NHS 111Pilot Sites. Sheffield: University of Sheffield; 2012.
54. Curtis LA, Burns A. Unit Costs of Health and Social Care 2017. Canterbury: Personal SocialServices Research Unit, University of Kent; 2017.
55. National Association of Care Catering. Meals on Wheels Survey 2018. 2018. URL: http://costsectorcatering.co.uk/sites/default/files/attachment/nacc_-_meals_on_wheels_report_2018.pdf(accessed 5 June 2019).
56. Keene DJ, Alsousou J, Harrison P, Hulley P, Wagland S, Parsons SR, et al. Platelet rich plasmainjection for acute Achilles tendon rupture: PATH-2 randomised, placebo controlled, superioritytrial. BMJ 2019;367:l6132. https://doi.org/10.1136/bmj.l6132
REFERENCES
NIHR Journals Library www.journalslibrary.nihr.ac.uk
64
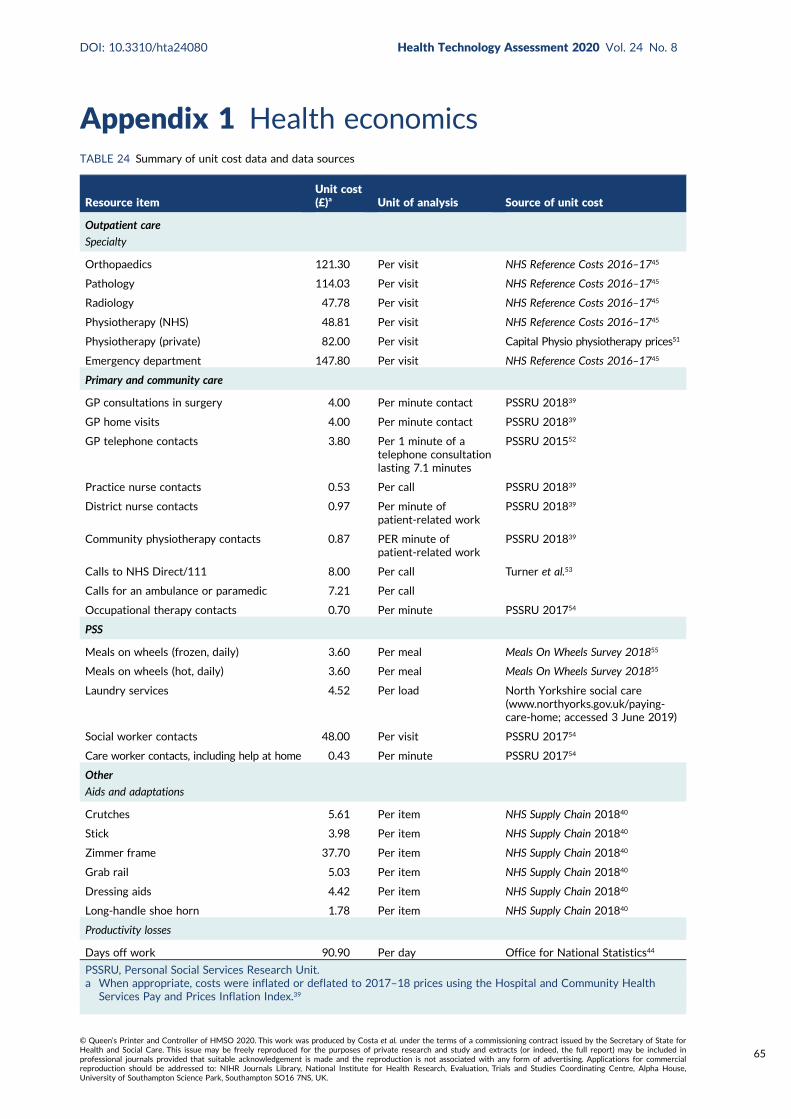
Appendix 1 Health economicsTABLE 24 Summary of unit cost data and data sources
Resource itemUnit cost(£)a Unit of analysis Source of unit cost
Outpatient care
Specialty
Orthopaedics 121.30 Per visit NHS Reference Costs 2016–1745
Pathology 114.03 Per visit NHS Reference Costs 2016–1745
Radiology 47.78 Per visit NHS Reference Costs 2016–1745
Physiotherapy (NHS) 48.81 Per visit NHS Reference Costs 2016–1745
Physiotherapy (private) 82.00 Per visit Capital Physio physiotherapy prices51
Emergency department 147.80 Per visit NHS Reference Costs 2016–1745
Primary and community care
GP consultations in surgery 4.00 Per minute contact PSSRU 201839
GP home visits 4.00 Per minute contact PSSRU 201839
GP telephone contacts 3.80 Per 1 minute of atelephone consultationlasting 7.1 minutes
PSSRU 201552
Practice nurse contacts 0.53 Per call PSSRU 201839
District nurse contacts 0.97 Per minute ofpatient-related work
PSSRU 201839
Community physiotherapy contacts 0.87 PER minute ofpatient-related work
PSSRU 201839
Calls to NHS Direct/111 8.00 Per call Turner et al.53
Calls for an ambulance or paramedic 7.21 Per call
Occupational therapy contacts 0.70 Per minute PSSRU 201754
PSS
Meals on wheels (frozen, daily) 3.60 Per meal Meals On Wheels Survey 201855
Meals on wheels (hot, daily) 3.60 Per meal Meals On Wheels Survey 201855
Laundry services 4.52 Per load North Yorkshire social care(www.northyorks.gov.uk/paying-care-home; accessed 3 June 2019)
Social worker contacts 48.00 Per visit PSSRU 201754
Care worker contacts, including help at home 0.43 Per minute PSSRU 201754
Other
Aids and adaptations
Crutches 5.61 Per item NHS Supply Chain 201840
Stick 3.98 Per item NHS Supply Chain 201840
Zimmer frame 37.70 Per item NHS Supply Chain 201840
Grab rail 5.03 Per item NHS Supply Chain 201840
Dressing aids 4.42 Per item NHS Supply Chain 201840
Long-handle shoe horn 1.78 Per item NHS Supply Chain 201840
Productivity losses
Days off work 90.90 Per day Office for National Statistics44
PSSRU, Personal Social Services Research Unit.a When appropriate, costs were inflated or deflated to 2017–18 prices using the Hospital and Community Health
Services Pay and Prices Inflation Index.39
DOI: 10.3310/hta24080 Health Technology Assessment 2020 Vol. 24 No. 8
© Queen’s Printer and Controller of HMSO 2020. This work was produced by Costa et al. under the terms of a commissioning contract issued by the Secretary of State forHealth and Social Care. This issue may be freely reproduced for the purposes of private research and study and extracts (or indeed, the full report) may be included inprofessional journals provided that suitable acknowledgement is made and the reproduction is not associated with any form of advertising. Applications for commercialreproduction should be addressed to: NIHR Journals Library, National Institute for Health Research, Evaluation, Trials and Studies Coordinating Centre, Alpha House,University of Southampton Science Park, Southampton SO16 7NS, UK.
65
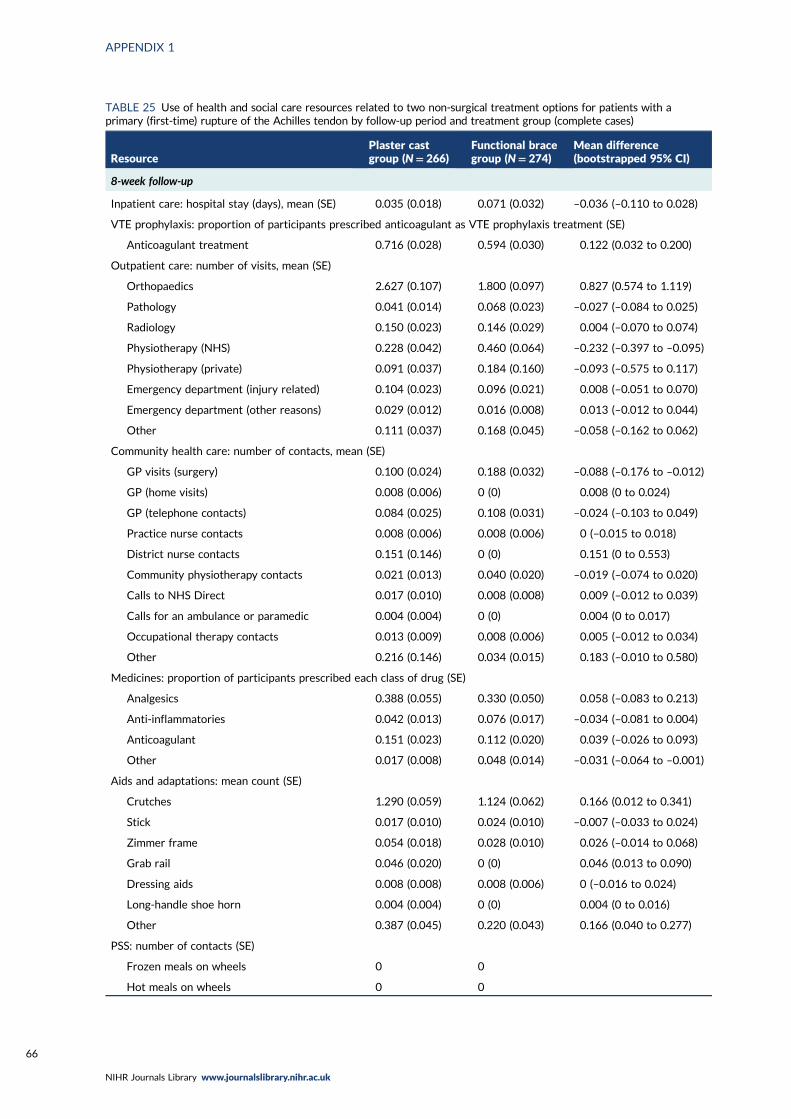
TABLE 25 Use of health and social care resources related to two non-surgical treatment options for patients with aprimary (first-time) rupture of the Achilles tendon by follow-up period and treatment group (complete cases)
ResourcePlaster castgroup (N= 266)
Functional bracegroup (N= 274)
Mean difference(bootstrapped 95% CI)
8-week follow-up
Inpatient care: hospital stay (days), mean (SE) 0.035 (0.018) 0.071 (0.032) –0.036 (–0.110 to 0.028)
VTE prophylaxis: proportion of participants prescribed anticoagulant as VTE prophylaxis treatment (SE)
Anticoagulant treatment 0.716 (0.028) 0.594 (0.030) 0.122 (0.032 to 0.200)
Outpatient care: number of visits, mean (SE)
Orthopaedics 2.627 (0.107) 1.800 (0.097) 0.827 (0.574 to 1.119)
Pathology 0.041 (0.014) 0.068 (0.023) –0.027 (–0.084 to 0.025)
Radiology 0.150 (0.023) 0.146 (0.029) 0.004 (–0.070 to 0.074)
Physiotherapy (NHS) 0.228 (0.042) 0.460 (0.064) –0.232 (–0.397 to –0.095)
Physiotherapy (private) 0.091 (0.037) 0.184 (0.160) –0.093 (–0.575 to 0.117)
Emergency department (injury related) 0.104 (0.023) 0.096 (0.021) 0.008 (–0.051 to 0.070)
Emergency department (other reasons) 0.029 (0.012) 0.016 (0.008) 0.013 (–0.012 to 0.044)
Other 0.111 (0.037) 0.168 (0.045) –0.058 (–0.162 to 0.062)
Community health care: number of contacts, mean (SE)
GP visits (surgery) 0.100 (0.024) 0.188 (0.032) –0.088 (–0.176 to –0.012)
GP (home visits) 0.008 (0.006) 0 (0) 0.008 (0 to 0.024)
GP (telephone contacts) 0.084 (0.025) 0.108 (0.031) –0.024 (–0.103 to 0.049)
Practice nurse contacts 0.008 (0.006) 0.008 (0.006) 0 (–0.015 to 0.018)
District nurse contacts 0.151 (0.146) 0 (0) 0.151 (0 to 0.553)
Community physiotherapy contacts 0.021 (0.013) 0.040 (0.020) –0.019 (–0.074 to 0.020)
Calls to NHS Direct 0.017 (0.010) 0.008 (0.008) 0.009 (–0.012 to 0.039)
Calls for an ambulance or paramedic 0.004 (0.004) 0 (0) 0.004 (0 to 0.017)
Occupational therapy contacts 0.013 (0.009) 0.008 (0.006) 0.005 (–0.012 to 0.034)
Other 0.216 (0.146) 0.034 (0.015) 0.183 (–0.010 to 0.580)
Medicines: proportion of participants prescribed each class of drug (SE)
Analgesics 0.388 (0.055) 0.330 (0.050) 0.058 (–0.083 to 0.213)
Anti-inflammatories 0.042 (0.013) 0.076 (0.017) –0.034 (–0.081 to 0.004)
Anticoagulant 0.151 (0.023) 0.112 (0.020) 0.039 (–0.026 to 0.093)
Other 0.017 (0.008) 0.048 (0.014) –0.031 (–0.064 to –0.001)
Aids and adaptations: mean count (SE)
Crutches 1.290 (0.059) 1.124 (0.062) 0.166 (0.012 to 0.341)
Stick 0.017 (0.010) 0.024 (0.010) –0.007 (–0.033 to 0.024)
Zimmer frame 0.054 (0.018) 0.028 (0.010) 0.026 (–0.014 to 0.068)
Grab rail 0.046 (0.020) 0 (0) 0.046 (0.013 to 0.090)
Dressing aids 0.008 (0.008) 0.008 (0.006) 0 (–0.016 to 0.024)
Long-handle shoe horn 0.004 (0.004) 0 (0) 0.004 (0 to 0.016)
Other 0.387 (0.045) 0.220 (0.043) 0.166 (0.040 to 0.277)
PSS: number of contacts (SE)
Frozen meals on wheels 0 0
Hot meals on wheels 0 0
APPENDIX 1
NIHR Journals Library www.journalslibrary.nihr.ac.uk
66
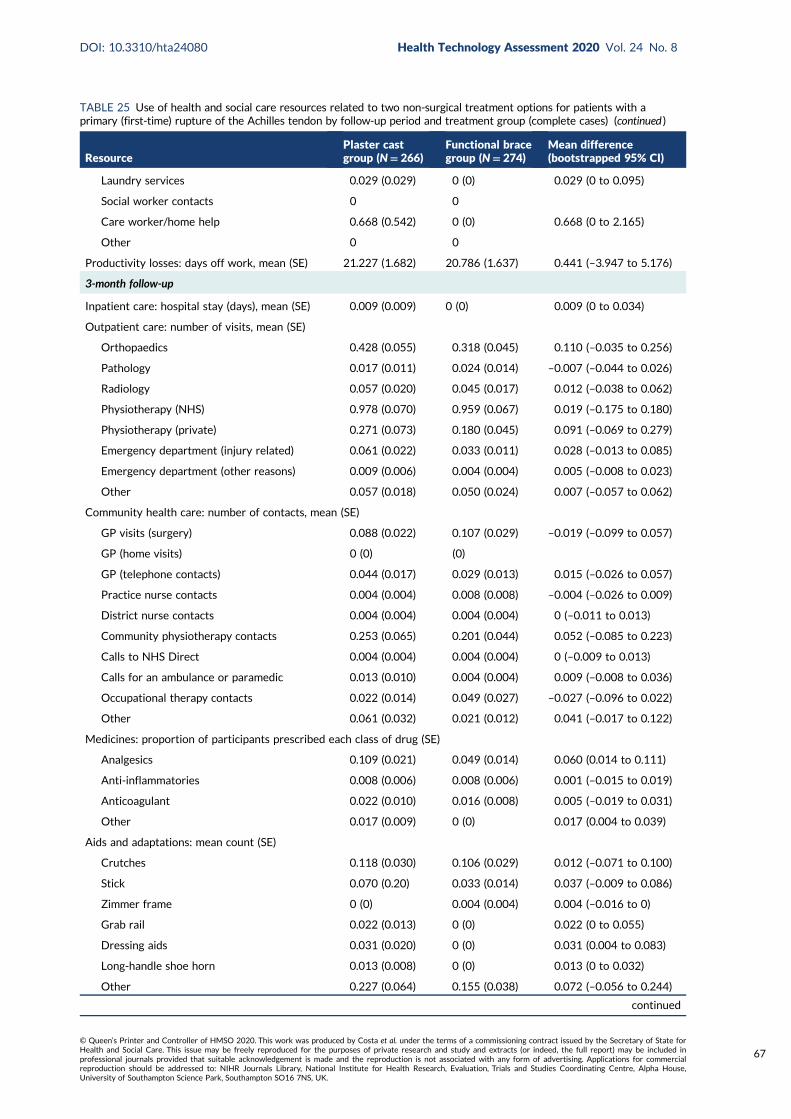
TABLE 25 Use of health and social care resources related to two non-surgical treatment options for patients with aprimary (first-time) rupture of the Achilles tendon by follow-up period and treatment group (complete cases) (continued )
ResourcePlaster castgroup (N= 266)
Functional bracegroup (N= 274)
Mean difference(bootstrapped 95% CI)
Laundry services 0.029 (0.029) 0 (0) 0.029 (0 to 0.095)
Social worker contacts 0 0
Care worker/home help 0.668 (0.542) 0 (0) 0.668 (0 to 2.165)
Other 0 0
Productivity losses: days off work, mean (SE) 21.227 (1.682) 20.786 (1.637) 0.441 (–3.947 to 5.176)
3-month follow-up
Inpatient care: hospital stay (days), mean (SE) 0.009 (0.009) 0 (0) 0.009 (0 to 0.034)
Outpatient care: number of visits, mean (SE)
Orthopaedics 0.428 (0.055) 0.318 (0.045) 0.110 (–0.035 to 0.256)
Pathology 0.017 (0.011) 0.024 (0.014) –0.007 (–0.044 to 0.026)
Radiology 0.057 (0.020) 0.045 (0.017) 0.012 (–0.038 to 0.062)
Physiotherapy (NHS) 0.978 (0.070) 0.959 (0.067) 0.019 (–0.175 to 0.180)
Physiotherapy (private) 0.271 (0.073) 0.180 (0.045) 0.091 (–0.069 to 0.279)
Emergency department (injury related) 0.061 (0.022) 0.033 (0.011) 0.028 (–0.013 to 0.085)
Emergency department (other reasons) 0.009 (0.006) 0.004 (0.004) 0.005 (–0.008 to 0.023)
Other 0.057 (0.018) 0.050 (0.024) 0.007 (–0.057 to 0.062)
Community health care: number of contacts, mean (SE)
GP visits (surgery) 0.088 (0.022) 0.107 (0.029) –0.019 (–0.099 to 0.057)
GP (home visits) 0 (0) (0)
GP (telephone contacts) 0.044 (0.017) 0.029 (0.013) 0.015 (–0.026 to 0.057)
Practice nurse contacts 0.004 (0.004) 0.008 (0.008) –0.004 (–0.026 to 0.009)
District nurse contacts 0.004 (0.004) 0.004 (0.004) 0 (–0.011 to 0.013)
Community physiotherapy contacts 0.253 (0.065) 0.201 (0.044) 0.052 (–0.085 to 0.223)
Calls to NHS Direct 0.004 (0.004) 0.004 (0.004) 0 (–0.009 to 0.013)
Calls for an ambulance or paramedic 0.013 (0.010) 0.004 (0.004) 0.009 (–0.008 to 0.036)
Occupational therapy contacts 0.022 (0.014) 0.049 (0.027) –0.027 (–0.096 to 0.022)
Other 0.061 (0.032) 0.021 (0.012) 0.041 (–0.017 to 0.122)
Medicines: proportion of participants prescribed each class of drug (SE)
Analgesics 0.109 (0.021) 0.049 (0.014) 0.060 (0.014 to 0.111)
Anti-inflammatories 0.008 (0.006) 0.008 (0.006) 0.001 (–0.015 to 0.019)
Anticoagulant 0.022 (0.010) 0.016 (0.008) 0.005 (–0.019 to 0.031)
Other 0.017 (0.009) 0 (0) 0.017 (0.004 to 0.039)
Aids and adaptations: mean count (SE)
Crutches 0.118 (0.030) 0.106 (0.029) 0.012 (–0.071 to 0.100)
Stick 0.070 (0.20) 0.033 (0.014) 0.037 (–0.009 to 0.086)
Zimmer frame 0 (0) 0.004 (0.004) 0.004 (–0.016 to 0)
Grab rail 0.022 (0.013) 0 (0) 0.022 (0 to 0.055)
Dressing aids 0.031 (0.020) 0 (0) 0.031 (0.004 to 0.083)
Long-handle shoe horn 0.013 (0.008) 0 (0) 0.013 (0 to 0.032)
Other 0.227 (0.064) 0.155 (0.038) 0.072 (–0.056 to 0.244)
continued
DOI: 10.3310/hta24080 Health Technology Assessment 2020 Vol. 24 No. 8
© Queen’s Printer and Controller of HMSO 2020. This work was produced by Costa et al. under the terms of a commissioning contract issued by the Secretary of State forHealth and Social Care. This issue may be freely reproduced for the purposes of private research and study and extracts (or indeed, the full report) may be included inprofessional journals provided that suitable acknowledgement is made and the reproduction is not associated with any form of advertising. Applications for commercialreproduction should be addressed to: NIHR Journals Library, National Institute for Health Research, Evaluation, Trials and Studies Coordinating Centre, Alpha House,University of Southampton Science Park, Southampton SO16 7NS, UK.
67

TABLE 25 Use of health and social care resources related to two non-surgical treatment options for patients with aprimary (first-time) rupture of the Achilles tendon by follow-up period and treatment group (complete cases) (continued )
ResourcePlaster castgroup (N= 266)
Functional bracegroup (N= 274)
Mean difference(bootstrapped 95% CI)
PSS: number of contacts (SE)
Frozen meals on wheels 0 (0) 0 (0)
Hot meals on wheels 0 (0) 0 (0)
Laundry services 0 (0) 0.008 (0.008) –0.008 (–0.033 to 0)
Social worker contacts 0 (0) 0 (0)
Care worker/home help 0 (0) 0 (0)
Other 0.009 (0.009) 0 (0) 0.009 (0 to 0.029)
Productivity losses: days off work, mean (SE) 4.511 (0.820) 5.44 (0.880) –0.930 (–3.342 to 1.494)
6-month follow-up
Subsequent inpatient care: hospital stay (days),mean (SE)
0 (0) 0 (0)
Outpatient care: number of visits, mean (SE)
Orthopaedics 0.224 (0.043) 0.289 (0.059) –0.065 (–0.230 to 0.071)
Pathology 0.018 (0.011) 0.030 (0.015) –0.012 (–0.048 to 0.024)
Radiology 0.044 (0.015) 0.033 (0.012) 0.011 (–0.027 to 0.050)
Physiotherapy (NHS) 1.946 (0.257) 1.915 (0.182) 0.031 (–0.550 to 0.674)
Physiotherapy (private) 0.417 (0.103) 0.366 (0.091) 0.051 (–0.218 to 0.316)
Emergency department (injury related) 0.013 (0.008) 0.026 (0.010) –0.012 (–0.039 to 0.014)
Emergency department (other reasons) 0.013 (0.008) 0.017 (0.008) –0.004 (–0.026 to 0.018)
Other 0.093 (0.031) 0.067 (0.031) 0.026 (–0.065 to 0.103)
Community health care: number of contacts, mean (SE)
GP visits (surgery) 0.094 (0.037) 0.060 (0.018) 0.035 (–0.034 to 0.122)
GP (home visits) 0 (0) 0.009 (0.009) –0.009 (–0.028 to 0)
GP (telephone contacts) 0.018 (0.011) 0.021 (0.015) –0.003 (–0.046 to 0.031)
Practice nurse contacts 0 (0) 0.004 (0.004) –0.004 (–0.017 to 0)
District nurse contacts 0 (0) 0 (0)
Community physiotherapy contacts 0.605 (0.187) 0.557 (0.101) 0.048 (–0.311 to 0.547)
Calls to NHS Direct 0 (0) 0 (0)
Calls for an ambulance or paramedic 0 (0) 0 (0)
Occupational therapy contacts 0.067 (0.033) 0.043 (0.023) 0.025 (–0.054 to 0.115)
Other 0.058 (0.043) 0.106 (0.077) –0.048 (–0.264 to 0.085)
Medicines: proportion of participants prescribed each class of drug (SE)
Analgesics 0.103 (0.020) 0.064 (0.016) 0.040 (–0.008 to 0.090)
Anti-inflammatories 0.009 (0.006) 0.021 (0.009) –0.012 (–0.036 to 0.009)
Anticoagulant 0.004 (0.004) 0.013 (0.007) –0.008 (–0.025 to 0.009)
Other 0.009 (0.006) 0.008 (0.006) 0 (–0.013 to 0.019)
Aids and adaptations: mean count (SE)
Crutches 0.054 (0.021) 0.051 (0.020) 0.003 (–0.051 to 0.066)
Stick 0.031 (0.012) 0.030 (0.015) 0.002 (–0.041 to 0.035)
Zimmer frame 0.009 (0.009) 0.013 (0.007) –0.004 (–0.022)
Grab rail 0.018 (0.011) 0.008 (0.008) 0.009 (–0.013 to 0.038)
APPENDIX 1
NIHR Journals Library www.journalslibrary.nihr.ac.uk
68

TABLE 25 Use of health and social care resources related to two non-surgical treatment options for patients with aprimary (first-time) rupture of the Achilles tendon by follow-up period and treatment group (complete cases) (continued )
ResourcePlaster castgroup (N= 266)
Functional bracegroup (N= 274)
Mean difference(bootstrapped 95% CI)
Dressing aids 0 (0) 0 (0)
Long-handle shoe horn 0.018 (0.009) 0.008 (0.006) 0.009 (–0.009 to 0.032)
Other 0.144 (0.047) 0.091 (0.030) 0.054 (–0.031 to 0.188)
PSS: number of contacts (SE)
Frozen meals on wheels 0 (0) 0 (0)
Hot meals on wheels 0 (0) 0 (0)
Laundry services 0 (0) 0 (0)
Social worker contacts 0 (0) 0 (0)
Care worker/home help 0.036 (0.036) 0 (0) 0.036 (0 to 0.138)
Other 0 (0) 0 (0)
Productivity losses: days off work, mean (SE) 1.894 (0.743) 4.301 (1.172) –2.407 (–5.642 to –0.110)
9-month follow-up
Subsequent inpatient care: hospital stay (days),mean (SE)
0 (0) 0 (0)
Outpatient care: number of visits, mean (SE)
Orthopaedics 0.090 (0.024) 0.077 (0.030) 0.013 (–0.060 to 0.081)
Pathology 0.016 (0.008) 0.073 (0.027) –0.057 (–0.120 to –0.012)
Radiology 0.029 (0.011) 0.012 (0.009) 0.017 (–0.005 to 0.047)
Physiotherapy (NHS) 0.709 (0.108) 0.857 (0.147) –0.148 (–0.540 to 0.178)
Physiotherapy (private) 0.234 (0.073) 0.174 (0.058) 0.060 (–0.103 to 0.260)
Emergency department (injury related) 0.004 (0.004) 0.008 (0.005) –0.004 (–0.016 to 0.012)
Emergency department (other reasons) 0.020 (0.011) 0.030 (0.014) –0.010 (–0.051 to 0.019)
Other 0.140 (0.058) 0.089 (0.045) 0.051 (–0.090 to 0.206)
Community health care: number of contacts, mean (SE)
GP visits (surgery) 0.058 (0.024) 0.046 (0.017) 0.011 (–0.046 to 0.072)
GP (home visits) 0 (0) 0 (0)
GP (telephone contacts) 0.008 (0.006) 0.004 (0.004) 0.004 (–0.007 to 0.021)
Practice nurse contacts 0 (0) 0.004 (0.004) –0.004 (–0.016 to 0)
District nurse contacts 0 (0) 0 (0)
Community physiotherapy contacts 0.169 (0.052) 0.255 (0.066) –0.085 (–0.258 to 0.071)
Calls to NHS Direct 0 (0) 0 (0)
Calls for an ambulance or paramedic 0 (0) 0 (0)
Occupational therapy contacts 0.074 (0.038) 0.031 (0.017) 0.043 (–0.033 to 0.128)
Other 0.136 (0.070) 0.131 (0.100) 0.005 (–0.307 to 0.214)
Medicines: proportion of participants prescribed each class of drug (SE)
Analgesics 0.037 (0.012) 0.031 (0.011) 0.006 (–0.027 to 0.037)
Anti-inflammatories 0.012 (0.007) 0 (0) 0.012 (0 to 0.029)
Anticoagulant 0.004 (0.004) 0 (0) 0.004 (0 to 0.016)
Other 0.004 (0.004) 0.004 (0.004) 0 (–0.008 to 0.016)
continued
DOI: 10.3310/hta24080 Health Technology Assessment 2020 Vol. 24 No. 8
© Queen’s Printer and Controller of HMSO 2020. This work was produced by Costa et al. under the terms of a commissioning contract issued by the Secretary of State forHealth and Social Care. This issue may be freely reproduced for the purposes of private research and study and extracts (or indeed, the full report) may be included inprofessional journals provided that suitable acknowledgement is made and the reproduction is not associated with any form of advertising. Applications for commercialreproduction should be addressed to: NIHR Journals Library, National Institute for Health Research, Evaluation, Trials and Studies Coordinating Centre, Alpha House,University of Southampton Science Park, Southampton SO16 7NS, UK.
69
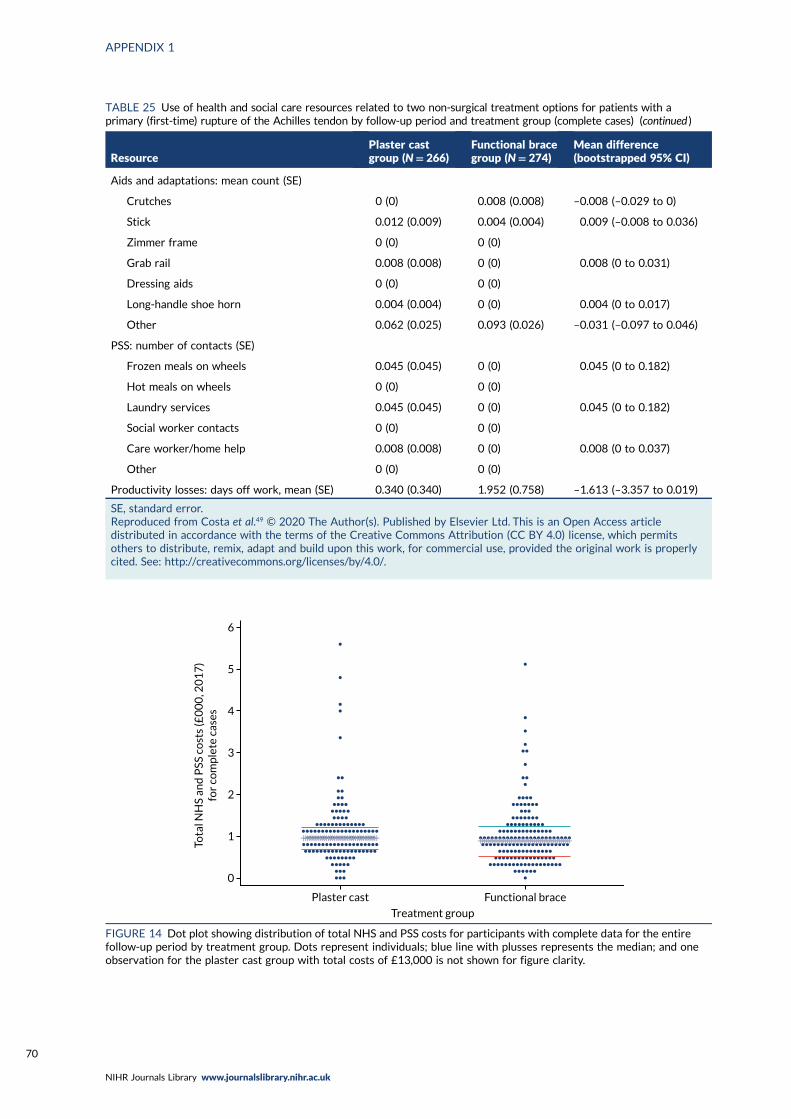
TABLE 25 Use of health and social care resources related to two non-surgical treatment options for patients with aprimary (first-time) rupture of the Achilles tendon by follow-up period and treatment group (complete cases) (continued )
ResourcePlaster castgroup (N= 266)
Functional bracegroup (N= 274)
Mean difference(bootstrapped 95% CI)
Aids and adaptations: mean count (SE)
Crutches 0 (0) 0.008 (0.008) –0.008 (–0.029 to 0)
Stick 0.012 (0.009) 0.004 (0.004) 0.009 (–0.008 to 0.036)
Zimmer frame 0 (0) 0 (0)
Grab rail 0.008 (0.008) 0 (0) 0.008 (0 to 0.031)
Dressing aids 0 (0) 0 (0)
Long-handle shoe horn 0.004 (0.004) 0 (0) 0.004 (0 to 0.017)
Other 0.062 (0.025) 0.093 (0.026) –0.031 (–0.097 to 0.046)
PSS: number of contacts (SE)
Frozen meals on wheels 0.045 (0.045) 0 (0) 0.045 (0 to 0.182)
Hot meals on wheels 0 (0) 0 (0)
Laundry services 0.045 (0.045) 0 (0) 0.045 (0 to 0.182)
Social worker contacts 0 (0) 0 (0)
Care worker/home help 0.008 (0.008) 0 (0) 0.008 (0 to 0.037)
Other 0 (0) 0 (0)
Productivity losses: days off work, mean (SE) 0.340 (0.340) 1.952 (0.758) –1.613 (–3.357 to 0.019)
SE, standard error.Reproduced from Costa et al.49 © 2020 The Author(s). Published by Elsevier Ltd. This is an Open Access articledistributed in accordance with the terms of the Creative Commons Attribution (CC BY 4.0) license, which permitsothers to distribute, remix, adapt and build upon this work, for commercial use, provided the original work is properlycited. See: http://creativecommons.org/licenses/by/4.0/.
Plaster cast
Tota
l NH
S an
d P
SS c
ost
s (£
00
0, 2
01
7)
for
com
ple
te c
ases
0
1
2
3
4
5
6
Functional brace
Treatment group
FIGURE 14 Dot plot showing distribution of total NHS and PSS costs for participants with complete data for the entirefollow-up period by treatment group. Dots represent individuals; blue line with plusses represents the median; and oneobservation for the plaster cast group with total costs of £13,000 is not shown for figure clarity.
APPENDIX 1
NIHR Journals Library www.journalslibrary.nihr.ac.uk
70

–16
–0.08 –0.06 –0.04 –0.02 0.02 0.04 0.06 0.080
–12
–8
–4
0
4
8
12
16
(a)
Incremental QALY
Incr
emen
tal c
ost
(£0
0)
–16
–0.08 –0.06 –0.04 –0.02 0.02 0.04 0.06 0.080
–12
–8
–4
0
4
8
12
16
(b)
Incremental QALY
Incr
emen
tal c
ost
(£0
0)
–16
–0.08 –0.06 –0.04 –0.02 0.02 0.04 0.06 0.080
–12
–8
–4
0
4
8
12
16
(c)
Incremental QALY
Incr
emen
tal c
ost
(£0
0)
–16
–0.08 –0.06 –0.04 –0.02 0.02 0.04 0.06 0.080
–12
–8
–4
0
4
8
12
16
(d)
Incremental QALY
Incr
emen
tal c
ost
(£0
0)
–16
–0.08 –0.06 –0.04 –0.02 0.02 0.04 0.06 0.080
–12
–8
–4
0
4
8
12
16
(e)
Incremental QALY
Incr
emen
tal c
ost
(£0
0)
–16
–0.08 –0.06 –0.04 –0.02 0.02 0.04 0.06 0.080
–12
–8
–4
0
4
8
12
16
(f)
Incremental QALY
Incr
emen
tal c
ost
(£0
0)
–16
–0.08 –0.06 –0.04 –0.02 0.02 0.04 0.06 0.080
–12
–8
–4
0
4
8
12
16
(g)
Incremental QALY
Incr
emen
tal c
ost
(£0
0)
–16
–0.08 –0.06 –0.04 –0.02 0.02 0.04 0.06 0.080
–12
–8
–4
0
4
8
12
16
(h)
Incremental QALY
Incr
emen
tal c
ost
(£0
0)
FIGURE 15 Cost-effectiveness planes under different MNAR assumptions. (a) 1 (1,1,1,1); (b) 2 (0.9,0.9,1,1); (c) 3 (1,1,1.1,1.1);(d) 4 (0.9,0.9,1.1,1.1); (e) 5 (1,0.9,1,1); (f) 6 (0.9,1,1,1); (g) 7 (1,1,1,1.1); and (h) 8 (1,1,1.1,1). These headings indicate the scenarionumber and the MNAR rescaling parameters (c plaster cast, c functional brace). For example, in scenario 2 (0.9, 0.9, 1,1)imputed QoL values have been reduced by 10% in both treatment groups, but no adjustment has been made for costs,whereas in scenario 7 (1, 1,1.1,1) imputed costs increased by 10% in the plaster cast group only and no other adjustment wasmade for imputed QALYs in either group or on imputed costs in the functional brace group.
DOI: 10.3310/hta24080 Health Technology Assessment 2020 Vol. 24 No. 8
© Queen’s Printer and Controller of HMSO 2020. This work was produced by Costa et al. under the terms of a commissioning contract issued by the Secretary of State forHealth and Social Care. This issue may be freely reproduced for the purposes of private research and study and extracts (or indeed, the full report) may be included inprofessional journals provided that suitable acknowledgement is made and the reproduction is not associated with any form of advertising. Applications for commercialreproduction should be addressed to: NIHR Journals Library, National Institute for Health Research, Evaluation, Trials and Studies Coordinating Centre, Alpha House,University of Southampton Science Park, Southampton SO16 7NS, UK.
71
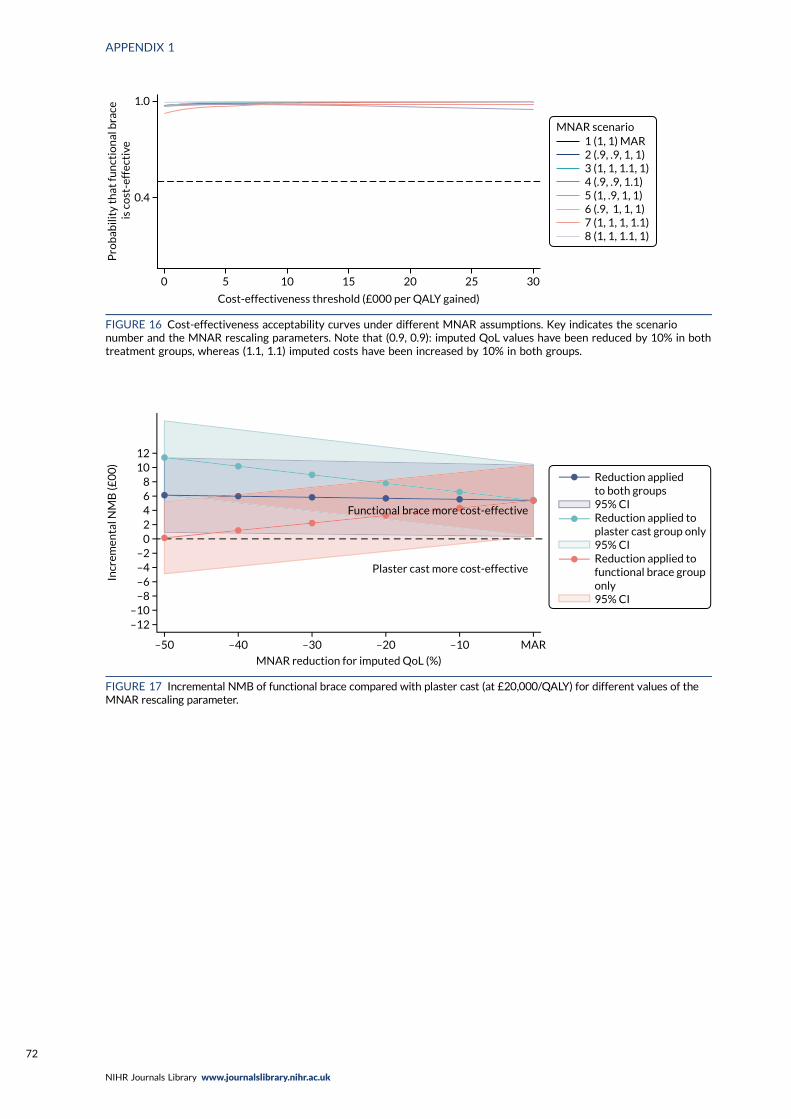
0.4
0 5 10 15 20 25 30
Pro
bab
ility
th
at fu
nct
ion
al b
race
is c
ost
-eff
ecti
ve
1.0
Cost-effectiveness threshold (£000 per QALY gained)
MNAR scenario1 (1, 1) MAR2 (.9, .9, 1, 1)3 (1, 1, 1.1, 1)4 (.9, .9, 1.1)5 (1, .9, 1, 1)6 (.9, 1, 1, 1)7 (1, 1, 1, 1.1)8 (1, 1, 1.1, 1)
FIGURE 16 Cost-effectiveness acceptability curves under different MNAR assumptions. Key indicates the scenarionumber and the MNAR rescaling parameters. Note that (0.9, 0.9): imputed QoL values have been reduced by 10% in bothtreatment groups, whereas (1.1, 1.1) imputed costs have been increased by 10% in both groups.
–50
–12–10
–8–6–4–2
Incr
emen
tal N
MB
(£0
0)
02468
1012
–40 –30 –20
MNAR reduction for imputed QoL (%)
–10 MAR
Plaster cast more cost-effective
Functional brace more cost-effective
Reduction applied to both groups95% CIReduction applied toplaster cast group only95% CIReduction applied tofunctional brace grouponly95% CI
FIGURE 17 Incremental NMB of functional brace compared with plaster cast (at £20,000/QALY) for different values of theMNAR rescaling parameter.
APPENDIX 1
NIHR Journals Library www.journalslibrary.nihr.ac.uk
72
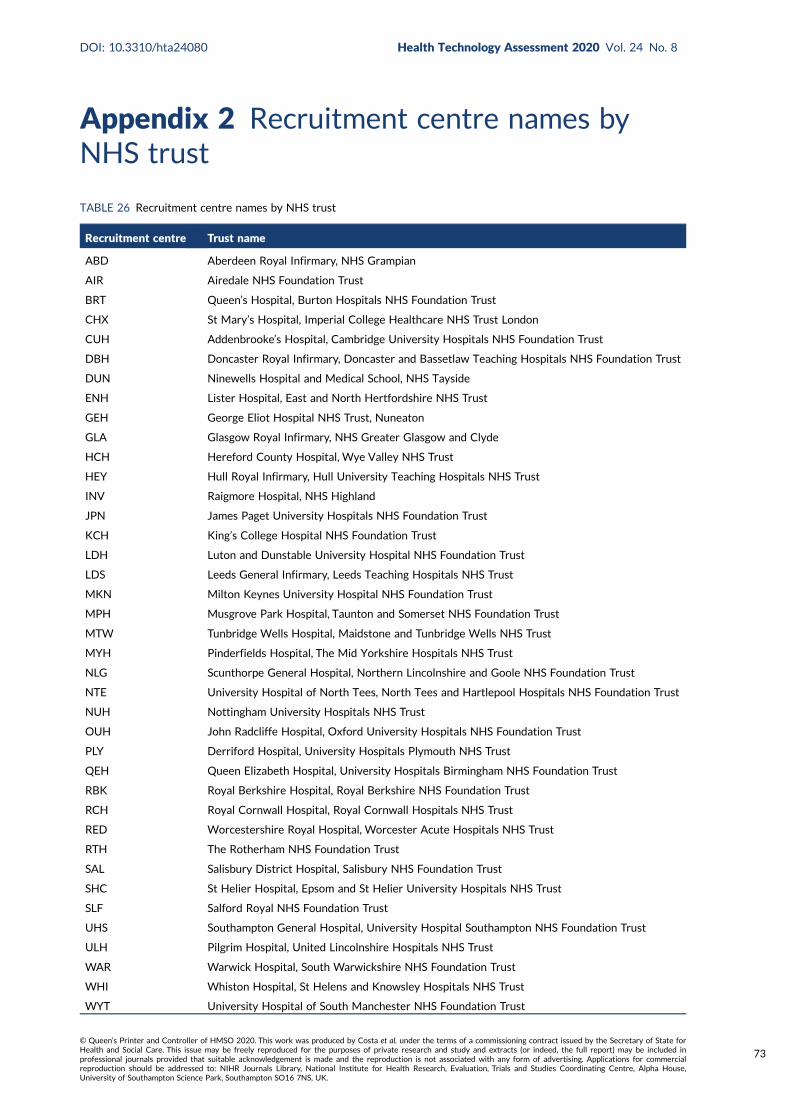
Appendix 2 Recruitment centre names byNHS trust
TABLE 26 Recruitment centre names by NHS trust
Recruitment centre Trust name
ABD Aberdeen Royal Infirmary, NHS Grampian
AIR Airedale NHS Foundation Trust
BRT Queen’s Hospital, Burton Hospitals NHS Foundation Trust
CHX St Mary’s Hospital, Imperial College Healthcare NHS Trust London
CUH Addenbrooke’s Hospital, Cambridge University Hospitals NHS Foundation Trust
DBH Doncaster Royal Infirmary, Doncaster and Bassetlaw Teaching Hospitals NHS Foundation Trust
DUN Ninewells Hospital and Medical School, NHS Tayside
ENH Lister Hospital, East and North Hertfordshire NHS Trust
GEH George Eliot Hospital NHS Trust, Nuneaton
GLA Glasgow Royal Infirmary, NHS Greater Glasgow and Clyde
HCH Hereford County Hospital, Wye Valley NHS Trust
HEY Hull Royal Infirmary, Hull University Teaching Hospitals NHS Trust
INV Raigmore Hospital, NHS Highland
JPN James Paget University Hospitals NHS Foundation Trust
KCH King’s College Hospital NHS Foundation Trust
LDH Luton and Dunstable University Hospital NHS Foundation Trust
LDS Leeds General Infirmary, Leeds Teaching Hospitals NHS Trust
MKN Milton Keynes University Hospital NHS Foundation Trust
MPH Musgrove Park Hospital, Taunton and Somerset NHS Foundation Trust
MTW Tunbridge Wells Hospital, Maidstone and Tunbridge Wells NHS Trust
MYH Pinderfields Hospital, The Mid Yorkshire Hospitals NHS Trust
NLG Scunthorpe General Hospital, Northern Lincolnshire and Goole NHS Foundation Trust
NTE University Hospital of North Tees, North Tees and Hartlepool Hospitals NHS Foundation Trust
NUH Nottingham University Hospitals NHS Trust
OUH John Radcliffe Hospital, Oxford University Hospitals NHS Foundation Trust
PLY Derriford Hospital, University Hospitals Plymouth NHS Trust
QEH Queen Elizabeth Hospital, University Hospitals Birmingham NHS Foundation Trust
RBK Royal Berkshire Hospital, Royal Berkshire NHS Foundation Trust
RCH Royal Cornwall Hospital, Royal Cornwall Hospitals NHS Trust
RED Worcestershire Royal Hospital, Worcester Acute Hospitals NHS Trust
RTH The Rotherham NHS Foundation Trust
SAL Salisbury District Hospital, Salisbury NHS Foundation Trust
SHC St Helier Hospital, Epsom and St Helier University Hospitals NHS Trust
SLF Salford Royal NHS Foundation Trust
UHS Southampton General Hospital, University Hospital Southampton NHS Foundation Trust
ULH Pilgrim Hospital, United Lincolnshire Hospitals NHS Trust
WAR Warwick Hospital, South Warwickshire NHS Foundation Trust
WHI Whiston Hospital, St Helens and Knowsley Hospitals NHS Trust
WYT University Hospital of South Manchester NHS Foundation Trust
DOI: 10.3310/hta24080 Health Technology Assessment 2020 Vol. 24 No. 8
© Queen’s Printer and Controller of HMSO 2020. This work was produced by Costa et al. under the terms of a commissioning contract issued by the Secretary of State forHealth and Social Care. This issue may be freely reproduced for the purposes of private research and study and extracts (or indeed, the full report) may be included inprofessional journals provided that suitable acknowledgement is made and the reproduction is not associated with any form of advertising. Applications for commercialreproduction should be addressed to: NIHR Journals Library, National Institute for Health Research, Evaluation, Trials and Studies Coordinating Centre, Alpha House,University of Southampton Science Park, Southampton SO16 7NS, UK.
73


Appendix 3 EuroQol-5 Dimensionsindividual-level items
In Figures 18–22, the median score is marked as a triangle, whiskers are IQRs, and the individual dotsand crosses mark the outliers. Numbers and percentages for each EQ-5D-5L dimension and level are
further presented by treatment group and time point in Appendix 4.
0
Pre injury Post injury 8 weeks 3 months
Time point
6 months 9 months
1
2
3
EQ
-5D
sel
f-ca
re
4
5
Plaster castFunctional brace
Treatment group
FIGURE 19 EuroQol-5 Dimensions: self-care from baseline pre injury to 9 months. EQ-5D self-care values range from1 to 5, with 1 indicating ‘no problems’.
0
Pre injury Post injury 8 weeks 3 months
Time point
6 months 9 months
1
2
3
EQ
-5D
mo
bili
ty
4
5
Plaster castFunctional brace
Treatment group
FIGURE 18 EuroQol-5 Dimensions: mobility from baseline pre injury to 9 months. EQ-5D mobility values range from1 to 5, with 1 indicating ‘no problems’.
DOI: 10.3310/hta24080 Health Technology Assessment 2020 Vol. 24 No. 8
© Queen’s Printer and Controller of HMSO 2020. This work was produced by Costa et al. under the terms of a commissioning contract issued by the Secretary of State forHealth and Social Care. This issue may be freely reproduced for the purposes of private research and study and extracts (or indeed, the full report) may be included inprofessional journals provided that suitable acknowledgement is made and the reproduction is not associated with any form of advertising. Applications for commercialreproduction should be addressed to: NIHR Journals Library, National Institute for Health Research, Evaluation, Trials and Studies Coordinating Centre, Alpha House,University of Southampton Science Park, Southampton SO16 7NS, UK.
75
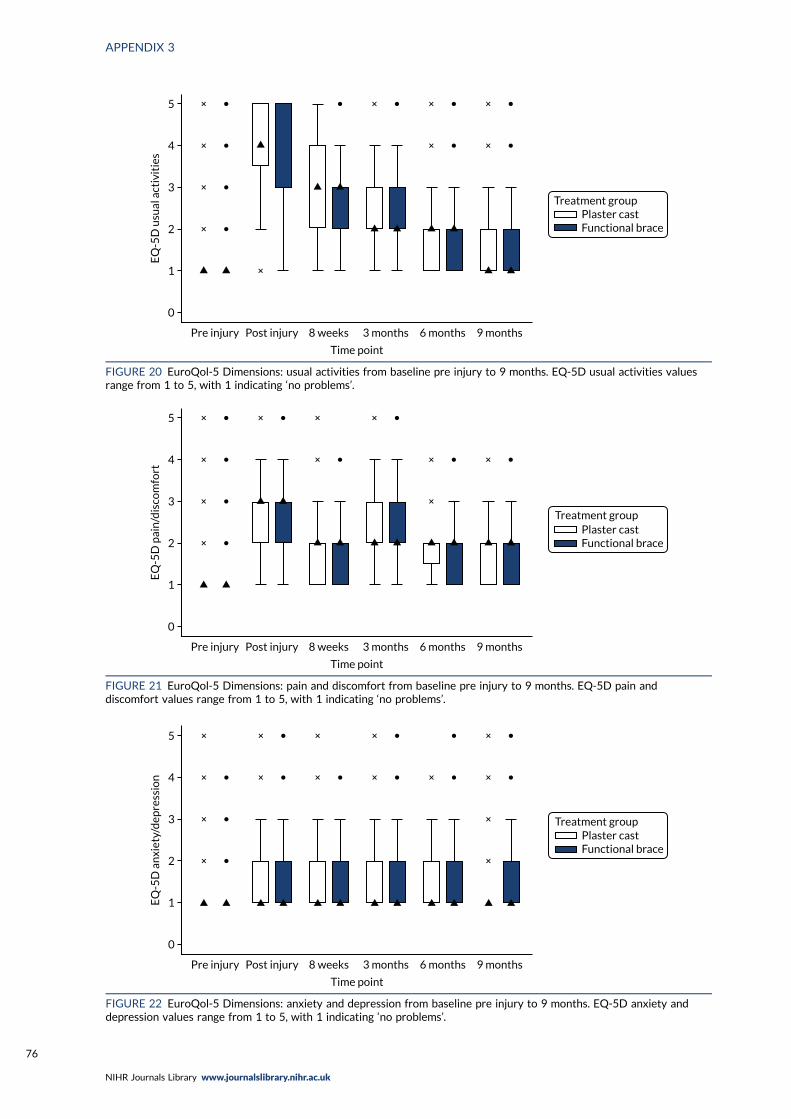
0
Pre injury Post injury 8 weeks 3 months
Time point
6 months 9 months
1
2
3
EQ
-5D
usu
al a
ctiv
itie
s4
5
Plaster castFunctional brace
Treatment group
FIGURE 20 EuroQol-5 Dimensions: usual activities from baseline pre injury to 9 months. EQ-5D usual activities valuesrange from 1 to 5, with 1 indicating ‘no problems’.
0
Pre injury Post injury 8 weeks 3 months
Time point
6 months 9 months
1
2
3
EQ
-5D
pai
n/d
isco
mfo
rt
4
5
Plaster castFunctional brace
Treatment group
FIGURE 21 EuroQol-5 Dimensions: pain and discomfort from baseline pre injury to 9 months. EQ-5D pain anddiscomfort values range from 1 to 5, with 1 indicating ‘no problems’.
0
Pre injury Post injury 8 weeks 3 months
Time point
6 months 9 months
1
2
3
EQ
-5D
an
xiet
y/d
epre
ssio
n 4
5
Plaster castFunctional brace
Treatment group
FIGURE 22 EuroQol-5 Dimensions: anxiety and depression from baseline pre injury to 9 months. EQ-5D anxiety anddepression values range from 1 to 5, with 1 indicating ‘no problems’.
APPENDIX 3
NIHR Journals Library www.journalslibrary.nihr.ac.uk
76
Appendix 4 Distribution of EuroQol-5Dimensions, five-level version, responses bytreatment group
DOI: 10.3310/hta24080 Health Technology Assessment 2020 Vol. 24 No. 8
© Queen’s Printer and Controller of HMSO 2020. This work was produced by Costa et al. under the terms of a commissioning contract issued by the Secretary of State forHealth and Social Care. This issue may be freely reproduced for the purposes of private research and study and extracts (or indeed, the full report) may be included inprofessional journals provided that suitable acknowledgement is made and the reproduction is not associated with any form of advertising. Applications for commercialreproduction should be addressed to: NIHR Journals Library, National Institute for Health Research, Evaluation, Trials and Studies Coordinating Centre, Alpha House,University of Southampton Science Park, Southampton SO16 7NS, UK.
77
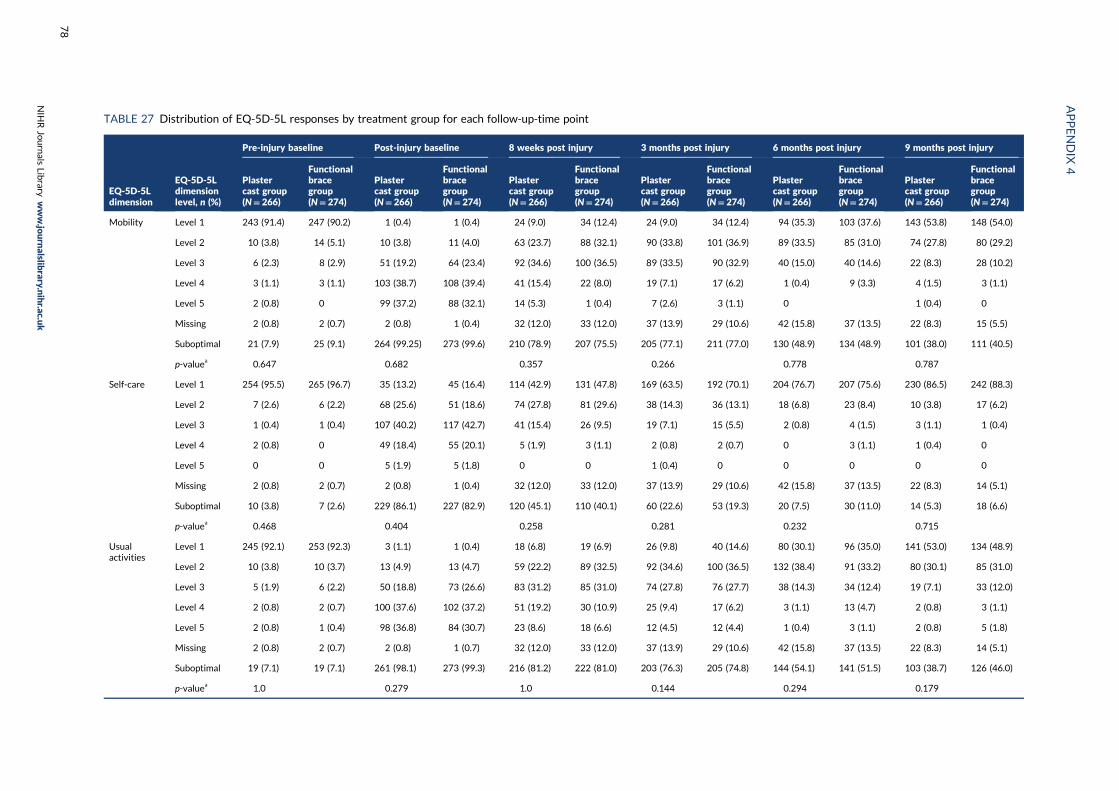
TABLE 27 Distribution of EQ-5D-5L responses by treatment group for each follow-up-time point
EQ-5D-5Ldimension
EQ-5D-5Ldimensionlevel, n (%)
Pre-injury baseline Post-injury baseline 8 weeks post injury 3 months post injury 6 months post injury 9 months post injury
Plastercast group(N= 266)
Functionalbracegroup(N= 274)
Plastercast group(N= 266)
Functionalbracegroup(N= 274)
Plastercast group(N= 266)
Functionalbracegroup(N= 274)
Plastercast group(N= 266)
Functionalbracegroup(N= 274)
Plastercast group(N= 266)
Functionalbracegroup(N= 274)
Plastercast group(N= 266)
Functionalbracegroup(N= 274)
Mobility Level 1 243 (91.4) 247 (90.2) 1 (0.4) 1 (0.4) 24 (9.0) 34 (12.4) 24 (9.0) 34 (12.4) 94 (35.3) 103 (37.6) 143 (53.8) 148 (54.0)
Level 2 10 (3.8) 14 (5.1) 10 (3.8) 11 (4.0) 63 (23.7) 88 (32.1) 90 (33.8) 101 (36.9) 89 (33.5) 85 (31.0) 74 (27.8) 80 (29.2)
Level 3 6 (2.3) 8 (2.9) 51 (19.2) 64 (23.4) 92 (34.6) 100 (36.5) 89 (33.5) 90 (32.9) 40 (15.0) 40 (14.6) 22 (8.3) 28 (10.2)
Level 4 3 (1.1) 3 (1.1) 103 (38.7) 108 (39.4) 41 (15.4) 22 (8.0) 19 (7.1) 17 (6.2) 1 (0.4) 9 (3.3) 4 (1.5) 3 (1.1)
Level 5 2 (0.8) 0 99 (37.2) 88 (32.1) 14 (5.3) 1 (0.4) 7 (2.6) 3 (1.1) 0 1 (0.4) 0
Missing 2 (0.8) 2 (0.7) 2 (0.8) 1 (0.4) 32 (12.0) 33 (12.0) 37 (13.9) 29 (10.6) 42 (15.8) 37 (13.5) 22 (8.3) 15 (5.5)
Suboptimal 21 (7.9) 25 (9.1) 264 (99.25) 273 (99.6) 210 (78.9) 207 (75.5) 205 (77.1) 211 (77.0) 130 (48.9) 134 (48.9) 101 (38.0) 111 (40.5)
p-valuea 0.647 0.682 0.357 0.266 0.778 0.787
Self-care Level 1 254 (95.5) 265 (96.7) 35 (13.2) 45 (16.4) 114 (42.9) 131 (47.8) 169 (63.5) 192 (70.1) 204 (76.7) 207 (75.6) 230 (86.5) 242 (88.3)
Level 2 7 (2.6) 6 (2.2) 68 (25.6) 51 (18.6) 74 (27.8) 81 (29.6) 38 (14.3) 36 (13.1) 18 (6.8) 23 (8.4) 10 (3.8) 17 (6.2)
Level 3 1 (0.4) 1 (0.4) 107 (40.2) 117 (42.7) 41 (15.4) 26 (9.5) 19 (7.1) 15 (5.5) 2 (0.8) 4 (1.5) 3 (1.1) 1 (0.4)
Level 4 2 (0.8) 0 49 (18.4) 55 (20.1) 5 (1.9) 3 (1.1) 2 (0.8) 2 (0.7) 0 3 (1.1) 1 (0.4) 0
Level 5 0 0 5 (1.9) 5 (1.8) 0 0 1 (0.4) 0 0 0 0 0
Missing 2 (0.8) 2 (0.7) 2 (0.8) 1 (0.4) 32 (12.0) 33 (12.0) 37 (13.9) 29 (10.6) 42 (15.8) 37 (13.5) 22 (8.3) 14 (5.1)
Suboptimal 10 (3.8) 7 (2.6) 229 (86.1) 227 (82.9) 120 (45.1) 110 (40.1) 60 (22.6) 53 (19.3) 20 (7.5) 30 (11.0) 14 (5.3) 18 (6.6)
p-valuea 0.468 0.404 0.258 0.281 0.232 0.715
Usualactivities
Level 1 245 (92.1) 253 (92.3) 3 (1.1) 1 (0.4) 18 (6.8) 19 (6.9) 26 (9.8) 40 (14.6) 80 (30.1) 96 (35.0) 141 (53.0) 134 (48.9)
Level 2 10 (3.8) 10 (3.7) 13 (4.9) 13 (4.7) 59 (22.2) 89 (32.5) 92 (34.6) 100 (36.5) 132 (38.4) 91 (33.2) 80 (30.1) 85 (31.0)
Level 3 5 (1.9) 6 (2.2) 50 (18.8) 73 (26.6) 83 (31.2) 85 (31.0) 74 (27.8) 76 (27.7) 38 (14.3) 34 (12.4) 19 (7.1) 33 (12.0)
Level 4 2 (0.8) 2 (0.7) 100 (37.6) 102 (37.2) 51 (19.2) 30 (10.9) 25 (9.4) 17 (6.2) 3 (1.1) 13 (4.7) 2 (0.8) 3 (1.1)
Level 5 2 (0.8) 1 (0.4) 98 (36.8) 84 (30.7) 23 (8.6) 18 (6.6) 12 (4.5) 12 (4.4) 1 (0.4) 3 (1.1) 2 (0.8) 5 (1.8)
Missing 2 (0.8) 2 (0.7) 2 (0.8) 1 (0.7) 32 (12.0) 33 (12.0) 37 (13.9) 29 (10.6) 42 (15.8) 37 (13.5) 22 (8.3) 14 (5.1)
Suboptimal 19 (7.1) 19 (7.1) 261 (98.1) 273 (99.3) 216 (81.2) 222 (81.0) 203 (76.3) 205 (74.8) 144 (54.1) 141 (51.5) 103 (38.7) 126 (46.0)
p-valuea 1.0 0.279 1.0 0.144 0.294 0.179
APPENDIX
4
NIH
RJournals
Library
www.jo
urnalslib
rary.nihr.ac.u
k
78
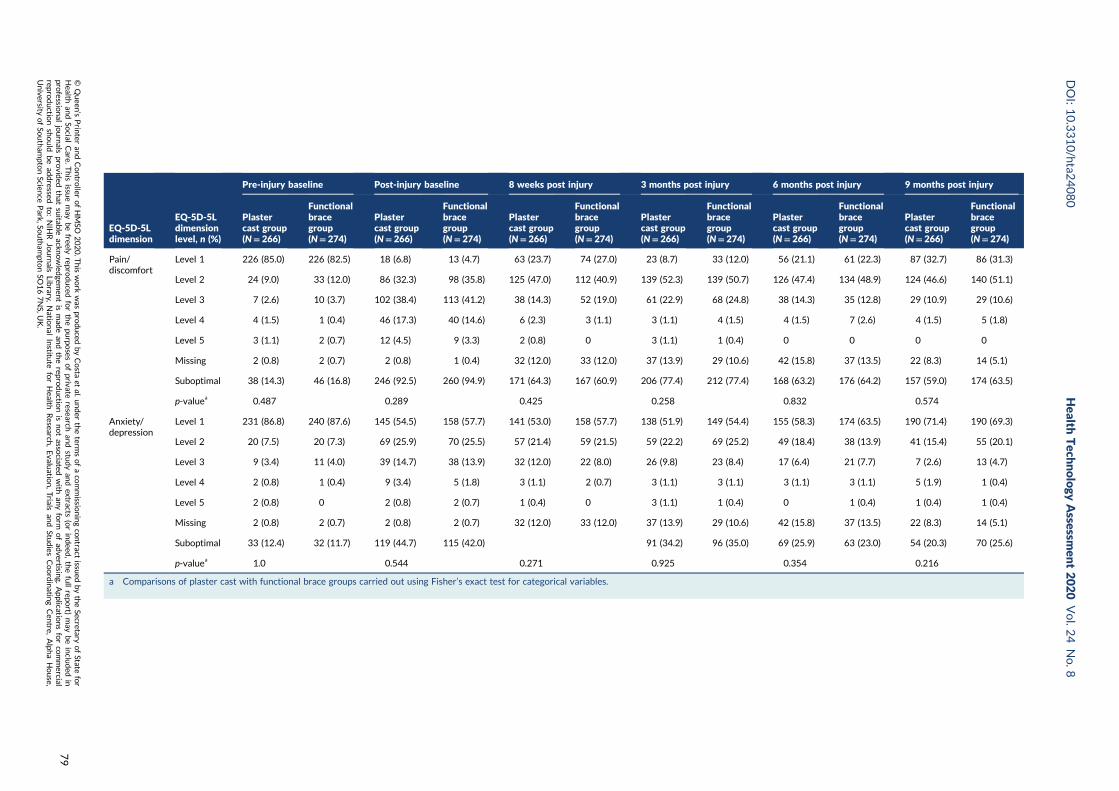
EQ-5D-5Ldimension
EQ-5D-5Ldimensionlevel, n (%)
Pre-injury baseline Post-injury baseline 8 weeks post injury 3 months post injury 6 months post injury 9 months post injury
Plastercast group(N= 266)
Functionalbracegroup(N= 274)
Plastercast group(N= 266)
Functionalbracegroup(N= 274)
Plastercast group(N= 266)
Functionalbracegroup(N= 274)
Plastercast group(N= 266)
Functionalbracegroup(N= 274)
Plastercast group(N= 266)
Functionalbracegroup(N= 274)
Plastercast group(N= 266)
Functionalbracegroup(N= 274)
Pain/discomfort
Level 1 226 (85.0) 226 (82.5) 18 (6.8) 13 (4.7) 63 (23.7) 74 (27.0) 23 (8.7) 33 (12.0) 56 (21.1) 61 (22.3) 87 (32.7) 86 (31.3)
Level 2 24 (9.0) 33 (12.0) 86 (32.3) 98 (35.8) 125 (47.0) 112 (40.9) 139 (52.3) 139 (50.7) 126 (47.4) 134 (48.9) 124 (46.6) 140 (51.1)
Level 3 7 (2.6) 10 (3.7) 102 (38.4) 113 (41.2) 38 (14.3) 52 (19.0) 61 (22.9) 68 (24.8) 38 (14.3) 35 (12.8) 29 (10.9) 29 (10.6)
Level 4 4 (1.5) 1 (0.4) 46 (17.3) 40 (14.6) 6 (2.3) 3 (1.1) 3 (1.1) 4 (1.5) 4 (1.5) 7 (2.6) 4 (1.5) 5 (1.8)
Level 5 3 (1.1) 2 (0.7) 12 (4.5) 9 (3.3) 2 (0.8) 0 3 (1.1) 1 (0.4) 0 0 0 0
Missing 2 (0.8) 2 (0.7) 2 (0.8) 1 (0.4) 32 (12.0) 33 (12.0) 37 (13.9) 29 (10.6) 42 (15.8) 37 (13.5) 22 (8.3) 14 (5.1)
Suboptimal 38 (14.3) 46 (16.8) 246 (92.5) 260 (94.9) 171 (64.3) 167 (60.9) 206 (77.4) 212 (77.4) 168 (63.2) 176 (64.2) 157 (59.0) 174 (63.5)
p-valuea 0.487 0.289 0.425 0.258 0.832 0.574
Anxiety/depression
Level 1 231 (86.8) 240 (87.6) 145 (54.5) 158 (57.7) 141 (53.0) 158 (57.7) 138 (51.9) 149 (54.4) 155 (58.3) 174 (63.5) 190 (71.4) 190 (69.3)
Level 2 20 (7.5) 20 (7.3) 69 (25.9) 70 (25.5) 57 (21.4) 59 (21.5) 59 (22.2) 69 (25.2) 49 (18.4) 38 (13.9) 41 (15.4) 55 (20.1)
Level 3 9 (3.4) 11 (4.0) 39 (14.7) 38 (13.9) 32 (12.0) 22 (8.0) 26 (9.8) 23 (8.4) 17 (6.4) 21 (7.7) 7 (2.6) 13 (4.7)
Level 4 2 (0.8) 1 (0.4) 9 (3.4) 5 (1.8) 3 (1.1) 2 (0.7) 3 (1.1) 3 (1.1) 3 (1.1) 3 (1.1) 5 (1.9) 1 (0.4)
Level 5 2 (0.8) 0 2 (0.8) 2 (0.7) 1 (0.4) 0 3 (1.1) 1 (0.4) 0 1 (0.4) 1 (0.4) 1 (0.4)
Missing 2 (0.8) 2 (0.7) 2 (0.8) 2 (0.7) 32 (12.0) 33 (12.0) 37 (13.9) 29 (10.6) 42 (15.8) 37 (13.5) 22 (8.3) 14 (5.1)
Suboptimal 33 (12.4) 32 (11.7) 119 (44.7) 115 (42.0) 91 (34.2) 96 (35.0) 69 (25.9) 63 (23.0) 54 (20.3) 70 (25.6)
p-valuea 1.0 0.544 0.271 0.925 0.354 0.216
a Comparisons of plaster cast with functional brace groups carried out using Fisher’s exact test for categorical variables.
DOI:10.3310/hta2
4080
Health
Tech
nology
Assessm
ent2020
Vol.2
4No.8
©Queen
’sPrin
teran
dContro
llerofHMSO
2020.T
hiswork
was
produced
byCosta
etal.u
nder
theterm
sofaco
mmissio
ningco
ntract
issued
bytheSecretary
ofState
for
Health
andSo
cialCare.T
his
issuemay
befreely
reproduced
forthepu
rposes
ofprivate
researchan
dstu
dyan
dextracts
(orindeed
,thefullrepo
rt)may
beinclu
ded
inpro
fessional
journals
provid
edthat
suitab
leackn
owled
gemen
tis
mad
ean
dtherepro
ductio
nis
notasso
ciatedwith
anyform
ofad
vertising.
Applicatio
nsforco
mmercial
reproductio
nshould
bead
dressed
to:NIH
RJournals
Library,
Natio
nal
Institu
teforHealth
Research
,Evalu
ation,Trials
and
Studies
Coordinatin
gCen
tre,Alph
aHouse,
University
ofSo
utham
ptonScien
cePark,So
utham
ptonSO
167NS,U
K.
79


Appendix 5 Trial management
Introduction
UKSTAR completed recruitment on schedule (Figure 23), with 540 participants recruited.
Completeness of baseline and 8-week data and rates of follow-up at all time points were excellent,thanks to the dedication of clinicians and researchers at the recruitment centres and an experienced,dedicated, central trial management team.
Management milestones
Table 28 shows the dates when milestones in the project management plan were reached.
Recruitment target and recruitment centre selection
Principal investigators at potential recruitment centres were approached through the NIHR/OrthopaedicTrauma Society Research Network and British Orthopaedic Foot and Ankle Society. We included sitesof all sizes (from major trauma centres to local emergency hospitals) from regions across Englandand Scotland.
Each potential recruitment centre completed a site feasibility questionnaire, which was reviewedby the chief investigator. Sites were asked to declare how many patients presented at their site withAchilles tendon rupture and were treated non-operatively, and their expected recruitment rate, whichneeded to be at least one participant per month. Some sites declined on the grounds that all of theirpatients had already been put into a functional brace, or were all treated with a plaster cast. Sites thatwere actively recruiting for another Achilles trial by our research group, the Platelet Rich Plasma inAchilles Tendon Healing (PATH-2) study,56 were not opened to UKSTAR until recruitment for PATH-2was complete to avoid competition between trials for the same patients and potential recruitment bias.
UKSTAR opened to recruitment on 16 August 2016, 1 month later than planned as a result of contractualdelays at recruitment centres. The original application predicted a recruitment rate of one participantper month per centre, which led to the conclusion that a minimum of 22 centres was required. However,during the first 6 months, although more recruitment centres were opened than planned (nine as opposedto six), recruitment in most centres was slower than expected (27 participants in total) and weightedtowards a single, high-recruiting centre (Aberdeen, with 15 participants). We decided, therefore, toexpand the number of recruitment centres and were successful in opening 39 recruitment centres,including some whose trauma departments were new to participating in trials.
One recruitment centre (James Paget University Hospitals NHS Foundation Trust, Norfolk) closed torecruitment early because of lack of research staff, having recruited no participants. All other recruitmentcentres recruited at least one participant.
The trial reached its original recruitment target of 330 participants in October 2017, 7 months aheadof schedule. The required sample had been estimated a priori to achieve 90% power in the primaryoutcome (ATRS at 9 months) and allowing for 20% loss to follow-up and crossovers. Crossover data,protocol deviations and outcome completion information were assessed prior to reaching the initialtarget. To avoid the power of the trial being compromised by potentially large numbers of crossoversand loss to follow-up at 9 months, we submitted, with the support of the DSMC and TSC, a substantial
DOI: 10.3310/hta24080 Health Technology Assessment 2020 Vol. 24 No. 8
© Queen’s Printer and Controller of HMSO 2020. This work was produced by Costa et al. under the terms of a commissioning contract issued by the Secretary of State forHealth and Social Care. This issue may be freely reproduced for the purposes of private research and study and extracts (or indeed, the full report) may be included inprofessional journals provided that suitable acknowledgement is made and the reproduction is not associated with any form of advertising. Applications for commercialreproduction should be addressed to: NIHR Journals Library, National Institute for Health Research, Evaluation, Trials and Studies Coordinating Centre, Alpha House,University of Southampton Science Park, Southampton SO16 7NS, UK.
81
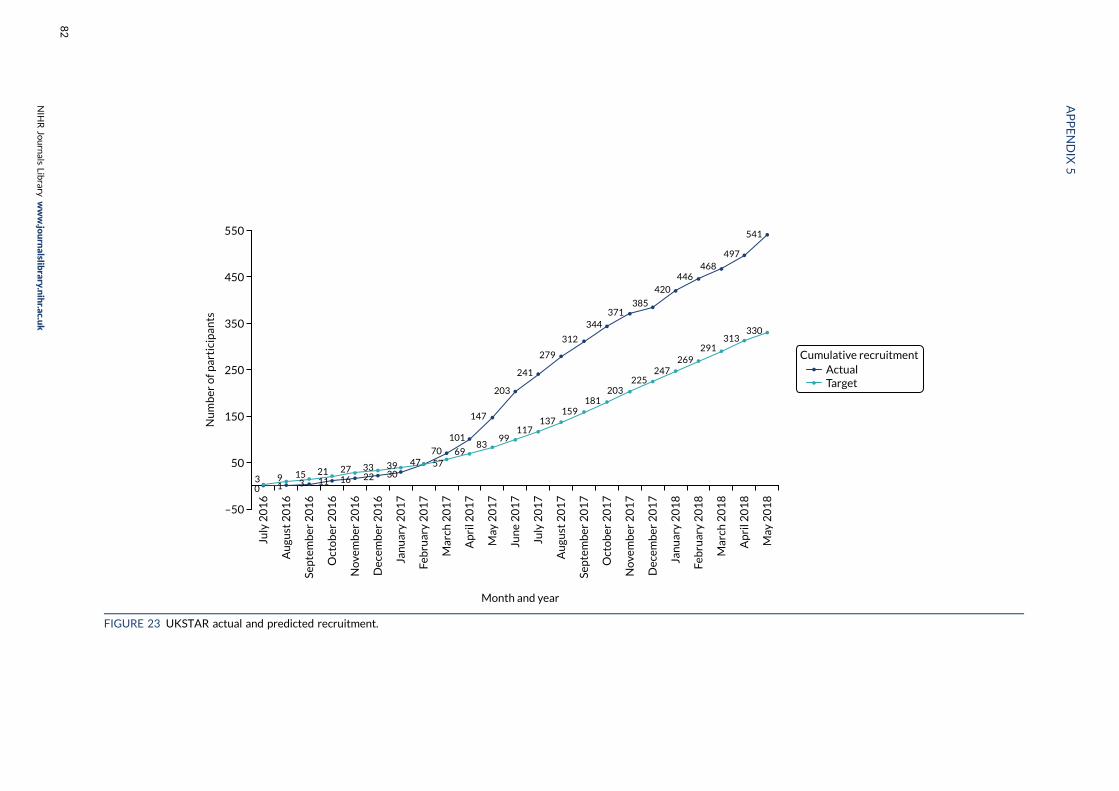
–50
Month and year
50
150
250
Nu
mb
er o
f par
tici
pan
ts 350
450
550
ActualTarget
July
20
16
Au
gust
20
16
Sep
tem
ber
20
16
Oct
ob
er 2
01
6
Nov
emb
er 2
01
6
Dec
emb
er 2
01
6
July
20
17
Au
gust
20
17
Sep
tem
ber
20
17
Oct
ob
er 2
01
7
Nov
emb
er 2
01
7
Dec
emb
er 2
01
7
Jan
uar
y 2
01
7
Feb
ruar
y 2
01
7
Mar
ch 2
01
7
Ap
ril 2
01
7
May
20
17
Jan
uar
y 2
01
8
Feb
ruar
y 2
01
8
Mar
ch 2
01
8
Ap
ril 2
01
8
May
20
18
Jun
e 2
01
7
Cumulative recruitment
541
497468
446420
385371
344
312
279
241
203
147
101
7047393327211593
5769
8399
117137
159181
203225
247269
291313
330
30221611310
FIGURE 23 UKSTAR actual and predicted recruitment.
APPENDIX
5
NIH
RJournals
Library
www.jo
urnalslib
rary.nihr.ac.u
k
82

amendment to increase the sample size to a maximum of 550, and to recruit up to the originalrecruitment end date (31 May 2018). The trial continued recruiting until its original planned end date,recruiting 540 participants (see Figure 23).
Monitoring of trial recruitment
Recruitment centres were trained in recruitment procedures during site initiation visits, which were inperson or by conference call. It was not necessary for trial staff to travel to distant recruitment centresif staff at those centres were experienced in trial recruitment. Staff at recruitment centres completeda monthly screening log, declaring all patients who had presented to the emergency department,specialist fracture clinic or foot and ankle clinic with Achilles tendon rupture. We monitored the reasonsfor non-recruitment, looking for trends at particular recruitment centres, and addressed them on acentre-by-centre basis. Recruitment centres were informed of how their recruitment rate comparedwith that of other recruitment centres in a monthly newsletter.
Data management
The data management plan defined the trial’s data management procedures in accordance with thetrials unit’s standard operating procedures. The data management plan identified databases andinformation technology systems used by the trial, defined data types, data sharing and access, thecritical data items, questionnaires and events, and the location of the trial data matrix; and describedconfidentiality, how protocol deviations were defined and what action to take, how source data werecollected and entered at each time point, and how follow-up was managed. It recorded decisions onfollow-up time windows made by the TMG, data rulings made by the chief investigator, statistician,health economist or trial manager, how data queries were handled and how data were to be processedat the end of the trial.
The trial monitoring plan described procedures for central monitoring and stated that no sitemonitoring would take place unless triggered by concerns. All recruitment centres were monitoredcentrally and none generated concerns sufficient to merit a monitoring visit.
TABLE 28 Progress against milestones in project management plan
Event Planned date Actual date
Grant activation 1 April 2016 1 April 2016
Trial open 16 August 2016 16 August 2016
First DSMC/TSC meeting 6 July 2016 6 July 2016
Expected end of recruitment 31 May 2018 31 May 2018
Expected end of follow-up 31 March 2019 12 March 2019
Expected start of data cleaning January 2019 January 2019
Expected start of final analysis March 2019 March 2019
End of grant 31 May 2019 31 May 2019
DOI: 10.3310/hta24080 Health Technology Assessment 2020 Vol. 24 No. 8
© Queen’s Printer and Controller of HMSO 2020. This work was produced by Costa et al. under the terms of a commissioning contract issued by the Secretary of State forHealth and Social Care. This issue may be freely reproduced for the purposes of private research and study and extracts (or indeed, the full report) may be included inprofessional journals provided that suitable acknowledgement is made and the reproduction is not associated with any form of advertising. Applications for commercialreproduction should be addressed to: NIHR Journals Library, National Institute for Health Research, Evaluation, Trials and Studies Coordinating Centre, Alpha House,University of Southampton Science Park, Southampton SO16 7NS, UK.
83
Trial promotion
Promotion to patients and the publicA publicly available web page hosted on the OCTRU trials unit website provided trial information,current recruitment figures and news.
Promotion within the trauma and scientific communitiesUKSTAR was featured on a poster at the 7th NIHR OTS Musculoskeletal Trauma Trials Annual Meetingon 9 January 2019. The Kadoorie Centre newsletter, sent to recruitment centres participating in Oxfordtrauma trials, highlighted the end of follow-up and excellent retention rate in its March 2019 issue.A monthly newsletter was sent to recruitment centres during recruitment to help maintain engagementand to acknowledge and thank centres that recruited well.
APPENDIX 5
NIHR Journals Library www.journalslibrary.nihr.ac.uk
84
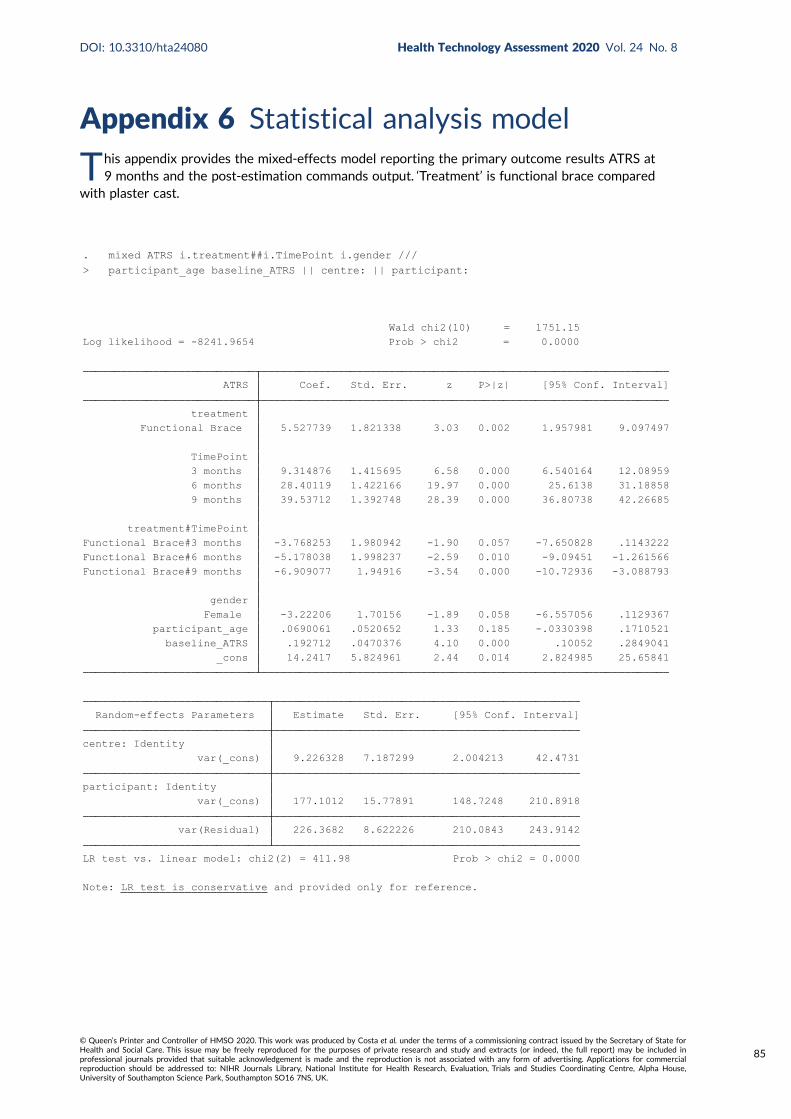
Appendix 6 Statistical analysis model
This appendix provides the mixed-effects model reporting the primary outcome results ATRS at9 months and the post-estimation commands output. ‘Treatment’ is functional brace compared
with plaster cast.
> participant_age baseline_ATRS || centre: || participant:. mixed ATRS i.treatment##i.TimePoint i.gender ///
Note: LR test is conservative and provided only for reference.
LR test vs. linear model: chi2(2) = 411.98 Prob > chi2 = 0.0000 var(Residual) 226.3682 8.622226 210.0843 243.9142 var(_cons) 177.1012 15.77891 148.7248 210.8918participant: Identity var(_cons) 9.226328 7.187299 2.004213 42.4731centre: Identity Random-effects Parameters Estimate Std. Err. [95% Conf. Interval]
_cons 14.2417 5.824961 2.44 0.014 2.824985 25.65841 baseline_ATRS .192712 .0470376 4.10 0.000 .10052 .2849041 participant_age .0690061 .0520652 1.33 0.185 -.0330398 .1710521 Female -3.22206 1.70156 -1.89 0.058 -6.557056 .1129367 gender Functional Brace#9 months -6.909077 1.94916 -3.54 0.000 -10.72936 -3.088793Functional Brace#6 months -5.178038 1.998237 -2.59 0.010 -9.09451 -1.261566Functional Brace#3 months -3.768253 1.980942 -1.90 0.057 -7.650828 .1143222 treatment#TimePoint 9 months 39.53712 1.392748 28.39 0.000 36.80738 42.26685 6 months 28.40119 1.422166 19.97 0.000 25.6138 31.18858 3 months 9.314876 1.415695 6.58 0.000 6.540164 12.08959 TimePoint Functional Brace 5.527739 1.821338 3.03 0.002 1.957981 9.097497 treatment ATRS Coef. Std. Err. z P>|z| [95% Conf. Interval]
Log likelihood = -8241.9654 Prob > chi2 = 0.0000 Wald chi2(10) = 1751.15
DOI: 10.3310/hta24080 Health Technology Assessment 2020 Vol. 24 No. 8
© Queen’s Printer and Controller of HMSO 2020. This work was produced by Costa et al. under the terms of a commissioning contract issued by the Secretary of State forHealth and Social Care. This issue may be freely reproduced for the purposes of private research and study and extracts (or indeed, the full report) may be included inprofessional journals provided that suitable acknowledgement is made and the reproduction is not associated with any form of advertising. Applications for commercialreproduction should be addressed to: NIHR Journals Library, National Institute for Health Research, Evaluation, Trials and Studies Coordinating Centre, Alpha House,University of Southampton Science Park, Southampton SO16 7NS, UK.
85

Note: dy/dx for factor levels is the discrete change from the base level. 9 months -1.381338 1.784543 -0.77 0.439 -4.878979 2.116303 6 months .349701 1.845002 0.19 0.850 -3.266436 3.965838 3 months 1.759486 1.825223 0.96 0.335 -1.817885 5.336857 8 weeks 5.527739 1.821338 3.03 0.002 1.957981 9.097497 TimePoint 2.treatment 1.treatment (base outcome) dy/dx Std. Err. z P>|z| [95% Conf. Interval] Delta-method
dy/dx w.r.t. : 2.treatmentExpression : Linear prediction, fixed portion, predict()
Average marginal effects Number of obs = 1,909
. margins TimePoint, dydx(treatment) //Primary ITT analysis.//
9 months#Functional Brace 73.1968 1.369833 53.43 0.000 70.51198 75.88162 9 months#Plaster Cast 74.57814 1.402394 53.18 0.000 71.8295 77.326786 months#Functional Brace 63.79191 1.410448 45.23 0.000 61.02749 66.55634 6 months#Plaster Cast 63.44221 1.439571 44.07 0.000 60.6207 66.263723 months#Functional Brace 46.11538 1.393666 33.09 0.000 43.38385 48.84692 3 months#Plaster Cast 44.3559 1.430426 31.01 0.000 41.55232 47.15948 8 weeks#Functional Brace 40.56876 1.400354 28.97 0.000 37.82412 43.3134 8 weeks#Plaster Cast 35.04102 1.421637 24.65 0.000 32.25466 37.82738 TimePoint#treatment Margin Std. Err. z P>|z| [95% Conf. Interval] Delta-method
Expression : Linear prediction, fixed portion, predict()
Predictive margins Number of obs = 1,909
. margins TimePoint#treatment
APPENDIX 6
NIHR Journals Library www.journalslibrary.nihr.ac.uk
86

EMEHS&DRHTAPGfARPHRPart of the NIHR Journals Librarywww.journalslibrary.nihr.ac.uk
This report presents independent research funded by the National Institute for Health Research (NIHR). The views expressed are those of the author(s) and not necessarily those of the NHS, the NIHR or the Department of Health and Social Care
Published by the NIHR Journals Library