The influence of natural reinforcement fibres on insulation values of earth plaster for straw bale...
11
This article appeared in a journal published by Elsevier. The attached copy is furnished to the author for internal non-commercial research and education use, including for instruction at the authors institution and sharing with colleagues. Other uses, including reproduction and distribution, or selling or licensing copies, or posting to personal, institutional or third party websites are prohibited. In most cases authors are permitted to post their version of the article (e.g. in Word or Tex form) to their personal website or institutional repository. Authors requiring further information regarding Elsevier’s archiving and manuscript policies are encouraged to visit: http://www.elsevier.com/copyright
Transcript of The influence of natural reinforcement fibres on insulation values of earth plaster for straw bale...

This article appeared in a journal published by Elsevier. The attachedcopy is furnished to the author for internal non-commercial researchand education use, including for instruction at the authors institution
and sharing with colleagues.
Other uses, including reproduction and distribution, or selling orlicensing copies, or posting to personal, institutional or third party
websites are prohibited.
In most cases authors are permitted to post their version of thearticle (e.g. in Word or Tex form) to their personal website orinstitutional repository. Authors requiring further information
regarding Elsevier’s archiving and manuscript policies areencouraged to visit:
http://www.elsevier.com/copyright
Author's personal copy
The influence of natural reinforcement fibres on insulation values of earth plasterfor straw bale buildings
Taha Ashour a,*, Hansjörg Wieland b, Heiko Georg c, Franz-Josef Bockisch d, Wei Wu e
a Agriculture Engineering Department, Faculty of Agriculture, Benha University, Egyptb Dipl. Biol. Institute of Production Engineering and Building Research, FAL, Braunschweig, Germanyc Institute of Organic Farming, von Thünen Institute (VTI), Trenthorst 32, D-23847 Westerau, Germanyd Institute of Production Engineering and Building Research, FAL, Braunschweig, Germanye Institute of Geotechnical Engineering, University of Natural Resources and Applied Life Sciences, Vienna, Austria
a r t i c l e i n f o
Article history:Received 3 March 2010Accepted 12 May 2010Available online 16 May 2010
Keywords:Thermal conductivityEarth plasterReinforcement fibresStraw bale buildings
a b s t r a c t
This work aimed to measure the thermal conductivity of some natural plaster materials that could beused for straw bale buildings. Thermal conductivity is very important to determine the insulation valueand other thermal parameters for natural plaster materials. Plaster materials consisted of soil, sand andstraw. Straw is used as a reinforcement fibre for plaster. Three types of fibres were used such as wheatstraw, barley straw and wood shavings. The results indicated that the thermal conductivity of all mate-rials decreased with increasing straw fibre content and decreased with increasing sand content. Thestraw fibres have greater effect on the change of thermal conductivity than the effect of sand. The resultsalso revealed that plaster reinforced by barley straw fibres has the highest values of thermal insulation.
� 2010 Elsevier Ltd. All rights reserved.
1. Introduction
There is a growing interest in using earth as a building materialwhich exhibits excellent physical properties with respect to eco-logical design, and fulfils all strength and serviceability require-ments for thermal transmittance. This development is also due tothe present concerns for sustainable development that have arisenout of extensive environmental problems (such as climate changeand impoverishment of resources) and also rapid pace of techno-logical development within the building sector. Most building reg-ulations have increasingly laid down strict criteria for the thermalperformance of buildings rather than the theoretically possible le-vel of performance derived in the past. This has become necessarybecause the energy efficiency of building depends on the ability ofthe whole building envelope to retain internal heat, and also con-siders other factors such as heat loss and moisture movementthrough the walls. Understandably, the need for energy efficientstructures in the built environment is increasing. Residential build-ings use the largest proportion of energy, where heating and cool-ing are the predominant forms, and this is exacerbated by theadoption of air-conditioning, which has increased dramatically inrecent years [1].
Studies on the thermal conductivity of building and insulatingmaterials have increased in recent years. New materials are beingdeveloped and new uses for existing materials are being found. To-day it is often not enough to obtain approximate data from textbooks, but measurements of real samples are necessary. Rapidtechnological developments in recent years have resulted inincreasing effort to expand our knowledge of the transport proper-ties of construction materials [2].
On the other hand, faced with the worldwide shortage of forestresources, industry is showing increased interest in the productionof particle board from agricultural residues [3]. Wheat straw con-tains a large amount of fibre with the potential to replace woodfor particleboard fabrication. Particleboard with a density rangefrom 0.59 to 0.8 g/cm3 is designated as medium-density particle-board [4]. It has broad applications for both structural and non-structural uses. Also barley straw is a significant raw material usedin cellulose production as an energy resource [5–11].
Furthermore, thermal conductivity of wheat and barley strawbales ranged from 0.0414 to 0.0486 and 0.0353 to 0.0539 W/mKfor all bale densities at different temperature for wheat and barleystraw bales respectively. The average values of thermal conductiv-ity and thermal resistance at both 20.7 and 34.2 �C were muchhigher than those of at 10.3 �C. The differences in the thermal con-ductivity and thermal resistance values as temperature changedfrom 10.3 to 20.7 �C is higher than when temperature changedfrom 20.7 to 34.2 �C [12]. McCabe [13] measured the thermal con-ductivity of wheat straw bales was found to be 0.046 W/mK. The
0261-3069/$ - see front matter � 2010 Elsevier Ltd. All rights reserved.doi:10.1016/j.matdes.2010.05.026
* Corresponding author. Address: Institute of Geotechnical Engineering, Univer-sity of Natural Resources and Applied Life Sciences, Feistmantelstraße 4, A-1180Vienna, Austria. Tel.: +43 1 47654 5568; fax: +43 1 47654 5567.
E-mail address: [email protected] (T. Ashour).
Materials and Design 31 (2010) 4676–4685
Contents lists available at ScienceDirect
Materials and Design
journal homepage: www.elsevier .com/locate /matdes

Author's personal copy
lightweight straw loam with density of 750 kg/m3 gave a k-value of0.20 W/mK whereas a lightweight expanded day loam with a den-sity of 740 kg/m3 gave a value of 0.18 W/mK. The specific heat forthe same material was 1.0 kJ/kg K [14].
Thermal expansion coefficients of plaster made from heavyloam were 0.0043–0.0052 mm/mK. Thermal expansion coefficientsfor mud brick masonry were up to 0.0062 mm/mK, and for sandymud mortar has a value of 0.005 mm/mK, and strong cement mor-tar 0.01 mm/mK, the same as a concrete [15].
In addition the insulation is rated by R-value, the resistance toheat flow. The R-value of wood is 1 per inch (0.15 W/mK), brickis 0.2 (0.734 W/mK), fibre glass bats are 3.0 (0.05 W/mK). Strawbale buildings are thermally efficient and energy conserving, withR-values significantly better than conventional construction,depending on the type of straw and the wall thickness [16]. WhileStone [17] estimated the insulation value for the straw bale walls.The R-value for the bale walls was R-44 (0.04 W/mK).
The thermal properties of sustainable earth materials weremeasured by using a novel thermal probe technique involving aniterative method of data analysis for determining simultaneouslythe thermal conductivity and diffusivity [18,19].
The viability of using coconut fibre as thermal insulation wasexplored by conducting thermal conductivity tests on 200 �400 � 60 mm thick slab-like specimens. The thermal conductivitywas 0.058 W/mK occurred at an optimum density of 85 kg/m3 at38 �C temperature [20].
The effect of adding wood shavings to sand concretes was stud-ies. Results demonstrate that the inclusion of shavings into sandconcretes reduces material density to a considerable extent, whilstthe structure remained homogeneous with a strong wood–matrixadherence; furthermore, thermal conductivity has been improved[21].
Gatland et al. [22] described a unique guarded hot box designedfor thermal testing of fenestration products incorporates severalnew design concepts from guarded hot plates, namely wall andedge guards. The wall and edge guarded hot box was built to meetthe test methodologies specified in the American Society for Test-ing and Materials (ASTM) Standard Test Methods C 236-89 [23].Our article presents an investigation into the thermal conductivityof earth plasters reinforced with different natural fibres such aswheat straw, barley straw and wood shavings under differentmix ratios.
2. Materials and methods
2.1. Materials tested
Three different materials are used, i.e. cohesive soil, sand andreinforcement fibres. The composition of the cohesive soil textureis as follows: 31% clay (<2 lm), 22% silt (20–63 lm) and 47% sand(63–2000 lm). Three different fibre types, barley straw,wheat straw and wood shavings are used. The average length ofstraw particles is about 5 cm, while the length of wood shavings isabout 2 cm.
2.2. Sample preparation
At first, the oversized gravels and organic matter (grass root)were removed from the natural cohesive soil. The soil was thenoven dried at 105 �C to obtain a constant mass. After the dryingprocess, the hard soil lumps were broken up with a hammer. Thenatural fibres were also oven dried at 105 �C to constant mass.
Different recipes of earth plasters with different compositionsof cohesive soil, sand and fibre were used for testing. The dosingof different materials was controlled by volume with given density.This was done by compressing the materials in a mold. The densi-ties of wheat straw, barley straw and wood shavings are 103.6 kg/m3, 106.9 kg/m3 and 111.4 kg/m3 respectively. The densities of soiland sand are 1666.8 kg/m3 and 1974.4 kg/m3 respectively. Theamount of soil and the fibre of a given recipe were placed in a con-tainer and mixed by hand without water until the different mate-rials are homogeneously distributed. Afterwards, 2 L of water wassprayed over the materials and the materials were mixed by handfor about 15 min until a homogeneous mixture was obtained. Thesoil–fibre mixture was left to rest for about 30 min and then man-ually mixed for about 15 min. Earth plaster of four different recipescombined with three different natural fibres used in the thermalconductivity tests are given in Table 1. The compositions of thematerials in Table 1 are given in volume percentage with the aver-age material densities mentioned above.
The soil–fibre mixture was poured into a steel mold placed on awood board. The square steel mold has a side length of 30 cm and adepth of 5 cm (see Fig. 1). The surface was leveled and compressedwith a loading plate under a force of about 50 kg, which simulatesthe plaster operation on site. Afterwards, the steel mold was liftedleaving an earth plaster sample on the wood board.
The samples were allowed to dry slowly to avoid any cracks.This was done in a climate chamber under the temperature of30 �C and the humidity of 40% for 60 days. The temperature andrelative humidity inside the climate chamber can be controlled. A
Table 1Four earth plasters with three natural fibres.
Earth plasterrecipes
Wood shavings Wheat straw Barley straw
Soil (%) Soil (%) Reinforcement fibres (%) Soil (%) Soil (%) Reinforcement fibres (%) Soil (%) Soil (%) Reinforcement fibres (%)
A 25 0 75 25 0 75 25 0 75B 25 25 50 25 25 50 25 25 50C 25 50 25 25 50 25 25 50 25D 25 75 0 25 75 0 25 75 0
Fig. 1. Steel frame for samples preparation.
T. Ashour et al. / Materials and Design 31 (2010) 4676–4685 4677

Author's personal copy
unique facility is that the water moving into or out of the climatechamber. The humidity control unit within the chamber measureshow much water it collects or releases. Basically, water is evapo-rated from or condensed into a weighed water tank whose temper-ature is controlled by a Peltier heat pump.
2.3. Guarded hot plate apparatus
The guarded hot plate apparatus (GHPA) is widely accepted as aprimary apparatus to determine the apparent thermal conductivityof insulating materials. Fig. 2 shows the principal characterizes of aGHPA.
The hot and cold plate maintains the boundary conditions con-stants (temperature) in the superior and inferior surfaces of thespecimen. In the ideal case, the plates are in perfect thermal con-tact with the specimen and the heat flow through it is one-dimen-sional and independent of time. The specification for the thermalconductivity equipment k-Meter EP 500 can be seen in Table 2.
The single-specimen conductivity test tool k-Meter EP 500 is aguarded hot plate apparatus and measures the thermal conductivity,thermal resistance as well as the k-value and U-value respectively ofan insulating material and other products. Thermal conductivitytests were done in accordance with different standard methods[23–30].
2.4. Test procedure
Forty-eight block samples of different plaster materials wereused for the thermal conductivity test. The samples were preparedby using a steel frame of dimensions 30 � 30 � 5 cm for length �width � height respectively (Fig. 2).
For each straw type and each treatment five samples of thesame material were used as replicates as shows in Fig. 3.
After placing plastering samples in the thermal conductivity de-vice, the borders of samples were insulated with ‘‘Polystyrene”,which has a thermal conductivity of 0.025 W/mK Fig. 4.
The guarded hot plate apparatus k-Meter EP 500 can test thethermal conductivity at exactly the desired test temperature. Itsheat control does not switch off when thermal conditions withinthe specimen are almost stationary to allow for adjusting to thetest temperature. This is common for heat flow meters and in mostcases leads to marginal differences between real and desired testtemperatures. For the evaluation of k10 on the guarded hot plateapparatus only a single test is needed.
The guarded hot plate apparatus k-Meter EP 500 can automati-cally complete three subsequent tests on one specimen at differenttemperatures between 10 and 40 �C. The average of measuringtemperature was 10, 25, 40 �C. The difference between cool and
Fig. 2. Experimental setup for the thermal conductivity measurement.
Table 2Specifications for thermal conductivity equipment.
Model k-Meter EP 500
Measurement temperatures Random choice of temperature in the rangeof 10–40 �C
Temperature differencebetween sensor plates
Range random choice in range of 5–15 �C
Measurement range R = 0.250–5 m2 K/W and k = 4–250 mW/mKSpecimen thickness 10–200 mmMaximum specimen
dimensions500 � 500 mm
Accuracy <1.5% for specimen thickness < 90 mm andk = 10–60 mW/mK (mostly <0.5)
Tool dimension(length � breadth � height)
630 � 630 � 880 cm
Mass Ca. 85 kgVoltage 220 V/50 HzMaximum power input 450 W
4678 T. Ashour et al. / Materials and Design 31 (2010) 4676–4685

Author's personal copy
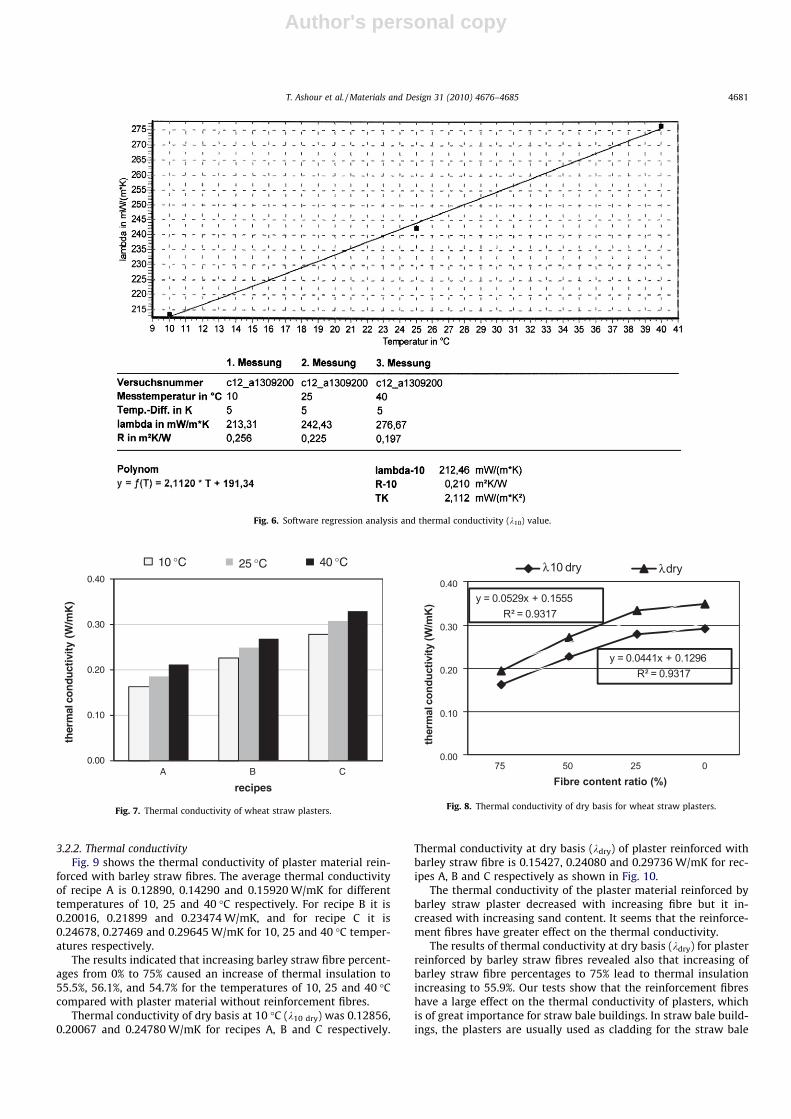
heat plate was 5 �C for all test sequent. The average temperaturewas calculated from the cold and heating plates. The software isdetermining the thermal conductivity for the obtained data fromthe instrument through data logger. The instrument is change dig-itally to the second point condition, when the thermal conductivityline is stable. This means that the thermal conductivity at theseconditions was evaluated as shows in Fig. 5.
The difference between based on the individual test results thetool can compute moist thermal conductivity at 10 �C (k10), moistthermal insulation at 10 �C (R10) and temperature coefficient of
conductivity (TK) by applying linear regression. The program drawsthe regression line and fit the best equation with high coefficient ofdetermination (R2). The program also calculates dry thermal con-ductivity at 10 �C (k10 dry) and dry thermal insulation (R10 dry) asshows in Fig. 6.
2.5. Mathematical equations
2.5.1. Thermal conductivityThermal conductivity determinations are depending on several
equations. The data were taken from the data logger and thermalconductivity was calculated through software related to the k-instrument. Thermal conductivity was calculated using the follow-ing equation.
k10;most ¼Uc � L
2AðTh � TCÞð1Þ
where k10, moist is the thermal conductivity at 10 �C (W/mK), Uc theheat flow, which flows under stationary conditions perpendicularlyto the sample surface through the sample (W), A the heating platearea (m2), L the thickness of the samples (m), Th the temperatureat the heating plate surface (K), and TC is the temperature at thecooling plates surface (K)
In the case of electrical heating with direct current is the heatflow in ‘‘Watt”, the voltage ‘‘U” in volts and the current ‘‘I” in am-pere is measured at the clips of the heating plate.
Uc ¼ U � I ð2Þ
The calculated thermal conductivity is referred to the averagetemperature ‘‘T” between the heated and cooled surfaces.
T ¼ 12ðTh þ TCÞ ð3Þ
After measuring of the thermal conductivity, the samples weredried to determine the moisture content of the plastering samples.The thermal conductivity values should be modified for dry byusing the following equations:
k10 dry ¼ k10 moist � ðMC � k10 moistÞ ð4Þ
kdry ¼ k10 dry þ k10 dry � 0:2 ð5Þ
where k10 moist is the moist thermal conductivity for the samples onwet basis of 10 �C (W/mK), k10 dry the thermal conductivity on drybasis at temperature 10 �C (W/mK), kdry the thermal conductivityon dry basis (W/mK), and MC is the moisture content for dry weight.
2.5.2. Moisture content equationThe materials were dried according to DIN EN ISO [31]. The fol-
lowing equation was used to calculate the moisture content asfollows:
MC ð%Þ ¼ ðWm �WdÞWd
� 100 ð6Þ
where MC is the moisture content (%), Wm the moist weight (kg),and Wd is the dry weight (kg).
3. Results and discussion
3.1. Plaster material reinforced by wheat straw fibre
3.1.1. Measurements of moisture content and dry densityThe average moisture content of plasters reinforced with wheat
straw fibres are 2.78%, 1.3%, and 0.61% for reinforcement fibres75%, 50%, and 25% respectively. These measurements were madeafter finishing the test. On the other hand, the average of drydensities of plasters reinforced with wheat straw fibres are
Fig. 3. Thermal conductivity samples after preparation.
Fig. 4. Thermal conductivity instrument.
T. Ashour et al. / Materials and Design 31 (2010) 4676–4685 4679

Author's personal copy
1123.89, 1416.31 and 1699.55 kg/m3 for reinforcement fibres 75%,50%, and 25% respectively. The results revealed that the moisturecontent increases with the wheat straw content. As may be ex-pected, the dry density decreases with increasing fibre content.
3.1.2. Thermal conductivityFig. 7 shows the relationship between different recipes and the
thermal conductivity of plaster reinforced by wheat straw fibres.Plaster materials density ranged from 949 to 1069 kg/m3 with anaverage of 1000 ± 49 kg/m3 for recipe A, while it is 1516–1527 kg/m3 with an average of 1512 ± 26 kg/m3 for recipe B. Forrecipe C, the plaster density is 1702–1759 kg/m3 with an averageof 1725 ± 28 kg/m3.
The average thermal conductivity of recipe A is 0.1626, 0.1856and 0.2118 W/mK for the test temperatures of 10, 25 and 40 �Crespectively. For recipe B it is 0.22610, 0.24850 and 0.26810 W/mK, while for recipe C it is 0.27763, 0.30750 and 0.32975 W/mKfor 10, 25 and 40 �C temperatures respectively.
The results indicated that increasing wheat straw fibres percent-ages from 0% to 75% caused an increase in thermal insulation to43.9%, 43.4%, and 39.8% for temperatures of 10, 25 and 40 �C in acomparison with plaster material without reinforcement fibres.
Fig. 7 shows also that an increase of fibre content brings onlymarginal improvement in thermal insulation for all recipes underdifferent temperature.
Thermal conductivity of dry basis at 10 �C (k10 dry) is0.16210, 0.22660 and 0.27890 W/mK for recipes A, B and Crespectively. While thermal conductivity at dry basis (kdry) ofplaster reinforced by wheat straw fibre is 0.19448, 0.27189and 0.33468 W/mK for recipes A, B and C respectively as shownin Fig. 8.
It is clear that the thermal conductivity of the plaster materialreinforced with wheat straw fibre decreased with increasing fibrecontent, but it increased as sand content increased. It seems thatthe reinforcement fibres have greater effect on the thermal con-ductivity than the sand content.
The thermal conductivity results at dry basis (kdry) showed alsothat increasing wheat straw fibres percentages to 75% lead to ther-mal insulation increasing to 44.4%. Since both the fibre content andthe sand content were changed simultaneously, it is difficult toseparate the influence of each of them.
3.2. Plaster material reinforced by barley straw fibre
3.2.1. Measurements of moisture content and dry densityPlaster materials density ranged from 869 to 902 kg/m3 with
the average of 876 ± 17 kg/m3 for recipe A, while it is 1352–1366 kg/m3 with the average of 1359 ± 5 kg/m3 for recipe B. Theplaster density for recipe C is 1618–1734 kg/m3 with the averageof 11684 ± 44 kg/m3.
Fig. 5. Summarize the thermal conductivity steps measurements.
4680 T. Ashour et al. / Materials and Design 31 (2010) 4676–4685
Author's personal copy
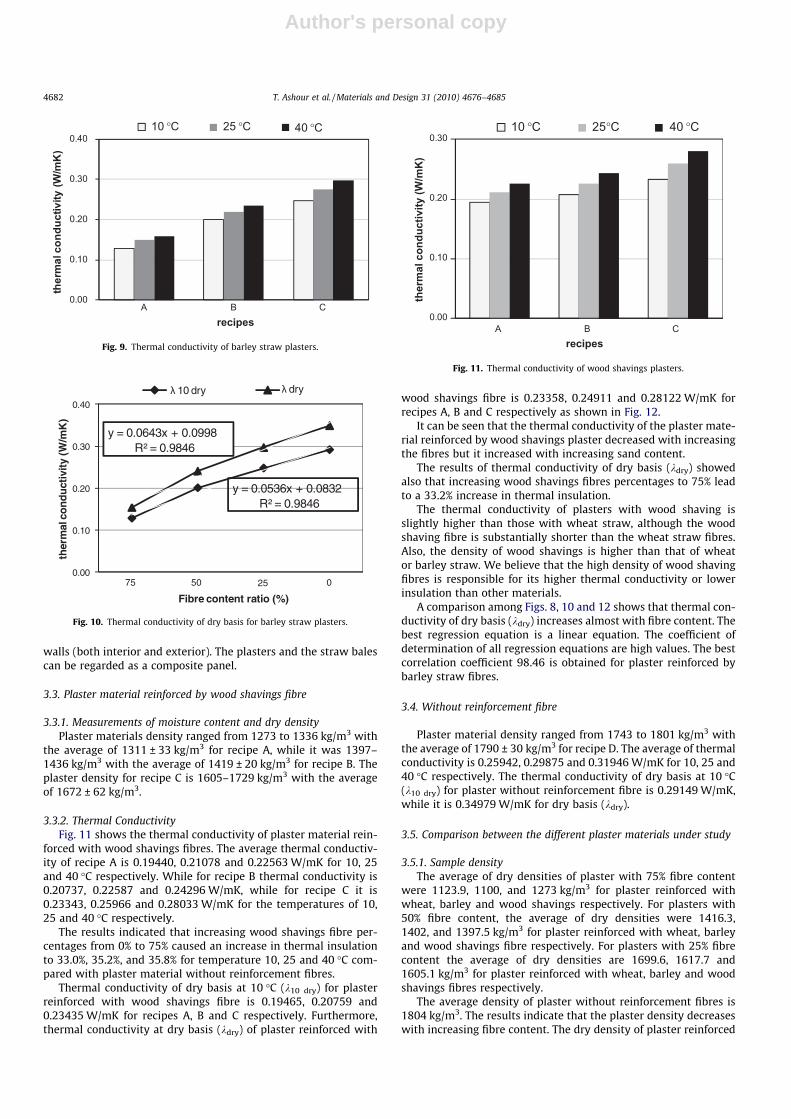
3.2.2. Thermal conductivityFig. 9 shows the thermal conductivity of plaster material rein-
forced with barley straw fibres. The average thermal conductivityof recipe A is 0.12890, 0.14290 and 0.15920 W/mK for differenttemperatures of 10, 25 and 40 �C respectively. For recipe B it is0.20016, 0.21899 and 0.23474 W/mK, and for recipe C it is0.24678, 0.27469 and 0.29645 W/mK for 10, 25 and 40 �C temper-atures respectively.
The results indicated that increasing barley straw fibre percent-ages from 0% to 75% caused an increase of thermal insulation to55.5%, 56.1%, and 54.7% for the temperatures of 10, 25 and 40 �Ccompared with plaster material without reinforcement fibres.
Thermal conductivity of dry basis at 10 �C (k10 dry) was 0.12856,0.20067 and 0.24780 W/mK for recipes A, B and C respectively.
Thermal conductivity at dry basis (kdry) of plaster reinforced withbarley straw fibre is 0.15427, 0.24080 and 0.29736 W/mK for rec-ipes A, B and C respectively as shown in Fig. 10.
The thermal conductivity of the plaster material reinforced bybarley straw plaster decreased with increasing fibre but it in-creased with increasing sand content. It seems that the reinforce-ment fibres have greater effect on the thermal conductivity.
The results of thermal conductivity at dry basis (kdry) for plasterreinforced by barley straw fibres revealed also that increasing ofbarley straw fibre percentages to 75% lead to thermal insulationincreasing to 55.9%. Our tests show that the reinforcement fibreshave a large effect on the thermal conductivity of plasters, whichis of great importance for straw bale buildings. In straw bale build-ings, the plasters are usually used as cladding for the straw bale
Fig. 6. Software regression analysis and thermal conductivity (k10) value.
0.00
0.10
0.20
0.30
0.40
A B C
ther
mal
co
nd
uct
ivit
y (W
/mK
)
recipes
10 °C 25 °C 40 °C
Fig. 7. Thermal conductivity of wheat straw plasters.
y = 0.0441x + 0.1296R² = 0.9317
y = 0.0529x + 0.1555R² = 0.9317
0.00
0.10
0.20
0.30
0.40
75 50 25 0
ther
mal
con
duct
ivity
(W/m
K)
Fibre content ratio (%)
λ10 dry λdry
Fig. 8. Thermal conductivity of dry basis for wheat straw plasters.
T. Ashour et al. / Materials and Design 31 (2010) 4676–4685 4681
Author's personal copy
walls (both interior and exterior). The plasters and the straw balescan be regarded as a composite panel.
3.3. Plaster material reinforced by wood shavings fibre
3.3.1. Measurements of moisture content and dry densityPlaster materials density ranged from 1273 to 1336 kg/m3 with
the average of 1311 ± 33 kg/m3 for recipe A, while it was 1397–1436 kg/m3 with the average of 1419 ± 20 kg/m3 for recipe B. Theplaster density for recipe C is 1605–1729 kg/m3 with the averageof 1672 ± 62 kg/m3.
3.3.2. Thermal ConductivityFig. 11 shows the thermal conductivity of plaster material rein-
forced with wood shavings fibres. The average thermal conductiv-ity of recipe A is 0.19440, 0.21078 and 0.22563 W/mK for 10, 25and 40 �C respectively. While for recipe B thermal conductivity is0.20737, 0.22587 and 0.24296 W/mK, while for recipe C it is0.23343, 0.25966 and 0.28033 W/mK for the temperatures of 10,25 and 40 �C respectively.
The results indicated that increasing wood shavings fibre per-centages from 0% to 75% caused an increase in thermal insulationto 33.0%, 35.2%, and 35.8% for temperature 10, 25 and 40 �C com-pared with plaster material without reinforcement fibres.
Thermal conductivity of dry basis at 10 �C (k10 dry) for plasterreinforced with wood shavings fibre is 0.19465, 0.20759 and0.23435 W/mK for recipes A, B and C respectively. Furthermore,thermal conductivity at dry basis (kdry) of plaster reinforced with
wood shavings fibre is 0.23358, 0.24911 and 0.28122 W/mK forrecipes A, B and C respectively as shown in Fig. 12.
It can be seen that the thermal conductivity of the plaster mate-rial reinforced by wood shavings plaster decreased with increasingthe fibres but it increased with increasing sand content.
The results of thermal conductivity of dry basis (kdry) showedalso that increasing wood shavings fibres percentages to 75% leadto a 33.2% increase in thermal insulation.
The thermal conductivity of plasters with wood shaving isslightly higher than those with wheat straw, although the woodshaving fibre is substantially shorter than the wheat straw fibres.Also, the density of wood shavings is higher than that of wheator barley straw. We believe that the high density of wood shavingfibres is responsible for its higher thermal conductivity or lowerinsulation than other materials.
A comparison among Figs. 8, 10 and 12 shows that thermal con-ductivity of dry basis (kdry) increases almost with fibre content. Thebest regression equation is a linear equation. The coefficient ofdetermination of all regression equations are high values. The bestcorrelation coefficient 98.46 is obtained for plaster reinforced bybarley straw fibres.
3.4. Without reinforcement fibre
Plaster material density ranged from 1743 to 1801 kg/m3 withthe average of 1790 ± 30 kg/m3 for recipe D. The average of thermalconductivity is 0.25942, 0.29875 and 0.31946 W/mK for 10, 25 and40 �C respectively. The thermal conductivity of dry basis at 10 �C(k10 dry) for plaster without reinforcement fibre is 0.29149 W/mK,while it is 0.34979 W/mK for dry basis (kdry).
3.5. Comparison between the different plaster materials under study
3.5.1. Sample densityThe average of dry densities of plaster with 75% fibre content
were 1123.9, 1100, and 1273 kg/m3 for plaster reinforced withwheat, barley and wood shavings respectively. For plasters with50% fibre content, the average of dry densities were 1416.3,1402, and 1397.5 kg/m3 for plaster reinforced with wheat, barleyand wood shavings fibre respectively. For plasters with 25% fibrecontent the average of dry densities are 1699.6, 1617.7 and1605.1 kg/m3 for plaster reinforced with wheat, barley and woodshavings fibres respectively.
The average density of plaster without reinforcement fibres is1804 kg/m3. The results indicate that the plaster density decreaseswith increasing fibre content. The dry density of plaster reinforced
0.00
0.10
0.20
0.30
A B C
ther
mal
con
duct
ivity
(W/m
K)
recipes
10 °C 25°C 40 °C
Fig. 11. Thermal conductivity of wood shavings plasters.
0.00
0.10
0.20
0.30
0.40
A B C
ther
mal
con
duct
ivity
(W/m
K)
recipes
10 °C 25 °C 40 °C
Fig. 9. Thermal conductivity of barley straw plasters.
y = 0.0536x + 0.0832R² = 0.9846
y = 0.0643x + 0.0998R² = 0.9846
0.00
0.10
0.20
0.30
0.40
75 50 25 0
ther
mal
co
nd
uct
ivit
y (W
/mK
)
Fibre content ratio (%)
λ 10 dry λ dry
Fig. 10. Thermal conductivity of dry basis for barley straw plasters.
4682 T. Ashour et al. / Materials and Design 31 (2010) 4676–4685

Author's personal copy
with wood shavings is slightly higher than those with wheat andbarley straw. This may be due to the fact that the shavings are finerthan wheat or barley straw fibres. Also wood shavings have a morelignin and a greater solid composition than wheat and barley strawfibres.
3.5.2. Moisture contentThe average moisture content of plaster with 75% fibre contents
are 2.78%, 2.68% and 1.11% for plaster reinforced with wheat, bar-ley and wood shavings respectively. For plasters with 50% fibrecontent, the average moisture contents are 1.3%, 1.04%, and 0.87%for plaster reinforced with wheat, barley and wood shavings fibresrespectively. For plasters with 25% fibre content, the average mois-ture contents are 0.61%, 0.8%, and 0.51% for plaster reinforced bywheat, barley and wood shavings respectively. This compares withthe average moisture content of plaster without fibre being about1.11%. The results confirm that the moisture content increases withincreasing fibre content. We believe that the fibres absorb morewater than soil. The moisture content for plaster reinforced bywheat and barley straw fibre are slightly higher than plaster rein-forced by wood shavings.
3.5.3. Thermal conductivityFig. 13 shows the relationship between the thermal conductiv-
ity of different plaster materials and different temperatures 10, 25,40 �C. It can be seen that the thermal conductivity increased grad-ually with increasing temperature.
For recipe A, thermal conductivity is 0.16260, 0.12894, 0.19440and 0.289965 W/mK at 10 �C for plaster reinforced by wheat, bar-ley wood shavings and without fibres respectively. While at 25 �C,thermal conductivity is 0.18560, 0.14293, 0.21078 and 0.32532 W/mK for wheat, barley, wood shavings sand plaster respectively. Onthe other hand, thermal conductivity at 40 �C is 0.21180, 0.15922,0.22563 and 0.35155 W/mK of plaster reinforced with wheat, bar-ley, wood shavings and without fibres respectively (Fig. 13).
For recipe B, the values of thermal conductivity is 0.22610,0.20016, 0.20737 and 0.289965 W/mK at 10 �C for plaster rein-forced with wheat, barley, wood shavings and without fibresrespectively. While at 25 �C, thermal conductivity is 0.24850,0.21899, 0.22587 and 0.32532 W/mK for wheat, barley, woodshavings and plasters without fibres respectively. Thermal conduc-tivity at 40 �C is 0.26810, 0.23474, 0.24296 and 0.35155 W/mK ofplaster reinforced with wheat, barley, wood shavings and sandrespectively (Fig. 14).
For recipe C thermal conductivity is 0.27763, 0.24678, 0.23343and 0.28997 W/mK at 10 �C temperature for plaster reinforcedwith wheat, barley, wood shavings and without fibres respectively.Whilst at 25 �C, thermal conductivity is 0.30750, 0.27469, 0.25966and 0.32532 W/mK for wheat, barley, wood shavings and plasterwithout fibres respectively. Thermal conductivity at 40 �C is0.32975, 0.29645, 0.28033 and 0.35155 W/mK of plaster reinforcedwith wheat, barley, wood shavings and without fibres respectively(Fig. 15).
It is interesting to observe that the lowest thermal conductivitywas obtained by plaster reinforced by barley straw fibre. This maybe because the barley bales contain finer particles than wheat baleswhich were more resistant to the heat transfer.
Fig. 16 shows the relationship between dry bases at 10 �C forplasters with different reinforcement fibres. Thermal conductivityof dry basis at 10 �C (k10 dry) for recipe A is 0.16207, 0.12856,0.19465 and 0.29149 W/mK of wheat, barley, wood shavings andwithout fibres plaster respectively. While for recipe B, it is0.22660, 0.20067, 0.20759 and 0.29149 W/mK for wheat, barley,wood shavings and without fibres plaster respectively. k10 dry forrecipe C is 0.27890, 0.24780, 0.23435 and 0.29149 W/mK for plas-ter reinforced with wheat, barley, wood shavings and without fi-bres respectively.
y = 0.0317x + 0.1527R² = 0.9093
y = 0.0381x + 0.1832R² = 0.9093
0.00
0.10
0.20
0.30
0.40
75 50 25 0
ther
mal
con
duct
ivity
(W/m
K)
Fibre content ratio (%)
λ 10 dry λ dry
Fig. 12. Thermal conductivity of dry basis for wood shavings plasters.
0.00
0.10
0.20
0.30
0.40
10 25 40
ther
mal
con
duct
ivity
(w/m
K)
temperature (°C)
wheat barley
shavings without fibres
Fig. 13. Thermal conductivity of different plaster materials for treatment A.
0.00
0.10
0.20
0.30
0.40
10 25 40
ther
mal
con
duct
ivity
(W/m
K)
temperature (°C)
wheat barley
shavings without fibres
Fig. 14. Thermal conductivity of different plaster materials for treatment B.
T. Ashour et al. / Materials and Design 31 (2010) 4676–4685 4683

Author's personal copy
Thermal conductivity of dry basis (kdry) for recipe A is 0.19448,0.154272, 0.23358 and 0.34979 W/mK for wheat, barley, and woodshavings and without fibres plaster respectively. kdry for recipe B is0.27189, 0.24080, 0.24911 and 0.34979 W/mK for wheat, barley,and wood shavings and without fibres plaster respectively. kdry
for recipe C is 0.33468, 0.29736, 0.28122 and 0.34979 W/mK ofplaster reinforced with wheat, barley, wood shavings and withoutfibres respectively (Fig. 17).
When the straw fibres increased to the percent of 75% and thesand percent decreased to 0% (recipe A), thermal insulation in-creased to 44.4%, 55.9%, and 33.2% for plaster reinforced withwheat straw, barley straw and wood shavings fibres respectively.For recipe B, thermal insulation increased to 22.3%, 31.2%, and28.8% for plaster reinforced with wheat straw fibre, barley strawand wood shavings respectively. The results revealed that plasterreinforced by barley straw fibres had the highest values of thermalinsulation.
Generally, thermal conductivity for plaster reinforced by woodshavings is higher than plaster reinforced by wheat and barleystraw fibres. The highest thermal resistance is obtaining from theplaster reinforced by barley straw fibres.
4. Conclusion and recommendations
Thermal conductivity of dry basis at 10 �C (k10 dry) for recipe A isabout 0.16207, 0.12856, 0.19465 and 0.29149 W/mK for wheat,barley, wood shavings and unreinforced fibre plasters respectively.For recipe B, it is about 0.22660, 0.20067, 0.20759 and 0.29149 W/mK for wheat, barley, wood shavings and unreinforced fibre plas-ters respectively. k10 dry for recipe C is 0.27890, 0.24780, 0.23435and 0.29149 W/mK of plaster reinforced with wheat, barley, woodshavings and without fibres respectively.
The thermal conductivity of dry basis (kdry) for recipe A is0.19448, 0.154272, 0.23358 and 0.34979 W/mK of wheat, barley,wood shavings and without fibres plaster respectively. On theother hand kdry for recipe B is 0.27189, 0.24080, 0.24911 and0.34979 W/mK for the same materials. Furthermore, kdry for recipeC is 0.33468, 0.29736, 0.28122 and 0.34979 W/mK of the sameplaster materials.
By increasing the fibre content to about 75% and removing sand(recipe A), the thermal insulation is increased to about 44.4%, 55.9%and 33.2% for plaster reinforced with wheat straw, barley strawand wood shaving fibres respectively. For recipe B the thermalinsulation is increased to about 22.3%, 31.2% and 28.8% for plasterreinforced with wheat straw fibre, barley straw and wood shavingsrespectively.
The results revealed that the thermal conductivity of the plastermaterial decreases with increasing fibre content and decreasingsand content. The reinforcement fibres have greater effect on thethermal conductivity than the sand content. Our results show thatplaster reinforced by barley straw fibre possesses the highest ther-mal insulation.
Acknowledgement
The authors would like to thank Mr. John Mathews, Institute ofGeotechnical Engineering, University of Natural Resources and Ap-plied Life Sciences for his efforts through this work.
References
[1] Doukas H, Patlitziana KD, Kagiannas AG, Psarras J. Renewable energy sourcesand rationale use of energy development in the countries of GCC: myth orreality? Renew Energy 2006(31):755–70.
[2] Papadopoulos A. State of the art in thermal insulation materials and aims forfuture developments. Energy Build 2005(37):77–86.
[3] Sampathrajan A, Vijayaraghavan NC, Swaminathan KR. Mechanical andthermal properties of particle boards made from farm residues. BioresourTechnol 1992;1(4):249–51.
[4] ASTM D1554-86. Standard terminology relating to wood-based fiber andparticle panel materials. West Conshohocken (PA): ASTM; 1995. p. 225–7.
0.00
0.10
0.20
0.30
0.40
10 25 40
ther
mal
con
duct
ivity
(W/m
K)
temperature (°C)
wheat barley
shavings without fibres
Fig. 15. Thermal conductivity of different plaster materials for treatment C.
0.00
0.10
0.20
0.30
0.40
wheat barley shavings without fibres
ther
mal
con
duct
ivity
(W/m
K)
reinforcement fibers
A B C D
Fig. 16. Thermal conductivity (k10 dry) of different plaster materials.
0.00
0.10
0.20
0.30
0.40
wheat barley shavings without fibres
ther
mal
co
nd
uct
ivity
(W
/mK
)
reinforcement fibers
A B C D
Fig. 17. Thermal conductivity (kdry) of different plaster materials.
4684 T. Ashour et al. / Materials and Design 31 (2010) 4676–4685

Author's personal copy
[5] Johnson RF. Environ Sci Technol 1973;7:439 (5).[6] Wollenberg R, Naundorf W, Abraham J, Edel J, Trommer DA. Mieth, Offen. DE
19628751A1; 1998.[7] Witka-Jezewska E, Hupka J, Pieniazek P. In: Proceedings of the US united
engineering foundation conference and 2nd international conference analysisand utilization of oily wastes (AUZO’99), Jurata, Poland, August 29–September3; 1999. p. 63–7.
[8] Joergensen RG, Figge RM, Kupsch LZ. Pflanzenernaehr Bodenkd 1997;160(1):21.
[9] Welch IM, Barret PRF, Gibson MT, Ridge I. J Appl Phytol 1990:231 (2).[10] Pillinger JM, Cooper JA, Ridge I. J Chem Ecol 1994;20(7):1557.[11] Witka-Jezewska E, Hupka J. In: Proceedings of the seventh Polish_Danish
workshop on biomass for energy, Starbienino, December 7–10, 2000. p. 215.[12] Ashour TH. The use of renewable agricultural by-products as building
materials. PhD thesis. Egypt: Benha University; 2003.[13] McCabe J. The thermal resistivity of straw bales for construction. Unpublished
Master’s thesis. Tucson, AZ: Department Nuclear Engineering University ofArizona; 1994.
[14] Minke G. Building with earth, design and technology of sustainablearchitecture, text book. Basel, Berlin, Boston: Birkhaeser, Publishers forArchitecture; 2006. p. 30–2.
[15] Kuenzel H. Feuchteeonfluss auf die Waermeleitfaehigkeit bei Hygroskopischenund nicht Hygroskopischen Stoffen. WKSB 1990(36):15–8.
[16] Steen AS, Bainbridge D. The straw bale house. 1. Aufl. White River Junction, VT,USA; 1994.
[17] Stone L. A passive solar straw bale school. Solar Today 1999;13(1):32–5 [1042-0630].
[18] Goodhew S, Griffiths R. Analysis of thermal-probe measurements using aniterative method to give sample conductivity and diffusivity data. Appl Energy2004:205–23.
[19] Goodhew S, Griffiths R. Sustainable earth walls to meet the buildingregulations. Energy Build 2005;1(37):451–9.
[20] Kochhar GS, Manohar K. Use of Coconut fiber as a low-cost thermal insulator.In: Graves RS, Zarr RR, editors. Insulation materials: testing and applications,3rd volume, ASTM STP 1320, American Society for Testing and Materials;1997. p. 283–91.
[21] Bederina M, Marmoret L, Mezreb K, Khenfer MM, Bali A, Quéneudec M. Effectof the addition of wood shavings on thermal conductivity of sand concretes:experimental study and modeling. Constr Build Mater 2007;21(3):662–8.
[22] Gatland SD, Goss WP, Baumgardner RL, Williams RG, Miller RG. A wall andedge guarded hot box for thermal transmittance measurements. ASTM SpecialTech Publ 1997;1320:46–59.
[23] ISO 8302. Thermal insulation – determination of steady-state thermalresistance and related properties – guarded hot plate apparatus; 1991.
[24] DIN EN 1946-2. Thermal performance of building products and buildingcomponents – specific criteria for the assessment of laboratories measuringheat transfer properties – part 2: measurements by guarded hot platemethod.
[25] EN 12664, 2001. Thermal performance of building materials and products.Determination of thermal resistance by means of guarded hot plate and heatflow meter methods. Dry and moist products of medium and low thermalresistance.
[26] DIN EN 12667. Thermal performance of building materials and products.Determination of thermal resistance by means of guarded hot plate and heatflow meter methods. Products of high and medium thermal resistance;German version EN 12667:2001; 2001–05.
[27] BS EN 12939. Thermal performance of building materials and products.Determination of thermal resistance by means of guarded hot plate and heatflow meter methods. Thick products of high and medium thermal resistance;2001.
[28] ASTM C177. Standard test method for steady-state heat flux measurementsand thermal transmission properties by means of the guarded-hot-plateapparatus; 2004.
[29] DIN 52612. Testing of thermal insulating materials. Determination of thermalconductivity by the guarded hot plate apparatus. Test procedure andevaluation; 1979.
[30] DIN EN 1266. Thermal performance of building materials and products –Determination of thermal resistance by means of guarded hot plate and heatflow meter methods. Products of high and medium thermal resistance;German version EN 12667:2001; 2001.
[31] DIN EN ISO, 12570. Waerme und Feuchtetechnisches verhalten von Baustoffenund Bauprodukten-Bestimmung des Feuchtegehaltes durch Trocknen beierhoehter Temperatur; 2000.
T. Ashour et al. / Materials and Design 31 (2010) 4676–4685 4685