Wages, prices, and living standards in China, 17381925: in comparison with Europe, Japan, and India
62
Hitotsubashi University Repository Title Wages, prices, and living standards in China, 1738- 1925: in comparison with Europe, Japan, and India Author(s) Allen, Robert C.; Bassino, Jean-Pascal; Ma, Debin; Moll-Murata, Christine; Zanden, Jan Luiten van Citation Issue Date 2009-10 Type Technical Report Text Version publisher URL http://hdl.handle.net/10086/17751 Right
-
Upload
independent -
Category
Documents
-
view
2 -
download
0
Transcript of Wages, prices, and living standards in China, 17381925: in comparison with Europe, Japan, and India
Hitotsubashi University Repository
TitleWages, prices, and living standards in China, 1738-
1925: in comparison with Europe, Japan, and India
Author(s)Allen, Robert C.; Bassino, Jean-Pascal; Ma, Debin;
Moll-Murata, Christine; Zanden, Jan Luiten van
Citation
Issue Date 2009-10
Type Technical Report
Text Version publisher
URL http://hdl.handle.net/10086/17751
Right

Center for Economic Institutions
Working Paper Series
Center for Economic Institutions
Working Paper Series
Institute of Economic Research
Hitotsubashi University 2-1 Naka, Kunitachi, Tokyo, 186-8603 JAPAN
Tel: +81-42-580-8405 Fax: +81-42-580-8333
No. 2009-3
“Wages, Prices, and Living Standards in China, 1738-1925: in Comparison with Europe,
Japan, and India“
Robert C. Allen, Jean-Pascal Bassino, Debin Ma Christine Moll-Murata, Jan Luiten van Zanden
October 2009

Wages, prices, and living standards in China, 1738-1925: in comparison with Europe, Japan, and India*
Robert C. Allen Nuffield College, University of Oxford
Jean-Pascal Bassino
University of Montpellier, France
Debin Ma Economic History Department, London School of Economics
Christine Moll-Murata
Bochum University, Germany
Jan Luiten van Zanden Utrecht University/International Institute for Social History, Amsterdam
Debin Ma Corresponding author:
Economic History Department, London School of Economics, London, WC2A 2AE. Email: [email protected].
June 2009
SUMMARY The paper develops data on the history of wages and prices in Beijing, Canton, Suzhou/Shanghai in China from the eighteenth century to the twentieth and compare them with leading cities in Europe, Japan and India in terms of nominal wages, the cost of living, and the standard of living. In the eighteenth century, the real income of building workers in Asia was similar to that of workers in the backward parts of Europe but far behind that in the leading economies in northwestern Europe. Real wages declined in China in the eighteenth and early nineteenth centuries and rose slowly in the late nineteenth and early twentieth with little cumulative change for two hundred years. The income disparities of the early twentieth century were due to long run stagnation in China combined with industrialization in Japan and Europe. * This paper is part of the NSF grant funded project “Global Prices and Income 1350-1950” headed by Peter Lindert, the Spinoza premium project on Global Economic History funded by NWO (The Netherlands), and the Team for Advanced Research on Globalization, Education, and Technology funded by the Social Sciences and Humanities Research Council of Canada. We wish to express our thanks to Peter Lindert for suggestions and encouragements at every stage of this paper, as well as to Kariin Sundsback for collecting the VOC data. Our paper also benefited from the lively discussion at the 43rd Cliometrics Conference June 2005, the Global Economic History Network (GEHN) Conference at Utrecht in June 2005, seminars at University of Warwick, Paris School of Economics, Tsinghua University, University of Tuebinger, University of Tokyo, Yale University, in particular from Jörg Baten, Steve Broadberry, Kent Deng, Bishnupriya Gupta, Timothy Guinnane, Patrick O’Brien, Kenneth Pomeranz, Jean-Laurent Rosenthal, Tirthankar Roy, Osamu Saito and R. Bin Wong. Our thanks also go to the three anonymous referees of this Journal and to the editor, Jane Humphries. The underlying price and wage data in this study are available in excel format at http://www.iisg.nl/hpw/data.php#china and http://gpih.ucdavis.edu/Datafilelist.htm.
2
Wages, prices, and living standards in China, 1738-1925: in comparison with Europe, Japan, and India
SUMMARY
The paper develops data on the history of wages and prices in Beijing, Canton, Suzhou/Shanghai in China from the eighteenth century to the twentieth and compare them with leading cities in Europe, Japan and India in terms of nominal wages, the cost of living, and the standard of living. In the eighteenth century, the real income of building workers in Asia was similar to that of workers in the backward parts of Europe but far behind that in the leading economies in northwestern Europe. Real wages declined in China in the eighteenth and early nineteenth centuries and rose slowly in the late nineteenth and early twentieth with little cumulative change for two hundred years. The income disparities of the early twentieth century were due to long run stagnation in China combined with industrialization in Japan and Europe.
‘The difference between the money price of labour in China and Europe is still greater than that between the money price of subsistence; because the real recompence of labour is higher in Europe than in China.’
Adam Smith, Wealth of nations, 1776, p. 189.
The comparative standard of living of Asians and Europeans on the eve of the
Industrial Revolution has become a controversial question in economic history. The classical
economists and many modern scholars have claimed that European living standards exceeded
those in Asia long before the Industrial Revolution. Recently, this consensus has been
questioned by revisionists,1
1 For instance, Pomeranz, Great divergence; Parthasarathi, ‘Rethinking wages’; Wong, China transformed; Lee
and Wang, One quarter of humanity; Li Bozhong, Agricultural development; Allen, ‘Agricultural productivity’;
Allen, ‘Mr. Lockyer’; Allen, ‘Real wages in Europe and Asia’; Allen, Bengtsson, and Dribe (eds.), Living
standards in the past.
who have suggested that Asian living standards were on a par
with those of Europe in the eighteenth century and who have disputed the demographic and

3
agrarian assumptions that underpin the traditional view. The revisionists have not convinced
everyone, however.2
One thing is clear about this debate, and that is the fragility of the evidence that has
been brought to the issue. Most of the comparative studies relied on indirect comparisons
based on scattered output, consumption, or demographic data. The few that attempted
comparisons of direct income were largely based on scattered information about wages and
prices in Asia.
3
This article, by assembling and constructing systematic data on wages and prices from
Imperial ministry records, merchant account books and local gazetteers, is an attempt to fill
that gap for China in the eighteenth and nineteenth centuries. These wage series, deflated by
appropriate cost of living indices using reconstructed consumption baskets, are then compared
to the Japanese, Indian, and European evidence to assess the relative levels of wage earners’
real income at the two ends of Eurasia. The comparisons paint a less optimistic picture of
Asian performance than the revisionists suggest.
Our knowledge of real incomes in Europe is broad and deep because scholars
since the mid-nineteenth century have been compiling data bases of wages and prices for
European cities from the late Middle Ages into the nineteenth century when official statistics
begin.
Taking the hypothesis of Adam Smith at the head of this paper as a point of departure,
the present study compares the ‘money price’ of labour in China and Europe. For this purpose,
wage rates are expressed in grams of silver earned per day in the two regions. Unminted
2 For instance, Broadberry and Gupta, ‘Early modern great divergence’; Allen, ‘India in the great divergence’.
3 Pomeranz, Great divergence; Lee and Wang, One quarter of humanity.

4
silver measured in tael (of 37 grams)4
Approaching the problem in several ways turns out to imply similar relative price
levels. Once they are measured, the differences between European and Chinese money
wages and costs of subsistence and the implications of those differences for the ‘real
recompence of labour’ can be perceived.
was a universal medium of exchange in China in this
period. The terms on which silver coins exchanged defined the market exchange rate of
European and Asian moneys. Next, the ‘money price of subsistence’ is compared. This is a
more complicated problem since the subsistence foods were different in China and Europe.
The rest of the paper is divided into five sections with a conclusion. The first two
sections review a variety of Chinese wage data to establish the history of nominal wages from
the eighteenth to the twentieth centuries. The focus is set on the histories of Canton, Beijing,
and the nearby cities of Suzhou and Shanghai in the Yangzi delta, because fullest information
is available for these cities, and because they are comparable to the large cities in Europe and
Japan for which we have similar information. In section 3, nominal wages in China and
Europe are compared to see if Smith was correct about the ‘money price of labour’. Section 4
turns to the ‘price of subsistence’ and develops consumer prices indices to compare the cost
of living across Eurasia. In section 5, the authors compare Smithian price indices to Fisher
Ideal Indices for broader consumer bundles and show that they yield similar results in a
comparison of London and Beijing. In section 6, the real wage income in Canton, Beijing,
and Suzhou/Shanghai from the mid-eighteenth century to the 1920s is estimated. Smith’s
belief about the ‘real recompence of labour’ is tested by comparing real wage income in these
Chinese cities to their counterpart in other countries. For Japan, Chinese urban incomes are
4 The present study applies this average value; variation for the four most important units ranged between 36.54
and 37.58 grams. See Peng, Monetary history of China, p. 669, fn. 4-7.

5
compared to a composite picture of Kyoto and Edo (modern Tokyo) in the eighteenth and
early nineteenth centuries, and Tokyo for the late nineteenth and early twentieth century,
based on Bassino and Ma’s study ‘Japanese unskilled wages’. Real wages in China are
compared to those in India using the results in Allen’s ‘India in the great divergence’. The
perspective on Asian performance is broadened by contrasting living standards there to
London, Amsterdam, Leipzig and Milan, as worked out by Allen in ‘Great divergence in
European wages’. The study concludes with a discussion of the significance of its findings for
Adam Smith and the great divergence debate.
I. Wage levels in eighteenth- and nineteenth-century China
Before comparing living standards, the level and trend of nominal wages in China
must be established. Since most European wages are recorded for urban labourers in the
building industry, the present study concentrates on unskilled male workers in three large
Chinese cities. No single source covers the whole period from the eighteenth century to the
twentieth, so the wage history of China must be pieced together by combining disparate
information.5
For Beijing, some wages for labourers on eighteenth-century government building
projects are known, and wages for similar workers from the 1860s to the 1920s can be found.
For Canton, wage data of unskilled port labour hired by European trading companies in the
eighteenth century are available. For Suzhou, the daily earnings of men engaged as
calenderers pressing cloth in the textile industry can be estimated. This series can be linked
to the wages of spinners in cotton textile mills in Shanghai in the twentieth century. Indeed,
5 For a survey of existing studies on wages and prices, see Kishimoto, Shindai chūgoku.

6
a more complete picture of labour incomes in the Yangzi delta can be developed by also
assessing the earnings of male farm labourers, rural women spinning and weaving cotton
cloth, and peasant households as a whole. By matching eighteenth-century wages for
specific unskilled occupations in China with corresponding wages for the early twentieth
century, the long-term history of Chinese wages can be reconstructed for comparison with
European wages.
This wage survey begins with three sets of wage data for the eighteenth century that are
reasonably continuous and well defined. The first set are the piece wage rates of the cotton
calenderers inscribed on steles for crafts and commerce in Suzhou, the largest industrial and
trading city in the Yangzi delta during the eighteenth and nineteenth centuries. The case of
cotton calenderers and their wage disputes have been the subject of numerous studies.6 The
calenderers’ job was ‘to soften and polish cotton cloth after it had been pressed and rubbed’.7
In the eighteenth century, the calenderers were mostly migrants to Suzhou from the
impoverished provinces of northern Jiangsu and Anhui. They ‘had to be strong men,
considering the especially tiring nature of their job: using their arms as levers on wooden
The inscribed data give us the guild-negotiated piece wage rates for the years of 1670, 1693,
1701, 1715, 1730, 1772 and 1795. As these are piece wages quoted in silver taels, there are no
ambiguities about copper-silver exchange rates or additional food allowance. The major issue
is the conversion of piece rates into daily wages, for which Xu Xinwu’s study for the early
twentieth century was used, as explained in Appendix I A. Overall, the daily wages thus
derived come to 0.09944 and 0.1144 silver taels in 1730 and 1772 respectively.
6 Quan, ‘Qingdai Suzhou de chuaibuye’; Terada, ‘Sōshū tampogyō no kei’ei keitai’; Santangelo, ‘Urban society
in late imperial Suzhou’; Xu, Jiangnan tubu shi.
7 Santangelo, ‘Urban society in late imperial Suzhou’, p. 109.

7
supports while balancing, they had to rock a huge forked stone with a ground base onto cotton
cloth wrapped around a wooden roller which rotated in a groove in the base of the stone’.8
Our second source for private sector wages is the archives of the Dutch East Indies
Company (VOC). Many VOC ships docked at Canton, which was the city where Europeans
were allowed to trade with China in the eighteenth century. The VOC hired many Chinese
workers to repair ships and move cargo. A recent study by Paul Van Dyke offers a detailed
description on the workings of the provisioning system in Canton. From the VOC archives,
63 wage quotations spanning the eighteenth century can be obtained.
Calenderers were only a little above unskilled building labourers in the skill and pay
distribution.
9
The third set of wage data comes from diverse sources. We begin with two
government regulations. The first is the Wuliao jiazhi zeli (‘Regulations and precedents on
the prices of materials’) of 1769, which is a very detailed and systematic government report
on the prices of buildings materials and the wages paid at construction projects, and an
attempt to set these prices and wages for the future. According to the editorial introduction, it
contained information about 1,557 administrative units described in a compilation of 220
chapters. The original compilation has not been preserved, but the editions for 15 provinces
covering 945 districts are extant. Most of them contain the daily wages of unskilled and
skilled craftsmen for each district; a few are more detailed and present wages for occupations
The wages fluctuated,
but they clustered between 0.08 and 0.1 taels per day with no additional food allowances.
8 Ibid., p. 109.
9 See Van Dyke, Canton trade, and Jörg, Porcelain, pp. 21-73, for the details of the organization of the VOC in
Canton. We specifically used the files in the National Archives The Hague, Archives VOC, no. 4373, 4376,
4378, 4381, 4382, 4386, 4388, 4390, 4392, 4395-4401, 4403, 4405, 4408, 4409.

8
such as master sawyers, carpenters, stonemasons, paint-makers and painters, tailors, plasterers,
canopy makers, paperhangers, and cleaners (in Zhili). Occasionally additional food provisions
and their monetary value are recorded, so that the total wage value can be calculated. Where
no food provisions are mentioned, probably no food allowance was given, as these wage
regulations were supposed to cover the entire labour cost of these public building projects.10
A virtue of the Wuliao jiazhi zeli is its comprehensive regional coverage of Chinese
wages. For each province we calculated the unweighted average of the wage norms for
labourers in all districts. Table 1 presents the results of these calculations for 21 regions. Zhili
is divided into a number of sub-regions because of the large wage differences within this
province. The total population of these regions in 1776 was about 214.5 millions or 73 per
cent of the total population of China of about 293 millions.
11
Insert Table 1 here
The pattern that emerges from the Wuliao jiazhi zeli is that daily wages in parts of
10 The introductory memorial to these regulations states that market prices and wages were investigated in the
regions, and that the prices and wages quoted in these volumes were near to market prices at low market activity;
see ‘Wuliao jiazhi zonglue’, http://www.uni-tuebingen.de/uni/ans/project/shp/zeli/zonglue.htm. The provincial
editions for Zhili, Henan, Shandong, Shanxi, Shaanxi, Gansu, Jiangsu, Zhejiang, Guangdong, and Yunnan all
carry the same introductory memorial dated 1769. Other editions have no preface, such as those for Hunan,
which is a fragment, and ‘Manchuria’ (Shengjing/Jilin/Heilongjiang). The 1791 Sichuan and the 1795 Rehe
editions are later compilations. No special edition was ever compiled for Xinjiang, but a few Xinjiang data are
mentioned in the Gansu, Sichuan, and Rehe editions. Digitalized datasets for the provinces Gansu, Zhili, Yunnan,
Hunan, and Shanxi are available online in the ‘Databases on materials, wages, and transport costs in public
construction in the Qianlong era’ (www.uni-tuebingen.de/sinologie/project/shp/databases.html). See also Song
and Moll-Murata, ‘Notes on Qing dynasty handicraft regulations’.
11 Wang, Land taxation, p. 87.

9
Manchuria (Heilongjiang and Jilin), the home territory of the ruling Manchu dynasty, and the
sparsely populated north-western frontier of Xinjiang, stand out as the highest, followed by
areas in and near the capital city of Beijing. Average daily wages in the rest of China seemed
to have been fairly uniform, with the coastal Fujian province fetching the lowest 0.030 taels
for unskilled labourers.
A second government source is the so-called Gongbu junqi zeli (Regulations and
precedents on weapons and military equipment by the Ministry of Public Works) of 1813,
which contains more government wage regulations on an empire-wide scale. The Gongbu
junqi zeli contains wages for master artisans and unskilled labour that produced military
equipment. Our data base includes information for skilled and unskilled labourers.12
Extreme caution should be exercised in the interpretation of these government data.
The Wuliao jiazhi zeli wage data collected at the county level often show identical wages
across a vast number of counties within one province, with little distinction between the more
and less urbanized ones. This poses the question whether these data reflect actual market
conditions or rather government policies, which tended to favour the capital region as well as
Manchuria, the home territory of the Qing rulers.
This
source shows again that, with the exception of Zhili where Beijing is situated, the norm for
average daily wages of unskilled labourers in most provinces in 1813 was about 0.04 taels,
very close to that in the 1769 regulations.
13
To tackle the question of how accurately these government regulated wages
approximate wages in the private sector of the economy, we place these wage series against a
12 See You, ‘Lun junqi zeli’, p. 314. Wages of skilled craftsmen were 0.020 or 0.010 taels higher.
13 Qing restricted the migration of Han Chinese to the land and resource rich, but labour-scarce region of
Manchuria until the mid-nineteenth century.
10
broader data set of 264 scattered wage quotations from many sources and for different parts
of China. The problem with these disparate wages from the private sector is a lack of the
kind of detail information available for the Suzhou calenderers and Canton VOC labourers.
Also, there is a general lack of comparability due to the multiplicity of labour contracts,
payment systems, and currency units. Employment contracts could last for a day, a month, or
a year, and careful attention must be given to the number of days worked in a month or a year
to reduce the payment information to a consistent daily rate. There are many cases for which
food allowances were given in addition to cash payments. Possibly the most difficult issue of
all was the quotation of wages in different currency units (copper coins, silver taels) with
exchange values that were both highly localized and fluctuating over time. Studies not taking
full cognizance of these problems can be very misleading.14
The most important official source for private wages consulted in the present study is
the records of the imperial Ministry of Justice, which summarized judicial cases dealing with
wage payment. A sample of 188 manufacturing and handicraft wages was obtained from Peng
Zeyi’s compilation on craft history, which is based on judicial records from ca 1740 to
1820.
15 They are contained in the archival documents of the Ministry of Justice, Qingdai
xingbu chao’an (Copies of archival materials from the Qing Ministry of Justice).16
14 Vogel, ‘Chinese central monetary policy’ contains the most comprehensive collection of market exchange
rates for various provinces in China for the seventeenth to nineteenth centuries. But these exchange rates do not
apply to the case of the co-circulation of multiple versions of silver and copper cash within the same locality, an
issue pointed out in Kuroda’s recent study ‘Copper coins’. For a case of neglecting these complicated currency
problems in the study of nominal and grain wages, see Chao, Man and land.
This
represents a wide-spread sample which includes scattered wage data for different occupations,
15 Peng, Zhongguo jindai shougongye, vol. 1, pp. 396-414.
16 Peng, Zhongguo jindai shougongye, vol. 1, p. 397, note 2.

11
in different regions, using different means of payment (silver taels or copper coins), covering
different time periods (per day, month or year), and spread over a long period. The Ministry
of Justice records also contain samples of agricultural wages. These are available in the work
of Wei Jinyu and Wu Liangkai. For the present study, these wages (mostly in copper cash)
were converted to silver tael based on Vogel’s exchanges rates.17
The resulting large, if disparate, sample of wages covers many provinces, industries,
and types of employment in eighteenth-century China. To extract basic patterns from this
information, a wage function was estimated using all of the collected wages, including the
VOC and government regulation wages. All wages were converted to daily wages in silver
tael by means of Vogel’s regional dataset of silver-copper conversion ratios.
18
The following independent variables were defined:
• Regions, based on Wuliao jiazhi zeli: Manchuria, Zhili, the north (Shanxi, Shaanxi,
Gansu, Shandong), the Yangzi delta (Jiangsu and Zhejiang), the ‘middle’ and the
south (see Table 1 for the other regions); Canton was also distinguished.
17 A few additional governmental wage data from Suzhou zizhao ju zhi (Treatise on the Suzhou weaving offices)
for 1686, included in Peng, Zhongguo jindai shougongye, pp. 90-92 were also consulted, as well as wage data
from Da Qing huidian shili, chap. 952, fol. 4b-5a, pp. 16640-16641. The complete wage dataset used in this
study can be found (in excel format) at http://www.iisg.nl/hpw/data.php#china.
18 Another problem was how to convert monthly and annual wages into daily wages; a few observations of both
daily and monthly or annual wages suggests conversion factors of about 15 (days/month) and 60 (days/year).
The next step was to use these conversion factors and estimate dummies for monthly and annual wages in the
wage regression. The dummies became close to zero when somewhat different conversion factors were used,
namely 13 and 90. We used these conversion factors in the estimation of wage levels in the wage regressions
shown in table 1; therefore, the dummies for monthly and annual wages have not been included.
12
• Branches: agriculture, coal mining, iron industry, construction, textiles, and other
industries;
• a time-trend with 1700 as the base year;
• Skill: a dummy for skilled labour was used; unskilled labourers were all
agricultural workers, the unskilled labourers in construction and the ‘helpers’ in
other industries;
• Regulation: data drawn from the two government documents Wuliao jiazhi zeli
(1769) and Gongbu junqi zeli (1813) were identified by a dummy for ‘regulation’.
We also include a few additional government regulation data from Suzhou zizhao
ju zhi (1686) and Da Qing huidian shili (for 1723 and 1736) (see footnote 17 for
references).
The total number of observations was 327, relatively equally spread over the different
regions and branches. There are only four observations for the late seventeenth century. Most
observations cluster between the 1740s and the 1810s; no observations after 1820 were
included.
Insert Table 2 here
Table 2 presents the results of the wage regression. All independent variables except
the time trend are dummies for regions, branches etc.; the standard for comparison is the
market wage of a construction labourer in the Yangzi delta in 1700. The constant in the
equation is his wage, which is estimated as 0.0456 taels. The regional pattern mirrors the
results from the analysis of the Wuliao jiazhi zeli: wages in Manchuria and Zhili were (much)
higher than in the rest of the country, whereas the differences between the Yangzi delta and
the rest of the rice region were very small. Most industry dummies were insignificant.

13
Finally, the dummy for skill premium is significant; its level in regression is 63% of the wage
of an unskilled labourer in the Yangzi delta.
To get a perspective on our wage regression, we plotted in figure 1 the wage rates of
Suzhou and Canton against the predicted wages from our regression. Figure 1 shows that
the baseline predicted wages, set as the constant plus the time trend in the wage regression
(the rate equivalent to that of an unskilled labourer in the Yangzi delta), is about half the level
of Suzhou and Canton wages. While VOC and calenderers’ wages were rising gently, wages
in China in general were declining slowly, as indicated by the wage equation. This difference
in trend is not significant for our purpose. Figure 1 also plots the predicted wages of Beijing
which uses the dummy coefficients for Zhili from the wage regression.
Insert Figure 1 here
These results make sense: large cities in Europe, the counterparts of Canton, Suzhou
and Beijing, had higher wages than small towns and rural districts in part because the cost of
living was higher in the large cities and also because they had to recruit population from the
countryside. This conjecture is in agreement with Pomeranz’s description of the earnings of a
Yangzi delta farm worker employed by the year in the mid-eighteenth century. Pomeranz
reckoned that the cash component of these earnings was two to five taels, and that the food
allowance over a full year was perhaps five shi of rice worth 8.4 taels, so the total earnings
over the year were 10.4 to 13.4 taels. Dividing by 360 implies daily earnings of 0.035 to
0.045 taels per day, very close to the baseline wage level from our regression result.19
19 Pomeranz, Great Divergence, pp. 319-320. The average of agriculture wages on daily contracts collected in
our sample was 0.045 taels. Wages on daily contract were likely to be higher as usually day labourers were more
often employed during the planting and harvest seasons. It is unclear whether additional food was provided. A
national level survey conducted by Chen Zhengmo in the 1930s, Gesheng nonggong, reveals the existence of
both types of payment arrangements for daily wages, either with or without food payment, the latter being higher.

14
As the wage regression contains some wage data that might include additional food
allowances, we have experimented with alternative regressions by adding 0.024 taels –
roughly the cost of one kilogram of rice in Canton or millet in Beijing in the middle of the
eighteenth century – to the daily earnings of those workers earning less than 6 taels per year
(0.5 taels per month). The alternative regression leads to little changes of significance to the
coefficients of most significance for this study.
The level of our base line wage in Figure 1 matches the empire-wide averages in the
Wuliao jiazhi zeli and Gongbu junqi zeli in the official regulation data. This leads us to
believe that the government regulation wages may have been set as a wage floor for the
market wages, which the government used for purpose of cost-accounting. Both these
sources also reveal higher wage levels for the capital region than the national average, which
may be a reflection of possible governmental discrimination. If carefully interpreted, the
regulated wage is more useful as a benchmark for a national wage floor than as an indication
of regional wage patterns. For the subsequent analysis, the wage level for Beijing and
Canton was set in 1700, based on the predicted values in the regression of 0.0897 and 0.0835
taels respectively, equal to the constant coefficients plus dummy coefficients for Zhili and
Canton respectively. For Suzhou, 0.09 taels for 1700 were used, very close to the 0.0968
taels for the calenderers’ wages. The national trend level was used for all these three series
But in cases where there was food payment, the portion amounted to about 33 per cent of the total cash wage,
much less than for the eighteenth and nineteenth century agricultural wages on annual contracts (Chen, Gesheng
nonggong, p. 9). Li, Agricultural development, p. 94, also seems to indicate that seventeenth-century nominal
wage levels may not be far apart from those of the eighteenth to nineteenth century. He discusses wage levels in
agriculture and silk production in the Yangzi delta, and estimates the average wage in rice cultivation at 0.06
taels per day, adding ‘the official standard was 0.04 taels a day which is a bit low compared to the wages in
some farms in Huzhou, Zhejiang province’.

15
in the international comparison. Clearly, we view our wage series is more reliable as
indications of long-term trend than short-term fluctuations.
Somewhat contrary to the claims of Lower Yangzi as having the highest living
standards, our dataset collected at this stage do not reveal a higher nominal wage for unskilled
laborers in that region. While the implications of possible regional wage difference will be
discussed later (in particular, see footnote 47), the rest of this study focuses on cross-national
comparison of average wage income for the unskilled labourers between China and Europe.
On the assumption that these wages are complete payments for unskilled labourers in the
three major urban centers, they represent, in most likelihood, the upper bound estimates of
our larger dataset. Thus, if the average level turns out to be lower than our nominal wages,
then actual Chinese living standards would be even lower.
II. Wage levels in nineteenth- and twentieth-century China
Jumping forward in time, the best available information on wages in Beijing, Canton,
and Shanghai is for the early twentieth century. Our wage series for Beijing is anchored on
the work of Sidney Gamble (1890-1968). Gamble was an American sociologist who lived in
China in the 1920s and 1930s. He conducted a survey of workers in Beijing in 1921. This
provided the weights for a consumer price index for Chinese capital for 1900-1924, and that
index, in turn, was used in a study of real wages for the period. Gamble and his associates
also recorded wage series for unskilled construction workers in Beijing for 1862-1925 using
the records of the Beijing guilds for construction workers. This is our source for unskilled
wages in the capital.20
20 This series is composed of two parts. The first part is the 1870-1900 copper cash wages (inclusive of food

16
Gamble carried out another important study based on the account books of a fuel store
in the rural area of Beijing. The information runs from 1807 to 1902 and is possibly the only
consistent wage series for nineteenth-century China. The nineteenth-century wage payments
were recorded in copper cash and were broken around the mid-nineteenth century due to the
monetary debasement in the period of the Taiping rebellion. Gamble does provide vital
information on copper-silver rates in that area from which we derive a silver-based wage
series for 1807-1902 as shown in Appendix I B. The level of the wage rates seems very low
and is difficult to interpret in its own right as Gamble indicated that workers received
unrecorded food allowances.21
Information on Cantonese wages is less comprehensive than that for Beijing. As noted
above, estimates of wages in the eighteenth century have been derived mainly from VOC
records and summarized in the wage regression. For the early twentieth century, simple
average of six series of union-regulated show wage rates for unskilled labourers in the
construction sector from 1912 to 1927.
We apply the trend (not the levels) of these silver wages to fill
in the 1820-1862 gap for the light it throws on the Taiping Rebellion and its aftermath.
22
Similarly, no systematic wage series for Suzhou in the nineteenth century was
available. From the middle of the nineteenth century, Shanghai was emerging as China’s
predominant trading and industrial city under the treaty port system imposed by Western
For the nineteenth century, various plausible wage
data exist, but were not included in the analysis as they were incomplete and scattered.
money) in Gamble (1943, p. 66), converted to silver wages using copper-silver rates from Peng (p. 548). The
second series is the 1900-1924 series by Meng and Gamble ‘Wages, prices, and the standard of living’ (p. 100).
21 Gamble, ‘Daily wages’, p. 4.
22 Department of Peasantry and Labour, Kwangtung Government, Reports of Statistics, vol. 3, ‘The wage
indexes of labourers in Canton’. Our wage series is the simple average of five types of unskilled labourers in the
construction sector.

17
imperialism. Setting out from wage notations for female cotton spinners in Shanghai between
1910 and 1934, we have calculated the wage levels of male unskilled labourers based on a
wage survey of the 1930s.23
III. Wage patterns in Europe and China
Adam Smith thought that the ‘money price of labour’ was higher in Europe than in
China. To test that, Chinese and European wages must be compared. Building on our earlier
studies of European daily wage rates earned by labourers in the building industry,24
Figures 2 and 3 graph the daily wage rates of unskilled workers in London,
Amsterdam, Leipzig, Milan, Beijing, and Kyoto/Tokyo from the eighteenth century to the
twentieth. Figure 2 shows the series from 1738 to 1870. For this period, Adam Smith was half
right. Wages were, indeed, highest in London and lowest in Beijing, but the other series show
that the world was more complex than Smith thought. The silver wage in Milan or Leipzig
was not appreciably higher than the wage in Beijing, Canton or Suzhou throughout the
we have
been careful to exclude wage quotations where the earnings included food or other payment
in kind that could not be valued and added to the money wage. As with China, we have
converted the European wages to grams of silver per day by using the market price (in units
of account) at which silver coins of known weight and fineness could be purchased.
23 We make use of the series by Rawski, Economic growth, p. 301, and The Bureau of Social Affairs, Cost of
living, pp iii-iv. According to Yang, ‘Shanghai gongren shenghuo’, p. 250, female workers in 1927-28 were paid
about 80 per cent of the level of male workers.
24 Van Zanden, ‘Wages and the standard of living’; Allen, ‘Great divergence in European wages’.

18
eighteenth century.25
Figures 2 and 3 here
The statistics of other European and Chinese cities show that this
similarity was general.
Amsterdam occupies a peculiar position in Figure 2. Nominal wages there were
remarkably constant for a century and a half. At the outset the Amsterdam wage was similar
to the London wage. The same was true of Antwerp. Indeed, the Low Countries and the
London region stand out from the rest of Europe for their high wages in the seventeenth and
eighteenth centuries. These high wages were probably due to the active involvement of these
regions in inter-continental commerce.
But this pattern changed as the nineteenth century advanced. The Industrial
Revolution raised British wages above Dutch levels. Indeed, the early industrialization of
Germany is seen in Figure 2 as a rise in the Leipzig wage.
These developments intensified after 1870 as shown in Figure 3. British wages
continued to increase. By the First World War, German wages had caught up with the British
level, and Dutch wages closed the gap as well. Italian wages were also growing, but the
increase was muted compared to the industrial core of Europe. Outside Europe, Japanese
wages before 1870 stayed largely flat, in keeping with the low Italian level. After 1890,
Japanese wages, spurred by the industrialization drive in the Meiji era, began to rise but
continued to stay substantially below the rising trend of early twentieth-century European
wages.
25 As indicated earlier in section I and in figure 1, the silver wages we used for Beijing, Canton and
Suzhou/Shanghai are broadly equal. For reasons of easy visibility, we only plot the silver wage for Beijing series
on figures 2 and 3. Complete price and wage series for figures 2 through 6 can be downloaded from the websites
at http://www.iisg.nl/hpw/data.php and http://gpih.ucdavis.edu/Datafilelist.htm.

19
Chinese wages, in contrast, changed little over the entire period. There was some
increase in the silver wage after 1870, but Figure 3 emphasizes that the gain was of little
importance from a global perspective. By the First World War, nominal wages in China were
very much lower than wages in Europe generally. Taken at face value, Adam Smith’s
generalization about Chinese and European wages was more accurate at the time of the First
World War than when he penned it in 1776.
IV. Price indices
What of Adam Smith’s second generalization? He remarked that ‘the difference
between the price of subsistence in China and in Europe is very great’.26
The index number problem is a difficult one since diet and life style were radically
different in different parts of Eurasia. How precisely does the real income of an English
worker who consumed beef, bread, and beer compare to that of a Chinese labourer who ate
rice and fish?
This generalization
can be tested by computing price indices. We have tried many formulae and sets of weights,
and the reassuring result is that our conclusions about relative real wages do not depend in
any important way on the choice of price index.
The approach considered in this section takes Adam Smith’s comment as its point of
departure. His generalization about price levels is expressed in terms of the ‘price of
subsistence’. We operationalize that by defining consumption baskets that represent the
‘bare bones’ minimum for survival (see Tables 2-3). The baskets provide 1940 calories per
day mainly from the cheapest available carbohydrate. In Shanghai, Canton, Japan, and
26 Smith, Wealth of nations, p. 189.
20
Bengal that was rice, in Beijing, it was sorghum, in Milan it was polenta, and in north-western
Europe it was oats. The diet includes some beans and small quantities of meat or fish and
butter or oil. Their quantities were suggested by Japanese consumption surveys of the 1920s
and by the Chinese rural consumption survey in the 1930s carried out by the National
Agricultural Research Bureau (NARB).27
Insert Tables 3-4 here
Despite relying on the cheapest carbohydrates,
these baskets provide at least the recommended daily intake of protein, although the amount
varies from basket to basket. Polenta (closely followed by rice) is the least nutritious source
of calories in this regard. Non fuel items include some cloth and fuel. The magnitudes of
the non-food items were also suggested by the Japanese and Chinese consumption surveys of
the inter war period. It would have been hard for a man to survive on less than the cost of
one of these baskets.
Having specified the consumption ‘baskets’ in Tables 3-4, time series of the prices of
the items shown are necessary, so that the cost of the baskets can be calculated across the
eighteenth, nineteenth, and twentieth centuries. For Europe, the prices described in Allen,
‘Great divergence’ can be applied.28
27 Department of Crop Reporting, ‘Crop reports’, VI, 10, pp. 115-117. Rōdō undō shiryō iinkai (1959), p. 568.
Alternative baskets constructed based these surveys can also be found in our earlier working paper Allen et al,
‘Wages, Prices, and Living Standards’.
New data bases were compiled for the Chinese cities
under observation. For Beijing, we extended Gamble’s retail prices for 1900-1924 back to
1738. Food prices were extended using wholesale agricultural prices for Zhili province
compiled by Lillian Li (2000). The implicit assumption in these extrapolations was that the
ratio of retail to wholesale prices remained constant. The details and the procedures for
28 The data are available on-line at http://www.nuffield.ox.ac.uk.

21
cloth and fuel are explained in Appendix II. For Shanghai and Canton, twentieth century
retail prices were extracted from official sources.29 For the eighteenth century, Yeh-Chien
Wang’s Yangzi delta rice price series was used for Suzhou and Chun-sheng Chen’s series for
Guangdong. These are probably wholesale rather than retail prices. No allowance was
made for retail mark-ups–a procedure which is again biased against our conclusions, for if
rice prices in China were higher then living standards would have been even lower. The
prices of other foods and fuel were taken from the costs incurred by European trading
companies in provisioning their ships in Canton. These prices have been compared to the
estimated prices for Beijing, and the agreement is close. For most of the eighteenth century,
competition was intense in supplying these ships.30
The cost of the basket is Adam Smith’s ‘money price of subsistence’ and its history is
plotted in Figure 4 for leading cities in China and Europe in the eighteenth and nineteenth
centuries. The findings would have surprised Smith, for it contradicts his claim that China had
cheaper subsistence than Europe. The silver cost of a bare bones basket in Beijing or
Suzhou was in the middle of the European range. A corollary is that the silver prices of
grains, which dominate the cost of these indices, were similar across Eurasia. Another
casualty of Figure 4 is Smith’s generalization that ‘rice in China is much cheaper than wheat
is anywhere in Europe’.
31
29 The Canton data is based on The reports of statistics compiled by the Department of Peasantry and Labour,
Kwangtung Government in 1928; it covers the period of 1911 to 1927. The Shanghai price is from Bureau of
Social Affairs, The City Government of Greater Shanghai, The cost of living index numbers of labourers,
greater Shanghai (January 1926 - December 1931, 1932).
30 see Van Dyke, Canton trade.
31 Smith, Wealth of nations, p. 189.

22
Another feature of Figure 4 is worth highlighting. The figure shows very little
difference between the two consumer price indices for both Beijing and Suzhou/Shanghai (or
Canton not shown in the figure) for the eighteenth century. These two cities represent the
two agrarian halves of China – the northern small grain region and the southern rice region.
However, from beginning of the eighteenth century, rice prices began a secular rise over those
of sorghum, which led to a somewhat more expensive basket for the unskilled labourers in the
South than in the North. While the implication of this finding needs further research, this
difference matters little for our purpose of international comparison. Overall, as seen in
Figure 4, price gaps between Europe and China really opened up from about the
mid-nineteenth century.
Insert Figure 4 here
V. A look at other index numbers
Before considering the implications of the cost of the baskets for comparative living
standards, the results of indexing prices in other ways can be briefly summarized.
In modern theory, the index number problem unfolds like this: Suppose an individual
or family receives a particular income and faces particular prices. The income and prices
determine the maximum level of utility (highest indifference curve) that the individual can
reach. Now suppose that prices change. What proportional change in income would allow the
individual to reach the original indifference curve in the new price situation? The price index
is supposed to answer that question. Comparing the actual change in income to the index
shows whether consumer welfare has risen or fallen.
23
There are no insuperable difficulties in applying the theory to real income changes
over time in either Europe or Asia, provided full information about wages, consumer prices,
and spending patterns is available. Yet how can living standards between Europe and Asia be
compared? The pattern of goods – particularly foods – consumed in the two regions was
radically different. The standard theory of consumer welfare assumes that all of the goods are
available in both regions and that there is a ‘representative agent’ who would voluntarily
choose to consume rice, fish, and sake when confronted with Asian prices and bread, beef,
and beer when confronted with English prices. In fact, all goods were not available
everywhere, and, moreover, it is unlikely that there were people flexible enough to voluntarily
shift their consumption between the European and the Asian patterns in response to the
difference in prices. This is the reason why we approached the problem in terms of Adam
Smith’s ‘cost of subsistence’. By building on the results of these calculations, the outcome of
a more orthodox approach can be approximated. During the comparative process, the
associated data problems come sharply into focus. We concentrate on a comparison of
Beijing and London because the Beijing diet was based on small grains that were more
comparable than rice to English grains.
We first approach the question from the point of view of a Beijing resident and ask
how much it would have cost to live the ‘bare bones’ Beijing lifestyle in London. This is the
pertinent question, for the typical labourer could not afford to buy anything more. The
difficulty is that we cannot cost out the Beijing basket in London, for sorghum was not sold in
London. However, oats was the counterpart of sorghum in Britain–it was the least cost,
most inferior grain–and if we take oats and sorghum to be equivalent, we realize that we have
already answered the question by comparing the cost of the bare bones baskets.

24
We can also ask how much the London lifestyle would have cost in Beijing. That
lifestyle is specified by ‘respectable’ consumption basket in Table 5, which summarizes the
spending in north-western Europe.32
Insert Table 5 here
The diet is late medieval in inspiration in that it does not
contain new commodities like sugar and potatoes introduced into Europe after the voyages of
discovery.
The basket in Table 5 contains important items for which we lack prices in China.
Bread is the most important, and we estimated what bread would have sold for, had it been
produced commercially, from Allen’s ‘bread equation’.33 This is a statistical relationship
between bread prices, wheat prices, and wage rates prevailing in many cities in Europe.
Since we have time series of wages and wheat prices for Zhili province, which includes
Beijing, the price at which bread would have been supplied had it been produced in the
European manner can be calculated. Likewise, the price of beer is unknown. For it, we
substituted the quantity of rice wine (sake) that contained the same quantity of alcohol.34
The European and Beijing baskets define Paasche and Laspeyres price indices. The
final step in comparing the cost of living in London and Beijing is to compute the geometric
average of the two, which is a Fisher Ideal Price index. This is a ‘superlative’ price index,
We estimated the price of rice wine using the Japanese relationship between the retail price of
sake and the wholesale price of rice. In this way we proxied the missing prices needed to cost
out a European basket in Beijing.
32 Allen, ‘Great divergence in European wages’.
33 Allen, ‘Great divergence in European wages’, p. 418.
34 182 litres of beer at 4.5% alcohol contain as much as alcohol as 41 litres of sake at 20%.
25
which corresponds to a generalized Leontief expenditure function.35
How does the Fisher Ideal Price index compare to the bare bones indices? In fact,
they are very similar. The relative cost of the European basket in London and Beijing was
always close to the relative cost of the bare bones baskets which are equal to ratios of 1.12
and 1.17 respectively in Table 5. Hence, their geometric average is also similar.
Consequently, a superlative index number, in this case, gives the same result as a comparison
of Smith’s ‘cost of subsistence’. Since the latter has so many intuitive interpretations, we
use it as the axis of our discussion with the confidence that it is not misleading us when the
index number problem is considered from other perspectives.
That representation of
consumer preferences has the property that indifference curves are tangent to prices at both
consumption patterns. In other words, the representative consumer whose behaviour is
summarized by the price index would shift from an English to a Chinese spending pattern as
prices shifted from the London to the Chinese configuration. Using this index number
imposes the assumptions of modern theory on the reality of eighteenth century behaviour –
certainly a debatable procedure.
VI. Comparison of living standards
The purchasing power of wages is usually measured by the ratio of the wage to the
consumer price index. Our procedure elaborates that approach. In constructing the consumer
price index, a notional budget was specified that represented the least cost way to survive.
35 Diewert, ‘Exact and superlative index numbers’, pp. 115-45. The use of alternative consumption baskets for
Canton and Japan based on comparable calories and proteins contents also confirm the findings here, see Allen
et al ‘Wages, Prices, and Living Standards’.

26
(Tables 3 and 4, however, do not include housing costs, so we increase them now by 5%,
which is a minimal allowance for rent.) The budget was an annual budget for an adult male.
If the man supported a family, the expenditures would have been higher, so that the cost of
the budget (augmented 5% for rent) was multiplied by three to represent the annual budget of
a family. This increase is roughly in line with the calorie norms for a man, a woman, and two
young children.36
Our real wage index has a particular interpretation since it answers a specific question,
namely, whether a man working full time could support a family at the ‘bare bones’ level of
consumption. Real wage indices of this sort are called ‘welfare ratios’. When the welfare ratio
equalled one, an unskilled labourer working full time could earn just enough to support his
family at subsistence income. Higher values indicate some surplus, while values below one
mean either that the family size had to be reduced or work effort had to be increased since
there was little scope for reducing expenditure.
On the income side, our income measure is the annual earnings that a
worker could have gained if he worked full time for a year. We assume that one year’s work
consisted of 250 days – roughly full time work allowing for holidays, illness, and slack
periods. The earnings from full time work provide a useful benchmark for comparing Europe
and Asia and for defining the economic strategies of families. The ratio of estimated full time
earnings to the annual cost of the family budget is a real wage index.
Figure 5 shows welfare ratios for unskilled male workers from 1738 to 1923 in the
European cities we discussed and the Yangzi delta cities. Several features stand out:
Insert Figure 5 here
36 Precisely, two children aged 1-3 and 4-6 respectively. For a discussion of food requirements for a notional
family of four, see Allen, ‘Great divergence in European wages’, p. 426.

27
1) The Yangzi delta is reputed to have the most advanced economy of any Chinese
province, but the real wage there was not noticeably higher than the real wage in Beijing or
Canton, as we will see.
2) The Chinese cities were in a tie for last place with the Italian cities, which had the
lowest standard of living in Europe, so an optimistic assessment of China’s performance is
difficult.
3) The existing information about Beijing wages in the nineteenth century indicates
that the real wage continued to slide until the Taiping Rebellion in mid-century when it
reached a life-threateningly low level. After authority was restored, living standards
improved slowly into the early twentieth century.
4) The most striking feature of Figure 5 is the great lead in living standards enjoyed by
workers in the rapidly growing parts of western Europe. The standard of living of workers in
London was always much higher than that of workers in Beijing or the Yangzi delta. After the
middle of the nineteenth century, London living standards began an upward trajectory and
increased the lead over China. While workers in Amsterdam in the eighteenth century also
lived better than their counterparts in Beijing, the Dutch economy faltered in the early
nineteenth century. 37
37 Van Zanden and van Riel, The strictures, pp. 121ff, pp. 188ff.
By mid-century, however, growth resumed and real wages were
climbing to new heights. At the same time, the rapid growth of the German economy was
translating into rising real wages for workers in Leipzig. By the First World War, the standard
of living of workers in the industrial core of western Europe had greatly increased over their
counterparts in Beijing and Suzhou. The standard of living in China remained low and on a
par with the regions of Europe untouched by the Industrial Revolution.

28
5) The workers in north-western Europe with welfare ratios of four or more did not eat
four times as much oatmeal as their ‘bare bones’ diet presupposes. Instead, they ate higher
quality food – beef, beer, and bread – that was a more expensive source of calories. In
addition, they bought a wide range of non-food items. In the eighteenth century, these
included the Asian imports and novel manufactures that comprised the ‘consumer revolution’
of that era. By the same token, the workers in north-western Europe could afford the
basket of goods shown in Table 5, while workers in Asia could not and had to subsist on the
‘bare bones’ baskets. After all, in regions of settled agriculture, the least expensive way to
get calories is to boil the cheapest grain into a gruel or porridge. In northern Britain, the
poorest people ate oat porridge; in the Yangzi delta, they ate wheat gruel.38
Insert Figure 6 here
Figure 6 tests the generality of these conclusions by including all of the Asian welfare
ratios for comparison. There was variation in experience, but that variety does not qualify the
conclusion that Asian living standards were at the low end of the European range. The history
of living standards in Japan, India, and Canton was very similar to Beijing’s or Suzhou’s.
Real wages in Istanbul as shown in Özmucur and Pamuk were at a level as low as China’s, so
it may have characterized much of the non-industrializing world in the eighteenth century.39
38 Li, Agricultural development, p. 207, fn. 25.
There is evidence of rising living standards across Asia after 1870, but the gains were not
enough to catch up to the standard of mid-eighteenth century London or Amsterdam let alone
the much higher standard of living enjoyed by workers in those cities in the early twentieth
century.
39 Özmucur and Pamuk, ‘Real wages and standards of living’.
29
Figure 6 broadens our comparison by inserting the welfare ratio of Oxford with the
view that London may be exceptional in terms of real wages among English towns. Indeed,
real wages in Oxford were always lower than in London, although the gap narrowed from the
late eighteenth century.40
A more important question is how representative wages are of labour incomes in
China in general. Our knowledge of labour market conditions and the extent of regional
migration seem to substantiate the view that wage rates may serve as a reasonable proxy for
the average earnings of a particular socio-economic group as well as the marginal
productivity of labour in the economy as a whole. The existence of a vibrant and active
labour market particularly for short-term or day labour in early modern China (and Japan) is
well documented, although the precise proportion for the early modern era remains elusive.
Nonetheless, at a welfare ratio between 2.5 and 3.0 during the
eighteenth century, Oxford still seemed far more prosperous than Beijing. London (capital
and major port) and other big cities were chosen because they are comparable to Beijing
(capital) and Canton (major port), which are likely to be at the top of the wage scale in their
country or region. Oxford, meanwhile, ranked much lower on the urban hierarchies
compared with the cities in our study. Thus, the inclusion of Oxford as a robustness check
assured us that our finding is not driven by the relative position of London.
41
40 For welfare ratios in Oxford and other towns in England, see Allen, ‘Great divergence in European wages’,
pp. 415-6.
For the early twentieth century which bore much of the institutional and economic
continuities of the eighteenth and nineteenth centuries, large scale household surveys reveal,
41 The literature on the prevalence of labour employment and contracts in Ming and Qing China is voluminous.
Examples of this literature can be seen in Pomeranz, Great divergence, pp. 81-82, and Huang, The peasant
economy, pp. 62-62. Wei, Ming-Qing, documents in detail the improved legal status of labourers towards the
eighteenth century.

30
for example, that between 30 and 50 per cent of rural households in the 1930s Wuxi county in
the Yangzi delta region hired day labourers during peak season whereas the long-term labour
market was extremely thin. Furthermore, those households whose main income derived
from farm labour fetched an average income 20 per cent below the mean per capita income of
all the Wuxi households. This income distance of 20 per cent from the mean shows that
agricultural day labourers were at the lower end – but not a marginal fringe – of the income
ladder.42
Secondly, at least for the commercialized regions near the major urban centres,
evidence of a relatively high degree of integration of labour markets between urban and rural
areas can be perceived. As noted earlier, calenderers in Suzhou largely consisted of migrant
workers from the relatively impoverished rural Northern Jiangsu. Similarly for the Beijing
wage series, Gamble’s detailed study reminds us of the close linkage between urban and rural
wages in the nineteenth century. Indeed, if labour market and regional labour migration in
eighteenth century China were as flexible as claimed by the revisionists,
43
42 For information on labour market in North China and the Yangzi delta, see Huang, The peasant economy, p.
110. The Wuxi survey summary can be found in Kung, Lee and Bai, ‘Human capital’, Tables 1 and 2. For a
nationwide survey of labour market in the 1930s, see Chen, Gesheng. Similar labour market and income
distribution can also be found in Tokugawa Japan. Bassino, Ma and Saito, ‘Levels of real wages’ calculates that
the welfare ratios of the wage earnings of farm labourers were roughly equivalent to those of tenant cultivators
who, in turn, were about 20 per cent below those of the median class.
there is all the
more reason to believe that the wage rates for unskilled labourers we measure are
43 For linkage between urban and rural wages, see Gamble, ‘Daily wages’, p. 67. See Pomeranz, Great
divergence, chapter 2 for an argument on the flexibility of product and factor markets and labour migration in
early modern China.

31
representative of labour earnings for a substantial part of the population at the relatively low
end of income distribution.
Our notional wage income can be directly compared with the labour income data cited
by Pomeranz and Li when they in fact argue the reverse case, namely, that labouring people
in the Yangzi delta had a high standard of living. Pomeranz, for instance, estimates that a
male agricultural labourer employed full time over the course of a year would have realized
about 12 taels. Using average prices for 1745-54, the ‘bare bones’ cost of maintaining a
family was 22.59 taels, so the labourer was only earning 53 per cent of subsistence; in other
words, the welfare ratio was 0.53. He could barely support himself, let alone a wife and
children. A woman spinning and weaving cotton for 200 days per year, which Li and
Pomeranz both reckon was about the maximum possible, could earn 14.61 taels, a bit more
than a man.44
So far, this comparison focused on the wage income of unskilled labourers. However,
the wage regression and the twentieth-century wages summarized by Gamble for Beijing all
indicate that the ratio of skilled to unskilled wages was about the same in China as in
north-western Europe. While future research is needed, this evidence suggests that our
Again, this was less than the cost of maintaining a family. Husband and
wife together, however, would have earned 26.61 taels, which was 1.18 times the cost of
maintaining a family. A family could survive on that, so long as nothing went wrong, but
the standard of living was far behind that in London or Amsterdam where the labourers
earned four times the cost of a bare bones standard of living in the middle of the eighteenth
century.
44 Li, Agricultural development, pp. 149, 152. Pomeranz, Great divergence, pp. 318-9, offers two calculations
pointing to slightly lower earnings. Li’s calculation assumes the woman received 0.19 shi per bolt of cloth;
Pomeranz’s is slightly higher. They do not use precisely the same prices. We use average values for 1745-54.
32
conclusions about comparative living standards could still hold true if the comparison was
broadened to include all kinds of wage earners.45
VII. Conclusion
Our investigation of Asian and European wages and prices shows that the situation
differed somewhat from Adam Smith’s impressions. Money wages were in accord with his
view: In China, they were certainly lower than wages in the advanced parts of western Europe
in the eighteenth century and similar to those in the lagging parts of Europe. By the twentieth
century, however, wages in all parts of Europe were higher than in China. Contrary to Smith,
the cost of living was similar in China and in Europe.
The upshot of the wage and price comparisons is that living standards were low in
China. In the eighteenth century, advanced cities like London and Amsterdam had a higher
standard of living than Suzhou, Beijing or Canton. The standard of living in the Chinese cities
we have studied was on a par with the lagging parts of Europe, the Ottoman Empire, India,
and Japan. By the twentieth century, enough progress had occurred in even the backward
parts of Europe that their standards of living were beginning to creep above those in China.
Wages seemed to have slipped in China in the eighteenth century. Still, most of the
difference between Europe and China in 1913 was due to European advance rather than
Chinese decline.
In spite of the above, a major surprise is our finding that unskilled labourers in major
cities of China and Japan – poor as they were – had roughly the same standard of living as
their counterparts in central and southern Europe for the larger part of the eighteenth century.
45 Van Zanden, ‘The skill premium and the great divergence’.

33
This calls into question the fundamental tenet of the large ‘rise of the west’ literature that sees
western Europe – as a whole – surpassing the rest of the world in the early modern era. Our
paper suggests that it was only England and the Low Countries that pulled ahead of the rest.
The rest, in this context, includes not only Asia but also much of Europe.46
In this regard, Adam Smith neglected regional variation and, thereby,
over-generalized the comparison of Europe and China. But our findings also dispute the
revisionists’ claim that the advanced parts of China such as the Yangzi delta were on a par
with England on the eve of the Industrial Revolution, for we find real wages for unskilled
labourers in the Yangzi delta to have been no higher than those in Beijing or Canton. Clearly,
our database on China could be greatly improved and we do not claim to have given the final
answer to this question. But newly discovered data would have to be very different from what
is currently at hand to convince us that pre-industrial Chinese living standards were similar to
those in the leading regions of Europe.
47
46 For a coverage of welfare ratios of unskilled workers across 16 major urban centers of continental Europe in
the early modern period, see Allen, ‘Great divergence in European wages’.
In this regard, Adam Smith’s pessimism looks
47 For the argument of a higher living standards in the Yangzi delta, see Pomeranz, Great divergence, and Li,
Agricultural development. Philip Huang’s comparative regional study also makes a strong case that the Yangzi
delta overall have higher productivity levels and income than north China, see The peasant family. Our findings
of roughly comparable nominal and real wage levels in the three major Chinese urban centres do not necessarily
preclude the possibility that broader measures of per capita income and living standards could still be higher in
the Yangzi delta. A recent study by Ma ‘Economic growth’ shows that the per capita income of the two
provinces in the Yangzi delta in the 1930s were 55 per cent higher than the Chinese national average. There is
good reason to believe the regional income gap in China in the 1930s would be larger than in the eighteenth
century. While future empirical research is needed to construct a comprehensive regional wage profile for
eighteenth- and nineteenth-century China, the magnitude of regional variation within China as discussed in these

34
closer to the truth than the revisionists’ optimism. Of course, establishing the case of an
income gap between north-western Europe and China in the early modern era only takes us
halfway towards the resolution of the great divergence debate. The search for a causal
explanation of the great divergence still looms large as a future research agenda.
Appendix I: Notes on the sources for Chinese wages, 1686–1902
A. Cotton calenderers’ wages
In the seventeenth to nineteenth centuries, the calenderers in Suzhou usually consisted of
migrant workers from impoverished regions in Northern Jiangsu or Anhui. They usually
worked under a contract system renting capital and working place from cotton cloth
merchants. Although not allowed to form their own guilds by the government, they often
went on strike for higher wages, hence the documentation of these negotiated wage rates in
the stele records.
Information on the daily productivity quoted in Xu Xinwu’s study can be applied for
converting the piece rates into daily wages. According to Xu, a calenderer could do one bolt
of cloth in about 40 minutes.48
other studies pales in comparison with the gaps in average real wages in urban centres between China and
England.
For a day with about 11 working hours, he could press about
12 bolts of cloths. For conversion, we use 11 bolts of cloth pressed per day to adjust it
48 Xu, Jiangnan tubu shi, p. 378.
35
roughly to a ten hour working day. However, the calenderers would have to hand in 20 per
cent as payment for rental and other expenses. Deducting the 20 per cent from the final wage,
we converted the piece wage of 0.0113 taels (in 1730) and 0.013 taels (in 1772 and 1795) per
bolt of cloth into 0.0994 and 0.1144 taels per day respectively. The daily productivity data
in Xu’s study are based on suburban Shanghai in the early twentieth century, but Xu
explicitly stated that both technology and organization changed little from the early modern
period.49
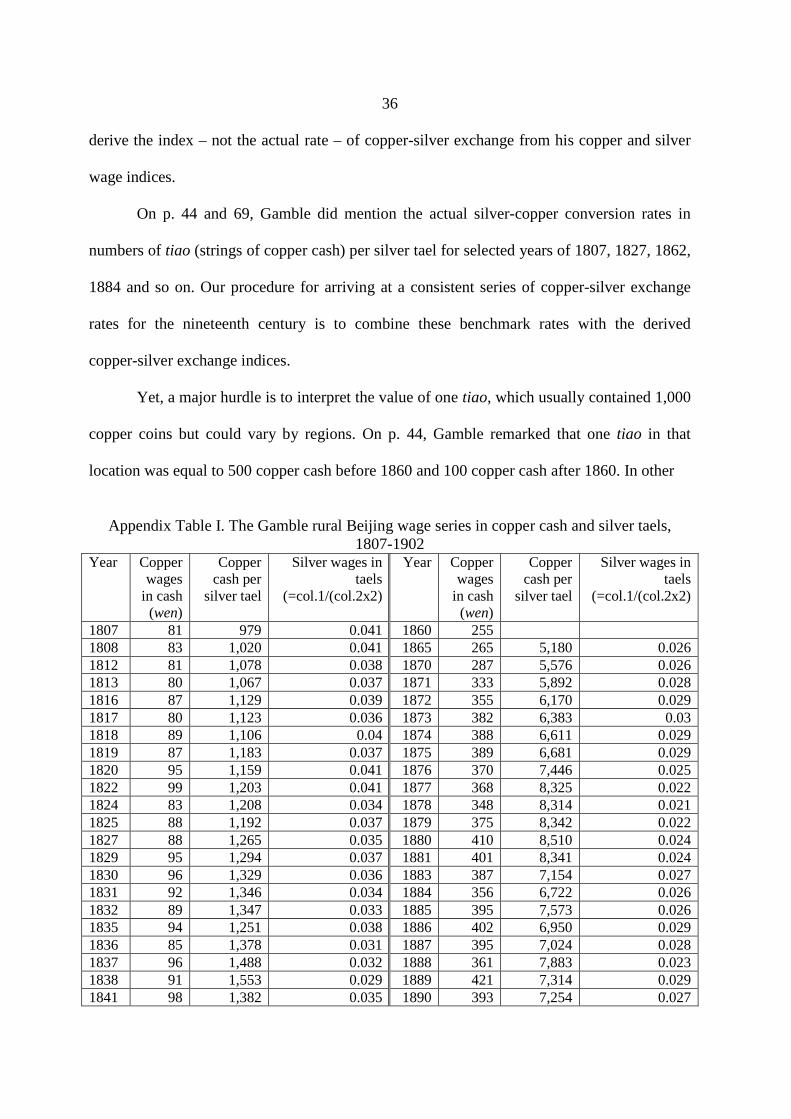
B. The nineteenth-century wage series by Gamble
The wage series in Gamble, ‘Daily wages’ which spans almost the entire nineteenth
century, was derived from detailed account books of a fuel store in rural Beijing. Gamble
presented three series of average wages for the months of May through August, April through
September and January through December respectively (p. 61). His careful study reveals the
highly seasonal nature in the annual wage patterns which corresponded with the agricultural
harvest season. We chose the annual average wage series (January through December) which
is the lowest of the three as it includes the rates for the winter slack period. This wage series
in copper cash is in the first column of the Appendix Table I below.
The original wage series are all quoted in copper cash. Since Gamble was mainly
interested in constructing wage indices, he presented nominal and copper wage indices in
Table 6 of his article without explicitly giving the copper-silver conversion rates. Moreover,
due to a major debasement around 1860 and a corresponding change of monetary account in
the fuel store account books, Gamble broke his silver and copper wage indices at 1860,
setting 1845 as a base 100 for the pre- and post-1860s respectively. Thus, it is possible to 49 Xu, Jiangnan tubu shi, p. 375.
36
derive the index – not the actual rate – of copper-silver exchange from his copper and silver
wage indices.
On p. 44 and 69, Gamble did mention the actual silver-copper conversion rates in
numbers of tiao (strings of copper cash) per silver tael for selected years of 1807, 1827, 1862,
1884 and so on. Our procedure for arriving at a consistent series of copper-silver exchange
rates for the nineteenth century is to combine these benchmark rates with the derived
copper-silver exchange indices.
Yet, a major hurdle is to interpret the value of one tiao, which usually contained 1,000
copper coins but could vary by regions. On p. 44, Gamble remarked that one tiao in that
location was equal to 500 copper cash before 1860 and 100 copper cash after 1860. In other
Appendix Table I. The Gamble rural Beijing wage series in copper cash and silver taels,
1807-1902 Year Copper
wages in cash
(wen)
Copper cash per
silver tael
Silver wages in taels
(=col.1/(col.2x2)
Year Copper wages
in cash (wen)
Copper cash per
silver tael
Silver wages in taels
(=col.1/(col.2x2)
1807 81 979 0.041 1860 255 1808 83 1,020 0.041 1865 265 5,180 0.026 1812 81 1,078 0.038 1870 287 5,576 0.026 1813 80 1,067 0.037 1871 333 5,892 0.028 1816 87 1,129 0.039 1872 355 6,170 0.029 1817 80 1,123 0.036 1873 382 6,383 0.03 1818 89 1,106 0.04 1874 388 6,611 0.029 1819 87 1,183 0.037 1875 389 6,681 0.029 1820 95 1,159 0.041 1876 370 7,446 0.025 1822 99 1,203 0.041 1877 368 8,325 0.022 1824 83 1,208 0.034 1878 348 8,314 0.021 1825 88 1,192 0.037 1879 375 8,342 0.022 1827 88 1,265 0.035 1880 410 8,510 0.024 1829 95 1,294 0.037 1881 401 8,341 0.024 1830 96 1,329 0.036 1883 387 7,154 0.027 1831 92 1,346 0.034 1884 356 6,722 0.026 1832 89 1,347 0.033 1885 395 7,573 0.026 1835 94 1,251 0.038 1886 402 6,950 0.029 1836 85 1,378 0.031 1887 395 7,024 0.028 1837 96 1,488 0.032 1888 361 7,883 0.023 1838 91 1,553 0.029 1889 421 7,314 0.029 1841 98 1,382 0.035 1890 393 7,254 0.027

37
1842 100 1,439 0.035 1891 390 7,627 0.026 1845 86 1,823 0.024 1892 372 7,651 0.024 1846 96 2,010 0.024 1893 410 7,212 0.028 1847 87 2,013 0.022 1894 443 6,722 0.033 1848 68 2,049 0.017 1896 448 6,501 0.034 1849 80 2,046 0.02 1900 422 5,312 0.04 1850 94 1,997 0.024 1901 462 5,758 0.04 1852 93 2,018 0.023 1902 470 6,079 0.039 1853 93 2,205 0.021 1854 90 2,723 0.017 1856 110 4,970 0.011 1857 105 3,935 0.013 1858 130 4,970 0.013
words, the copper cash before 1860 circulated in that locality was only half of the value of the
official cash. This seems to be corroborated by Yan Zhongping and associates’ study of prices
and exchange rates.50
Despite their footnote, Yan and associates derived their copper-silver series based on
the standard rate of one tiao equal to 1,000 cash. Our copper-silver exchange rate series in the
second column is similarly derived with the standard of one tiao equal to 1,000 cash. In order
to derive the accurate wage rate in silver tale, the third column of our Appendix is silver wage
converted from the first two volumes further divided by two. The wage rate thus derived
seems extraordinarily low. However, as indicated by Gamble on p. 41, workers were also
given additional food. As shown above, we use only the trend (not the level) for this study.
These authors derived the exchange rate series (1807-50) from the
account books of a merchant store located in Daliu zhen of Ningjin County in Hebei province,
about three hundred kilometres from Beijing. In a footnote to their exchange rate table (Table
31 on p. 38), the authors pointed out that the value of two copper cash was counted as one. A
comparison of the copper-silver exchange series of the Yan series and our implicit Gamble
series shows that their trends are nearly identical.
50 Yan Zhongping et al., Zhongguo jindai jingjishi.
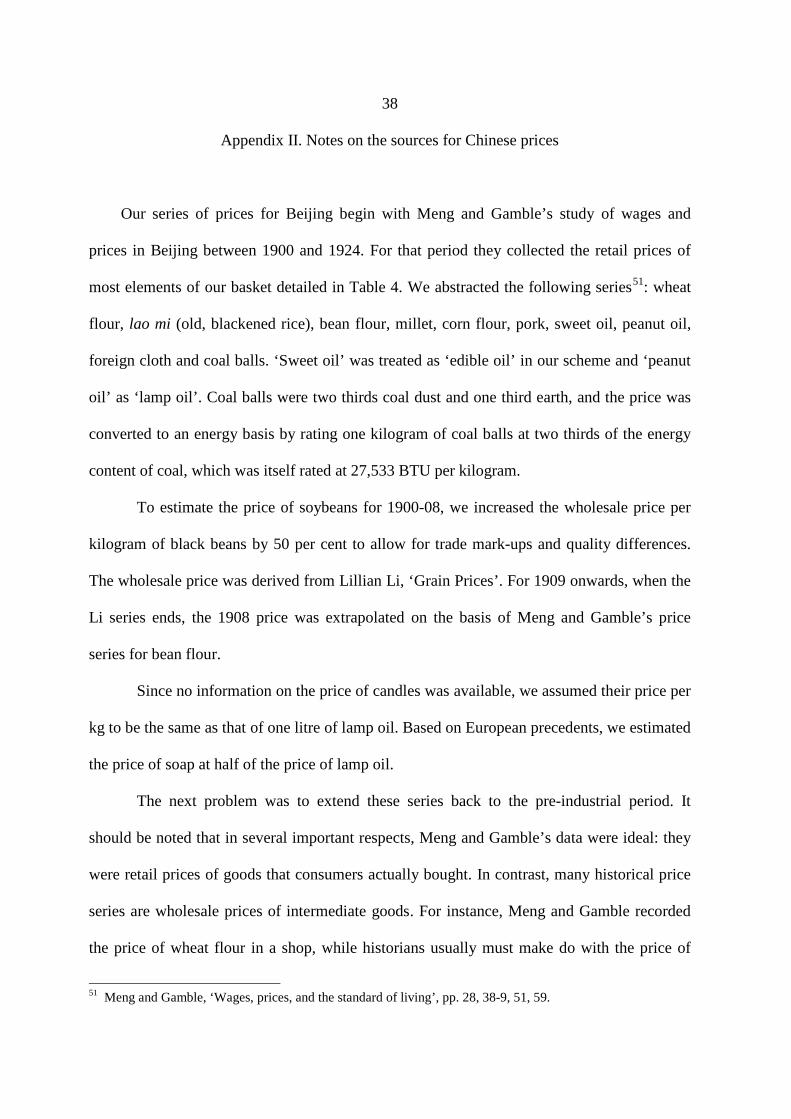
38
Appendix II. Notes on the sources for Chinese prices
Our series of prices for Beijing begin with Meng and Gamble’s study of wages and
prices in Beijing between 1900 and 1924. For that period they collected the retail prices of
most elements of our basket detailed in Table 4. We abstracted the following series51
To estimate the price of soybeans for 1900-08, we increased the wholesale price per
kilogram of black beans by 50 per cent to allow for trade mark-ups and quality differences.
The wholesale price was derived from Lillian Li, ‘Grain Prices’. For 1909 onwards, when the
Li series ends, the 1908 price was extrapolated on the basis of Meng and Gamble’s price
series for bean flour.
: wheat
flour, lao mi (old, blackened rice), bean flour, millet, corn flour, pork, sweet oil, peanut oil,
foreign cloth and coal balls. ‘Sweet oil’ was treated as ‘edible oil’ in our scheme and ‘peanut
oil’ as ‘lamp oil’. Coal balls were two thirds coal dust and one third earth, and the price was
converted to an energy basis by rating one kilogram of coal balls at two thirds of the energy
content of coal, which was itself rated at 27,533 BTU per kilogram.
Since no information on the price of candles was available, we assumed their price per
kg to be the same as that of one litre of lamp oil. Based on European precedents, we estimated
the price of soap at half of the price of lamp oil.
The next problem was to extend these series back to the pre-industrial period. It
should be noted that in several important respects, Meng and Gamble’s data were ideal: they
were retail prices of goods that consumers actually bought. In contrast, many historical price
series are wholesale prices of intermediate goods. For instance, Meng and Gamble recorded
the price of wheat flour in a shop, while historians usually must make do with the price of
51 Meng and Gamble, ‘Wages, prices, and the standard of living’, pp. 28, 38-9, 51, 59.

39
unprocessed wheat in wholesale markets.
Taking advantage of these ideal features of Meng and Gamble’s data, we applied
Lillian Li’s study of wholesale grain prices in Zhili province, which includes Beijing. From
the graphs in her paper, we could read off the prices of wheat, millet, sorghum from 1738 to
1908 as well as the relative price of black beans to wheat. These are five-year moving
averages, so annual fluctuations are suppressed, but that is of little consequence for the
present study.52
The retail prices of other products were extrapolated back to 1738 as follows: for meat,
edible oil, lamp oil, candles, the price of wheat flour was applied, based on the benchmark
period of 1901-04 for meat (the average price of pork and mutton), and 1902 for the rest. For
corn flour, the price of sorghum based on 1901-04 benchmark was used, and for rice (lao mi,
old or blackened rice), the price of rice in the Yangzi delta
On the basis of these series, the retail prices of wheat flour, millet, corn flour,
bean flour, and soybeans were extrapolated back to 1738. The resulting extrapolated series
are linked using the average of 1901-04 as the base period. This procedure assumes that the
ratio of the retail price of the consumer good to the wholesale price of the unprocessed good
remained constant.
53
Two things can be said in favour of these extrapolations. First, most of the long term
agricultural time series inflate at the same rate, so the values projected back into the
eighteenth century do not depend critically on which price series is used for the extrapolation.
Second, the extrapolations can be checked by comparing the values we obtain in the
, based on the 1901-04
benchmark.
52 Professor Li kindly supplied us with some of the underlying series, which we used in preference to the
graphed data.
53 Wang, ‘Secular trends’, pp. 40-47.

40
eighteenth century for prices recorded in the VOC records for Canton. Since the extrapolated
prices are similar to prices paid then, this gives us some confidence in the procedure.
The price series of cotton cloth is based on several sources. First, the Beijing retail
price of foreign cloth was projected back to 1871 using Albert Feuerwerker’s series of the
price of cotton cloth imported into China.54
In his detailed discussion of eighteenth-century cloth prices and weaving incomes,
Pomeranz estimated the price of cloth in a low price scenario at 0.5 taels per bolt.
Imported cloth was measured in pieces which
were usually 40 yards long by one yard wide (360 square feet). Meng and Gamble’s price was
the price per 100 feet. We interpret that to mean 100 linear feet from a bolt of cloth, which we
assume was three feet wide – a typical width. On those assumptions, the retail price per
square foot of foreign cloth in Beijing was about 50 per cent more than the price at which it
was landed. This is not an unreasonable markup.
55 On this
assumption 300 square feet of cloth were worth 4.59 taels, and we interpret this as the
eighteenth-century counterpart to Meng and Gamble’s price for a 100 foot length of a piece of
cloth three feet wide. Following Pomeranz, we assume that cloth prices remained constant
over the eighteenth century.56
For the years between 1800 and 1870 we were guided by the history of cloth prices in
Indonesia. A series of the price paid for cotton cloth on Java from 1815 to 1871 shows that
from 1815 to 1824, the price was 4.89 grams of silver per square meter, which compares to a
Chinese price of 5.12 grams per square meter for the eighteenth century. This correspondence
54 Feuerwerker, Handicraft and manufactured cotton, p. 344.
55 Pomeranz in Great divergence, p. 319 decided that a cloth of 16 chi length cost 0.4 taels. According to Li,
Agricultural development, p. xvii, a bolt of 20 chi had 3.63 square yards. Hence, the price of cloth was 0.5 taels
per bolt.
56 Pomeranz, Great divergence, p. 323.

41
is reassuring since cotton cloth was traded across Asia, so we would not expect extreme
differences in its price. Starting in the1830s, the price in Java dropped fairly quickly to a
value of about 2.5 grams of silver per square meter and stayed at that level until 1871.57
The price of energy was also combined from diverse sources. For 1739-69, we used
the data implied by charcoal prices in Zhili province in the 1769 Wuliao jiazhi zeli, and for
1816, the price implied by the price of coal in Beijing given by Timkovski.
That
low price is like the value of cloth imported into China – 2.36 grams of silver per square
meter in 1871. On the assumption that cloth prices in China followed the same temporal
pattern as those in Java, the eighteenth-century price derived from Pomeranz was continued to
1830, and then interpolated linearly between 1830 and 1871.
58
Since no Chinese alcohol prices were available, the present study used the Japanese
data which show that one litre of sake equalled 1.31 kg of rice (based on Mitsui Bunko). This
ratio is applied to Beijing and Canton, assuming that the technology for processing rice wine
was similar in China and Japan.
From 1900
onwards, the cost of energy was based on the price of coal balls. One of the striking features
of this scattered information is that they should give a fairly constant price of energy. In view
of that constancy, the values for the missing years were interpolated.
Appendix Table II. Caloric and protein contents
Unit
(metric) Calories per unit
Grams of protein per unit
Bread kg 2450 100 Beans/peas (Europe) litre 1125 71 Beans (Asia) kg 3383 213 Meat kg 2500 200 Butter kg 7268 7 Cheese kg 3750 214 Eggs pc 79 6,25 Beer litre 426 3
57 See W.L. Korthals Altes, “Prices (non-rice)” for Java cloth price. 58 Timkovski, Voyage à Péking, p. 200.

42
Soy beans kg 4160 365 Rice kg 3620 75 Wheat flour kg 3390 137 Barley kg 3450 105 Millet kg 3780 110 Buckwheat kg 3430 133 Corn flour kg 3610 69 Fresh fish kg 1301 192 Edible oil litre 8840 1 Alcohol (20°) litre 1340 5
Sources: The caloric and protein content are based on Allen, ‘Great divergence in European wages’ for bread, beans/peas consumed in Europe (fresh with pods, measured in litres), meat, butter, cheese, eggs, and beer. For other items, we relied on US Department of Agriculture (USDA) National Nutrient Database for Standard Reference, http://www.nal.usda.gov/fnic/foodcomp/cgi-bin/list_nut_edit.pl.

43
References
Allen, R. C., ‘The great divergence in European wages and prices from the Middle Ages to
the First World War’, Explorations in Economic History, 38 (2001), pp. 411-447.
Allen, R. C. (2003) ‘Agricultural productivity and rural incomes in England and the Yangtze
Delta, c. 1620 – c. 1820’ [WWW document].
URL http://www.economics.ox.ac.uk/Members/robert.allen/Papers/chineseag.pdf
[accessed on 10 June 2009].
Allen, R. C. (2004) ‘Mr. Lockyer meets the index number problem: the standard of living of
unskilled workers in Canton and London in 1704’ [WWW document].
URL http://www.economics.ox.ac.uk/Members/robert.allen/Papers/Lockyer.pdf [accessed
on 10 June 2009].
Allen, R. C., ‘Real wages in Europe and Asia: a first look at the long-term patterns’, in R. C.
Allen, T. Bengtsson, and M. Dribe, eds., Living standards in the past: new perspectives
on well-being in Asia and Europe (Oxford, 2005), pp. 111-131.
Allen, R. C., Bengtsson, T., and Dribe, M., eds., Living standards in the past: new
perspectives on well-being in Asia and Europe (Oxford, 2005).
Allen, R. C., Jean-Pascal Bassino, Debin Ma, Christine Moll-Murata, and Jan Luiten van
Zanden. ‘Wages, Prices, and Living Standards in China, Japan, and Europe, 1738-1925’.
GPIH Working Paper No. 1 at http://gpih.ucdavis.edu/Papers.htm#1. 2005.
Allen, R. C., ‘India in the great divergence’, in T. J. Hatton, K. H. O’Rourke, and A. M.
Taylor, eds., The New Comparative Economic History: Essays in Honor of Jeffrey G.
Williamson (Cambridge, MA, 2007), pp. 9-32.
Bassino, J.-P., and Ma, D., ‘Japanese unskilled wages in international perspective,
1741-1913’, Research in Economic History, 23 (2005).

44
Bassino, J.-P., Ma, D., Saito, O., ‘Level of real wages in historic China, Japan and Southern
Europe, 1700-1920: a review of evidence’, Economic Research (Keizai Kenkyu), 56(4),
(2005), pp. 348-369.
Broadberry, S., and Gupta, B., ‘The early modern great divergence: wages, prices and
economic development in Europe and Asia, 1500-1800’, Economic History Review, LIX,
1 (2006), pp. 2-31.
Bureau of Social Affairs, The City Government of Greater Shanghai, The cost of living index
numbers of laborers, greater Shanghai (January 1926 - December 1931, 1932).
Chao, K., Man and land in Chinese history: An economic analysis (Stanford, 1986).
Chen, C., Shichang jizhi yu shehui bianqian: Shiba shiji Guangdong mijia fenxi (Market
mechanism and social change – an analysis of rice prices in eighteenth-century
Guangdong) (Guangzhou, 1992).
Chen, Z., Gesheng nonggong guyong xiguan ji xugong zhuangkuang (Employment practice
and conditions of supply and demand for agricultural labourers in various provinces)
(Nanjing, 1935).
The Chinese Repository, ‘Diet of the Chinese’, 3(10), (Feb. 1835), pp. 457-446.
Chuan, H-S., and Wang, Y.-C., ‘Jindai Sichuan Hejiang xian wujia yu gongzi de biandong
qushi’ (Price and wage trends in Modern Hejiang County, Sichuan), Zhongyang
yanjiuyuan lishi yuyan yanjiusuo jikan (Bulletin of the Institute of History and Philology,
Academia Sinica, Taiwan), 34 (1962), pp. 265-274.
Da Qing huidian shili (Collected statutes of the great Qing dynasty, with factual precedents)
(Taibei, 1963, reprinted from 1899).
‘Data files of historical prices and wages’ [WWW document].
URL http://www.iisg.nl/hpw/data.php [accessed on 6 June 2009].

45
‘Databases on materials, wages, and transport costs in public construction in the Qianlong era’
[WWW document].
URL http://www.uni-tuebingen.de/sinologie/project/shp/databases.html [accessed on 6
June 2009].
Department of Crop Reporting, Division of Agricultural Economics, The National
Agricultural Research Bureau (NARB), China, Crop Reports, 5, issues 7 and 8 (Nanjing,
1937).
Department of Peasantry and Labour, Kwangtung Government, China, The Reports of
Statistics, Vol. 3, The wage indexes of labourers in Canton, China, 1912-1927 (June
1928).
Diewert, W.E., ‘Exact and superlative index numbers’, Journal of econometrics, 4(2), (1976),
pp. 115-45.
Fang, X., Jing, J., and Wei, J., Zhongguo jingji tongshi. Qingdai jingji juan (General
economic history of China. Volume on the Qing period) (Beijing, 3 vols., 2000).
Feuerwerker, A., ‘Handicraft and manufactured cotton textiles in China, 1871-1910’, Journal
of Economic History, 30(2), (1970), pp. 338-378.
Gamble, S. D., ‘Daily wages of unskilled Chinese laborers, 1807-1902’, The Far Eastern
Quarterly, 3(1), (1943), pp. 41-73.
Huang, P., The peasant family and rural development in the Yangzi delta, 1350-1988
(Stanford, 1990).
Imperial Maritime Customs, ed., I. Statistical Series, 6, Decennial Reports on the Trade,
Navigation, Industries etc. of the Ports open to Foreign Commerce in China and Corea
[…] , 1882-1891 (Shanghai: Inspector General of Customs, 1896).
Jörg, C. J. A., Porcelain and the Dutch China trade (The Hague).

46
Kishimoto, M., Shindai Chūgoku no bukka to keizai hendō (Prices and economic change in
Qing dynasty China) (Tokyo, 1997).
Korthals Altes, W.L. “Prices (non-rice)”, in P. Creutzeberg et.el., Changing Economy in
Indonesia, XV. The Hague, Nijhoff, 1994.
Kung, J., Lee, Y-F., and Bai, N., ‘Human Capital, Migration, and “Vent” for Surplus Rural
Labor in 1930s’ China: The Case of the Lower Yangzi’ (unpublished paper).
Kuroda, A., ‘Copper coins chosen and silver differentiated: another aspect of the “Silver
Century” in East Asia’, Acta Asiatica (2005), pp. 65-86.
Lee, J. Z., and Wang, F., One quarter of humanity: Malthusian mythology and Chinese
realities, 1700-2000 (Cambridge, MA, 1999).
Li, B., Agricultural development in Jiangnan, 1620-1850 (New York, 1998).
Li, L. M., ‘Grain prices in Zhili province, 1736-1911: a preliminary study’, in T. G. Rawski
and L. M. Li, eds., Chinese History in Economic Perspective (Berkeley, 1992), pp.
70-100.
Li, L. M., ‘Integration and disintegration in North China’s grain markets, 1738-1911’,
Journal of Economic History, 60/3 (Sept. 2000), pp. 665-699.
Li, W., Wei, J., and Jing, J., eds., Ming Qing shidai de nongye ziben zhuyi mengya wenti (The
issue of the ‘sprouts of capitalism’ in the Ming and Qing periods) (Beijing, 1983).
Ma, D., ‘Economic growth in the lower Yangzi region of China in 1911-1937: a quantitative
and historical perspective’, The Journal of Economic History, 68(2), (June 2008), pp.
385-392.
Meng, T.-P., and Gamble, S. D., ‘Wages, prices, and the standard of living in Peking,
1900-1924’, The Chinese Social and Political Science Review, 20 (1926), pp. 1-113.
Ohkawa, K., Noda, T., Takamatsu, N., Yamada, S., Kumazaki, M., Shionoya, Y., and

47
Ryoshin, M., Nihon chōki keizai tōkei (Estimates of long-term economic statistics (LTES)
of Japan since 1868), 8 (Tokyo, 1967).
Özmucur, S., and Pamuk, Ş., ‘Real wages and standards of living in the Ottoman Empire,
1489-1914’, Journal of Economic History, 62 (2002), pp. 293-321.
Parthasarathi, P., ‘Rethinking wages and competitiveness in the eighteenth century: Britain
and south India’, Past & Present, 158 (1998), pp. 79-109.
Peng, X., Zhongguo huobi shi (A monetary history of China) (Shanghai, 1954), transl. as A
Monetary History of China by E. H. Kaplan (Bellingham, 1993).
Peng, Z., Zhongguo jindai shougongye shi ziliao 1840–1949 (Materials for early modern
Chinese craft history, 1840–1949), 4 vols. (Beijing, 1962/1984).
Pomeranz, K., The great divergence: China, Europe, and the making of the modern world
economy (Princeton, 2000).
Quan, H., ‘Qingdai Suzhou de chuaibuye’ (Cotton calendering in Qing Suzhou), Xin Ya
xuebao, 13 (1975), pp. 424-26.
Rawski, T., Economic growth in pre-war China (Berkeley, 1989).
Rōdō undō shiryō iinkai (Commission for Historical Documentation of the Labour
Movement), Nihon rōdō undō shiryō (Historical documents on the Japanese labour
movement), 10 (Tokyo, 1959).
Saito, O., ‘Wages, inequality, and pre-industrial growth in Japan, 1727-1894’, in R. C. Allen,
T. Bengtsson, and M. Dribe, eds., Living standards in the past, pp. 77-97.
Santangelo, P., ‘Urban society in late imperial Suzhou’, in L. Cooke Johnson, ed., Cities of
Jiangnan in late imperial China (New York, 1993), pp. 81-116.
Smith, A., An inquiry into the nature and causes of the wealth of nations (1776), edited by E.
Cannan (New York, 1937).
48
Song, J., and Moll-Murata, C., ‘Notes on Qing dynasty handicraft regulations and precedents
(jiangzuo zeli), with special focus on regulations on materials, working time, prices, and
wages’, Late Imperial China, 23:2 (2002), pp. 87–126.
Terada, T., ‘Sōshū tampogyō no kei’ei keitai’ (Management systems in Suzhou calendering)
Tōhōku daigaku bungakubu kenkyū nenpō, 18 (1967), pp. 121-173.
Timkovski, G., Voyage à Péking (Paris, 1827).
United Nations, Food and Agricultural Organization. Food Balance Sheets (Rome, 1984-86).
Van Dyke, P. A., The Canton trade. Life and enterprise on the China coast, 1700-1845 (Hong
Kong, 2005).
Van Zanden, J. L., ‘Wages and the standards of living in Europe, 1500-1800’, European
Review of Economic History, 3 (1999), pp. 175-98.
Van Zanden, J. L., ‘The skill premium and the great divergence’, paper presented at the
conference ‘Towards a global history of prices and wages’ (Utrecht, August 19-21, 2004).
[WWW document]. URL http://www.iisg.nl/hpw/papers/vanzanden.pdf [accessed on 10
June 2009].
Van Zanden, J. L., and van Riel, A., The strictures of inheritance. The Dutch economy in the
nineteenth century (Princeton, 2004).
Vogel, H. U., ‘Chinese central monetary policy, 1644-1800’, Late Imperial China, 8.2 (1987),
pp. 1-52.
Wang, Y.-C., Land taxation in imperial China, 1750-1911 (Cambridge, MA, 1973).
Wang, Y.-C., ‘Secular trends of rice prices in the Yangzi Delta, 1638-1935’, in T. G. Rawski
and L. M. Li, eds., Chinese history in economic perspective (Berkeley, 1992), pp. 35-68.
Wei, J., ‘Ming-Qing shidai nongye zhong dengjixing guyong laodong xiang feidengjixing
guyong laodong de guodu’ (The transition from hierarchical to non-hierarchical

49
agricultural labour employment during the Ming and Qing periods), in Li, Wei, and Jing,
eds., Ming Qing shidai de nongye ziben zhuyi mengya wenti (Beijing, 1983).
Wong, R. B., China transformed: historical change and the limits of European experience
(Ithaca, 1997).
Wu, L., ‘Qing qianqi nongye gugong de gongzi’ (Wages of hired agricultural labourers in the
early Qing), Zhongguo shehui jingjishi yanjiu (Journal of Chinese social and economic
history), 2 (1983).
Xu, X., ed., Jiangnan tubu shi (History of native cloth in Jiangnan) (Shanghai, 1989).
Yan, Z. et al., eds., Zhongguo jindai jingjishi tongji ziliao xuanji (Selected statistical materials
on modern Chinese economic history) (Beijing, 1955).
Yang, X., ‘Shanghai gongren shenghuo chengdu de yige yanjiu’ (A study on the living
standards of Shanghai workers), in W. Li, ed., Minguo shiqi shehui diaocha congbian.
Chengshi (laogong) shenghuo bian (A collection of survey research in Republican China.
Volume on the living conditions of the urban working class), 1 (Fuzhou, 2005), pp.
243-336.
You, Z., ‘Lun junqi zeli’ (A study of regulations and precedents on weapons and military
equipment), in C. Moll-Murata, J. Song, and H. U. Vogel, eds., Chinese handicraft
regulations of the Qing Dynasty (München, 2005), pp. 307-324.
Zhao, G., Liu, Y., Wu, H. et al., Qingdai liangshi muchanliang yanjiu (Research on grain
yields in the Qing period) (Beijing, 1995).
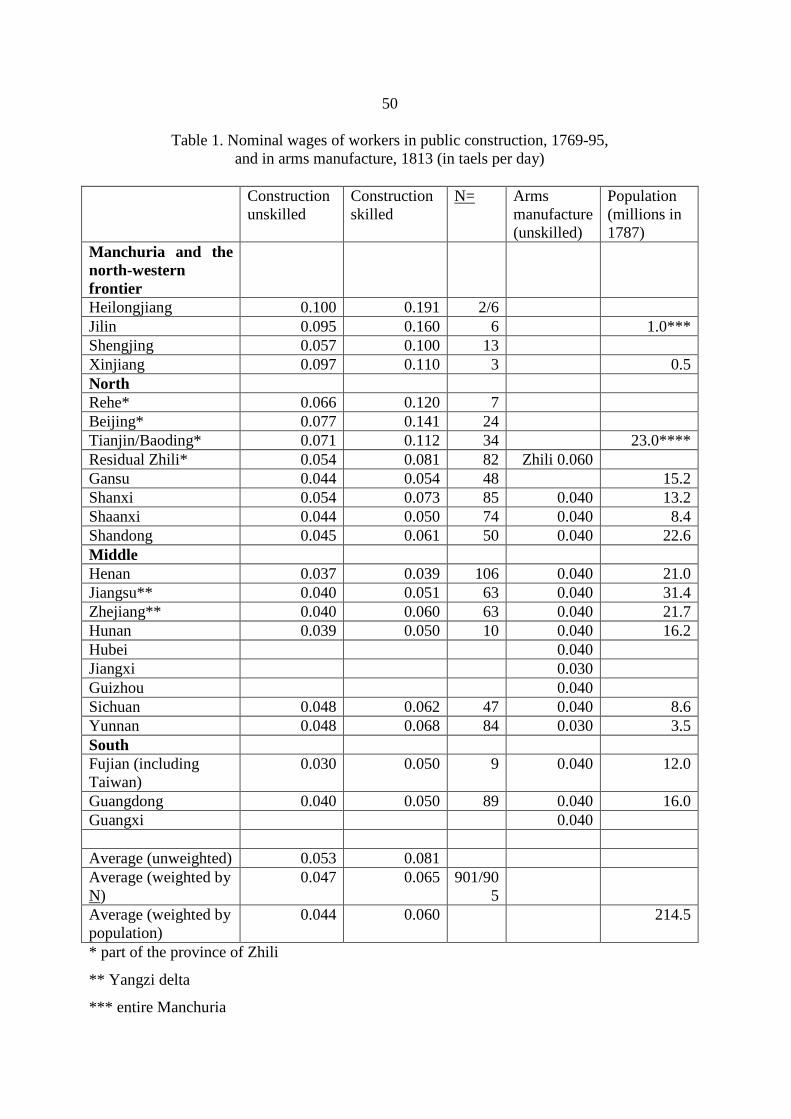
50
Table 1. Nominal wages of workers in public construction, 1769-95, and in arms manufacture, 1813 (in taels per day)
Construction
unskilled Construction skilled
Arms manufacture (unskilled)
N= Population (millions in 1787)
Manchuria and the north-western frontier
Heilongjiang 0.100 0.191 2/6 Jilin 0.095 0.160 6 1.0*** Shengjing 0.057 0.100 13 Xinjiang 0.097 0.110 3 0.5 North Rehe* 0.066 0.120 7 Beijing* 0.077 0.141 24 Tianjin/Baoding* 0.071 0.112 34 23.0**** Residual Zhili* 0.054 0.081 82 Zhili 0.060 Gansu 0.044 0.054 48 15.2 Shanxi 0.054 0.073 85 0.040 13.2 Shaanxi 0.044 0.050 74 0.040 8.4 Shandong 0.045 0.061 50 0.040 22.6 Middle Henan 0.037 0.039 106 0.040 21.0 Jiangsu** 0.040 0.051 63 0.040 31.4 Zhejiang** 0.040 0.060 63 0.040 21.7 Hunan 0.039 0.050 10 0.040 16.2 Hubei 0.040 Jiangxi 0.030 Guizhou 0.040 Sichuan 0.048 0.062 47 0.040 8.6 Yunnan 0.048 0.068 84 0.030 3.5 South Fujian (including Taiwan)
0.030 0.050 9 0.040 12.0
Guangdong 0.040 0.050 89 0.040 16.0 Guangxi 0.040 Average (unweighted) 0.053 0.081 Average (weighted by N)
0.047 0.065 901/905
Average (weighted by population)
0.044 0.060 214.5
* part of the province of Zhili
** Yangzi delta
*** entire Manchuria

51
**** entire Zhili
N number of districts for which data are available
Sources for wages: see Appendix I; for population data, Wang, Land taxation, p. 87.
Table 2. Wage regressions for eighteenth-century China, standardized on the daily wage of an unskilled construction labourer in the Yangzi delta in 1769 (in taels)
Coefficient T-value Constant 0.0456 4.00 Trend -0.0000351 -0.348 Manchuria 0.0902 6.73 Zhili (incl.Beijing) 0.0441 4.36 North 0.0132 1.397 Middle -0.0022 -0.026 South -0.000593 -0.056 Canton 0.0379 3.55 Skilled 0.0295 4.79 Regulated -0.0171 -2.21 Iron Industry 0.0092 1.12 Coal mining -0.0093 -0.83 Agriculture -0.0072 -0.744 Textiles 0.0403 3.22 Other -0.0147 -1.93 R^2 0.408 F (14,312) 15.34**
327 N ** Significant at 1 per cent.
Table 3. Subsistence lifestyle: baskets of goods in China
Suzhou/Canton Beijing

52
Quantity per person per year (kg)
Nutrients/day Quantity per person per year
Nutrients/day
Calories Grams of protein
Calories Grams of
protein Rice 171 1677 47 Sorghum 179 kg 1667 55 Polenta Beans/peas 20 187 14 20 187 14 Meat/fish 3 8 2 3 21 2 Butter Oil 3 67 0 3 67 0 Soap 1.3 1.3 Cotton 3 m 3 m Candles 1.3 1.3 Lamp oil 1.3 1.3 Fuel 3 M BTU 3 M BTU Total 1939 63 1942 71 For conversion of calories and proteins, see Appendix Table II.
Table 4. Subsistence incomes: baskets of goods in Europe
Northern Europe Milan Quantity per Nutrients/day Quantity per Nutrients/day
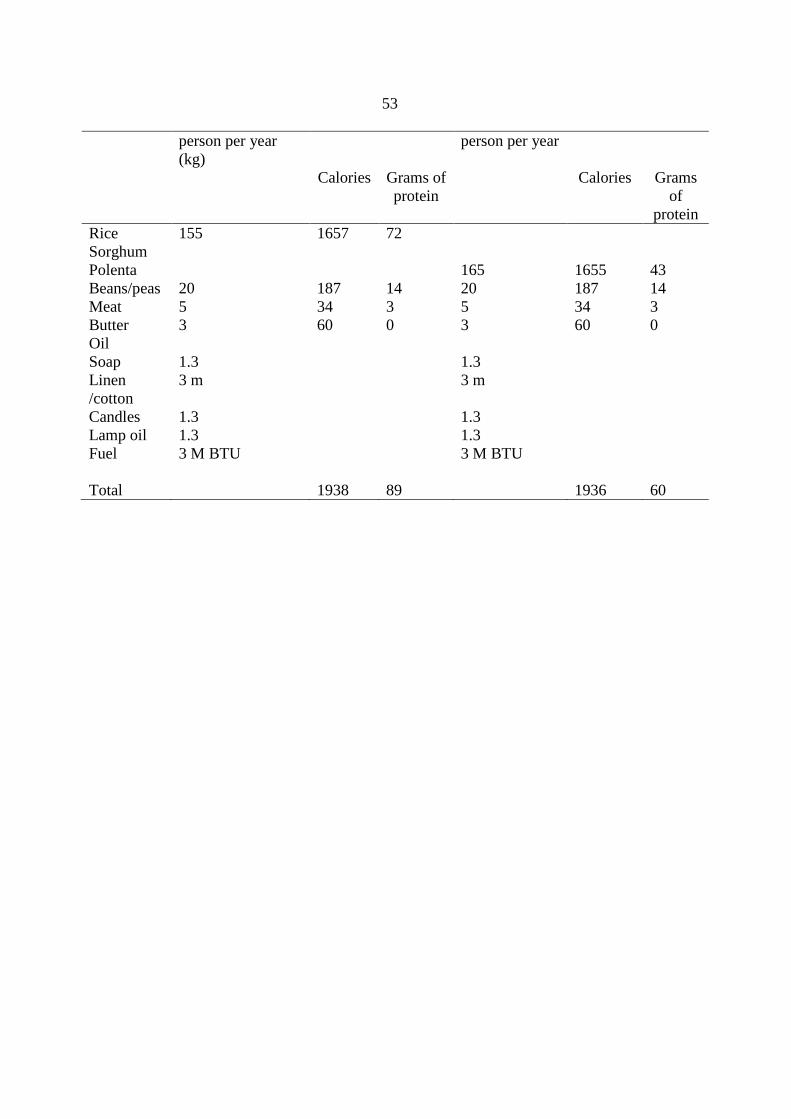
53
person per year (kg)
person per year
Calories Grams of protein
Calories Grams of
protein Rice 155 1657 72 Sorghum Polenta 165 1655 43 Beans/peas 20 187 14 20 187 14 Meat 5 34 3 5 34 3 Butter 3 60 0 3 60 0 Oil Soap 1.3 1.3 Linen /cotton
3 m 3 m
Candles 1.3 1.3 Lamp oil 1.3 1.3 Fuel 3 M BTU 3 M BTU Total 1938 89 1936 60

54
Table 5. Comparison of different basket costs around 1750
Sources: see the text.
Figure 1 Nominal wages in Beijing, Suzhou and Canton (in silver taels)
Barebone basket Respectable basket London prices (in grams of Silver)
Beijing prices (in grams of Silver)
Europe North China
Europe North China
Oats/Sorghum 155 kg 179 kg 0.76 0.48 Bread 182 kg 182 kg 1.28 0.95 Beans 40 kg 40 kg 0.5 0.84 Meat/Fish 5 kg 3 kg 26 kg 31 kg 3.19 2.04 Cheese 5.2 kg 2.07 Eggs 52 pc 52 pc 0.37 0.074 Butter 3 kg 5.2 kg 6.45 Oil/Cooking 3 kg 5.2 kg 4 Beer/Rice Wine 182 l 49 l 0.39 1.98 Soap 1.3 kg 1.3 kg 2.6 kg 2.6 kg 6.36 1.65 Linen/Cotton 3 m 3 m 5 m 5 m 4.87 6.14 Candles 1.3 kg 1.3 kg 2.6 kg 2.6 kg 5.4 3.3 Lamp Oil 1.3 kg 1.3 kg 2.6 kg 2.6 kg 2.8 3.3 Fuel (M BTU) 3 3 5 5 5.59 11.2 Total basket cost (grams of silver)
213 182.6 558.6 499.3
Europe/Beijing ratio
Barebone basket Respectable basket Geometric average
1.17 1.12 1.14
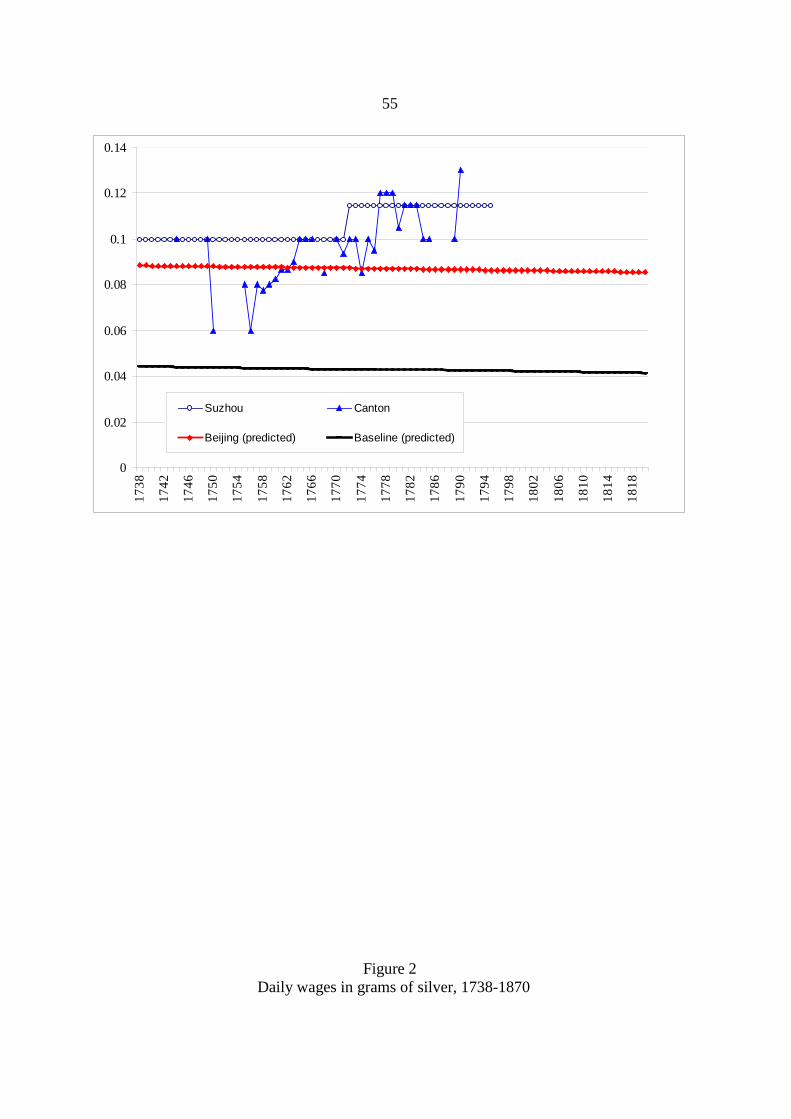
55
Figure 2 Daily wages in grams of silver, 1738-1870
0
0.02
0.04
0.06
0.08
0.1
0.12
0.1417
38
1742
1746
1750
1754
1758
1762
1766
1770
1774
1778
1782
1786
1790
1794
1798
1802
1806
1810
1814
1818
Suzhou Canton
Beijing (predicted) Baseline (predicted)
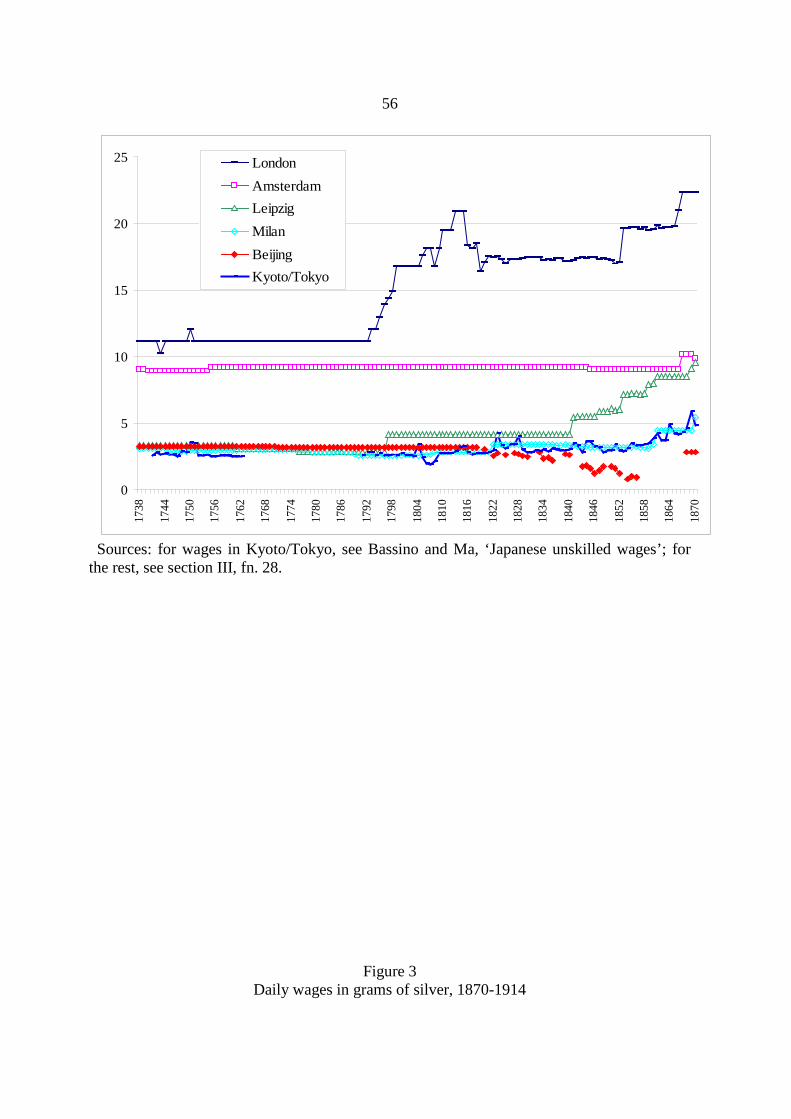
56
Sources: for wages in Kyoto/Tokyo, see Bassino and Ma, ‘Japanese unskilled wages’; for
the rest, see section III, fn. 28.
Figure 3 Daily wages in grams of silver, 1870-1914
0
5
10
15
20
2517
38
1744
1750
1756
1762
1768
1774
1780
1786
1792
1798
1804
1810
1816
1822
1828
1834
1840
1846
1852
1858
1864
1870
LondonAmsterdamLeipzigMilanBeijingKyoto/Tokyo
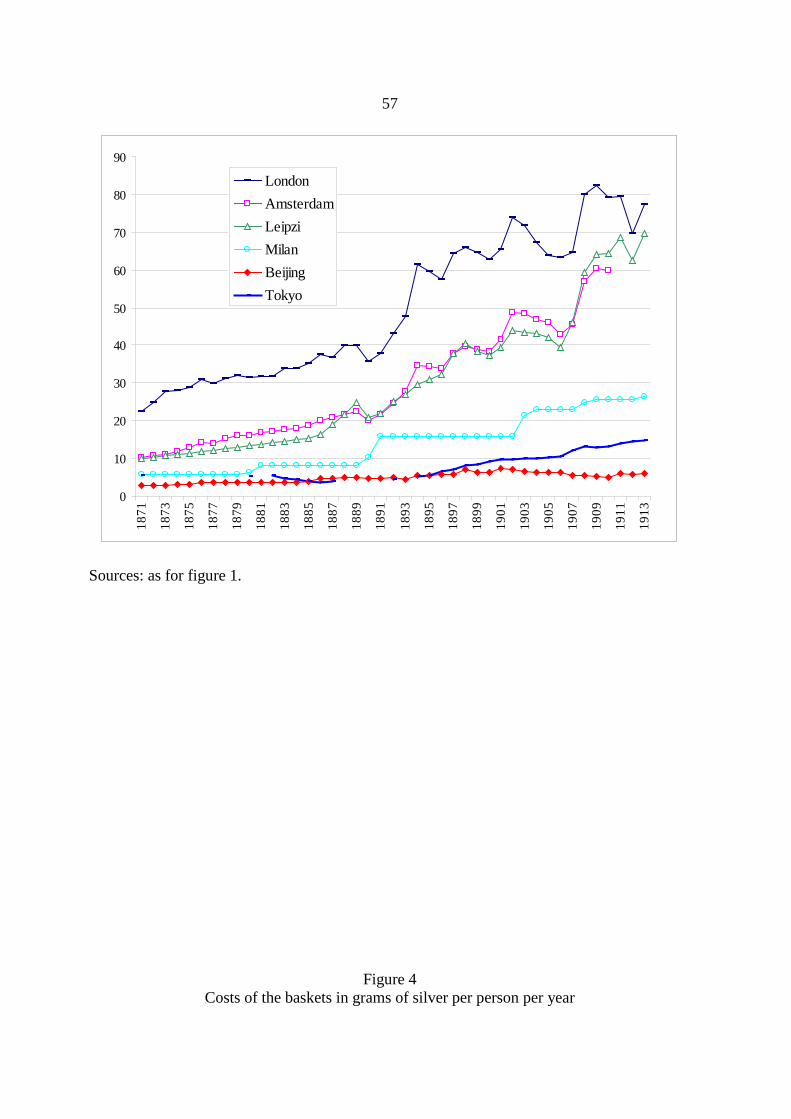
57
Sources: as for figure 1.
Figure 4 Costs of the baskets in grams of silver per person per year
0
10
20
30
40
50
60
70
80
9018
71
1873
1875
1877
1879
1881
1883
1885
1887
1889
1891
1893
1895
1897
1899
1901
1903
1905
1907
1909
1911
1913
LondonAmsterdamLeipziMilanBeijingTokyo
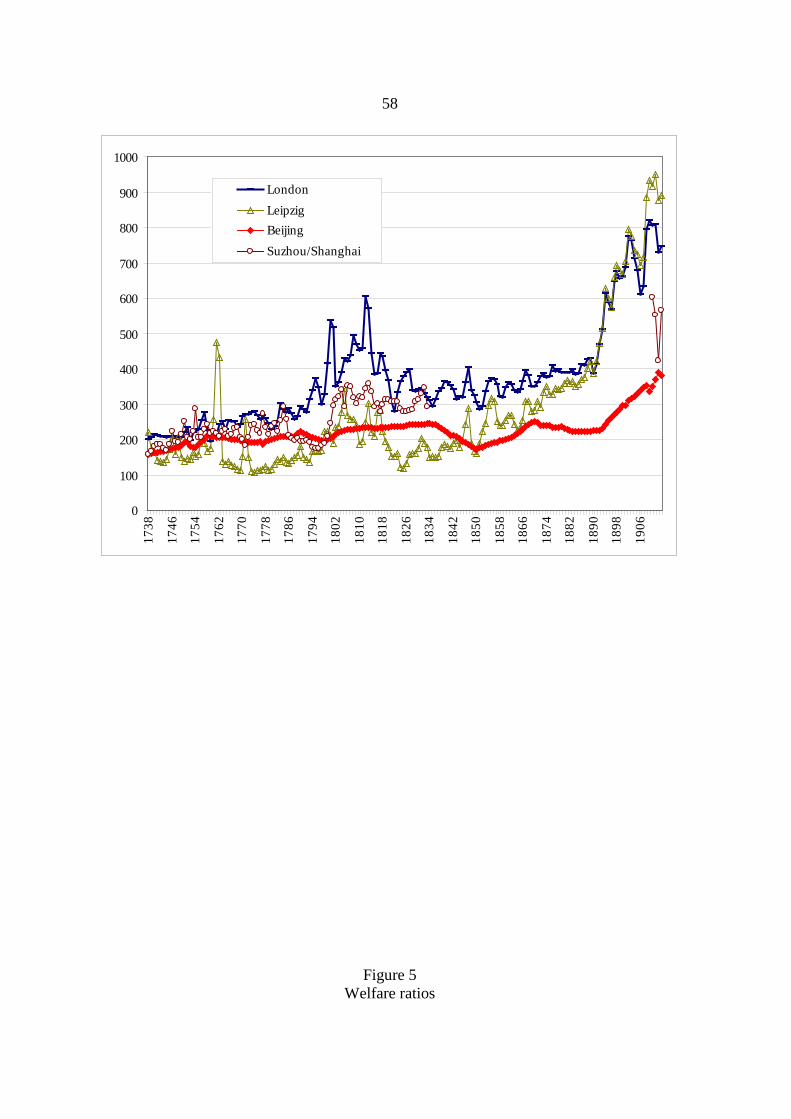
58
Figure 5 Welfare ratios
0
100
200
300
400
500
600
700
800
900
100017
38
1746
1754
1762
1770
1778
1786
1794
1802
1810
1818
1826
1834
1842
1850
1858
1866
1874
1882
1890
1898
1906
LondonLeipzigBeijingSuzhou/Shanghai
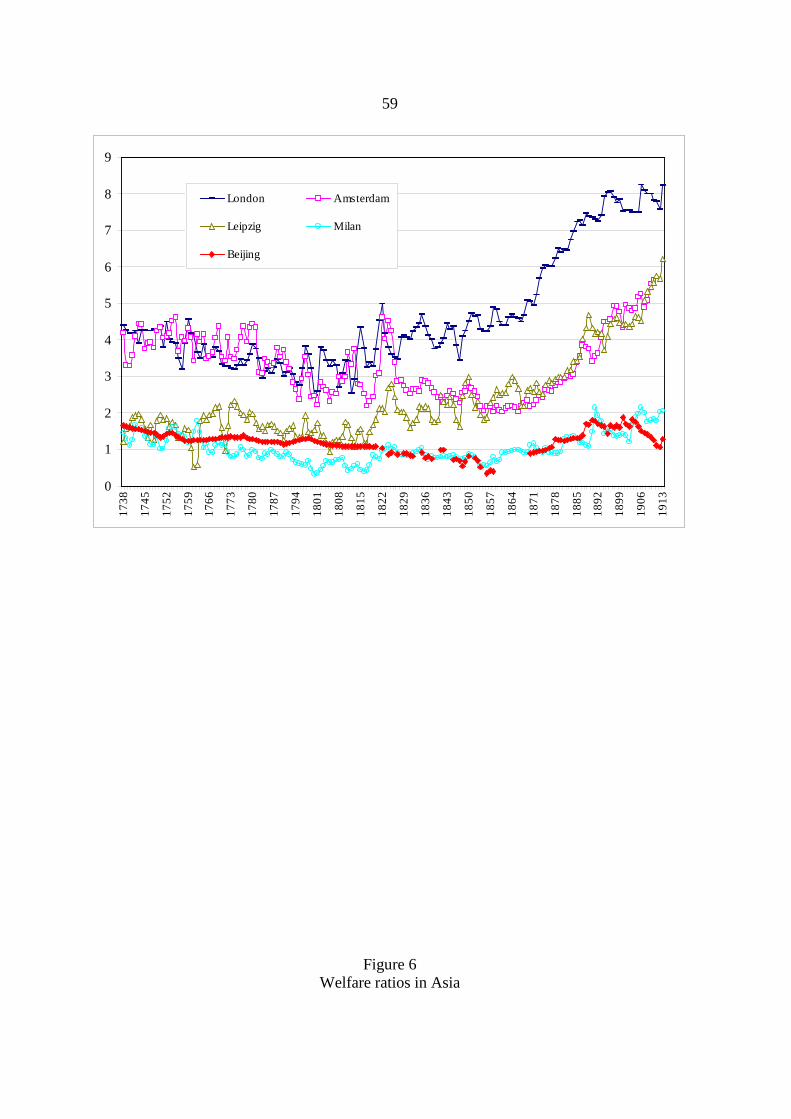
59
Figure 6 Welfare ratios in Asia
0
1
2
3
4
5
6
7
8
9
1738
1745
1752
1759
1766
1773
1780
1787
1794
1801
1808
1815
1822
1829
1836
1843
1850
1857
1864
1871
1878
1885
1892
1899
1906
1913
London Amsterdam
Leipzig Milan
Beijing
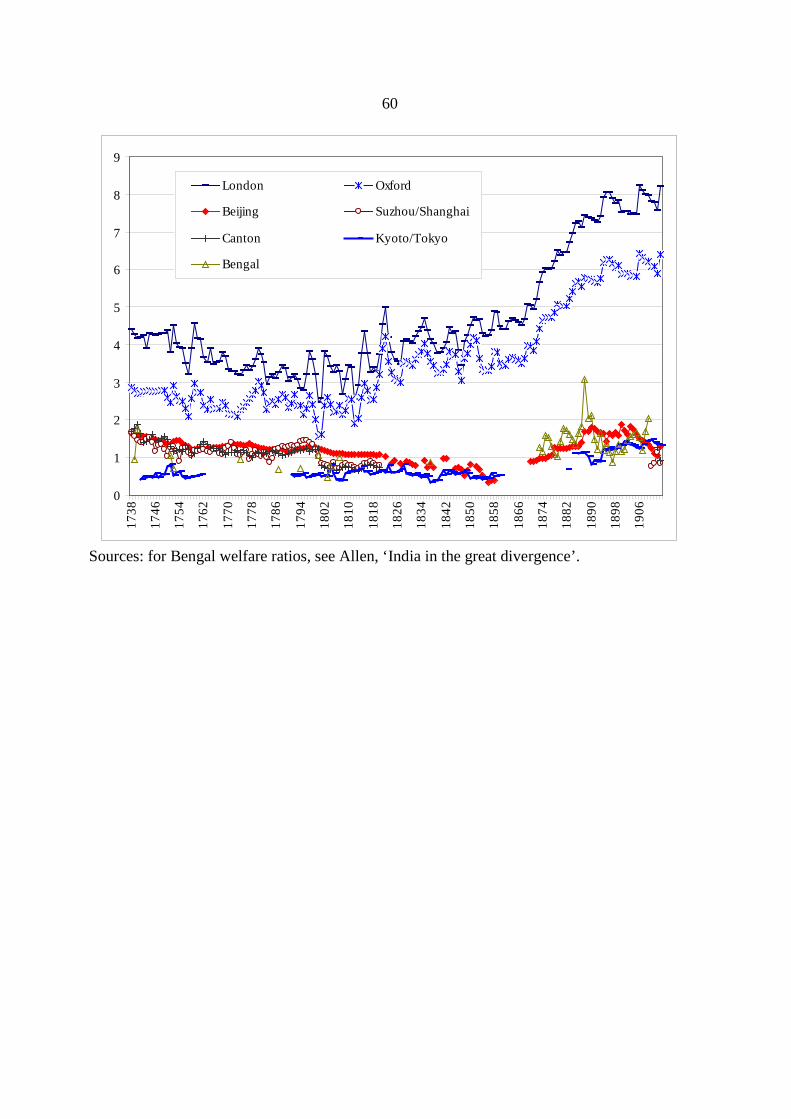
60
Sources: for Bengal welfare ratios, see Allen, ‘India in the great divergence’.
0
1
2
3
4
5
6
7
8
9
1738
1746
1754
1762
1770
1778
1786
1794
1802
1810
1818
1826
1834
1842
1850
1858
1866
1874
1882
1890
1898
1906
London Oxford
Beijing Suzhou/Shanghai
Canton Kyoto/Tokyo
Bengal