Bargaining regimes and wages in Portugal
32
Port Econ J (2002) 1: 237–268 c Springer-Verlag 2002 Bargaining regimes and wages in Portugal Joop Hartog 1 , Pedro T. Pereira 2 , and Jos´ e A. C. Vieira 3 1 University of Amsterdam, Roetersstraat 11, 1018 WB Amsterdam, The Netherlands (e-mail: [email protected]) 2 Universidade da Madeira, Campus Universit´ ario da Penteada, 9000-930 Funchal, Portugal (e-mail: [email protected]) 3 Universidade dos Ac ¸ores and NIMA, Rua M˜ ae de Deus, 9500 P. Delgada, Portugal (e-mail: [email protected]) Received: April 2001 / Accepted: May 2002 Abstract. In this paper we analyse the bargaining regime wage-effect in Portugal. The results indicate that the bargaining regime coverage is important in explain- ing the variability of wages. Wage differentials between bargaining regimes are substantial, a fact which may be related to a decentralised wage setting which pre- vails in Portugal. The highest wages are generated by multi-firm negotiations and the lowest are generated by sectoral contracts. Single-firm contracts align at an intermediate level in the ranking. Key words: Wage equation – Wage setting – Bargaining regime JEL Classification: J31 1 Introduction The nature and structure of collective bargaining have become more important to labour economists who at one time were interested more in the wage rate for homogeneous labour and the volume of employment. The standard neo-classical model of pure competition states that in a market economy wages correspond to equilibrium prices determined by the forces of demand and supply of labour and constitute an instrument guiding the allocation of resources in a changing environment. However, labour economists have increasingly realised that wage structures and labour contracts may also be instruments to the firm (a survey of these developments is presented in Hartog and Theeuwes, 1990). Moreover, the We are very grateful to an anonymous referee. Financial support from program PRAXIS XXI under grant PRAXIS/2/2.1/CSH/781/95 and FEDER is acknowledged. The third author also acknowledges financial support from program PRAXIS XXI under grant BD/3486/94 and from the University of the Azores. Correspondence to: P. T. Pereira
-
Upload
independent -
Category
Documents
-
view
0 -
download
0
Transcript of Bargaining regimes and wages in Portugal
Port Econ J (2002) 1: 237–268
c© Springer-Verlag 2002
Bargaining regimes and wages in Portugal�
Joop Hartog1, Pedro T. Pereira2, and Jose A. C. Vieira3
1 University of Amsterdam, Roetersstraat 11, 1018 WB Amsterdam, The Netherlands(e-mail: [email protected])
2 Universidade da Madeira, Campus Universitario da Penteada, 9000-930 Funchal, Portugal(e-mail: [email protected])
3 Universidade dos Acores and NIMA, Rua Mae de Deus, 9500 P. Delgada, Portugal(e-mail: [email protected])
Received: April 2001 / Accepted: May 2002
Abstract. In this paper we analyse the bargaining regime wage-effect in Portugal.The results indicate that the bargaining regime coverage is important in explain-ing the variability of wages. Wage differentials between bargaining regimes aresubstantial, a fact which may be related to a decentralised wage setting which pre-vails in Portugal. The highest wages are generated by multi-firm negotiations andthe lowest are generated by sectoral contracts. Single-firm contracts align at anintermediate level in the ranking.
Key words: Wage equation – Wage setting – Bargaining regime
JEL Classification: J31
1 Introduction
The nature and structure of collective bargaining have become more importantto labour economists who at one time were interested more in the wage rate forhomogeneous labour and the volume of employment. The standard neo-classicalmodel of pure competition states that in a market economy wages correspondto equilibrium prices determined by the forces of demand and supply of labourand constitute an instrument guiding the allocation of resources in a changingenvironment. However, labour economists have increasingly realised that wagestructures and labour contracts may also be instruments to the firm (a survey ofthese developments is presented in Hartog and Theeuwes, 1990). Moreover, the
� We are very grateful to an anonymous referee. Financial support from program PRAXIS XXI undergrant PRAXIS/2/2.1/CSH/781/95 and FEDER is acknowledged. The third author also acknowledgesfinancial support from program PRAXIS XXI under grant BD/3486/94 and from the University of theAzores.Correspondence to: P. T. Pereira

238 J. Hartog et al.
influence of the institutional environment of the labour market has led to greaterinterest in the role of bargaining between trade unions and management. There isa lively debate underway in the economic literature on the role of labour marketinstitutions for wage formation and thus for economic performance (see Bruno andSachs, 1985; Calmfors and Driffill, 1988; Teulings and Hartog, 1998). From thelabour market point of view, such a performance has mostly been addressed in termsof (un)employment. The level of centralisation-corporatism of bargaining has beenviewed as a crucial variable in this context.
According to Bruno and Sachs (1985), there is a monotonic relationship be-tween the level of corporatism and economic performance, which reads that thehigher the level of corporatism the better the performance. A competing - and chal-lenging - contribution was formulated by Calmfors and Driffill (1988). They usea micro-economic model of an economy with many firms grouped into a numberof industries where workers are represented by unions in the collective bargain-ing. From fully decentralised to fully centralised, bargaining can take place at thelevel of the firm, at the level of the industry or nation-wide. Calmfors and Driffillsuggest the existence of a hump-shaped relationship between the degree of cen-tralisation (level of bargaining) and economic performance. They argue that bothcentralised and decentralised bargaining systems would work well in reducing thelevel of unemployment. Intermediate (industry) levels of negotiations would workpoorly. The argument reads as follows: in centralised environments “large and all-encompassing trade unions naturally recognise their market power and take intoaccount both inflationary and unemployment effects of wage increases. Conversely,unions operating at the individual firm or plant level have limited market power. Inintermediate cases, unions can exert some market power but are led to ignore themacroeconomic implications of their actions” (Calmfors and Driffill, 1988, p.13).
In both of these models wage formation is a key link variable. Calmfors andDriffill (1988) claim a hump-shaped relationship between real wage and central-isation, which through a downward-sloping demand for labour, translates into alikewise hump-shaped relationship between the degree of centralisation and thelevel of unemployment. Among countries this debate has strongly highlighted theimpact of differences in the level at which collective bargaining takes place. Insti-tutional wage setting arrangements can vary widely across countries (see Hartogand Theeuwes, 1993).
Even within each country, we can find different arrangements (see Stewart,1987, or Hartog et al., forthcoming). Most studies on the role of collective bargain-ing to wage formation have compared wage differentials or differences in the wagestructure between unionised and non-unionised workers, firms/plants or industries(see Lee, 1978; Bloch and Kuskin, 1978; Shah, 1984; Lewis, 1986; Robinson,1989). However, the structure of bargaining involves different types of bargain-ing arrangements in many European countries. Furthermore, in many cases thewage-effect of negotiated contracts exceeds union membership and goes beyondfirms represented at the bargaining table, by provisions of coverage extension. Theestimation of wage differentials between union and non-union members, or evenbetween firms represented and not represented in the negotiations may then bemeaningless (this argument is found in Hartog et al., forthcoming, and Teulings
Bargaining regimes and wages in Portugal 239
and Hartog, 1998). In this situation the analysis should determine whether or notthe unit of analysis is covered by a collective bargaining contract rather than portraya simple dichotomy between union and non-union members. This study deals withthe Portuguese case and intends to contribute to this scarce literature.
Negotiated contracts are widely extended by the government in Portugal. As aconsequence of this governmental action, most workers are covered by some formof collective bargaining. Only 1.9% and 1.3% of the workers were considered tobe uncovered by any regime in 1987 and 1991, respectively (MESS, Quadros dePessoal). This means that neither the distinction between union/non-union membersnor the distinction between covered and uncovered workers seems to provide asuitable cut-off for understanding the unions/collective bargaining wage-effect.The level at which bargaining takes place is a distinguishing feature, however.There are different types of bargaining regimes operating at different levels (e.g.single-firm, multi-firm and sectoral level). Hence, examining the impact of thevariety of institutional settings may be important to the understanding of the wage-determination process. Furthermore, it will elaborate upon the role of institutionsand particularly on the level at which collective bargaining takes place in wage-formation.
Although the work of Bruno and Sachs (1985) and Calmfors and Driffill (1988)have brought economists’ attention to institutional variation among countries withrespect to the level at which collective bargaining takes place, there are few stud-ies which acknowledge this feature within a single-country.1 This type of analysisbecomes even more intriguing when we acknowledge a shift towards more decen-tralised forms of bargaining in many western economies (see Hartog and Theeuwes,1993). In particular, we try to address the following issues: Is the level at whichbargaining occurs important for wage determination? How large are the wage-gapsbetween bargaining regimes, ceteris paribus? Are the gaps and rankings stableover time? What are the effects on the wage structure? How does wage dispersionvary by bargaining regime? How can the findings be related with the Portugueseinstitutional wage-setting?
It is reasonable to consider in advance the extent to which the bargaining regimewill affect wages. There are a number of theoretical models of wage/employmentdetermination in unionised labour markets. Empirical research has documentedthat union members receive higher wages relative to other equally-skilled workers.Unions apparently push wages up, but this issue remains controversial (see Lee,1978; Shah, 1984; Lewis, 1986; Robinson, 1989). There is, however, no solid theoryfor guiding the analysis of bargaining regimes as defined in the current study, butwe can analogise with the theoretical setting developed in Calmfors and Driffill(1988). Ceteris paribus, labour’s bargaining power would increase from single-firm, to multi-firm to sectoral negotiations. In such a framework we would thereforeexpect wages to increase from single-firm, to multi-firm to sectoral contracts. Thisfollows from assuming that these three points are on the upward sloping part ofthe Calmfors-Driffill parabola. Moving from single-firm to multi-firm to sectoral
1 Within this meagre literature we can mention the studies of Mulvey (1976), Stewart (1987) andHartog et al. (forthcoming).
240 J. Hartog et al.
contracts, the disciplining effect from competition in the product market diminishes,while the disciplining effect from internalising external effects (fully relevant at thenational level) does not yet kick in. With respect to the wage structure, few thingscan be expected in advance. There is however, the emerging notion that more-decentralised environments, i.e. firm level negotiations, generate steeper tenureprofiles. Tenure profiles are seen as a mechanism for extracting rents from thefirm (Kuhn, 1988), and increased bargaining power for labour (see above) allowsappropriating a greater share of the rents. However, we see no simple mechanismfor prediction with regard to the returns to education (see Teulings and Hartog,1998).
We should note that we only focus on the wage effect of the bargaining regime.Of course, effects on (un)employment are similarly important, as stressed in thebargaining literature in general, and in Calmfors and Driffill in particular. However,unemployment is not easily connected to a bargaining regime, as it is differentiatedby supply characteristics of the worker, and bargaining regime is not a workertrait. It would of course be interesting and relevant to consider the employmenteffect of bargaining regimes. But that is a very tough issue, as simple employmentsize comparison of bargaining regimes is not very meaningful, and measuring thecounterfactual is extremely difficult.
The paper is organised as follows. The next section describes the Portugueseinstitutional setting concerning wage bargaining. Section 3 describes the data andincludes selected descriptive statistics by bargaining regime. Section 4 includesestimated average wage differentials between bargaining regimes. Differences inreturns to individual and job-related attributes among bargaining regimes are thesubject of analysis in Section 5. Section 6 contains a decomposition of wage differ-entials between bargaining regimes. Finally, the main findings and issues requiringfurther research are presented in Section 7.
2 The institutional setting
There are in Portugal two workers’ confederations (UGT and CGTP) and a sig-nificant number of independent trade unions. The two existing confederations areorganised along political lines. However, the differences between them go beyondthe ideological-political polarisation. They are also differentiated by the organisa-tion of the affiliated trade unions. The UGT founded its own trade unions primarilyat a national level. This confederation is essentially made up of trade unions withoutintermediate organisations. The CGTP is based on many small trade unions organ-ised by districts. These are developed by the industries into national federations.The trade unions affiliated with the CGTP are assembled mostly at the industrylevel. Organisation at the level of profession or category is the norm in the UGT,although the number of industrial trade unions is quite high in this confederation.Independent trade unions are fundamentally established by profession or categoryand at a national level. There are few industrial trade unions within this group. Pinto(1990a) reports that the CGTP encompasses 150 trade unions, the UGT contains49, and 160 independent trade unions do not belong to any confederation.
Bargaining regimes and wages in Portugal 241
There are few constraints to starting a union and there is a fragmented tradeunion structure. Unions exist within a municipal, regional, or national scope, andothers are organised by industry or profession. Many overlapping trade unions com-pete for identical workers. Multi-unionism and fragmented collective bargainingarrangements are two marked features of Portuguese industrial relations. A study byCerdeira and Padilha (1990) reveals that 50.5% of the trade unions from the mid-1980s had 1,500 or fewer affiliated workers. Only 5.5% of the trade unions hadmore than 20,000 members. 75.7% of the trade unions were below the average size(4,000 members). Large and all-encompassing trade unions are not predominant inPortuguese industrial relations.
There are no good data on union membership in Portugal (trade unions are notrequired to report their membership). The OECD (1994a) provides values of 60.8%(1978), 60.7% (1984) and 31.8% (1990). These figures indicate a sharp drop in therate of unionisation during the 1980s. The OECD (1994a) ranks Portugal as havinga low level of unionisation in 1990 if compared to other western countries. It isworth mentioning that the rate of unionisation depends upon economic activity.According to the data in Cerdeira and Padilha (1990), the lowest rates are found insectors such as agriculture, construction, mining and quarrying. The highest unionmemberships exist in banking and insurance (around 99%). It is also very high(above 70%) in other concentrated sectors of manufacturing and services such astransport and communications; electricity; chemical products; food, beverages; andtobacco; and the textiles, clothing and footwear industries.
There are three employer confederations divided on the basis of broad eco-nomic activity: trade (CCP), industry (CIP), and agriculture (CAP). The CAP atone time represented 76 regional farmers’ associations, 16 specialised associationsand 12 cooperatives. The CIP represented 76 regional or sectoral associations. TheCCP had 137 associations (Pinto, 1990a). It is noteworthy that the organisation ofthe employers associations plays a crucial role in defining the bargaining unit inPortugal. These are normally organised at the sectoral-regional level. Furthermore,they are very fragmented within industries and across regions.
The right to bargain and sign collective agreements is recognised and permittedat all levels of the employers’ and workers’ organisations described above, as well asat the firm level. However, the main workers’ organisations involved in negotiationshave been trade unions and federations. On the employer side, the agents involvedin negotiations have been the sectoral associations or the enterprise. The tradeunions or their federations normally initiate the bargaining process by submitting aproposal. Although the employers’ and workers’ confederations can negotiate andsign collective contracts, they have not done so. They may, however, have a roleduring the negotiations, particularly as advisors to the participating organisations.More recently, the confederations have been granted access to discussions at thelevel of the Economic and Social Council. However, the power within the workers’and employers’ organisations is quite decentralised and, as a consequence, baseunions and the associations are extremely influential in the negotiations.
A worker is covered by a specific collective agreement if and only if he or sheis affiliated with the respective workers’ organisation and the firm where she worksor its association has signed the contract. Despite this constraint, most Portuguese
242 J. Hartog et al.
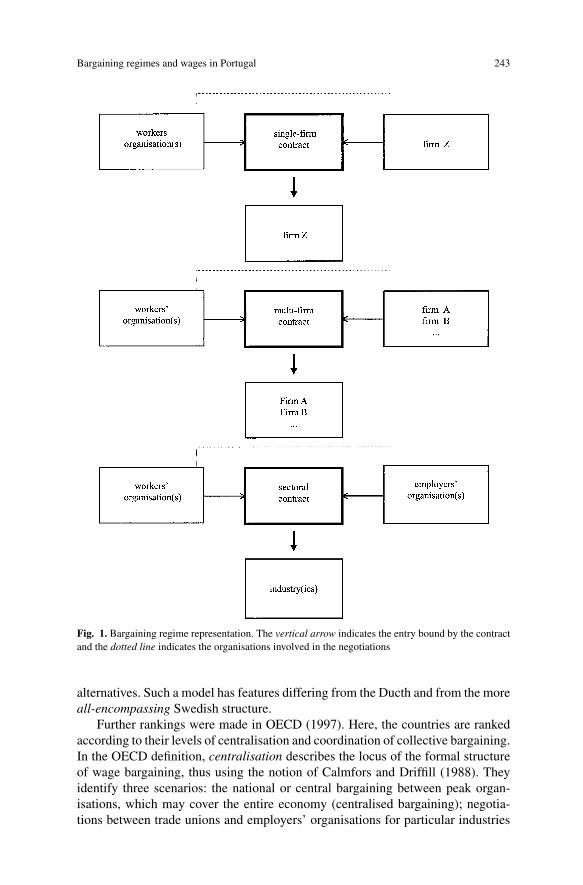
workers are covered by some type of bargaining regime. This is because the govern-ment widely extends negotiated contracts to otherwise uncovered workers and/orfirms within the bargaining unit through a mandatory extension. Collective bargain-ing normally determines minimum wages for each category or group of workers.Negotiated contracts are not ordinarily supplemented by local collective negotia-tions, but employers can, at their discretion, pay their workers at a rate above theagreed-upon floors.The institutional setting yields three relevant bargaining regimesin the private sector and public companies. Firstly, a company can negotiate its owncollective agreement with one or several unions (single-firm contracts). Secondly,several companies can form a coalition and negotiate together with the trade unions(multi-firm contracts). Thirdly, employers associations, normally organised at theindustry level may negotiate with the trade unions (sectoral contracts). The gov-ernment can use compulsory regimes to regulate working conditions and wagesetting if negotiations fail or in the absence of workers’ organisations. This regimeis imposed by the government and does not result from direct negotiations betweenworkers’ and employers’ organisations (see Fig. 1).
Several authors have developed rankings of national labour markets with re-spect to the degree of corporatism or centralisation (Blyth, 1979; Lehmbruch, 1984;Bruno and Sachs, 1985; Tarantelli, 1986; Calmfors and Driffill, 1988). The authorsemphasise different factors comprising the process of collective bargaining, such asthe level at which bargaining occurs, the extent of coordination within national tradeunion confederations and national employer organisations, the extent of unionisa-tion, the degree of political and ideological consensus, and the existence of tripartitenegotiations between the government and workers’ and employers’ organisations.According to those rankings, the wage bargaining systems of the OECD countriesreveal great differences.
The bulk of collective bargaining in Portugal takes place at a sectoral leveland the contracts are widely extended within the bargaining unit by the govern-ment (through mandatory extensions). From this perspective, the Portuguese set-ting would appear to be similar to other European countries such as the Netherlandsand Germany, but upon further investigation we see that Portugal was not includedin corporatism/centralisation rankings referred to by Calmfors and Driffill (1988),Bruno and Sachs (1985), or Blyth (1979). The OECD has made recent attempts,but it did not reduce the final conclusion to a single number.
The OECD (1994b) classifies countries according to the level of bargaining(central, sectoral, or firm/plant) and coordination between bargaining units (lack-ing, limited or high) in the 1980s. Portugal, the Netherlands, France, Denmark,Spain, Sweden, and Switzerland fall into the group of countries combining sectoralwage bargaining as the predominant form with limited coordination between bar-gaining units. Despite broad similarities among these countries, they may also showrelative differences (a comparison of the institutional settings among these coun-tries can be found in Hartog and Theeuwes, 1993). For instance, although sectoralagreements are predominant in Portugal, many of them only have an occupationalscope within the industry. There is often more than one contract within a sectordiffering by occupation, region, trade union affiliation or by combinations of these
Bargaining regimes and wages in Portugal 243
Fig. 1. Bargaining regime representation. The vertical arrow indicates the entry bound by the contractand the dotted line indicates the organisations involved in the negotiations
alternatives. Such a model has features differing from the Ducth and from the moreall-encompassing Swedish structure.
Further rankings were made in OECD (1997). Here, the countries are rankedaccording to their levels of centralisation and coordination of collective bargaining.In the OECD definition, centralisation describes the locus of the formal structureof wage bargaining, thus using the notion of Calmfors and Driffill (1988). Theyidentify three scenarios: the national or central bargaining between peak organ-isations, which may cover the entire economy (centralised bargaining); negotia-tions between trade unions and employers’ organisations for particular industries
244 J. Hartog et al.
or occupations (intermediate bargaining); and firm-level bargaining between tradeunions and management (decentralised bargaining). On the other hand, coordina-tion is the degree of consensus among the collective bargaining partners. This relieson the notion of Soskice (1990), who uses the argument that bargaining may bewell-coordinated even when it is decentralised. Although there are exceptions, therankings for centralisation and coordination largely agree with those proposed byCalmfors and Driffill (1988), Bruno and Sachs (1985), and Blyth (1979). Accord-ing to these rankings a change has occurred in Portugal. According to the index ofcentralisation, the country shifted from low to high centralisation during the 1980s,but the shift in the coordination ranking is more modest: from low to intermediate.
Although industrial relations became more centralised and coordinated in Por-tugal throughout the 1980s, this phenomenon requires further examination. Thereis further opportunity for coordination and centralisation. Our goal here is notto reduce all available information for Portugal to a single number in the corpo-ratism/centralisation rankings. Rather than suggest exact position on the scale, ouraim is to add to the discussion about the degree to which corporatism/centralisationbest describes Portugal’s labour market.Tripartite negotiations are the essence of thePortuguese corporatist centralisation. A neo-corporatist setting was implementedin 1983-1984, but its role may still be limited in terms of income and wage policies.For instance, social pacts involving wage guidelines were signed in 1986, 1988,1990, and 1992, but one workers’ confederation (CGTP) refused to sign any ofthem. The industry’s confederation did not sign the pact in 1988. The workers’confederation UGT initially signed the pact, but later reneged on it.
Insofar as wages were concerned, social pacts merely set guidelines for thenational average (proportional) wage increase. However, it is not apparent how thisis to be distributed at the lower levels of negotiations. Furthermore, employers’confederations have sometimes participated in social forums but have shown littleinterest in income policies emerging from them. The employers’ principal objectivein tripartite negotiations has been to reform labour market legislation rather than tocentralise pay (Barreto, 1992, p. 479). Given the very decentralised nature of em-ployers’ and workers’ organisations, the confederate bodies lack the authority toenforce strict income policies among their affiliates. There are also many indepen-dent trade unions which do not belong to any confederation. We must also considerthe fragmented and overlapping trade union structure, the fragmented employerassociations and the multiplicity of bargaining units lacking strong coordination.The institutional system allows for a high level of decentralisation and considerableflexibility to respond to differences in market conditions across narrowly definedindustries, occupations and geographical areas. In practice, collective bargainingin Portugal is not as decentralised/uncoordinated as in the U.S., but it is also dif-ferent from the centralised/coordinated Scandinavian countries. Although changesoccurred at the collective bargaining level throughout the 1980s, the system maystill be rather decentralised/uncoordinated. There is latitude for more concertedindustrial relations.
Bargaining regimes and wages in Portugal 245
3 Data and selected descriptive statistics by bargaining regime
The data used here were drawn from Quadros de Pessoal for 1986 and 1992. This is aperiod of expansion of the economic activity, following a crisis that hit the countryduring the first half of the 1980s. The economy grew rapidly and employmentexpanded. The unemployment rate decreased from 8.4% in 1986 to 4.1% in 1992.It is also a period during which Portugal joined the European Union (in 1986) andembarked upon a path of liberalisation and modernisation of the economy.
Quadros de Pessoal is a standardised questionnaire which all firms with wageearners must complete every year for the Department of Labour. The data refer toMarch of each year and include information on individual workers such as age,tenure with the current firm, the highest completed level of education, and gender.Information is also available on firm size, industry, region, bargaining regime, firmownership structure, job complexity and hours worked. It also includes informa-tion on workers’ monthly wages. Years of education were calculated by attributingthe nominal number of completed years in order to complete the level reported inthe data. Potential labour market experience was computed as age minus years ofeducation minus six. Data on firm age were gathered from an external file usedin MESS-DE (1994). Civil servants and others serving in the armed forces arenot included in the data source. Each random sample contains more than 50,000observations of full-time, non-agricultural and non-fishermen workers between 14and 65 years of age. Records with missing values were deleted from the originalsamples, as were part-timers, the self-employed, unpaid family workers and ap-prentices. Also deleted were observations in which tenure was greater than labourmarket experience.
The data contain information on the four bargaining regimes mentioned in Sec-tion 2. These are defined at a firm level. The available data may have shortcomings.Firstly, the data-set does not contain any information on whether or not the workeris affiliated with a union. This does not seem to be particularly disturbing, sincemost contracts are extended to otherwise uncovered workers and firms. Secondly,it is not possible to differentiate between workers who are covered by a specifictype of collective bargaining contract, or those covered by its extension resultingfrom a mandatory government extension. This limitation is inevitable. Thirdly, it isimpossible to disentangle the roles of important features of the Portuguese indus-trial relations, such as whether the contract is vertical or horizontal and regional ornational. Finally, when the firm is covered by a given type of bargaining regime, topmanagement is also thought to be covered by it. There is some belief that this typeof worker is more bound by individual rather than by collective negotiations. Weknow very little, however, about formal rules for exclusion of this type of workerfrom the collective bargaining, however.2
2 A preliminary test was performed to assess the importance of bargaining regimes for wage deter-mination of managers and higher clerical staff. A wage equation was estimated for this specific groupof workers. The equation included covariates for education, experience, tenure with the firm, gender,hours worked, firm size, firm age, firm ownership, region, industry affiliation of the firm, and bargainingregimes. The null hypothesis that the bargaining regime parameters are jointly equal to zero is rejectedat the 5% level in both years through an F-test. But it is not rejected at the 1% level in 1992.
246 J. Hartog et al.
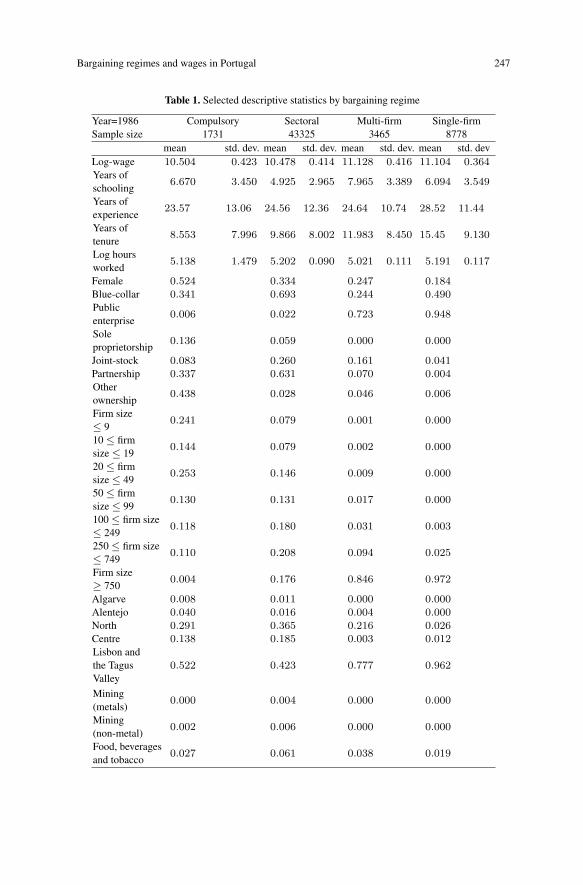
Table 1 contains selected descriptive statistics by bargaining regime. As we cansee, single-firm and multi-firm contracts have a higher sample average wage rate(the latter regime has the highest average). In terms of wage dispersion (measured bythe standard deviations of log-wages), the highest value is generated in compulsorygovernment regimes and the lowest value in single-firm contracts. Wage dispersionincreased within all bargaining regimes from 1986 to 1992. The changes were morepronounced in the compulsory regimes and sectoral contracts (the standard devia-tion increased by about 17.0%). The lowest proportional increase was in multi-firmcontracts (3.8%). Single-firm contracts align between these two extremes (11.8%).
The highest average years of education are found in single- and multi-firmbargaining regimes in 1992, but not in 1986 (with the exception of multi-firmcontracts). The lowest value for average years of education is found for workers infirms covered by sectoral negotiations. If one excludes the compulsory governmentregime, results reveal that workers in firms covered by sectoral bargaining have onaverage lower education, while those in firms covered by single- and multi-firmbargaining have on higher average education (multi-firm has the highest average).
Workers covered by multi-firm and single-firm contracts also stand apart fromthe other regimes with regard to average tenure. The sub-samples of workers cov-ered by these regimes show a larger average tenure. As will be discussed later, theseregimes appear more often in large firms, in public enterprises and in certain sec-tors. The existence of rents in these firms/sectors may eventually keep the workerswith the firm longer. The compulsory government regime presents on average theleast tenured workers. With respect to labour market experience, the single-firmagreement really stands apart. The lowest average years of experience is found forthe compulsory government regime.
Single- and multi-firm bargaining are more likely to occur as firm size increases.As one can see, there is a clear pattern between the chosen firm type of bargainingcoverage and firm size. Workers covered by single- and multi-firm negotiationswork mostly in large firms (more than 750 workers). The majority of those coveredby sectoral negotiations are in medium-large firms. The compulsory governmentregime is mostly concentrated in small-medium firms.
With respect to regions, the majority of workers covered by any of the bargainingregimes work in Lisbon and the Tagus Valley. The lowest numbers of workers arefound in Alentejo and Algarve. This distribution follows the regional pattern ofthe Portuguese population density. The dominant regions by bargaining regimeare: single-firm (Lisbon and the Tagus Valley), multi-firm (Lisbon and the TagusValley, and North), sectoral and compulsory regimes (Lisbon and the Tagus Valley,and North and Centre).
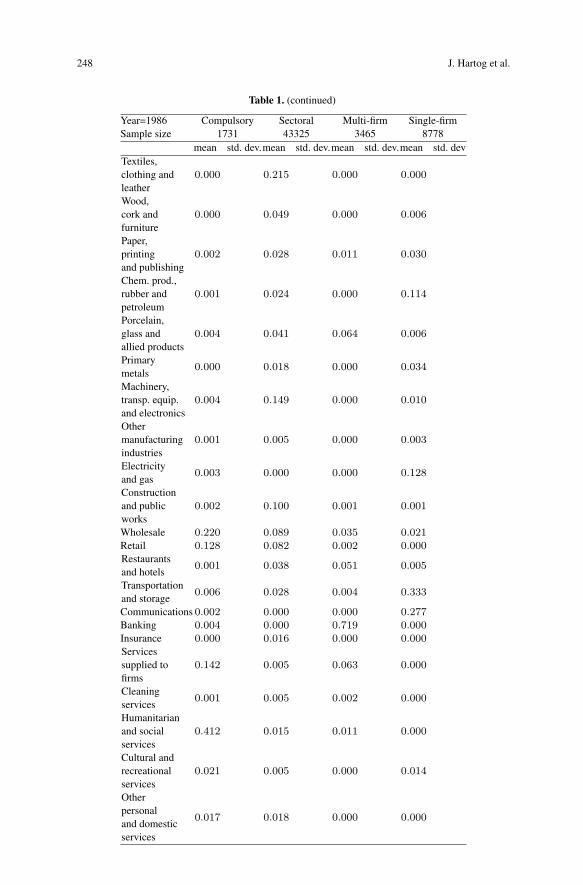
It is also possible to identify the main economic activities within each regime.The compulsory regime is dominated by wholesale, retail, services supplied tofirms, and humanitarian and social services. For sectoral agreements, one may high-light textiles, clothing and leather, machinery, transport equipment and electronics,and construction and public works. Banking is the dominant activity in terms ofcoverage by multi-firm contracts. With respect to single-firm contracts, the mainactivities are chemical products and petroleum, electricity and gas, transportationand communications.
Bargaining regimes and wages in Portugal 247
Table 1. Selected descriptive statistics by bargaining regime
Year=1986 Compulsory Sectoral Multi-firm Single-firmSample size 1731 43325 3465 8778
mean std. dev. mean std. dev. mean std. dev. mean std. devLog-wage 10.504 0.423 10.478 0.414 11.128 0.416 11.104 0.364Years ofschooling
6.670 3.450 4.925 2.965 7.965 3.389 6.094 3.549
Years ofexperience
23.57 13.06 24.56 12.36 24.64 10.74 28.52 11.44
Years oftenure
8.553 7.996 9.866 8.002 11.983 8.450 15.45 9.130
Log hoursworked
5.138 1.479 5.202 0.090 5.021 0.111 5.191 0.117
Female 0.524 0.334 0.247 0.184Blue-collar 0.341 0.693 0.244 0.490Publicenterprise
0.006 0.022 0.723 0.948
Soleproprietorship
0.136 0.059 0.000 0.000
Joint-stock 0.083 0.260 0.161 0.041Partnership 0.337 0.631 0.070 0.004Otherownership
0.438 0.028 0.046 0.006
Firm size≤ 9
0.241 0.079 0.001 0.000
10 ≤ firmsize ≤ 19
0.144 0.079 0.002 0.000
20 ≤ firmsize ≤ 49
0.253 0.146 0.009 0.000
50 ≤ firmsize ≤ 99
0.130 0.131 0.017 0.000
100 ≤ firm size≤ 249
0.118 0.180 0.031 0.003
250 ≤ firm size≤ 749
0.110 0.208 0.094 0.025
Firm size≥ 750
0.004 0.176 0.846 0.972
Algarve 0.008 0.011 0.000 0.000Alentejo 0.040 0.016 0.004 0.000North 0.291 0.365 0.216 0.026Centre 0.138 0.185 0.003 0.012Lisbon andthe TagusValley
0.522 0.423 0.777 0.962
Mining(metals)
0.000 0.004 0.000 0.000
Mining(non-metal)
0.002 0.006 0.000 0.000
Food, beveragesand tobacco
0.027 0.061 0.038 0.019
248 J. Hartog et al.
Table 1. (continued)
Year=1986 Compulsory Sectoral Multi-firm Single-firmSample size 1731 43325 3465 8778
mean std. dev.mean std. dev.mean std. dev.mean std. devTextiles,clothing andleather
0.000 0.215 0.000 0.000
Wood,cork andfurniture
0.000 0.049 0.000 0.006
Paper,printingand publishing
0.002 0.028 0.011 0.030
Chem. prod.,rubber andpetroleum
0.001 0.024 0.000 0.114
Porcelain,glass andallied products
0.004 0.041 0.064 0.006
Primarymetals
0.000 0.018 0.000 0.034
Machinery,transp. equip.and electronics
0.004 0.149 0.000 0.010
Othermanufacturingindustries
0.001 0.005 0.000 0.003
Electricityand gas
0.003 0.000 0.000 0.128
Constructionand publicworks
0.002 0.100 0.001 0.001
Wholesale 0.220 0.089 0.035 0.021Retail 0.128 0.082 0.002 0.000Restaurantsand hotels
0.001 0.038 0.051 0.005
Transportationand storage
0.006 0.028 0.004 0.333
Communications 0.002 0.000 0.000 0.277Banking 0.004 0.000 0.719 0.000Insurance 0.000 0.016 0.000 0.000Servicessupplied tofirms
0.142 0.005 0.063 0.000
Cleaningservices
0.001 0.005 0.002 0.000
Humanitarianand socialservices
0.412 0.015 0.011 0.000
Cultural andrecreationalservices
0.021 0.005 0.000 0.014
Otherpersonaland domesticservices
0.017 0.018 0.000 0.000
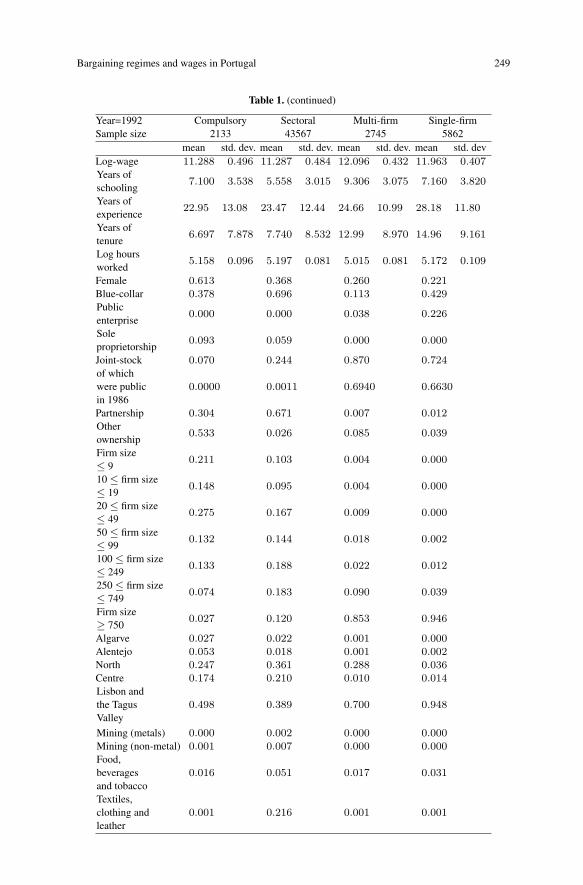
Bargaining regimes and wages in Portugal 249
Table 1. (continued)
Year=1992 Compulsory Sectoral Multi-firm Single-firmSample size 2133 43567 2745 5862
mean std. dev. mean std. dev. mean std. dev. mean std. devLog-wage 11.288 0.496 11.287 0.484 12.096 0.432 11.963 0.407Years ofschooling
7.100 3.538 5.558 3.015 9.306 3.075 7.160 3.820
Years ofexperience
22.95 13.08 23.47 12.44 24.66 10.99 28.18 11.80
Years oftenure
6.697 7.878 7.740 8.532 12.99 8.970 14.96 9.161
Log hoursworked
5.158 0.096 5.197 0.081 5.015 0.081 5.172 0.109
Female 0.613 0.368 0.260 0.221Blue-collar 0.378 0.696 0.113 0.429Publicenterprise
0.000 0.000 0.038 0.226
Soleproprietorship
0.093 0.059 0.000 0.000
Joint-stock 0.070 0.244 0.870 0.724of whichwere publicin 1986
0.0000 0.0011 0.6940 0.6630
Partnership 0.304 0.671 0.007 0.012Otherownership
0.533 0.026 0.085 0.039
Firm size≤ 9
0.211 0.103 0.004 0.000
10 ≤ firm size≤ 19
0.148 0.095 0.004 0.000
20 ≤ firm size≤ 49
0.275 0.167 0.009 0.000
50 ≤ firm size≤ 99
0.132 0.144 0.018 0.002
100 ≤ firm size≤ 249
0.133 0.188 0.022 0.012
250 ≤ firm size≤ 749
0.074 0.183 0.090 0.039
Firm size≥ 750
0.027 0.120 0.853 0.946
Algarve 0.027 0.022 0.001 0.000Alentejo 0.053 0.018 0.001 0.002North 0.247 0.361 0.288 0.036Centre 0.174 0.210 0.010 0.014Lisbon andthe TagusValley
0.498 0.389 0.700 0.948
Mining (metals) 0.000 0.002 0.000 0.000Mining (non-metal) 0.001 0.007 0.000 0.000Food,beveragesand tobacco
0.016 0.051 0.017 0.031
Textiles,clothing andleather
0.001 0.216 0.001 0.001
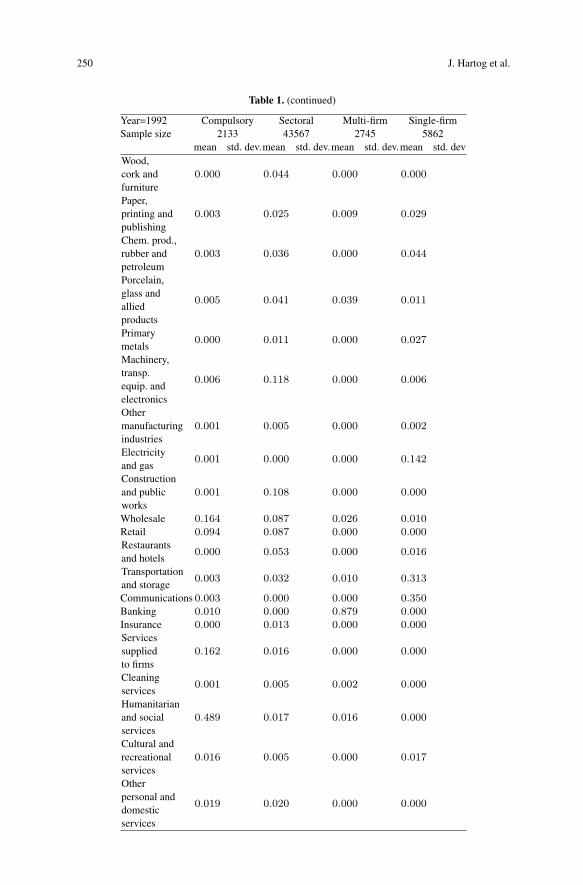
250 J. Hartog et al.
Table 1. (continued)
Year=1992 Compulsory Sectoral Multi-firm Single-firmSample size 2133 43567 2745 5862
mean std. dev.mean std. dev.mean std. dev.mean std. devWood,cork andfurniture
0.000 0.044 0.000 0.000
Paper,printing andpublishing
0.003 0.025 0.009 0.029
Chem. prod.,rubber andpetroleum
0.003 0.036 0.000 0.044
Porcelain,glass andalliedproducts
0.005 0.041 0.039 0.011
Primarymetals
0.000 0.011 0.000 0.027
Machinery,transp.equip. andelectronics
0.006 0.118 0.000 0.006
Othermanufacturingindustries
0.001 0.005 0.000 0.002
Electricityand gas
0.001 0.000 0.000 0.142
Constructionand publicworks
0.001 0.108 0.000 0.000
Wholesale 0.164 0.087 0.026 0.010Retail 0.094 0.087 0.000 0.000Restaurantsand hotels
0.000 0.053 0.000 0.016
Transportationand storage
0.003 0.032 0.010 0.313
Communications 0.003 0.000 0.000 0.350Banking 0.010 0.000 0.879 0.000Insurance 0.000 0.013 0.000 0.000Servicessuppliedto firms
0.162 0.016 0.000 0.000
Cleaningservices
0.001 0.005 0.002 0.000
Humanitarianand socialservices
0.489 0.017 0.016 0.000
Cultural andrecreationalservices
0.016 0.005 0.000 0.017
Otherpersonal anddomesticservices
0.019 0.020 0.000 0.000
Bargaining regimes and wages in Portugal 251
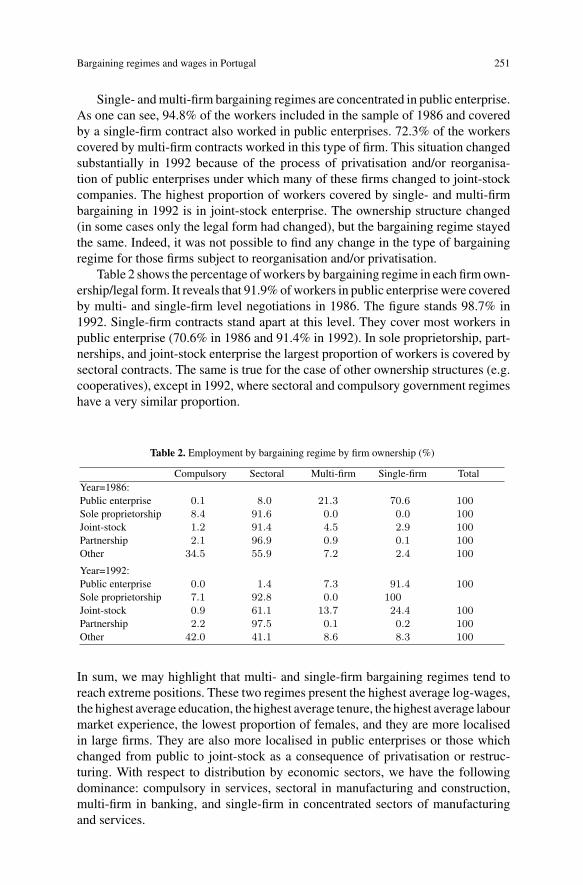
Single- and multi-firm bargaining regimes are concentrated in public enterprise.As one can see, 94.8% of the workers included in the sample of 1986 and coveredby a single-firm contract also worked in public enterprises. 72.3% of the workerscovered by multi-firm contracts worked in this type of firm. This situation changedsubstantially in 1992 because of the process of privatisation and/or reorganisa-tion of public enterprises under which many of these firms changed to joint-stockcompanies. The highest proportion of workers covered by single- and multi-firmbargaining in 1992 is in joint-stock enterprise. The ownership structure changed(in some cases only the legal form had changed), but the bargaining regime stayedthe same. Indeed, it was not possible to find any change in the type of bargainingregime for those firms subject to reorganisation and/or privatisation.
Table 2 shows the percentage of workers by bargaining regime in each firm own-ership/legal form. It reveals that 91.9% of workers in public enterprise were coveredby multi- and single-firm level negotiations in 1986. The figure stands 98.7% in1992. Single-firm contracts stand apart at this level. They cover most workers inpublic enterprise (70.6% in 1986 and 91.4% in 1992). In sole proprietorship, part-nerships, and joint-stock enterprise the largest proportion of workers is covered bysectoral contracts. The same is true for the case of other ownership structures (e.g.cooperatives), except in 1992, where sectoral and compulsory government regimeshave a very similar proportion.
Table 2. Employment by bargaining regime by firm ownership (%)
Compulsory Sectoral Multi-firm Single-firm TotalYear=1986:Public enterprise 0.1 8.0 21.3 70.6 100Sole proprietorship 8.4 91.6 0.0 0.0 100Joint-stock 1.2 91.4 4.5 2.9 100Partnership 2.1 96.9 0.9 0.1 100Other 34.5 55.9 7.2 2.4 100
Year=1992:Public enterprise 0.0 1.4 7.3 91.4 100Sole proprietorship 7.1 92.8 0.0 100Joint-stock 0.9 61.1 13.7 24.4 100Partnership 2.2 97.5 0.1 0.2 100Other 42.0 41.1 8.6 8.3 100
In sum, we may highlight that multi- and single-firm bargaining regimes tend toreach extreme positions. These two regimes present the highest average log-wages,the highest average education, the highest average tenure, the highest average labourmarket experience, the lowest proportion of females, and they are more localisedin large firms. They are also more localised in public enterprises or those whichchanged from public to joint-stock as a consequence of privatisation or restruc-turing. With respect to distribution by economic sectors, we have the followingdominance: compulsory in services, sectoral in manufacturing and construction,multi-firm in banking, and single-firm in concentrated sectors of manufacturingand services.
252 J. Hartog et al.
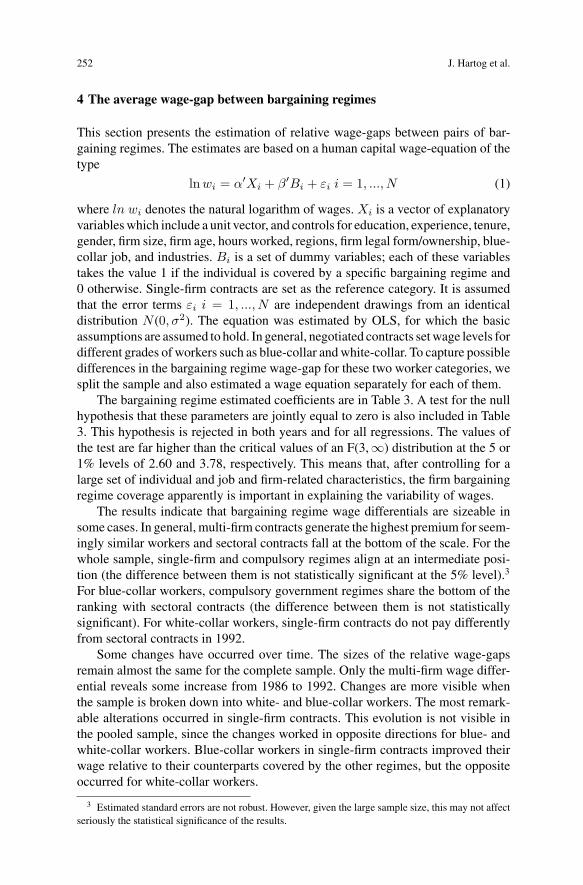
4 The average wage-gap between bargaining regimes
This section presents the estimation of relative wage-gaps between pairs of bar-gaining regimes. The estimates are based on a human capital wage-equation of thetype
lnwi = α′Xi + β′Bi + εi i = 1, ..., N (1)
where ln wi denotes the natural logarithm of wages. Xi is a vector of explanatoryvariables which include a unit vector, and controls for education, experience, tenure,gender, firm size, firm age, hours worked, regions, firm legal form/ownership, blue-collar job, and industries. Bi is a set of dummy variables; each of these variablestakes the value 1 if the individual is covered by a specific bargaining regime and0 otherwise. Single-firm contracts are set as the reference category. It is assumedthat the error terms εi i = 1, ..., N are independent drawings from an identicaldistribution N (0, σ2). The equation was estimated by OLS, for which the basicassumptions are assumed to hold. In general, negotiated contracts set wage levels fordifferent grades of workers such as blue-collar and white-collar. To capture possibledifferences in the bargaining regime wage-gap for these two worker categories, wesplit the sample and also estimated a wage equation separately for each of them.
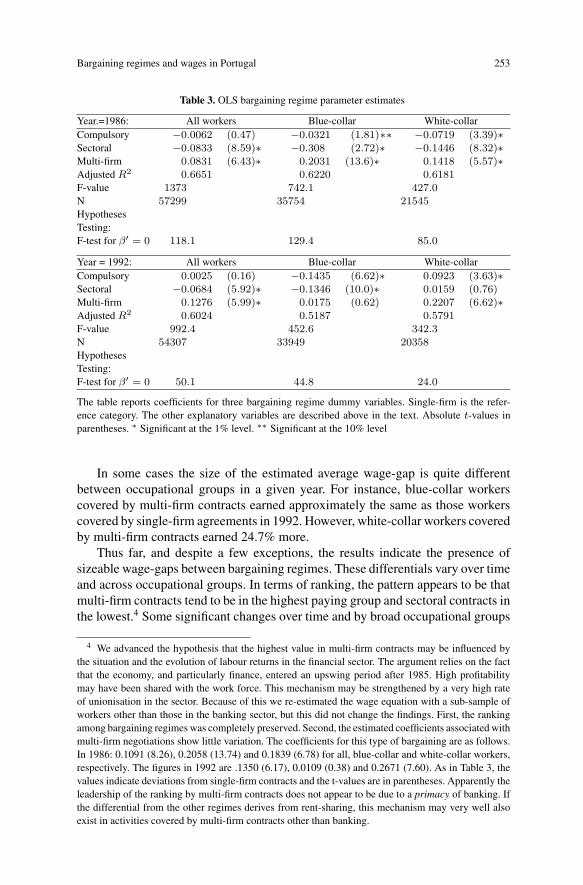
The bargaining regime estimated coefficients are in Table 3. A test for the nullhypothesis that these parameters are jointly equal to zero is also included in Table3. This hypothesis is rejected in both years and for all regressions. The values ofthe test are far higher than the critical values of an F(3, ∞) distribution at the 5 or1% levels of 2.60 and 3.78, respectively. This means that, after controlling for alarge set of individual and job and firm-related characteristics, the firm bargainingregime coverage apparently is important in explaining the variability of wages.
The results indicate that bargaining regime wage differentials are sizeable insome cases. In general, multi-firm contracts generate the highest premium for seem-ingly similar workers and sectoral contracts fall at the bottom of the scale. For thewhole sample, single-firm and compulsory regimes align at an intermediate posi-tion (the difference between them is not statistically significant at the 5% level).3
For blue-collar workers, compulsory government regimes share the bottom of theranking with sectoral contracts (the difference between them is not statisticallysignificant). For white-collar workers, single-firm contracts do not pay differentlyfrom sectoral contracts in 1992.
Some changes have occurred over time. The sizes of the relative wage-gapsremain almost the same for the complete sample. Only the multi-firm wage differ-ential reveals some increase from 1986 to 1992. Changes are more visible whenthe sample is broken down into white- and blue-collar workers. The most remark-able alterations occurred in single-firm contracts. This evolution is not visible inthe pooled sample, since the changes worked in opposite directions for blue- andwhite-collar workers. Blue-collar workers in single-firm contracts improved theirwage relative to their counterparts covered by the other regimes, but the oppositeoccurred for white-collar workers.
3 Estimated standard errors are not robust. However, given the large sample size, this may not affectseriously the statistical significance of the results.
Bargaining regimes and wages in Portugal 253
Table 3. OLS bargaining regime parameter estimates
Year.=1986: All workers Blue-collar White-collarCompulsory −0.0062 (0.47) −0.0321 (1.81)∗∗ −0.0719 (3.39)∗Sectoral −0.0833 (8.59)∗ −0.308 (2.72)∗ −0.1446 (8.32)∗Multi-firm 0.0831 (6.43)∗ 0.2031 (13.6)∗ 0.1418 (5.57)∗Adjusted R2 0.6651 0.6220 0.6181F-value 1373 742.1 427.0N 57299 35754 21545HypothesesTesting:F-test for β′ = 0 118.1 129.4 85.0
Year = 1992: All workers Blue-collar White-collarCompulsory 0.0025 (0.16) −0.1435 (6.62)∗ 0.0923 (3.63)∗Sectoral −0.0684 (5.92)∗ −0.1346 (10.0)∗ 0.0159 (0.76)Multi-firm 0.1276 (5.99)∗ 0.0175 (0.62) 0.2207 (6.62)∗Adjusted R2 0.6024 0.5187 0.5791F-value 992.4 452.6 342.3N 54307 33949 20358HypothesesTesting:F-test for β′ = 0 50.1 44.8 24.0
The table reports coefficients for three bargaining regime dummy variables. Single-firm is the refer-ence category. The other explanatory variables are described above in the text. Absolute t-values inparentheses. ∗ Significant at the 1% level. ∗∗ Significant at the 10% level
In some cases the size of the estimated average wage-gap is quite differentbetween occupational groups in a given year. For instance, blue-collar workerscovered by multi-firm contracts earned approximately the same as those workerscovered by single-firm agreements in 1992. However, white-collar workers coveredby multi-firm contracts earned 24.7% more.
Thus far, and despite a few exceptions, the results indicate the presence ofsizeable wage-gaps between bargaining regimes. These differentials vary over timeand across occupational groups. In terms of ranking, the pattern appears to be thatmulti-firm contracts tend to be in the highest paying group and sectoral contracts inthe lowest.4 Some significant changes over time and by broad occupational groups
4 We advanced the hypothesis that the highest value in multi-firm contracts may be influenced bythe situation and the evolution of labour returns in the financial sector. The argument relies on the factthat the economy, and particularly finance, entered an upswing period after 1985. High profitabilitymay have been shared with the work force. This mechanism may be strengthened by a very high rateof unionisation in the sector. Because of this we re-estimated the wage equation with a sub-sample ofworkers other than those in the banking sector, but this did not change the findings. First, the rankingamong bargaining regimes was completely preserved. Second, the estimated coefficients associated withmulti-firm negotiations show little variation. The coefficients for this type of bargaining are as follows.In 1986: 0.1091 (8.26), 0.2058 (13.74) and 0.1839 (6.78) for all, blue-collar and white-collar workers,respectively. The figures in 1992 are .1350 (6.17), 0.0109 (0.38) and 0.2671 (7.60). As in Table 3, thevalues indicate deviations from single-firm contracts and the t-values are in parentheses. Apparently theleadership of the ranking by multi-firm contracts does not appear to be due to a primacy of banking. Ifthe differential from the other regimes derives from rent-sharing, this mechanism may very well alsoexist in activities covered by multi-firm contracts other than banking.
254 J. Hartog et al.
can be emphasized. A decrease of premium associated with single-firm contracts’wages within the white-collar group is visible over time. An improvement occurredwithin the blue-collar category. It is unknown whether these alterations can belinked with those which occurred in the legal and economic environment. Indeed,changes over this period may have contributed to decrease union bargaining powerwhile others may very well have worked in the opposite direction. For instance,the power of unions to exploit local rents could have been reduced by relaxingfiring restrictions, the existence of social contracts, or the introduction of morecompetition in the product markets. But at the same time, this may have been offsetby the prevailing very tight labour market conditions and fast economic growth (fora summary of these developments see Vieira, 1999). Therefore, it is difficult withthe current data to de-couple the effects of regulatory changes from those arisingfrom changing macroeconomic conditions.
5 Differences in the rewards to individual and job attributes
The previous section merely analysed differences in wage levels among bargainingregimes. The main concern of this section is to go a step further and analyse the effectof the bargaining regime on the rewards to individual and job related attributes (i.e.on the wage structure). In order to analyse how those rewards vary across bargainingregimes, the sample was split into four bargaining regimes and a wage equation foreach was estimated by OLS.5 The estimated wage equations are of the type
lnwij = γ′jXij + ωij j = 1, 2, 3, 4 (2)
where Xij is a set of explanatory variables (including a vector of ones), γj arevectors of unknown parameters to be estimated, and ωij are random errors whichare assumed to be independent drawings from an identical N(0,σ2) distribution.The subscripts i and j index individual workers and the corresponding bargainingregime, respectively. Because of the small sample size in some cases, we do notestimate separate versions of equation (2) for white- and blue-collar workers. Weonly break down the sample by bargaining regime and include in the regressors
5 Such an analysis may be undermined by a selection bias problem. The typical situation of selectivityis when the outcome variable is observed for only one part of the original sample. Estimates obtainedby conventional linear regression techniques from the sub-sample with complete observations may failto give consistent parameters for the population. This occurs because of (endogenous) selection of theindividuals in a particular regime. That inconsistency occurs if the disturbances of the individuals’selection equation and those of the outcome equation are correlated. The data set includes informationon wages for individuals employed in firms covered by a particular bargaining regime. In such a case,the bargaining regime may be regarded as a characteristic of the firm (in the same way that firm sizeis). Selectivity of the workers in a given bargaining regime can be conceived of in a context in whichindividuals maximise wages and choose the firm/bargaining regime which provides them with thehighest wage. There may be unobservable characteristics that influence the probability of being selectedinto a certain bargaining regime aside from the potential wage rate in the respective regime. Lee (1983)proposes a method for dealing with this type of problem. Largely because the data set has no variablesthat can be used as satisfactory identifying restrictions in the correction technique, the present analysisignores any correction. We did not want to rely on functional form. Moreover, we do not have the strongconviction that selectivity bias is relevant here.
Bargaining regimes and wages in Portugal 255
list a dummy variable indicating whether the individual performs a blue-collar job.Furthermore, the interaction of this variable with education, experience, tenure, andfirm size is analysed so as to capture differences in the rewards to these character-istics between the two skill groups by bargaining regime.
The estimation results for equation (2) are in Tables 1A to 3A in the Appendix.It is quite interesting to look at the standard error of the regressions. Let us considerthe results in Table 2A. As we can see, the standard error of the regression is system-atically lower in multi- and single firm negotiations. This would suggest that unionsreduce inequality resulting from unobserved attributes when negotiating close tothe firm level. But one may also suspect that the real reason possibly relies uponspecific attributes of the firms involved in this type of bargaining. There may be ahigher capacity for monitoring the wage effectively paid by reducing the capacityof the employer to adjust wages. Different from small firms, large firms typicallyhave internal unions’ representatives and workers’ committees which may work toweaken discretionary wage management policies for seemingly similar workers.The reduction of discretionary policies may also be related to the ownership struc-ture of the firm. Most of those firms were – or are – public companies for whichpromotions and recruitment criteria (and thus wages) are probably tightly linked toobservable characteristics such as education, experience, tenure, and so forth.
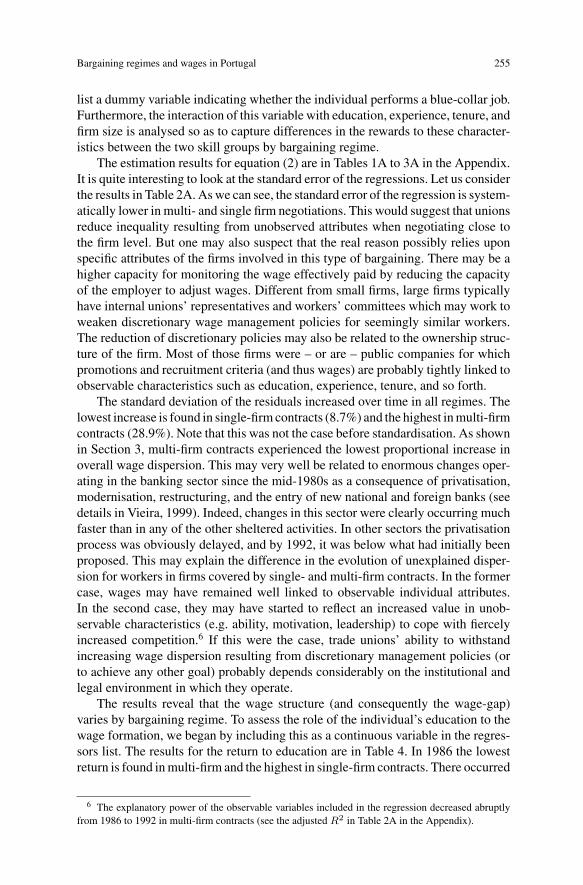
The standard deviation of the residuals increased over time in all regimes. Thelowest increase is found in single-firm contracts (8.7%) and the highest in multi-firmcontracts (28.9%). Note that this was not the case before standardisation. As shownin Section 3, multi-firm contracts experienced the lowest proportional increase inoverall wage dispersion. This may very well be related to enormous changes oper-ating in the banking sector since the mid-1980s as a consequence of privatisation,modernisation, restructuring, and the entry of new national and foreign banks (seedetails in Vieira, 1999). Indeed, changes in this sector were clearly occurring muchfaster than in any of the other sheltered activities. In other sectors the privatisationprocess was obviously delayed, and by 1992, it was below what had initially beenproposed. This may explain the difference in the evolution of unexplained disper-sion for workers in firms covered by single- and multi-firm contracts. In the formercase, wages may have remained well linked to observable individual attributes.In the second case, they may have started to reflect an increased value in unob-servable characteristics (e.g. ability, motivation, leadership) to cope with fiercelyincreased competition.6 If this were the case, trade unions’ ability to withstandincreasing wage dispersion resulting from discretionary management policies (orto achieve any other goal) probably depends considerably on the institutional andlegal environment in which they operate.
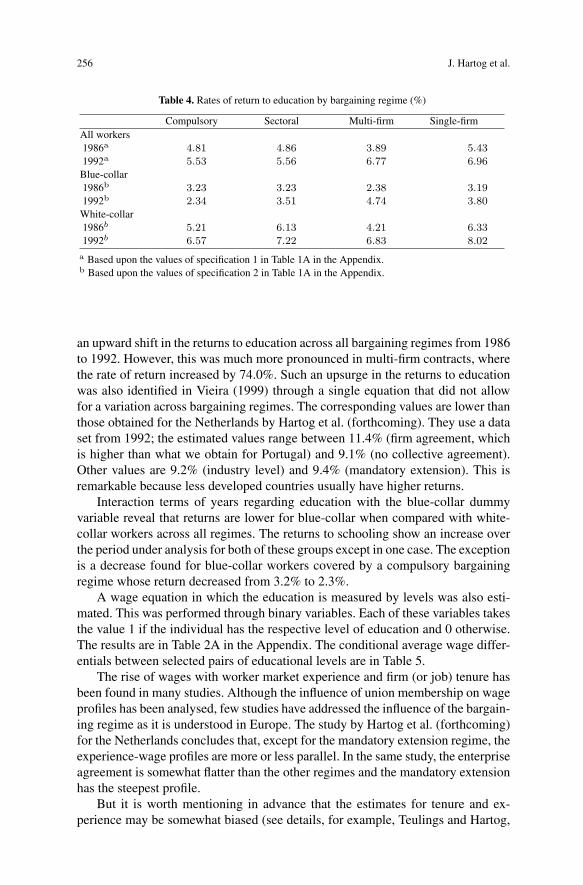
The results reveal that the wage structure (and consequently the wage-gap)varies by bargaining regime. To assess the role of the individual’s education to thewage formation, we began by including this as a continuous variable in the regres-sors list. The results for the return to education are in Table 4. In 1986 the lowestreturn is found in multi-firm and the highest in single-firm contracts. There occurred
6 The explanatory power of the observable variables included in the regression decreased abruptlyfrom 1986 to 1992 in multi-firm contracts (see the adjusted R2 in Table 2A in the Appendix).
256 J. Hartog et al.
Table 4. Rates of return to education by bargaining regime (%)
Compulsory Sectoral Multi-firm Single-firmAll workers1986a 4.81 4.86 3.89 5.431992a 5.53 5.56 6.77 6.96
Blue-collar1986b 3.23 3.23 2.38 3.191992b 2.34 3.51 4.74 3.80
White-collar1986b 5.21 6.13 4.21 6.331992b 6.57 7.22 6.83 8.02
a Based upon the values of specification 1 in Table 1A in the Appendix.b Based upon the values of specification 2 in Table 1A in the Appendix.
an upward shift in the returns to education across all bargaining regimes from 1986to 1992. However, this was much more pronounced in multi-firm contracts, wherethe rate of return increased by 74.0%. Such an upsurge in the returns to educationwas also identified in Vieira (1999) through a single equation that did not allowfor a variation across bargaining regimes. The corresponding values are lower thanthose obtained for the Netherlands by Hartog et al. (forthcoming). They use a dataset from 1992; the estimated values range between 11.4% (firm agreement, whichis higher than what we obtain for Portugal) and 9.1% (no collective agreement).Other values are 9.2% (industry level) and 9.4% (mandatory extension). This isremarkable because less developed countries usually have higher returns.
Interaction terms of years regarding education with the blue-collar dummyvariable reveal that returns are lower for blue-collar when compared with white-collar workers across all regimes. The returns to schooling show an increase overthe period under analysis for both of these groups except in one case. The exceptionis a decrease found for blue-collar workers covered by a compulsory bargainingregime whose return decreased from 3.2% to 2.3%.
A wage equation in which the education is measured by levels was also esti-mated. This was performed through binary variables. Each of these variables takesthe value 1 if the individual has the respective level of education and 0 otherwise.The results are in Table 2A in the Appendix. The conditional average wage differ-entials between selected pairs of educational levels are in Table 5.
The rise of wages with worker market experience and firm (or job) tenure hasbeen found in many studies. Although the influence of union membership on wageprofiles has been analysed, few studies have addressed the influence of the bargain-ing regime as it is understood in Europe. The study by Hartog et al. (forthcoming)for the Netherlands concludes that, except for the mandatory extension regime, theexperience-wage profiles are more or less parallel. In the same study, the enterpriseagreement is somewhat flatter than the other regimes and the mandatory extensionhas the steepest profile.
But it is worth mentioning in advance that the estimates for tenure and ex-perience may be somewhat biased (see details, for example, Teulings and Hartog,
Bargaining regimes and wages in Portugal 257
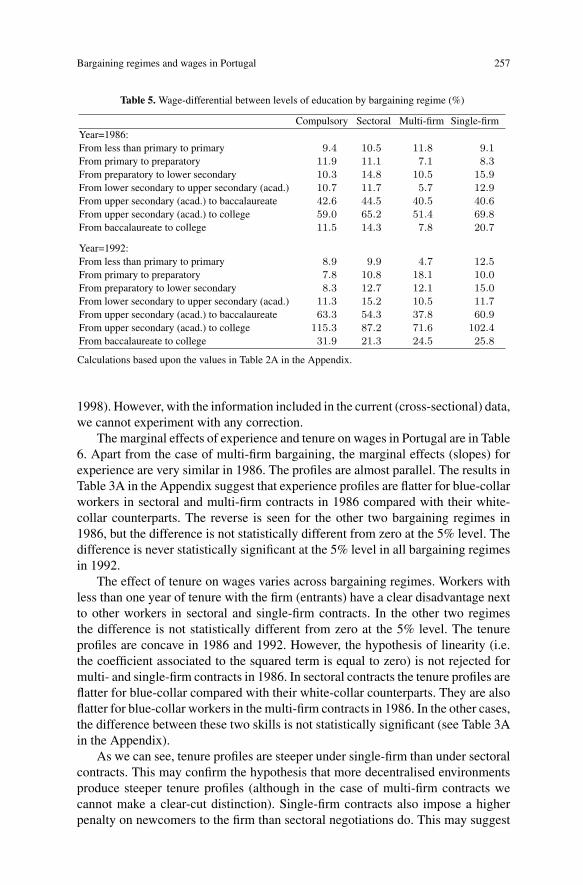
Table 5. Wage-differential between levels of education by bargaining regime (%)
Compulsory Sectoral Multi-firm Single-firmYear=1986:From less than primary to primary 9.4 10.5 11.8 9.1From primary to preparatory 11.9 11.1 7.1 8.3From preparatory to lower secondary 10.3 14.8 10.5 15.9From lower secondary to upper secondary (acad.) 10.7 11.7 5.7 12.9From upper secondary (acad.) to baccalaureate 42.6 44.5 40.5 40.6From upper secondary (acad.) to college 59.0 65.2 51.4 69.8From baccalaureate to college 11.5 14.3 7.8 20.7
Year=1992:From less than primary to primary 8.9 9.9 4.7 12.5From primary to preparatory 7.8 10.8 18.1 10.0From preparatory to lower secondary 8.3 12.7 12.1 15.0From lower secondary to upper secondary (acad.) 11.3 15.2 10.5 11.7From upper secondary (acad.) to baccalaureate 63.3 54.3 37.8 60.9From upper secondary (acad.) to college 115.3 87.2 71.6 102.4From baccalaureate to college 31.9 21.3 24.5 25.8
Calculations based upon the values in Table 2A in the Appendix.
1998). However, with the information included in the current (cross-sectional) data,we cannot experiment with any correction.
The marginal effects of experience and tenure on wages in Portugal are in Table6. Apart from the case of multi-firm bargaining, the marginal effects (slopes) forexperience are very similar in 1986. The profiles are almost parallel. The results inTable 3A in the Appendix suggest that experience profiles are flatter for blue-collarworkers in sectoral and multi-firm contracts in 1986 compared with their white-collar counterparts. The reverse is seen for the other two bargaining regimes in1986, but the difference is not statistically different from zero at the 5% level. Thedifference is never statistically significant at the 5% level in all bargaining regimesin 1992.
The effect of tenure on wages varies across bargaining regimes. Workers withless than one year of tenure with the firm (entrants) have a clear disadvantage nextto other workers in sectoral and single-firm contracts. In the other two regimesthe difference is not statistically different from zero at the 5% level. The tenureprofiles are concave in 1986 and 1992. However, the hypothesis of linearity (i.e.the coefficient associated to the squared term is equal to zero) is not rejected formulti- and single-firm contracts in 1986. In sectoral contracts the tenure profiles areflatter for blue-collar compared with their white-collar counterparts. They are alsoflatter for blue-collar workers in the multi-firm contracts in 1986. In the other cases,the difference between these two skills is not statistically significant (see Table 3Ain the Appendix).
As we can see, tenure profiles are steeper under single-firm than under sectoralcontracts. This may confirm the hypothesis that more decentralised environmentsproduce steeper tenure profiles (although in the case of multi-firm contracts wecannot make a clear-cut distinction). Single-firm contracts also impose a higherpenalty on newcomers to the firm than sectoral negotiations do. This may suggest
258 J. Hartog et al.
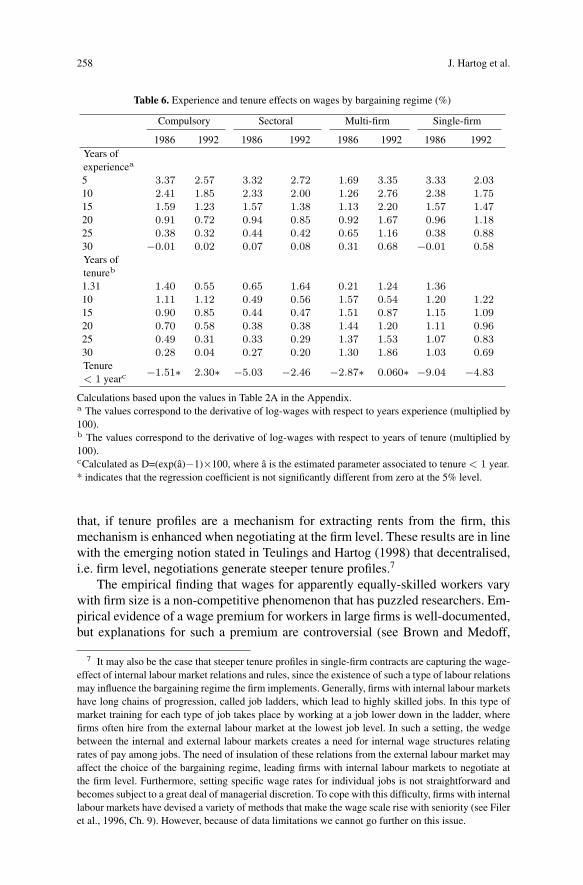
Table 6. Experience and tenure effects on wages by bargaining regime (%)
Compulsory Sectoral Multi-firm Single-firm
1986 1992 1986 1992 1986 1992 1986 1992Years ofexperiencea
5 3.37 2.57 3.32 2.72 1.69 3.35 3.33 2.0310 2.41 1.85 2.33 2.00 1.26 2.76 2.38 1.7515 1.59 1.23 1.57 1.38 1.13 2.20 1.57 1.4720 0.91 0.72 0.94 0.85 0.92 1.67 0.96 1.1825 0.38 0.32 0.44 0.42 0.65 1.16 0.38 0.8830 −0.01 0.02 0.07 0.08 0.31 0.68 −0.01 0.58Years oftenureb
1.31 1.40 0.55 0.65 1.64 0.21 1.24 1.3610 1.11 1.12 0.49 0.56 1.57 0.54 1.20 1.2215 0.90 0.85 0.44 0.47 1.51 0.87 1.15 1.0920 0.70 0.58 0.38 0.38 1.44 1.20 1.11 0.9625 0.49 0.31 0.33 0.29 1.37 1.53 1.07 0.8330 0.28 0.04 0.27 0.20 1.30 1.86 1.03 0.69Tenure< 1 yearc
−1.51∗ 2.30∗ −5.03 −2.46 −2.87∗ 0.060∗ −9.04 −4.83
Calculations based upon the values in Table 2A in the Appendix.a The values correspond to the derivative of log-wages with respect to years experience (multiplied by100).b The values correspond to the derivative of log-wages with respect to years of tenure (multiplied by100).cCalculated as D=(exp(a)−1)×100, where a is the estimated parameter associated to tenure < 1 year.* indicates that the regression coefficient is not significantly different from zero at the 5% level.
that, if tenure profiles are a mechanism for extracting rents from the firm, thismechanism is enhanced when negotiating at the firm level. These results are in linewith the emerging notion stated in Teulings and Hartog (1998) that decentralised,i.e. firm level, negotiations generate steeper tenure profiles.7
The empirical finding that wages for apparently equally-skilled workers varywith firm size is a non-competitive phenomenon that has puzzled researchers. Em-pirical evidence of a wage premium for workers in large firms is well-documented,but explanations for such a premium are controversial (see Brown and Medoff,
7 It may also be the case that steeper tenure profiles in single-firm contracts are capturing the wage-effect of internal labour market relations and rules, since the existence of such a type of labour relationsmay influence the bargaining regime the firm implements. Generally, firms with internal labour marketshave long chains of progression, called job ladders, which lead to highly skilled jobs. In this type ofmarket training for each type of job takes place by working at a job lower down in the ladder, wherefirms often hire from the external labour market at the lowest job level. In such a setting, the wedgebetween the internal and external labour markets creates a need for internal wage structures relatingrates of pay among jobs. The need of insulation of these relations from the external labour market mayaffect the choice of the bargaining regime, leading firms with internal labour markets to negotiate atthe firm level. Furthermore, setting specific wage rates for individual jobs is not straightforward andbecomes subject to a great deal of managerial discretion. To cope with this difficulty, firms with internallabour markets have devised a variety of methods that make the wage scale rise with seniority (see Fileret al., 1996, Ch. 9). However, because of data limitations we cannot go further on this issue.
Bargaining regimes and wages in Portugal 259
1989). However, our estimates led to two distinct cases. The estimated elasticity ispositive in compulsory and sectoral contracts. It is negative in the two regimes thatembody negotiations close to the firm level. This dichotomy is valid for both yearsand is also an inexplicable result. The result is thus very consistent over time.
One explanation for the negative sign could be the monopsony model: largefirms can have monopsony power compared to smaller firms. In the strictest sense,monopsony is the sole buyer of a factor of production. More generally, it may referto situations of reduced alternatives in the labour market (for all or some work-ers). In equilibrium, the resulting wage paid by the monopsonist and the amountof labour hired, are below what would occur in a competitive labour market. Thisresults from a limited number of potential employers and is normally associatedwith small labour markets. It is remarkable, however, that this sign was not foundfor the economy as a whole but only within two particular subsets (i.e. bargain-ing regimes).8 Therefore, a second explanation might focus on differences arisingwithin each of these (small) subsets of the economy. Within each subset, jobs maydiffer along the firm size demarcation, thus leading to lower wages in larger firms.These firms may have better working conditions, provide more secure jobs, providespecific benefits/services such as health care, child day care, and so forth, and havelarger pools of applicants relative to vacancies. Without empirical testing little canbe claimed for these hypotheses.
Regarding firm age the results are not totally consistent across bargainingregimes and over time. For compulsory government regimes and sectoral con-tracts the sign is negative in both years. It is not statistically different from zero atthe 5% level in the former of these regimes. With respect to multi- and single-firmbargaining regimes, the sign is negative in 1992, but not in 1986.9
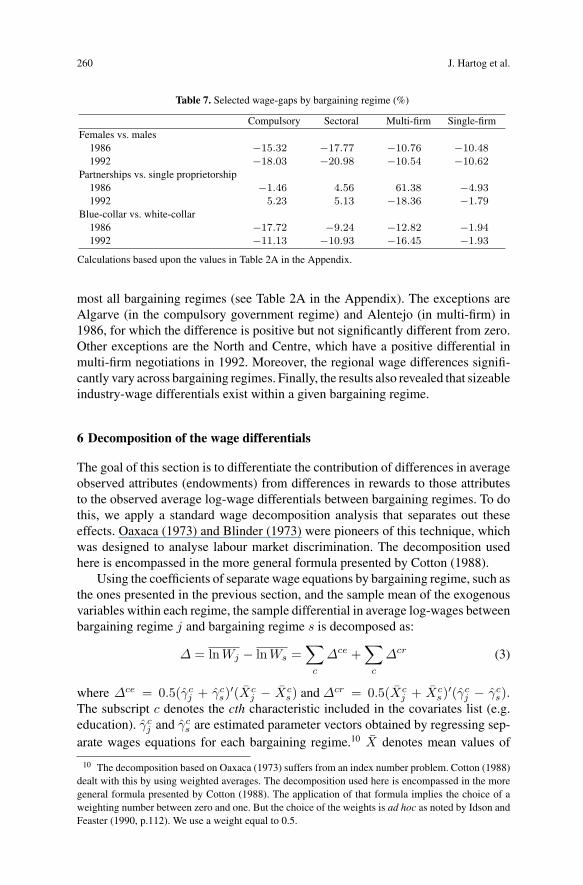
Females earn less than males, ceteris paribus. This disadvantage is found in allbargaining regimes. Nevertheless, the size of the differential varies across regimesand, in some cases, over time. It is substantially lower in multi- and single-firmbargaining negotiations than in the other regimes. With respect to changes from1986 to 1992, that disadvantage increased in sectoral contracts and in compulsoryregimes. It is remarkably stable in the remaining regimes. A comparison with thevalues by Hartog et al. (forthcoming) suggests that the gap is larger in Portugal thanin the Netherlands.
Wage differentials between firm ownership structures vary across bargainingregimes. Table 7 shows this through estimated percentage differences betweenpartnerships and single proprietorship enterprises. Other differences can be foundby looking at the estimates in Table 2A in the Appendix. Furthermore, the own-ership/legal form wage-gap changes over time. With respect to skill, single-firmnegotiations generate the lowest difference between white- and blue-collar work-ers. This differential widened markedly from 1986 to 1992 in multi-firm contracts.It decreased during the same period in compulsory regimes. Wages in Lisbon andthe Tagus Valley tend to be higher than in the other regions. This is valid for al-
8 These are specific subsets of the economy comprised of fairly large firms. Most of these firmsemploy more (in some cases many more) than 1,000 employees.
9 The estimation of a single equation for the whole economy led to very consistent results over time.In this case, there is a clear negative relation between firm age and wages (see Vieira, 1999).
260 J. Hartog et al.
Table 7. Selected wage-gaps by bargaining regime (%)
Compulsory Sectoral Multi-firm Single-firmFemales vs. males
1986 −15.32 −17.77 −10.76 −10.481992 −18.03 −20.98 −10.54 −10.62
Partnerships vs. single proprietorship1986 −1.46 4.56 61.38 −4.931992 5.23 5.13 −18.36 −1.79
Blue-collar vs. white-collar1986 −17.72 −9.24 −12.82 −1.941992 −11.13 −10.93 −16.45 −1.93
Calculations based upon the values in Table 2A in the Appendix.
most all bargaining regimes (see Table 2A in the Appendix). The exceptions areAlgarve (in the compulsory government regime) and Alentejo (in multi-firm) in1986, for which the difference is positive but not significantly different from zero.Other exceptions are the North and Centre, which have a positive differential inmulti-firm negotiations in 1992. Moreover, the regional wage differences signifi-cantly vary across bargaining regimes. Finally, the results also revealed that sizeableindustry-wage differentials exist within a given bargaining regime.
6 Decomposition of the wage differentials
The goal of this section is to differentiate the contribution of differences in averageobserved attributes (endowments) from differences in rewards to those attributesto the observed average log-wage differentials between bargaining regimes. To dothis, we apply a standard wage decomposition analysis that separates out theseeffects. Oaxaca (1973) and Blinder (1973) were pioneers of this technique, whichwas designed to analyse labour market discrimination. The decomposition usedhere is encompassed in the more general formula presented by Cotton (1988).
Using the coefficients of separate wage equations by bargaining regime, such asthe ones presented in the previous section, and the sample mean of the exogenousvariables within each regime, the sample differential in average log-wages betweenbargaining regime j and bargaining regime s is decomposed as:
∆ = lnWj − lnWs =∑
c
∆ce +∑
c
∆cr (3)
where ∆ce = 0.5(γcj + γc
s)′(Xc
j − Xcs) and ∆cr = 0.5(Xc
j + Xcs)′(γc
j − γcs).
The subscript c denotes the cth characteristic included in the covariates list (e.g.education). γc
j and γcs are estimated parameter vectors obtained by regressing sep-
arate wages equations for each bargaining regime.10 X denotes mean values of
10 The decomposition based on Oaxaca (1973) suffers from an index number problem. Cotton (1988)dealt with this by using weighted averages. The decomposition used here is encompassed in the moregeneral formula presented by Cotton (1988). The application of that formula implies the choice of aweighting number between zero and one. But the choice of the weights is ad hoc as noted by Idson andFeaster (1990, p.112). We use a weight equal to 0.5.
Bargaining regimes and wages in Portugal 261
the explanatory variables over the individuals in a particular regime. Equation (3)separates out the observed sample differential of average log-wage that may beattributed to
– differences in individual/job characteristics (endowments), captured by∑c
∆ce, where ∆ce denotes the contribution of differences in endowments as-
sociated with the cth characteristic;
– -differences in returns to these characteristics, captured by∑c
∆cr, where ∆cr denotes the contribution of differences in returns associated
with the cth characteristic;As has been noted by Jones (1983), the contribution of the ‘return’ component
in the intercept is flawed in the presence of dummy variables, since the magnitudeof the constant term depends on the excluded reference group. But the problem goesbeyond identifying the intercept component. In general, it is not possible to identifythe separate contributions of the ‘return’ component associated with the binaryvariables in the wage decomposition, since they will depend on the reference group.Nevertheless, neither the contribution of the constituent components to differencesin ‘endowment’ nor the overall decomposition are affected by the choice of thereference groups (Oaxaca and Ransom, 1997). Given that limitation, we separateout only the contribution of continuous variables. In the underlying wage equation,education was defined in years such as in Table 1A in the Appendix.
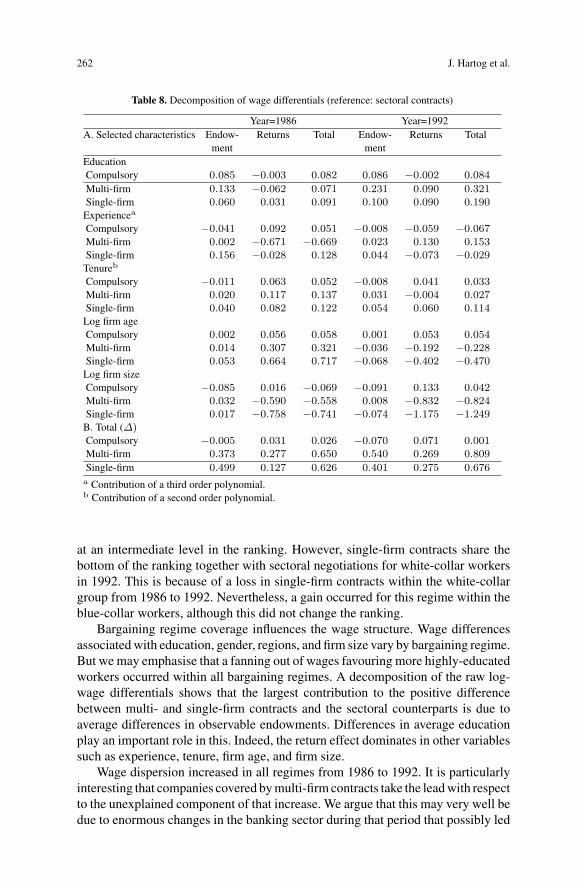
The results are in Table 8 and take sectoral contracts as the reference category.The decomposition with respect to this regime is partly justified by the fact that itcovers most workers. Furthermore, it tends to generate the lowest average wage.Only some of the prominent cases are highlighted here. Looking at the values forthe total differences at the bottom of Table 8, differences in the return componentappear to dominate for compulsory regimes. The endowment component leadsin multi- and single-firm contracts. This primacy of the endowment componentis largely influenced by the contribution of education. In fact, for the effect ofeducation the endowment component dominates, while for the other variables, thereturns component mostly dominates.
7 Conclusions and remarks
This study was an attempt to further explore the role of institutions and the levelat which collective bargaining takes place for wage formation in Portugal. Theresults show that after controlling for a large set of individual and job relatedcharacteristics, the firm bargaining regime coverage apparently is important inexplaining the variability of wages. The main results reveal that wage differentialsbetween the bargaining regimes are in some cases sizeable. These differentials varywith individual and job (or firm) characteristics. If there is a pattern, it seems to bethat multi-firm contracts tend to generate higher wages and sectoral contracts tendto generate the lowest wages. Compulsory regimes and single-firm contracts align
262 J. Hartog et al.
Table 8. Decomposition of wage differentials (reference: sectoral contracts)
Year=1986 Year=1992A. Selected characteristics Endow- Returns Total Endow- Returns Total
ment mentEducationCompulsory 0.085 −0.003 0.082 0.086 −0.002 0.084Multi-firm 0.133 −0.062 0.071 0.231 0.090 0.321Single-firm 0.060 0.031 0.091 0.100 0.090 0.190Experiencea
Compulsory −0.041 0.092 0.051 −0.008 −0.059 −0.067Multi-firm 0.002 −0.671 −0.669 0.023 0.130 0.153Single-firm 0.156 −0.028 0.128 0.044 −0.073 −0.029Tenureb
Compulsory −0.011 0.063 0.052 −0.008 0.041 0.033Multi-firm 0.020 0.117 0.137 0.031 −0.004 0.027Single-firm 0.040 0.082 0.122 0.054 0.060 0.114Log firm ageCompulsory 0.002 0.056 0.058 0.001 0.053 0.054Multi-firm 0.014 0.307 0.321 −0.036 −0.192 −0.228Single-firm 0.053 0.664 0.717 −0.068 −0.402 −0.470Log firm sizeCompulsory −0.085 0.016 −0.069 −0.091 0.133 0.042Multi-firm 0.032 −0.590 −0.558 0.008 −0.832 −0.824Single-firm 0.017 −0.758 −0.741 −0.074 −1.175 −1.249B. Total (∆)Compulsory −0.005 0.031 0.026 −0.070 0.071 0.001Multi-firm 0.373 0.277 0.650 0.540 0.269 0.809Single-firm 0.499 0.127 0.626 0.401 0.275 0.676a Contribution of a third order polynomial.b Contribution of a second order polynomial.
at an intermediate level in the ranking. However, single-firm contracts share thebottom of the ranking together with sectoral negotiations for white-collar workersin 1992. This is because of a loss in single-firm contracts within the white-collargroup from 1986 to 1992. Nevertheless, a gain occurred for this regime within theblue-collar workers, although this did not change the ranking.
Bargaining regime coverage influences the wage structure. Wage differencesassociated with education, gender, regions, and firm size vary by bargaining regime.But we may emphasise that a fanning out of wages favouring more highly-educatedworkers occurred within all bargaining regimes. A decomposition of the raw log-wage differentials shows that the largest contribution to the positive differencebetween multi- and single-firm contracts and the sectoral counterparts is due toaverage differences in observable endowments. Differences in average educationplay an important role in this. Indeed, the return effect dominates in other variablessuch as experience, tenure, firm age, and firm size.
Wage dispersion increased in all regimes from 1986 to 1992. It is particularlyinteresting that companies covered by multi-firm contracts take the lead with respectto the unexplained component of that increase. We argue that this may very well bedue to enormous changes in the banking sector during that period that possibly led
Bargaining regimes and wages in Portugal 263
to a greater valuation of unobserved attributes (e.g. ability, motivation, leadership)for coping with increased competition.
There is an emerging literature arguing that the effect of unions/collective bar-gaining on wages within a country in general vary negatively with the degree ofcorporatism in that country. That is, the more corporatist the country is, the smallerare unions/collective bargaining wage differentials. Hartog et al. (forthcoming) con-clude that their results for the Netherlands fit neatly into this pattern. The Nether-lands ranks high on the scales of corporatism and they have established smalldifferences in wage levels between bargaining regimes (the gaps are less than 5%).In Section 2 we suggested that Portugal might rank low in terms of corporatism(centralisation). If that is the case, the results seem to match, as well. In all, we findthat average wages vary across bargaining regimes, conditional upon worker andfirm/job characteristics. However, these values, which are based on cross-sectionaldata, should not be taken as the last word on bargaining regime wage-effects. Theycould suffer from some bias that was impossible to control for.
At the beginning of the study we remarked that wage mark-ups could increasefrom single-firm to multi-firm to sectoral contracts, ceteris paribus. The idea wasthat labour’s power would increase along this demarcation and would thereforepush wages up. From single-firm to multi-firm this is neatly verified. However,sectoral contracts fall at the bottom of the scale rather than appear at the top. Butthis may not suffice to reject that hypothesis. It could be that the ceteris paribuscondition is not completely satisfied. The bargaining regimes may be indexingdifferent conditions. Firstly, differences in wage levels between employees coveredby different bargaining mechanisms may reflect differences in unobserved labourqualities. Secondly, the bargaining regimes may be indexing differences in non-competitive effects arising from firm-level wage policies (e.g. efficiency wages).Thirdly, they may be indexing differences in the surplus to be shared. Althoughvariables such as industries, firm size and firm ownership may control to someextent for such an effect, the control is most likely less than perfect. The abilityof unions to capture rents in firms facing competitive market conditions is ratherlimited (see Stewart, 1990). They are better placed when bargaining with firms witha degree of product market power (the employer is able to pass on its high wage coststo consumers). Therefore, the bargaining regime effects may be partially capturingthe situation where firms covered by sectoral contracts operate in more competitiveproduct markets with low rents. Conversely, most of those firms covered by single-and multi-firm contracts operate in fairly concentrated sectors owned by the stateand have been completely sheltered from any competition until very recently. Suchattributes seem favourable to the enactment of rent-sharing.
Finally, the study leaves questions remaining because of a lack of statisticalinformation. It would be interesting to extend the analysis in order to capture otherimportant features of the bargaining structure. Of particular interest might be theconsideration of whether negotiations are targeted at a particular profession, ifthey involve all the workers of the industry/firm, whether they have a regionalor a national scope, if they are signed by a single union or by multiple unions,and whether they are signed by trade unions or by their federations. The union
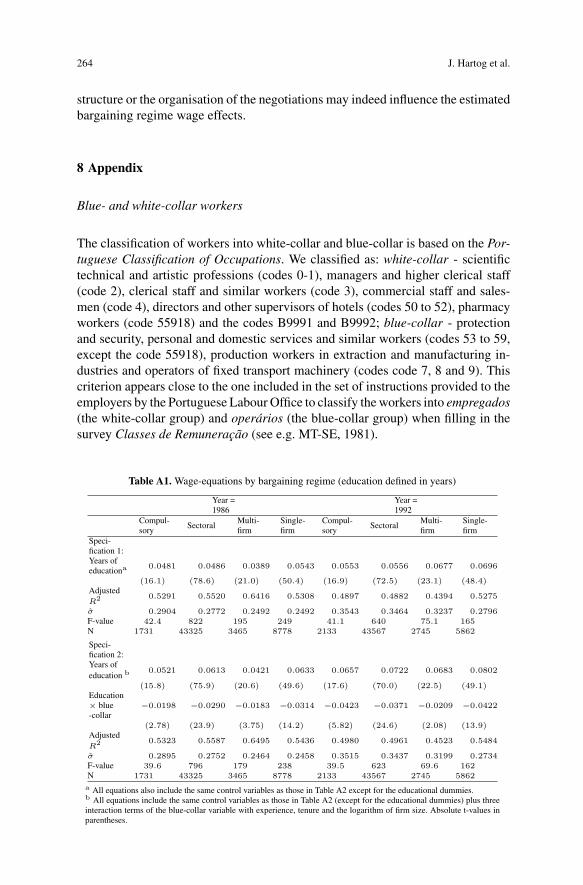
264 J. Hartog et al.
structure or the organisation of the negotiations may indeed influence the estimatedbargaining regime wage effects.
8 Appendix
Blue- and white-collar workers
The classification of workers into white-collar and blue-collar is based on the Por-tuguese Classification of Occupations. We classified as: white-collar - scientifictechnical and artistic professions (codes 0-1), managers and higher clerical staff(code 2), clerical staff and similar workers (code 3), commercial staff and sales-men (code 4), directors and other supervisors of hotels (codes 50 to 52), pharmacyworkers (code 55918) and the codes B9991 and B9992; blue-collar - protectionand security, personal and domestic services and similar workers (codes 53 to 59,except the code 55918), production workers in extraction and manufacturing in-dustries and operators of fixed transport machinery (codes code 7, 8 and 9). Thiscriterion appears close to the one included in the set of instructions provided to theemployers by the Portuguese Labour Office to classify the workers into empregados(the white-collar group) and operarios (the blue-collar group) when filling in thesurvey Classes de Remuneracao (see e.g. MT-SE, 1981).
Table A1. Wage-equations by bargaining regime (education defined in years)
Year =1986
Year =1992
Compul-sory
SectoralMulti-firm
Single-firm
Compul-sory
SectoralMulti-firm
Single-firm
Speci-fication 1:Years ofeducationa
0.0481 0.0486 0.0389 0.0543 0.0553 0.0556 0.0677 0.0696
(16.1) (78.6) (21.0) (50.4) (16.9) (72.5) (23.1) (48.4)AdjustedR2 0.5291 0.5520 0.6416 0.5308 0.4897 0.4882 0.4394 0.5275
σ 0.2904 0.2772 0.2492 0.2492 0.3543 0.3464 0.3237 0.2796F-value 42.4 822 195 249 41.1 640 75.1 165N 1731 43325 3465 8778 2133 43567 2745 5862
Speci-fication 2:Years ofeducation b 0.0521 0.0613 0.0421 0.0633 0.0657 0.0722 0.0683 0.0802
(15.8) (75.9) (20.6) (49.6) (17.6) (70.0) (22.5) (49.1)Education× blue-collar
−0.0198 −0.0290 −0.0183 −0.0314 −0.0423 −0.0371 −0.0209 −0.0422
(2.78) (23.9) (3.75) (14.2) (5.82) (24.6) (2.08) (13.9)AdjustedR2 0.5323 0.5587 0.6495 0.5436 0.4980 0.4961 0.4523 0.5484
σ 0.2895 0.2752 0.2464 0.2458 0.3515 0.3437 0.3199 0.2734F-value 39.6 796 179 238 39.5 623 69.6 162N 1731 43325 3465 8778 2133 43567 2745 5862a All equations also include the same control variables as those in Table A2 except for the educational dummies.b All equations include the same control variables as those in Table A2 (except for the educational dummies) plus threeinteraction terms of the blue-collar variable with experience, tenure and the logarithm of firm size. Absolute t-values inparentheses.
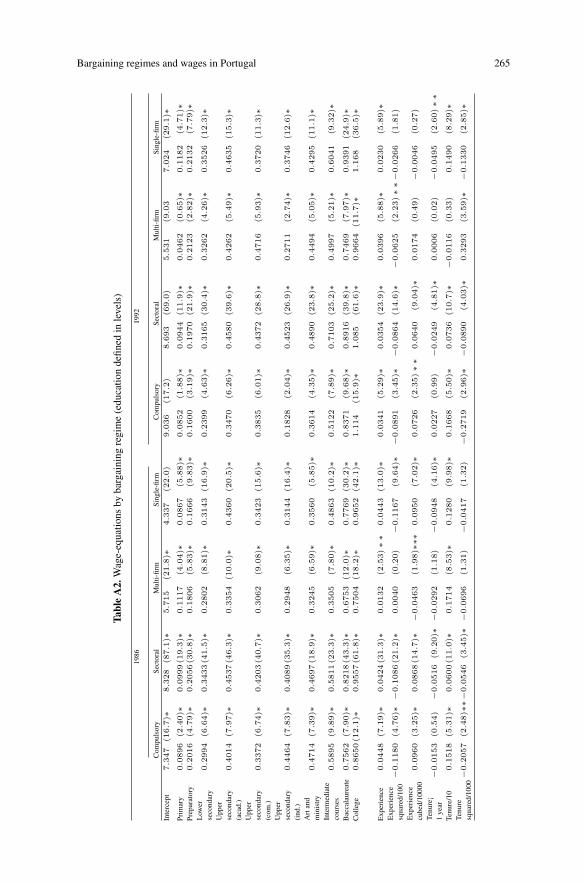
Bargaining regimes and wages in Portugal 265
Tabl
eA
2.W
age-
equa
tions
byba
rgai
ning
regi
me
(edu
catio
nde
fined
inle
vels
)
1986
1992
Com
puls
ory
Sect
oral
Mul
ti-fir
mSi
ngle
-firm
Com
puls
ory
Sect
oral
Mul
ti-fir
mSi
ngle
-firm
Inte
rcep
t7.3
47
(16.7
)∗8.3
28
(87.1
)∗5.7
15
(21.8
)∗4.3
37
(22.0
)9.0
36
(17.2
)8.6
93
(69.0
)5.5
31
(9.0
37.0
24
(29.1
)∗Pr
imar
y0.0
896
(2.4
0)∗
0.0
999(1
9.3
)∗0.1
117
(4.0
4)∗
0.0
867
(5.8
8)∗
0.0
852
(1.8
8)∗
0.0
944
(11.9
)∗0.0
462
(0.6
5)∗
0.1
182
(4.7
1)∗
Prep
arat
ory
0.2
016
(4.7
9)∗
0.2
056(3
0.8
)∗0.1
806
(5.8
3)∗
0.1
666
(9.8
3)∗
0.1
600
(3.1
9)∗
0.1
970
(21.9
)∗0.2
123
(2.8
2)∗
0.2
132
(7.7
9)∗
Low
erse
cond
ary
0.2
994
(6.6
4)∗
0.3
433(4
1.5
)∗0.2
802
(8.8
1)∗
0.3
143
(16.9
)∗0.2
399
(4.6
3)∗
0.3
165
(30.4
)∗0.3
262
(4.2
6)∗
0.3
526
(12.3
)∗U
pper
seco
ndar
y(a
cad.
)0.4
014
(7.9
7)∗
0.4
537(4
6.3
)∗0.3
354
(10.0
)∗0.4
360
(20.5
)∗0.3
470
(6.2
6)∗
0.4
580
(39.6
)∗0.4
262
(5.4
9)∗
0.4
635
(15.3
)∗
Upp
erse
cond
ary
(com
.)0.3
372
(6.7
4)∗
0.4
203(4
0.7
)∗0.3
062
(9.0
8)∗
0.3
423
(15.6
)∗0.3
835
(6.0
1)∗
0.4
372
(28.8
)∗0.4
716
(5.9
3)∗
0.3
720
(11.3
)∗
Upp
erse
cond
ary
(ind
.)0.4
464
(7.8
3)∗
0.4
089(3
5.3
)∗0.2
948
(6.3
5)∗
0.3
144
(16.4
)∗0.1
828
(2.0
4)∗
0.4
523
(26.9
)∗0.2
711
(2.7
4)∗
0.3
746
(12.6
)∗
Art
and
min
istr
y0.4
714
(7.3
9)∗
0.4
697(1
8.9
)∗0.3
245
(6.5
9)∗
0.3
560
(5.8
5)∗
0.3
614
(4.3
5)∗
0.4
890
(23.8
)∗0.4
494
(5.0
5)∗
0.4
295
(11.1
)∗In
term
edia
teco
urse
s0.5
895
(9.8
9)∗
0.5
811(2
3.3
)∗0.3
505
(7.8
0)∗
0.4
863
(10.2
)∗0.5
122
(7.8
9)∗
0.7
103
(25.2
)∗0.4
997
(5.2
1)∗
0.6
041
(9.3
2)∗
Bac
cala
urea
te0.7
562
(7.9
0)∗
0.8
218(4
3.3
)∗0.6
753
(12.0
)∗0.7
769
(30.2
)∗0.8
371
(9.6
8)∗
0.8
916
(39.8
)∗0.7
469
(7.9
7)∗
0.9
391
(24.9
)∗C
olle
ge0.8
650(1
2.1
)∗0.9
557(6
1.8
)∗0.7
504
(18.2
)∗0.9
652
(42.1
)∗1.1
14
(15.9
)∗1.0
85
(61.6
)∗0.9
664
(11.7
)∗1.1
68
(36.5
)∗
Exp
erie
nce
0.0
448
(7.1
9)∗
0.0
424(3
1.3
)∗0.0
132
(2.5
3)
∗∗
0.0
443
(13.0
)∗0.0
341
(5.2
9)∗
0.0
354
(23.9
)∗0.0
396
(5.8
8)∗
0.0
230
(5.8
9)∗
Exp
erie
nce
squa
red/
100
−0.1
180
(4.7
6)∗
−0.1
086(2
1.2
)∗0.0
040
(0.2
0)
−0.1
167
(9.6
4)∗
−0.0
891
(3.4
5)∗
−0.0
864
(14.6
)∗−
0.0
625
(2.2
3)
∗∗
−0.0
266
(1.8
1)
Exp
erie
nce
cube
d/10
000
0.0
960
(3.2
5)∗
0.0
868(1
4.7
)∗−
0.0
463
(1.9
8)∗
∗∗0.0
950
(7.0
2)∗
0.0
726
(2.3
5)
∗∗
0.0
640
(9.0
4)∗
0.0
174
(0.4
9)
−0.0
046
(0.2
7)
Tenu
re¡
1ye
ar−
0.0
153
(0.5
4)
−0.0
516
(9.2
0)∗
−0.0
292
(1.1
8)
−0.0
948
(4.1
6)∗
0.0
227
(0.9
9)
−0.0
249
(4.8
1)∗
0.0
006
(0.0
2)
−0.0
495
(2.6
0)
∗∗
Tenu
re/1
00.1
518
(5.3
1)∗
0.0
600(1
1.0
)∗0.1
714
(8.5
3)∗
0.1
280
(9.9
8)∗
0.1
668
(5.5
0)∗
0.0
736
(10.7
)∗−
0.0
116
(0.3
3)
0.1
490
(8.2
9)∗
Tenu
resq
uare
d/10
00−
0.2
057
(2.4
8)∗
∗−0.0
546
(3.4
5)∗
−0.0
696
(1.3
1)
−0.0
417
(1.3
2)
−0.2
719
(2.9
6)∗
−0.0
890
(4.0
3)∗
0.3
293
(3.5
9)∗
−0.1
330
(2.8
5)∗
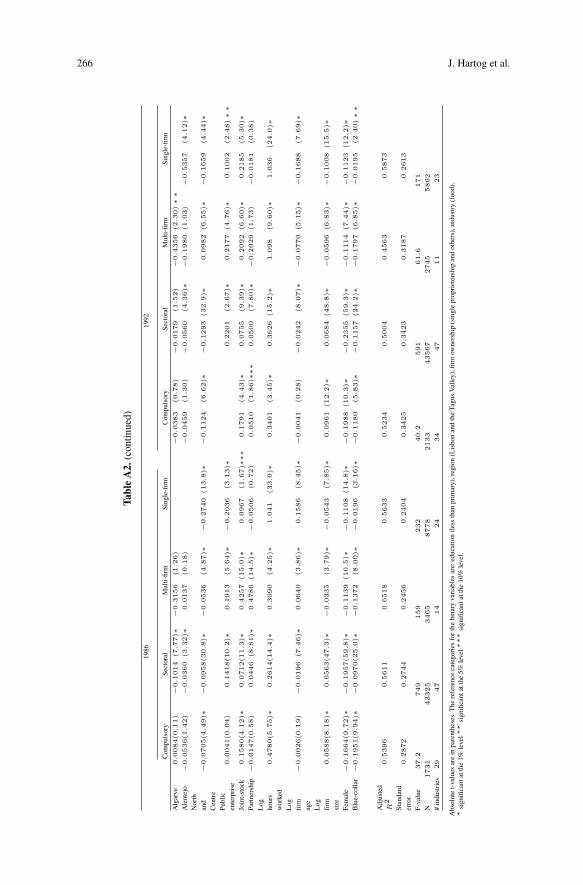
266 J. Hartog et al.
Tabl
eA
2.(c
ontin
ued)
1986
1992
Com
puls
ory
Sect
oral
Mul
ti-fir
mSi
ngle
-firm
Com
puls
ory
Sect
oral
Mul
ti-fir
mSi
ngle
-firm
Alg
arve
0.0
084(0
.11)
−0
.1014
(7.7
7)∗
−0
.3156
(1.2
6)
−0
.0383
(0.7
8)
−0
.0179
(1.5
2)
−0
.4356
(2.3
0)
∗∗
Ale
ntej
o−
0.0
536(1
.42)
−0
.0360
(3.3
2)∗
0.0
137
(0.1
8)
−0
.0459
(1.3
0)
−0
.0560
(4.3
6)∗
−0
.1980
(1.0
3)
−0
.5357
(4.1
2)∗
Nor
than
dC
entr
e−
0.0
705(4
.49)∗
−0
.0958(3
0.8
)∗−
0.0
536
(4.8
7)∗
−0
.2740
(13
.8)∗
−0
.1124
(6.6
2)∗
−0
.1293
(32
.9)∗
0.0
982
(6.5
5)∗
−0
.1659
(4.4
4)∗
Publ
icen
terp
rise
0.0
041(0
.04)
0.1
418(1
0.2
)∗0
.1913
(5.6
4)∗
−0
.2036
(3.1
3)∗
0.2
201
(2.6
7)∗
0.2
177
(4.7
6)∗
0.1
002
(2.4
8)
∗∗
Join
t-st
ock
0.1
580(4
.12)∗
0.0
712(1
1.3
)∗0
.4257
(15
.0)∗
0.0
967
(1.6
7)∗
∗∗0
.1791
(4.4
3)∗
0.0
755
(9.3
9)∗
0.2
092
(6.6
0)∗
0.2
185
(5.3
0)∗
Part
ners
hip
−0
.0147(0
.58)
0.0
446
(8.8
1)∗
0.4
786
(14
.5)∗
−0
.0506
(0.7
2)
0.0
510
(1.8
6)∗
∗∗0
.0500
(7.8
0)∗
−0
.2029
(1.7
3)
−0
.0181
(0.3
8)
Log
hour
sw
orke
d0
.4780(5
.75)∗
0.2
614(1
4.4
)∗0
.3090
(4.2
5)∗
1.0
41
(33
.0)∗
0.3
401
(3.4
5)∗
0.3
626
(15
.2)∗
1.0
98
(9.6
0)∗
1.0
36
(24
.0)∗
Log
firm
age
−0
.0026(0
.19)
−0
.0196
(7.4
6)∗
0.0
640
(3.8
6)∗
0.1
586
(8.4
5)∗
−0
.0041
(0.2
8)
−0
.0242
(8.0
7)∗
−0
.0770
(5.1
5)∗
−0
.1688
(7.6
9)∗
Log
firm
size
0.0
588(8
.18)∗
0.0
563(4
7.3
)∗−
0.0
335
(3.7
9)∗
−0
.0543
(7.8
5)∗
0.0
961
(12
.2)∗
0.0
684
(48
.8)∗
−0
.0596
(6.8
3)∗
−0
.1008
(15
.5)∗
Fem
ale
−0
.1664(9
.72)∗
−0
.1957(5
9.8
)∗−
0.1
139
(10
.5)∗
−0
.1108
(14
.8)∗
−0
.1988
(10
.3)∗
−0
.2355
(59
.3)∗
−0
.1114
(7.4
4)∗
−0
.1123
(12
.2)∗
Blu
e-co
llar
−0
.1951(9
.94)∗
−0
.0970(2
5.0
)∗−
0.1
372
(8.0
0)∗
−0
.0196
(3.1
6)∗
−0
.1180
(5.8
3)∗
−0
.1157
(24
.2)∗
−0
.1797
(6.8
5)∗
−0
.0195
(2.4
0)
∗∗
Adj
uste
dR
20
.5396
0.5
611
0.6
518
0.5
633
0.5
234
0.5
004
0.4
563
0.5
873
Stan
dard
erro
r0
.2872
0.2
744
0.2
456
0.2
404
0.3
425
0.3
423
0.3
187
0.2
613
F-va
lue
37
.2749
159
232
40
.2591
61
.6171
N1731
43325
3465
8778
2133
43567
2745
5862
#in
dust
ries
29
47
14
24
34
47
11
23
Abs
olut
et-
valu
esar
ein
pare
nthe
ses.
The
refe
renc
eca
tego
ries
for
the
bina
ryva
riab
les
are:
educ
atio
n(l
ess
than
prim
ary)
,reg
ion
(Lis
bon
and
the
Tagu
sV
alle
y),fi
rmow
ners
hip
(sin
gle
prop
riet
orsh
ipan
dot
hers
),in
dust
ry(f
ood)
.∗
sign
ifica
ntat
the
1%le
vel∗
∗si
gnifi
cant
atth
e5%
leve
l∗∗∗
sign
ifica
ntat
the
10%
leve
l.
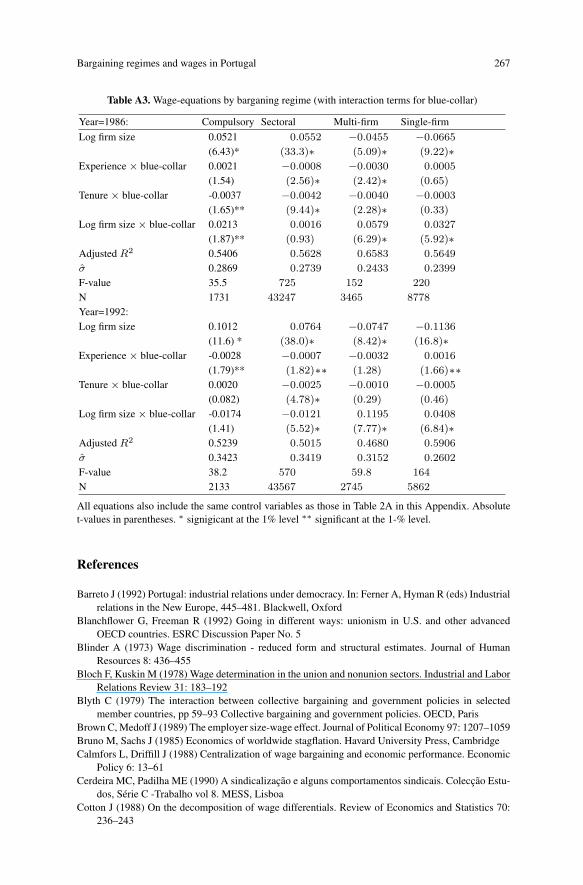
Bargaining regimes and wages in Portugal 267
Table A3. Wage-equations by barganing regime (with interaction terms for blue-collar)
Year=1986: Compulsory Sectoral Multi-firm Single-firm
Log firm size 0.0521 0.0552 −0.0455 −0.0665(6.43)* (33.3)∗ (5.09)∗ (9.22)∗
Experience × blue-collar 0.0021 −0.0008 −0.0030 0.0005(1.54) (2.56)∗ (2.42)∗ (0.65)
Tenure × blue-collar -0.0037 −0.0042 −0.0040 −0.0003(1.65)** (9.44)∗ (2.28)∗ (0.33)
Log firm size × blue-collar 0.0213 0.0016 0.0579 0.0327(1.87)** (0.93) (6.29)∗ (5.92)∗
Adjusted R2 0.5406 0.5628 0.6583 0.5649σ 0.2869 0.2739 0.2433 0.2399F-value 35.5 725 152 220N 1731 43247 3465 8778Year=1992:Log firm size 0.1012 0.0764 −0.0747 −0.1136
(11.6) * (38.0)∗ (8.42)∗ (16.8)∗Experience × blue-collar -0.0028 −0.0007 −0.0032 0.0016
(1.79)** (1.82)∗∗ (1.28) (1.66)∗∗Tenure × blue-collar 0.0020 −0.0025 −0.0010 −0.0005
(0.082) (4.78)∗ (0.29) (0.46)Log firm size × blue-collar -0.0174 −0.0121 0.1195 0.0408
(1.41) (5.52)∗ (7.77)∗ (6.84)∗Adjusted R2 0.5239 0.5015 0.4680 0.5906σ 0.3423 0.3419 0.3152 0.2602F-value 38.2 570 59.8 164N 2133 43567 2745 5862
All equations also include the same control variables as those in Table 2A in this Appendix. Absolutet-values in parentheses. ∗ signigicant at the 1% level ∗∗ significant at the 1-% level.
References
Barreto J (1992) Portugal: industrial relations under democracy. In: Ferner A, Hyman R (eds) Industrialrelations in the New Europe, 445–481. Blackwell, Oxford
Blanchflower G, Freeman R (1992) Going in different ways: unionism in U.S. and other advancedOECD countries. ESRC Discussion Paper No. 5
Blinder A (1973) Wage discrimination - reduced form and structural estimates. Journal of HumanResources 8: 436–455
Bloch F, Kuskin M (1978) Wage determination in the union and nonunion sectors. Industrial and LaborRelations Review 31: 183–192
Blyth C (1979) The interaction between collective bargaining and government policies in selectedmember countries, pp 59–93 Collective bargaining and government policies. OECD, Paris
Brown C, Medoff J (1989) The employer size-wage effect. Journal of Political Economy 97: 1207–1059Bruno M, Sachs J (1985) Economics of worldwide stagflation. Havard University Press, CambridgeCalmfors L, Driffill J (1988) Centralization of wage bargaining and economic performance. Economic
Policy 6: 13–61Cerdeira MC, Padilha ME (1990) A sindicalizacao e alguns comportamentos sindicais. Coleccao Estu-
dos, Serie C -Trabalho vol 8. MESS, LisboaCotton J (1988) On the decomposition of wage differentials. Review of Economics and Statistics 70:
236–243
268 J. Hartog et al.
Filer R, Hamermesh D, Rees A (1996) The economics of work and pay. Harper Collins, New YorkHartog J, Theeuwes J (1993) Labour market institutions and contracts. North-Holland, AmsterdamHartog J, Hartog J, Theeuwes J (1990) Postwar developments in labour economics. In: van der Ploeg F
(ed) Advanced lectures in quantitative economics, pp 313–348. Academic Press, LondonHartog J, Leuven E, Teulings C: Wages and the bargaining regime in a corporatist country: The Nether-
lands. European Journal of Political Economy (forthcoming)Idson T, Feaster D (1990) A selectivity model of employer-size wage differentials. Journal of Labor
Economics 8: 99–122Jones FL (1983) On decomposing the wage gap: a critical comment on blinder’s method. Journal of
Human Resources 18: 126–130Kuhn P (1988) A nonuniform pricing model of union wages and employment. Journal of Political
Economy 96: 473–508Lee L-F (1978) Unionism and wage rates: a simultaneous equations model with quantitative and limited
dependent variables. International Economic Review 19: 415–433Lee L-F (1983) Generalized econometric models with selectivity. Econometrica 51: 507–512Lehmbruch G (1984) Concertation and the structure of corporatist networks. In: Goldthorpe JH (ed)
Order and conflict in contemporary capitalism. Clarendon Press, OxfordLewis HG (1986) Union relative wages: a survey. University of Chicago Press, ChicagoMESS-DE (Ministerio do Emprego e Seguranca Social - Departamento de Estatıstica) (1994) De-
mografia das Empresas: 1982–1992. MESS-DE, LisboaMulvey G (1976) Collective agreements and relative earnings in U.K. manufacturing in 1973. Economica
43: 419–427Oaxaca R (1973) Male-female wage differentials in urban labor markets. International Economic Review
14: 693–709Oaxaca R, Ransom M (1997) Identification in detailed wage decomposition. Centre for Labour Mar-
ket and Social Research Working Paper No. 12, University of Aarhus and the Aarhus School ofBusiness, Aarhus
OECD (Organization for economic co-operation and development) (1994a) Employment OutlookOECD, Paris
OECD (organization for economic co-operation and development) (1994b) The OECD jobs study:evidence and explanations, Part II. OECD, Paris
OECD (Organization for economic co-operation and development) (1997) Employment Outlook.OECD, Paris
Pinto M (1990a) Les relations industrielles au Portugal. Office des Publications Officielles des Com-munautes Europeennes, Luxemburg
Pinto, M (1990b) Trade union action and industrial relations in Portugal. In: Baglioni G Crouch C (eds)European Industrial Relations, pp 243–264. Sage, London
Pinto M, Moura C (1973) As estruturas sindicais Portuguesas. G.I.S., LisboaRobinson C (1989) The joint determination of union status and union wage effects: some tests of
alternative models. Journal of Political Economy 97: 639–667Shah A (1984) Job attributes and the size of union/non-union wage differential. Economica 51: 437–446Soskice D (1990) Wage determination: the changing role of institutions in advanced industrialized
countries. Oxford Review of Economic Policy 6: 36–61Stewart M (1987) Collective bargaining arrangements, closed shops and relative pay. Economic Journal
97: 149–156Stewart M (1990) Union wage differentials, product market influences and the division of rents. Eco-
nomic Journal 100: 1122–1137Tarantelli E (1986) Monetary policy and the regulation of inflation and unemployment. In: Gunderson
M, Meltz N, Ostry S (eds) Unemployment: international perspectives, pp 94–102. University ofToronto Press, Toronto
Teulings CN, Hartog J (1998) Competition or corporatism? Labour contracts, institutions and wagestructures in international comparison. Cambridge University Press, Cambridge
Vieira J (1999) The evolution of wage structures in Portugal 1982–1992. Doctoral Dissertation, Tinber-gen Institute, Amsterdam