QUARTERLY ENERGY PRICES - GOV.UK
88
A National Statistics Publication QUARTERLY ENERGY PRICES DECEMBER 2014
-
Upload
khangminh22 -
Category
Documents
-
view
1 -
download
0
Transcript of QUARTERLY ENERGY PRICES - GOV.UK

A National Statistics Publication
QUARTERLY ENERGY PRICES DECEMBER 2014

This document is available in large print, audio and braille on request. Please e-mail [email protected] with the version you require.
© Crown copyright 2014
You may re-use this information (not including logos) free of charge in any format or medium, under the terms of the Open Government Licence.
To view this licence, visit www.nationalarchives.gov.uk/doc/open-government-licence/ or write to the Information Policy Team, The National Archives, Kew, London TW9 4DU, or email: [email protected].
Any enquiries regarding this publication should be sent to us at [email protected] This document is also available from our website at www.gov.uk/government/collections/quarterly-energy-prices

December 2014 1
Contents List of Tables .......................................................................................................................................... 3 List of Charts .......................................................................................................................................... 4 Update Timetable ................................................................................................................................... 5 Section 1 – Introduction ......................................................................................................................... 6 Section 2 – Domestic Prices .................................................................................................................. 8 2.1 Retail price of fuels for the domestic sector ...................................................................................... 10 2.2 Domestic electricity bills ................................................................................................................... 12 2.3 Domestic gas bills ............................................................................................................................ 12 2.4 Domestic electricity competition ....................................................................................................... 13 2.5 Domestic gas competition ................................................................................................................ 14 Section 3 – Industrial Prices ................................................................................................................ 25 3.1 Energy prices in the manufacturing sector ....................................................................................... 27 3.2 Average prices of fuels purchased by the major UK power producers and of gas at UK delivery points ...................................................................................................................................................... 28 3.3 Fuel price indices for the industrial sector ........................................................................................ 30 3.4 Gas and electricity prices for the non-domestic sector in the UK ..................................................... 31 Section 4 – Oil and Petroleum Product Prices ................................................................................... 41 4.1 Typical retail prices of petroleum products ....................................................................................... 42 4.2 Crude oil prices ................................................................................................................................ 44 Section 5 – International Comparisons .............................................................................................. 47 5.1 Premium unleaded petrol prices in the EU ....................................................................................... 48 5.2 Diesel prices in the EU ..................................................................................................................... 48 5.3 Average annual industrial electricity prices, IEA ............................................................................... 49 5.4 Average industrial electricity prices in the EU by size of consumer .................................................. 50 5.5 Average annual domestic electricity prices, IEA ............................................................................... 51 5.6 Average domestic electricity prices in the EU by size of consumer .................................................. 52 5.7 Average annual industrial gas prices, IEA ........................................................................................ 53 5.8 Average industrial gas prices in the EU by size of consumer ........................................................... 54 5.9 Average annual domestic gas prices, IEA ........................................................................................ 55 5.10 Average domestic gas prices in the EU by size of consumer ......................................................... 56 Annex A – Technical Notes ................................................................................................................. 71 Annex B – Calorific values and conversion factors .......................................................................... 79 B1: Estimated average gross calorific values of fuels 2013.................................................................... 79 B2: Estimated average gross calorific values of fuels 1980, 1990, 2000 and 2009 to 2013 ................... 80 B3: Standard conversion factors ............................................................................................................ 81 B4: Average conversion factors for petroleum ........................................................................................ 82 Annex C - Effective rates of duty on principal hydrocarbon oils, 1979 to 2014 .............................. 83 The cover illustration used for Quarterly Energy Prices and other DECC energy statistics publications is from a photograph by Peter Askew. It was a winning entry in the DTI Sports and Social Association’s 2002 Photographic Competition. URN: 14D/276D

December 2014 2
CONTACT POINTS
TO SUBSCRIBE TO ENERGY TRENDS AND QUARTERLY ENERGY PRICES For new subscription queries please telephone: SSD on 01904 455395 or write to: SSD, 2nd Floor, Foss House, 1-2 Peasholme Green, York YO1 7PX. A subscription form is also available on the DECC website: https://www.gov.uk/government/organisations/department-of-energy-climate-change/series/quarterly-energy-prices
Please direct any suggestions about changes to the content or scope of this publication to Jo Marvin ([email protected]).
This publication, including historical data, is available on the internet at https://www.gov.uk/government/organisations/department-of-energy-climate-
change/series/quarterly-energy-prices
Quarterly Energy Prices is prepared by the Energy Prices Analysis team in DECC.
Household Energy Prices Helen Lucas 0300 068 5057 [email protected] Industrial Energy Prices and Petrol Prices Jo Marvin 0300 068 5049 [email protected] International Energy Prices Helen Lucas 0300 068 5057 [email protected]
More information on DECC energy publications is available on the DECC website https://www.gov.uk/government/organisations/department-of-energy-climate-
change/about/statistics
Other Useful websites Ofgem www.ofgem.gov.uk/ DEFRA https://www.gov.uk/government/organisations/department-for-environment-food-rural-affairs HM Revenue and Customs https://www.gov.uk/government/organisations/hm-revenue-customs International Energy Agency www.iea.org Eurostat www.eurostat.ec.europa.eu/ UK Petroleum Industry Association www.ukpia.com
This is a National Statistics publication
The United Kingdom Statistics Authority has designated these statistics as National Statistics, in accordance with the Statistics and Registration Service Act 2007 and signifying compliance with the UK Statistics Authority: Code of Practice for Official Statistics. Designation can be broadly interpreted to mean that the statistics: • meet identified user needs • are well explained and readily accessible • are produced according to sound methods, and • are managed impartially and objectively in the public interest Once statistics have been designated as National Statistics it is a statutory requirement that the Code of Practice shall continue to be observed.
EXPLANATORY NOTES ARE TO BE FOUND INSIDE THE BACK COVER

December 2014 3
List of Tables Table 2.1.1: Consumer prices index UK: fuel components in the UK Table 2.1.2: Consumer prices index UK: fuel components, relative to GDP deflator Table 2.1.3: Consumer prices index: fuel components, monthly figures * Table 2.2.1: Average annual domestic standard electricity bills by home and non-home supplier Table 2.2.2: Average annual domestic standard electricity bills for UK countries Table 2.2.3: Average annual domestic standard electricity bills for selected towns and cities in the UK and
average unit costs Table 2.2.4: Average variable unit costs and fixed costs for electricity for selected towns and cities in the UK * Table 2.3.1: Average annual domestic gas bills by home and non-home supplier Table 2.3.2: Average annual domestic gas bills for GB countries Table 2.3.3: Average annual domestic gas bills for selected towns and cities in the GB and average unit costs Table 2.3.4: Average variable unit costs and fixed costs for gas for selected towns and cities in Great Britain * Table 2.4.1: Percentage of domestic electricity customers by region by supplier type Table 2.4.2: Regional variation of payment method for standard electricity Table 2.4.3: Regional variation of payment method for Economy 7 electricity * Table 2.5.1: Percentage of domestic gas customers by region by supplier type Table 2.5.2: Regional variation of payment method for gas Table 2.7.1: Transfer statistics in the domestic gas and electricity markets * Table 3.1.1: Prices of fuels purchased by manufacturing industry in Great Britain (original units) Table 3.1.2: Prices of fuels purchased by manufacturing industry in Great Britain (p/kWh) * Table 3.1.3: Annual prices of fuels purchased by manufacturing industry (original units) Table 3.1.4: Annual prices of fuels purchased by manufacturing industry (p/kWh) * Table 3.2.1: Average prices of fuels purchased by the major UK power producers and of gas at UK delivery
points Table 3.3.1: Fuel price indices for the industrial sector in current and real terms excluding CCL Table 3.3.2: Fuel price indices for the industrial sector in current and real terms including CCL Table 3.4.1: Prices of fuels purchased by non-domestic consumers in the UK excluding CCL Table 3.4.2: Prices of fuels purchased by non-domestic consumers in the UK including CCL Table 4.1.1: Typical retail prices of petroleum products and a crude oil price index Table 4.1.2: Average annual retail prices of petroleum products and a crude oil price index Table 4.1.3: Typical retail prices of petroleum products * Table 5.1.1: Premium unleaded petrol prices in the EU Table 5.2.1: Diesel prices in the EU Table 5.3.1: Industrial electricity prices in the IEA Table 5.4.1: Industrial electricity prices in the EU for small consumers * Table 5.4.2: Industrial electricity prices in the EU for medium consumers Table 5.4.3: Industrial electricity prices in the EU for large consumers * Table 5.4.4: Industrial electricity prices in the EU for extra large consumers * Table 5.5.1: Domestic electricity prices in the IEA Table 5.6.1: Domestic electricity prices in the EU for small consumers * Table 5.6.2: Domestic electricity prices in the EU for medium consumers Table 5.6.3: Domestic electricity prices in the EU for large consumers * Table 5.7.1: Industrial gas prices in the IEA Table 5.8.1: Industrial gas prices in the EU for small consumers * Table 5.8.2: Industrial gas prices in the EU for medium consumers Table 5.8.3: Industrial gas prices in the EU for large consumers * Table 5.9.1: Domestic gas prices in the IEA Table 5.10.1: Domestic gas prices in the EU for small consumers * Table 5.10.2: Domestic gas prices in the EU for medium consumers Table 5.10.3: Domestic gas prices in the EU for large consumers * (Tables marked with * are internet-only)

December 2014 4
List of Charts Chart 2.1.1: Fuel price indices in the domestic sector in real terms Q3 2011 to Q3 2014 Chart 2.1.2: Fuel price indices in the domestic sector in real terms 1996 to 2013 Chart 2.1.3: Fuel price indices in the domestic sector in real terms 1996 to 2013 Chart 2.2: Average UK combined gas and electricity bills 2007 to 2014, current prices Chart 2.2.1: Average UK annual domestic standard electricity bills 2014 Chart 2.3.1: Average GB annual domestic gas bills 2014 Chart 2.4.1: Percentage of GB domestic standard credit electricity customers not with home supplier by
region, September 2014 Chart 2.4.2: Regional variation of payment method for standard electricity, September 2014 Chart 2.5.1: Percentage of domestic standard credit gas customers not with home supplier by PES
region, September 2014 Chart 2.5.2: Regional variation of payment method for gas, September 2014 Chart 3.1.1: Percentage price movements between Q3 2013 and Q3 2014 for HFO, electricity and gas by
size of consumer for manufacturing industry Chart 3.1.2: Fuel prices paid by manufacturing industry in cash terms 1995 to 2013 Chart 3.2.1: Average price paid by UK power producers for coal, oil and natural gas Q3 2012 to Q3 2014 Chart 3.2.2: Average price paid in real terms by UK power producers for coal, oil and natural gas 1999 to
2013 Chart 3.2.3: Average price of gas at UK delivery points 1995 to 2011 in real and current terms Chart 3.3.1: Fuel price indices in real terms (including CCL) Q3 2012 to Q3 2014 Chart 3.3.2: Industrial fuel price indices in real terms including CCL 1995 to 2013 Chart 3.4.1: Average UK non-domestic electricity prices Q3 2014 Chart 3.4.2: Average UK non-domestic gas prices Q3 2014 Chart 4.1.1: Typical retail prices of motor spirits December 2012 to December 2014 Chart 4.1.2: Annual average retail price of motor spirit and diesel 1995 to 2014 Chart 4.1.3: Price of unleaded petrol and diesel December 2009 to December 2014 Chart 4.1.4: Typical retail prices of standard grade burning oil and gas oil to November 2014 Chart 4.2.1: Index of crude oil prices November 2009 to November 2014 Chart 5.1.1: Average EU premium unleaded petrol prices in pence per litre November 2014 Chart 5.2.1: Average EU diesel prices in pence per litre November 2014 Chart 5.3.1: Average industrial electricity prices in 2013, IEA Chart 5.4.1: Average industrial electricity prices for EU medium consumers January – June 2014 Chart 5.4.2: Average industrial electricity prices in the EU by size of consumer January – June 2014 Chart 5.5.1: Average domestic electricity prices in 2013, IEA Chart 5.6.1: Average domestic electricity prices for EU medium consumers January – June 2014 Chart 5.6.2: Average domestic electricity prices in the EU by size of consumer January – June 2014 Chart 5.7.1: Average industrial gas prices in 2013, IEA Chart 5.8.1: Average industrial gas prices for EU medium consumers January – June 2014 Chart 5.8.2: Average industrial gas prices in the EU by size of consumer July – December 2013 Chart 5.9.1: Average domestic gas prices in 2013, IEA Chart 5.10.1: Average domestic gas prices for EU medium consumers January – June 2014 Chart 5.10.2: Average domestic gas prices in the EU by size of consumer January – June 2014

December 2014 5
Update Timetable All tables will be updated in the March 2015 edition with the following exceptions:
Table Next update 2.1.1 January 2015 2.1.2 January 2015 2.1.3 January 2015 2.6.1 June 2015 2.6.2 June 2015 4.1.1 January 20155.1.1 January 2015 5.2.1 January 2015
Annex C As duty rates change
Future of QEP As a result of the fall in the number of subscribers, DECC have decided that the last printed edition of the Quarterly Energy Prices publication will be released on Thursday 26 March 2015. From June 2015 onwards the publication will only be available on the DECC section of the gov.uk website at: www.gov.uk/government/collections/quarterly-energy-prices.
If you have any queries or comments on this matter, please contact Jo Marvin, [email protected] , tel: 0300 068 5049.

Domestic Prices
December 2014 6
Section 1 – Introduction 1.1 Quarterly Energy Prices was first published in June 2001. The publication is available on the Internet at https://www.gov.uk/government/collections/quarterly-energy-prices , with the tables as Excel files available at https://www.gov.uk/government/organisations/department-of-energy-climate-change/about/statistics. Monthly updates on domestic energy price indices and the prices of petroleum products are posted at the same address, as are any tables affected by changes in the GDP deflator. 1.2 In this issue there are estimates of provisional annual 2014 domestic fuel bills, also provisional Q3 2014 prices for industrial consumers and major power producers. There is also a comparison of prices in the IEA with those in the UK for 2013, sourced from IEA data. The petroleum product prices are provisional December 2014 and provisional annual 2014, whilst the international unleaded petrol and diesel prices are for November 2014. 1.3 This issue also includes analyses of electricity and gas prices in the EU 15 and EU 28 countries compared to those in the UK, by size of consumer. These tables are based upon data published by Eurostat, the EU statistical office, in their ‘Statistics in Focus’ series. From January 2008, prices are for the 6-month periods from January – June and July – December for each year. The tables cover the 6-month periods from January – June 2011 to January – June 2014. 1.4 The next issue, published on 26 March 2015, will present provisional Q4 2014 and provisional annual 2014 energy prices for the manufacturing sector, industrial and domestic fuel price indices, and the price of fuels for major power producers. There will be final estimates of domestic fuel bills for 2014. The petroleum product prices table will have provisional prices for March 2015 and final annual 2014 prices, and there will be international petrol and diesel prices as at February 2015. 1.5 Data in the tables are mainly in cash prices. However, price comparisons (unless otherwise stated) refer to movements in data in real terms. These are prices from which the effects of inflation, as measured by the Gross Domestic Product (GDP) market prices deflator, have been removed. The GDP deflator provides an index of inflation in the whole economy and therefore is applicable consistently to domestic and industrial prices. 1.6 For most fuels there is a difference in the prices paid by smaller consumers, typically households, and those paid by larger consumers, usually those in the industrial sector. Indeed, there are differences in prices between large and small industrial users. In a competitive energy market, larger consumers can negotiate lower prices. A household’s energy demands may be more variable through the day and year (and therefore higher in peak price times) than those of industrial customers who use energy for continuous processes or can load manage. For these reasons the tables show prices separately for domestic and industrial consumers. Although no prices are given for commercial consumers, prices for the domestic sector should be fairly close to those for smaller commercial consumers and industrial prices should provide a reasonable proxy for larger customers in the commercial sector. The source of all data is the Department of Energy and Climate Change unless otherwise stated.

Domestic prices
December 2014 7
The main points in this edition are presented below: Domestic The price paid for domestic fuels in real terms has risen by 2.4 per cent in the year to Q3 2014.
Between Q3 2013 and Q3 2014, real terms prices for domestic electricity rose by 3.3 per cent and domestic gas prices rose by 2.9 per cent.
Provisional 2014 figures show that an average annual 2014 electricity bill across all payment types has risen by £15 (2.6 per cent) since 2013, to £592. Meanwhile, the average provisional 2014 gas bill across all payment types has risen by £24 (3.3 per cent) since 2013, to £753. These bills are based on standard consumptions of 3,800 kWh per year for electricity and 15,000 kWh per year for gas.
Between Quarter 2 2014 and Quarter 3 2014 electricity transfers increased by 6 per cent after a record low in Quarter 2 2014, based on figures provided by Ofgem. Comparing switching levels in Quarter 3 2014 to the same period in 2013, electricity transfers have increased by 5 per cent.1
Industrial Between Q3 2013 and Q3 2014, average industrial prices in real terms including the Climate
Change Levy (CCL) fell by 19 per cent for gas and by 8.6 per cent for heavy fuel oil, but increased by 4.4 per cent for electricity and 7.4 per cent for coal.
Between Q3 2013 and Q3 2014, the price of coal gas used for electricity generation has decreased by 26 per cent in cash terms, whilst the price of coal for generation has decreased by 4.6 per cent and oil by 5.3 per cent.
Oil and petroleum product prices The price of petrol in December 2014 is 8.4 per cent lower than a year ago, at 119.8 pence per
litre, whilst diesel is 10 per cent lower at 124.8 pence per litre. Petrol and diesel prices are over 20 pence lower than their peaks in April 2012.
The price of crude oil purchased by UK refineries in November 2014 was 25 per cent lower than a year ago. The price has fallen to around $70 per barrel, having previously been above $100 per barrel between February 2011 and September 2014.
International In November 2014 the UK price for petrol was fifth highest in the EU 15 at 122.5 pence per
litre, whilst the UK price for diesel was the highest in the EU 15 at 127.2 pence per litre. For January to June 2014, UK industrial electricity prices for medium consumers including tax
were the third highest in the EU 15, whilst industrial gas prices for medium consumers including tax were the second lowest in the EU 15.
For January to June 2014, UK domestic gas and electricity prices, including tax, were the second lowest and sixth lowest respectively in the EU 15.
1 For electricity, Ofgem provide switching levels which cover all suppliers in the domestic electricity market. From January 2014, Ofgem provided gas switching levels on the same basis for the first time. Previous to
this, gas switching levels only covered the main six suppliers.

Domestic Prices
December 2014 8
Section 2 – Domestic Prices Highlights
The price paid for domestic fuels in real terms has risen by 2.4 per cent in the year to Q3 2014. Between Q3 2013 and Q3 2014, real terms prices for domestic electricity rose by 3.3 per cent and domestic gas prices rose by 2.9 per cent.
The average provisional 2014 electricity bill across all payment types has risen by £15 (2.6 per cent) since 2013, to £592. Meanwhile, the average provisional 2014 gas bill across all payment types has risen by £24 (3.3 per cent) since 2013, to £753. These bills are based on standard consumptions of 3,800 kWh per year for electricity and 15,000 kWh per year for gas.
The increase in bills is due to increases in prices at the end of 2013; these rises were followed by some price reductions at the start of 2014 and the £12 electricity rebate received by customers in Great Britain in Q4 of 2014.
Between Quarter 2 2014 and Quarter 3 2014 electricity transfers increased by 6 per cent after a record low in Q2 2014, based on figures provided by Ofgem. Comparing switching levels in Quarter 3 2014 to the same period in 2013, electricity transfers have increased by 5 per cent.1
Retail price of fuels for the domestic sector 2.1.1 Domestic fuel prices in the form of consumer price indices are published in Tables 2.1.1 to 2.1.3. Table 2.1.3 also contains data on the average prices of coal, smokeless fuel and heating oil.
2.1.2 UK wholesale gas prices have been increasing since the early 2000’s, due to upward pressure on prices in Europe and the decline of UK Continental Shelf gas production. Electricity prices have risen, as gas is an important part of the UK generation mix, and also as a result of higher coal prices, wholesale electricity prices rising from unsustainably low levels, and the introduction of the EU Emissions Trading scheme in 2005. 2.1.3 Liquid fuels (heating oil) prices typically follow crude oil prices. Between 2004 and 2008, prices increased strongly, following crude oil price rises, although they began to decrease after a peak in mid-2008. Liquid fuels prices increased again to reach a new high in real terms in 2012, but in 2013 prices fell slightly in real terms. 2.1.4 Motor fuel prices also follow crude oil prices, with variations according to Budget increases in the duty payable on petrol and diesel and changes to the rate of VAT.
Domestic gas and electricity bills 2.2.1 Electricity and gas prices in the domestic sector are presented in Tables 2.2.1 to 2.3.3 in the form of average annual bills. These bills relate to the total amount charged during the year, rather than being based on the latest prices, and are calculated assuming annual consumption of 3,800 kWh for standard electricity and 15,000 kWh for gas.2 Consistent consumption over time enables comparisons of the effects of actual price changes to be made, whilst excluding any change in consumption. Actual average domestic consumption of both gas and electricity varies from year to year due to changes in weather and energy efficiency improvements. 1 For electricity, Ofgem provide switching levels which cover all suppliers in the domestic electricity market. From January 2014, Ofgem provided gas switching levels on the same basis for the first time. Previous to
this, gas switching levels only covered the main six suppliers. 2 See March 2014 Energy Trends article for more details: https://www.gov.uk/government/collections/energy-trends-articles

Domestic prices
December 2014 9
2.2.2 All six of the major domestic energy suppliers effected price increases at the end of 2013 or start of 2014. Four of the six subsequently effected price decreases in the first quarter of 2014 in response to Government changes to the costs of some energy policies. Overall, the changes reflect an average increase in gas and electricity prices of around 5 per cent. In Q4 2014 a £12 government rebate was applied to domestic electricity customers in Great Britain. 2.2.3 Provisional average electricity and gas bills in 2014 were higher than 2013 bills, mainly due to price rises implemented in late 2013. These price rises are lower than seen in previous years, which are partially accounted for by a small price fall in Q1 2014 and the £12 electricity rebate received by customers in Great Britain in Q3 of 2014.
2.2.4 The tables show that electricity and gas customers on direct debit paid, on average, less than customers on other payment methods. For domestic customers, electricity and gas bills in 2014 are, on average, also higher for home suppliers (the original supplier in any given area) than for non-home suppliers.
Domestic gas and electricity competition 2.3.1 Competition in domestic electricity supply began on 14 September 1998 with 750,000 consumers in four areas, and was gradually extended to all consumers in Great Britain by 24 May 1999. The first trial in competitive gas supply started in April 1996 in South West England, with all customers able to choose their gas supplier by May 1998. In Northern Ireland the market is now beginning to open up to competition, after being monopolistic for many years, although two suppliers still currently supply the vast majority of the market. Gas is still not yet widely available in Northern Ireland, although the number of customers with access to the gas grid is increasing. 2.3.2 The number of transfers in the domestic electricity market, based on data provided by Ofgem, increased by 5 per cent between 2013 quarter 3 and 2014 quarter 3, with an estimated 731,000 transfers in 2014 quarter 3 compared with 696,000 transfers in the same period last year. Data for gas are available in Table 2.7.1 but are affected by a methodology change in 2014 so published growth rates are artificially high. Since quarter 2 of 2014, electricity transfers have increased by 6 per cent and gas transfers have decreased by 12 per cent. Switching rates though remain low compared to levels in previous years. An alternative data set for electricity transfers is published by Energy UK. This shows a broadly similar pattern and indicates that there has been a growth in switching to the new entrants in the domestic electricity supply market.

Domestic Prices
December 2014 10
0
20
40
60
80
100
120
140
1996
1997
1998
1999
2000
2001
2002
2003
2004
2005
2006
2007
2008
2009
2010
2011
2012
2013
Ind
ex 2
010=
100
Solid fuels Electricity
Gas
2.1 Retail price of fuels for the domestic sector Table 2.1.1: Consumer prices index: fuel components in the UK Table 2.1.2: Consumer prices index: fuel components, relative to GDP deflator Table 2.1.3: Consumer prices index: fuel components, monthly figures *
Chart 2.1.1 Fuel price indices in the domestic sector in real terms(1) Q3 2011 to Q3 2014
Source: ONS, Consumer prices index
Chart 2.1.2 Fuel price indices in the domestic sector in real terms(1) 1996 to 2013
Source: ONS, Consumer prices index
The prices paid for all domestic fuels rose by 2.4 per cent in real terms between Q3 2013 and Q3 2014.
Domestic electricity prices,
including VAT, rose by 3.3 per cent in real terms between Q3 2013 and Q3 2014. Domestic gas prices, including VAT, rose by 2.9 per cent in real terms over the same period.
Prices of liquid fuels, including
VAT, fell by 11.9 per cent in real terms between Q3 2013 and Q3 2014 whilst motor fuel and oil prices, including VAT, fell by 6.9 per cent. Prices of oil products have been falling since Q3 2013, following the price of crude oil.
The price of solid fuels rose
marginally in real terms between Q3 2013 and Q3 2014.
The prices paid for the combined all domestic fuels series rose by 5.4 per cent in real terms between 2012 and 2013 to reach a new high in real terms.
Annual average domestic
electricity prices, including VAT, rose by 5.6 per cent in real terms between 2012 and 2013 to reach a new high in real terms. Domestic gas prices, including VAT, rose by 5.9 per cent in real terms during the same period and also reached a new high.
Prices for domestic solid fuels in
2013 fell by 0.2 per cent in real terms from the high reached in 2012.
(1) Adjusted for inflation using the GDP (market prices) deflator.
(1) Adjusted for inflation using the GDP (market prices) deflator.
0
20
40
60
80
100
120
140
160
Q3
2011
Q4
2011
Q1
2012
Q2
2012
Q3
2012
Q4
2012
Q1
2013
Q2
2013
Q3
2013
Q4
2013
Q1
2014
Q2
2014
Q3
2014
Ind
ex 2
010=
100
Motor fuel & oil Solid fuels
Liquid fuels Gas
Electricity

Domestic prices
December 2014 11
0
20
40
60
80
100
120
14019
96
1997
1998
1999
2000
2001
2002
2003
2004
2005
2006
2007
2008
2009
2010
2011
2012
2013
Ind
ex 2
010=
100
Motor fuel & oil
Liquid fuels
‐
200
400
600
800
1,000
1,200
1,400
1,600
2007 2008 2009 2010 2011 2012 2013 2014
Combined average bill (£s)
Gas Electricity
Chart 2.1.3 Fuel price indices in the domestic sector in real terms(1) 1996 to 2013
Source: ONS, Consumer prices index
Chart 2.2 Average UK combined gas and electricity bills 2007 to 2014, current prices
Prices of petroleum products in 2013 fell slightly from the real term highs reached in 2012.
The annual average price of
domestic liquid fuels decreased by 1.3 per cent between 2012 and 2013.
Motor fuel and oil prices decreased
by 2.7 per cent between 2012 and 2013.
(1) Adjusted for inflation using the GDP (market prices) deflator.
This chart shows average provisional standard domestic energy bills, in cash terms, produced from average provisional domestic electricity and gas bills as published in tables 2.2.1 and 2.3.1
Combined provisional gas and
electricity bills are estimated to have grown by £39 (3.0 per cent) between 2013 and 2014 to £1,345.
Bills are based on fixed annual
consumption levels of 15,000kWh for gas and 3,800kWh for electricity. An article examining bills based on actual annual consumption was published in March 2014’s Energy Trends: https://www.gov.uk/government/collections/energy-trends-articles

Domestic Prices
December 2014 12
Provisional average electricity bills in 2014 increased by £15 (to £592) compared to average 2013 bills.
Figures for 2014 show that a
standard credit customer with a non-home supplier, on average, paid £40 less than a customer who had not changed supplier. Equivalent savings for direct debit and prepayment customers were £31 and £37 respectively.
The bill estimates have taken
account of the £12 rebate received by customers in Great Britain.
650
700
750
800
850
Standard credit Direct debit Prepayment
Ave
rag
e b
ill (
£s)
Home suppliers Non-home suppliers All consumers
0
500
550
600
650
700
Standard credit Direct debit Prepayment
Ave
rag
e b
ill (
£s)
Home suppliers Non-home suppliers All consumers
0
2.2 Domestic electricity bills Table 2.2.1: Average annual domestic electricity bills, by home and non-home supplier Table 2.2.2: Average annual domestic electricity bills for UK countries Table 2.2.3: Average annual domestic electricity bills for selected towns and cities in the UK Chart 2.2.1 Average UK annual domestic standard electricity bills 2014
2.3 Domestic gas bills Table 2.3.1: Average annual domestic gas bills, by home and non-home supplier Table 2.3.2: Average annual domestic gas bills for GB countries Table 2.3.3: Average annual domestic gas bills for selected towns and cities in Great Britain. Chart 2.3.1 Average GB annual domestic gas bills 2014
Provisional average gas bills in 2014 increased by £24 (to £753) compared to average 2013 bills.
Figures for 2014 show that a
standard credit customer with a non-home supplier, on average, paid £56 less than a customer who had not changed supplier. Equivalent savings for direct debit customers were £65.
Figures for 2014 show that
prepayment customers with a non-home supplier, on average, paid £55 less than those with their home supplier.

Domestic prices
December 2014 13
0
10
20
30
40
50
60
70
80
Wes
t Mid
land
s
Nor
th E
ast
Yo
rksh
ire
Nor
th W
est
Ea
ste
rn
Ea
st M
idla
nds
Mer
seys
ide
& N
Wal
es
So
uth
Eas
t
So
uth
Wes
t
Lond
on
So
uth
Sco
tland
So
uthe
rn
So
uth
Wal
es
Nor
th S
cotla
nd
GB
Ave
rage
Per
cen
tag
e (%
)
0102030405060708090
100
So
uthe
rn
So
uth
Eas
t
So
uth
Wes
t
Ea
ste
rn
Nor
th E
ast
Ea
st M
idla
nds
Nor
th S
cotla
nd
Wes
t Mid
land
s
So
uth
Sco
tland
Yo
rksh
ire
Nor
th W
est
So
uth
Wal
es
Mer
seys
ide
& N
…
Lond
on
Nor
ther
n Ir
elan
d
UK
Ave
rage
Per
cen
tag
e (%
)
Direct Debit Standard Credit Prepayment
2.4 Domestic electricity competition Table 2.4.1: Percentage of domestic electricity customers by region by supplier type Table 2.4.2: Regional variation of payment method for standard electricity Table 2.4.3: Regional variation of payment method for Economy 7 electricity* At the end of September 2014, DECC estimates that 17.9 million (63 per cent of) domestic electricity customers in Great Britain were no longer with their home supplier. Charts below and Tables 2.4 are based on DECC price surveys, which currently do not include most smaller suppliers, so will under-estimate the proportion of customers not with their home supplier. DECC is considering options to expand data coverage. Chart 2.4.1 Percentage of GB domestic electricity customers not with home supplier by region, September 2014
Chart 2.4.2 Regional variation of payment method for standard electricity, September 2014
Direct Debit customers were most likely to have transferred, with 67 per cent of customers no longer with their home supplier.
Customers paying by Standard
Credit were the least likely to have switched supplier, with only 57 per cent of customers with a non-home supplier at the end of September 2014.
Overall, customers in North Scotland were the least likely to have switched, with around 66 per cent still with their home supplier.
In September 2014, 27 per cent of standard electricity customers in the UK paid by standard credit, 56 per cent by direct debit, and 17 per cent by pre-payment meter. Direct debit is the cheapest payment method for domestic fuel.
The Southern region had the
highest proportion of standard electricity customers paying by direct debit, at 64 per cent. Northern Ireland had the lowest percentage of direct debit customers at 38 per cent.
Northern Ireland had the highest
percentage of pre-payment customers in the UK, at 36 per cent. The South Eastern region of England had the lowest percentage of pre-payment customers, at 10 per cent.

Domestic Prices
December 2014 14
0
10
20
30
40
50
60
70
80
So
uth
Wal
es
Nor
th S
cotla
nd
Nor
th E
ast
So
uth
Eas
t
Ea
st M
idla
nds
So
uthe
rn
So
uth
Sco
tland
So
uth
Wes
t
Yo
rksh
ire
Ea
ste
rn
Wes
t Mid
land
s
Nor
th W
est
Mer
seys
ide
& N
Wal
es
Lond
on
GB
Ave
rage
Per
cen
tag
e (%
)
0102030405060708090
100
So
uthe
rn
So
uth
Eas
t
So
uth
Wes
t
Ea
st M
idla
nds
Ea
ste
rn
Nor
th S
cotla
nd
Nor
th E
ast
So
uth
Sco
tland
Wes
t Mid
land
s
Nor
th W
est
Yo
rksh
ire
So
uth
Wal
es
Mer
seys
ide
& N
…
Lond
on
Gre
at B
ritai
n
Per
cen
tag
e (%
)
Direct debit Credit Prepayment
2.5 Domestic gas competition Table 2.5.1: Percentage of domestic gas customers by region by supplier type Table 2.5.2: Regional variation of payment method for gas At the end of September 2014, DECC estimates that 14.0 million (62 per cent of) domestic gas customers in Great Britain were no longer with their home supplier. Charts below and tables 2.5 are based on DECC price surveys, which currently do not include most smaller suppliers, so will under-estimate the proportion of customers not with their home supplier. DECC is considering options to expand data coverage. Chart 2.5.1 Percentage of domestic gas customers not with home supplier by PES region, September 2014
Chart 2.5.2 Regional variation of payment method for gas, September 2014
Direct Debit customers were most likely to have transferred, with 68 per cent of customers no longer with their home supplier.
Customers paying for their gas by
Standard Credit were the least likely to have switched supplier, with only 44 per cent of customers with a non-home supplier.
Overall, customers in the London region were the least likely to have switched, with 50 per cent still with their home supplier.
At the end of September 2014, 28 per cent of gas customers in Great Britain paid by standard credit, 57 per cent paid by direct debit, and 15 per cent paid by pre-payment meter.
The Southern region of England
had the highest proportion of gas customers paying by direct debit, at 64 per cent. The London region had the lowest percentage of gas customers paying by direct debit, at 43 per cent. Direct debit is the cheapest payment method for domestic fuel.
Merseyside and North Wales had
the highest percentage of gas pre-payment customers in GB, at 21 per cent. The Southern region of England had the lowest percentage of gas pre-payment customers, at 10 per cent.

Table 2.1.1 Consumer prices index: fuel components(1)(2)
United Kingdom
Motor CPISolid Liquid Domestic fuel & all
fuels Gas Electricity fuels fuels(3) oil(4) ItemsCurrent fuel price index numbers 2010=100
1996 45.0 43.2 62.3 34.9 51.5 48.2 76.9
1997 45.4 42.8 59.3 32.0 50.1 52.9 78.3
1998 45.8 41.4 56.6 24.7 48.0 55.6 79.6
1999 46.7 41.4 55.9 28.1 47.9 60.3 80.6
2000 47.5 40.5 54.7 42.9 48.0 68.2 81.3
2001 49.8 41.7 54.2 40.3 48.2 64.7 82.3
2002 52.3 44.3 54.5 36.4 49.3 62.7 83.3
2003 53.4 45.2 55.1 40.4 50.2 65.0 84.5
2004 56.2 48.4 58.4 47.6 53.6 68.6 85.6
2005 61.9 55.3 64.6 64.7 60.6 74.6 87.3
2006 66.6 72.6 78.6 73.5 75.7 78.7 89.3
2007 71.4 78.2 84.8 73.2 81.1 81.0 91.4
2008 85.0 93.3 98.1 109.3 96.1 93.0 94.8
2009 100.0 105.9 102.6 77.0 102.9 85.7 96.8
2010 100.0 100.0 100.0 100.0 100.0 100.0 100.0
2011 104.9 110.8 107.2 126.6 109.9 114.7 104.5
2012 108.6 122.5 113.4 130.5 118.7 116.9 107.4
2013 110.2 131.9 121.7 130.9 127.2 115.7 110.1 % Change
+1.5 +7.7 +7.3 +0.3 +7.2 -1.1 +2.5 2012 Q3 107.2 121.1 112.3 127.2 117.3 116.2 107.4
2012 Q4 108.9 124.8 115.0 134.0 120.8 116.5 108.7
2013 Q1 109.5 130.8 120.5 139.8 126.4 117.1 109.3
2013 Q2 109.3 131.3 120.9 127.9 126.4 115.7 110.0
2013 Q3 109.8 131.3 121.4 129.0 126.6 116.9 110.4
2013 Q4 112.1 134.2 124.0 126.7 129.2 112.9 111.0
2014 Q1 113.3 138.7 129.1 124.0 133.7 111.8 111.1
2014 Q2 112.8 137.9 128.2 118.5 132.6 111.6 111.9
2014 Q3 112.3 137.9 128.2 116.0 132.5 111.3 112.0 % Change
+2.3 +5.1 +5.6 -10.0 +4.6 -4.8 +1.4
2012-2013
Q3 2013-Q3 2014
Source : Office for National Statistics (ONS)(1) Series are annually weighted. Figures include VAT where applicable. The VAT rate for
coal and coke, gas, electricity and heating oils was 8% from the 2nd quarter of 1994 and 5% from the 4th quarter of 1997 (the rate changed on 1st September.)
(2) Monthly figures are available in Table 2.1.3 on the DECC website. (3) Aggregate of individual solid fuels, gas, electricity and liquid fuels indices.(4) ULSP, ULSD & motor oil.Other fuels are as defined by ONS. See Annex A for further details.
15

United Kingdom
Motor CPISolid Liquid Domestic fuel & all GDP
fuels Gas Electricity fuels fuels(4) oil(5) Items deflatorFuel price index numbers 2010=100 relative to the GDP deflator
1996 62.4 59.9 86.4 48.4 71.5 66.8 106.7 72.1
1997 61.2 57.7 79.9 43.1 67.5 71.4 105.6 74.2
1998 60.9 55.0 75.1 32.8 63.7 73.8 105.7 75.3
1999 61.4 54.4 73.5 36.9 63.0 79.2 105.9 76.1
2000 61.0 52.0 70.3 55.1 61.6 87.6 104.4 77.9
2001 63.1 52.9 68.7 51.1 61.1 82.0 104.3 78.9
2002 64.7 54.8 67.4 45.0 60.9 77.5 103.0 80.9
2003 64.7 54.7 66.7 48.9 60.7 78.6 102.2 82.6
2004 66.1 56.9 68.6 55.9 63.0 80.6 100.6 85.1
2005 70.8 63.3 73.9 74.0 69.4 85.3 99.9 87.4
2006 74.2 80.9 87.5 81.8 84.3 87.6 99.5 89.8
2007 77.3 84.7 91.9 79.3 87.9 87.7 99.1 92.3
2008 89.3 98.1 103.1 114.9 101.1 97.8 99.6 95.1
2009 103.2 109.2 105.9 79.4 106.1 88.4 99.9 96.9
2010 100.0 100.0 100.0 100.0 100.0 100.0 100.0 100.0
2011 102.7 108.6 105.0 124.0 107.6 112.3 102.3 102.1
2012 104.5 117.9 109.1 125.6 114.2 112.5 103.4 103.9
2013 104.4 124.9 115.2 123.9 120.4 109.5 104.3 105.6
% Change -0.2 +5.9 +5.6 -1.3 +5.4 -2.7 +0.9 +1.6
2012 Q3 103.0 116.4 107.8 122.2 112.7 111.6 103.2 104.1
2012 Q4 104.3 119.6 110.2 128.4 115.7 111.6 104.2 104.4
2013 Q1 104.5 124.8 114.9 133.4 120.6 111.7 104.3 104.8
2013 Q2 103.9 124.8 114.9 121.6 120.1 110.0 104.6 105.2
2013 Q3 103.4 123.6 114.3 121.4 119.2 110.1 103.9 106.2
2013 Q4 105.5 126.2 116.7 119.2 121.6 106.2 104.4 106.3
2014 Q1 106.5 130.4 121.3 116.5 125.7 105.1 104.4 106.4
2014 Q2 104.9 128.3 119.3 110.2 123.4 103.8 104.1 107.5
2014 Q3 103.5 127.1 118.2 107.0 122.1 102.5 103.2 108.5
% Change +0.1 +2.9 +3.3 -11.9 +2.4 -6.9 -0.7 +2.2
Table 2.1.2 Consumer prices index: fuel components, relative to GDP
deflator(1)(2)(3)
2012-2013
Q3 2013-Q3 2014
Source : Office for National Statistics (ONS)(1) Series are annually weighted. Figures include VAT where applicable. The VAT rate for coal and coke,
gas, electricity and heating oils was 8% from the 2nd quarter of 1994 and 5% from the 4th quarter of 1997 (the rate changed on 1st September.)
(2) Deflated using GDP (market prices) deflator(3) Monthly figures are available in Table 2.1.3 on the DECC website. (4) Aggregate of individual solid fuels, gas, electricity and liquid fuels indices.(5) ULSP, ULSD & motor oil.Other fuels are as defined by ONS. See Annex A for further details.
16

United KingdomPounds
OverallHome supp-
liers
Non-home
suppliersAll cons-
umers
Home supp-
liers
Non-home
suppliersAll cons-
umers
Home supp-
liers
Non-home
suppliersAll cons-
umers UKCash terms
1996 .. .. 336 .. .. 330 .. .. 359 338 1997 .. .. 322 .. .. 315 .. .. 342 323 1998 .. .. 303 .. .. 293 .. .. 323 303 1999 301 277 299 290 265 287 318 306 318 298 2000 294 273 291 283 262 278 312 309 311 289 2001 288 268 283 278 258 271 304 297 303 282 2002 290 264 282 281 253 269 306 290 300 280 2003 292 268 283 282 257 270 304 296 301 281 2004 300 275 291 292 262 277 318 299 311 288 2005 334 308 322 321 291 305 350 337 345 318 2006 388 376 382 371 343 355 402 414 407 374 2007(3)
442 408 428 420 378 395 450 441 446 415 2008 511 468 492 489 430 454 521 507 514 477 2009 532 481 507 501 446 466 535 501 519 488 2010 517 469 493 484 436 453 522 489 505 474 2011 554 515 533 516 481 493 558 529 542 513 2012 584 549 565 543 511 521 588 552 568 542 2013 621 588 602 579 548 557 625 594 605 577 2014(4) 641 601 618 591 560 570 645 608 623 592
% Change 2013-2014 +3.2 +2.2 +2.7 +2.1 +2.2 +2.3 +3.2 +2.4 +3.0 +2.6
Real terms (2)
1996 .. .. 466 .. .. 458 .. .. 498 468 1997 .. .. 435 .. .. 424 .. .. 461 435 1998 .. .. 403 .. .. 389 .. .. 429 402 1999 395 364 392 381 348 378 418 402 418 392 2000 378 350 373 363 337 357 400 397 399 371 2001 366 340 358 353 327 344 385 376 383 357 2002 358 326 348 347 313 333 378 359 371 346 2003 353 325 342 341 311 327 368 358 365 340 2004 352 323 342 343 308 326 374 352 365 338 2005 382 352 369 368 333 350 401 385 394 364 2006 432 418 426 414 382 396 448 461 453 416
2007(3) 479 442 463 455 410 428 487 478 484 450 2008 538 493 517 515 453 478 548 533 541 501 2009 550 496 523 517 460 481 553 517 535 504 2010 517 469 493 484 436 453 522 489 505 474 2011 543 505 522 505 471 483 547 518 531 502 2012 562 529 544 522 492 502 566 532 546 521 2013 588 557 570 548 519 527 592 562 573 547 2014(4) 595 558 574 548 520 529 599 565 578 550
% Change 2013-2014 +1.2 +0.2 +0.7 0.0 +0.2 +0.4 +1.2 +0.5 +0.9 +0.5
Table 2.2.1 Average annual domestic standard electricity bills by home and non-
home supplier based on consumption of 3,800kWh/year(1)
Standard credit Direct debit Prepayment
(1) Bills up to (and including) 2006 relate to total bill received in the year, e.g. covering consumption from Q4 ofthe previous year to Q3 of the named year. Bills up to 1998 relate to home supplier only.All bills are calculated assuming an annual consumption of 3,800 kWh. Figures are inclusive of VAT.Home supplier denotes the former public electricity suppliers within their own distribution areas.Non-home suppliers are new entrant suppliers and the former electricity suppliers outside of their own areas.
(2) Bills deflated to 2010 terms using the GDP (market prices) deflator. An estimate of the 2014 GDP deflator has been used.
(3) Bills from 2007 on are subject to a change in methodology. Bills relate to the calendar year, i.e. coveringconsumption from Q1 to Q4 of the named year. More information can be found in the methodology note at:https://www.gov.uk/government/publications/domestic-energy-prices-data-sources-and-methodology
(4) In Q4 2014 a £12 Government rebate was applied to electricity bills for all customers in Great Britain. This isincluded in the figures above.
17

Pounds
England & Wales Scotland
Northern Ireland
England & Wales Scotland
Northern Ireland
England & Wales Scotland
Northern Ireland
Cash terms1996 334 336 410 328 332 411 357 355 441 1997 320 320 398 312 316 400 340 335 425 1998 301 311 369 291 307 360 321 326 391 1999 294 309 369 285 300 360 316 323 391 2000 286 304 348 276 294 340 308 317 356 2001 278 302 359 268 290 349 298 313 373 2002 276 302 368 266 291 358 296 314 364 2003 277 303 368 267 294 358 296 317 363 2004 284 324 372 272 309 362 303 337 369 2005 318 354 383 301 332 369 341 358 374 2006 379 409 407 352 380 393 403 433 397 2007(3) 426 448 426 394 408 412 446 466 416 2008 490 506 516 453 457 498 513 529 503 2009 502 530 592 462 479 570 512 533 577 2010 488 516 571 449 470 549 499 520 557 2011 529 551 603 490 505 580 537 548 588 2012 561 580 648 519 531 614 563 565 626 2013 599 616 634 555 564 600 605 609 608 2014(4) 616 623 685 568 572 645 620 616 663
% Change 2013-2014 +2.8 +1.1 +8.0 +2.3 +1.4 +7.5 +2.5 +1.1 +9.0
Real terms(2)
1996 463 466 568 455 460 570 495 492 611 1997 431 431 537 421 425 539 458 452 573 1998 400 413 490 386 407 478 426 433 519 1999 387 406 485 375 394 473 415 424 514 2000 367 391 447 354 378 436 396 407 457 2001 353 383 455 340 367 442 378 396 473 2002 341 373 454 328 359 442 366 388 450 2003 336 367 445 323 356 433 358 384 439 2004 334 381 437 319 364 426 356 396 433 2005 364 405 438 345 380 422 390 410 428 2006 422 456 453 392 423 437 449 482 442 2007(3) 461 485 462 427 442 447 483 505 451 2008 515 532 542 476 481 523 539 557 529 2009 518 547 611 477 495 588 528 550 595 2010 488 516 571 449 470 549 499 520 557 2011 518 540 590 480 494 568 526 537 576 2012 540 558 624 499 511 591 542 544 603 2013 568 583 600 525 534 569 573 576 576 2014(4) 572 578 636 527 531 598 576 572 615
% Change 2013-2014 +0.7 -0.9 +6.0 +0.4 -0.6 +5.1 +0.5 -0.7 +6.8
Table 2.2.2 Average annual domestic standard electricity bills for UK countries
based on consumption of 3,800kWh/year(1)
Standard credit Direct debit Prepayment
(1) Bills up to (and including) 2006 relate to total bill received in the year, i.e. covering consumption from Q4of the previous year to Q3 of the named year. Bills up to 1998 relate to home supplier only. All bills are calculated assuming an annual consumption of 3,800 kWh. Figures are inclusive of VAT.
(2) Bills deflated to 2010 terms using the GDP (market prices) deflator. An estimate of the 2014 deflator has been used. (3) Bills from 2007 on are subject to a change in methodology. Bills relate to the calendar year, i.e. covering
consumption from Q1 to Q4 of the named year. More information can be found in the methodology note at:
(4) In Q4 2014 a £12 Government rebate was applied to electricity bills forall customers in Great Britain. This isincluded in the figures above.
https://www.gov.uk/government/publications/domestic-energy-prices-data-sources-and-methodology
18

Table 2.2.3 Average annual domestic standard electricity bills in 2014(3)
3,800kWh/year(1)
Pence per kWh and pounds
Payment type
Region(2)Unit cost Bill
Unit cost Bill
Unit cost Bill
Unit cost Bill
East Midlands 15.58 592 14.42 548 15.71 597 14.94 568
Eastern 15.62 594 14.42 548 15.73 598 14.93 567
London 15.99 608 14.78 562 16.08 611 15.51 589
Merseyside & North Wales 17.45 663 16.04 610 17.32 658 16.68 634
North East 16.28 619 14.96 568 16.22 616 15.50 589
North Scotland 17.55 667 16.21 616 17.59 669 16.79 638
North West 16.33 620 15.12 575 16.44 625 15.69 596
Northern Ireland 18.04 685 16.96 645 17.44 663 17.41 662
South East 16.07 611 14.82 563 16.17 614 15.29 581
South Scotland 15.99 608 14.65 557 15.83 601 15.21 578
South Wales 17.04 648 15.73 598 17.15 652 16.36 622
South West 16.98 645 15.76 599 17.09 649 16.26 618
Southern 16.16 614 14.92 567 16.23 617 15.37 584
West Midlands 16.35 621 14.88 565 16.22 616 15.52 590
Yorkshire 16.15 614 14.71 559 15.97 607 15.33 583
UK(4) 16.27 618 15.00 570 16.38 623 15.57 592
for UK regions with average unit costs based on consumption of
Credit Direct debit Prepayment Overall
(1) All bills are calculated assuming an annual consumption of 3,800 kWh. Bills and unit costs reflect theprices of all suppliers and include standing charges. Figures are inclusive of VAT. Bills relate to calendaryear, i.e.covering consumption from Q1 to Q4 of the named year. Unit costs are calculated by dividingthe bills shown by the relevant consumption levels.
(2) From 2013 onwards regional electricity bills are shown based on Public Electricity Supply (PES) regioninstead of selected towns and cities within that region.
(3) In Q4 2014 a £12 Government rebate was applied to electricity bills for all customers in Great Britain. Thisis included in the figures above.
(4) DECC have ceased publication of maximum and minimum bills. As proposed in Energy Trends article:
https://www.gov.uk/government/uploads/system/uploads/attachment_data/file/323447/Energy_price_variation_in_the_domestic_energy_market.pdf
19

Great Britain Pounds
OverallHome supp-
liers
Non-home
suppliersAll cons-
umers
Home supp-
liers
Non-home
suppliersAll cons-
umers
Home supp-
liers
Non-home
suppliersAll cons-
umers GBCash terms
1996 283 262 283 263 246 263 300 300 300 277 1997 282 238 281 262 227 262 299 288 299 275 1998 274 225 270 240 213 237 284 279 284 259 1999 271 225 261 234 214 229 272 280 272 250 2000 265 223 253 233 211 226 265 277 266 242 2001 264 224 251 234 211 227 264 273 265 242 2002 279 234 266 252 221 240 280 280 280 253 2003 287 248 274 258 235 250 287 294 288 262 2004 294 265 285 271 253 264 304 293 301 277 2005 344 303 331 311 289 302 348 332 344 317 2006 437 366 406 387 342 362 441 400 427 387 2007(3) 467 450 459 408 419 415 502 474 491 441 2008 536 535 536 492 497 495 573 540 558 517 2009 613 599 607 565 552 556 653 620 636 582 2010 591 578 586 560 539 546 590 580 584 564 2011 654 629 643 627 582 597 654 624 638 617 2012 741 691 720 711 637 661 738 688 710 686 2013 791 736 767 752 677 701 784 738 758 729 2014 821 765 796 765 700 721 823 768 792 753
% Change 2013-2014 +3.8 +3.9 +3.8 +1.7 +3.4 +2.9 +5.0 +4.1 +4.5 +3.3
Real terms (2)
1996 392 364 392 365 341 365 416 416 416 384 1997 380 321 379 354 306 354 403 388 403 371 1998 364 299 359 319 283 314 377 371 377 344 1999 356 296 344 308 281 301 357 368 358 328 2000 340 286 325 298 271 290 340 355 342 311 2001 335 284 318 297 268 288 334 346 336 307 2002 345 289 328 312 273 297 346 346 346 313 2003 348 300 332 313 285 302 347 356 349 317 2004 346 311 335 319 297 310 357 344 353 326 2005 394 347 379 356 331 345 398 379 393 363 2006 487 408 452 431 381 404 491 445 475 431 2007(3) 506 488 498 442 453 449 544 514 532 478 2008 564 562 563 517 523 520 602 568 586 544 2009 632 618 626 583 569 574 674 640 656 600 2010 591 578 586 560 539 546 590 580 584 564 2011 640 616 630 614 570 585 641 612 625 605 2012 713 665 693 685 613 637 710 662 683 660 2013 749 697 726 712 641 664 742 699 718 690 2014 762 710 739 710 650 670 764 713 735 699
% Change 2013-2014 +1.7 +1.9 +1.8 -0.3 +1.4 +0.9 +3.0 +2.0 +2.4 +1.3
Table 2.3.1 Average annual domestic gas bills by home and non-home
supplier based on consumption of 15,000kWh/year(1)
Standard credit Direct debit Prepayment
(1) Bills up to (and including) 2006 relate to total bill received in the year, i.e. covering consumption from Q4 of theprevious year to Q3 of the named year. All bills are calculated using an annual consumption of 15,000 kWh. Figures are inclusive of VAT.Home supplier denotes British Gas Trading. Non-home suppliers are all other suppliers.
(2) Bills deflated to 2010 terms using the GDP (market prices) deflator. An estimate of the 2014 deflator has been used.(3) Bills from 2007 on are subject to a change in methodology. Bills relate to the calendar year, i. e. covering
consumption from Q1 to Q4 of the named year. The assumed gas consumption pattern has also been altered
https://www.gov.uk/government/publications/domestic-energy-prices-data-sources-and-methodology
20

Pounds
England & Wales Scotland
England & Wales Scotland
England & Wales Scotland
Cash terms
1998(2) 270 268 237 235 284 284 1999 261 263 229 229 272 272 2000 253 255 226 224 266 266 2001 251 253 227 225 265 264 2002 266 267 240 238 280 280 2003 274 274 250 249 288 287 2004 285 284 264 260 301 301 2005 331 329 302 297 343 343 2006 407 402 363 357 427 429
2007(4) 460 454 416 403 491 493 2008 536 529 497 476 557 560 2009 607 596 557 541 636 637 2010 586 576 547 535 584 582 2011 644 638 598 589 638 634 2012 720 712 662 653 711 703 2013 768 758 702 690 759 751 2014 797 789 722 716 794 782
% Change
2013-2014 +3.8 +4.1 +2.8 +3.8 +4.6 +4.1
Real terms(3)
1998(2) 359 356 314 312 377 377 1999 342 346 301 302 358 358 2000 325 327 290 288 342 341 2001 318 320 288 285 336 334 2002 328 330 297 295 346 346 2003 332 332 302 301 349 347 2004 335 334 310 306 354 353 2005 378 377 345 340 393 392 2006 453 448 404 398 475 478
2007(4) 499 492 451 436 532 534 2008 564 556 523 500 586 589 2009 627 615 575 559 656 657 2010 586 576 547 535 584 582 2011 631 625 586 576 625 621 2012 693 685 637 628 684 676 2013 727 718 665 653 719 711 2014 740 733 670 664 737 726
% Change 2013-2014 +1.8 +2.1 +0.8 1.7 +2.5 +2.1
Table 2.3.2 Average annual domestic gas bills for GB countries based on
consumption of 15,000kWh/year(1)
Standard Credit Direct debit Prepayment
(1) Bills upto (and including) 2006 relate to total bill received in the year, i.e. covering consumption fromQ4 of the previous year to Q3 of the named year. All bills are calculated using an annual consumption of 15,000 kWh. Figures are inclusive of VAT.
(2) Prior to 1998, average bills for England & Wales and Scotland were all the same as the GB averages given in Table 2.3.1.
(3) Bills deflated to 2010 terms using the GDP (market prices) deflator. An estimate of the 2014 deflator hasbeen used.
(4) Bills from 2007 on are subject to a change in methodology. Bills relate to the calendar year, i.e.covering consumption from Q1 to Q4 of the named year. The assumed gas consumption pattern hasalso been altered to more accurately reflect real consumption patterns. More information can be found in the methodology note at:
. https://www.gov.uk/government/publications/domestic-energy-prices-data-sources-and-methodology
21

Table 2.3.3 Average annual domestic gas bills in 2014 for GB regionswith average unit costs based on consumption of 15,000kWh/year(1)
Pence per kWh and pounds
Payment type
Region(2)Unit
Cost Bill Unit
Cost Bill Unit
Cost BillUnit
Cost Bill
East Midlands 5.20 780 4.72 708 5.23 784 4.92 738
Eastern 5.30 795 4.80 720 5.30 794 5.00 751
London 5.42 814 4.93 740 5.39 808 5.21 781
Merseyside & North Wales 5.29 794 4.82 723 5.28 792 5.04 756
North East 5.20 779 4.71 707 5.19 778 4.92 738
North Scotland 5.24 786 4.80 720 5.21 781 4.98 746
North West 5.26 789 4.77 716 5.27 791 4.99 749
South East 5.36 803 4.85 727 5.31 797 5.04 756
South Scotland 5.27 790 4.76 715 5.22 782 4.97 746
South Wales 5.28 793 4.86 729 5.24 786 5.05 757
South West 5.23 784 4.80 721 5.19 779 4.97 745
Southern 5.44 815 4.96 744 5.40 809 5.13 769
West Midlands 5.34 801 4.80 720 5.32 798 5.03 755
Yorkshire 5.29 794 4.72 708 5.31 796 4.98 746
Great Britain(3)5.31 796 4.81 721 5.28 793 5.02 753
Credit Direct debit Prepayment Overall
(1) All bills are calculated assuming an annual consumption of 15,000 kWh. Bills and unit costs reflect theprices of all suppliers and include standing charges and VAT. Bills relate to the calendar year, i.e.covering consumption from Q1 to Q4 of the named year. Unit costs are calculated by dividing the billsshown by the relevant consumption levels.
(2) The regions shown indicate which Public Electricity Supply (PES) region these bills apply to. From2013 onwards, data on regional gas bills are shown based on (PES) regions as opposed to selectedtowns and cities within Local Distribution Zones (LDZs), as most energy suppliers now charge forgas according to PES area.
(3) DECC have ceased publication of maximum and minimum bills, as proposed in Energy Trends article;
https://www.gov.uk/government/uploads/system/uploads/attachment_data/file/323447/Energy_price_variation_in_the_domestic_energy_market.pdf
22

Per cent
Home supplier
Non-home supplier
Home supplier
Non-home supplier
Home supplier
Non-home supplier
Home supplier
Non-home supplier
West Midlands 35 65 26 74 24 76 28 72North East 36 64 27 73 21 79 28 72Yorkshire 35 65 28 72 23 77 29 71North West 38 62 24 76 31 69 29 71Eastern 43 57 27 73 29 71 32 68East Midlands 41 59 28 72 35 65 33 67Merseyside & N Wales 38 62 30 70 39 61 34 66South East 42 58 33 67 36 64 36 64South West 45 55 34 66 40 60 38 62London 45 55 37 63 42 58 41 59South Scotland 42 58 37 63 54 46 42 58Southern 55 45 43 57 48 52 47 53South Wales 62 38 50 50 64 36 56 44North Scotland 73 27 61 39 71 29 66 34
Great Britain(5)43 57 33 67 38 62 37 63
Table 2.4.2 Regional variation of payment method for standard electricity,September 2014(4)
Per cent
Credit Direct debit PrepaymentSouthern 24 64 12South East 26 63 10South West 25 59 15Eastern 30 59 11North East 26 58 16North Scotland 25 57 18East Midlands 28 57 15South Scotland 23 55 21North West 28 55 17West Midlands 28 55 17South Wales 26 54 21Yorkshire 28 55 17Merseyside & N Wales 24 53 24London 37 42 21Scotland 24 56 21England & Wales 28 56 16Great Britain 27 56 16Northern Ireland 26 38 36
UK 27 56 17
Table 2.4.1 Percentage of domestic electricity customers(1) by
region(2) by supplier type(3), September 2014(4)
Credit Direct debit Prepayment All Payment Types
(1) Includes both standard electricity and Economy 7 electricity customers.(2) The regions used in this table are the distribution areas of the former public electricity suppliers.(3) Home supplier denotes the former public electricity suppliers within their own distribution areas, or their
parent company. Non-home suppliers are new entrant suppliers and the former electricity suppliers outside of their distribution areas.
(4) Data are derived from a survey of the 6 major suppliers and is not adjusted to account for survey coverage. TheDomestic Fuels Inquiry survey coverage is estimated at around 92% of the domestic energy market. All those notsurveyed will be with non-home suppliers.
(5) Competition is still limited in scope for domestic customers in Northern Ireland, and so this country has been excluded from this table.
23

Per cent
Home supplier
Non-home supplier
Home supplier
Non-home supplier
Home supplier
Non-home supplier
Home supplier
Non-home supplier
South Wales 44 56 27 73 24 76 31 69North Scotland 46 54 28 72 32 68 33 67North East 50 50 27 73 35 65 34 66South East 52 48 30 70 41 59 37 63East Midlands 51 49 30 70 44 56 38 62Southern 55 45 32 68 42 58 39 61South Scotland 57 43 33 67 37 63 40 60South West 57 43 33 67 41 59 40 60Yorkshire 57 43 32 68 50 50 41 59Eastern 56 44 34 66 47 53 42 58West Midlands 59 41 32 68 50 50 42 58North West 58 42 36 64 51 49 44 56Merseyside & N Wales 60 40 37 63 47 53 45 55London 61 39 39 61 53 47 50 50Great Britain(5)
56 44 32 68 44 56 41 59
Table 2.5.2 Regional variation of payment method for gas,
September 2014(4)
Per cent
Credit Direct debit PrepaymentSouthern 26 64 10
South East 26 62 12
South West 27 60 13
East Midlands 27 60 14
Eastern 29 59 12
North Scotland 26 59 16
North East 25 58 17
South Scotland 25 57 18
West Midlands 28 56 16
North West 27 56 17
Yorkshire 28 56 16
South Wales 26 54 20Merseyside & N Wales 25 54 21London 38 43 19
Scotland 25 57 18
England & Wales 28 57 15Great Britain 28 57 15
Table 2.5.1 Percentage of domestic gas customers by region(1) by supplier type(2)(3),
September 2014(4)
Credit Direct debit Prepayment All Payment Types
(1) The regions used in this table are the distribution areas of the former public electricity suppliers.(2) Home supplier denotes British Gas Trading.(3) Non-home suppliers are all other suppliers.(4) Data are derived from a survey of the 6 major suppliers and is not adjusted to account for survey coverage. The
Domestic Fuels Inquiry survey coverage is estimated at around 92% of the domestic energy market. All those notsurveyed are with non-home suppliers.
(5) Gas is not yet widely available in Northern Ireland and so this country has been excluded from this table.
24

Industrial prices
December 2014 25
Section 3 – Industrial Prices Highlights Between Q3 2013 and Q3 2014, average industrial prices in real terms including the Climate
Change Levy (CCL) fell by 19 per cent for gas and by 8.6 per cent for heavy fuel oil, but increased by 4.4 per cent for electricity and by 7.4 per cent for coal.
Annual prices between 2012 and 2013 in real terms including CCL fell by 4.7 per cent for heavy fuel oil, but increased by 3.3 per cent for electricity, 3.3 per cent for coal and 8.7 per cent for gas.
Between Q3 2013 and Q3 2014, the price of gas used for electricity generation has decreased
by 26 per cent in cash terms, whilst the price of coal for generation has decreased by 4.6 per cent and oil by 5.3 per cent.
Prices presented in this section will vary depending on sectoral coverage (manufacturing industry, all industry, or non-domestic consumers) and consumption levels (Tables 3.1.1 – 3.1.4 and Tables 3.4.1 & 3.4.2). The price of a fuel may move to a different degree, or even in a different direction, depending on the sectors and/or consumption sizebands being compared. Changes in price may vary depending on the time period used, i.e. changes in annual average prices may be different to changes in price between quarters a year apart. In addition, larger consumers may be more dependent on wholesale spot prices, and therefore more vulnerable to price spikes, whereas smaller consumers tend to be on more stable contracts. These factors help to explain differences between average and sizeband prices. As an example, average prices in Tables 3.1.1 – 3.1.4, which covers manufacturing industry, tend to be weighted more towards the price paid by large consumers, whereas for Tables 3.4.1 & 3.4.2, covering all non-domestic consumers, average prices tend to be weighted more towards smaller consumers. Price indices in Table 3.3.1 aim to be reflective of all industrial users and are quoted in the key points on page 7.
Energy Prices in the manufacturing sector 3.1.1 Prices of fuels for the manufacturing sector, excluding CCL, for various sizebands of consumer are presented in Tables 3.1.1 to 3.1.4. Prices tend to vary by consumption, reflecting the bargaining position of the larger users and factors such as length of contracts and the relative (to size) impact of crude prices on fuel prices. 3.1.2 Prices of most fuels broadly follow the price of crude oil, which has been on an upward trend since 2004 aside from a significant fall in 2009 and a slight fall in 2013. Average fuel prices for coal increased each year between 2004 and 2013 with the exception of 2009 and 2012. For heavy fuel oil and gas oil, prices have increased each year with the exception of 2009 and 2013. For gas, average prices fell in 2007, 2009 and 2010 but otherwise increased each year. For electricity, average prices rose each year with the exception of falls in 2007 and 2010.
Average prices of fuels purchased by the major UK power producers and of gas at UK delivery points 3.2.1 Average purchase costs of fuels used to generate electricity are presented in Table 3.2.1. Generation costs are also affected by non-fuel costs, and by the efficiency with which fuel is converted into electricity in different types of power station, therefore comparing the fuel input costs in common units does not necessarily provide a picture of full costs. 3.2.2 Gas wholesale prices have generally been higher and more volatile since 2008, in line with crude oil prices. Prices reached a 5-year high of 108 pence per therm in March 2013, due to a number of unplanned outages at oil and gas facilities in the North Sea and unseasonably cold

Industrial prices
December 2014 26
weather. Prices then fell back, and ranged between 60 and 70 pence per therm for the rest of 2013. In February 2014 prices fell below 60 pence per therm, as mild weather decreased demand, then fell further to under 40 pence per therm in June and July. In late summer prices started to increase as maintenance outages reduced pipeline flows, and by December prices had reached around 60 pence per therm. 3.2.3 Prior to 2008, coal was the dominant fuel used in electricity generation. Between 2008 and 2010, gas overtook coal as the dominant fuel, but since 2011 the relative prices of coal and gas have meant that coal use has increased once more at the expense of gas. In 2013, gas generation fell to the lowest level since 1996 due to high gas prices. 3.2.4 Oil purchased for generation, like all generation fuels, is more likely to be purchased on longer-term contracts. This, coupled with the mix of oils purchased, means that oil for generation is less closely related to spot prices than other industrial users’ contracts. Between 2000 and 2013, the price of oil for generation has more than tripled in cash terms.
Fuel price indices for the industrial sector 3.3.1 Fuel price indices, both excluding and including the Climate Change Levy (CCL) in real and cash terms, are presented in Tables 3.3.1 and 3.3.2. Prices in real terms (including CCL) for all fuels generally stayed below 1990 levels until 2005/06, with some of the largest annual increases occurring between 2007 and 2008. Heavy fuel oil prices increased strongly in 2010 and 2011 as crude oil prices increased, but the increase was less strong in 2012, and prices in 2013 fell slightly.
Gas and electricity prices for the non-domestic sector in the UK 3.4.1 Gas and electricity prices in the non-domestic sector, both including and excluding CCL, for various sizes of consumer are presented in Tables 3.4.1 and 3.4.2. 3.4.2 Average electricity prices, including CCL, increased every quarter from the second quarter of 2004 until the first quarter of 2009, then generally trended down until Q3 2011 when prices started to trend upwards once more. Average gas prices, including CCL, show prices trending upwards from 2004, with a slight seasonal decrease usually evident in the second and third quarter of each year. This decrease was not shown in 2008 due to consistently high wholesale gas prices, and has been less marked than usual in recent years for the same reason.

Industrial prices
December 2014 27
0.0
1.0
2.0
3.0
4.0
5.0
6.0
7.0
8.0
9.0
1995
1996
1997
1998
1999
2000
2001
2002
2003
2004
2005
2006
2007
2008
2009
2010
2011
2012
2013
pen
ce p
er k
Wh
Coal
Gas
Electricity
Heavy Fuel Oil
-25
-20
-15
-10
-5
0
5
10
Sm
all H
FO
Med
ium
HF
O
Larg
e H
FO
Sm
all e
lec
Med
ium
ele
c
Mod
. lar
ge e
lec
Ext
ra la
rge
elec
Sm
all g
as
Med
ium
gas
Larg
e g
as
per
cen
tag
e ch
ang
e
3.1 Energy prices in the manufacturing sector Table 3.1.1: Quarterly prices of fuels purchased by manufacturing industry (original units) Table 3.1.2: Quarterly prices of fuels purchased by manufacturing industry (p/kWh) * Table 3.1.3: Annual prices of fuels purchased by manufacturing industry (original units) Table 3.1.4: Annual prices of fuels purchased by manufacturing industry (p/kWh) *
Chart 3.1.1 Percentage price movements between Q3 2013 and Q3 2014 for heavy fuel oil (HFO), electricity and gas, by size of consumer, for manufacturing industry
Chart 3.1.2: Fuel prices for manufacturing industry, in cash terms 1995 to 2013
Compared to Q3 2013, heavy fuel oil consumers in Q3 2014 have seen prices fall by an average of 6.7 per cent in cash terms.
Electricity consumers generally saw
prices, excluding CCL, fall between Q3 2013 and Q3 2014 by an average of 0.5 per cent, although the largest industrial firms saw prices fall by 6.0 per cent as wholesale prices fell.
Gas consumers saw average
prices, excluding CCL, decrease between Q3 2013 and Q3 2014 by 20 per cent
Data for 2013 shows that over the past five years (2008 to 2013), average industrial electricity prices have risen by 13 per cent (2.1 per cent in real terms), with an increase of 5.5 per cent (3.8 per cent in real terms) in the last year.
Over the same period average
industrial gas prices have increased by 20 per cent (8.2 per cent in real terms), and by 10 per cent (8.4 per cent in real terms) in the last year.
.

Industrial prices
December 2014 28
0.0
0.5
1.0
1.5
2.0
2.5
3.0
3.5
4.0
4.5
5.0
1999
2000
2001
2002
2003
2004
2005
2006
2007
2008
2009
2010
2011
2012
2013
pen
ce p
er k
Wh
Oil
Natural gas
Coal
0.0
1.0
2.0
3.0
4.0
5.0
6.0
Q3
2012
Q4
2012
Q1
2013
Q2
2013
Q3
2013
Q4
2013
Q1
2014
Q2
2014
Q3
2014
pen
ce p
er k
Wh Oil
Natural gas
Coal
3.2 Average prices of fuels purchased by the major UK power producers and of gas at UK delivery points
Table 3.2.1: Average price of fuels purchased by the major UK power producers and of gas at UK delivery points Chart 3.2.1: Average price paid by UK power producers for coal, oil and natural gas Q3 2012 to Q3 2014
Chart 3.2.2: Average price paid in real(1) terms by UK power producers for coal, oil and natural gas 1999 to 2013
Between Q3 2013 and Q3 2014 the price in cash terms of gas for power stations fell by 26 per cent. Over the same period, the price of coal fell by 4.6 per cent and oil fell by 5.3 per cent.
In Q3 2014, the price of coal in
p/kWh was less than half the price of gas and was at the lowest level in real terms since Q3 2007. The price gap between coal and gas in p/kWh in cash terms in Q3 2014 was 0.87 pence.
Compared to Q2 2014, the price of
coal in cash terms has fallen by 0.8 per cent whilst the price of gas fell by 6.0 per cent in cash terms. Over the same period the price of oil has increased by 1.1 per cent.
Compared to 2008, the annual average real terms price of natural gas used by major power producers in 2013 has increased by 26 per cent, whilst the price of coal has decreased by 16 per cent. The annual average cost of oil has increased by 70 per cent in real terms since 2008.
Oil prices fell during 2013 by 8.0 per
cent in real terms. In comparison the annual average price of gas increased by 5.9 per cent, whilst the price of coal fell by 9.1 per cent.
Annual 2013 prices for gas are at
new highs in real terms. (1) Adjusted for inflation using the GDP (market prices) deflator.

Industrial prices
December 2014 29
0
20
40
60
80
100
120
14019
95
1996
1997
1998
1999
2000
2001
2002
2003
2004
2005
2006
2007
2008
2009
2010
2011
Ind
ex 2
010
= 1
00
Real terms
Current prices
Chart 3.2.3: Average price of gas(1) at UK delivery points 1995 to 2011 in real(2) and current terms
(1) Includes the levy, the Government’s tax on indigenous supplies, which was abolished on 1st April 1998.
(2) Adjusted for inflation using the GDP (market prices) deflator.
The average price of gas at UK delivery points more than doubled in real terms between 1995 and 2011.
The majority of that change occurred
between 2001 and 2011, where the price of gas increased by 104 per cent in real terms. Prices increased by 19 per cent in real terms between 2006 and 2011.
In 2011, the price of gas increased
by 28 per cent.
Fluctuations in gas prices in recent years have closely followed fluctuations in the price of oil.
Data for 2012 and 2013 is not yet
available.

Industrial prices
December 2014 30
0
20
40
60
80
100
120
140
160
1995
1996
1997
1998
1999
2000
2001
2002
2003
2004
2005
2006
2007
2008
2009
2010
2011
2012
2013
Ind
ex 2
010
= 1
00
Coal
Heavy fuel oil
Gas
Electricity
60
70
80
90
100
110
120
130
140
150
Q3
2012
Q4
2012
Q1
2013
Q2
2013
Q3
2013
Q4
2013
Q1
2014
Q2
2014
Q3
2014
Ind
ex 2
010
= 1
00
Coal Heavy fuel oil
Gas Electricity
Total fuel
0
3.3 Fuel price indices for the industrial sector Table 3.3.1: Fuel price indices for the industrial sector excluding CCL Table 3.3.2: Fuel price indices for the industrial sector including CCL Chart 3.3.1 Fuel price indices in real terms
(1) including the Climate Change Levy from Q3 2012 to Q3 2014
(1) Deflated using the GDP implied deflator at market prices
Chart 3.3.2: Industrial fuel price indices in real terms(1) including the Climate Change
Levy 1995 to 2013
Average industrial gas prices including the Climate Change Levy (CCL) fell by 19 per cent in real terms between Q3 2013 and Q3 2014, whilst industrial electricity prices including CCL rose in real terms by 4.4 per cent.
Over the same period the price of
coal increased by 7.4 per cent in real terms and the price of heavy fuel oil decreased by 8.6 per cent.
The inclusion of CCL increases the
average price of coal by 5.2 per cent and the average price of electricity and gas by 2.5 and 3.2 per cent respectively in Q3 2014.
Compared to 2003, the average price of heavy fuel oil in 2013 has increased by 201 per cent in real terms, with a decrease of 4.7 per cent in 2013.
In comparison, the annual average
price of gas, including CCL, has increased by 130 per cent in real terms since 2003, with a rise of 8.7 per cent in the latest year.
The average price of electricity,
including CCL, has risen by 108 per cent in real terms since 2003, and by 3.3 per cent in the latest year.
(1) Deflated using the GDP implied deflator at market prices

Industrial prices
December 2014 31
0.0
2.0
4.0
6.0
8.0
10.0
12.0
14.0
16.0
Ve
ry S
mal
l
Sm
all
Sm
all/M
ed
Med
ium
Larg
e
Ve
ry L
arge
Ext
ra L
arge
pen
ce p
er k
Wh
CCL
Price excluding CCL
0.0
1.0
2.0
3.0
4.0
5.0
6.0
Ve
ry S
mal
l
Sm
all
Med
ium
Larg
e
Ve
ry L
arge
pen
ce p
er k
Wh
CCL
Price excluding CCL
3.4 Gas and electricity prices for the non-domestic sector in the UK
Table 3.4.1: Price of fuels purchased by non-domestic consumers in the UK (excluding the Climate Change Levy) Table 3.4.2: Price of fuels purchased by non-domestic consumers in the UK (including the Climate Change Levy)
Chart 3.4.1: Average UK non-domestic electricity prices Q3 2014
Chart 3.4.2: Average UK non-domestic gas prices Q3 2014
Average electricity prices, excluding CCL, have risen in cash terms between Q3 2013 and Q3 2014 by an average of 4.2 per cent.
Price changes have varied by
sizeband, rising by between 1 and 5 per cent for all consumers.
Average current prices in Q3 2014
have fallen by 2.1 per cent compared to Q1 2014, which was a record high .
The inclusion of CCL increases the
average price of electricity by between 2 and 4 per cent.
Average gas prices excluding CCL have fallen in cash terms between Q3 2013 and Q3 2014 by an average of 13 per cent.
Price changes have varied by
sizeband, rising by between 1 and 8 per cent for very small and small consumers, and falling by between 11 and 24 per cent for medium to very large consumers.
Average current prices in Q3 2014
have fallen 2 per cent on the high reached in Q2 2013.
The inclusion of CCL increases the
average price of gas by between 2 and 5 per cent.

Table 3.1.1 Prices of fuels purchased by manufacturing industry in
Great Britain(1) excluding the Climate Change LevyOriginal units
2012 2013 2014Size of 4th 1st 2nd 3rd 4th 1st 2nd 3rd
Fuel consumer quarter quarter quarter quarter quarter quarter quarter quarter p
Coal(6)(10) Small .. .. .. .. .. .. .. ..
(£ per GJ) Medium .. .. .. .. .. .. .. ..
Large 2.55 2.65 2.86 2.70 2.51 2.62 2.93 ..
All consumers: Average 2.72 2.95 3.16 3.02 2.86 2.97 3.28 3.33 median(2)
.. .. .. .. .. .. .. .. Heavy fuel oil(3)(6)(9)
Small 613.7 711.3 665.0 656.7 647.0 649.5r 611.8r 639.2
(£ per tonne) Medium 583.4 589.2 580.3 586.3 569.0 554.1r 523.7r 525.1
Large 560.6 596.5 576.5 572.7 538.5 547.7 559.7r 542.7
Of which: Extra large .. .. .. .. .. .. .. ..
Moderately large .. .. .. .. .. .. .. ..
All consumers: Average 575.5 609.0 589.4 588.4 563.4 563.3r 554.0r 549.2 median(2)
600.6 677.7 647.2 646.5 637.8 606.2r 605.9r 593.5 Gas oil(3)
Small 826.2 852.4 764.3 813.5 805.7 787.0r 776.0r 750.3
(£ per tonne) Medium 806.4 817.3 794.3 813.4 784.2 770.7r 761.9r 736.5
Large 756.9 756.0 727.6 757.9 726.1 714.2r 700.7r 668.1
All consumers: Average 766.1 767.6 738.4 767.6 736.8 724.4r 711.7r 680.4 median(2)
811.2 823.8 786.5 805.7 782.0 760.5 747.4r 726.4
Electricity Small 9.96 9.72 9.53 9.76 10.37 10.13 9.89r 10.39
(Pence per kWh) Medium 8.60 8.45 8.53 8.70 9.04 9.12r 9.00r 8.98
Large 7.05 7.30 7.14 7.09 7.44 7.27r 6.99r 6.87
Of which: Extra large 6.38 6.75 6.37 6.32 6.74 6.24 5.98r 5.94
Moderately large 7.57 7.72 7.74 7.68 7.97 8.08 7.77r 7.59
All consumers: Average 7.61 7.73 7.63 7.65 8.01 7.90r 7.66r 7.61 10% decile(2)
7.31 7.42 7.27 7.41 7.88 7.83r 7.54 7.48 median(2)
8.88 8.73 8.89 9.03 9.33 9.43 9.38r 9.35 90% decile(2)
11.06 11.08 10.76 10.78 11.27 11.05 11.29r 11.21
Gas(4)Small 3.131 3.119 3.493 4.276 3.356 3.171r 3.350r 3.540
(Pence per kWh) Medium 2.713 2.695 2.808 2.968 2.880 2.826r 2.839r 2.829
Large 2.419 2.555 2.442 2.392 2.513 2.386r 2.048r 1.869
All consumers: Average 2.471 2.597 2.508 2.461 2.577 2.474 2.161r 1.958 Firm(5)
2.524 2.623 2.561 2.547 2.626 2.581r 2.278r 2.060
Interruptible 2.423 2.564 2.452 2.393 2.533 2.357r 2.034r 1.877 10% decile(2)
2.370 2.442 2.382 2.348 2.471 2.409 2.053r 1.925 median(2)
2.833 2.820 2.960 3.091 2.968 2.861r 2.915r 3.041 90% decile(2)
4.460 4.490 4.622 7.991 4.806 4.272r 4.668 7.043
For notes see notes page
32

Table 3.1.3 Annual prices of fuels purchased by manufacturing industry in
Great Britain(1) excluding the Climate Change LevyOriginal units
Size of consumer 2007 2008 2009 2010 2011 2012 2013Coal(6)(10) Small 79.58 95.83 120.19 .. .. .. ..
(£ per tonne) Medium 61.95 74.03 82.23 .. .. .. ..
Large 43.43 57.44 54.82 65.46 81.59 82.70 88.38
All consumers: Average 46.49 60.31 59.60 70.90 87.03 87.54 94.59
Heavy fuel oil(3)(6)(9) Small 300.5 483.0 421.9 506.9 625.6 651.8 675.4
(£ per tonne) Medium 275.1 425.9 378.6 461.0 537.5 592.8 581.7
Large 258.3 348.2 376.5 469.6 581.8 605.8 570.5
Of which: Extra large 249.8 .. .. .. .. .. ..
Moderately large 273.8 .. .. .. .. .. ..
All consumers: Average 269.7 392.9 383.2 471.5 572.0 607.3 588.2
Gas oil(3) Small 430.0 632.8 507.6 618.6 782.4 825.7 815.3
(£ per tonne) Medium 427.4 617.8 506.0 620.4 766.2 806.6 803.1
Large 394.5 588.0 481.8 588.0 731.7 759.6 743.2
All consumers: Average 400.3 593.6 486.0 593.6 738.1 768.3 753.9
Electricity Small 7.574 8.661 9.817 8.804 8.528 9.504 9.834
(Pence per kWh) Medium 6.600 7.366 8.836 7.484 7.794 8.491 8.672
Large 4.850 6.490 6.484 5.964 6.468 6.742 7.237
Of which: Extra large 3.982 5.533 5.078 5.180 5.785 6.093 6.535
Moderately large 5.521 7.230 7.571 6.570 6.996 7.245 7.780
All consumers: Average 5.449 6.836 7.270 6.512 6.922 7.343 7.749
Gas(4) Small 2.438 2.896 2.931 2.793 2.887 3.212 3.371
(Pence per kWh) Medium 2.081 2.379 2.534 2.242 2.405 2.602 2.809
Large 1.370 2.056 1.797 1.642 2.047 2.239 2.479
All consumers: Average 1.474 2.114 1.906 1.738 2.109 2.306 2.540
Firm 1.644 2.205 2.000 1.861 2.218 2.393 2.597
Interruptible 1.332 2.038 1.827 1.635 2.017 2.232 2.493
For notes see notes page
33

Notes for Tables 3.1.1 to 3.1.4
Range of annual purchases of which:
Fuel Large Small
Coal (tonnes) 7,600 760Heavy fuel oil (tonnes) 4,900 490Gas oil (tonnes) 175 35Electricity (thousand kWh) 8,800 880Gas* (thousand kWh) 8,800 1,500
*Respondents purchasing more than one type of supply (firm contract and interruptible contract) are treated as separate entities in respect of each type of supply.
The Climate Change Levy (CCL) came into effect in April 2001. Information on the operation of the CCL is availableon the HM Revenue and Customs web site at https://www.gov.uk/government/organisations/hm-revenue-customsAlthough data from the Quarterly Fuels Inquiry cannot currently be used to produce estimates of the amount of levy paid by size of consumer, it has been used to give an estimate of the average amount of levy paid for coal. Data from suppliers has been used to produce estimates of the average amount of levy paid on gas and electricity.
Table of the average amount of Climate Change Levy paid by fuel type
FuelQ4/13 Q1/14 Q2/14 Q3/14
Coal £14.76/tonne £6.1/tonne £6.2/tonne £6.3/tonne £6.1/tonneElectricity 0.541p/kWh 0.25p/kWh 0.26p/kWh 0.27p/kWh 0.29p/kWhGas 0.188p/kWh 0.10p/kWh 0.10p/kWh 0.10p/kWh 0.09p/kWhLPG £12.10/tonne .. ..
(i) The levy rates shown here are the rates from April 2014. Previous rates are shown in Annex A
(ii) estimated
Extra large Moderately Mediumlarge
Greater than Greater than Less than
n/a n/a 760 to 7,600n/a n/a 490 to 4,900
.. ..
n/a n/a 35 to 175150,000 8,800 to 150,000 880 to 8,800
n/a n/a 1,500 to 8,800
Full rate of Levy(i) Average amount paid (ii)
(1) Average prices paid (exclusive of VAT) by respondents to a Department of Energy and Climate Change(DECC) survey of some 600 manufacturing sites. The average price for each size of consumer is obtained by dividing the total quantity of purchases, for each fuel, into their total value.Prices vary widely around the average values shown (see footnote 2). Purchases of fuels used as rawmaterials in manufacturing are excluded. For further details, see Annex A.
(2) The 10% decile is the point within the complete range of prices below which the bottom 10% of thoseprices fall. Similarly the 90% decile is the point above which the top 10% of prices occur. The median isthe midway point. Thus, these values show the spread of prices paid. The deciles and the median arecalculated by giving equal 'weight' to each purchaser but scaled to represent the mix of fuel users bysize in the industrial population that the panel represents, whereas the average prices for each size-bandand all consumers are given 'weight' according to the quantity purchased. The 10% and 90% decilesare not published from Q1 2005 onwards, except for gas and electricity.
(3) Oil product prices include hydrocarbon oil duty. From 23 March 2011 the effective duty rates per tonneare £108.18 for Heavy Fuel Oil and £128.77 for gas oil.
(4) Covers all supplies of natural gas including, for example, those purchased direct from onshore/offshoregas fields. Respondents purchasing more than one type of supply (firm contract and interruptiblecontract) are treated as separate entities in respect of each type of supply.
(5) From Q1 1998 tariff gas prices are not collected separately and are included in the firm contract prices.The 90% decile and average firm contract price will be affected by contributors who previously hadseparate contracts for tariff and firm contract gas. In Q4 1997, tariff gas represented a weight of around1% of the sample.
(6) It should be noted that prices for these fuels are drawn from small samples.(7) Excludes breeze and blast furnace supplies.(8) Following a consultation with users, this data is no longer published.(9) Extra-large and moderately large splits are no longer published (from Q2 2008)(10) Only large and average prices are published (from Q1 2010). Average prices will be produced with the
provisional prices, large prices with the final prices.The source of the original data is ONS.Prices are shown for various sizes of consumers. These sizebands are defined in terms of the approximate annual purchases by the consumers purchasing them, as shown in the table below.
34

Table 3.2.1 Average prices of fuels purchased by the major UK power
producers(1) and of gas at UK delivery points(2)
United KingdomMajor power producers(1) Natural gas at UK delivery points(7)(8)
Natural
gas(6) Including levy(9) Excluding levy(9)
£ per pence £ per pence pencetonne per kWh tonne per kWh per kWh pence per kWh pence per kWh
1993 42.44 0.611 55.91 0.472 0.706 0.556 0.523 1994 36.35 0.528 67.90 0.526 0.667 0.588 0.564 1995 35.11 0.500 81.12 0.684 0.643 0.584 0.561 1996 35.22 0.507 84.15 0.709 0.628 0.592 0.571 1997 33.74 0.474 89.75 0.746 0.647 0.593 0.576 1998 30.17 0.421 71.87 0.599 0.656 0.560 0.560 1999 29.01 0.405 85.84 0.715 0.613 0.468 0.468 2000 29.35 0.406 120.96 1.010 0.595 0.534 0.534 2001 32.20 0.444 118.59 0.981 0.664 0.647 0.647 2002 29.66 0.409 127.92 1.061 0.609 0.601 0.601 2003 28.11 0.389 158.40 1.308 0.682 0.650 0.650 2004 32.61 0.450 145.60 1.205 0.761 0.706 0.706 2005 36.07 0.497 233.45 1.932 1.015 0.973 0.973 2006 38.06 0.523 254.61 2.117 1.284 1.264 1.264 2007 41.16 0.566 240.27 1.984 1.236 1.047 1.047 2008 65.57 0.901 287.36 2.373 1.644 1.481 1.481 2009 54.42 0.753 268.32 2.220 1.403 1.135 1.135 2010 62.30 0.869 419.48 3.487 1.461 1.307 1.307 2011 80.14 1.110 531.39 4.418 1.914 1.711 1.711 2012 66.33 0.911 577.20 4.799 2.135 .. .. 2013 61.55 0.842 539.93 4.489 2.299 .. ..
Per cent change(10) -7.2 -7.6 -6.5 -6.5 +7.7 +30.9 +30.9 2012 3rd quarter 65.28 0.897 599.04 4.980 2.047 .. ..
4th quarter 62.91 0.864 542.93 4.514 2.283 .. .. 2013 1st quarter 63.77 0.873 573.64 4.769 2.440 .. ..
2nd quarter 62.29 0.853 554.33 4.608 2.161 .. .. 3rd quarter 58.15 0.796 539.83 4.488 2.195 .. .. 4th quarter 61.89 0.847 488.19 4.058 2.376 .. ..
2014 1st quarter 58.80 0.805 516.10 4.291 2.256 .. .. 2nd quarter 55.92 0.765 505.59 4.203 1.730 .. .. 3rd quarter p 55.49 0.760 510.99 4.248 1.626 .. ..
Per cent change(10) -4.6 -4.6 -5.3 -5.3 -25.9 .. ..
Coal(3) Oil(4)(5)
(1) Companies that produce electricity from nuclear sources plus all companies whose prime purpose isthe generation of electricity are included under the heading “Major Power Producers”. A list of thesecompanies is given in Annex A.
(2) The series represents gas supplied to the UK (i.e exports are excluded) (3) Includes slurry. Price excludes CPS (Carbon Price Support) levy.(4) Includes oil for burning, for gas turbines and for internal combustion engines (other than for use in road
vehicles). Excludes any natural gas liquids burnt at Peterhead power station. (5) Includes hydrocarbon oil duty.(6) Includes sour gas. Price excludes CPS (Carbon Price Support) levy.(7) A quarterly series consistent with the annual series is available back to quarter two 1987. An article
describing this series was published in Energy Trends in November 1996. (8) Quarterly data is not available from Quarter 2 2004 onwards.(9) The levy is the Government's tax on indigenous supplies introduced in 1981 and abolished on 1 April
1998. The levy was reduced from 4 to 3 pence per therm for 1997/8 .(10) Percentage change relates to the corresponding period a year earlier. The annual percentage change
varies depending on the units used as the calorific values change each year. For further informationsee Annex B.
35

Table 3.3.1 Fuel price indices for the industrial sector in current terms
excluding the Climate Change LevyUnited Kingdom
2010=100
Unadjusted Seasonally adjusted
Coal(1)
Heavy
fuel oil(1) Gas(2) Electricity(2)
Total
fuel(3) Gas(2) Electricity(2)
Total
fuel(3)
1983 73.2 29.8 53.3 45.9 44.6 .. .. .. 1984 73.3 35.4 55.1 45.8 46.6 .. .. .. 1985 76.2 35.9 58.8 47.6 49.3 .. .. .. 1986 72.4 17.3 51.3 48.0 45.0 .. .. .. 1987 69.4 18.5 48.3 46.7 44.2 .. .. .. 1988 61.7 13.6 46.0 49.2 44.5 .. .. .. 1989 60.2 14.9 44.5 52.7 46.5 .. .. .. 1990 61.9 16.2 45.3 52.6 46.5 .. .. .. 1991 61.0 14.2 45.7 54.3 47.5 .. .. .. 1992 61.8 13.6 45.9 57.3 50.2 .. .. .. 1993 58.0 14.5 44.2 60.1 50.8 .. .. .. 1994 57.3 15.7 43.3 57.9 49.3 .. .. .. 1995 53.8 18.4 40.5 57.3 48.8 .. .. .. 1996 51.1 20.3 30.9 55.4 46.6 .. .. .. 1997 49.9 19.4 32.0 52.2 43.7 .. .. .. 1998 51.1 16.2 33.7 51.7 43.6 .. .. .. 1999 50.3 18.5 33.5 52.0 44.3 .. .. .. 2000 50.4 26.8 36.5 48.2 41.7 .. .. .. 2001 51.7 26.8 48.9 44.1 41.8 .. .. .. 2002 53.0 28.0 46.2 42.6 40.7 .. .. .. 2003 48.6 32.4 48.2 41.2 41.0 .. .. .. 2004 54.1 32.6 53.7 44.9 44.2 .. .. .. 2005 63.6 43.3 81.6 60.2 62.1 .. .. .. 2006 60.8 55.2 101.8 80.8 81.0 .. .. .. 2007 70.7 57.2 82.1 82.9 77.8 .. .. .. 2008 91.7 83.3 123.7 102.1 103.1 .. .. .. 2009 86.3 81.3 103.9 110.1 103.5 .. .. .. 2010 100.0 100.0 100.0 100.0 100.0 .. .. .. 2011 111.1 121.3 122.3 103.2 111.3 .. .. .. 2012 108.5 128.8 133.5 108.4 118.3 .. .. .. 2013 114.2 124.8 147.8 114.2 123.0 .. .. ..
Per cent change(4) +5.3 -3.1 +10.7 +5.4 +4.0 .. .. .. 2012 3rd quarter 109.2 130.0 127.2 106.1 115.9 132.9 108.7 118.6
4th quarter 105.0 122.1 143.3 112.4 121.0 138.5 110.3 118.9 2013 1st quarter 113.9 129.2 153.0 113.2 124.3 145.7r 111.7r 122.0
2nd quarter 122.0 125.0 144.0 112.9 121.7 148.1r 113.4r 122.8r3rd quarter 116.6 124.8 143.8 113.1 121.7 151.3r 115.5r 124.5r4th quarter 110.4 119.5 150.2 117.6 124.3 146.5r 116.5r 122.9r
2014 1st quarter 114.6 119.5r 146.3 122.7r 126.6r 139.3r 120.9r 124.1r2nd quarter 126.6 117.5r 128.8 122.0 122.6r 132.3r 122.6r 123.5r3rd quarter p 128.5 116.5 118.8 121.0 119.8 124.9 123.4 122.4
Per cent change(4) +10.3 -6.7 -17.4 +6.9 -1.5 -17.4 +6.8 -1.7
(1) Indices based on a survey of the prices (excluding VAT) of fuels delivered to industrial consumers inGreat Britain, as shown in Table 3.1.1.
(2) Indices based on the average unit value (excluding VAT) of sales to industrial consumers.(3) Total fuel indices are annually weighted.(4) Percentage change relates to the corresponding period a year earlier.Note: r's indicate revised data. An r in the date column indicates the majority of data in the row has been revised.
36

Table 3.3.1 Fuel price indices for the industrial sector in real terms(1)
excluding the Climate Change LevyUnited Kingdom
2010=100
Unadjusted Seasonally adjusted
Coal(2)
Heavy
fuel oil(2) Gas(3) Electricity(3)
Total
fuel(4) Gas(3) Electricity(3)
Total
fuel(4)GDP
deflator1983 187.3 76.2 136.4 117.3 114.1 .. .. .. 39.1 1984 178.4 86.2 134.1 111.4 113.3 .. .. .. 41.1 1985 174.7 82.4 135.0 109.1 113.1 .. .. .. 43.6 1986 159.1 38.0 112.8 105.6 98.8 .. .. .. 45.5 1987 144.9 38.6 100.9 97.4 92.2 .. .. .. 47.9 1988 121.4 26.9 90.6 96.8 87.7 .. .. .. 50.8 1989 110.1 27.2 81.3 96.3 85.0 .. .. .. 54.7 1990 104.6 27.3 76.4 88.8 78.6 .. .. .. 59.2 1991 96.7 22.5 72.4 86.1 75.3 .. .. .. 63.1 1992 94.8 20.9 70.5 87.9 77.0 .. .. .. 65.2 1993 86.7 21.7 66.1 89.8 76.0 .. .. .. 66.9 1994 84.7 23.3 64.0 85.5 72.9 .. .. .. 67.7 1995 77.5 26.5 58.3 82.6 70.3 .. .. .. 69.4 1996 70.9 28.2 42.9 76.8 64.7 .. .. .. 72.1 1997 67.3 26.2 43.2 70.4 58.9 .. .. .. 74.2 1998 67.9 21.5 44.8 68.7 57.9 .. .. .. 75.3 1999 66.1 24.3 44.1 68.4 58.2 .. .. .. 76.1 2000 64.7 34.4 46.8 61.9 53.6 .. .. .. 77.9 2001 65.5 33.9 62.0 55.9 53.0 .. .. .. 78.9 2002 65.5 34.7 57.1 52.6 50.3 .. .. .. 80.9 2003 58.8 39.2 58.3 49.8 49.7 .. .. .. 82.6 2004 63.6 38.3 63.0 52.8 51.9 .. .. .. 85.1 2005 72.7 49.6 93.4 68.8 71.0 .. .. .. 87.4 2006 67.7 61.5 113.3 90.0 90.2 .. .. .. 89.8 2007 76.6 62.0 88.9 89.9 84.2 .. .. .. 92.3 2008 96.4 87.6 130.1 107.4 108.4 .. .. .. 95.1 2009 89.0 83.9 107.2 113.6 106.9 .. .. .. 96.9 2010 100.0 100.0 100.0 100.0 100.0 .. .. .. 100.0 2011 108.8 118.8 119.8 101.0 109.0 .. .. .. 102.1 2012 104.4 124.0 128.5 104.3 113.8 .. .. .. 103.9 2013 108.2 118.1 139.9 108.1 116.5 .. .. .. 105.6 Per cent change(5) +3.6 -4.7 +8.9 +3.7 +2.3 .. .. .. +1.6 2012 3rd quarter 104.9 124.9 122.2 101.9 111.3 127.7 104.4 113.9 104.1
4th quarter 100.6 116.9 137.3 107.6 115.9 132.6 105.7 113.9 104.4 2013 1st quarter 108.6 123.3 146.0 108.0 118.6 139.0r 106.6r 116.4 104.8
2nd quarter 115.9 118.8 136.9 107.3 115.7 140.8r 107.8r 116.8r 105.2 3rd quarter 109.8 117.5 135.4 106.5 114.6 142.4r 108.7r 117.2r 106.2 4th quarter 103.8 112.4 141.3 110.6 116.9 137.8r 109.6r 115.6r 106.3
2014 1st quarter 107.7 112.3r 137.5 115.3r 118.9r 130.9r 113.6r 116.7r 106.4 2nd quarter 117.8 109.3r 119.9 113.5 114.0r 123.0r 114.0r 114.9r 107.5 3rd quarter p 118.5 107.4 109.5 111.5 110.4 115.1 113.7 112.8 108.5
Per cent change(5) +7.9 -8.6 -19.2 +4.7 -3.6 -19.2 +4.6 -3.8 +2.2
(1) Deflated using the GDP implied deflator at market prices. (2) Indices based on a survey of the prices (excluding VAT) of fuels delivered to industrial consumers in
Great Britain, as shown in Table 3.1.1.(3) Indices based on the average unit value (excluding VAT) of sales to industrial consumers.(4) Total fuel indices are annually weighted.(5) Percentage change relates to the corresponding period a year earlier.Note: r's indicate revised data. An r in the date column indicates the majority of data in the row has been revised.
37

Table 3.3.2 Fuel price indices for the industrial sector in current terms
including the Climate Change Levy (1)
United Kingdom2010=100
Unadjusted Seasonally adjusted
Coal(2)
Heavy
fuel oil(3) Gas(4) Electricity(4)
Total
fuel(5) Gas(4) Electricity(4)
Total
fuel(5)
1983 68.6 29.8 51.9 44.3 43.3 .. .. .. 1984 68.7 35.4 53.6 44.2 45.3 .. .. .. 1985 71.4 35.9 57.3 46.0 47.9 .. .. .. 1986 67.8 17.3 50.0 46.4 43.5 .. .. .. 1987 65.1 18.5 47.1 45.1 42.7 .. .. .. 1988 57.8 13.6 44.8 47.5 43.1 .. .. .. 1989 56.5 14.9 43.3 50.9 44.9 .. .. .. 1990 58.0 16.2 44.0 50.8 45.0 .. .. .. 1991 57.2 14.2 44.5 52.5 45.9 .. .. .. 1992 57.9 13.6 44.6 55.4 48.5 .. .. .. 1993 54.4 14.5 43.0 58.0 49.1 .. .. .. 1994 53.7 15.7 42.1 55.9 47.7 .. .. .. 1995 50.4 18.4 39.4 55.4 47.2 .. .. .. 1996 47.9 20.3 30.1 53.5 45.2 .. .. .. 1997 46.8 19.4 31.1 50.4 42.3 .. .. .. 1998 47.9 16.2 32.8 50.0 42.2 .. .. .. 1999 47.2 18.5 32.6 50.3 42.9 .. .. .. 2000 47.2 26.8 35.5 46.6 40.5 .. .. .. 2001 54.6 26.8 49.9 45.1 42.6 .. .. .. 2002 55.8 28.0 48.4 44.1 42.1 .. .. .. 2003 51.6 32.4 50.1 42.7 42.3 .. .. .. 2004 56.8 32.6 55.2 46.4 45.4 .. .. .. 2005 65.7 43.3 82.2 60.9 62.6 .. .. .. 2006 63.1 55.2 101.8 81.0 81.1 .. .. .. 2007 72.4 57.3 82.1 82.8 77.7 .. .. .. 2008 92.1 83.3 123.0 101.8 102.8 .. .. .. 2009 87.1 81.3 104.7 109.9 103.5 .. .. .. 2010 100.0 100.0 100.0 100.0 100.0 .. .. .. 2011 110.4 121.3 122.2 103.1 111.2 .. .. .. 2012 107.9 128.8 133.2 108.0 118.0 .. .. .. 2013 113.3 124.8 147.2 113.5 122.4 .. .. ..
Per cent change(6) +5.0 -3.1 +10.5 +5.0 +3.8 .. .. .. 2012 3rd quarter 108.6 130.0 126.2 106.0 115.7 132.8 108.5 118.4
4th quarter 104.7 122.1 142.4 112.0 120.7 138.2 110.2 118.7 2013 1st quarter 113.0 129.2 152.6 112.8 124.0 144.7r 111.4r 121.6r
2nd quarter 120.6 125.0 144.2 112.3 121.4 147.9r 112.7r 122.4r3rd quarter 115.5 124.8 142.7 112.3 120.9 151.4r 114.6r 124.0r4th quarter 109.7 119.5 149.2 116.5 123.4 145.3r 115.4r 122.1r
2014 1st quarter 113.7 119.5r 146.5 121.7r 126.0r 138.7r 119.9r 123.4r2nd quarter 124.9 117.5r 129.2 121.2 122.1r 132.3r 121.6r 123.0r3rd quarter p 126.7 116.5 118.1 119.8 119.0 125.6r 122.1r 121.8r
Per cent change(6) +9.7 -6.7 -17.2 +6.6 -1.6 -17.1 +6.5 -1.8
(1) The levy came into effect in April 2001 (Q2). The full rates of levy from 1 April 2013 are: coal 14.29£/tonne, gas 0.182p/kWh, electricity 0.524p/kWh; discounts and exemptions are available.
(2) Indices based on a survey of the prices (excluding VAT) of fuels delivered to industrial consumers inGreat Britain, as shown in Table 3.1.1, but with the inclusion of an estimation of the amount of CCL paid.
(3) Indices based on a survey of the prices (excluding VAT) of fuels delivered to industrial consumers inGreat Britain, as shown in Table 3.1.1.
(4) Indices based on the average unit value (excluding VAT) of sales to industrial consumers.(5) Total fuel indices are annually weighted.(6) Percentage change relates to the corresponding period a year earlier.Note: r's indicate revised data. An r in the date column indicates the majority of data in the row has been revised.
38

Table 3.3.2 Fuel price indices for the industrial sector in real terms(1)
including the Climate Change Levy (2)
United Kingdom2010=100
Unadjusted Seasonally adjusted
Coal(3)
Heavy
fuel oil(4) Gas(5) Electricity(5)
Total
fuel(6) Gas(5) Electricity(5)
Total
fuel(6)GDP
deflator1983 175.5 76.2 132.8 113.3 110.9 .. .. .. 39.1 1984 167.1 86.2 130.5 107.6 110.3 .. .. .. 41.1 1985 163.7 82.4 131.4 105.4 109.9 .. .. .. 43.6 1986 149.1 38.0 109.8 102.0 95.5 .. .. .. 45.5 1987 135.8 38.6 98.2 94.1 89.2 .. .. .. 47.9 1988 113.8 26.9 88.2 93.5 84.8 .. .. .. 50.8 1989 103.2 27.2 79.1 93.1 82.2 .. .. .. 54.7 1990 98.1 27.3 74.4 85.8 76.0 .. .. .. 59.2 1991 90.6 22.5 70.5 83.2 72.8 .. .. .. 63.1 1992 88.8 20.9 68.5 85.0 74.4 .. .. .. 65.2 1993 81.3 21.7 64.3 86.7 73.5 .. .. .. 66.9 1994 79.3 23.3 62.2 82.6 70.5 .. .. .. 67.7 1995 72.6 26.5 56.7 79.8 68.0 .. .. .. 69.4 1996 66.5 28.2 41.7 74.2 62.6 .. .. .. 72.1 1997 63.1 26.2 42.0 68.0 57.0 .. .. .. 74.2 1998 63.6 21.5 43.5 66.4 56.1 .. .. .. 75.3 1999 62.0 24.4 42.8 66.1 56.4 .. .. .. 76.1 2000 60.6 34.4 45.5 59.8 52.0 .. .. .. 77.9 2001 69.2 34.0 63.3 57.1 54.1 .. .. .. 78.9 2002 68.9 34.7 59.9 54.6 52.1 .. .. .. 80.9 2003 62.5 39.2 60.7 51.7 51.3 .. .. .. 82.6 2004 66.8 38.3 64.8 54.6 53.3 .. .. .. 85.1 2005 75.2 49.6 94.1 69.7 71.7 .. .. .. 87.4 2006 70.3 61.5 113.3 90.2 90.3 .. .. .. 89.8 2007 78.5 62.1 88.9 89.7 84.2 .. .. .. 92.3 2008 96.8 87.6 129.4 107.0 108.1 .. .. .. 95.1 2009 89.9 83.9 108.0 113.4 106.9 .. .. .. 96.9 2010 100.0 100.0 100.0 100.0 100.0 .. .. .. 100.0 2011 108.1 118.8 119.6 101.0 108.9 .. .. .. 102.1 2012 103.9 124.0 128.2 104.0 113.6 .. .. .. 103.9 2013 107.3 118.1 139.4 107.5 115.9 .. .. .. 105.6
Per cent change(7) +3.3 -4.7 +8.7 +3.3 +2.1 .. .. .. +1.6 2012 3rd quarter 104.4 124.9 121.2 101.9 111.1 127.6 104.2 113.8 104.1
4th quarter 100.3 116.9 136.4 107.3 115.6 132.3 105.5 113.7 104.4 2013 1st quarter 107.8 123.3 145.6 107.6 118.3 138.0r 106.3r 116.0r 104.8
2nd quarter 114.6 118.8 137.1 106.8 115.4 140.6r 107.2r 116.3r 105.2 3rd quarter 108.8 117.5 134.4 105.8 113.9 142.5r 107.9r 116.7r 106.2 4th quarter 103.2 112.4 140.4 109.6 116.1 136.7r 108.6r 114.8r 106.3
2014 1st quarter 106.9 112.3r 137.6 114.4r 118.4r 130.4r 112.7r 116.0r 106.4 2nd quarter 116.2 109.3r 120.1 112.8r 113.6r 123.1r 113.1r 114.4r 107.5 3rd quarter p 116.8 107.4 108.9 110.4 109.6 115.7 112.5 112.2 108.5
Per cent change(7) +7.4 -8.6 -19.0 +4.4 -3.7 -18.8 +4.3 -3.9 +2.2
(1) Deflated using the GDP implied deflator at market prices.(2) The levy came into effect in April 2001 (Q2). The full rates of levy from 1 April 2013 are:
coal 14.29£/tonne, gas 0.182p/kWh, electricity 0.524p/kWh; discounts and exemptions are available. (3) Indices based on a survey of the prices (excluding VAT) of fuels delivered to industrial consumers in
Great Britain, as shown in Table 3.1.1, but with the inclusion of an estimation of the amount of CCL paid.(4) Indices based on a survey of the prices (excluding VAT) of fuels delivered to industrial consumers in
Great Britain, as shown in Table 3.1.1.(5) Indices based on the average unit value (excluding VAT) of sales to industrial consumers.(6) Total fuel indices are annually weighted.(7) Percentage change relates to the corresponding period a year earlier.Note: r's indicate revised data. An r in the date column indicates the majority of data in the row has been revised.
39

Table 3.4.1 Prices of fuels purchased by non-domestic consumers in the United Kingdom (excluding the Climate Change Levy)
Pence per kWh
Size of 3rd 4th 1st 2nd 3rd 4th 1st 2nd 3rdFuel consumer quarter quarter quarter quarter quarter quarter quarter quarter quarter
Electricity Very Small 12.30 12.52 12.03 12.09 13.07 13.89 13.20 13.42 13.72 Small 10.39 10.40 10.52 10.79 10.89 11.33 11.44 11.42 11.36 Small/Medium 9.08 9.24 9.48 9.65 9.63 9.99 10.28 10.19 10.08 Medium 8.27 8.46 8.62 8.82 8.82 9.27 9.46 9.30 9.12 Large 7.99 8.41 8.55 9.06 8.80 9.33 9.39 9.46 9.06 Very Large 7.84 8.20 8.65 8.84 8.50 8.97 9.02 9.19 8.70 Extra Large 7.86 8.29 8.19 8.26 8.51 8.71 9.03 8.74 8.56 Average 8.84 9.17 9.29 9.46 9.45 9.90 10.06 9.94 9.85
Gas Very Small 4.425 3.953 3.867 4.175 4.673 4.153 4.067 4.445r 5.063 Small 2.955 2.839 2.977 3.223 3.511 3.089 3.140 3.383r 3.541 Medium 2.466 2.655 2.840 2.906 2.908 2.914 2.966 2.859r 2.594 Large 2.222 2.461 2.577 2.588 2.539 2.550 2.470 2.144r 1.923 Very Large 2.087 2.247 2.290 2.224 2.259 2.270 2.227 1.916r 1.812 Average 2.640 2.794 2.938 3.028 2.980 2.954 3.002 2.850r 2.591
Table 3.4.2 Prices of fuels purchased by non-domestic consumersin the United Kingdom (including the Climate Change Levy)
Pence per kWh
Size of 3rd 4th 1st 2nd 3rd 4th 1st 2nd 3rdFuel consumer quarter quarter quarter quarter quarter quarter quarter quarter quarter
Electricity Very Small 12.62 12.85 12.35 12.38 13.40 14.24 13.55 13.78 14.08 Small 10.80 10.80 10.95 11.21 11.30 11.72 11.84 11.83 11.76 Small/Medium 9.48 9.60 9.82 10.01 9.99 10.33 10.62 10.55 10.46 Medium 8.62 8.78 8.93 9.13 9.10 9.51 9.70 9.56 9.41 Large 8.26 8.66 8.80 9.27 8.99 9.50 9.55 9.65 9.29 Very Large 8.08 8.45 8.89 9.04 8.67 9.14 9.20 9.39 8.94 Extra Large 7.99 8.43 8.31 8.38 8.63 8.83 9.16 8.87 8.72 Average 9.14 9.46 9.57 9.73 9.70 10.15 10.31 10.20 10.14
Gas Very Small 4.538 4.082 3.998 4.309 4.787 4.284 4.201 4.568r 5.172 Small 3.070 2.962 3.102 3.352 3.632 3.213 3.268 3.517r 3.669 Medium 2.580 2.775 2.960 3.032 3.029 3.039 3.091 2.987r 2.719 Large 2.294 2.549 2.667 2.676 2.621 2.643 2.546 2.207r 1.975 Very Large 2.116 2.286 2.334 2.262 2.292 2.314 2.285 1.965r 1.852 Average 2.727 2.896 3.044 3.133 3.071 3.060 3.108 2.947r 2.673
2012 2013 2014
2012 2013 2014
The Climate Change Levy (CCL) came into effect in April 2001. More information is available on the HM Revenue and Customs web site at https://www.gov.uk/government/organisations/hm‐revenue‐customsFrom 1 April 2014 the full rate of levy for electricity is 0.541p/kWh and for gas 0.188/kWh. Previous rates are in Annex A.
Annual ConsumptionElectricityVery SmallSmallSmall/MediumMediumLargeVery LargeExtra Large
MWh0 -20
20 - 499500 - 1,999
2,000 - 19,99920,000 - 69,99970,000 - 150,000
>150,000
GasVery SmallSmallMediumLargeVery Large
MWh<278
278 - 2,7772,778 - 27,777
27,778 - 277,777277,778 - 1,111,112
Source: DECC survey of energy suppliers.Notes: The average price (excluding VAT) for each size of consumer is obtained by dividing the total quantity of purchases, for each fuel, into their total value. The electricity and gas sizebands shown in table 3.4.1 and 3.4.2 are defined in terms of the approximate annual purchases by the consumers purchasing them, as shown in the table below.
40

Oil and petroleum product prices
December 2014 41
Section 4 – Oil and Petroleum Product Prices Highlights The price of petrol in December 2014 is 8.4 per cent (11 pence) lower than a year ago, at 119.8
pence per litre, whilst diesel is 10 per cent (14 pence) lower at 124.8 pence per litre. Petrol and diesel prices are over 20 pence lower than their peaks in April 2012.
The price of crude oil purchased by UK refiners in November 2014 was 25 per cent lower than a
year ago, and has fallen to around $70 per barrel, having previously been above $100 per barrel between February 2011 and September 2014.
Typical retail prices of petroleum prices 4.1.1 Prices of petroleum products, including road fuels, are presented in Tables 4.1.1 to 4.1.3. Prices of unleaded petrol (ULSP) and diesel (ULSD) reached new highs in April 2012, mainly due to the cost of crude oil (see paragraph 4.2.2). Prices in December 2014 are more than 20 pence lower than that peak.
4.1.2 Chart 4.1.3 shows the price of ULSP and ULSD excluding VAT and duty. Prices are affected by duty rate changes, as listed in Annex C, and by changes in the general rate of VAT.
4.1.3 The retail prices of standard grade burning oil and gas oil are more directly influenced by the price of crude oil, due to lower duty rates and VAT.
Crude oil prices 4.2.1 A price index for crude oil is presented in Tables 4.1.1 and 4.1.2 for comparison against the prices of petroleum products. 4.2.2 OPEC’s 166th Meeting took place on 27 November 2014 in Vienna. The Conference reviewed oil market developments and world economic growth, in particular supply/demand projections for 2015. The Conference considered forecasts for the world economic outlook and noted that the global economic recovery was continuing, albeit very slowly and unevenly spread. The Conference also noted that the forecast increase in world oil demand during 2015 will be offset by the projected increase of 1.36 million barrels per day (mb/d) in non-OPEC supply. Recording its concern over the rapid decline in oil prices in recent months, the Conference concurred that stable oil prices - at a level which did not affect global economic growth but which allowed producers to receive a decent income and to invest to meet future demand – were vital for world economic wellbeing. Accordingly, in the interest of restoring market equilibrium, the Conference decided to maintain the production level of 30.0 mb/d.
4.2.3 Movements in the price of crude oil affect the prices of various domestic and industrial fuels, as well as petroleum products. The price of crude oil can change for a variety of reasons, such as: oil shortages (1973); over-supply and weaker demand (1998); Hurricanes (Katrina and Rita, 2005); the global recession (2008-9); and geopolitical tensions (2008 onwards). In July 2008, average monthly crude oil prices reached a new high in real terms, 10.5 per cent higher than the late 1970’s. More recently, oil prices have been almost consistently above $100 per barrel since February 2011. In September prices fell below $100 per barrel, due to weak demand and increased supply. In late November prices fell to around $72 per barrel when OPEC announced their decision to maintain output levels, and in early December prices fell below $70 per barrel, reaching a 5-year low.

Oil and petroleum product prices
December 2014 42
70
80
90
100
110
120
130
140
150
Dec
-12
Mar
-13
Jun
-13
Se
p-13
Dec
-13
Mar
-14
Jun
-14
Se
p-14
Dec
-14
pen
ce p
er li
tre
Premium Unleaded/ULSP
Diesel/ULSD
0
0
20
40
60
80
100
120
140
160
1995
1996
1997
1998
1999
2000
2001
2002
2003
2004
2005
2006
2007
2008
2009
2010
2011
2012
2013
2014
p
pen
ce p
er li
tre
Super Unleaded
Diesel/ULSD
Premium Unleaded/ULSP
4.1 Typical retail prices of petroleum products Table 4.1.1: Typical monthly retail prices of petroleum products and a crude oil index Table 4.1.2: Average annual retail prices of petroleum products and a crude oil price index Table 4.1.3: Typical retail prices of petroleum products 1975 to 2008 *
Chart 4.1.1: Typical retail prices of motor spirits from December 2012 to December 2014
Chart 4.1.2: Annual average retail price of motor spirit and diesel 1995 to 2014
In mid-December 2014 a litre of ULSP was on average 119.8 pence, 2.6 pence per litre lower than the previous month and 11 pence per litre lower than a year ago.
Diesel prices were 124.8 pence per litre, 2.4 pence per litre lower the previous month and 14 pence per litre lower than a year ago.
Petrol and diesel prices are at the
lowest level since the end of 2010.
The price differential between ULSP and ULSD in December 2014 was 5.0 pence per litre. The differential has broadly stayed between 4p and 8p for the past 4 years.
Prices of ULSP and ULSD in 2014 were lower than the record highs of 2012 by 5.6 per cent and 5.8 per cent respectively.
The differential between ULSP
and ULSD in 2014 was 5.9 pence per litre, a slight fall on 2013.
Motor fuel prices increased at a
steady rate from the Gulf crisis in 1990/91 to 2000, chiefly as a result of duty changes. Since 2000, prices have followed oil prices, increasing strongly in 2008, falling back in 2009, and then increasing strongly once more in 2010 and 2011 before levelling off in 2012 and falling in 2013 and 2014.

Oil and petroleum product prices
December 2014 43
0
10
20
30
40
50
60
70
80
Nov
-09
Mar
-10
Jul-1
0
Nov
-10
Mar
-11
Jul-1
1
Nov
-11
Mar
-12
Jul-1
2
Nov
-12
Mar
-13
Jul-1
3
Nov
-13
Mar
-14
Jul-1
4
Nov
-14
pen
ce p
er li
tre
Standard grade burning oil
Gas oil
0
10
20
30
40
50
60
70
Dec
-09
Ap
r-10
Au
g-10
Dec
-10
Ap
r-11
Au
g-11
Dec
-11
Ap
r-12
Au
g-12
Dec
-12
Ap
r-13
Au
g-13
Dec
-13
Ap
r-14
Au
g-14
Dec
-14
pen
ce p
er li
tre
Diesel/ULSD
Premium Unleaded/ULSP
Chart 4.1.3: Price of unleaded petrol and diesel excluding taxes December 2009 to December 2014
Chart 4.1.4: Typical retail prices of standard grade burning oil and gas oil November 2009 to November 2014
The price of unleaded petrol, excluding tax, in December 2014 is 30 per cent lower than the peak in April 2012.
The price of diesel, excluding
taxes, is 29 per cent lower than the April 2012 peak.
In December 2014, the price
differential between ULSP and diesel, excluding tax, was 4.1 pence per litre, compared to the high of 12 pence per litre in November 2008.
The price of SGBO in November 2014 was 28 per cent lower than February 2013, which was the highest level since July 2008
The price of gas oil in November
2014 was 23 per cent lower than April 2012, which was the highest level since our records started in 1989.
In November 2014 the price of
SGBO was 15 per cent lower than a year ago, whilst gas oil was 14 per cent lower.

Oil and petroleum product prices
December 2014 44
0
40
80
120
160
200
Nov
-09
Mar
-10
Jul-1
0
Nov
-10
Mar
-11
Jul-1
1
Nov
-11
Mar
-12
Jul-1
2
Nov
-12
Mar
-13
Jul-1
3
Nov
-13
Mar
-14
Jul-1
4
Nov
-14
Ind
ex 2
010
= 1
004.2 Crude oil prices
Table 4.1.1: Typical monthly retail prices of petroleum products and a crude oil index Table 4.1.2: Average annual retail prices of petroleum products and a crude oil price index
Chart 4.2.1: Index(1) of crude oil prices November 2009 to November 2014
(1)The index represents the average price paid by refineries for the month and is calculated in sterling on a cif basis, see Annex A.
Compared to a year ago, the price of crude oil acquired by UK refineries in November 2014 was 25 per cent lower.
The average cost of crude oil
acquired by UK refineries in November 2014 has risen since the low of December 2008 by 84 per cent. Prices though are 37 per cent lower than March 2012, which was the highest level since our records began in 1991.
Although prices stayed above $100
a barrel for much of 2013, the annual price for 2013 was 1.2 per cent lower than the high of 2012 and 35 per cent lower than the previous annual peak in 2008.
Over the past five years (November
2009 to November 2014) the average cost of crude oil acquired by refineries has increased by around 9 per cent.

United Kingdom
Motor spirit(1)
Super unleaded
Premium unleaded Diesel(1)
Standard grade burning
oil(1) Gas oil(1)(2)
Pence per litre 2010 = 1002012 January 140.40 132.89 141.34 61.04 70.74 136.7
February 141.82 134.56 142.56 61.52 71.34 146.3 March 144.90 137.67 145.04 63.28 73.69 154.9 April 148.85 141.74 147.78 64.40 74.59 147.2 May 145.36 137.68 144.01 59.10 69.89 136.3 June 139.36 131.63 137.44 54.50 65.59 120.3 July 138.44 131.08 136.59 53.74 67.34 125.5 August 141.59 134.13 139.41 57.87 71.06 137.4 September 146.45 139.13 143.98 60.65 72.96 136.2 October 145.58 138.08 143.02 60.44 73.19 135.1 November 142.28 134.54 141.10 57.75 70.01 133.0 December 139.40 131.55 139.66 57.18 68.74 132.0
2013 January 139.35 131.71 139.46 57.85 68.99 136.7 February 144.03 136.37 143.90 64.59 74.54 144.8 March 144.99 137.25 144.61 62.73 72.67 140.9 April 144.24 136.81 141.27 57.76 69.79 131.6 May 140.54 132.75 137.95 55.39 67.96 130.5 June 141.88 134.06 139.26 54.99 68.23 128.3 July 142.26 134.74 139.62 56.94 70.96 137.3 August 144.42 136.87 141.63 55.32 70.08 138.8 September 145.03 137.19 142.33 56.64 71.25 138.2 October 139.49 131.48 138.76 54.44 67.89 132.9 November 136.20 129.73 137.30 54.36 67.32 129.6 December 138.55 130.79 138.77 54.72 67.71 131.8
2014 January 137.77 130.16 138.11 55.67 66.68 128.8 February 136.34 129.00 136.65 52.87 65.81 128.5 March 136.26 128.62 136.03 51.59 65.60 126.3 April 136.34 128.79 135.87 51.36 66.69 125.4 May 137.15 129.32 136.10 50.27 63.74 126.6 June 137.35 129.70 135.41 51.69 63.93 128.2 July 138.67 131.12 136.01 51.33 62.55 123.0 August 136.85 129.27 133.61 51.15 62.61 119.5 September 136.13 128.51 133.07 51.02 61.90 116.3 October 134.24 126.76 131.08 46.73 58.66 106.4rNovember 130.02 122.48r 127.18r 46.32 57.79 97.8 December p .. 119.83 124.79 .. .. ..
0.00
Table 4.1.1 Typical retail prices of petroleum products and a crude oil price
index(1)
Crude oil acquired by
refineries(3)
(1) These estimates are generally representative of prices paid on or about the 15th of the month. Estimates are based on information provided by oil marketing companies until December 1994. FromJanuary 1995, data from super/hypermarket chains have been included. The very latest data for motorspirit and diesel are provisional, based on a smaller sample than used for preceding months.
(2) These estimates are for deliveries of 2,000 to 5,000 litres; such deliveries attracted 8 per cent VATfrom 1 April 1994. With effect from 1 September 1997 the rate of VAT was reduced to 5 per cent.
(3) Price index for supplies received by refineries in the UK from both indigenous and imported sources.
45

United Kingdom
Motor spirit(1)Crude oil
4 star/
LRP(2)(8)Super
unleaded
Premium
unleaded(3) Diesel(1)(4)Standard grade
burning oil(1)(5) Gas oil(1)(6) acquired by
refineries(7)
Pence per litre 2010 = 100
1978 16.77 .. .. 18.46 8.39 8.42 .. 1979 22.66 .. .. 23.65 10.89 10.90 .. 1980 28.32 .. .. 29.67 14.78 14.77 .. 1981 34.29 .. .. 34.01 18.01 17.51 .. 1982 36.62 .. .. 35.86 20.75 20.11 .. 1983 39.28 .. .. 37.30 21.19 20.71 .. 1984 40.62 .. .. 38.33 19.67 20.44 .. 1985 43.14 .. .. 41.94 21.12 21.58 .. 1986 37.35 .. .. 35.60 13.95 13.77 .. 1987 37.90 .. .. 34.58 12.55 13.16 .. 1988 37.38 .. .. 34.00 10.65 10.88 .. 1989 40.39 .. 38.29 36.18 12.04 11.64 .. 1990 44.87 .. 42.03 40.48 15.56 14.64 .. 1991 48.48 47.31 45.07 43.82 14.11 13.65 .. 1992 50.28 48.38 46.07 45.01 13.06 12.49 .. 1993 54.12 52.91 49.44 49.20 13.64 13.42 .. 1994 56.87 55.98 51.58 51.53 13.37 13.27 .. 1995 59.70 58.55 53.77 54.24 13.80 13.87 .. 1996 61.63 63.67 56.52 57.71 15.93 16.53 25.9 1997 67.22 71.31 61.82 62.47 14.36 15.45 22.7 1998 71.11 77.80 64.80 65.50 11.25 12.47 14.8 1999 77.20 82.92 70.16 72.49 12.73 13.89 21.3 2000 84.89 87.32 79.93 81.34 20.57 21.51 36.5 2001 79.71 82.74 75.72 77.84 18.13 19.12 32.8 2002 77.03 79.79 73.24 75.46 15.66 15.93 31.6 2003 79.94 81.36 76.04 77.92 17.57 18.58 34.3 2004 84.42 85.75 80.22 81.91 21.26 21.96 39.7 2005 .. 93.40 86.75 90.86 29.03 30.53 57.1 2006 .. 98.05 91.32 95.21 33.66 36.58 67.7 2007 .. 100.40 94.24 96.85 35.03 40.03 70.1 2008 .. 113.47 107.08 117.51 51.05 58.42 100.4 2009 .. 105.71 99.29 103.93 36.15 44.00 75.4 2010 .. 123.83 116.90 119.26 45.45 54.14 100.0 2011 .. 140.57 133.27 138.72 58.18 68.10 135.7 2012 .. 142.87 135.39 141.83 59.29 70.76 136.7 2013 .. 141.75 134.15 140.41 57.14 69.78 135.1 2014p .. .. 127.80 133.66 .. .. ..
Table 4.1.2 Average annual retail prices of petroleum products and a crude oil price index
(1) Estimates are based on information provided by oil marketing companies until December 1994. From January 1995, data from super/hypermarket chains have been included.
(2) From October 1999, Four Star prices represent 'Lead Replacement Petrol' (LRP). Pump prices for both petrolsare broadly the same.
(3) From April 2001, Premium unleaded prices represent Ultra Low Sulphur Petrol (ULSP), which now accounts forvirtually all Premium unleaded sold. The pump prices for both fuels were broadly the same.
(4) From July 1999, diesel prices represent average prices for Ultra Low Sulphur Diesel which now accounts forvirtually all diesel sold. Prices for the period March - June 1999 represent a mixture of both types of dieselas companies switched to only selling ULSD. Pump prices for both diesels are broadly the same.
(5) These estimates are for deliveries of up to 1,000 litres; such deliveries attract 8 per cent VAT from 1 April 1994. With effect from 1 September 1997 the rate of VAT has been reduced to 5 per cent.
(6) These estimates are for deliveries of 2,000 to 5,000 litres; such deliveries attract 8 per cent VAT from 1 April1994. With effect from 1 September 1997 the rate of VAT has been reduced to 5 per cent.
(7) Price index for supplies received by refineries in the UK from both indigenous and imported sources. It represents the average for the month calculated in sterling on a cif basis.
(8) The LRP series has been discontinued from September 2005 due to the low volume of sales.
46

International comparisons
December 2014 47
Section 5 – International Comparisons Highlights In November 2014 the UK price for petrol was fifth highest in the EU 15 at 122.5 pence per litre,
whilst the UK price for diesel was the highest in the EU 15 at 127.2 pence per litre. For January to June 2014, UK industrial electricity prices for medium consumers including tax
were the third highest in the EU 15, whilst industrial gas prices for medium consumers including tax were the second lowest in the EU 15.
For January to June 2014, UK domestic gas and electricity prices, including tax, were second lowest and sixth lowest respectively in the EU 15.
International prices vary for many reasons including differences in indigenous resources and market structures, and varying exchange rates and inflation rates (for example, the pound depreciated against the euro by around 6 per cent between the second half of 2012 and the same period in 2013). Prices for gas and electricity in this section will vary depending on the periodicity (6-monthly or annual) and consumption (banded or an overall average) of the tables. In general, the 6-monthly Eurostat EU28 tables have more timely data and reflect changes on a shorter timescale, but comparisons with non EU countries require the annual IEA tables. Rankings may differ between the IEA and Eurostat tables
Premium unleaded petrol prices and diesel prices in the EU 5.1.1 Prices of road fuels in the EU are shown in Tables 5.1.1 and 5.2.1. Including tax, the UK has the fifth highest price for petrol and the highest price for diesel. The tax component of UK petrol and diesel prices is around 60 per cent, generally one of the highest rates in Europe.
Average industrial and domestic electricity prices, EU and IEA 5.3.1 IEA data for 2013 in Table 5.3.1 shows that UK industrial electricity prices were above the IEA median including and excluding tax. 5.4.1 Eurostat data in Tables 5.4.1 to 5.4.4 shows that, for January to June 2014, UK industrial electricity prices were above the EU15 median for all consumers including and excluding tax, except for small consumers including tax, which were at the median. 5.5.1 IEA data for 2013 in Table 5.5.1 shows that UK domestic electricity prices were slightly above the IEA median including tax and considerably above the IEA median excluding tax. 5.6.1 Eurostat data in Table 5.6.2 shows that, for January to June 2014, UK domestic electricity prices for medium consumers were below the EU15 median including tax but above the median excluding tax.
Average industrial and domestic gas prices, EU and IEA 5.7.1 IEA data for 2013 in Table 5.7.1 shows that UK industrial gas prices were below the IEA median including and excluding tax.
5.8.1 Eurostat data in Tables 5.8.1 to 5.8.3 shows that, for January to June 2014, UK industrial gas prices were amongst the lowest in the EU15 for all size bands including tax. 5.9.1 IEA data for 2013 in Table 5.9.1 shows that UK domestic gas prices were below the IEA median including tax but above the median excluding tax. 5.10.1 Eurostat data in Table 5.10.2 shows that, for January to June 2014, UK domestic gas prices for medium consumers were the second lowest in the EU15 including tax and the seventh highest excluding tax.

International comparisons
December 2014 48
0
10
20
30
40
50
60
70
80
90
100
110
120
130
140
Italy
Ne
the
rlan
ds
Gre
ece
De
nma
rk
UK
Fin
land
Ger
ma
ny
Irel
and
Sw
ede
n
Por
tug
al
Be
lgiu
m
Ma
lta
Slo
ven
ia
Fra
nce
Slo
vaki
a
Cyp
rus
Spa
in
Cro
atia
Aus
tria
Ro
man
ia
Cze
ch R
ep
Hu
nga
ry
Lith
uan
ia
Luxe
mb
our
g
Latv
ia
Est
oni
a
Bul
gar
ia
Pol
and
pen
ce (
p/li
tre)
Excluding Tax and Duty
Tax and Duty
0
10
20
30
40
50
60
70
80
90
100
110
120
130
140
UK
Italy
Sw
eden
Fin
land
De
nmar
k
Irel
and
Cyp
rus
Net
herla
nds
Ma
lta
Slo
veni
a
Rom
ania
Hun
gary
Ge
rman
y
Be
lgiu
m
Gre
ece
Cze
ch R
ep
Slo
vaki
a
Cro
atia
Au
stri
a
Spa
in
Po
rtug
al
Fra
nce
Est
onia
Bul
garia
Lith
uan
ia
Lat
via
Pol
and
Lux
embo
…
pen
ce
(p/li
tre)
Excluding Tax and Duty
Tax and Duty
5.1 Premium unleaded petrol prices in the EU
Table 5.1.1: Premium unleaded petrol prices in the EU Chart 5.1.1 Average EU premium unleaded petrol prices in pence per litre as at November 2014
5.2 Diesel prices in the EU Table 5.2.1: Diesel prices in the EU Chart 5.2.1 Average EU diesel prices in pence per litre as at November 2014
Average UK unleaded petrol prices, including taxes, in November 2014 were the fifth highest in the EU at 122.5 pence per litre when presented in a common currency basis.
The highest price was in Italy at 131.7 pence per litre, whilst the lowest price was in Poland at 95.1 pence per litre.
Average UK diesel prices, including taxes, in November 2014 were the highest within the EU at 127.2 pence per litre. The lowest price was in Luxembourg at 90.2 pence per litre.
The high UK Diesel price is mainly
due to the taxes levied, which formed 62 per cent of the total price in November 2014, compared to a range of 43 to 58 per cent in the rest of the EU.
Source: European Commission Oil Bulletin
Source: European Commission Oil Bulletin

International comparisons
December 2014 49
0
5
10
15
20
25
Nor
way
US
A
Sw
eden
Luxe
mbo
urg
Fin
lan
d
Po
lan
d
Net
herla
nds
Den
mar
k
Tur
key
Fra
nce
Be
lgiu
m
Sw
itzer
lan
d
Hun
gary UK
Au
stria
Gre
ece
Cze
ch R
ep
Po
rtug
al
Jap
an
Ger
man
y
Irel
and
Slo
vaki
a
Italy
pen
ce p
er k
Wh
Tax Component
Price (excl tax)
IEA Median (including taxes)
5.3 Average annual industrial electricity prices, IEA
Table 5.3.1: Industrial electricity prices in the EU and G7 countries including and excluding taxes
Chart 5.3.1 Average industrial electricity prices in 2013, IEA
In 2013, average UK industrial electricity prices, including taxes, were the Eleventh highest in the IEA, fourth highest in the G7, and were 8.9 per cent above the IEA median price.
Prices in the UK excluding taxes
were the tenth highest in the IEA, third highest in the G7, and were 24 per cent above the IEA median price.
Prices relative to the median for
some countries have been estimated
Notes: Data for 2013 is not available for Australia, Canada, Korea, New Zealand, and Spain. The excluding tax price for the USA has been estimated using a weighted average of general sales taxes and fuel taxes levied by individual states. Source: IEA Energy Prices and Taxes.

International comparisons
December 2014 50
0
2
4
6
8
10
12
14
Sw
eden
Luxe
mbo
urg
Fin
lan
d
Fra
nce
Den
mar
k
Net
herla
nds
Au
stria
Be
lgiu
m
Po
rtug
al
Sp
ain
Gre
ece
Irel
and
UK
Ger
man
y
Italy
Pen
ce p
er k
Wh
Price (excl tax) Tax Component Eu 15 Median (inc tax)
0
2
4
6
8
10
12
14
16
18
Sw
ede
nLu
xem
bour
gB
ulg
aria
Fin
land
Pol
and
Slo
ven
iaC
zech
Rep
Ro
man
iaC
roa
tiaF
ranc
eD
enm
ark
Est
oni
aH
ung
ary
Ne
the
rla
nds
Aus
tria
Be
lgiu
mP
ortu
gal
Slo
vaki
aS
pain
Latv
iaG
reec
eIr
elan
dL
ithu
ania
UK
Ger
ma
nyIt
aly
Cyp
rus
Ma
lta
pen
ce p
er k
Wh
Small
Medium
Large
5.4 Average industrial electricity prices in the EU by size of consumer Table 5.4.1: Average industrial electricity prices for small consumers in the EU * Table 5.4.2: Average industrial electricity prices for medium consumers in the EU Table 5.4.3: Average industrial electricity prices for large consumers in the EU * Table 5.4.4: Average industrial electricity prices for extra large consumers in the EU 15 * Chart 5.4.1 Average industrial electricity prices for medium consumers in the EU 15 for January – June 2014
Chart 5.4.2 Average industrial electricity prices(1) in the EU for small, medium and large consumers January – June 2014 (ordered on medium sizeband)
Average UK industrial electricity prices including taxes for medium consumers for the period January to June 2014 were the third highest in the EU15 and were 22 per cent above the estimated EU15 median.
The UK prices for medium consumers excluding taxes were the highest in the EU15 and were 42 per cent above the median price.
Annual 2013 prices for medium
consumers including tax were the fourth highest in the EU15.
Medium consumers are defined as having an annual consumption of 2,000 – 19,999 MWh per annum Source: Eurostat Statistics in Focus Electricity Prices for EU Industry January – June 2014. .
(1) Including taxes where not refunded. Source: Eurostat Statistics in Focus Electricity prices for EU Industry January – June 2014.
Data for all sizebands shows that, for all countries reporting data, small consumers pay the highest unit prices.
The median price for small industrial electricity consumers in the EU, including tax, was 34 per cent higher than prices paid by medium consumers.
The median price for large
industrial electricity consumers in the EU was 15 per cent lower than prices paid by medium consumers.

International comparisons
December 2014 51
0
5
10
15
20
25
30
US
AN
orw
ayH
unga
ryT
urke
yF
ranc
eP
ola
nd
Fin
lan
dS
witz
erla
nd
Cze
ch R
epLu
xem
bour
gG
reec
eN
ew Z
eala
nd UK
Sw
eden
Slo
vaki
aJa
pan
Net
herla
nds
Be
lgiu
mA
ust
riaP
ort
uga
lIr
elan
dIta
lyG
erm
any
Den
mar
k
pen
ce p
er k
Wh
Tax Component
Price (excl tax)
IEA Median (including taxes)
5.5 Average annual domestic electricity prices, IEA
Table 5.5.1: Domestic electricity prices in the EU and G7 countries including and excluding taxes.
Chart 5.5.1 Average domestic electricity prices in 2013, IEA
In 2013, average UK domestic
electricity prices, including taxes, were thirteenth highest in the IEA, fourth highest in the G7, and were 2.2 per cent above the IEA median.
Prices in the UK excluding taxes
were the fifth highest in the IEA, second highest in the G7, and were 20 per cent above the IEA median.
Prices relative to the median for
some countries have been estimated.
Notes: Data for 2013 is not available for Australia, Canada, and Spain. Excluding tax data is not available for Korea. The excluding tax price for the USA has been estimated using a weighted average of general sales taxes and fuel taxes levied by individual states. Source: IEA Energy Prices and Taxes.

International comparisons
December 2014 52
0
4
8
12
16
20
24
28
Bu
lga
riaH
unga
ryC
zech
…R
oman
iaE
ston
iaC
roa
tiaLi
thua
nia
Latv
iaP
ola
nd
Slo
vaki
aF
inla
nd
Fra
nce
Slo
veni
aM
alta
Luxe
mbo
urg
Gre
ece
Net
herla
nds
UK
Sw
eden
Au
stria
Be
lgiu
mP
ort
uga
lS
pai
nC
ypru
sIr
elan
dIta
lyG
erm
any
Den
mar
k
Pen
ce p
er k
Wh
Small
Medium
Large
0
5
10
15
20
25
30
Fin
land
Fra
nce
Luxe
mbo
urg
Gre
ece
Ne
ther
land
s
UK
Sw
ede
n
Aus
tria
Bel
giu
m
Po
rtu
gal
Sp
ain
Irel
and
Ita
ly
Ger
ma
ny
De
nma
rk
Pen
ce p
er k
Wh
Tax Component Price (excl tax)
Eu 15 Median (inc tax)
5.6 Average domestic electricity prices in the EU by size of consumer Table 5.6.1: Average domestic electricity prices for small consumers in the EU * Table 5.6.2: Average domestic electricity prices for medium consumers in the EU Table 5.6.3: Average domestic electricity prices for large consumers in the EU *
Chart 5.6.1 Average domestic electricity prices for medium consumers in the EU 15 for January – June 2014
Chart 5.6.2 Average domestic electricity prices(1) in the EU by size of consumer January – June 2014 (ordered on medium sizeband)
The average UK domestic electricity price including taxes for medium consumers for January to June 2014 was the sixth lowest in the EU 15 and was 5.1 per cent below the median price.
The UK price excluding taxes was
the second highest in the EU15, and was 38 per cent above the median level.
Annual 2013 prices for medium
consumers including tax were the fifth lowest in the EU15.
Medium consumers are defined as having an annual consumption of 2,500 - 4,999 kWh per annum. Source: Eurostat Statistics in Focus Electricity prices for EU households, January – June 2014
(1) Including taxes where not refunded. Source: Eurostat Statistics in Focus Electricity Prices for EU households January – June 2014.
Data for all sizebands shows that, in general, small consumers pay the highest prices. The most notable exception is The Netherlands, where small consumers pay 53 per cent less than medium consumers.
The median price for small domestic electricity consumers in the EU, including tax, was 14 per cent higher than the price paid by medium consumers.
The median price for large domestic
electricity consumers in the EU was 6 per cent lower than the price paid by medium consumers.

International comparisons
December 2014 53
0
1
2
3
4
5
6
Can
ada
US
AN
ew Z
eala
ndT
urke
yB
elg
ium
Net
herla
nds
UK
Po
lan
dH
unga
ryS
pai
nC
zech
Rep
Fin
lan
dA
ust
riaS
lova
kia
Ger
man
yIr
elan
dF
ranc
eLu
xem
bour
gP
ort
uga
lD
enm
ark
Gre
ece
Sw
eden
Jap
anS
witz
erla
nd
Ko
rea
pen
ce p
er k
Wh
Tax component
Price (excl tax)
IEA Median (Including Taxes)
5.7 Average annual industrial gas prices, IEA
Table 5.7.1: Industrial gas prices in the EU and G7 countries including and excluding taxes
Chart 5.7.1 Average industrial gas prices in 2013, IEA
In 2013, average UK industrial gas prices, including taxes where not refunded, were the seventh lowest in the IEA, third lowest in the G7, and were 15 per cent below the IEA median.
Prices in the UK excluding taxes
were the ninth lowest in the IEA, third lowest in the G7, and were 9.1 per cent below the IEA median.
Prices relative to the median for
some countries have been estimated.
Notes: Data for 2013 is not available for Australia, Italy, and Norway. The excluding tax price for the USA has been estimated using a weighted average of general sales taxes and fuel taxes levied by individual states. The excluding tax price for Korea for some recent years has been estimated using average tax rates for years where both including and excluding tax data is available. Source: IEA Energy Prices and Taxes.

International comparisons
December 2014 54
0
1
2
3
4
5
Be
lgiu
m UK
Den
mar
k
Sp
ain
Italy
Fra
nce
Irel
and
Net
herla
nds
Luxe
mbo
urg
Au
stria
Po
rtug
al
Ger
man
y
Fin
lan
d
Gre
ece
Sw
eden
Pen
ce p
er k
Wh
Tax ComponentPrice (excl tax)Eu 15 Median (inc tax)
0
2
4
6
Rom
ania
Be
lgiu
mC
zech
…La
tvia
Bu
lga
riaE
ston
iaU
KS
lova
kia
Den
mar
kS
pai
nP
ola
nd
Italy
Fra
nce
Hun
gary
Irel
and
Lith
uani
aC
roa
tiaN
ethe
rland
sLu
xem
bour
gA
ust
riaP
ort
uga
lS
love
nia
Ger
man
yF
inla
nd
Gre
ece
Sw
eden
Pen
ce p
er k
Wh
Small
Medium
Large
5.8 Average industrial gas prices in the EU by size of consumer
Table 5.8.1: Average industrial gas prices for small consumers in the EU * Table 5.8.2: Average industrial gas prices for medium consumers in the EU Table 5.8.3: Average industrial gas prices for large consumers in the EU *
Chart 5.8.1 Average industrial gas prices for medium consumers in the EU 15 for January – June 2014
Chart 5.8.2 Average industrial gas prices(1) in the EU by size of consumer January – June 2014 (ordered on medium sizeband)
Average UK industrial gas prices for the period January to June 2014, including taxes, for medium consumers were the second lowest in the EU15 and were 12 per cent below the median price.
UK prices excluding taxes for
medium consumers were the sixth lowest in the EU15 and were 4.1 per cent below the EU15 median.
Annual 2013 prices for medium
consumers including tax were the lowest in the EU15.
(1) Including taxes where not refunded. Cyprus and Malta do not provide data to Eurostat for this series. Source: Eurostat Statistics in Focus Electricity Prices for EU Industry January – June 2014.
Medium consumers are defined as having an annual consumption of 2,778 – 27,777 MWh. Source: Eurostat Statistics in Focus Electricity prices for EU Industry January – June 2014.
Data for all sizebands shows that, for all countries reporting data, small consumers pay the highest prices.
The median price for small
industrial gas consumers in the EU, including tax, was 15 per cent higher than the price paid by medium consumers.
The median price for large
industrial gas consumers in the EU was 15 per cent lower than the price paid by medium consumers.

International comparisons
December 2014 55
0
1
2
3
4
5
6
7
8
9
10
11
Can
ada
US
AT
urke
yH
unga
ryF
inla
nd
Po
lan
dS
lova
kia
UK
Luxe
mbo
urg
Cze
ch R
epB
elg
ium
Fra
nce
Au
stria
Ger
man
yIr
elan
dN
ethe
rland
sS
witz
erla
nd
Sp
ain
New
Zea
land
Po
rtug
al
Den
mar
kJa
pan
Gre
ece
Sw
eden
pen
ce p
er k
Wh
Tax component
Price (excl tax)
IEA Median (including taxes)
5.9 Average annual domestic gas prices, IEA Table 5.9.1: Domestic gas prices in the EU 15 and G7 countries including and excluding taxes
Chart 5.9.1 Average domestic gas prices in 2013, IEA
Notes: Data for 2013 is not available for Australia, Italy, and Norway. Excluding tax data is not available for Korea. Prices for Finland are for district heating, not central heating as is the case in other countries. The excluding tax price for the USA has been estimated using a weighted average of general sales taxes and fuel taxes levied by individual states. Source: IEA Energy Prices and Taxes.
In 2013, average UK domestic gas prices, including taxes where not refunded, were the eighth lowest in the IEA, third lowest in the G7, and were 17 per cent lower than the IEA median.
Prices in the UK excluding taxes
were the tenth highest in the IEA, fourth highest in the G7, and were 3.6 per cent above the IEA median.
Prices relative to the median for
some countries have been estimated.

International comparisons
December 2014 56
0
2
4
6
8
10
12
Luxe
mbo
urg
UK
Be
lgiu
m
Ger
man
y
Irel
and
Fra
nce
Gre
ece
Au
stria
Sp
ain
Italy
Net
herla
nds
Den
mar
k
Po
rtug
al
Sw
eden
Pe
nc
e p
er
kW
h
Tax Component Price (excl tax) Eu 15 Median (inc tax)
0
2
4
6
8
10
12
14
16
Rom
ania
Hun
gary
Cro
atia
Latv
iaP
ola
nd
Bu
lga
riaE
ston
iaS
lova
kia
Luxe
mbo
urg
Cze
ch…
Lith
uani
aU
KB
elg
ium
Slo
veni
aG
erm
any
Irel
and
Fra
nce
Gre
ece
Au
stria
Sp
ain
Italy
Net
herla
nds
Den
mar
kP
ort
uga
lS
wed
en
Pen
ce p
er k
Wh
Small
Medium
Large
5.10 Average domestic gas prices in the EU by size of consumer
Table 5.10.1: Average domestic gas prices for small consumers in the EU * Table 5.10.2: Average domestic gas prices for medium consumers in the EU Table 5.10.3: Average domestic gas prices for large consumers in the EU *
Chart 5.10.1 Average domestic gas prices for medium consumers in the EU 15 for January – June 2014
Chart 5.10.2 Average domestic gas prices(1) in the EU by size of consumers January – June 2014 (ordered on medium sizeband)
Average UK domestic gas prices, including taxes, for medium consumers for the period January to June 2014 were the second lowest in the EU 15 and were 18 per cent lower than the median.
The UK price excluding taxes was
the seventh highest in the EU 15 and was 2.3 per cent higher than the median price.
Annual 2013 prices for medium
consumers including tax were the lowest in the EU15.
Medium consumers are defined as having an annual consumption of 5,557 – 55,556 kWh per annum. Finland does not provide data to Eurostat for this series. Source: Eurostat Statistics in Focus Electricity prices for EU households, January – June 2014.
(1) Including taxes where not refunded. Cyprus, Finland and Malta do not provide data to Eurostat for this series. Source: Eurostat Statistics in Focus Electricity Prices for EU households January – June 2014.
Data for all sizebands shows that, on average, small consumers pay the highest prices.
The median price for small domestic
gas consumers in the EU, including tax, was 28 per cent higher than the price paid by medium consumers.
The median price for large domestic
gas consumers in the EU was 11 per cent lower than the price paid by medium consumers.

Table 5.1.1 Premium unleaded petrol prices in the EU (September, October and November 2014)
Pence per litre(1)
Sept Oct Nov Sept Oct Nov Sept Oct NovAustria 52.6 51.3 47.9 110.2 108.2 104.8 52 53 54Belgium 57.5 53.3 46.7 128.6 123.0 115.8 55 57 60Denmark 58.0 55.1 52.1 132.4 128.3 125.4 56 57 58Finland 54.3 52.7 48.0 128.8 126.2 121.4 58 58 60France 50.6 49.4 46.1 119.2 117.3 114.2 58 58 60Germany 52.9 50.8 46.9 124.9 121.8 118.1 58 58 60Greece 53.6 52.4 48.3 132.8 130.7 126.5 60 60 62Ireland 53.4 50.7 46.9 125.1 121.3 117.4 57 58 60Italy 55.0 53.4 49.5 137.9 135.4 131.7 60 61 62Luxembourg 55.6 53.8 48.8 106.1 103.7 98.5 48 48 51Netherlands 53.0 50.5 46.7 137.9 134.3 130.7 62 62 64Portugal 53.6 51.8 47.8 123.2 120.5 116.3 57 57 59Spain 56.0 54.0 50.6 112.5 109.7 106.1 50 51 52Sweden 51.8 50.4 45.1 125.4 123.8 117.2 59 59 62UK 49.1 47.7 44.1 128.5 126.8 122.5 62 62 64UK Rank in EU 15 1 1 1 9 11 11 15 14 14
Bulgaria 57.5 55.3 50.3 103.7 100.7 95.2 45 45 47Croatia 51.6 50.4 46.3 112.3 110.1 105.5 54 54 56Cyprus 56.0 54.7 50.5 113.0 111.0 106.6 50 51 53Czech Republic 50.9 50.2 48.7 106.3 105.2 103.8 52 52 53Estonia 51.2 50.5 46.9 101.8 100.6 96.8 50 50 52Hungary 52.9 52.4 47.7 106.7 106.9 101.4 50 51 53Latvia 51.0 50.0 46.3 102.5 100.8 96.9 50 50 52Lithuania 53.3 51.8 49.0 106.3 104.1 101.2 50 50 52Malta 56.5 56.0 56.8 114.5 113.5 115.0 51 51 51Poland 50.0 49.3 45.7 100.4 99.3 95.1 50 50 52Romania 52.7 50.7 47.1 110.8 108.1 103.9 52 53 55Slovakia 51.8 52.3 48.3 116.5 116.6 112.6 56 55 57Slovenia 50.3 49.5 45.8 114.6 114.0 114.3 56 57 60UK Rank in EU 28 1 1 1 22 24 24 28 27 27
European unleaded petrol(2) prices on, or about, the fifteenth of the monthPrice excl tax and duty Pump price Tax component (%)
Source: European Commission Oil Bulletin(1) Prices converted to pounds sterling using mid month exchange rates.(2) Premium unleaded petrol, 95RON
57

Table 5.2.1 Diesel prices in the EU (September, October and November 2014)
Pence per litre(1)
Sept Oct Nov Sept Oct Nov Sept Oct NovAustria 54.6 52.2 51.5 104.6 101.3 101.1 48 49 49Belgium 58.1 53.2 52.3 111.4 105.1 104.7 48 49 50Denmark 59.7 56.8 55.9 115.7 111.7 111.1 48 49 50Finland 56.6 55.9 56.0 115.8 114.6 115.3 51 51 51France 51.0 49.2 47.7 103.3 100.7 99.6 51 51 52Germany 54.4 51.7 50.4 109.2 105.7 104.7 50 51 52Greece 60.5 59.5 57.4 108.0 106.4 104.2 44 44 45Ireland 55.9 52.9 50.4 117.6 113.4 111.0 52 53 55Italy 56.0 54.4 52.1 128.4 126.0 123.9 56 57 58Luxembourg 55.4 52.6 51.6 94.4 90.9 90.2 41 42 43Netherlands 54.4 51.5 51.5 112.6 108.6 109.3 52 53 53Portugal 55.4 53.4 51.6 104.3 101.5 99.7 47 47 48Spain 57.7 55.3 53.7 105.5 102.3 100.9 45 46 47Sweden 55.8 53.9 51.8 121.9 119.8 117.1 54 55 56UK 52.9 51.3 48.0 133.1 131.1 127.2 60 61 62UK Rank in EU 15 2 2 2 15 15 15 15 15 15
Bulgaria 61.9 59.6 55.2 105.7 102.7 97.8 41 42 44Croatia 55.4 53.6 51.2 106.5 103.8 101.3 48 48 49Cyprus 59.0 57.7 55.1 113.7 111.8 109.4 48 48 50Czech Republic 56.0 55.3 54.4 105.9 104.8 104.1 47 47 48Estonia 52.2 51.9 50.5 100.2 99.5 98.3 48 48 49Hungary 56.0 54.9 53.5 107.6 107.0 105.6 48 49 49Latvia 55.1 54.0 51.7 100.0 98.3 96.0 45 45 46Lithuania 57.6 56.1 53.3 101.5 99.4 96.4 43 44 45Malta 58.0 57.5 58.3 108.1 107.2 108.7 46 46 46Poland 52.1 51.4 48.6 98.1 96.9 93.7 47 47 48Romania 56.4 54.7 52.0 112.3 109.9 106.9 50 50 51Slovakia 56.6 55.1 53.5 106.7 104.5 103.1 47 47 48Slovenia 52.1 51.1 48.7 107.7 107.1 107.9 52 52 55UK Rank in EU 28 5 3 2 28 28 28 28 28 28
European diesel prices on, or about, the fifteenth of the month Price excl tax and duty Pump price Tax component (%)
Source: European Commission Oil Bulletin(1) Prices converted to pounds sterling using mid month exchange rates.
58

Table 5.3.1 Industrial electricity prices in the IEAPence per kWh(1)
2005 2010 2011 2012 2013 2005 2010 2011 2012 2013
EU 15Austria(3) 4.24 7.25 7.15 7.14 7.15 5.60 8.86 8.79 8.71 9.04Belgium .. 7.17 7.63 7.00 6.86 .. 8.06 8.64 7.99 8.21Denmark 4.39 6.75 6.60 6.13 6.74 5.10 7.41 7.18 7.01 7.66Finland 3.56 5.92 6.47 5.99 6.23 3.87 6.14 7.08 6.56 6.83France 2.43 6.18 6.52 6.21 6.61 2.74 6.92 7.58 7.33 8.07Germany 4.62 6.82 6.92 6.31 6.59 4.62 8.79 9.80 9.38 10.84Greece 3.69 6.37 6.76 7.01 7.41 3.69 7.37 7.83 8.44 9.09Ireland 5.47 8.88 9.50 9.79 11.10 5.47 8.88 9.50 9.79 11.10Italy 7.52 12.89 12.77 12.59 13.14 9.57 16.71 17.41 18.41 20.60Luxembourg .. 6.87 6.98 6.70 6.46 .. 7.44 7.36 7.05 6.82Netherlands .. 6.58 6.45 6.01 6.29 .. 7.52 7.39 6.91 7.22Portugal 5.39 7.79 8.67 9.30 9.74 5.39 7.79 8.67 9.30 9.74Spain 4.36 8.12 8.82 + + 4.59 8.54 9.27 + +Sweden .. 6.19 6.44 5.59 5.74 .. 6.23 6.49 5.63 5.79UK 4.56 7.57 7.81 8.21 8.69 4.77 7.84 8.08 8.47 8.94
Rest of IEAAustralia .. .. .. .. .. .. .. .. .. ..Canada 2.71 4.33 4.52 4.96 - 3.04 4.73 5.05 5.57 -Czech Republic 4.43 9.22 9.87 9.05 9.43 4.43 9.32 9.97 9.14 9.53Hungary 5.21 8.40 8.20 7.81 7.96 5.26 8.59 8.55 8.30 8.49Japan 6.23 9.24 10.36 11.38 10.37 6.43 9.52 10.65 11.68 10.62Korea .. .. .. .. .. 3.24 - - - -New Zealand 3.38 4.64 5.29 5.32 - 3.38 4.64 5.29 5.32 -Norway 1.91 3.82 3.55 2.91 3.52 1.91 3.82 3.55 2.91 3.52Poland 3.51 7.36 7.16 6.84 6.60 3.85 7.79 7.58 7.23 7.01Slovakia 6.08 10.95 11.13 10.71 11.46 6.08 10.95 11.13 10.71 11.46Switzerland 4.43 6.99 7.91 7.92 8.17 4.43 7.27 8.23 8.22 8.48Turkey 4.77 7.96 7.04 7.62 7.64 4.96 8.28 7.32 7.93 7.95USA(4)
3.00 4.19 4.05 4.01 4.16 3.15 4.40 4.25 4.21 4.36
IEA median 4.41 7.08 7.09 7.01 7.01 4.59 7.79 7.83 7.99 8.21
UK relative to:
IEA median% +3.3 +7.0 +10.2 +17.1 +24.0 +4.0 +0.7 +3.2 +6.0 +8.9IEA rank 14 17 17 19 19 14 16 15 18 17
G7 rank 4 5 5 5 5 5 4 4 4 4
Source: Derived from the International Energy Agency publication, Energy Prices and Taxes
Electricity
Excluding taxes Including taxes(2)
(1) Prices converted to pounds sterling using annual average exchange rates.(2) Prices include all taxes where not refundable on purchase.(3) Prices for Austria are taken from Eurostat's medium sizeband(4) Prices excluding taxes have been estimated using a weighted average of general sales taxes and fuel taxes levied by individual states.
.. Data unavailable.- DECC estimates that the price is likely to be below the IEA median.+/- DECC estimates that the price is likely to be around the IEA median.+ DECC estimates that the price is likely to exceed the IEA median.
59

Table 5.4.2 Industrial electricity prices in the EU for medium consumers(1)
(Excluding taxes)Pence per kWh(2)
Jan 11 - June 11
July 11 - Dec 11
Jan 12 - June 12
July 12 - Dec 12
Jan 13 - June 13
July 13 - Dec 13
Jan 14 -June 14
Austria 7.14 7.15 6.63 6.34 6.57 6.54 6.03
Belgium(7) 7.47 7.80 7.28 6.72 6.66 7.05 6.62Denmark 7.55 6.98 6.77 6.80 7.60 7.35 6.78Finland 5.76 5.66 5.34 5.18 5.45 5.48 5.14France 5.66 5.13 5.78 4.56 5.73 4.95 5.32Germany 6.87 6.97 6.46 6.16 6.43 6.73 5.91Greece 6.62 6.91 7.01 7.00 7.44 7.37 7.32Ireland 7.45 8.21 8.35 9.38 9.65 9.65 9.21
Italy(7) 8.74 9.00 9.61 9.19 8.67 8.82 7.78Luxembourg 6.16 6.17 5.90 6.12 6.13 5.97 5.23Netherlands 6.41 6.50 5.89 6.12 6.25 6.32 5.88Portugal 7.30 7.19 8.15 7.17 7.76 8.21 7.31Spain 7.57 7.73 7.94 7.63 8.47 8.71 8.11Sweden 6.80 6.10 5.81 5.33 5.82 5.65 5.17UK 7.43 7.72 8.14 8.36 8.72 9.11 9.38
EU 15 Median(4) 7.14 6.98 6.77 6.72 6.66 7.05 6.62UK relative to:EU 15 Median(%) +4.0 +10.6 +20.1 +24.4 +30.9 +29.2 +41.7EU 15 Rank 10 11 12 13 14 14 15
Bulgaria 4.98 5.05 5.13 5.50 5.88 5.26 5.49Croatia 6.67 6.55 6.17 6.37 6.85 6.52 6.31Cyprus 12.54 16.52 16.65 17.02 15.97 15.39 12.81Czech Republic 8.54 8.29 7.88 7.68 8.18 8.00 6.36Estonia 5.35 5.48 5.26 5.36 6.58 6.49 5.90Hungary 7.96 7.58 7.05 7.22 7.46 7.59 6.66Latvia 7.86 8.58 8.14 6.58 7.39 6.75 6.63Lithuania 8.83 8.87 8.81 8.56 10.08 9.59 7.88Malta 13.89 13.88 13.15 12.79 14.18 14.12 13.65Poland 7.04 6.44 6.31 6.37 6.36 5.98 5.39Romania 6.10 6.10 6.00 5.36 6.47 5.98 5.47Slovakia 9.66 9.83 9.66 8.91 9.69 9.36 8.15Slovenia 6.55 6.69 6.31 6.16 6.30 6.24 5.52
EU 28 Median(4) 7.22 7.07 6.89 6.65 7.12 6.90 6.49UK relative to:EU 28 Median(%) +2.9 +9.3 +18.1 +25.7 +22.5 +32.1 +44.6EU 28 Rank 16 18 20 22 23 23 26
(1) Medium consumers: consuming 2,000 - 19,999 MWh per annum for periods
January - June and July - December each year
(2) Prices converted to sterling using exchange rates in the appropriate period.
(3) See paragraph A47 in the Technical notes for an explanation of the estimating methodology.(4) Median price is based upon the available data, including those cases where DECC have estimated
the position of prices relative to the EU median.
(5) Prices include all taxes where not refundable on purchase.
(6) There is no tax.
Source: Eurostat Statistics in Focus
60
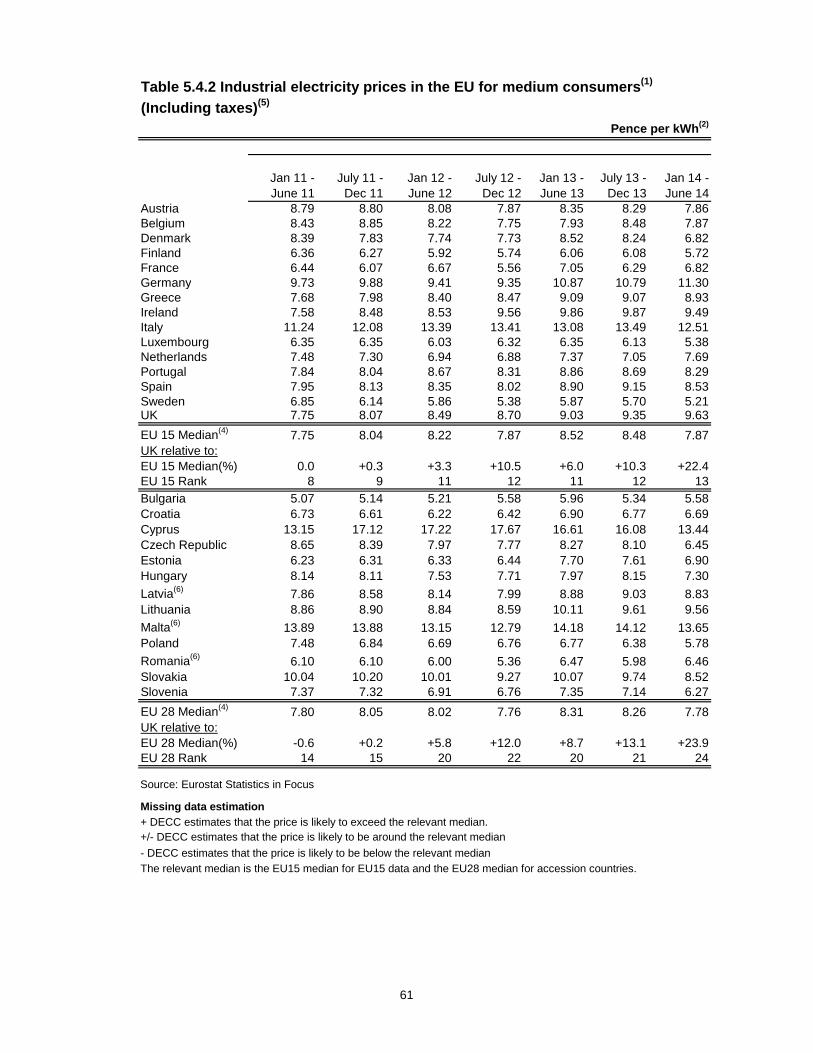
Table 5.4.2 Industrial electricity prices in the EU for medium consumers(1)
(Including taxes)(5)
Pence per kWh(2)
Jan 11 - June 11
July 11 - Dec 11
Jan 12 - June 12
July 12 - Dec 12
Jan 13 - June 13
July 13 - Dec 13
Jan 14 - June 14
Austria 8.79 8.80 8.08 7.87 8.35 8.29 7.86Belgium 8.43 8.85 8.22 7.75 7.93 8.48 7.87Denmark 8.39 7.83 7.74 7.73 8.52 8.24 6.82Finland 6.36 6.27 5.92 5.74 6.06 6.08 5.72France 6.44 6.07 6.67 5.56 7.05 6.29 6.82Germany 9.73 9.88 9.41 9.35 10.87 10.79 11.30Greece 7.68 7.98 8.40 8.47 9.09 9.07 8.93Ireland 7.58 8.48 8.53 9.56 9.86 9.87 9.49Italy 11.24 12.08 13.39 13.41 13.08 13.49 12.51Luxembourg 6.35 6.35 6.03 6.32 6.35 6.13 5.38Netherlands 7.48 7.30 6.94 6.88 7.37 7.05 7.69Portugal 7.84 8.04 8.67 8.31 8.86 8.69 8.29Spain 7.95 8.13 8.35 8.02 8.90 9.15 8.53Sweden 6.85 6.14 5.86 5.38 5.87 5.70 5.21UK 7.75 8.07 8.49 8.70 9.03 9.35 9.63
EU 15 Median(4) 7.75 8.04 8.22 7.87 8.52 8.48 7.87UK relative to:EU 15 Median(%) 0.0 +0.3 +3.3 +10.5 +6.0 +10.3 +22.4EU 15 Rank 8 9 11 12 11 12 13
Bulgaria 5.07 5.14 5.21 5.58 5.96 5.34 5.58Croatia 6.73 6.61 6.22 6.42 6.90 6.77 6.69Cyprus 13.15 17.12 17.22 17.67 16.61 16.08 13.44Czech Republic 8.65 8.39 7.97 7.77 8.27 8.10 6.45Estonia 6.23 6.31 6.33 6.44 7.70 7.61 6.90Hungary 8.14 8.11 7.53 7.71 7.97 8.15 7.30
Latvia(6) 7.86 8.58 8.14 7.99 8.88 9.03 8.83Lithuania 8.86 8.90 8.84 8.59 10.11 9.61 9.56
Malta(6) 13.89 13.88 13.15 12.79 14.18 14.12 13.65Poland 7.48 6.84 6.69 6.76 6.77 6.38 5.78
Romania(6) 6.10 6.10 6.00 5.36 6.47 5.98 6.46Slovakia 10.04 10.20 10.01 9.27 10.07 9.74 8.52Slovenia 7.37 7.32 6.91 6.76 7.35 7.14 6.27
EU 28 Median(4) 7.80 8.05 8.02 7.76 8.31 8.26 7.78UK relative to:EU 28 Median(%) -0.6 +0.2 +5.8 +12.0 +8.7 +13.1 +23.9EU 28 Rank 14 15 20 22 20 21 24
Missing data estimation
+ DECC estimates that the price is likely to exceed the relevant median.+/- DECC estimates that the price is likely to be around the relevant median
- DECC estimates that the price is likely to be below the relevant median
The relevant median is the EU15 median for EU15 data and the EU28 median for accession countries.
Source: Eurostat Statistics in Focus
61

Table 5.5.1 Domestic electricity prices in the IEAPence per kWh(1)
2005 2010 2011 2012 2013 2005 2010 2011 2012 2013
EU 15Austria 6.55 12.09 12.38 11.57 11.90 9.59 16.68 17.01 16.02 17.41Belgium .. 10.92 12.08 11.70 12.23 .. 15.00 16.48 15.77 16.89Denmark 6.85 10.15 11.19 10.57 10.83 16.20 23.07 25.53 24.20 25.21Finland 4.94 8.51 9.35 8.62 9.00 6.65 11.36 13.32 12.30 12.95France 5.85 7.80 8.24 7.71 8.41 7.79 10.70 11.66 11.05 12.38Germany 10.08 11.80 12.15 11.65 12.67 11.69 20.64 21.94 21.38 24.82Greece 5.67 8.29 8.80 8.67 10.04 6.17 10.26 10.79 11.39 13.85Ireland 9.37 13.27 14.25 15.03 16.51 10.60 15.06 16.18 17.06 18.74Italy 8.20 12.60 12.47 12.65 13.01 10.87 17.04 17.39 18.20 19.56Luxembourg 8.96 11.45 11.86 11.39 11.53 10.27 13.95 13.78 13.21 13.24Netherlands 7.52 11.59 11.95 11.95 12.64 12.99 14.32 14.83 15.03 16.47Portugal 9.41 13.21 13.89 13.37 14.55 9.88 13.93 15.32 16.45 17.90Spain 6.93 12.88 14.84 + + 8.45 15.97 18.41 + +Sweden .. 8.90 9.79 8.75 9.25 .. 14.11 15.46 14.13 14.95UK 7.88 11.29 12.37 13.09 14.01 8.27 11.85 12.99 13.74 14.71
Rest of IEAAustralia .. .. .. .. .. .. .. .. .. ..Canada 3.75 5.56 6.07 6.09 - 4.16 6.04 6.55 6.61 -Czech Republic 4.88 9.91 10.84 10.36 10.77 5.81 12.01 13.13 12.55 13.16Hungary 6.49 11.24 10.69 9.82 8.90 8.04 14.15 13.63 12.88 11.65Japan 9.69 14.04 15.23 16.34 14.51 10.39 15.03 16.30 17.46 15.50Korea .. .. .. .. .. 4.89 5.39 5.53 5.87 6.49New Zealand 6.65 10.08 11.11 11.88 12.51 7.48 11.40 12.78 13.66 14.39Norway 4.53 7.93 7.26 5.63 6.34 6.71 11.38 10.64 8.58 9.50Poland 5.11 9.08 9.63 9.40 9.81 6.65 11.60 12.36 12.05 12.56Slovakia 8.33 11.59 12.56 12.08 12.70 9.92 13.79 15.07 14.49 15.24Switzerland 7.11 10.55 12.54 11.63 11.76 7.64 11.65 13.89 12.88 13.04Turkey 5.09 9.36 8.28 9.15 9.54 6.49 11.92 10.55 11.66 12.15USA(3)
4.95 7.14 6.96 7.14 7.38 5.20 7.50 7.31 7.50 7.75
IEA median 6.75 10.74 11.52 11.48 11.64 8.04 13.79 13.78 13.66 14.39
UK relative to:
IEA median% +16.7 +5.1 +7.3 +14.0 +20.3 +2.9 -14.0 -5.8 +0.6 +2.2IEA rank 17 16 18 22 22 14 11 10 15 15
G7 rank 4 4 5 6 6 4 4 4 4 4Source: Derived from the International Energy Agency publication, Energy Prices and Taxes
Electricity
Excluding taxes Including taxes(2)
(1) Prices converted to pounds sterling using annual average exchange rates.(2) Prices include all taxes where not refundable on purchase.(3) Prices excluding taxes have been estimated using a weighted average of general sales taxes and fuel
taxes levied by individual states.
.. Data unavailable.+ DECC estimates that the price is likely to exceed the IEA median. +/- DECC estimates that the price is likely to be around the IEA median.- DECC estimates that the price is likely to be below the IEA median.
62

Table 5.6.2 Domestic electricity prices in the EU for medium consumers(1)
(Excluding taxes)Pence per kWh(2)
Jan 11 - June 11
July 11 - Dec 11
Jan 12 - June 12
Jul 12 - Dec 12
Jan 13 - June 13
Jul 13 - Dec 13
Jan 14 - June 14
Austria 12.52 12.53 11.78 11.29 12.02 11.54 10.85Belgium 13.65 13.84 13.07 13.46 13.47 13.91 13.74Denmark 10.96 11.41 10.80 10.36 11.06 10.59 10.82Finland 9.38 9.61 8.95 8.77 9.38 9.21 8.79France 8.63 8.82 8.11 8.20 8.57 9.32 8.74Germany 12.21 12.10 11.85 11.45 12.70 12.62 11.78Greece 8.90 8.70 8.76 8.57 9.95 10.11 9.89Ireland 13.75 15.22 15.21 15.62 16.60 17.17 16.49
Italy(6) 12.13 12.25 11.88 12.19 12.75 12.72 12.64Luxembourg 12.60 12.46 12.07 11.81 12.31 12.11 11.75Netherlands 10.86 11.65 10.83 11.01 11.25 11.65 10.73Portugal 8.81 9.27 9.09 9.39 10.30 10.54 10.41Spain 13.86 14.61 14.52 14.30 14.91 15.15 14.54Sweden 11.95 11.62 10.79 10.75 11.56 11.20 10.38UK 11.85 13.09 13.18 13.60 14.11 14.51 15.00
EU 15 Median(4) 11.95 12.10 11.78 11.29 12.02 11.65 10.85UK relative to:EU 15 Median(%) -0.8 +8.2 +11.9 +20.5 +17.3 +24.6 +38.2EU 15 Rank 7 12 13 13 13 13 14Bulgaria 5.97 6.31 5.80 6.36 6.56 6.23 5.66Croatia 7.97 8.02 7.93 8.79 9.28 8.99 8.25Cyprus 15.03 17.65 19.22 19.30 19.37 17.19 15.28Czech Republic 10.70 10.48 10.15 9.90 10.63 10.37 8.61Estonia 6.11 6.62 6.34 6.35 8.46 8.54 7.94Hungary 11.60 10.34 9.71 9.86 9.03 8.64 7.77Latvia 8.31 9.54 9.40 7.63 8.20 7.23 7.06Lithuania 8.72 8.75 8.57 8.38 9.63 9.75 7.33Malta 14.02 14.01 13.28 12.91 13.74 13.69 13.15Poland 9.94 9.13 9.09 9.55 9.83 9.50 9.09Romania 7.36 7.14 6.54 5.98 7.57 7.60 7.47Slovakia 11.91 12.10 11.51 11.22 11.78 11.58 10.05Slovenia 9.37 9.97 9.81 9.53 10.01 9.97 9.46
EU 28 Median(4) 10.91 10.94 10.47 10.13 10.84 10.56 10.22UK relative to:EU 28 Median(%) +8.6 +19.6 +25.9 +34.3 +30.1 +37.4 +46.8EU 28 Rank 17 23 24 25 25 25 26
Source: Eurostat Statistics in Focus
(1) Medium consumers: consuming 2,500 - 4,999 kWh per annum, for periods January - June and July - December each year.
(2) Prices converted to sterling using exchange rates in the appropriate period.(3) Source: DECC. See paragraph A47 in the Technical notes for an explanation of the
estimating methodology.(4) Median price is based upon the available data, including those cases where DECC have
estimated the position of prices relative to the EU median.(5) Prices include all taxes where not refundable on purchase.(6) Some ex-tax data is missing
63

Table 5.6.2 Domestic electricity prices in the EU for medium consumers(1)
(Including Taxes)(5)
Pence per kWh(2)
Jan 11 - June 11
July 11 - Dec 11
Jan 12 - June 12
July 12 -Dec 12
Jan 13 - June 13
Jul 13 - Dec 13
Jan 14 - June 14
Austria 17.24 17.05 16.24 16.18 17.71 17.11 16.60Belgium 18.54 18.38 19.13 17.77 18.49 18.78 17.22Denmark 25.24 25.81 24.64 23.76 25.53 24.89 24.98Finland 13.37 13.65 12.74 12.46 13.43 13.22 12.84France 12.01 12.34 11.44 11.59 12.52 13.47 13.02Germany 21.95 21.96 21.34 21.39 24.84 24.76 24.48Greece 10.85 10.74 11.44 11.34 13.30 14.39 14.51Ireland 16.50 18.10 17.72 18.30 19.53 20.39 19.77Italy 17.25 17.91 17.53 18.36 19.50 19.69 20.09Luxembourg 14.57 14.42 13.94 13.64 14.17 13.95 14.27Netherlands 15.11 15.95 15.28 15.15 16.30 16.23 14.95Portugal 14.36 16.32 16.39 16.49 17.71 18.06 17.86Spain 17.20 18.11 18.01 18.19 18.96 19.27 18.49Sweden 18.16 17.73 16.67 16.65 17.88 17.34 16.15UK 12.44 13.74 13.83 14.27 14.81 15.23 15.75
EU 15 Median(4) 16.50 17.05 16.39 16.49 17.71 17.34 16.60UK relative to:EU 15 Median(%) -24.6 -19.4 -15.6 -13.5 -16.4 -12.2 -5.1EU 15 Rank 3 4 4 5 5 5 6Bulgaria 7.17 7.58 6.96 7.63 7.86 7.48 6.83Croatia 9.87 9.94 9.93 11.06 11.67 11.44 10.77Cyprus 17.80 20.93 22.86 23.26 23.48 21.03 18.81Czech Republic 12.98 12.72 12.31 12.00 12.98 12.66 10.54Estonia 8.45 9.04 9.01 8.98 11.49 11.59 10.73Hungary 14.60 13.47 12.74 12.93 11.89 11.24 9.87Latvia 10.14 11.64 11.36 10.94 11.72 11.51 11.21Lithuania 10.54 10.59 10.36 10.14 11.66 11.79 10.92Malta 14.76 14.75 13.98 13.59 14.46 14.41 13.80Poland 12.77 11.72 11.66 12.22 12.59 12.18 11.67Romania 9.39 9.41 8.63 8.59 11.26 10.84 10.59Slovakia 14.60 14.83 14.11 13.77 14.45 14.22 12.38Slovenia 12.51 12.94 12.68 12.33 13.70 14.05 13.39
EU 28 Median(4) 14.46 14.08 13.89 13.61 14.31 14.30 14.04UK relative to:EU 28 Median(%) -14.0 -2.4 -0.4 +4.8 +3.5 +6.5 +12.2EU 28 Rank 9 14 14 17 17 17 18
Missing data estimation+ DECC estimates that the price is likely to exceed the relevant median.+/- DECC estimates that the price is likely to be around the relevant median
- DECC estimates that the price is likely to be below the relevant medianThe relevant median is the EU15 median for EU15 data and the EU28 median for accession countries.
Source: Eurostat Statistics in Focus
64

Table 5.7.1 Industrial gas prices in the IEAPence per kWh(1)
2005 2010 2011 2012 2013 2005 2010 2011 2012 2013
EU 15Austria(3) .. 2.78 2.88 2.51 2.57 .. 3.01 3.11 3.02 3.13Belgium .. 1.92 2.29 2.26 2.48 .. 1.98 2.36 2.34 2.55Denmark(3) .. 2.32 2.88 2.90 2.87 .. 3.21 3.79 3.86 3.79Finland 0.78 1.79 2.11 2.23 2.16 0.90 1.95 2.82 2.89 3.04France 1.50 2.57 3.09 3.11 3.19 1.56 2.70 3.21 3.23 3.32Germany 1.61 2.67 3.04 2.49 2.85 1.89 3.01 3.39 2.82 3.19Greece 1.48 2.88 3.33 3.77 3.45 1.48 2.88 3.49 4.21 3.90Ireland 1.77 2.22 2.50 2.60 3.00 1.77 2.40 2.74 2.88 3.31Italy 1.44 2.34 - - + 1.67 2.69 + + +Luxembourg .. 2.46 3.08 3.08 3.38 .. 2.50 3.12 3.13 3.43Netherlands .. 2.05 2.22 2.27 2.44 .. 2.23 2.40 2.44 2.66Portugal 1.61 2.61 3.13 3.33 3.57 1.61 2.61 3.13 3.33 3.57Spain 1.20 2.17 2.35 2.77 2.89 1.20 2.17 2.35 2.77 2.93Sweden .. 3.09 3.48 3.21 3.30 .. 3.63 4.22 4.00 4.08UK 1.36 1.78 2.16 2.36 2.61 1.41 1.83 2.22 2.43 2.68
Rest of IEAAustralia .. .. .. .. .. .. .. .. .. ..Canada 1.29 0.85 0.92 0.72 0.84 1.29 0.85 0.92 0.72 0.84Czech Republic 1.38 2.85 3.06 2.98 2.93 1.38 2.95 3.17 3.08 3.03Hungary 1.58 2.29 2.63 2.94 2.84 1.63 2.38 2.72 3.02 2.92Japan 1.81 3.36 4.18 4.63 4.39 1.81 3.36 4.18 4.63 4.39Korea(4) 1.65 2.98 3.29 3.59 4.42 1.86 3.40 3.75 4.09 5.04New Zealand 0.99 1.27 1.31 1.35 1.45 1.05 1.35 1.39 1.44 1.54Norway .. .. .. .. .. .. .. .. .. ..Poland 1.06 2.53 2.65 2.77 2.71 1.06 2.53 2.65 2.77 2.71Slovakia 1.74 2.86 3.02 3.21 3.05 1.74 2.98 3.13 3.31 3.16Switzerland 1.89 3.26 4.04 4.07 4.16 1.90 3.69 4.52 4.53 4.62Turkey 1.14 1.83 1.71 2.12 2.29 1.22 1.92 1.79 2.20 2.36USA(5)
1.46 1.10 1.00 0.77 0.94 1.54 1.15 1.05 0.81 0.98
IEA median 1.47 2.40 2.83 2.77 2.88 1.55 2.57 3.12 3.02 3.14
UK relative to:
IEA median% -7.4 -25.8 -23.8 -14.8 -9.1 -8.8 -28.8 -28.9 -19.7 -14.7IEA rank 7 4 6 8 9 8 4 5 6 7
G7 rank 2 3 3 3 3 2 3 3 3 3
Source: Derived from the International Energy Agency publication, Energy Prices and Taxes
Gas
Excluding taxes Including taxes(2)
(1) Prices converted to pounds sterling using annual average exchange rates.(2) Prices include all taxes where not refundable on purchase.(3) Some prices are taken from Eurostat's medium sizeband(4) Prices excluding taxes have been estimated for some years using average tax rates for years where
both including and excluding tax data is available.(5) Prices excluding taxes have been estimated using a weighted average of general sales taxes and fuel
taxes levied by individual states.
.. Data unavailable.- DECC estimates that the price is likely to be below the IEA median.+/- DECC estimates that the price is likely to be around the IEA median.+ DECC estimates that the price is likely to exceed the IEA median.
65

Table 5.8.2 Industrial gas prices in the EU for medium consumers(1)
(Excluding taxes)Pence per kWh(2)
Jan 11 - June 11
July 11 - Dec 11
Jan 12 - June 12
July 12 - Dec 12
Jan 13 - June 13
July 13 - Dec 13
Jan 14 -June 14
Austria 2.80 2.96 2.90 2.80 2.97 2.92 2.79Belgium 2.72 2.75 2.71 2.69 3.28 2.79 2.49Denmark 2.95 2.82 2.93 2.87 2.94 2.80 2.25Finland 2.92 3.29 3.22 3.15 3.25 3.09 2.99France 3.08 3.18 3.11 3.13 3.38 3.19 3.06Germany 3.62 3.97 2.74 2.75 3.72 3.72 3.36Greece .. .. .. 4.18 4.06 3.83 3.58Ireland 3.09 3.14 2.89 3.10 3.31 3.71 3.09Italy 2.57 2.80 3.13 2.98 3.23 2.98 2.83Luxembourg 3.62 4.25 4.14 4.05 4.30 3.77 3.46Netherlands 2.36 2.50 2.36 2.49 2.58 2.60 2.42Portugal 2.93 3.30 3.28 3.35 3.51 3.49 3.44Spain 2.53 2.88 2.97 3.00 3.26 3.15 3.02Sweden 3.66 4.08 3.69 3.57 3.92 3.86 3.37UK 2.02 2.29 2.54 2.58 2.87 2.91 2.90
EU 15 Median(4) 2.92 3.05 2.95 3.00 3.28 3.15 3.02UK relative to:EU 15 Median(%) -30.9 -25.0 -13.7 -13.8 -12.6 -7.5 -4.1EU 15 Rank 1 1 2 2 2 4 6Bulgaria 2.49 2.76 2.97 3.18 3.03 2.97 2.81Croatia 3.51 3.75 3.51 3.69 3.89 3.56 3.37Cyprus .. .. .. .. .. .. ..Czech Republic 2.61 2.89 2.65 2.61 2.76 2.71 2.50Estonia 2.28 2.58 2.91 2.73 3.04 2.84 2.78Hungary 2.58 3.71 3.43 3.55 3.35 3.93 3.16Latvia 2.54 2.74 2.94 3.05 3.04 3.00 2.73Lithuania 3.04 3.73 3.69 3.68 3.75 3.46 3.40Malta .. .. .. .. .. .. ..Poland 2.85 2.76 2.77 2.99 3.08 3.07 3.04Romania 1.32 1.51 1.56 1.55 1.76 1.76 1.75Slovakia 2.88 3.44 3.14 3.19 3.03 3.17 2.93Slovenia 3.50 4.11 4.38 4.05 3.79 3.66 3.15
EU 28 Median(4) 2.85 2.96 2.97 3.07 3.25 3.12 3.01UK relative to:EU 28 Median(%) -29.0 -22.7 -14.3 -16.0 -11.9 -6.7 -3.5EU 28 Rank 2 2 3 3 4 7 11
Source: Eurostat Statistics in Focus
(1) Medium Consumers: consuming 2,778 - 17,777 MWh per annum, forperiods January - June and July - December each year.
(2) Prices converted to sterling using exchange rates in the appropriate period.(3) See paragraph A47 in the Technical notes for an explanation of the estimating
methodology. (4) Median price is based upon the available data, including those cases where DECC have
estimated the position of prices relative to the EU median. (5) Prices include all taxes where not refundable on purchase.(6) There is no tax.
66

Table 5.8.2 Industrial gas prices in the EU for medium consumers(1)
(Including taxes)(5)
Pence per kWh(2)
Jan 11 - June 11
July 11 - Dec 11
Jan 12 - June 12
July 12 - Dec 12
Jan 13 - June 13
July 13 - Dec 13
Jan 14 - June 14
Austria 3.01 3.21 3.57 3.47 3.72 3.63 3.50Belgium 2.85 2.88 2.86 2.77 3.39 2.91 2.58Denmark 3.86 3.73 3.91 3.82 3.87 3.72 3.07Finland 3.62 3.99 3.89 3.80 4.13 3.97 3.84France 3.17 3.28 3.20 3.22 3.47 3.29 3.17Germany 3.97 4.32 3.08 3.07 4.07 4.06 3.69Greece .. .. .. 4.63 4.55 4.31 4.04Ireland 3.32 3.36 3.11 3.39 3.61 4.02 3.39Italy 2.72 3.02 3.46 3.17 3.54 3.19 3.11Luxembourg 3.67 4.31 4.18 4.09 4.33 3.81 3.50Netherlands 2.99 2.98 3.00 2.92 3.42 3.05 3.45Portugal 2.94 3.31 3.29 3.36 3.57 3.56 3.51Spain(6) 2.53 2.88 2.97 3.00 3.31 3.19 3.07Sweden 4.41 4.82 4.42 4.39 4.71 4.63 4.10UK 2.14 2.40 2.66 2.70 2.99 3.03 3.03
EU 15 Median(4) 3.09 3.29 3.25 3.36 3.61 3.63 3.45UK relative to:EU 15 Median(%) -30.8 -27.0 -18.0 -19.5 -17.2 -16.4 -12.2EU 15 Rank 1 1 1 1 1 2 2Bulgaria 2.49 2.76 2.97 3.19 3.05 2.98 2.89Croatia(6) 3.51 3.75 3.51 3.69 3.89 3.60 3.41Cyprus .. .. .. .. .. .. ..Czech Republic 2.72 2.99 2.75 2.70 2.86 2.81 2.59Estonia 2.42 2.68 3.02 2.86 3.20 2.99 2.90Hungary 2.68 3.81 3.60 3.72 3.52 4.05 3.27Latvia 2.54 2.89 3.04 3.18 3.19 3.14 2.87Lithuania(6) 3.04 3.73 3.69 3.68 3.75 3.46 3.40Malta .. .. .. .. .. .. ..Poland 2.85 2.76 2.77 2.99 3.08 3.09 3.09Romania 1.97 2.15 2.15 2.11 2.38 2.44 2.46Slovakia 3.00 3.55 3.24 3.30 3.14 3.28 3.04Slovenia 3.88 4.50 4.75 4.40 4.20 4.07 3.54
EU 28 Median(4) 2.99 3.28 3.20 3.26 3.53 3.38 3.22UK relative to:EU 28 Median(%) -28.4 -26.7 -16.9 -17.2 -15.4 -10.1 -6.1EU 28 Rank 2 2 2 2 3 6 7
Source: Eurostat Statistics in Focus
Missing data estimation+ DECC estimates that the price is likely to exceed the relevant median. +/- DECC estimates that the price is likely to be around the relevant median.- DECC estimates that the price is likely to be below the relevant median.
The relevant median is the EU15 median for EU15 data, and the EU28 median for accession countries.
67
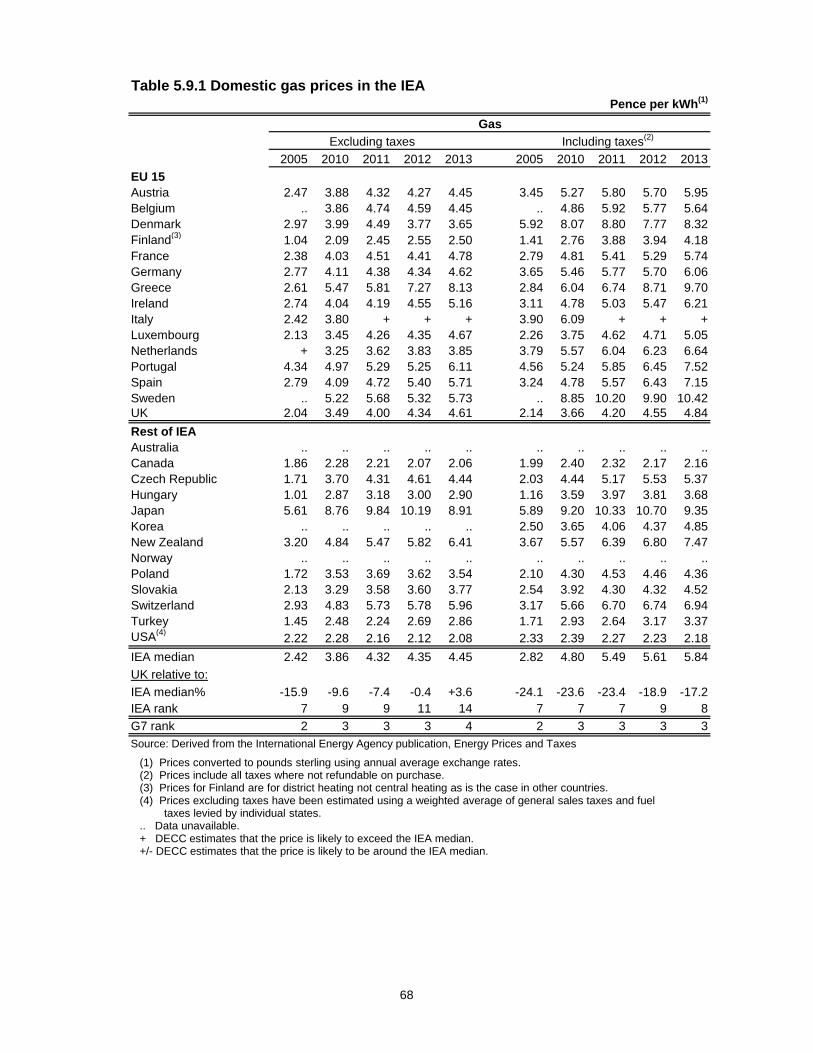
Table 5.9.1 Domestic gas prices in the IEAPence per kWh(1)
2005 2010 2011 2012 2013 2005 2010 2011 2012 2013
EU 15Austria 2.47 3.88 4.32 4.27 4.45 3.45 5.27 5.80 5.70 5.95Belgium .. 3.86 4.74 4.59 4.45 .. 4.86 5.92 5.77 5.64Denmark 2.97 3.99 4.49 3.77 3.65 5.92 8.07 8.80 7.77 8.32Finland(3) 1.04 2.09 2.45 2.55 2.50 1.41 2.76 3.88 3.94 4.18France 2.38 4.03 4.51 4.41 4.78 2.79 4.81 5.41 5.29 5.74Germany 2.77 4.11 4.38 4.34 4.62 3.65 5.46 5.77 5.70 6.06Greece 2.61 5.47 5.81 7.27 8.13 2.84 6.04 6.74 8.71 9.70Ireland 2.74 4.04 4.19 4.55 5.16 3.11 4.78 5.03 5.47 6.21Italy 2.42 3.80 + + + 3.90 6.09 + + +Luxembourg 2.13 3.45 4.26 4.35 4.67 2.26 3.75 4.62 4.71 5.05Netherlands + 3.25 3.62 3.83 3.85 3.79 5.57 6.04 6.23 6.64Portugal 4.34 4.97 5.29 5.25 6.11 4.56 5.24 5.85 6.45 7.52Spain 2.79 4.09 4.72 5.40 5.71 3.24 4.78 5.57 6.43 7.15Sweden .. 5.22 5.68 5.32 5.73 .. 8.85 10.20 9.90 10.42UK 2.04 3.49 4.00 4.34 4.61 2.14 3.66 4.20 4.55 4.84
Rest of IEAAustralia .. .. .. .. .. .. .. .. .. ..Canada 1.86 2.28 2.21 2.07 2.06 1.99 2.40 2.32 2.17 2.16Czech Republic 1.71 3.70 4.31 4.61 4.44 2.03 4.44 5.17 5.53 5.37Hungary 1.01 2.87 3.18 3.00 2.90 1.16 3.59 3.97 3.81 3.68Japan 5.61 8.76 9.84 10.19 8.91 5.89 9.20 10.33 10.70 9.35Korea .. .. .. .. .. 2.50 3.65 4.06 4.37 4.85New Zealand 3.20 4.84 5.47 5.82 6.41 3.67 5.57 6.39 6.80 7.47Norway .. .. .. .. .. .. .. .. .. ..Poland 1.72 3.53 3.69 3.62 3.54 2.10 4.30 4.53 4.46 4.36Slovakia 2.13 3.29 3.58 3.60 3.77 2.54 3.92 4.30 4.32 4.52Switzerland 2.93 4.83 5.73 5.78 5.96 3.17 5.66 6.70 6.74 6.94Turkey 1.45 2.48 2.24 2.69 2.86 1.71 2.93 2.64 3.17 3.37USA(4)
2.22 2.28 2.16 2.12 2.08 2.33 2.39 2.27 2.23 2.18
IEA median 2.42 3.86 4.32 4.35 4.45 2.82 4.80 5.49 5.61 5.84
UK relative to:
IEA median% -15.9 -9.6 -7.4 -0.4 +3.6 -24.1 -23.6 -23.4 -18.9 -17.2IEA rank 7 9 9 11 14 7 7 7 9 8
G7 rank 2 3 3 3 4 2 3 3 3 3
Source: Derived from the International Energy Agency publication, Energy Prices and Taxes
Gas
Excluding taxes Including taxes(2)
(1) Prices converted to pounds sterling using annual average exchange rates.(2) Prices include all taxes where not refundable on purchase.(3) Prices for Finland are for district heating not central heating as is the case in other countries.(4) Prices excluding taxes have been estimated using a weighted average of general sales taxes and fuel
taxes levied by individual states... Data unavailable.+ DECC estimates that the price is likely to exceed the IEA median. +/- DECC estimates that the price is likely to be around the IEA median.
68

Table 5.10.2 Domestic gas prices in the EU for medium consumers(1)
(Excluding taxes)Pence per kWh(2)
Jan 11 - June 11
July 11 - Dec 11
Jan 12 - June 12
July 12 - Dec 12
Jan 13 - June 13
July 13 - Dec 13
Jan 14- June 14
Austria 4.44 4.63 4.62 4.53 4.85 4.74 4.55Belgium 4.40 5.09 4.50 4.67 4.45 4.43 4.21
Denmark(4) 5.15 4.66 4.47 4.15 3.75 3.63 3.01Finland .. .. .. .. .. .. ..France 4.20 4.67 4.35 4.54 4.81 5.14 4.77Germany 3.77 4.15 3.91 3.88 4.22 4.40 4.19Greece .. .. .. 6.74 5.33 6.17 4.79Ireland 3.65 4.48 4.22 4.49 4.63 5.08 4.62Italy 3.83 4.88 4.20 5.16 4.80 5.26 4.37Luxembourg 3.97 4.54 4.25 4.30 4.80 4.30 3.93Netherlands 3.60 4.22 3.82 4.24 4.07 4.29 3.79Portugal 4.92 5.58 4.84 5.49 5.59 6.13 5.86Spain 3.94 3.97 4.61 5.78 4.95 6.05 4.91Sweden 5.73 5.63 5.26 5.36 5.71 5.74 5.35UK 3.51 4.32 4.09 4.40 4.30 4.74 4.69
EU 15 Median(5) 3.97 4.63 4.35 4.54 4.80 4.91 4.58UK relative to:EU 15 Median(%) -11.6 -6.7 -6.0 -3.0 -10.4 -3.4 +2.3EU 15 Rank 1 4 3 5 4 6 9Bulgaria 3.11 3.41 3.39 3.70 3.63 3.66 3.36Croatia 2.65 2.62 2.54 3.02 3.17 3.17 3.05Cyprus .. .. .. .. .. .. ..Czech Republic 3.94 4.30 4.52 4.40 4.51 4.03 3.72Estonia 2.83 2.96 3.23 3.26 3.50 3.17 3.17Hungary 3.89 3.95 3.06 3.19 2.90 2.80 2.36Latvia 3.00 3.09 3.31 3.57 3.41 3.38 3.15Lithuania 3.12 3.87 3.46 4.04 4.24 4.30 3.80Malta .. .. .. .. .. .. ..Poland 3.27 3.53 3.13 3.74 3.25 3.51 3.27Romania 1.29 1.25 1.17 1.17 1.29 1.36 1.31Slovakia 3.37 3.70 3.53 3.43 3.53 3.66 3.47Slovenia 4.45 5.34 5.10 4.51 4.33 4.52 4.09
EU 28 Median(5) 3.80 4.26 4.14 4.30 4.30 4.30 3.93UK relative to:EU 28 Median(%) -7.6 +1.4 -1.3 +2.4 0.0 +10.3 +19.4EU 28 Rank 9 14 12 14 13 17 20
Source: Eurostat Statistics in Focus(1) Medium consumers consuming 5,557 - 55,556 kWh per annum, for periods January - June and
July - December each year.(2) Prices converted to sterling using exchange rates in the appropriate month and year.(3) See paragraph A47 in the Technical notes for an explanation of the estimating methodology.(4) From July 2001 the price is for natural gas rather than gas works gas.(5) Median price is based upon the available data, including those cases where DECC have stimated the position of prices relative to the EU median.(6) Prices include all taxes where not refundable on purchase.
69
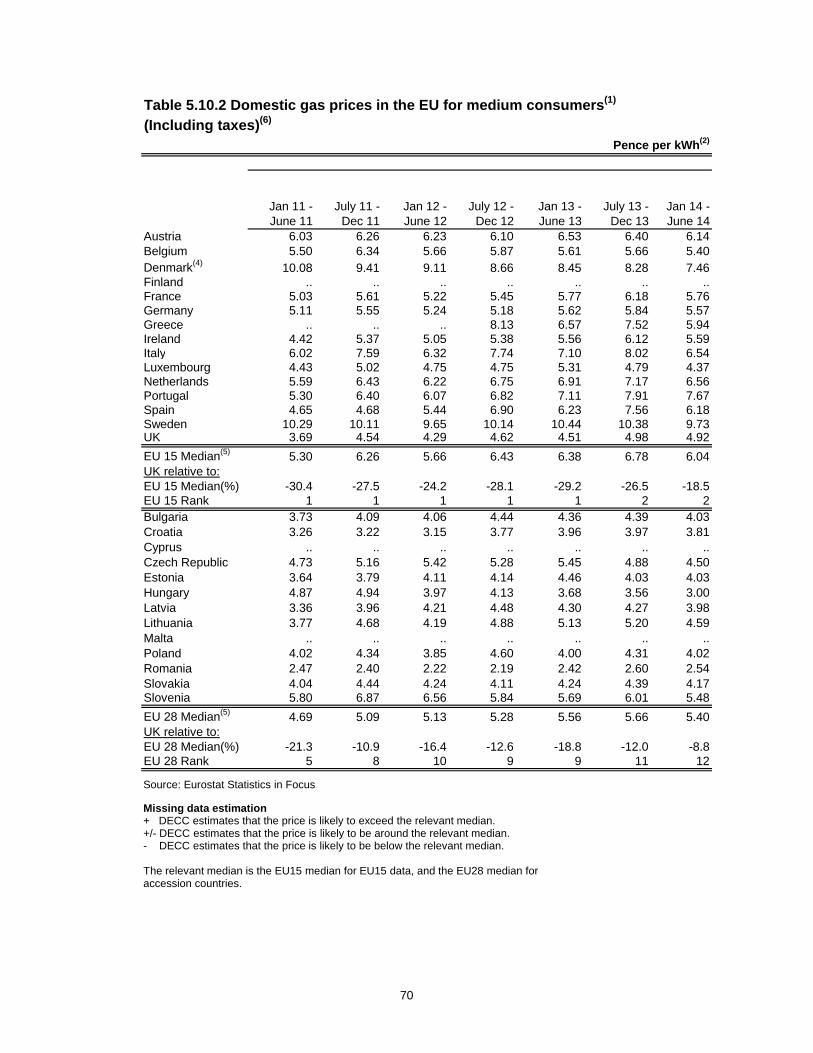
Table 5.10.2 Domestic gas prices in the EU for medium consumers(1)
(Including taxes)(6)
Pence per kWh(2)
Jan 11 - June 11
July 11 - Dec 11
Jan 12 - June 12
July 12 - Dec 12
Jan 13 - June 13
July 13 - Dec 13
Jan 14 - June 14
Austria 6.03 6.26 6.23 6.10 6.53 6.40 6.14Belgium 5.50 6.34 5.66 5.87 5.61 5.66 5.40Denmark(4) 10.08 9.41 9.11 8.66 8.45 8.28 7.46Finland .. .. .. .. .. .. ..France 5.03 5.61 5.22 5.45 5.77 6.18 5.76Germany 5.11 5.55 5.24 5.18 5.62 5.84 5.57Greece .. .. .. 8.13 6.57 7.52 5.94Ireland 4.42 5.37 5.05 5.38 5.56 6.12 5.59Italy 6.02 7.59 6.32 7.74 7.10 8.02 6.54Luxembourg 4.43 5.02 4.75 4.75 5.31 4.79 4.37Netherlands 5.59 6.43 6.22 6.75 6.91 7.17 6.56Portugal 5.30 6.40 6.07 6.82 7.11 7.91 7.67Spain 4.65 4.68 5.44 6.90 6.23 7.56 6.18Sweden 10.29 10.11 9.65 10.14 10.44 10.38 9.73UK 3.69 4.54 4.29 4.62 4.51 4.98 4.92
EU 15 Median(5) 5.30 6.26 5.66 6.43 6.38 6.78 6.04UK relative to:EU 15 Median(%) -30.4 -27.5 -24.2 -28.1 -29.2 -26.5 -18.5EU 15 Rank 1 1 1 1 1 2 2Bulgaria 3.73 4.09 4.06 4.44 4.36 4.39 4.03Croatia 3.26 3.22 3.15 3.77 3.96 3.97 3.81Cyprus .. .. .. .. .. .. ..Czech Republic 4.73 5.16 5.42 5.28 5.45 4.88 4.50Estonia 3.64 3.79 4.11 4.14 4.46 4.03 4.03Hungary 4.87 4.94 3.97 4.13 3.68 3.56 3.00Latvia 3.36 3.96 4.21 4.48 4.30 4.27 3.98Lithuania 3.77 4.68 4.19 4.88 5.13 5.20 4.59Malta .. .. .. .. .. .. ..Poland 4.02 4.34 3.85 4.60 4.00 4.31 4.02Romania 2.47 2.40 2.22 2.19 2.42 2.60 2.54Slovakia 4.04 4.44 4.24 4.11 4.24 4.39 4.17Slovenia 5.80 6.87 6.56 5.84 5.69 6.01 5.48
EU 28 Median(5) 4.69 5.09 5.13 5.28 5.56 5.66 5.40UK relative to:EU 28 Median(%) -21.3 -10.9 -16.4 -12.6 -18.8 -12.0 -8.8EU 28 Rank 5 8 10 9 9 11 12
Source: Eurostat Statistics in Focus
Missing data estimation+ DECC estimates that the price is likely to exceed the relevant median. +/- DECC estimates that the price is likely to be around the relevant median.- DECC estimates that the price is likely to be below the relevant median.
The relevant median is the EU15 median for EU15 data, and the EU28 median for accession countries.
70

Technical Notes
December 2014 71
Annex A – Technical Notes
Tables 2.1.1 to 2.1.3 A1. The source of the prices in these tables is the Consumer Prices Index (CPI), published by the Office for National Statistics (ONS). The fuel components within the CPI are published, together with the all items CPI. Table A1 below gives the weights within the total index, in parts per 1,000, of the fuel components. The CPI is calculated using prices collected on the second or third Tuesday of each month. A2. Quarterly data is published three months in arrears. Any revised data is marked with an “r”. Annual data is published in the March edition of QEP. Revisions to the real terms series in Table 2.1.2 occur when the GDP deflator is updated.
Table A1:Consumer price index, fuel component weights All
items Domestic
fuels Solid fuels
Gas
Electricity
Liquid fuels
Motor fuels and oil
1996 1,000 45 2 20 22 1 402000 1,000 33 1 13 17 2 382005 1,000 28 1 12 14 1 272006 1,000 32 1 14 15 2 352007 1,000 39 1 18 19 1 362008 1,000 35 1 15 17 2 382009 1,000 46 1 23 20 2 342010 1,000 47 1 25 19 2 412011 1,000 44 1 22 19 2 432012 1,000 56 1 32 20 3 462013 1,000 48 1 26 19 2 402014 1,000 45 1 21 21 2 35
The following notes apply to Table 2.1.1: A3. Solid fuels - Retail prices of one standard grade of household coal and of the boiler/room heater grade of smokeless fuel sold by the retailer, obtained from local retailers in up to 146 areas throughout the United Kingdom. A4. Gas – average of the major gas companies’ tariffs, plus butane gas. A5 Electricity – average of the major electricity companies’ tariffs. A6. Liquid fuels - This comprises domestic kerosene heating oil. Prices of heating oil are provided by retailers in up to 146 areas throughout the United Kingdom. A7. Motor fuel and oil - Ultra-low sulphur petrol (ULSP), ultra-low sulphur diesel (ULSD) and motor oil. Retail prices of the different grades of motor spirit and engine oil are obtained weekly from oil companies and supermarkets throughout the United Kingdom, with the weekly data averaged to produce a monthly figure. Tables 2.2.1 to 2.5.2 A8. Tables 2.2.3 and 2.3.3 show representative electricity and gas bills by payment type in each of the 15 Public Electricity Supply (PES) regions in the UK. The unit cost represents the total cost to the consumer per unit consumed and is calculated by dividing the bill shown by the number of units consumed (3,800 kWh for electricity, 15,000 kWh for gas). Data on regional electricity and gas bills from 2013 onwards are shown based on PES regions as opposed to selected towns and

Technical Notes
December 2014 72
cities within the PES regions and gas Local Distribution Zones (LDZ). This change has been made because most energy suppliers now charge for gas according to the PES area that a household is in. It is not possible to present historical data on gas bills in this way, as the data from previous years was not collected in this format. Table A2 maps the selected towns and cities to the PES region and LDZ that they are within.
Table A2: Towns and cities by LDZ and PES area Gas LDZ Electricity PES area Aberdeen Scotland Northern Scotland Belfast n/a Northern IrelandBirmingham West Midlands West Midlands Canterbury South East South East Cardiff Wales South Wales Edinburgh Scotland Southern Scotland Ipswich Eastern Eastern Leeds North East Yorkshire Liverpool North West Merseyside & North Wales London London London Manchester North West North West Newcastle Northern North East Nottingham East Midlands East MidlandsPlymouth South West South West Southampton Southern Southern
A9. Provisional annual data is published in the December edition of QEP, with final data being published in March. A10. Bills and unit costs are based on published prices and include standing charges where applicable. No allowances are made for introductory offers or non-cash benefits that may be available from new suppliers. Both electricity and gas bills and costs reflect the prices of all suppliers. This basis is used for all the domestic bills and cost data used in Tables 2.2.1 to 2.3.3. The bills shown relate to the total bill including VAT in cash terms received during the calendar year, for the tariff type shown, including all tariff changes and rebates. Averages are weighted by the number of domestic customers. For electricity, an annual consumption of 3,800 kWh is used whilst the equivalent figure for gas is 15,000 kWh. A11. The weighted average of all supplier gas bills are based on equivalent tariffs of British Gas and other gas supply companies. From 2007 onwards, due to a methodology change, the estimates are based on bills received during the calendar year. As part of the methodology change, it is now assumed that, of the 15,000 kWh of gas consumed per annum (see A8), 6,000 kWh are consumed in the first quarter, 3,000 kWh in Q2, 1,500 kWh in Q3 and 4,500 kWh in Q4. A12. From June 2013, data on the number of gas customers are shown based on Public Electricity Supply (PES) regions. In previous quarters, this data has been presented by Local Distribution Zones (LDZs). This change has been made because most energy suppliers now charge for gas according to the PES area that a household is in, and so it is more appropriate to present data in this format. Gas bills are also published on a PES area basis from December 2013 onwards. It is not possible to present historical data on gas bills and customer numbers in this way, as the data from previous years was not collected in this format. A13. Internet tables 2.4.2, 2.4.3 and 2.5.2 show data for ‘Economy 7’ tariffs, where a lower unit cost is applied to off-peak (night) consumption. For the total consumption of 6,000 kWh, off-peak consumption has been taken as 3,000 kWh. A14. Internet tables 2.2.4 and 2.3.4 are experimental statistics, used together with modelled energy consumption in the calculation of household notional energy bills for use in the modelling of the level of fuel poverty in England. These data are not suitable for calculating the average bills of

Technical Notes
December 2014 73
low use consumers. The data reported is an average of the fixed and variable costs across the four quarters in the year. In the calculation, more weight is given to costs in Q1 and Q4, when it is assumed that more electricity and gas is consumed (and hence the price at this time should contribute more to the average). Therefore, these values should not be used to determine current average bills. For more information see the Fuel Poverty Methodology Handbook on the DECC website: https://www.gov.uk/government/publications/fuel-poverty-methodology-handbook Table 2.6.1 A15. Household final consumption expenditure comprises household expenditure in the United Kingdom on the fuels specified and fuel purchases by foreign tourists. It excludes expenditure on fuels by businesses. VAT was levied on domestic fuels at 8 per cent in April 1994, reduced to 5 per cent in September 1997, and is included in the table from 1994 onwards. For coal, coke and petroleum products it was assumed that all consumers paid VAT from the date of its introduction. For electricity and gas an estimate was made that 5 per cent of electricity sales and 4 per cent of gas sales were covered by customers pre-paying their bills to avoid VAT in 1994 and 1995. Figures for total consumers’ expenditure are also shown for comparison. Due to the reclassification of Household Expenditure to conform to the European Systems of Accounts 1995 (ESA 95), COICOP (Classification of Individual Consumption by Purpose) headings have been rearranged. The following notes apply to Table 2.6.1: A16. Solid Fuels – Household final consumption expenditure on these fuels is based on estimates of inland sales of solid fuels to domestic consumers. Expenditure in Northern Ireland is estimated based on values of colliery despatches of house coal to Northern Ireland. A17. Gas - Personal consumption in the United Kingdom is taken as sales to domestic premises. Estimates of the quantity and value of liquid gases purchased by domestic consumers are provided by the petroleum industry. The average price used is the average revenue per kWh for public supply sales of gas to domestic consumers. A18. Electricity - Sales from the public electricity supply system to domestic consumers in the United Kingdom plus estimates of the domestic element included in sales to dual use premises. Sales are valued at the average revenue per unit for electricity sold to domestic consumers, which takes into account discounts and lump sum rebates. A19. Liquid fuels (domestic heating and lighting oil) - For fuel oils and heating oils, information is available from the petroleum industry on quantities delivered to domestic consumers. The figures for domestic consumption are then valued using monthly prices collected by the department from oil companies. A20. Vehicle fuels and lubricants (petrol, diesel, LPG, oil and lubricants, brake and other fluids, coolants) – Estimates of the quantity and value of lubricating oil purchased by domestic customers are provided by the petroleum industry. For motor spirit and diesel, estimates of business purchases of the fuels are made and deducted from total deliveries to arrive at purchases by domestic consumers. The figures for domestic consumption are then valued using monthly prices collected by the department from oil companies. Table 2.6.2 A21. Figures for Internet Table 2.6.2 are taken from the Expenditure and Food Survey (EFS) conducted by the ONS. The figures are estimates based upon a representative sample of households. The averages in the table have been calculated on the basis of consuming

Technical Notes
December 2014 74
households, i.e. only those households who consumed the particular fuel in question are included in the calculation of the average expenditure. These estimates therefore differ from those published by the ONS in the report, "Family Spending", where the total of all households is used to calculate average fuel expenditure. After the publication of data for 1993 the survey moved to a financial year basis until 2005/06, then returned to a calendar year basis from 2006. The data presented on expenditure on fuel as a proportion of total expenditure in table 2.6.2 are based on all households, not just those consuming the fuel or other commodity, for ease of comparison. Tables 3.1.1 to 3.1.4 A22. Prices are derived from information collected via the Quarterly Fuels Inquiry on fuel purchases from a panel of about 600 establishments within manufacturing industry (which excludes electricity generation). The panel consists of companies purchasing fuels in small and large quantities. To maximise the coverage of each fuel type and minimise the burden on business, larger users are surveyed proportionally more than smaller users.
A23. Provisional quarterly data is published three months in arrears, with final data being published six months in arrears. Any revised data is marked with an “r”. Provisional annual data is published in the March edition of QEP, with final annual data published in June. The entire year’s quarterly data is reviewed in June to ensure that each of the contributors who supply data have been placed in the correct size band based upon their actual annual consumption. This means that there can be revisions made to data from Q1 to Q4.
A24. For each size of consumer the average price for a fuel (exclusive of VAT) is calculated by dividing the total quantity of purchases into their total value. The "all consumers-average" price uses base weighting and weights the prices for each size band according to purchases by businesses in the size band recorded in the 1984 Purchases Inquiry (a large scale survey conducted every 5 years until 1989, and conducted annually for a rotating selection of industries from 1994 to 1999.) The weights will be reviewed when comprehensive up-to-date purchases data are available. The size bands are defined, for each fuel individually, according to the approximate range of annual purchases covered. (See Table A3). A25. As described above the prices given are representative market prices. This means trades that, because of their size or dominance of total consumption would produce an unrepresentative price, are excluded. Coal purchased by the iron and steel sector is excluded, as is gas purchased for electricity generation. A26. For some fuels, the relative size in volume terms of the largest users can have the effect of moving the weighted average more towards the large user price. This is true for gas where, because of the growth in consumption, the weights provided by the 1984 purchases survey may be out of date. Therefore, for some fuels (e.g. gas and gas oil), the median price (the price at which 50 per cent of the prices paid are higher and 50 per cent lower) may be another useful guide to average prices. A27. From Q1 2010, for coal only average prices and prices for large consumers are available due to the small number of companies reporting data. Data for medium fuel oil, liquefied petroleum gases and hard coke were discontinued from Q1 2005, and there was no sub-division into size bands due to the small number of sites purchasing each of these fuels. The small sample sizes reflect the small overall consumption, relative to the major fuels covered, which meant that, although the prices were still representative, they could be subject to more sample effects than the other fuels (e.g. if a relatively large purchaser switches fuel). A28. To enable coal prices to be calculated in common units, companies record the calorific value of the coal they purchase. Conversion factors for fuel oil (both heavy and medium), gas oil, liquefied petroleum gas and hard coke are given in Annex B.

Technical Notes
December 2014 75
A29. The 10 per cent and 90 per cent deciles and the median price are presented in addition to the prices for each size band. The 10 per cent decile is the point within the complete range of prices below which the lowest 10 per cent of those prices fall. Similarly, the 90 per cent decile is the point above which the highest 10 per cent of the prices occur. These values give some indication of the spread of prices paid by purchasers. The deciles and the median are calculated by giving equal "weight" to each purchaser, but are scaled to represent the mix of fuel users by size in the industrial population that the panel represents. From Q1 2007, decile information is only published for gas and electricity.
Table A3: Range of annual purchases for the Quarterly Fuels Inquiry
Large Of which: Medium Small
Extra large Moderately large
Fuel Greater than Greater than Less than
Coal (tonnes) 7,600 .. .. 760 to 7,600 760
Heavy fuel oil (tonnes) 4,900 .. .. 490 to 4,900 490
Gas oil (tonnes) 175 .. .. 35 to 175 35
Electricity (thousand kWh) 8,800 150,000 8,800 to 150,000 880 to 8,800 880
Gas(1) (thousand kWh) 8,800 .. .. 1,500 to 8,800 1,500
(1) Respondents purchasing more than one type of supply (firm contract and interruptible contract) are treated as separate entities in respect of each type of supply. Table 3.2.1 A30. The prices for fuels used in electricity generation are collected via a quarterly inquiry of electricity generators in the United Kingdom. This covers companies that produce electricity from nuclear sources plus all companies whose prime purpose is the generation of electricity. The companies are: AES Electric Ltd., Barking Power Ltd., Centrica plc., Coryton Energy Company Ltd., Eggborough Power Ltd., E.On UK plc., Fellside Heat and Power Ltd., Fibrogen Ltd., Fibropower Ltd., Fibrothetford Ltd., GDF Suez, International Power, Premier Power Ltd., Rocksavage Power Company Ltd., RWE Npower plc., Scottish Power plc., Scottish and Southern Energy plc., SELCHP Ltd., Spalding Energy Company Ltd. A31. The data reported are the value and volume of fuel purchased during the quarter and may not always reflect the fuel actually used (i.e. there can be stocking and destocking, especially of coal). The prices reported are typically for long-term contracts, with price escalator factors, some of which may have been entered into some time ago. As such, the prices can be higher than those paid by large industrial users who typically negotiate contracts each year. A32. Provisional quarterly data is published three months in arrears, with final data being published six months in arrears. Any revised data is marked with an “r”. Provisional annual data is published in the March edition of QEP, with final data being published in June. A33. The gas beach price series is derived from gas sales by licensees in the UKCS to delivery points in the UK. It excludes exported gas and is adjusted to include imported gas. It is calculated as follows:
Value of (UKCS gas sales + gas imports - gas exports) Volume of (UKCS gas sales + gas imports - gas exports)
where the UKCS sales value and volume data are derived from DECC’s statistical inquiry into oil and gas extraction (PQ1100). Returns from the inquiry give the value and volume of gas sold by each licensee from a particular field (or group of fields). Data from the inquiry on sales and expenditure by licensees are covered and further explained in Annex G of the internet version of

Technical Notes
December 2014 76
the Digest of UK Energy Statistics. Trade data are supplied by Revenue and Customs and published in the internet version of the Digest in Annex G, Chart G1.0. A34. The gas levy applied to gas purchased under certain contracts originally entered into before July 1975. The cost of gas under these pre-July 1975 contracts had historically been substantially less than the prevailing market price. Gas sold under these contracts was not subject to Petroleum Revenue Tax (PRT) because the contracts were classified as "tax-exempt" when PRT was introduced in 1975. Instead, under the Gas Levy Act 1981, the purchaser of gas subject to the relevant contracts had to pay a levy on every therm of such gas that they purchased. The purpose of the gas levy was to capture for the Exchequer the bulk of the economic rent which would otherwise accrue to the purchaser from purchasing this gas at below market prices. However, current and expected future gas market prices are now below the average cost of this gas (even before adding the cost of the levy). The gas levy was abolished from 1 April 1998. Tables 3.3.1 and 3.3.2 A35. Provisional quarterly data is published three months in arrears, with final data being published six months in arrears. Any revised data is marked with an “r”. Provisional annual data is published in March, with final data being published in June. The entire year’s quarterly data for coal and HFO is reviewed in June to ensure that each of the contributors who supply data to the Quarterly Fuels Inquiry have been placed in the correct size band based upon their actual annual consumption. This means that there can be revisions made to data from Q1 to Q4. A36. The Climate Change Levy (CCL) came into effect in April 2001. The rates increased in April 2007, 2008, 2009, and then annually in April of each successive year since 2011. The rates are shown in the table below:
Coal Electricity Gas LPGApr-2001 £11.70/tonne 0.430p/kWh 0.150p/kWh £9.60/tonne Apr-2007 £12.01/tonne 0.441p/kWh 0.154p/kWh £9.85/tonne Apr-2008 £12.42/tonne 0.456 p/kWh 0.159 p/kWh £10.18/tonneApr-2009 £12.81/tonne 0.470 p/kWh 0.164 p/kWh £10.50/tonneApr-2011 £13.21/tonne 0.485 p/kWh 0.169 p/kWh £10.83/tonneApr-2012 £13.87/tonne 0.509 p/kWh 0.177 p/kWh £11.37/tonneApr-2013 £14.29/tonne 0.524 p/kWh 0.182 p/kWh £11.72/tonneApr-2014 £14.76/tonne 0.541 p/kWh 0.188 p/kWh £12.10/tonne
Tables 3.4.1 and 3.4.2 A37. The prices for gas and electricity consumed by non-domestic users in the United Kingdom are collected via a quarterly inquiry of gas and electricity suppliers. The data reported are the value and volume of energy sold during the quarter, for each of the sizebands below:
Table A4: Range of annual purchases for the Price Transparency survey Annual consumption Annual consumption MWh MWh Electricity Very Small 0 - 20 Gas Very Small <278 Small 20 - 499 Small 278 – 2,777 Small/Medium 500 - 1,999 Medium 2,778 – 27,777 Medium 2,000 - 19,999 Large 27,778 – 277,777 Large 20,000 - 69,999 Very Large 277,778 – 1,111,112 Very Large 70,000 – 150,000 Extra Large >150,000

Technical Notes
December 2014 77
Tables 4.1.1 to 4.1.3 A38. The data published are national average prices calculated from prices supplied by all major motor fuel marketing companies. Prior to 1977, price data were collated from a variety of sources, mainly the published wholesale prices of the oil companies to which retailers margins were added. The results of various consumers’ surveys were also taken into consideration in arriving at a typical price. From January 1995 sales by super/hyper markets are included in the price estimates. A39. Crude oil prices are shown in Table 4.1.1 as an index based on a “basket” of both indigenous and imported crude oil prices that are used as an input, along with other fuel prices, for the Producer Prices Index (produced by ONS). The index represents the average price paid by refineries for the month and is calculated in sterling on a cif basis. A40. Provisional monthly prices are usually revised in the month following their original publication, with revisions being marked with an “r”. Provisional annual prices are published in December, with revisions being made during the following two months as data becomes available. Tables 5.1.1 to 5.10.3 A41. International comparisons are based on data published by international organisations. Motor fuel prices are taken from the European Commission’s ‘Oil Bulletin’. A42. Annual electricity and gas prices in Tables 5.3.1, 5.5.1, 5.7.1 and 5.9.1 are collated and published by the International Energy Agency (IEA) in ‘Energy Prices and Taxes’. Methodology can vary between countries. From December 2013, prices for all IEA countries are shown, rather than EU and G7 countries as previously published. A43. The data presented in Sections 5.4, 5.6, 5.8 and 5.10 are derived from Eurostat’s Statistics in Focus series. Eurostat publishes data on gas and electricity prices six months after the end of the reference period. A44. From 1st January 2008, data shows average prices over 6-month periods (January - June and July – December). The sizebands for consumers from January 2008 onwards are as follows:
Industrial Electricity Eurostat size band Annual consumption (MWh)Small Band IB 20 - 499
Medium Band ID 2,000 - 19,999
Large Band IE 20,000 - 69,999
Very Large Band IF 70,000 – 150,000
Industrial Gas Eurostat size band Annual consumption (MWh)Small Band I2 278 – 2,777
Medium Band I3 2,778 – 27,777
Large Band I4 27,778 – 277,777
Domestic Electricity Eurostat size band Annual consumption (kWh)Small Band DB 1,000 – 2,499
Medium Band DC 2,500 – 4,999
Large Band DD 5,000 – 15,000
Domestic Gas Eurostat size band Annual consumption (kWh) Small Band D1 < 5,557
Medium Band D2 5,557 – 55,557
Large Band D3 >55,557

Technical Notes
December 2014 78
A45. Prior to 2008, the Price Transparency data was for a single point in time (1st January and 1st July), and each size band was represented by a single consumption figure. Eurostat’s change to the methodology in 2008 created a discontinuity within the price series. We publish the new methodology prices within the original tables, with a clear distinction between old and new data. Whilst prices using the old and new methodologies will not be comparable, the UK ranking and UK price relative to the EU median should be broadly comparable across the old and new data. A46. It is important when comparing international prices to keep in mind the impact of exchange rates (as the data are presented in a common pound sterling basis, the changing level of the pound will cause some changes in relative prices) and inflation rates in individual countries. The relative strength of the pound in 1997, 1998 and 1999 (e.g. sterling appreciated by 21 per cent against the German Mark between 1996 and 1999) to some extent will have had an adverse effect on comparisons of UK data. The pound depreciated against the euro by 6 per cent between the second half of 2012 and the same period in 2013. A47. For tables 5.3.1 to 5.10.3, where data is not available, we have estimated the price in relation to the median for that table. A ‘+’ indicates that the price is likely to exceed the median and is given a high price, ‘+/-‘ indicates that the price is likely to be around the median, ‘-‘ indicates that the price is likely to be below the median price and is given a low price. This methodology is intended to give a better indication of the UK position when compared with those countries where up-to-date data is not available.

Calorific values and conversion factors
December 2014 79
Annex B – Calorific values and conversion factors
B1: Estimated average gross calorific values of fuels 2013
GJ per tonne GJ per tonne Moisture content
Coal: Renewable sources: All consumers (weighted average)(1) 27.0 Domestic wood (3) 14.9 20.0% Power stations (2) 25.2 Industrial wood (4) 18.6 0.0% Coke ovens (1) 31.8 Straw 15.8 15.0% Low temperature carbonisation plants and manufactured fuel
28.5 Poultry litter (5)
Meat and bone 9.1 20.0
16.0% 16.0%
plants General industrial waste 16.0 5.0% Collieries 29.0 Hospital waste 14.0 5.0% Agriculture 29.5 Municipal solid waste (6) 9.5 30.0% Iron and steel 30.4 Refuse derived waste (6) 18.5 30.0%
Other industries (weighted average)
26.8 Short rotation coppice (7)
Tyres 13.0 32.0
16.0% 5.0%
Non-ferrous metals 25.1 Wood pellets 16.7 10.0% Food, beverages and tobacco 29.4 Biodiesel 38.7 4.0% Chemicals 26.5 Bioethanol 29.7 10.0% Textiles, clothing, leather etc. 29.5 Petroleum: Pulp, paper, printing etc. 24.2 Crude oil (weighted average) 45.7 Mineral products 27.8 Petroleum products 46.4 Engineering (mechanical and 29.5 (weighted average) electrical engineering and Ethane 50.7 vehicles) Butane and propane (LPG) 49.3 Other industries 32.6 Light distillate feedstock for gasworks 47.8 Domestic
Aviation spirit and wide cut gasoline Aviation turbine fuel
47.4
46.2
House coal 30.2 Motor spirit 47.1 Anthracite and dry steam coal 34.3 Burning oil 46.2 Other consumers 26.3 Gas/diesel oil 45.3Imported coal (weighted average) 27.4 DERV 45.7 Exports (weighted average) 32.3 Fuel oil 43.3 Coke (including low temperature 29.8 Power station oil 43.3carbonisation cokes) Non-fuel products (notional value) 43.1 Coke breeze 29.8 Other manufactured solid fuel 29.8 MJ per m3
Natural gas produced (8) Natural gas consumed (9)
39.7 39.3
Coke oven gas Blast furnace gas
18.0 3.0
Landfill gas (10) 21 – 25 Sewage gas (10) 21 – 25 (1) Applicable to UK consumption - based on calorific value for home produced coal plus imports and, for “All consumers” net of exports. (2) Home produced coal only (3) On an ‘as received’ basis; seasoned logs at 20% moisture content. On a ‘dry’ basis 18.6 GJ per tonne. (4) Data reported on an oven-dry basis 18.6 GJ per tonne. (5)The calorific value of poultry litter typically ranges on a net basis from 5 GJ/tone to 10 GJ/tonne depending upon the moisture content of the fuel. For poultry manure, much lower calorific values should be used. (6) Average figure based on survey returns. (7) On an “as received” basis; at 30% moisture content. On a “dry” basis 18.6 GJ per tonne. (8) The gross calorific value of natural gas can also be expressed as 11.024 kWh per cubic metre. This value represents the average
calorific value seen for gas when extracted. At this point it contains not just methane, but also some other hydrocarbon gases (ethane, butane, propane). These gases are removed before the gas enters the National Transmission System for sale to final consumers.
(9) UK produced and imported gas. This weighted average of calorific values will approximate the average for the year of entering the National Transmission System and what readers will see quoted on their gas bills. It can also be expressed as 10.913 kWh per cubic metre.
(10) Calorific value varies depending on the methane content of the gas. Note: The above estimated average gross calorific values apply only to the year 2013. For calorific values of fuels in earlier years see Table B2. The calorific values for coal other than imported coal are based on estimates provided by the main coal producers. The calorific values for petroleum products have been calculated using the method described in Chapter 1, paragraph 1.31 of the Digest of UK Energy Statistics (DUKES).

Calorific values and conversion factors
December 2014 80
B2: Estimated average gross calorific values of fuels 1980, 1990, 2000 and 2010 to 2013 GJ per tonne (gross)
1980 1990 2000 2010 2011 2012 2013 Coal All consumers (1)(2) 25.6 25.5 26.2 25.8 25.9 26.0 26.0All consumers - home produced plus imports minus exports (1)
.. .. 27.0 27.1 26.9 26.9 27.0Power stations (2)
)23.8 24.8 25.6 24.9 25.2 25.3 25.2
Power stations - home produced plus imports (1).. .. 26.0 25.8 26.0 26.2 26.3
Coke ovens (2) 30.5 30.2 31.2 30.5 32.0 31.8 31.8Coke ovens - home produced plus imports (1)
.. .. 30.4 30.5 32.0 31.8 31.8Low temperature carbonisation plants and manufactured fuel plants 19.1 29.2 30.3 30.2 28.4 28.4 28.5Collieries 27.0 28.6 29.6 29.3 29.0 29.0 29.0Agriculture 30.1 28.9 29.2 28.0 29.5 29.5 29.5Iron and steel industry (3) 29.1 28.9 30.7 30.4 30.4 30.4 30.4Other industries (1) 27.1 27.8 26.7 27.7 26.8 26.8 26.8
Non-ferrous metals .. 23.1 25.1 25.4 25.1 25.1 25.1Food, beverages and tobacco 28.6 28.1 29.5 28.6 29.5 29.4 29.4Chemicals 25.8 27.3 28.7 26.7 26.7 26.6 26.5Textiles, clothing, leather & footwear 27.5 27.7 30.4 29.5 29.5 29.5 29.5Pulp, paper, printing, etc. 26.5 27.9 28.7 24.1 24.2 24.2 24.2Mineral products (4) .. 28.2 27.0 27.6 27.6 27.7 27.8Engineering (5) 27.7 28.3 29.3 29.5 29.5 29.5 29.5Other industry (6) 28.4 28.5 30.2 32.6 32.6 32.5 32.6
Domestic House coal 30.1 30.2 30.9 29.8 30.2 30.2 30.2Anthracite and dry steam coal 33.3 33.6 33.5 34.7 34.6 34.5 34.3
Other consumers 27.5 27.5 29.2 25.5 26.4 26.3 26.3Transport –Rail .. .. .. 30.3 30.3 30.2 30.2Imported coal (1) .. 28.3 28.0 27.9 27.5 27.4 27.4of which Steam coal .. .. 26.6 25.8 26.5 26.5 26.5 Coking coal . .. 30.4 30.5 32.0 31.8 31.8 Anthracite .. .. 31.2 31.0 31.2 31.7 31.7Exports (1) .. 29.0 32.0 32.3 32.3 32.4 32.3of which Steam coal .. .. 31.0 31.2 31.2 31.2 31.2 Anthracite .. .. 32.6 33.2 32.7 32.7 32.6Coke (7) 28.1 28.1 29.8 29.8 29.8 29.8 29.8Coke breeze 24.4 24.8 24.8 29.8 29.8 29.8 29.8Other manufactured solid fuels (1) 27.6 27.6 30.8 29.8 29.8 29.8 29.8Petroleum
Crude oil (1) 45.2 45.6 45.7 45.7 45.7 45.7 45.7Liquefied petroleum gas 49.6 49.3 49.1 49.2 49.3 49.3 49.3Ethane 52.3 50.6 50.7 50.7 50.7 50.7 50.7LDF for gasworks/Naphtha 47.8 47.9 47.6 47.8 47.7 47.8 47.8Aviation spirit and wide-cut gasoline (AVGAS & AVTAG) 47.2 47.3 47.3 47.4 47.4 47.4 47.4Aviation turbine fuel (AVTUR) 46.4 46.2 46.2 46.2 46.2 46.2 46.2Motor spirit 47.0 47.0 47.0 47.1 47.1 47.1 47.1Burning oil 46.5 46.2 46.2 46.2 46.2 46.2 46.2Vaporising oil 45.9 45.9 .. .. .. .. ..Gas/diesel oil(9) 45.5 45.4 45.6 45.3 45.3 45.3 45.3Derv (9)
).. .. .. 45.6 45.7 45.7 45.7
Fuel oil 42.8 43.2 43.1 43.3 43.3 43.3 43.3Power station oil 42.8 43.2 43.1 43.3 43.3 43.3 43.3Non-fuel products (notional value) 42.2 43.2 43.8 43.1 43.1 43.1 43.1Petroleum coke (Power stations) .. .. .. 30.9 30.3 31.1 30.1Petroleum coke (Other) .. 39.5 35.8 35.8 35.8 35.8 35.8
Natural Gas(8) .. 38.4 39.4 40.1 39.8 39.6 39.7(1) Weighted averages. (2) Home produced coal only. (3) From 2001 onwards almost entirely sourced from imports. (4) Based on information provided by the British Cement Industry Association; almost all coal used by this sector in the latest 4 years was imported. (5) Mechanical engineering and metal products, electrical and instrument engineering and vehicle manufacture. (6) Includes construction. (7) Since 1995 the source of these figures has been the ISSB. (8) Natural gas figures are shown in MJ per cubic metre. (9) DERV included within gas/diesel oil until 2005

Calorific values and conversion factors
December 2014 81
B3: Standard conversion factors
1 tonne of oil equivalent (toe) = 107 kilocalories = 396.83 therms = 41.868 GJ = 11,630 kWh 1 therm = 100,000 British thermal units (Btu) The following prefixes are used for multiples of joules, watts and watt hours: kilo (k) = 1,000 or 103 mega (M) = 1,000,000 or 106 giga (G) = 1,000,000,000 or 109
tera (T) = 1,000,000,000,000 or 1012 peta (P) = 1,000,000,000,000,000 or 1015 WEIGHT VOLUME 1 kilogramme (kg) = 2.2046 pounds (lb) 1 cubic metre (cu m)
= 35.31 cu ft
1 pound (lb) = 0.4536 kg 1 cubic foot (cu ft) = 0.02832 cu m 1 litre = 0.22 Imperial gallons 1 tonne (t) = 1,000 kg = 0.9842 long ton 1 UK gallon = 8 UK pints = 1.102 short ton = 1.201 U.S. gallons = 4.54609 litres 1 Statute or long ton = 2,240 lb = 1.016 t = 1.120 sh tn 1 barrel = 159.0 litres = 34.97 UK gal = 42 US gal LENGTH 1 mile = 1.6093 kilometres 1 kilometre (km) = 0.62137 miles TEMPERATURE 1 scale degree Celsius (C) = 1.8 scale degrees Fahrenheit (F) For conversion of temperatures: °C = 5/9 (°F - 32); °F = 9/5 °C + 32

Calorific values and conversion factors
December 2014 82
B4: Average conversion factors for petroleum
Litres per tonne
Crude oil: Indigenous 1,199
Imported 1,181 Average of refining throughput 1,192
Ethane 2,730 Propane 1,961 Butane 1,734 Naphtha (l.d.f.) 1,472 Aviation gasoline 1,406 Motor spirit: All grades 1,368 Super unleaded 1,359 Ultra low sulphur petrol (ULSP) 1,369
Middle distillate feedstock 1,093
Kerosene: Aviation turbine fuel 1,253 Burning oil 1,250
DERV fuel: 0.005% or less sulphur (ULSD) 1,192
Gas/marine diesel oil 1,172 Fuel oil (1% or less sulphur): All grades 1,014 Light .. Medium .. Heavy .. Lubricating oils White 1,143 Greases* .. Bitumen 987 Petroleum coke .. Petroleum waxes 1,184 Industrial spirit 1,247 White spirit 1,282 Note: The above conversion factors, which for refined products have been compiled by DECC using data from UK Petroleum Industry Association companies, apply to the year 2013. The litres to tonnes conversions are made at a standard temperature of 150C. .. Denotes commercially sensitive as too few companies are producing this to be able to report it.

Effective rates of duty
December 2014 83
Annex C - Effective rates of duty on principal hydrocarbon oils, 1979 to 2014(1)
Pence per litre
Date from which duty effective
Motor spirit(2)(3)
Diesel(2)
Leaded
Lead replacement
Unleaded Super
unleaded
Ultra low sulphur
Regular Ultra low sulphur
13 June 1979 8.100 .. .. .. .. 9.200 ..26 March 1980 10.000 .. .. .. .. 10.000 ..
10 March 1981 13.820 .. .. .. .. 13.820 ..
2 July 1981 .. .. .. .. 11.910 ..
9 March 1982 15.540 .. .. .. .. 13.250 ..
15 March 1983 16.300 .. .. .. .. 13.820 ..
13 March 1984 17.160 .. .. .. .. 14.480 ..
19 March 1985 17.940 .. .. .. .. 15.150 ..
19 March 1986 19.380 .. .. .. .. 16.390 ..
17 March 1987 .. 18.420 .. .. ..
15 March 1988 20.440 .. .. .. 17.290 ..
14 March 1989 .. 17.720 .. .. ..
20 March 1990 22.480 .. 19.490 .. .. 19.020 ..
19 March 1991 25.850 .. 22.410 .. .. 21.870 ..
10 March 1992 27.790 .. 23.420 .. .. 22.850 ..
16 March 1993 30.580 .. 25.760 .. .. 25.140 ..
30 November 1993 33.140 .. 28.320 .. .. 27.700 ..
29 November 1994 35.260 .. 30.440 .. .. 30.440 ..
1 January 1995 36.140 .. 31.320 .. .. 31.320 ..
28 November 1995 39.120 .. 34.300 .. .. 34.300 ..
15 May 1996 .. 37.620 .. ..
26 November 1996 41.680 .. 36.860 40.180 .. 36.860 ..
2 July 1997 45.100 .. 40.280 43.600 .. 40.280 ..
17 March 1998 49.260 .. 43.990 48.760 .. 44.990 42.990
9 March 1999 52.880 .. 47.210 52.330 .. 50.210 47.210
1 October 1999 49.210 49.210 ..
21 March 2000 54.680 50.890 48.820 50.890 .. 51.820 48.820
1 October 2000 47.820
7 March 2001 (4) 46.820 (4) 45.820 45.820
15 June 2001 48.820
1 October 2003 56.200 50.190 47.100 53.270 47.100
2004 (5) (5)
7 December 2006 57.680 51.520 48.350 54.680 48.350
1 October 2007 60.070 53.650 50.350 56.940 50.350
1 April 2008 (5) (9)
1 December 2008 62.070 52.350 52.350
1 April 2009 54.190 54.190
1 May 2009 63.910
1 September 2009 65.910 56.190 56.190
1 April 2010 66.910 57.190 57.190
1 October 2010 67.910 58.190 58.190
1 January 2011 68.670 58.950 58.950
23 March 2011 67.670 57.950 57.950
(1) Duty rates remain the same unless otherwise stated. (2) These fuels became liable to Value Added Tax (VAT) as follows:- (i) 10% with effect from 1 April 1974 (ii) 8% with effect from 29 July 1974 (iii) For motor spirit 25% with effect from 18 November 1974 (iv) For motor spirit 12.5% with effect from 12 April 1976 (v) 15% with effect from 18 June 1979 (vi) 17.5% with effect from 1 April 1991 (vi) 15% with effect from 1 December 2008 (vii) 17.5% with effect from 1 January 2010 (viii) 20% with effect from 4 January 2011 (Notes continued on following page)
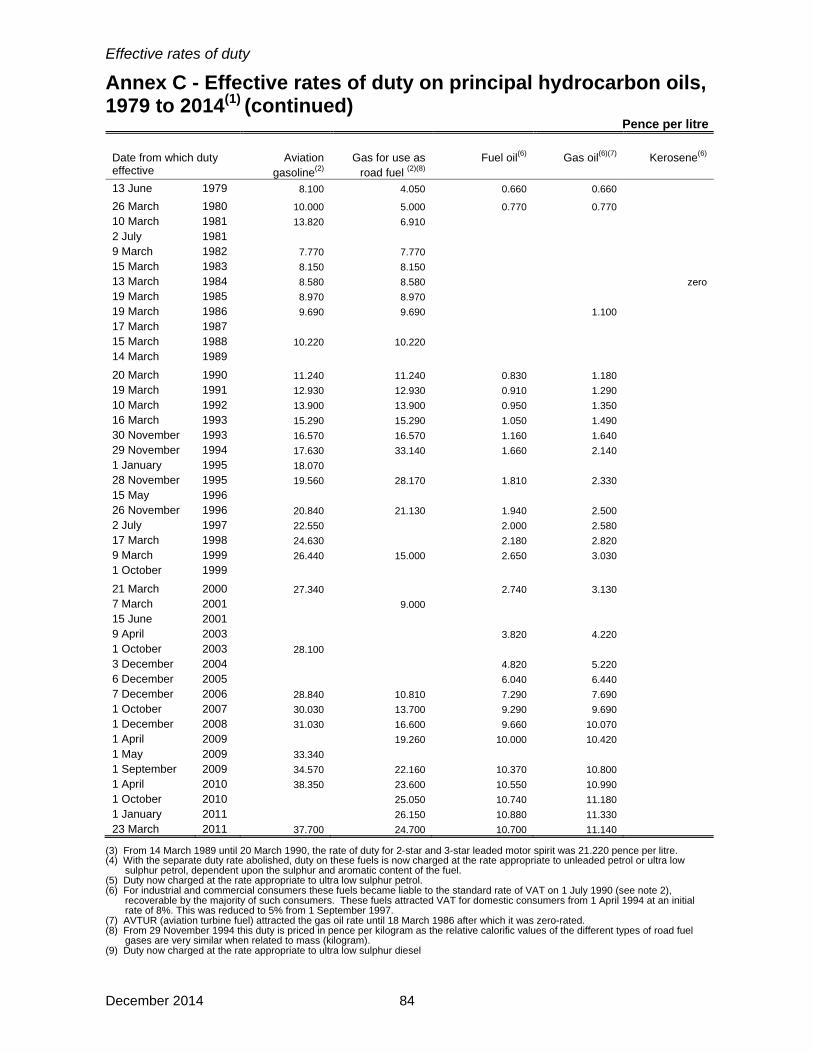
Effective rates of duty
December 2014 84
Annex C - Effective rates of duty on principal hydrocarbon oils, 1979 to 2014(1) (continued)
Pence per litre
Date from which duty effective
Aviation gasoline(2)
Gas for use as road fuel (2)(8)
Fuel oil(6) Gas oil(6)(7) Kerosene(6)
13 June 1979 8.100 4.050 0.660 0.660
26 March 1980 10.000 5.000 0.770 0.770
10 March 1981 13.820 6.910
2 July 1981
9 March 1982 7.770 7.770
15 March 1983 8.150 8.150
13 March 1984 8.580 8.580 zero
19 March 1985 8.970 8.970
19 March 1986 9.690 9.690 1.100
17 March 1987
15 March 1988 10.220 10.220
14 March 1989
20 March 1990 11.240 11.240 0.830 1.180
19 March 1991 12.930 12.930 0.910 1.290
10 March 1992 13.900 13.900 0.950 1.350
16 March 1993 15.290 15.290 1.050 1.490
30 November 1993 16.570 16.570 1.160 1.640
29 November 1994 17.630 33.140 1.660 2.140
1 January 1995 18.070
28 November 1995 19.560 28.170 1.810 2.330
15 May 1996
26 November 1996 20.840 21.130 1.940 2.500
2 July 1997 22.550 2.000 2.580
17 March 1998 24.630 2.180 2.820
9 March 1999 26.440 15.000 2.650 3.030
1 October 1999
21 March 2000 27.340 2.740 3.130
7 March 2001 9.000
15 June 2001
9 April 2003 3.820 4.220
1 October 2003 28.100
3 December 2004 4.820 5.220
6 December 2005 6.040 6.440
7 December 2006 28.840 10.810 7.290 7.690
1 October 2007 30.030 13.700 9.290 9.690
1 December 2008 31.030 16.600 9.660 10.070
1 April 2009 19.260 10.000 10.420
1 May 2009 33.340
1 September 2009 34.570 22.160 10.370 10.800
1 April 2010 38.350 23.600 10.550 10.990
1 October 2010 25.050 10.740 11.180
1 January 2011 26.150 10.880 11.330
23 March 2011 37.700 24.700 10.700 11.140 (3) From 14 March 1989 until 20 March 1990, the rate of duty for 2-star and 3-star leaded motor spirit was 21.220 pence per litre. (4) With the separate duty rate abolished, duty on these fuels is now charged at the rate appropriate to unleaded petrol or ultra low sulphur petrol, dependent upon the sulphur and aromatic content of the fuel. (5) Duty now charged at the rate appropriate to ultra low sulphur petrol. (6) For industrial and commercial consumers these fuels became liable to the standard rate of VAT on 1 July 1990 (see note 2), recoverable by the majority of such consumers. These fuels attracted VAT for domestic consumers from 1 April 1994 at an initial rate of 8%. This was reduced to 5% from 1 September 1997. (7) AVTUR (aviation turbine fuel) attracted the gas oil rate until 18 March 1986 after which it was zero-rated. (8) From 29 November 1994 this duty is priced in pence per kilogram as the relative calorific values of the different types of road fuel gases are very similar when related to mass (kilogram). (9) Duty now charged at the rate appropriate to ultra low sulphur diesel

Explanatory notes
General Symbols used in the tables More detailed notes on the methodology used to compile the figures and data sources are available on the DECC section of the gov.uk website.
.. - p r e
not available nil or not separately available provisional revised; where a column or row shows ‘r’ at the beginning, most, but not necessarily all, of the data have been revised. estimated; totals of which the figures form a constituent part are therefore partly estimated
Notes to tables Conversion factors Figures for the latest periods
and the corresponding averages (or totals) are provisional and are liable to subsequent revision.
1 tonne of crude oil = 1 tonne = 1 gallon (UK) = 1 kilowatt (kW) = 1 megawatt (MW) = 1 gigawatt (GW) = 1 terawatt (TW) =
7.55 barrels 1,000 kilograms 4.54609 litres 1,000 watts 1,000 kilowatts 1,000 megawatts 1,000 gigawatts
All conversion of fuels from original units to units of energy is carried out on the basis of the gross calorific value of the fuel. More detailed information on conversion factors and calorific values is given in Annex A of the Digest of United Kingdom Energy Statistics.
The figures have not been adjusted for temperature or seasonal factors except where noted.
Due to rounding the sum of the constituent items may not equal the totals.
Conversion matrices
Percentage changes relate to the corresponding period a year ago. They are calculated from unrounded figures but are shown only as (+) or (-) when the percentage change is very large.
To convert from the units on the left hand side to the units across the top multiply by the values in the table. To: From Thousand toe Terajoules (TJ) Gigawatt hours (GWh) Million therms To: From Tonnes of oil equivalent Gigajoules (GJ) Kilowatt hours (kWh) Therms
Thousand toe Multiply by 1 0.023885 0.085985 2.5200 Tonnes of oil equivalent Multiply by 1 0.023885 0.000085985 0.0025200
Terajoules 41.868 1 3.6000 105.51 Gigajoules 41.868 1 0.003600 0.105510
GWh 11.630 0.27778 1 29.307 kWh 11,630 277.78 1 29.307
Million therms 0.39683 0.0094778 0.034121 1 Therms 396.83 9.4778 0.034121 1
All figures relate to the United Kingdom unless otherwise indicated.
Note that all factors are quoted to 5 significant figures
Abbreviations Climate Change Levy (CCL) GDP Gross domestic
product The Climate Change Levy came into effect on 1 April 2001. This levy is designed to encourage businesse s to reduce their energy consumption so as to reduce global warming. For information about the Climate Change Levy please contact th e HM Revenue & Customs National Advice Service on 0845 010 9000.
UKCS United Kingdom continental shelf
VAT Value added tax

QUARTERLY ENERGY PRICESEnergy is a major natural resource and a key factor in the economy and environment of the United Kingdom. Data on energy supply and demand, energy prices and values and trade in energy are essential components of this country’s main economic and environmental indicators.
“QUARTERLY ENERGY PRICES”, which began in mid 2001, is a quarterly publication produced by the Department of Energy and Climate Change. This replaces the energy prices information formerly available in the monthly publication “ENERGY TRENDS” and the annual “DIGEST OF UK ENERGY STATISTICS”. It contains tables, charts and commentary covering energy prices to domestic and industrial consumers for all the major fuels, as well as presenting comparisons of fuel prices in the European Union and G7 countries. Information on production and consumption of energy continues to be available in the new quarterly editions of “Energy Trends”, and the annual “Digest of UK Energy Statistics”.
Quarterly Energy Prices and Energy Trends
Subscription available from DECC (0300 068 5056)Price £40 per annum UKwww.gov.uk/government/collections/quarterly-energy-pricesandwww.gov.uk/government/collections/energy-trendsSingle copies available from the Publications Orderlinepriced £6 for Energy Trends and £8 for Quarterly Energy Prices.
UK Energy in Brief
Available from the Publications Orderlinewww.gov.uk/government/collections/uk-energy-in-brief
Digest of UK Energy Statistics
Available from the Stationery Office (0870 600 5522)www.gov.uk/government/collections/digest-of-uk-energy-statistics-dukes
Energy Consumption in the UK
Available on the Internet at:www.gov.uk/government/collections/energy-consumption-in-the-uk
Publications OrderlineWeb: www.gov.uk/government/publications Phone: 0845 Email: [email protected]
© Crown Copyright. You may re-use this information (not including logos)free of charge in any format or medium, under the terms of the OpenGovernment Licence. The Department of Energy and Climate Change reserves the right to alter or discontinue the text of or any table in this bulletin without further notice.
Prepared and published by the Department of Energy and Climate Change.URN 14D/276DISSN 1475-6544 (Print)ISSN 1755-9103 (Online)