Voxel-Based Mapping of Cortical Ischemic Damage Using Tc 99M L, L-Ethyl Cysteinate Dimer Spect in...
10
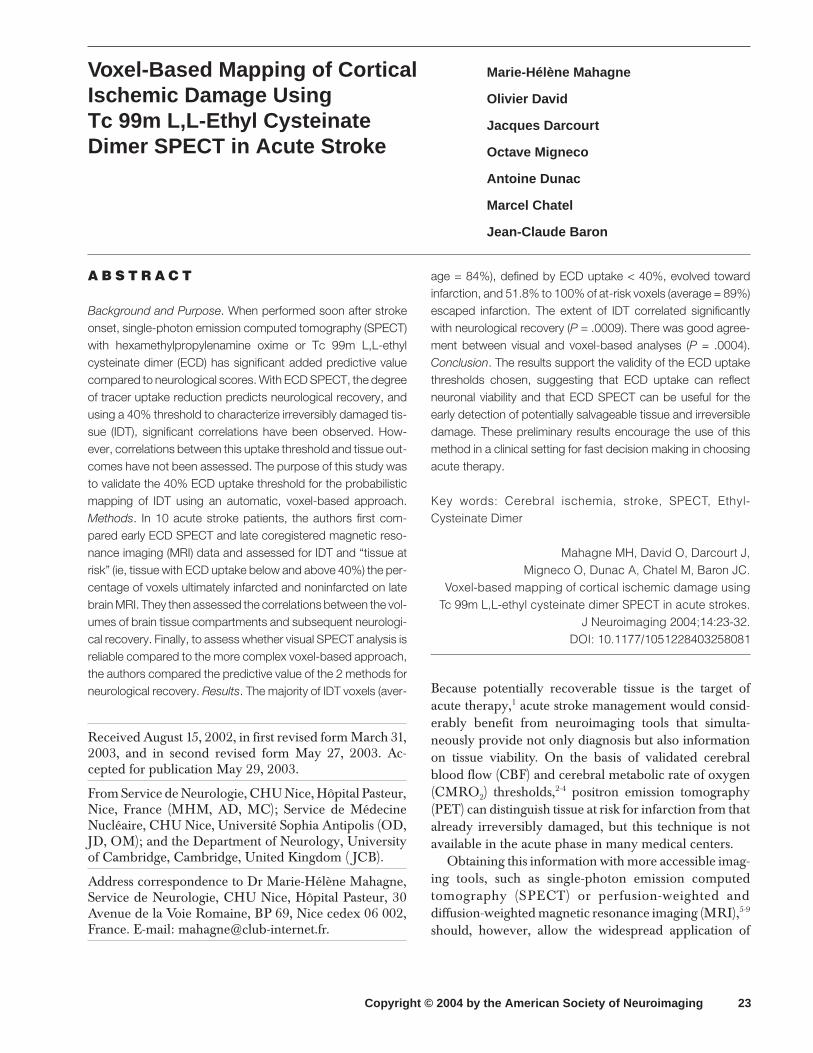
10.1177/1051228403258081 ARTICLE Journal of Neuroimaging Vol 14 No 1 January 2004 Mahagne et al: Mapping of Cortical Ischemic Damage Voxel-Based Mapping of Cortical Ischemic Damage Using Tc 99m L,L-Ethyl Cysteinate Dimer SPECT in Acute Stroke Marie-Hélène Mahagne Olivier David Jacques Darcourt Octave Migneco Antoine Dunac Marcel Chatel Jean-Claude Baron ABSTRACT Background and Purpose. When performed soon after stroke onset, single-photon emission computed tomography (SPECT) with hexamethylpropylenamine oxime or Tc 99m L,L-ethyl cysteinate dimer (ECD) has significant added predictive value compared to neurological scores. With ECD SPECT, the degree of tracer uptake reduction predicts neurological recovery, and using a 40% threshold to characterize irreversibly damaged tis- sue (IDT), significant correlations have been observed. How- ever, correlations between this uptake threshold and tissue out- comes have not been assessed. The purpose of this study was to validate the 40% ECD uptake threshold for the probabilistic mapping of IDT using an automatic, voxel-based approach. Methods. In 10 acute stroke patients, the authors first com- pared early ECD SPECT and late coregistered magnetic reso- nance imaging (MRI) data and assessed for IDT and “tissue at risk” (ie, tissue with ECD uptake below and above 40%) the per- centage of voxels ultimately infarcted and noninfarcted on late brain MRI. They then assessed the correlations between the vol- umes of brain tissue compartments and subsequent neurologi- cal recovery. Finally, to assess whether visual SPECT analysis is reliable compared to the more complex voxel-based approach, the authors compared the predictive value of the 2 methods for neurological recovery. Results. The majority of IDT voxels (aver- age = 84%), defined by ECD uptake < 40%, evolved toward infarction, and 51.8% to 100% of at-risk voxels (average = 89%) escaped infarction. The extent of IDT correlated significantly with neurological recovery (P = .0009). There was good agree- ment between visual and voxel-based analyses (P = .0004). Conclusion. The results support the validity of the ECD uptake thresholds chosen, suggesting that ECD uptake can reflect neuronal viability and that ECD SPECT can be useful for the early detection of potentially salvageable tissue and irreversible damage. These preliminary results encourage the use of this method in a clinical setting for fast decision making in choosing acute therapy. Key words: Cerebral ischemia, stroke, SPECT, Ethyl- Cysteinate Dimer Mahagne MH, David O, Darcourt J, Migneco O, Dunac A, Chatel M, Baron JC. Voxel-based mapping of cortical ischemic damage using Tc 99m L,L-ethyl cysteinate dimer SPECT in acute strokes. J Neuroimaging 2004;14:23-32. DOI: 10.1177/1051228403258081 Because potentially recoverable tissue is the target of acute therapy, 1 acute stroke management would consid- erably benefit from neuroimaging tools that simulta- neously provide not only diagnosis but also information on tissue viability. On the basis of validated cerebral blood flow (CBF) and cerebral metabolic rate of oxygen (CMRO 2 ) thresholds, 2-4 positron emission tomography (PET) can distinguish tissue at risk for infarction from that already irreversibly damaged, but this technique is not available in the acute phase in many medical centers. Obtaining this information with more accessible imag- ing tools, such as single-photon emission computed tomography (SPECT) or perfusion-weighted and diffusion-weighted magnetic resonance imaging (MRI), 5-9 should, however, allow the widespread application of Copyright © 2004 by the American Society of Neuroimaging 23 Received August 15, 2002, in first revised form March 31, 2003, and in second revised form May 27, 2003. Ac- cepted for publication May 29, 2003. From Service de Neurologie, CHU Nice, Hôpital Pasteur, Nice, France (MHM, AD, MC); Service de Médecine Nucléaire, CHU Nice, Université Sophia Antipolis (OD, JD, OM); and the Department of Neurology, University of Cambridge, Cambridge, United Kingdom ( JCB). Address correspondence to Dr Marie-Hélène Mahagne, Service de Neurologie, CHU Nice, Hôpital Pasteur, 30 Avenue de la Voie Romaine, BP 69, Nice cedex 06 002, France. E-mail: [email protected].
-
Upload
independent -
Category
Documents
-
view
5 -
download
0
Transcript of Voxel-Based Mapping of Cortical Ischemic Damage Using Tc 99M L, L-Ethyl Cysteinate Dimer Spect in...
10.1177/1051228403258081ARTICLEJournal of Neuroimaging Vol 14 No 1 January 2004Mahagne et al:Mapping of Cortical Ischemic Damage
Voxel-Based Mapping of CorticalIschemic Damage UsingTc 99m L,L-Ethyl CysteinateDimer SPECT in Acute Stroke
Marie-Hélène Mahagne
Olivier David
Jacques Darcourt
Octave Migneco
Antoine Dunac
Marcel Chatel
Jean-Claude Baron
A B S T R A C T
Background and Purpose. When performed soon after strokeonset, single-photon emission computed tomography (SPECT)with hexamethylpropylenamine oxime or Tc 99m L,L-ethylcysteinate dimer (ECD) has significant added predictive valuecompared to neurological scores. With ECD SPECT, the degreeof tracer uptake reduction predicts neurological recovery, andusing a 40% threshold to characterize irreversibly damaged tis-sue (IDT), significant correlations have been observed. How-ever, correlations between this uptake threshold and tissue out-comes have not been assessed. The purpose of this study wasto validate the 40% ECD uptake threshold for the probabilisticmapping of IDT using an automatic, voxel-based approach.Methods. In 10 acute stroke patients, the authors first com-pared early ECD SPECT and late coregistered magnetic reso-nance imaging (MRI) data and assessed for IDT and “tissue atrisk” (ie, tissue with ECD uptake below and above 40%) the per-centage of voxels ultimately infarcted and noninfarcted on latebrain MRI. They then assessed the correlations between the vol-umes of brain tissue compartments and subsequent neurologi-cal recovery. Finally, to assess whether visual SPECT analysis isreliable compared to the more complex voxel-based approach,the authors compared the predictive value of the 2 methods forneurological recovery. Results. The majority of IDT voxels (aver-
age = 84%), defined by ECD uptake < 40%, evolved towardinfarction, and 51.8% to 100% of at-risk voxels (average = 89%)escaped infarction. The extent of IDT correlated significantlywith neurological recovery (P = .0009). There was good agree-ment between visual and voxel-based analyses (P = .0004).Conclusion. The results support the validity of the ECD uptakethresholds chosen, suggesting that ECD uptake can reflectneuronal viability and that ECD SPECT can be useful for theearly detection of potentially salvageable tissue and irreversibledamage. These preliminary results encourage the use of thismethod in a clinical setting for fast decision making in choosingacute therapy.
Key words: Cerebral ischemia, stroke, SPECT, Ethyl-Cysteinate Dimer
Mahagne MH, David O, Darcourt J,Migneco O, Dunac A, Chatel M, Baron JC.
Voxel-based mapping of cortical ischemic damage usingTc 99m L,L-ethyl cysteinate dimer SPECT in acute strokes.
J Neuroimaging 2004;14:23-32.DOI: 10.1177/1051228403258081
Because potentially recoverable tissue is the target ofacute therapy,1 acute stroke management would consid-erably benefit from neuroimaging tools that simulta-neously provide not only diagnosis but also informationon tissue viability. On the basis of validated cerebralblood flow (CBF) and cerebral metabolic rate of oxygen(CMRO2) thresholds,2-4 positron emission tomography(PET) can distinguish tissue at risk for infarction from thatalready irreversibly damaged, but this technique is notavailable in the acute phase in many medical centers.
Obtaining this information with more accessible imag-ing tools, such as single-photon emission computedtomography (SPECT) or perfusion-weighted anddiffusion-weighted magnetic resonance imaging (MRI),5-9
should, however, allow the widespread application of
Copyright © 2004 by the American Society of Neuroimaging 23
Received August 15, 2002, in first revised form March 31,2003, and in second revised form May 27, 2003. Ac-cepted for publication May 29, 2003.
From Service de Neurologie, CHU Nice, Hôpital Pasteur,Nice, France (MHM, AD, MC); Service de MédecineNucléaire, CHU Nice, Université Sophia Antipolis (OD,JD, OM); and the Department of Neurology, Universityof Cambridge, Cambridge, United Kingdom ( JCB).
Address correspondence to Dr Marie-Hélène Mahagne,Service de Neurologie, CHU Nice, Hôpital Pasteur, 30Avenue de la Voie Romaine, BP 69, Nice cedex 06 002,France. E-mail: [email protected].

these concepts. It is indeed clear now that distinguishingirreversibly damaged tissue (IDT) from tissue at risk forinfarction is a key issue in acute stroke management.
When performed within 6 to 12 hours of stroke onset,SPECT with either hexamethylpropylenamine oxime(HMPAO)10-18 or Tc 99m L,L-ethyl cysteinate dimer(ECD)19-21 adds significant information to admission neu-rological scores to predict spontaneous evolution. How-ever, ECD brain uptake appears to reflect cell metabo-lism more than perfusion16,22-26 and so might be a bettertissue outcome predictor than HMPAO uptake in theacute phase of a stroke. According to several stud-ies,11,12,16,18,27 a 40% HMPAO uptake reduction may repre-sent the threshold below which brain tissue is irreversiblydamaged, whereas hypoperfused tissue with HMPAOuptake above this threshold may represent the penumbra(taken here for convenience to represent the at-risk tissue,including both the classic penumbra and moderatelyhypoperfused tissue2,3,28,29); however, this threshold hasnot been formally validated to date. With ECD SPECT,the degree of tracer uptake reduction is predictive of finalinfarction on late computed tomography (CT) scans,21
and using a threshold of 40% to visually derive volumes ofaffected tissue, significant correlations with neurologicalrecovery have been obtained.14 However, the correlationbetween uptake and tissue outcome has not beenassessed.
The aim of this study was therefore to validate the 40%ECD uptake threshold for the probabilistic mapping ofIDT. To this end, we compared initial ECD SPECT andlate coregistered MRI and assessed for each hypoper-fused tissue category the percentage of voxels ultimatelyinfarcted and noninfarcted on late brain MRI. We thenassessed the correlation between the volume of each braintissue compartment (ie, below and above the threshold)on one hand and subsequent neurological recovery onthe other hand. Finally, to assess whether visual SPECTimage analysis (ie, the method used in clinical routine) isreliable relative to the more complex voxel-basedapproach, we compared the predictive value of these 2methods of assessment for neurological recovery.
Patients and Methods
Patients
The group of 18 patients on which this study was basedhas been described previously,14 and the patients’ infor-mation is presented in Table 1. Briefly, the group con-sisted of 13 men and 5 women (mean age = 73 years, range60-91 years) with clinically defined first-ever ischemicstrokes prospectively studied with ECD SPECT withinthe 12 first hours of stroke onset. The patients fulfilled the
following inclusion criteria: (1) each had a middle cere-bral artery (MCA) territory ischemic event confirmed bysubsequent clinical evaluation and a follow-up CT scan,(2) a technically adequate SPECT study was performedwithin 12 hours of stroke onset, and (3) complete neuro-logical follow-up was performed until death or 90 days.Comatose patients and transient ischemic attacks wereexcluded, but otherwise, all degrees of severity were eligi-ble. Neurological deficit at entry was quantified by a neu-rologist using Orgogozo’s MCA scale. CT scans withoutcontrast were performed to exclude hemorrhages as soonas possible, within 12 hours of stroke onset in all cases. Allpatients received standard treatment, but none was part ofa therapeutic trial or received thrombolysis. Outcomeevaluation was performed after 90 days by the same neu-rologist using Orgogozo’s scale. Clinical evolution wasquantified with Martinez-Vila et al’s30 evolution indices,calculated as day 90 – day 0 / day 0 for deterioration andday 90 – day 0 / 100 – day 0 for recovery. Informed con-sent for the SPECT procedure was obtained from eachpatient or his or her next of kin.
Out of this series, 10 patients (8 men and 2 women,mean age = 71 years, range 60-87 years) underwent thecoregistration of late brain MRI and ECD SPECT, andthey constituted the material for the threshold validationsection of this study.
MRI
After 3 months of evolution, T1-weighted and T2-weighted 3-dimensional images were acquired on a 1.5-TGE scanner (Sigma, GE Medical Systems, Milwaukee,WI). We used a fast spin-echo sequence (TR = 3500 milli-seconds, effective TE = 91 milliseconds). The voxel sizewas 3 × 1 × 1 mm (25-cm field of view, 3-mm-thick sec-tions, 256 × 256 matrix size). These late T2-weightedMRI images were used as references, considering thatgray matter voxels with increased signal intensity on T2sequences corresponded to long-term IDT.31
SPECT
Under resting conditions in a quiet and dark room, eachpatient underwent a Tc 99m ECD SPECT study within 12hours of stroke onset and 1110 MBq (megabecquerels) ofTc 99m ECD (Neurolite, DuPont Pharma, Billerica, MA)were injected intravenously. Acquisition was carried out60 minutes after injection. We used a triple-head camera(Prism 3000, Picker International, Cleveland, OH)equipped with low-energy, ultra-high-resolution fan-beam collimators (one hundred twenty 128 × 128 pixelprojections of 50 seconds each). Reconstruction was per-formed using filtered back-projection. No attenuationcorrection was performed. Transaxial cuts were obtained
24 Journal of Neuroimaging Vol 14 No 1 January 2004
using a ramp filter followed by a 3-dimensional, low-passfilter (order = 6, cutoff frequency = 0.4), resulting in a 9-mm spatial resolution. These data were first reformattedinto transverse slices parallel to the anterior commissure–posterior commissure line, detected according to themethod described by Minoshima et al,32 and then into co-ronal slices orthogonal to this line. Sagittal cuts were alsoobtained for final display. The slices were 4.4 mm thick inall planes. This procedure allowed us to obtain SPECTimages easily referable to Talairach’s stereotaxic atlas inall 3 directions of space.
Voxel-Based Analysis of SPECT Data
This part of the study consisted of an automatic 3-dimen-sional analysis of coregistered SPECT and MRI data sets.It was performed voxel by voxel without recourse to re-gions of interest (ROIs). Except for the definition of theinterhemispheric plane (see below), all successive stepswere automated as follows (Fig 1).
Labeling of Gray Matter Voxels on Early SPECT Data (n = 18) (Fig 1A-1D)
The SPECT data sets were first displayed on a videoscreen using standard color scales (Fig 1A). Following de-lineation of the interhemispheric plane, the unaffectedhemisphere was edited automatically, with manual
correction needed on rare occasions. Unaffected-hemisphere gray matter tissue was then segmented auto-matically, as shown in Figure 1B. The segmentation of theunaffected gray matter was performed by an iterativesearch of the optimal activity threshold. Starting at 6%, thethreshold limit was iteratively increased until it included anumber of voxels equal to 22% of the total number ofbrain voxels. This value was validated against expertmanual segmentation. The results were an averagedthreshold of 51.8% ± 3.9% for the 18 patients. The seg-mented unaffected-hemisphere gray matter mask servedas a template for the affected-hemisphere gray mattermask, which was generated by symmetry relative to theinterhemispheric plane to obtain the whole gray matter 3-dimensional mask (Fig 1C). Within this mask, each voxelon the affected side was classified into 1 of 3 ECD uptakecategories according to the ratio between its uptake andthat of the symmetric voxel on the unaffected hemi-sphere. According to the design of the study, the 3 voxelcategories were normal uptake (>80%), penumbra (be-tween 40% and 80%), and IDT (<40%).
The above analysis assumes that individual brains aresymmetrical. Because this is not always the case, artifactsmay arise, notably with the risk for overestimating
Mahagne et al: Mapping of Cortical Ischemic Damage 25
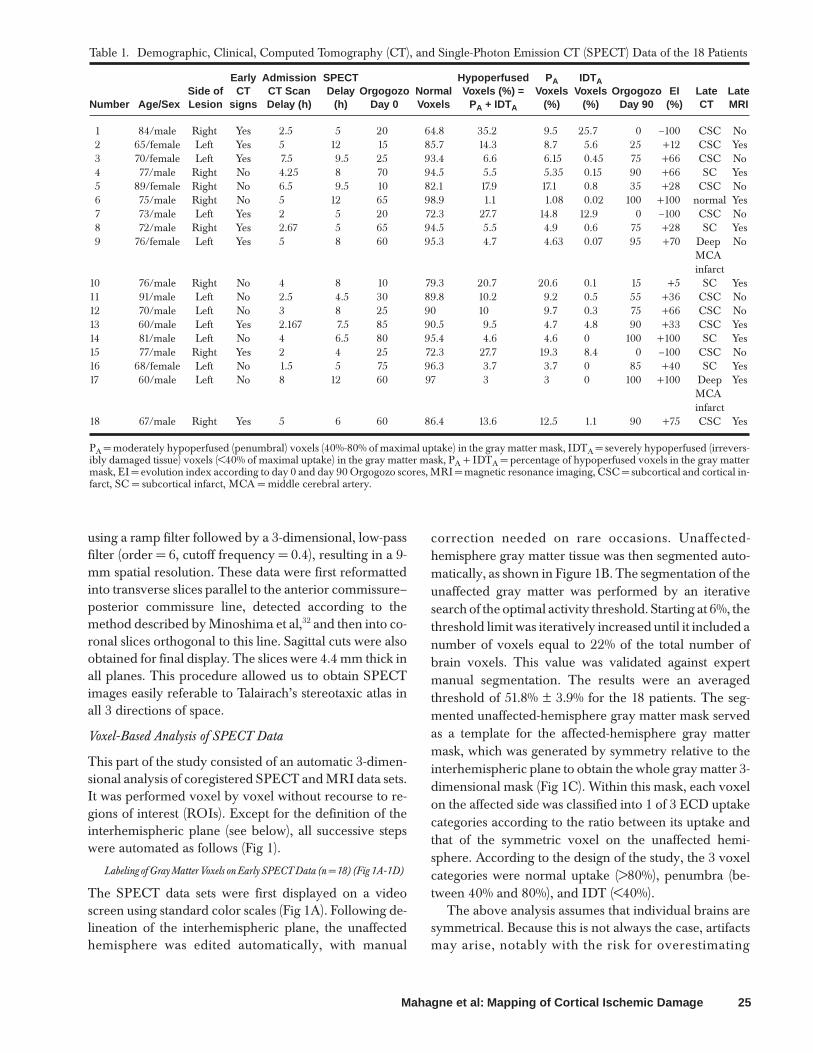
Table 1. Demographic, Clinical, Computed Tomography (CT), and Single-Photon Emission CT (SPECT) Data of the 18 Patients
Early Admission SPECT Hypoperfused P A IDTASide of CT CT Scan Delay Orgogozo Normal Voxels (%) = Voxels Voxels Orgogozo EI Late Late
Number Age/Sex Lesion signs Delay (h) (h) Day 0 Voxels P A + IDTA (%) (%) Day 90 (%) CT MRI
1 84/male Right Yes 2.5 5 20 64.8 35.2 9.5 25.7 0 –100 CSC No2 65/female Left Yes 5 12 15 85.7 14.3 8.7 5.6 25 +12 CSC Yes3 70/female Left Yes 7.5 9.5 25 93.4 6.6 6.15 0.45 75 +66 CSC No4 77/male Right No 4.25 8 70 94.5 5.5 5.35 0.15 90 +66 SC Yes5 89/female Right No 6.5 9.5 10 82.1 17.9 17.1 0.8 35 +28 CSC No6 75/male Right No 5 12 65 98.9 1.1 1.08 0.02 100 +100 normal Yes7 73/male Left Yes 2 5 20 72.3 27.7 14.8 12.9 0 –100 CSC No8 72/male Right Yes 2.67 5 65 94.5 5.5 4.9 0.6 75 +28 SC Yes9 76/female Left Yes 5 8 60 95.3 4.7 4.63 0.07 95 +70 Deep No
MCAinfarct
10 76/male Right No 4 8 10 79.3 20.7 20.6 0.1 15 +5 SC Yes11 91/male Left No 2.5 4.5 30 89.8 10.2 9.2 0.5 55 +36 CSC No12 70/male Left No 3 8 25 90 10 9.7 0.3 75 +66 CSC No13 60/male Left Yes 2.167 7.5 85 90.5 9.5 4.7 4.8 90 +33 CSC Yes14 81/male Left No 4 6.5 80 95.4 4.6 4.6 0 100 +100 SC Yes15 77/male Right Yes 2 4 25 72.3 27.7 19.3 8.4 0 –100 CSC No16 68/female Left No 1.5 5 75 96.3 3.7 3.7 0 85 +40 SC Yes17 60/male Left No 8 12 60 97 3 3 0 100 +100 Deep Yes
MCAinfarct
18 67/male Right Yes 5 6 60 86.4 13.6 12.5 1.1 90 +75 CSC Yes
PA = moderately hypoperfused (penumbral) voxels (40%-80% of maximal uptake) in the gray matter mask, IDTA = severely hypoperfused (irrevers-ibly damaged tissue) voxels (<40% of maximal uptake) in the gray matter mask, PA + IDTA = percentage of hypoperfused voxels in the gray mattermask, EI = evolution index according to day 0 and day 90 Orgogozo scores, MRI = magnetic resonance imaging, CSC = subcortical and cortical in-farct, SC = subcortical infarct, MCA = middle cerebral artery.

the number of voxels classified as IDT in the affected-hemisphere mask. Indeed, because the reference tem-plate used to generate the latter is the unaffected-hemi-sphere mask, any voxel misclassified as gray matter dur-ing the segmentation process (eg, if it lies outside the brainlimits or encroaches on cerebrospinal fluid [CSF] spaces)may have a very low uptake value and would therefore beclassified as IDT in the mirror mask. Because such voxelswould tend to be scattered across the image, this artifactwas minimized by adding a final step to the process thatconsisted of retaining as hypoperfused SPECT voxels forfurther analysis only the largest 3-dimensional connectedclusters. We verified that this step effectively largely elimi-nated voxels wrongly segmented as gray matter on theasymptomatic side. Once this automatic procedure wascompleted, the volume of hypoperfused gray mattervoxels was computed by summing all IDT and penumbravoxels, expressed as a percentage of the total gray mattervolume (IDTA% and PA%). The volumes for IDT and pen-umbra voxels were calculated in the same way. These vol-umes were used for global validation compared to clinicalevolution. For each patient, the relative indices were cal-culated as follows:
IDTA% = number of IDT voxels � totalnumber of hypoperfused voxels,
PA% = number of penumbral voxels � totalnumber of hypoperfused voxels.
Late MRI (n = 10) (Fig 1E)
As already stated, we considered that gray matter voxelswith high intensity on the late T2-weighted MRI repre-sented the final infarct.31 These infarcted voxels were au-tomatically selected by segmentation if their signals wereequal to that of the CSF and they were in the symptomatichemisphere. To eliminate voxels corresponding to sulcalCSF, only the largest 3-dimensional connected clusterswere considered, as described above. Finally, followingthe coregistration procedure described below, only thosevoxels included within the SPECT gray matter mask wereused for final analysis and considered as infarcted graymatter voxels. The remaining gray matter voxels weretherefore classified as noninfarcted.
MRI and SPECT Coregistration (Fig 1F)
We used Pelizzari et al’s33 classical surface-based registra-tion method, which uses a validated global rigid transfor-
26 Journal of Neuroimaging Vol 14 No 1 January 2004
Fig 1. Successive steps of image processing for voxel-based analysis of single-photon emission computed tomography(SPECT) data in relation to magnetic resonance imaging (MRI). (1) Labeling of SPECT data: (A) raw SPECT images; (B) segmen-tation of the unaffected hemisphere;(C) whole-brain 3-dimensional gray matter mask; (D) voxel classification by comparison to theunaffected side: green > 80% (normal), yellow < 40% (irreversibly damaged tissue), red between 40% and 80% (penumbral). (2)Late MRI and MRI/SPECT coregistration (E, F). (3) Final voxel classification using SPECT and late MRI coregistration (G).
mation and is popularly known as the “head-hat” method.In this method, the brain surface is first segmented foreach image modality and then coregistered, as fully de-scribed by Itti et al.34 Regarding T2-weighted MRI, theextraction of the brain contours combined morphologicalerosion to separate the brain from the surrounding tis-sues, the detection of the largest 3-dimensional connectedcomponent to identify the whole brain, and morphologi-cal dilatation to recover its original size. Finally, rigid sur-face matching35-37 was applied to obtain 3-dimensionalcoregistered SPECT and MRI brain voxels.
Voxel Classification According to Both SPECT and MRI (Fig 1G)
Because early SPECT gray matter voxels were classifiedinto 3 categories (normal, penumbral, and IDT) and MRIvoxels into 2 categories (infarcted and noninfarcted), eachcoregistered gray matter voxel could belong to 6 possiblecategories: (1) normal noninfarcted (normally perfusedon early SPECT and noninfarcted on late MRI, in blue),(2) normal infarcted (normally perfused on early SPECTbut infarcted on late MRI, in purple; this combination in-cluded registration artifacts; see, eg, the basal ganglia andthe Discussion), (3) penumbral noninfarcted (initiallyclassified as penumbral but escaping infarction; in green),(4) penumbral infarcted (initially classified as penumbraland evolving toward infarction; in white), (5) IDTinfarcted (infarcted voxels considered as IDT on earlySPECT; in red), and (6) IDT noninfarcted (voxels classi-fied as IDT on SPECT but ultimately noninfarcted onMRI; in yellow).
Visual Analysis of SPECT Data
As explained in the introduction, the SPECT data werealso analyzed visually according to a semiquantitativemethod, described previously,14 that uses a color-codeddisplay with normalization to the unaffected side. Thecolor scale was specially designed for this analysis using 3colors to code the pixel value relative to the unaffected-hemisphere maximum pixel value, namely, < 40%, 40%to 80%, and > 40%, similar to the thresholds used in thevoxel-based analysis to define the IDT, penumbral, andnormal voxels. As described in detail elsewhere,14 6 ROIscovering the MCA and anterior cerebral artery corticalterritories on the affected side were defined, and the ex-tent of abnormal ECD uptake, according to the IDT andpenumbral categories, was visually quantified by sum-ming the number of ROIs categorized into each of these 2categories. As for the automatic analysis, we then calcu-lated the total number of hypoperfused ROIs by sum-ming all IDT and penumbral ROIs (IDTV% and PV%).Likewise, for each patient, relative indices were then de-fined as follows:
IDTV% = number of IDT ROIs � total number ofhypoperfused ROIs,
PV% = number of penumbral ROIs � total number ofhypoperfused ROIs.
Data Handling and Statistical Analyses
According to the 3 aims of the present study, the data ob-tained as described above were analyzed as follows.
1. Validation of the SPECT thresholds (based on MRISPECT voxel classification, n = 10 patients with fullcoregistration): for each of these categories of SPECTand MRI voxels, we calculated the percentage of voxelsultimately infarcted on late MRI. If the thresholds werevalid, we expected that most IDT voxels would evolve toinfarcted on late MRI and most normal voxels tononinfarcted, whereas penumbral voxels might evolveto either infarcted or noninfarcted. Regarding IDT, andto further minimize the ill effects of the edge artifacts de-scribed above, only when IDT was > 1% of total graymatter did we consider it for further analysis.
2. Relationships between the voxel-based volumes of tissuecategories and clinical recovery (n = 18 patients): we cal-culated the Spearman rank correlations between PA%and IDTA% values on one hand and neurological recov-ery (evolution index percentage at 90 days) on the other.
3. Assessment of the reliability of the visual analysis (n = 18patients): correlations between IDT% and P% values ob-tained with the visual and automatic analyses were firstobtained (ie, IDTA%, IDTV%, PA%, and PV%), and thenthe correlations between these values for each methodand neurological recovery scores were compared.
Results
Validation of the Threshold (n = 10)
Table 1 shows the main clinical and radiological data ofthe 10 patients as well as the results of the voxel-by-voxelanalysis (percentage of normally perfused voxels, per-centage of hypoperfused voxels, percentage of penum-bral voxels [PA%] and percentage of IDT voxels[IDTA%]).
The results tended to validate the 40% threshold, asshown by the following observations (Table 2):
1. Virtually all normal voxels were ultimately noninfarcted,except in patient 2, in whom 9.1% were ultimatelyinfarcted.
2. Although IDT voxels were identified in 3 patients only(patients 2, 13, and 18), 93.6%, 88.9%, and 69.7% of theirIDT voxels evolved toward infarction, respectively (av-erage = 84%). The larger fraction of ultimately non-infarcted IDT voxels in patient 18 was explained bymany voxels being located at the edges of the brain pa-renchyma, as revealed by visual inspection.
3. Regarding the penumbral voxels, the fraction of them es-caping infarction ranged from 51.8% to 100% (average =
Mahagne et al: Mapping of Cortical Ischemic Damage 27
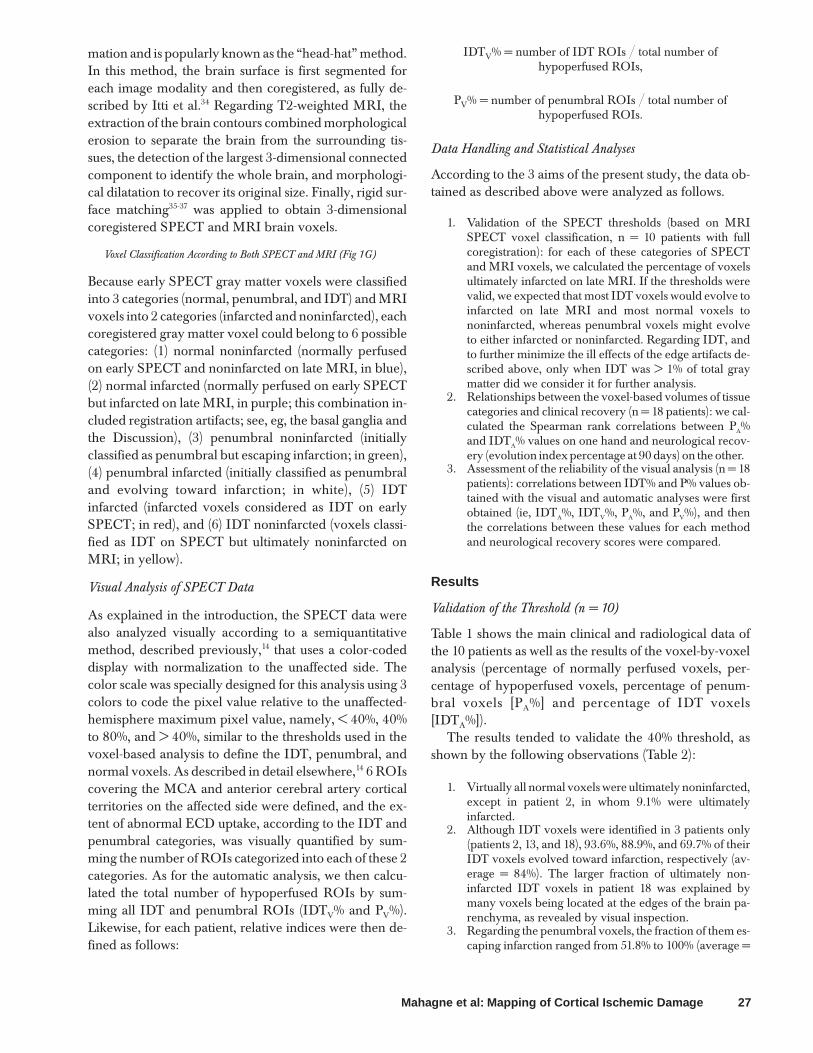
89%). Visual inspection showed that most of thepenumbral voxels evolving toward infarction were lo-cated at the periphery of the final infarct (see Fig 2 for il-lustration). In patients 2 and 13, a large number of thepenumbral voxels evolved toward infarction, yet SPECTwas performed respectively 12 and 7.5 hours after strokeonset.
Correlation With Neurological Recovery (n = 18)
Table 1 shows the clinical, radiological, and SPECT dataof the 18 patients.
The IDTA% significantly negatively correlated withneurological recovery (Table 3). The PA% similarly corre-
28 Journal of Neuroimaging Vol 14 No 1 January 2004
Table 2. Voxel Classification According to Single-Photon Emission Computed Tomography (SPECT) and Magnetic Resonance Im-aging (MRI)
Patient Normal Normal Penumbral Penumbral IDT IDTNumber Infarcted (%) Noninfarcted (%) Infarcted (%) Noninfarcted (%) Infarcted (%) Noninfarcted (%)
2 9.1 90.9 48.2 51.8 93.6 6.44 0 100 0 100 NA NA6 0 100 0 100 NA NA8 0 100 0 100 NA NA
10 0 100 0 100 NA NA13 0.7 99.3 33.3 66.7 88.9 11.114 0 100 0 100 NA NA16 0 100 0 100 NA NA17 0 100 0 100 NA NA18 0.4 99.6 24.7 75.3 69.7 30.3
IDT = irreversibly damaged tissue. For each category of SPECT voxels (ie, normal, penumbral, and IDT), the percentage of voxels infarcted ornoninfarcted on late MRI was calculated. Normal noninfarcted = normally perfused voxels noninfarcted on late MRI, normal infarcted = normallyperfused voxels infarcted on late MRI, penumbral noninfarcted = penumbral voxels noninfarcted on late MRI, penumbral infarcted = penumbralvoxels infarcted on late MRI, IDT noninfarcted = IDT voxels noninfarcted on late MRI, IDT infarcted = IDT voxels infarcted on late MRI.
Fig 2. Illustrative example of 3-dimensional single-photon emission computed tomography gray matter voxel labeling:normal inblue, penumbral noninfarcted in green, penumbral infarcted in white, irreversibly damaged tissue (IDT) infarcted in red, normallyperfused infarcted in purple, IDT noninfarcted in yellow.
lated with neurological recovery but, as expected, in thepositive direction.
Comparison of Visual and Automatic Analysis (n = 18)
Table 4 shows the P% and IDT% obtained with both theautomatic and the visual analyses. There was good agree-ment between both methods of assessment (P = .0004, r =0.864; P = .0004, r = 0.872, respectively). Compared tothe automatic analysis, the correlations between IDTV%and PV% on one hand and neurological recovery on theother hand had lower statistical significance (see Table 3).
Discussion
The results of this study can be summarized as follows: (1)the distribution of IDT, penumbral, and normal voxels inthe ultimately infarcted and noninfarcted MRI tissuecomponents was consistent with our assumptions aboutthe ECD uptake threshold; that is, most IDT voxelsevolved toward infarction, whereas most normal voxelsdid not, and penumbral voxels had either type of out-come; (2) the correlations between the sizes of these com-ponents and neurological recovery were also consistentwith the hypotheses, namely, the larger the IDT relativeto the hypoperfused area, the worse the recovery, and thelarger the penumbral component, the better the recovery;and (3) these voxel-based thresholds can be applied for avisual type of SPECT image analysis with good reliabilitydespite a minor loss of sensitivity. Altogether, therefore,these results support the validity of the 40% threshold forECD SPECT in acute stroke management and that of ap-plying this threshold for a convenient visual analysis ofthe data. Before discussing these findings, a brief accountof some issues related to the method developed here is inorder.
To our knowledge, the voxel-based comparison ofSPECT and MRI data sets with coregistration has notbeen applied before in the acute stroke setting. There are
obvious difficulties involved not only in obtaining bothacute-stage SPECT and follow-up MRI in this kind ofpatient but also in ensuring the adequate coregistration ofthe 2 data sets. Despite considering only the largest 3-dimensional connected clusters, some coregistration arti-facts remain with our method. Considering the normalinfarcted voxels (in purple) and the IDT noninfarctedvoxels (in yellow) as coregistration errors, we calculatedthat these misclassified voxels represented < 0.5% of allbrain voxels. However, the effects of misclassificationwithin the affected region cannot be measured. Moresophisticated methods could be used to reduce theseerrors. They would most likely not significantly modifythe clinical results. A second methodological issue is thatin this study, only the cortical voxels were eventually con-sidered in the analysis. However, the cortex is the brainarea most concerned by the ischemic penumbra andtherefore has been considered the main target for therapyto date,3 so this problem is not considered to have seri-ously compromised our interpretations. The origin of thisproblem lies in the method used here to reduce edge arti-facts, which in some cases led to the misclassification ofbasal ganglia voxels in patients 13 and 18. As illustrated inFigure 1, hypoperfused voxels belonging to the basal gan-glia, though identified with both the automatic and thevisual analyses, were not taken into account in the analy-sis because the artifact reduction procedure automaticallysuppressed all nonconfluent voxels. After this procedure,
Mahagne et al: Mapping of Cortical Ischemic Damage 29
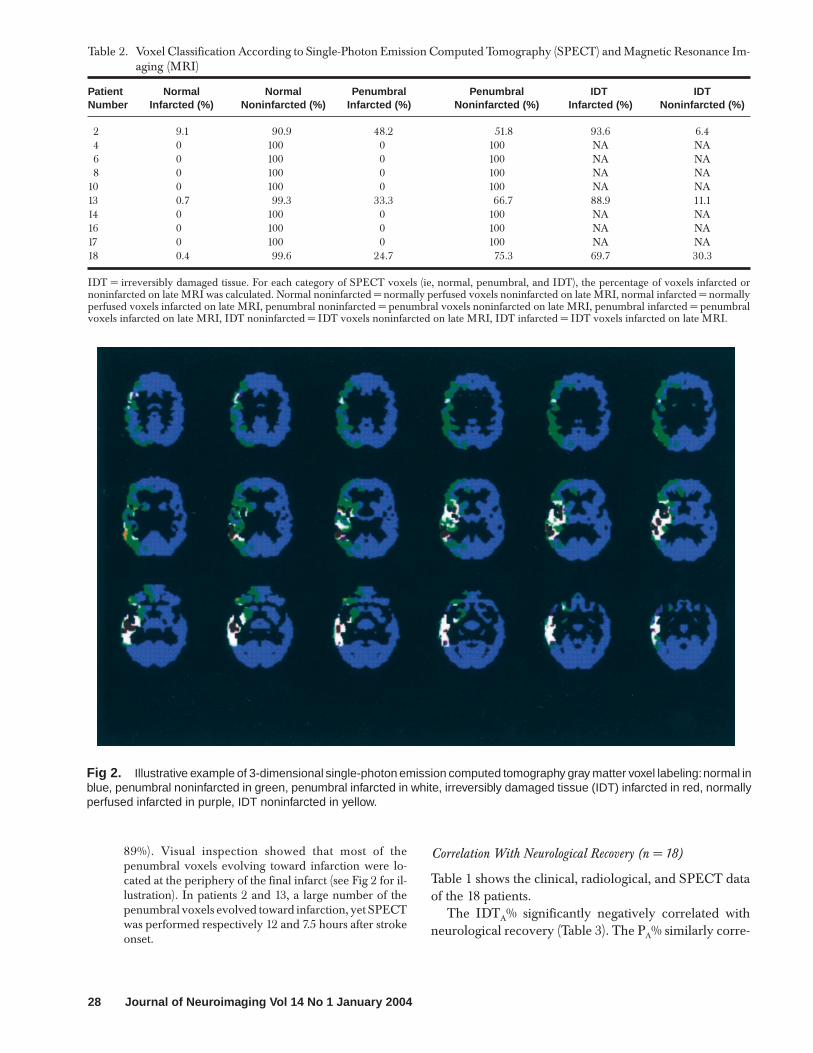
Table 3. Statistical Correlations Between Neurological Evolu-tion and Single-Photon Emission Computed Tomogra-phy Parameters (n = 18 cases)
EI (%)
Orgogozo day 0 P = .03, r = 0.525Automatic analysis
PA% P = .0007, r = 0.822IDTA% P = .0009, r = –0.802
Visual analysisPV% P = .002, r = 0.734IDTV% P = .0025, r = –0.734
Spearman’s nonparametric rank test. EI = evolution index, P =penumbral, IDT = irreversibly damaged tissue.
Table 4. Data Obtained With Automatic and Visual Analyses
PatientNumber P V (%) PA (%) IDTV (%) IDTA (%)
1 28 26.9 72 73.12 62 60.9 38 39.13 80 93.2 20 6.84 100 97.3 0 2.75 100 95.5 0 4.56 100 98 0 27 50 53.4 50 46.88 100 92.4 0 7.69 100 98.4 0 1.6
10 62 75.5 38 24.511 75 95.5 25 4.512 100 97.5 0 2.513 50 48.6 50 51.414 100 100 0 015 50 69.7 50 30.316 100 100 0 017 100 100 0 018 100 92.2 0 7.8
P = penumbral, IDT = irreversibly damaged tissue. Voxel-based analy-sis: PA% = number of P voxels / number of P and IDT voxels, IDTA% =number of IDT voxels / number of P and IDT voxels. Visual analysis:PV% = number of P regions of interest (ROIs) / number of P and IDTROIs, IDTV% = number of IDT ROIs / number of P and IDT ROIs.
the basal ganglia were miscategorized as normallyperfused yet ultimately infarcted in MRI; these basal gan-glia voxels represented 0.7% and 0.4% of normal voxels,respectively. This methodological problem hampered tosome extent our validation approach, because only 3patients out of 10 developed cortical infarctions, althoughall patients but 1 had subcortical infarctions at late imag-ing. In addition, the ECD uptake threshold studied heremay not necessarily apply to white matter, although bothare admittedly relevant targets of stroke therapy. How-ever, our voxel-based methodology could in the future beapplied to white matter using a threshold for IDT differ-ent from that in the cortex.28 A final point concerning ourstudy is that it concerned a 12-hour window, and thus, dif-ferent ECD thresholds might apply for earlier or latertime points.
Our results support the validity of the ECD uptakethreshold chosen here. First, although IDT voxels werefound in only 3 patients, on average, 85% were ultimatelyinfarcted. As already mentioned, there were substantialultimately noninfarcted IDT voxels in at least 1 patient,but these were considered as misclassified by the auto-matic analysis, on the basis of a visual inspection of theimage sets (see Results and Figure 2), indicating that ourartifact reduction procedure did not always remove alledge artifacts. Second, normally perfused voxels (takenhere as those voxels with ECD uptake > 80% of homolo-gous contralateral voxels) were consistently found in non-infarcted areas, except in 1 patient, in whom 6 hours afterstroke onset 9% of normally perfused voxels turned intoinfarction. Although this may represent statistical noise, itmight also reflect the true deterioration of normallyperfused voxels as a result of secondary physiologicalevents occurring after SPECT, as discussed extensivelyelsewhere.38 Third, the penumbral voxels (defined hereby ECD uptake between 40% and 80%) exhibited theexpected variable fate. In the 3 patients who had bothpenumbral and IDT voxels, 52% to 75% of the penumbralvoxels escaped infarction, especially at the periphery ofthe compromised areas, whereas the remainder evolvedtoward infarction, consistent with their putativelypenumbral conditions. In the remaining 7 patients, how-ever, all the penumbral voxels escaped infarction, whichmay have reflected either a sample effect or the fact thatpart of the voxels classified as penumbral were not at riskfor infarction because of moderately reduced perfusion(oligemia).2 Altogether, these findings concerning the fateof the 3 ECD uptake voxel categories are consistent withboth our hypotheses and the present understanding of thepathophysiology of acute strokes, which supports thevalidity of the thresholds chosen here. We did not attempthere a systematic search for the most accurate threshold,
because the aim of our study was mainly to establish amethod for evaluating any particular threshold of interestin view of clinical applications.
The significant predictive value of the sizes of the tissueclasses defined according to these thresholds for neuro-logical recovery further supports the validity of the latter.Consistent with both our hypotheses and the literature,6
the larger the IDT relative to the hypoperfused area, theworse the recovery, and the larger the penumbral compo-nent, the better the recovery.
The pathophysiological significance of ECD thresh-olds deserves some comments, because ample data haveestablished that ECD uptake only partly reflects perfusionand also reflects cell metabolism.16,22-26 Considering amean normal CBF around 50 mL/100 g/min, our infarc-tion threshold of 40% would correspond to 20 mL/100 g/min. However, PET studies have shown that CBF thresh-old values for at-risk tissue and IDT are around 17 to 20and 8 to 12 mL/100 g/min, respectively.3,4,8 ReportedCBF thresholds obtained with perfusion MRI wereroughly similar, with values about 37% and 12%, respec-tively.39 Regarding SPECT, Umemura et al9 reportedusing a 20 mL/100 g/min CBF threshold for infarction. Intheir series, tissue below this threshold consistentlyevolved toward infarction, even after thrombolysis. WithHMPAO, the estimated degree of uptake reduction thatpredicts infarction or hemorrhagic transformation hasvaried substantially.12,13,16-18 Ueda et al,17,18 in a 5-hour timewindow, determined that thrombolysis-related hemor-rhagic risk is very high in patients with HMPAO uptake of35% of contralateral values. Hirano et al,40 in the first 6hours after stroke onset, reported that a 60% HMPAOuptake was highly predictive of the size of final infarct,independently of the time interval between the onset of astroke and HMPAO SPECT. Regarding ECD, the onlydata have been reported by Nakano et al.41 In a retrospec-tive study of patients treated with low doses of rt-PA, theauthors found that ROIs with ECD uptake < 45% (withthe contralateral cortex as a reference) never escapedinfarction. Although these discrepancies betweenreported PET and SPECT thresholds might be explainedby an overestimation of CBF by SPECT, with bothHMPAO and ECD, the fact that ECD uptake reflectsboth perfusion and cell function needs to be taken intoaccount. Comparisons of ECD SPECT with PET-measured CBF and CMRO2 have shown the highest cor-relation of ECD uptake to be with regional CMRO2.
22-25,42
Furthermore, the retention ratio of Tc 99m ECD dimin-ished according to decreases in oxygen metabolism, soECD can be considered as an indicator of neuronal integ-rity. It has been clearly shown that the threshold for irre-versible tissue damage is considerably higher (relative to
30 Journal of Neuroimaging Vol 14 No 1 January 2004

normal ranges) for CMRO2 than for CBF,4 which is con-sistent with our data because ECD is assumed to at leastpartly reflect cell metabolism. ECD has also been com-pared to HMPAO43,44 and to benzodiazepine receptorimaging using I-123-iomazenil in the subacute stage of astroke. In the subacute stage of a stroke, iomazenil imagesresemble ECD images, suggesting that both tracers reflectneuronal viability.45
Earlier PET studies have shown that tissue with andwithout the potential for recovery can be identified byCMRO2, CBF, and more recently [11C]flumazenil bind-ing.29,38 Our results suggest that ECD uptake can alsoreflect neuronal viability and that ECD SPECT could beuseful for the early detection of potentially salvageable tis-sue and irreversible damage within 12 hours of strokeonset. Moreover, this study suggests that visual analysis,when compared to the voxel-based method, has adequatereliability. This widely applicable technology could thusbe used in the clinical setting for rapid decision making inthe choice of acute therapy (eg, reperfusion or neuro-protection). Until now, decisions have been made only onthe basis of clinical and CT findings.46 However, using areliable imaging marker of neuronal damage couldbroaden the 3-hour time window for thrombolysis andmight help improve the safety of therapy adapted to indi-vidually determined time windows.1 Our preliminaryresults encourage the pursuit of this approach in largerseries.
References
1. Baron JC, von Kummer R, del Zoppo GJ. Treatment ofacute ischemic stroke: challenging the concept of a rigid anduniversal time window. Stroke 1995;26:2219-2221.
2. Baron JC. Mapping the ischaemic penumbra with PET:implications for acute stroke treatment. Cerebrovasc Dis1999;9:193-201.
3. Heiss WD, Thiel A, Grond M, Graf R. Which targets are rel-evant for therapy of acute ischemic stroke? Stroke1999;30:1486-1489.
4. Marchal G, Benali K, Iglesias S, Viader F, Derlon JM, BaronJC. Voxel-based mapping of irreversible ischaemic damagewith PET in acute stroke. Brain 1999;123:2387-2400.
5. Baird AE, Benfield A, Schlaug G, et al. Enlargement ofhuman cerebral ischemic lesion volumes measured by diffu-sion-weighted magnetic resonance imaging. Ann Neurol1997;41:581-589.
6. Ezura M, Takahashi A, Shimizu H, Yoshimoto T. Diffusion-weighted MRI and selection of patients for fibrinolytic ther-apy of acute cerebral ischaemia. Neuroradiology2000;42(5):379-383.
7. Gass A, Gaa J, Sommer A, et al. Echo-planar diffusion-weighted MRI in the diagnosis of acute ischemic stroke:characterisation of tissue abnormalities and limitations in
the interpretation of imaging findings. Radiology1999;39(8):695-702.
8. Heiss WD. Ischemic penumbra: evidence from functionalimaging in man. Cereb Blood Flow and Metab 2000;20:1276-1293.
9. Umemura A, Yamada K, Suzuka T. Quantitative measure-ment of cerebral blood flow by 99mTc-HMPAO SPECT inacute ischemic stroke. J Neurol Neurosurg Psychiatry2000;69:472-478.
10. Alexandrov AV, Masdeu JC, Devous MD, Black SA, GrottaJ. Brain single-photon emission CT with HMPAO andsafety of thrombolytic therapy in acute ischemic stroke.Stroke 1997;28:1830-1834.
11. Ezura M, Takayashi A, Yoshimoto T. Evaluation of regionalcerebral blood flow using single photon emission tomogra-phy for the selection of patients for local fibrinolytic therapyof acute cerebral embolism. Neurosurg Rev 1996;19:231-236.
12. Giubilei F, Lenzi GL, di Piero V, et al. Predictive value ofbrain perfusion single photon emission computed tomogra-phy in acute ischemic stroke. Stroke 1990;211:895-900.
13. Herdershée D, Limburg M, van Royen EA, Hijdra A, BillerA, Koster PA. Thrombolysis with recombinant tissueplasminogen activator in acute ischemic stroke: evaluationwith rCBF-SPECT. Acta Neurol Scand 1991;83:317-322.
14. Mahagne MH, Darcourt J, Migneco O, et al. Early 99mTc-ethylcysteinate dimer brain SPECT patterns in the acutephase of stroke as predictors of neurological recovery.Cerebrovasc Dis 2000;10:364-373.
15. Marchal G, Bouvard G, Iglesias S, et al. Predictive value of99mTc-HMPAO-SPECT for neurological outcome/recov-ery at the acute phase of stroke. Cerebrovasc Dis 2000;10:8-17.
16. Shimosegawa E, Hatazawa J, Inugami A, et al. Cerebralinfarction within six hours of onset: prediction of completedinfarction with technetium-99-m-HMPAO SPECT. J NuclMed 1994;35:1097-1103.
17. Ueda T, Takao H, Kumon Y, Sabaki S, Uraoka T. Evaluationof risk of transformation in local intra-arterial thrombolysisin acute ischemic stroke by initial SPECT. Stroke 1994;25:298-303.
18. Ueda T, Sakaki S, Yuh WT, Noshide I, Ohta S. Outcome inacute stroke with successful intra-arterial thrombolysis andpredictive value of initial single-photon emission computedtomography. J Cereb Blood Flow Metab 1999;19(1):99-108.
19. Barthel H, Hesse S, Dannenberg C, et al. Prospective valueof perfusion and X-ray attenuation imaging with single-pho-ton emission and transmission computed tomography inacute cerebral ischemia. Stroke 2001;32:1588-1597.
20. Berrouschot J, Barthel, Hesse SH, Köster J, Knapp WH,Schneider D. Differentiation between transient ischemicattack and ischemic stroke within the first six hours afteronset of symptoms by using 99mTc-ECD-SPECT. J CerebBlood Flow Metab 1998;18:921-929.
21. Berrouschot J, Barthel H, von Kummer R, Knap WH, HesseS, Schneider D. 99 m technetium-ethyl-cysteinate-dimersingle photon emission CT can predict fatal ischemic brainoedema. Stroke 1998;29(12):2556-2562.
22. Shimosegawa E, Hatazawa J, Aisawa Y, Shouji Y, HachiyaT, Murakami M. Technetium-99m-ECD brain SPECT inmisery perfusion. J Nucl Med 1997;38:791-796.
Mahagne et al: Mapping of Cortical Ischemic Damage 31
23. Shishido F, Uemura K, Murakami M, et al. Cerebral uptakeof 99mTc-bicisate in patients with cerebrovascular diseasein comparison with CBF and CMRO2 measured by positronemission tomography. J Cereb Blood Flow Metab1994;14(suppl 1):S66-S75.
24. Shishido F, Uemura K, Inugami A, et al. Discrepant 99mTc-ECD images of CBF in patients with subacute cerebralinfarction: a comparison of CBF, CMRO2 and 99m-Tc-HMPAO imaging. Ann Nucl Med 1995;3(9):161-166.
25. Yonekura Y, Tsuchida T, Sadato N, et al. Brain perfusionSPECT with 99mTc-bicisate: comparison with PET mea-surement and linearization based on permeability-surfacearea product model. J Cereb Blood Flow Metab 1994;4(suppl1):S58-S65.
26. Yonekura Y, Nishizawa S, Mukai T, et al. SPECT with99mTc-d,1-hexamethyl-propylene amine oxyme(HMPAO) compared with regional cerebral blood flowmeasured by SPECT: effects of linearization. J Cereb BloodFlow Metab 1988;8(suppl 1):82-89.
27. Hatazawa J, Shimozewaga E, Toyoshima H, et al. Cerebralblood volume in acute brain infarction, a combined studywith dynamic susceptibility contrast and 99m Tc-HMPAO-SPECT. Stroke 1999;30:800-806.
28. Baron JC. Perfusion thresholds in human cerebral ischemia:historical perspective and therapeutic implications.Cerebrovasc Dis 2001;11(suppl 1):2-8.
29. Heiss WD, Grond M, Thiel A, et al. Permanent corticaldamage detected by flumazenil positron emission tomogra-phy in acute stroke. Stroke 1998;29:454-461.
30. Martinez-Vila E, Guillen F, Villanueva JA, et al. Placebo-controlled trial of nimodipine in the treatment of acuteischemic cerebral infarction. Stroke 1990;21:1023-1028.
31. Ebisu T, Tanaka C, Umeda M, et al. Hemorrhagic and nonhemorrhagic stroke: diagnosis with diffusion-weighted andT2-weighted echoplanar MR imaging. Radiology1997;203:823-828.
32. Minoshima S, Koeppe RA, Mintun MA, et al. Automateddetection of the intercommissural line for stereotaxic local-ization of functional brain images. J Nucl Med 1993;34:322-329.
33. Pelizzari CA, Chen GTY, Sperbling DR, WeichselbaumRR, Chen CT. Accurate three-dimensional registration ofCT, PET, and/or MR images of the brain. J Comput AssistTomogr 1989;13:20-26.
34. Itti L, Chang L, Mangin JF, Darcourt J, Ernst T. Robustmultimodality registration for brain mapping. Hum BrainMap 1997;5:3-17.
35. Malandrin G, Fernandez-Vidal S, Rocchisani JM. Rigid reg-istration of 3-D objects by motion analysis. Proc 12th Int ConfPattern Recog 1994;579-581.
36. Malandrin G, Fernandez-Vidal S, Rocchisani JM.Improving registration of 3-D images using a mechanicalbased method. Third Eur Conf Comput Vision 1994;131-136.
37. West J, Fitzpatrick M, Wang MY, et al. Comparison andevaluation of retrospective intermodality brain image regis-tration techniques. J Comput Assist Tomogr 1997;21(4):554-566.
38. Heiss WD, Kracht LW, Thiel A, Grond M, Pawlick G.Penumbral probability thresholds of cortical flumazenilbinding and blood flow predicting tissue outcome inpatients with cerebral ischemia. Brain 2001;124:20-29.
39. Schlaug G, Benfield A, Baird AE, et al. The ischemic penum-bra: operationally defined by diffusion and perfusion MRI.Neurology 1999;22;1528-1537.
40. Hirano T, Read SJ, Abott DF, et al. Prediction of the finalinfarct volume within six hours of stroke using single photonemission computed tomography with techtenium-99mhexamethylpropylene amine oxime. Cerebrovasc Dis2001;11:119-127.
41. Nakano S, Iseda T, Ikeda T, Yoneyama T, Wakisaka S.Thresholds of ischemia salvageable with intravenous tissueplasminogen activator therapy: evaluation with cerebralblood flow single-photon emission computed tomographicmeasurements. Neurosurgery 2000;47(1):68-73.
42. Hatazawa J, Shimosewaga E. Imaging neurochemistry ofcerebrovascular diseases with PET and SPECT. Q J Med1998;42(3):193-198.
43. Moretti JL, Caglar M, Weimann P. Cerebral perfusion imag-ing tracers for SPECT: which one to choose? J Nucl Med1995;36:359-363.
44. Ogasawara K, Ogawa A, Ezura M, Konno H, Suzuki M,Yoshimoto T. Brain single-photon emission CT studies using99mTc-H M PAO and 99mTc-ECD early af terrecanalization by local intraarterial thrombolysis in patientswith acute embolic middle cerebral artery occlusion. Am JNeuroradiol 2001;22(1):48-53.
45. Dong Y, Fukuyama H, Nabatame H, Yamaguchi H,Shibasaki H, Yonekura Y. Assessment of benzodiazepinereceptors using iodine-123-labelled iomazenil single-photonemission computed tomography in patients with ischemiccerebrovascular disease. A comparison with PET study.Stroke 1997;28(9):1776-1782.
46. von Kummer R, Weber J. Brain and vascular imaging inacute ischemic stroke: the potential of computed tomogra-phy. Neurology 1997;49(suppl 4):S52-S55.
32 Journal of Neuroimaging Vol 14 No 1 January 2004