Volumetric and Thermodynamic Properties of Liquid Mixtures of 2- n -Butoxyethanol with Water
24
International Journal of Thermophysics, Vol. 19, No. 1, 1998 Volumetric and Thermodynamic Properties of Liquid Mixtures of 2-n-Butoxyethanol with Water P. J. Back, 1 R. Malhotra, 1 and L. A. Woolf 1, 2 1 Atomic and Molecular Physics Laboratories, Research School of Physical Sciences and Engineering, Australian National University, Canberra, ACT 0200, Australia. 2 To whom correspondence should be addressed. 191 0195-928X/00/0700-0191$18.00/0 C 2000 Plenum Publishing Corporation Received August 22, 1997 p-V-T data for six compositions of 2-n-butoxyethanol (BE) and water have been obtained in the form of volume ratios at several temperatures in the range 278.15 to 353.13 K at pressures from atmospheric to 347 MPa or higher. One of the compositions is in the region where two phases exist at certain temperatures, while two compositions are near the boundary of that region. Densities at atmospheric pressure in a temperature range similar to that for the p-V-T data are also reported. Isothermal compressibilities, isobaric expansivities, and changes in the isobaric heat capacity have been calculated from the volumetric data for pressures up to 300 MPa. The values of normalized volume fluctuations obtained from the data at 0.1 MPa approach those of water for conditions which are close to those for phase separation in this system. Such behavior is not observed at 100 MPa, where such separation is suppressed. KEY WORDS: compressibility; expansivities; 2-n-butoxyethanol; heat capacity; p-V-T data; Tait equation; volume fluctuations. 1. INTRODUCTION Although this system has been studied extensively at pressures close to atmospheric, there are few data for its properties at high pressures. This work was performed principally to provide p-V-T data for the study by Mensah-Brown and Wakeham [ 1 ] of the effect of pressure on the thermal conductivity of mixtures of 2-n-butoxyethanol (BE) and water. Accor- dingly, two of the six compositions of the present work were close to but
-
Upload
independent -
Category
Documents
-
view
2 -
download
0
Transcript of Volumetric and Thermodynamic Properties of Liquid Mixtures of 2- n -Butoxyethanol with Water
International Journal of Thermophysics, Vol. 19, No. 1, 1998
Volumetric and Thermodynamic Properties of LiquidMixtures of 2-n-Butoxyethanol with Water
P. J. Back,1 R. Malhotra,1 and L. A. Woolf1, 2
1 Atomic and Molecular Physics Laboratories, Research School of Physical Sciences andEngineering, Australian National University, Canberra, ACT 0200, Australia.
2 To whom correspondence should be addressed.
191
0195-928X/00/0700-0191$18.00/0 C 2000 Plenum Publishing Corporation
Received August 22, 1997
p-V-T data for six compositions of 2-n-butoxyethanol (BE) and water havebeen obtained in the form of volume ratios at several temperatures in the range278.15 to 353.13 K at pressures from atmospheric to 347 MPa or higher. One ofthe compositions is in the region where two phases exist at certain temperatures,while two compositions are near the boundary of that region. Densities atatmospheric pressure in a temperature range similar to that for the p-V-T dataare also reported. Isothermal compressibilities, isobaric expansivities, andchanges in the isobaric heat capacity have been calculated from the volumetricdata for pressures up to 300 MPa. The values of normalized volume fluctuationsobtained from the data at 0.1 MPa approach those of water for conditionswhich are close to those for phase separation in this system. Such behavior isnot observed at 100 MPa, where such separation is suppressed.
KEY WORDS: compressibility; expansivities; 2-n-butoxyethanol; heat capacity;p-V-T data; Tait equation; volume fluctuations.
1. INTRODUCTION
Although this system has been studied extensively at pressures close toatmospheric, there are few data for its properties at high pressures. Thiswork was performed principally to provide p-V-T data for the study byMensah-Brown and Wakeham [ 1 ] of the effect of pressure on the thermalconductivity of mixtures of 2-n-butoxyethanol (BE) and water. Accor-dingly, two of the six compositions of the present work were close to but
outside opposite sides of the concentration region at which phase separa-tion occurs [2-4] at atmospheric and higher pressures. Another composi-tion was close to that of the lower consolute mixture and measurements forthis mixture were made at temperatures extending to close to the lowerconsolute temperature at 0.1 MPa. (At 0.1 MPa the two-phase region existsfor a small range of water-rich compositions at temperatures betweenabout 322.3 and 403.3 K.) An extensive series of density measurements at0.1 MPa has been made to assist the interpretation of the results at higherpressures. These data have enabled the effect of pressure and temperatureon volume fluctuations in the system to be determined. An earlier paper[5] reported p-V-T measurements for pure BE.
2. EXPERIMENTAL
The BE was Fluka Chemika HPLC-GC grade material of statedpurity <99.9% mol, which, before use, was fractionally distilled underreduced pressure in an argon atmosphere and then stored under helium.Temperatures were measured relative to IPTS-68 and converted to ITS90;they had an accuracy of +0.01 K and were constant within +0.005 K.Volume ratios k=V p /V 0 . 1 , with Vp and V0.1, the volumes of a fixed massof liquid at pressure p and 0.1 MPa, respectively, were measured with anautomated bellows volumometer described in detail elsewhere [6].
A summary of the pressure measurement system is given in Ref. 7.Densities at atmospheric pressure (0.093 to 0.095 MPa) were measured forsamples taken from the volumometer at the conclusion of the experimentsfor each composition with a reproducibility of +0.005 kg.m - 3 with anAnton Paar Model DMA 602 densimeter calibrated frequently with waterand dry nitrogen [8]. Measurements were also made for a series ofstandard solutions to enable determination of the composition of thevolumometer samples.
3. RESULTS AND DISCUSSION
3.1. Volumetric Data
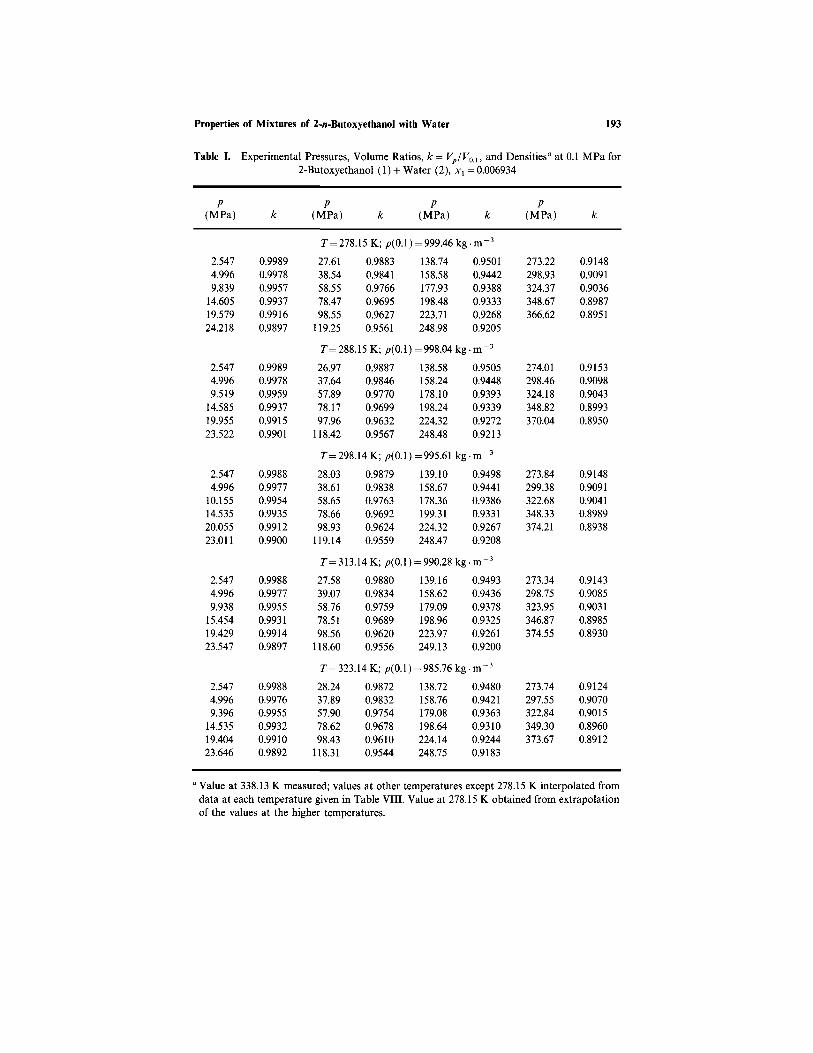
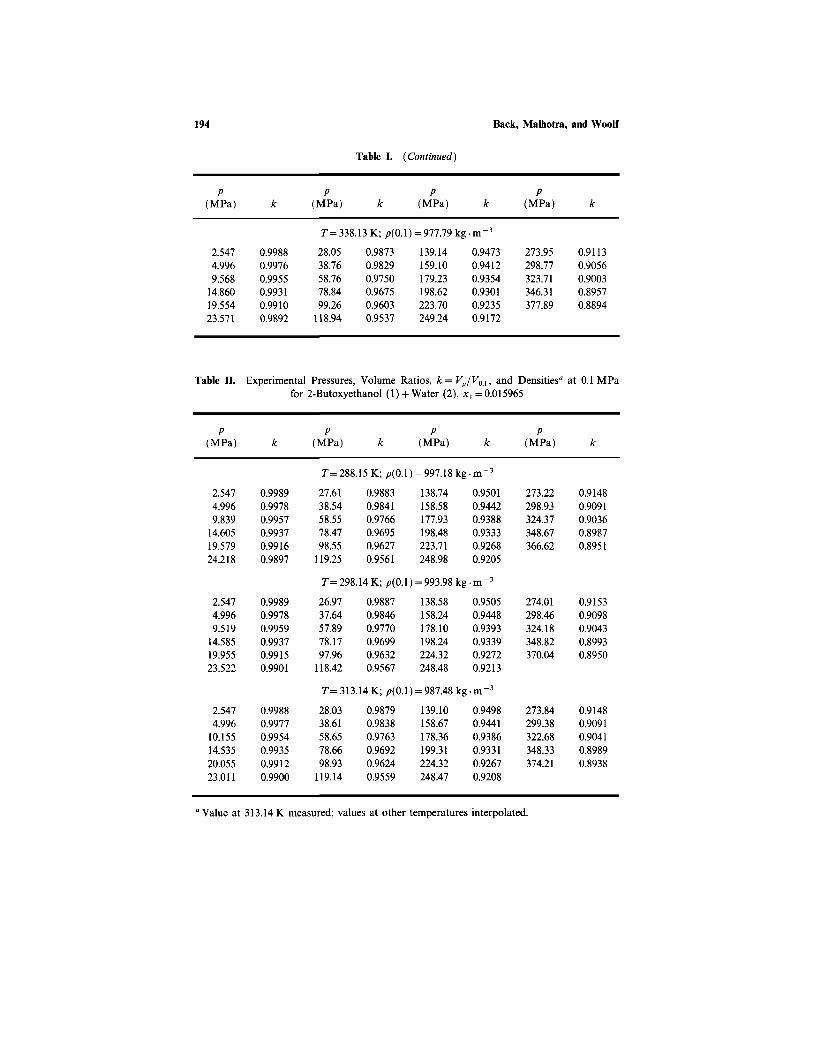
The experimental pressures, temperatures, and volume ratios are givenin Tables I-VI for each mole fraction, x1, of BE. The molecular weightswhich were used were 0.118767 and 0.0180153 kg.mol for BE and water,respectively. For the system with x1 = 0.04826 the highest temperature usedwas 322.14 K, which is about 0.1 K below the temperature at 0.1 MPa atwhich a phase separation is expected [4], which persists to a temperaturewell above the highest attainable with the present volumometer [6]. The
192 Back, Malhotra, and Woolf
Properties of Mixtures of 2-n-Butoxyethanol with Water 193
Table I. Experimental Pressures, Volume Ratios, k = V p /V 0 . 1 , and Densitiesa at 0.1 MPa for2-Butoxyethanol (1) + Water (2), x1 =0.006934
p(MPa) k
p(MPa) k
p(MPa) k
p(MPa) k
T = 278.15 K; p(0.1) = 999.46 kg . m-3
2.5474.9969.839
14.60519.57924.218
0.99890.99780.99570.99370.99160.9897
27.6138.5458.5578.4798.55
119.25
0.98830.98410.97660.96950.96270.9561
138.74158.58177.93198.48223.71248.98
0.95010.94420.93880.93330.92680.9205
273.22298.93324.37348.67366.62
0.91480.90910.90360.89870.8951
T= 288.15 K; p(0.1) = 998.04 kg.m - 3
2.5474.9969.519
14.58519.95523.522
0.99890.99780.99590.99370.99150.9901
26.9737.6457.8978.1797.96
118.42
0.98870.98460.97700.96990.96320.9567
138.58158.24178.10198.24224.32248.48
0.95050.94480.93930.93390.92720.9213
274.01298.46324.18348.82370.04
0.91530.90980.90430.89930.8950
T=298.14 K; p(0.1) =995.61 kg . m-3
2.5474.996
10.15514.53520.05523.011
0.99880.99770.99540.99350.99120.9900
28.0338.6158.6578.6698.93
119.14
0.98790.98380.97630.96920.96240.9559
139.10158.67178.36199.31224.32248.47
0.94980.94410.93860.93310.92670.9208
273.84299.38322.68348.33374.21
0.91480.90910.90410.89890.8938
T=313.14K; p(0.1 ) = 990.28 kg . m-3
2.5474.9969.938
15.45419.42923.547
0.99880.99770.99550.99310.99140.9897
27.5839.0758.7678.5198.56
118.60
0.98800.98340.97590.96890.96200.9556
139.16158.62179.09198.96223.97249.13
0.94930.94360.93780.93250.92610.9200
273.34298.75323.95346.87374.55
0.91430.90850.90310.89850.8930
T= 323.14 K; p(0.1) = 985.76 kg . m-3
2.5474.9969.396
14.53519.40423.646
0.99880.99760.99550.99320.99100.9892
28.2437.8957.9078.6298.43
118.31
0.98720.98320.97540.96780.96100.9544
138.72158.76179.08198.64224.14248.75
0.94800.94210.93630.93100.92440.9183
273.74297.55322.84349.30373.67
0.91240.90700.90150.89600.8912
a Value at 338.13 K measured; values at other temperatures except 278.15 K interpolated fromdata at each temperature given in Table VIII. Value at 278.15 K obtained from extrapolationof the values at the higher temperatures.
194 Back, Malhotra, and Woolf
Table I. (Continued)
p(MPa) k
p(MPa) k
p(MPa) k
p(MPa) k
T= 338.13 K; p(0.1) = 977.79 kg • m-3
2.5474.9969.56814.86019.55423.571
0.99880.99760.99550.99310.99100.9892
28.0538.7658.7678.8499.26118.94
0.98730.98290.97500.96750.96030.9537
139.14159.10179.23198.62223.70249.24
0.94730.94120.93540.93010.92350.9172
273.95298.77323.71346.31377.89
0.91130.90560.90030.89570.8894
Table II. Experimental Pressures, Volume Ratios, k= Vp/V0 . 1 , and Densitiesa at 0.1 MPafor 2-Butoxyethanol (1) + Water (2), x1 = 0.015965
p(MPa) k
p(MPa) k
p(MPa) k
p(MPa) k
T= 288.15 K; p(0.1) = 997.18 kg . m-3
2.5474.9969.839
14.60519.57924.218
0.99890.99780.99570.99370.99160.9897
27.6138.5458.5578.4798.55
119.25
0.98830.98410.97660.96950.96270.9561
138.74158.58177.93198.48223.71248.98
0.95010.94420.93880.93330.92680.9205
273.22298.93324.37348.67366.62
0.91480.90910.90360.89870.8951
T=298.14 K; p(0.1) = 993.98kg.m-3
2.5474.9969.519
14.58519.95523.522
0.99890.99780.99590.99370.99150.9901
26.9737.6457.8978.1797.96
118.42
0.98870.98460.97700.96990.96320.9567
138.58158.24178.10198.24224.32248.48
0.95050.94480.93930.93390.92720.9213
274.01298.46324.18348.82370.04
0.91530.90980.90430.89930.8950
T= 313.14 K; p(0 .1 ) = 987.48 kg . m-3
2.5474.996
10.15514.53520.05523.011
0.99880.99770.99540.99350.99120.9900
28.0338.6158.6578.6698.93
119.14
0.98790.98380.97630.96920.96240.9559
139.10158.67178.36199.31224.32248.47
0.94980.94410.93860.93310.92670.9208
273.84299.38322.68348.33374.21
0.91480.90910.90410.89890.8938
aValue at 313.14 K measured; values at other temperatures interpolated.
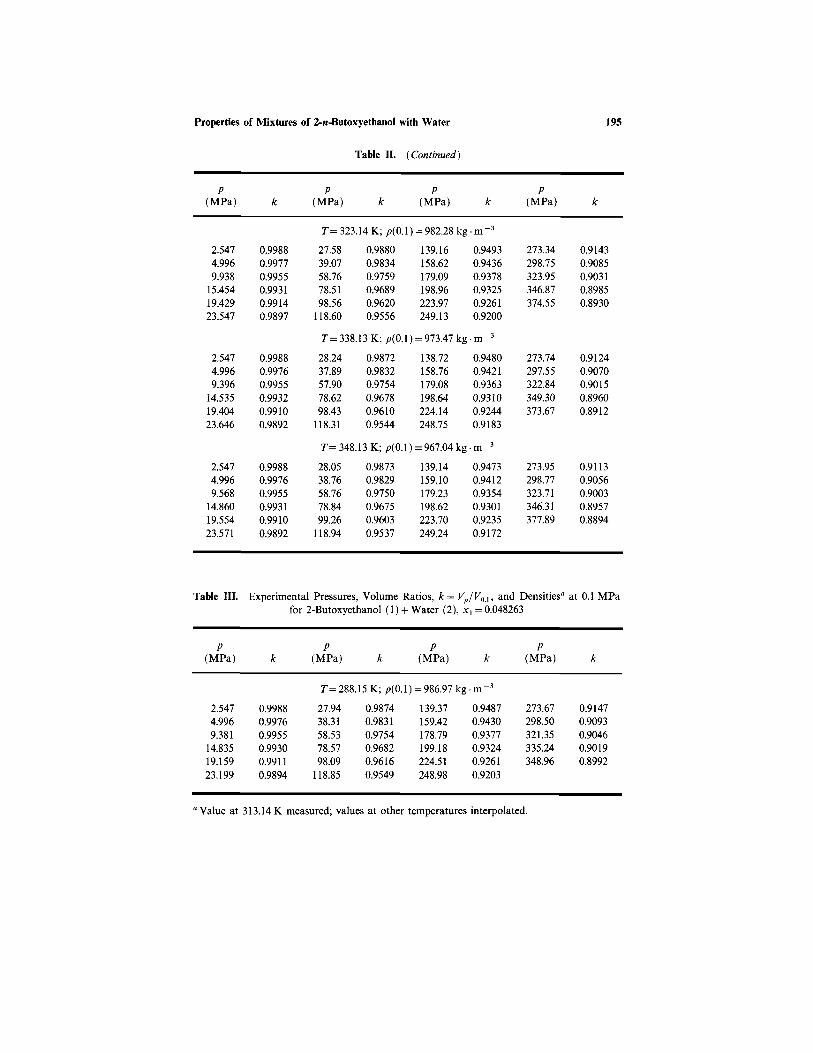
Properties of Mixtures of 2-n-Butoxyethanol with Water 195
Table II. (Continued)
p(MPa) k
p(MPa) k
p(MPa) k
p(MPa) k
T= 323.14 K; p(0.1) = 982.28 kg.m-3
2.5474.9969.93815.45419.42923.547
0.99880.99770.99550.99310.99140.9897
27.5839.0758.7678.5198.56118.60
0.98800.98340.97590.96890.96200.9556
139.16158.62179.09198.96223.97249.13
0.94930.94360.93780.93250.92610.9200
273.34298.75323.95346.87374.55
0.91430.90850.90310.89850.8930
T= 338.13 K; p(0.1) = 973.47 kg . m-3
2.5474.9969.39614.53519.40423.646
0.99880.99760.99550.99320.99100.9892
28.2437.8957.9078.6298.43118.31
0.98720.98320.97540.96780.96100.9544
138.72158.76179.08198.64224.14248.75
0.94800.94210.93630.93100.92440.9183
273.74297.55322.84349.30373.67
0.91240.90700.90150.89600.8912
T=348.13K; p(0.1) = 967.04 kg . m-3
2.5474.9969.56814.86019.55423.571
0.99880.99760.99550.99310.99100.9892
28.0538.7658.7678.8499.26118.94
0.98730.98290.97500.96750.96030.9537
139.14159.10179.23198.62223.70249.24
0.94730.94120.93540.93010.92350.9172
273.95298.77323.71346.31377.89
0.91130.90560.90030.89570.8894
Table III. Experimental Pressures, Volume Ratios, k= V p /V 0 . 1 , and Densitiesa at 0.1 MPafor 2-Butoxyethanol (1) + Water (2), x1 = 0.048263
p(MPa) k
p(MPa) k
p(MPa) k
p(MPa) k
T= 288.15 K; p(0.1) = 986.97 kg . m-3
2.5474.9969.381
14.83519.15923.199
0.99880.99760.99550.99300.99110.9894
27.9438.3158.5378.5798.09
118.85
0.98740.98310.97540.96820.96160.9549
139.37159.42178.79199.18224.51248.98
0.94870.94300.93770.93240.92610.9203
273.67298.50321.35335.24348.96
0.91470.90930.90460.90190.8992
a Value at 313.14 K measured; values at other temperatures interpolated.

196 Back, Malhotra, and Woolf
Table III. (Continued)
p(MPa) k
p(MPa) k
p(MPa) k
p(MPa) k
T= 298.14 K; p(0.1) = 981.65 kg.m-3
2.5474.9969.14514.36419.42423.701
0.99870.99760.99560.99320.99090.9890
28.2138.5059.0178.9599.00119.03
0.98710.98280.97480.96760.96070.9543
138.58158.56178.92199.03224.14249.47
0.94830.94250.93690.93170.92540.9193
274.05297.65321.47332.95347.48
0.91370.90860.90360.90130.8985
T = 313.14 K; p(0.1) = 972.92 kg . m-3
2.5474.9969.41015.00019.73523.776
0.99870.99750.99530.99260.99040.9886
27.8538.1157.9077.8197.97118.16
0.98680.98240.97440.96700.96000.9533
138.15158.58178.33199.01223.80248.79
0.94710.94110.93560.93010.92380.9177
274.06298.19323.80349.11373.48
0.91190.90650.90120.89610.8913
T = 322.14 K; p(0.1 ) = 966.92 kg.m-3
2.5474.9969.31715.20219.64923.666
0.99870.99740.99520.99230.99020.9883
28.0238.3159.0578.7696.71117.07
0.98630.98180.97330.96590.95950.9527
138.24159.10178.82199.32224.55249.85
0.94600.93980.93420.92860.92210.9160
273.28299.41323.99346.57379.42
0.91050.90470.89950.89500.8885
Table IV. Experimental Pressures, Volume Ratios, k= V p /V 0 . 1 , and Densitiesa at 0.1 MPafor 2-Butoxyethanol (1) + Water (2), x1= 0.17484
p(MPa) k
p(MPa) k
p(MPa) k
p(MPa) k
T= 288.15 K; p(0.1) = 957.48 kg • m-3
2.5474.9969.716
14.72719.56423.726
0.99860.99730.99480.99220.98980.9878
28.6838.6559.3778.9399.44
119.31
0.98550.98100.97230.96490.95760.9510
138.92158.79179.85199.99225.23249.55
0.94490.93910.93320.92790.92170.9159
274.16299.23323.87347.22367.62
0.91040.90510.90010.89550.8917
aValue at 313.14 K measured; values at other temperatures except 353.13 K interpolated.Value at 353.13 K extrapolated from p(0.1) at lower temperatures.
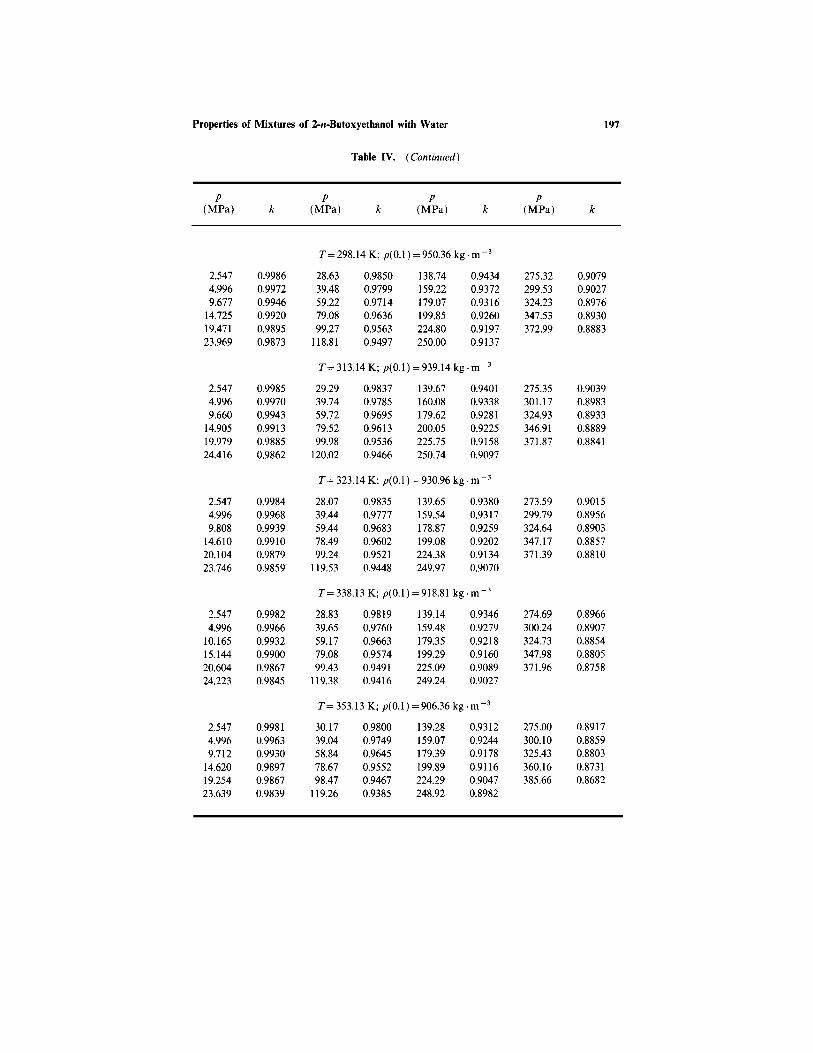
Properties of Mixtures of 2-n-Butoxyethanol with Water 197
Table IV. (Continued)
p(MPa) k
p(MPa) k
p(MPa) k
p(MPa) k
T=298.14K; p(0.1) = 950.36 kg.m-3
2.5474.9969.67714.72519.47123.969
0.99860.99720.99460.99200.98950.9873
28.6339.4859.2279.0899.27118.81
0.98500.97990.97140.96360.95630.9497
138.74159.22179.07199.85224.80250.00
0.94340.93720.93160.92600.91970.9137
275.32299.53324.23347.53372.99
0.90790.90270.89760.89300.8883
T=313.14K; p(O.l) = 939.14 kg.m-3
2.5474.9969.66014.90519.97924.416
0.99850.99700.99430.99130.98850.9862
29.2939.7459.7279.5299.98120.02
0.98370.97850.96950.96130.95360.9466
139.67160.08179.62200.05225.75250.74
0.94010.93380.92810.92250.91580.9097
275.35301.17324.93346.91371.87
0.90390.89830.89330.88890.8841
T = 323.14 K; p(0.1) = 930.96 kg • m-3
2.5474.9969.80814.61020.10423.746
0.99840.99680.99390.99100.98790.9859
28.0739.4459.4478.4999.24119.53
0.98350.97770.96830.96020.95210.9448
139.65159.54178.87199.08224.38249.97
0.93800.93170.92590.92020.91340.9070
273.59299.79324.64347.17371.39
0.90150.89560.89030.88570.8810
T= 338.13 K; p(0.1) = 918.81 kg.m-3
2.5474.99610.16515.14420.60424.223
0.99820.99660.99320.99000.98670.9845
28.8339.6559.1779.0899.43119.38
0.98190.97600.96630.95740.94910.9416
139.14159.48179.35199.29225.09249.24
0.93460.92790.92180.91600.90890.9027
274.69300.24324.73347.98371.96
0.89660.89070.88540.88050.8758
T= 353.13 K; p(0.1) = 906.36 kg.m-3
2.5474.9969.71214.62019.25423.639
0.99810.99630.99300.98970.98670.9839
30.1739.0458.8478.6798.47119.26
0.98000.97490.96450.95520.94670.9385
139.28159.07179.39199.89224.29248.92
0.93120.92440.91780.91160.90470.8982
275.00300.10325.43360.16385.66
0.89170.88590.88030.87310.8682
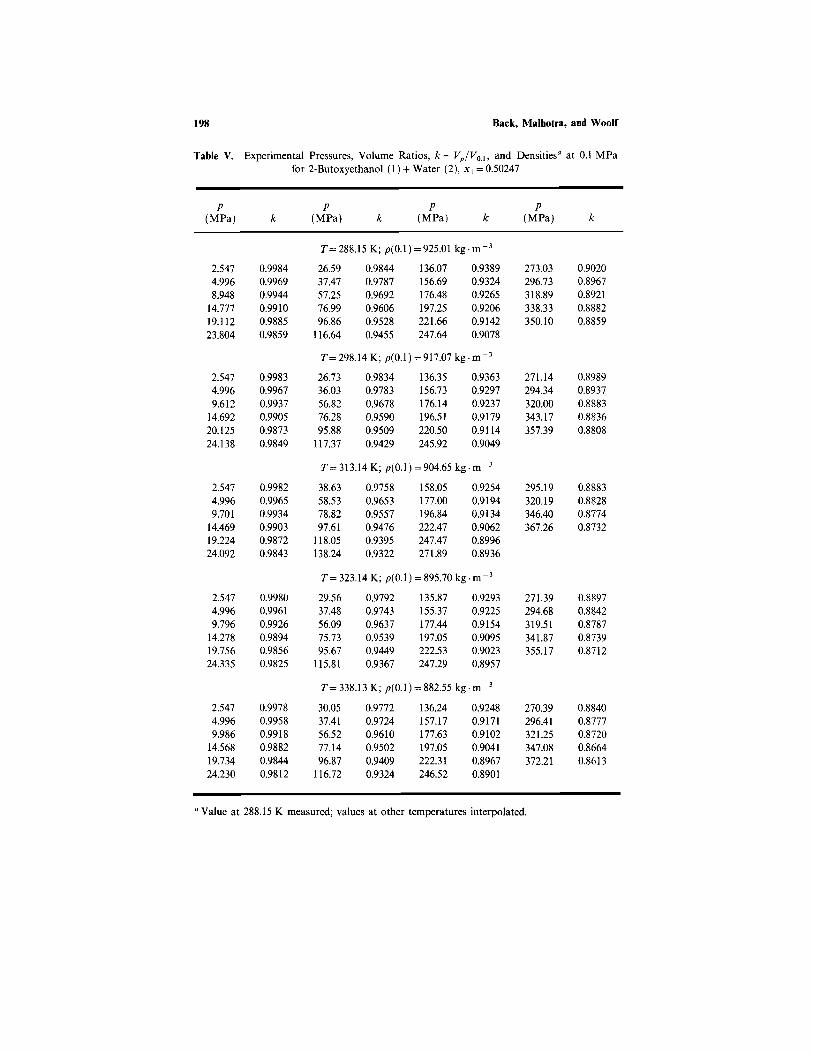
198 Back, Malhotra, and Woolf
Table V. Experimental Pressures, Volume Ratios, k= Vp/V0.1, and Densitiesa at 0.1 MPafor 2-Butoxyethanol (1) + Water (2), x1=0.50247
p(MPa) k
p(MPa) k
p(MPa) k
p(MPa) k
T=288.15 K; p(0.1) = 925.01 kg.m - 3
2.5474.9968.948
14.77719.11223.804
0.99840.99690.99440.99100.98850.9859
26.5937.4757.2576.9996.86
116.64
0.98440.97870.96920.96060.95280.9455
136.07156.69176.48197.25221.66247.64
0.93890.93240.92650.92060.91420.9078
273.03296.73318.89338.33350.10
0.90200.89670.89210.88820.8859
T= 298.14 K; p (0 .1) = 917.07 kg . m-3
2.5474.9969.612
14.69220.12524.138
0.99830.99670.99370.99050.98730.9849
26.7336.0356.8276.2895.88
117.37
0.98340.97830.96780.95900.95090.9429
136.35156.73176.14196.51220.50245.92
0.93630.92970.92370.91790.91140.9049
271.14294.34320.00343.17357.39
0.89890.89370.88830.88360.8808
T=313.14 K; p(0.1 ) = 904.65 kg . m-3
2.5474.9969.701
14.46919.22424.092
0.99820.99650.99340.99030.98720.9843
38.6358.5378.8297.61
118.05138.24
0.97580.96530.95570.94760.93950.9322
158.05177.00196.84222.47247.47271.89
0.92540.91940.91340.90620.89960.8936
295.19320.19346.40367.26
0.88830.88280.87740.8732
T= 323.14 K; p(0.1) = 895.70 kg . m-3
2.5474.9969.796
14.27819.75624.335
0.99800.99610.99260.98940.98560.9825
29.5637.4856.0975.7395.67
115.81
0.97920.97430.96370.95390.94490.9367
135.87155.37177.44197.05222.53247.29
0.92930.92250.91540.90950.90230.8957
271.39294.68319.51341.87355.17
0.88970.88420.87870.87390.8712
T= 338.13 K; p(0.1) = 882.55 kg . m-3
2.5474.9969.986
14.56819.73424.230
0.99780.99580.99180.98820.98440.9812
30.0537.4156.5277.1496.87
116.72
0.97720.97240.96100.95020.94090.9324
136.24157.17177.63197.05222.31246.52
0.92480.91710.91020.90410.89670.8901
270.39296.41321.25347.08372.21
0.88400.87770.87200.86640.8613
a Value at 288.15 K measured; values at other temperatures interpolated.
Properties of Mixtures of 2-n-Butoxyethanol with Water 199
Table V. (Continued)
p(MPa) k
p(MPa) k
p(MPa) k
p(MPa) k
T= 348.13 K; p(0.1) = 873.55 kg.m-3
2.5474.9969.48914.59619.82323.608
0.99770.99560.99180.98760.98350.9807
25.5939.7856.3777.0496.58116.10
0.97930.96950.95940.94820.93870.9300
137.14156.15176.32195.55222.82246.71
0.92150.91430.90720.90100.89270.8861
270.27295.80320.22349.32376.44
0.88000.87380.86820.86190.8565
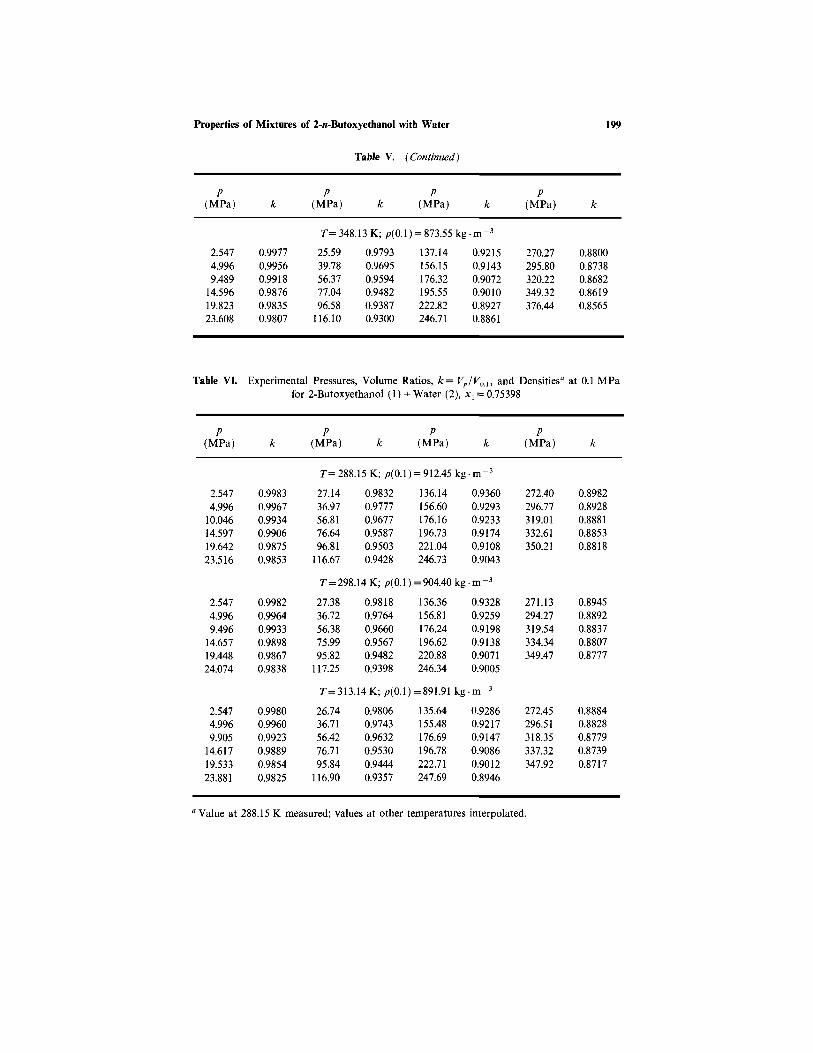
Table VI. Experimental Pressures, Volume Ratios, k= Vp/V0.1, and Densitiesa at 0.1 MPafor 2-Butoxyethanol (1) + Water (2), x1 = 0.75398
p(MPa) k
p(MPa) k
p(MPa) k
p(MPa) k
T= 288.15 K; p(0.1) = 912.45 kg.m - 3
2.5474.996
10.04614.59719.64223.516
0.99830.99670.99340.99060.98750.9853
27.1436.9756.8176.6496.81
116.67
0.98320.97770.96770.95870.95030.9428
136.14156.60176.16196.73221.04246.73
0.93600.92930.92330.91740.91080.9043
272.40296.77319.01332.61350.21
0.89820.89280.88810.88530.8818
T = 298.14K; p ( 0 . 1 ) = 904.40 kg . m-3
2.5474.9969.496
14.65719.44824.074
0.99820.99640.99330.98980.98670.9838
27.3836.7256.3875.9995.82
117.25
0.98180.97640.96600.95670.94820.9398
136.36156.81176.24196.62220.88246.34
0.93280.92590.91980.91380.90710.9005
271.13294.27319.54334.34349.47
0.89450.88920.88370.88070.8777
T=313.14K; p(0.1) =891.91 kg.m - 3
2.5474.9969.905
14.61719.53323.881
0.99800.99600.99230.98890.98540.9825
26.7436.7156.4276.7195.84
116.90
0.98060.97430.96320.95300.94440.9357
135.64155.48176.69196.78222.71247.69
0.92860.92170.91470.90860.90120.8946
272.45296.51318.35337.32347.92
0.88840.88280.87790.87390.8717
aValue at 288.15 K measured; values at other temperatures interpolated.
200 Back, Malhotra, and Woolf
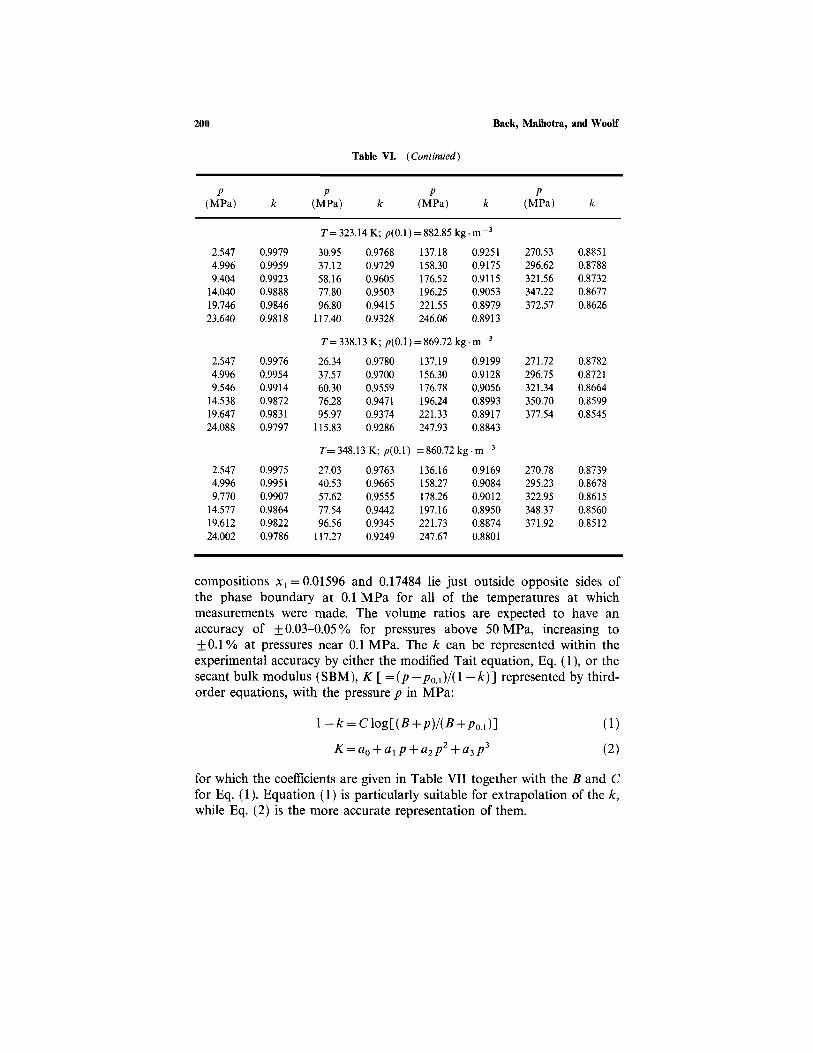
compositions x1 = 0.01596 and 0.17484 lie just outside opposite sides ofthe phase boundary at 0.1 MPa for all of the temperatures at whichmeasurements were made. The volume ratios are expected to have anaccuracy of +0.03-0.05% for pressures above 50 MPa, increasing to+ 0.1% at pressures near 0.1 MPa. The k can be represented within theexperimental accuracy by either the modified Tait equation, Eq. (1), or thesecant bulk modulus (SBM), K [ =(p — p 0 . 1 ) / (1 — k)] represented by third-order equations, with the pressure p in MPa:
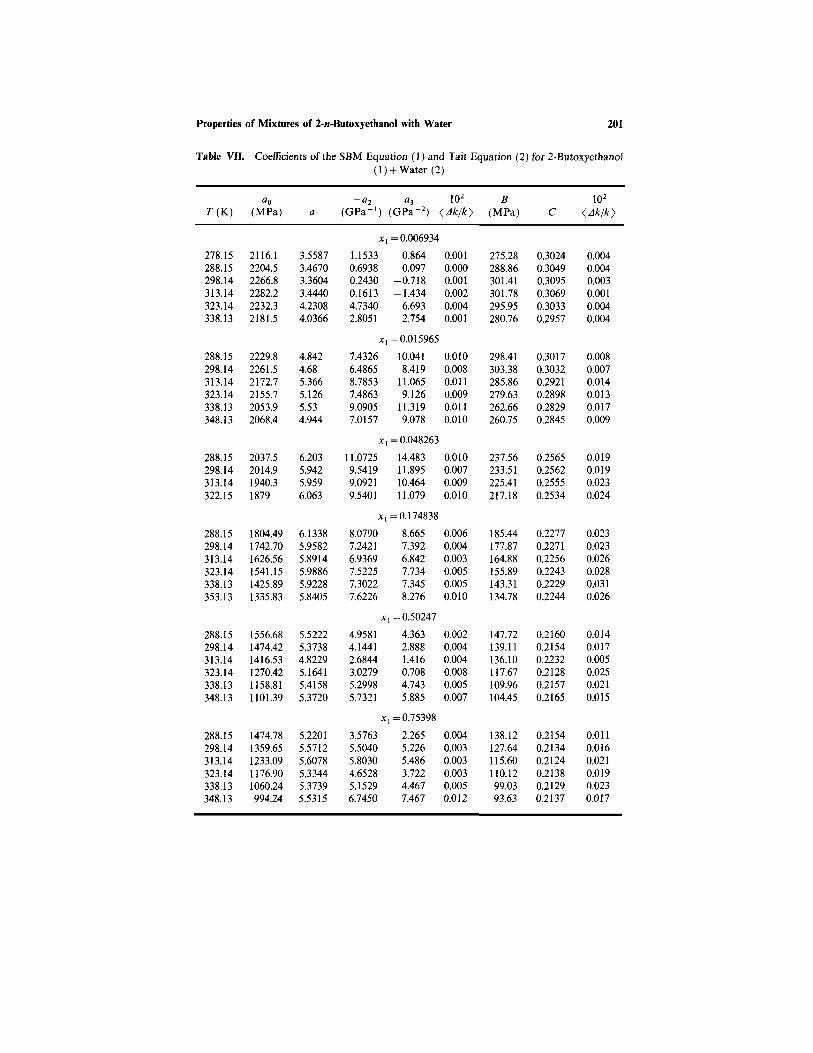
for which the coefficients are given in Table VII together with the B and Cfor Eq. (1). Equation (1) is particularly suitable for extrapolation of the k,while Eq. (2) is the more accurate representation of them.
Table VI. (Continued)
p(MPa) k
p(MPa) k
p(MPa) k
p(MPa) k
T= 323.14 K; p(0.1) = 882.85 kg . m-3
2.5474.9969.404
14.04019.74623.640
0.99790.99590.99230.98880.98460.9818
30.9537.1258.1677.8096.80
117.40
0.97680.97290.96050.95030.94150.9328
137.18158.30176.52196.25221.55246.06
0.92510.91750.91150.90530.89790.8913
270.53296.62321.56347.22372.57
0.88510.87880.87320.86770.8626
T=338.13 K; p(0.1) = 869.72 kg .m - 3
2.5474.9969.546
14.53819.64724.088
0.99760.99540.99140.98720.98310.9797
26.3437.5760.3076.2895.97
115.83
0.97800.97000.95590.94710.93740.9286
137.19156.30176.78196.24221.33247.93
0.91990.91280.90560.89930.89170.8843
271.72296.75321.34350.70377.54
0.87820.87210.86640.85990.8545
T= 348.13 K; p(0.1) =860.72 kg.m - 3
2.5474.9969.770
14.57719.61224.002
0.99750.99510.99070.98640.98220.9786
27.0340.5357.6277.5496.56
117.27
0.97630.96650.95550.94420.93450.9249
136.16158.27178.26197.16221.73247.67
0.91690.90840.90120.89500.88740.8801
270.78295.23322.95348.37371.92
0.87390.86780.86150.85600.8512
Properties of Mixtures of 2-n-Butoxyethanol with Water 201
Table VII. Coefficients of the SBM Equation (1) and Tait Equation (2) for 2-Butoxyethanol(1) + Water (2)
T ( K )a0
(MPa) a1
-a2(GPa-1)
a3
(GPa-2)102
(Dk/k)B
(MPa) C102
<Dk/k>
x1 =0.006934
278.15288.15298.14313.14323.14338.13
2116.12204.52266.82282.22232.32181.5
3.55873.46703.36043.44404.23084.0366
1.15330.69380.24300.16134.73402.8051
0.8640.097
-0.718-1.434
6.6932.754
0.0010.0000.0010.0020.0040.001
275.28288.86301.41301.78295.95280.76
0.30240.30490.30950.30690.30330.2957
0.0040.0040.0030.0010.0040.004
x1= 0.015965
288.15298.14313.14323.14338.13348.13
2229.82261.52172.72155.72053.92068.4
4.8424.685.3665.1265.534.944
7.43266.48658.78537.48639.09057.0157
10.0418.419
11.0659.126
11.3199.078
0.0100.0080.0110.0090.0110.010
298.41303.38285.86279.63262.66260.75
0.30170.30320.29210.28980.28290.2845
0.0080.0070.0140.0130.0170.009
x1 =0.048263
288.15298.14313.14322.15
2037.52014.91940.31879
6.2035.9425.9596.063
11.07259.54199.09219.5401
14.48311.89510.46411.079
0.0100.0070.0090.010
237.56233.51225.41217.18
0.25650.25620.25550.2534
0.0190.0190.0230.024
x1= 0.174838
288.15298.14313.14323.14338.13353.13
1804.491742.701626.561541.151425.891335.83
6.13385.95825.89145.98865.92285.8405
8.07907.24216.93697.52257.30227.6226
8.6657.3926.8427.7347.3458.276
0.0060.0040.0030.0050.0050.010
185.44177.87164.88155.89143.31134.78
0.22770.22710.22560.22430.22290.2244
0.0230.0230.0260.0280.0310.026
x1 =0.50247
288.15298.14313.14323.14338.13348.13
1556.681474.421416.531270.421158.811101.39
5.52225.37384.82295,16415.41585.3720
4.95814.14412.68443.02795.29985.7321
4.3632.8881.4160.7084.7435.885
0.0020.0040.0040.0080.0050.007
147.72139.11136.10117. 67109.96104.45
0.21600.21540.22320.21280.21570.2165
0.0140.0170.0050.0250.0210.015
x1= 0.75398
288.15298.14313.14323.14338.13348.13
1474.781359.651233.091176.901060.24994.24
5.22015.57125.60785.33445.37395.5315
3.57635.50405.80304.65285.15296.7450
2.2655.2265.4863.7224.4677.467
0.0040.0030.0030.0030.0050.012
138.12127.64115.60110.1299.0393.63
0.21540.21340.21240.21380.21290.2137
0.0110.0160.0210.0190.0230.017
202 Back, Malhotra, and Woolf
Table VIII. Density, p(0.1) (kg.m-3), for 2-Butoxyethanol (1) + Water (2) at 0.1 MPaa
X1 p(0.1) x1 p(0.1) x1 p(0.1) x1 p(0.1)
T = 288.15K
00.0010290.0049770.0096850.0148870.0198440.0249460.0302900.049564
999.099998.894998.276997.764997.293996.576995.110993.246986.538
0.0894730.1818280.2532010.3011380.3670680.3980200.4291650.4510910.506773
974.891956.366946.504941.169934.964932.369930.061928.405924.714
0.5471470.5939330.6474690.7015930.7467870.7992550.8456230.8883200.950764
922.300919.769917.090914.625912.734910.711909.081907.693905.795
0.9811080.9835760.9872630.9917180.9958110.9990821
904.930904.874904.775904.603904.516904.423904.412
T = 298.14 K
00.0095800.0160450.019560
997.044995.173993.963992.874
0.0468030.0488060.0550230.168653
982.183981.449979.246951.406
0.1774160.5005540.5460720.447247
949.924917.188914.416920.803
0.6905360.7395150.7907451
907.086904.988902.984896.289
T=313.14K
00.0008670.0051380.0096840.0105810.0157120.016140
992.215991.956990.763989.560989.331987.588987.406
0.0164340.0190120.0298640.0300150.0386310.050930
987.276986.096980.916980.846976.943971.809
0.0607600.0990290.1097250.1236030.1560500.162370
968.050955.935953.042949.615942.648941.413
0.1811330.1959900.3983370.5977120.8147711
937.994935.490912.258899.069889.602883.775
T= 322.14 K
00.0049050.0100660.0157850.0202190.050531
988.484986.869985.213982.863980.584965.990
0.1001940.1532670.1754310.1993580.2987370.380309
948.861936.012931.675927.494913.974905.843
0.3987060.4502610.4988660.5447530.695576
904.264900.219896.828893.961886.226
0.7432630.7990710.9013300.9495411
884.186882.019878.535877.059875.649
T= 338.13 K
00.0099100.0157850.0496520.0496520.1707000.2003140.251227
980.554976.546973.558969.549969.555919.613914.166906.385
0.2512270.2512270.2512270.4448350.4448350.4960840.5446110.693380
906.199906.214906.188886.627886.646882.972879.912872.267
0.693380.7395740.7967140.9003250.9003250.9498311
872.279870.310868.076864.560864.576863.054861.658
00.0030990.0070160.0100400.0140570.0159590.0196781
980.554979.311977.752976.494974.542973.476970.870861.751
T= 348.13 K
00.010037
974.848970.322
0.0158270.196789
967.125906.378
0.4992170.752993
873.765860.760
1 852.730
a Density of water adjusted for local isotopic composition.
3.2. Densities at 0.1 MPa
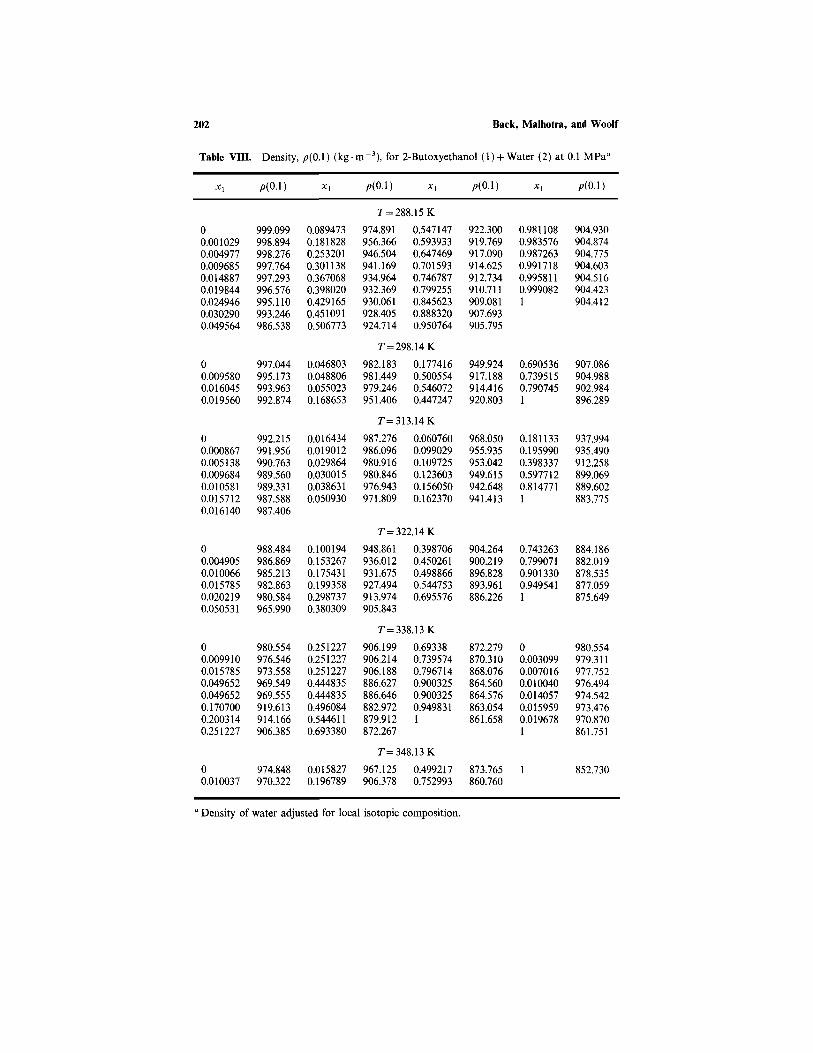
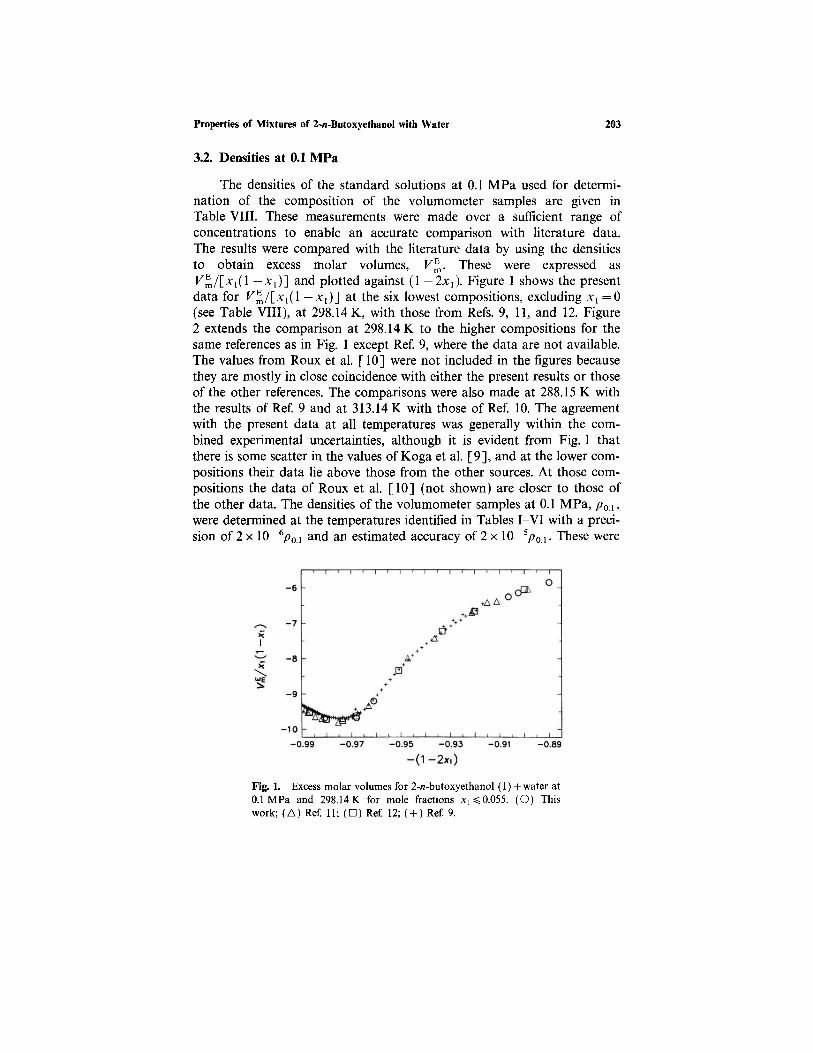
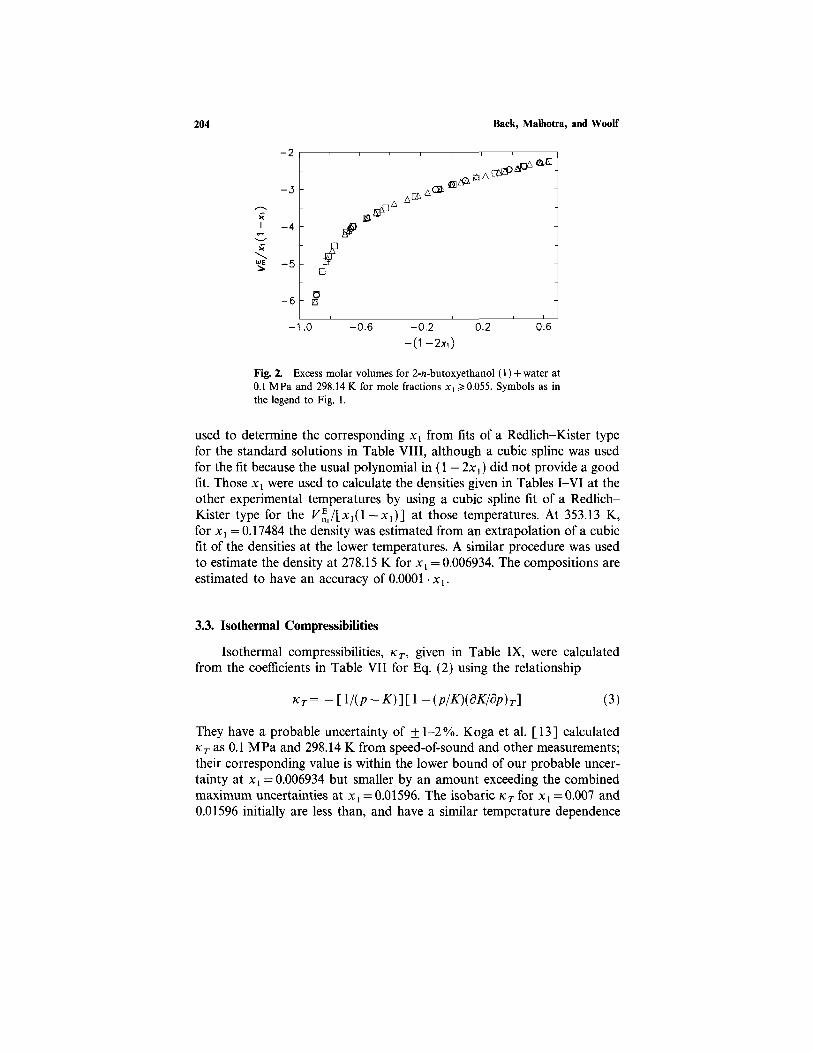
The densities of the standard solutions at 0.1 MPa used for determi-nation of the composition of the volumometer samples are given inTable VIII. These measurements were made over a sufficient range ofconcentrations to enable an accurate comparison with literature data.The results were compared with the literature data by using the densitiesto obtain excess molar volumes, VmE. These were expressed asVEm/[x1(1-x1)] and plotted against (1 — 2x1). Figure 1 shows the presentdata for VEm/[x1(1-x1)] at the six lowest compositions, excluding x1 =0(see Table VIII), at 298.14 K, with those from Refs. 9, 11, and 12. Figure2 extends the comparison at 298.14 K to the higher compositions for thesame references as in Fig. 1 except Ref. 9, where the data are not available.The values from Roux et al. [10] were not included in the figures becausethey are mostly in close coincidence with either the present results or thoseof the other references. The comparisons were also made at 288.15 K withthe results of Ref. 9 and at 313.14 K with those of Ref. 10. The agreementwith the present data at all temperatures was generally within the com-bined experimental uncertainties, although it is evident from Fig. 1 thatthere is some scatter in the values of Koga et al. [9], and at the lower com-positions their data lie above those from the other sources. At those com-positions the data of Roux et al. [10] (not shown) are closer to those ofthe other data. The densities of the volumometer samples at 0.1 MPa, p0.1,were determined at the temperatures identified in Tables I-VI with a preci-sion of 2 x 10⁻⁶/p0.1 and an estimated accuracy of 2 x 10⁻⁵/p0.1. These were
Fig. 1. Excess molar volumes for 2-n-butoxyethanol (1) + water at0.1 MPa and 298.14 K for mole fractions x1<0.055. (O) Thiswork; (T) Ref. 11; (S) Ref. 12; ( + ) Ref. 9.
Properties of Mixtures of 2-n-Butoxyethanol with Water 203
204 Back, Malhotra, and Woolf
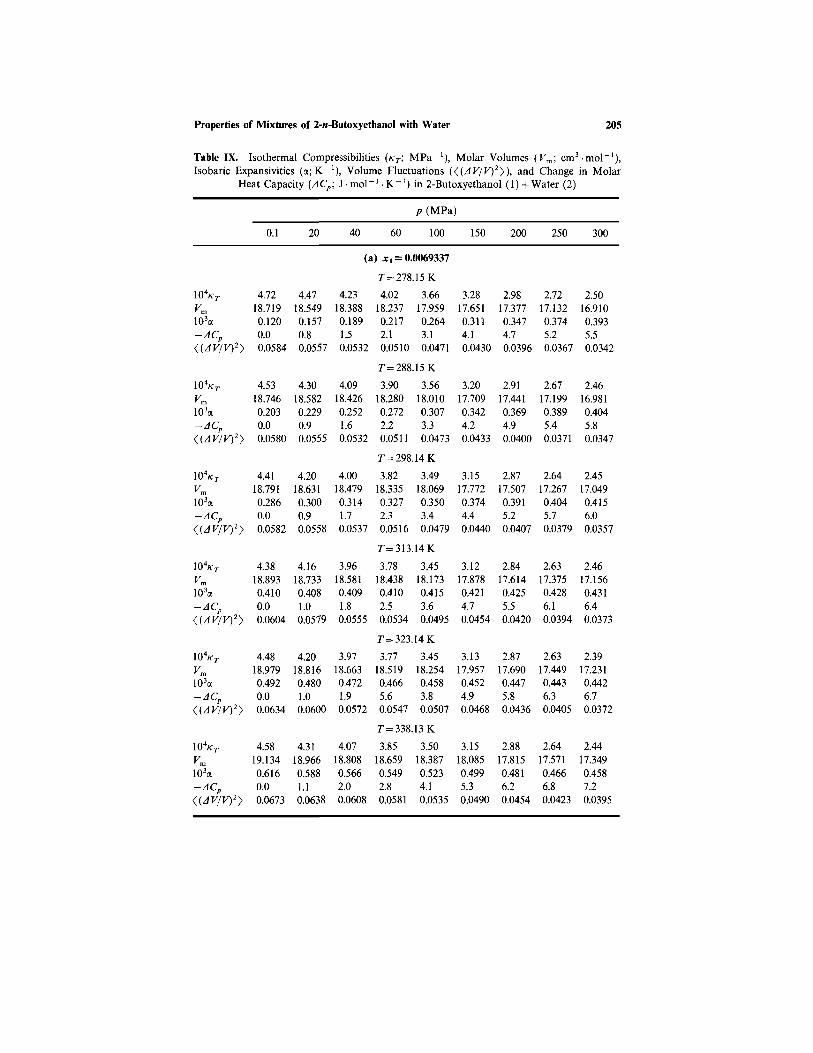
used to determine the corresponding x1 from fits of a Redlich-Kister typefor the standard solutions in Table VIII, although a cubic spline was usedfor the fit because the usual polynomial in (1 — 2x1) did not provide a goodfit. Those x1 were used to calculate the densities given in Tables I-VI at theother experimental temperatures by using a cubic spline fit of a Redlich-Kister type for the VE/[x1(1 -x1)] at those temperatures. At 353.13 K,for x1 = 0.17484 the density was estimated from an extrapolation of a cubicfit of the densities at the lower temperatures. A similar procedure was usedto estimate the density at 278.15 K for x1 = 0.006934. The compositions areestimated to have an accuracy of 0.0001 . x1 .
3.3. Isothermal Compressibilities
Isothermal compressibilities, KT, given in Table IX, were calculatedfrom the coefficients in Table VII for Eq. (2) using the relationship
They have a probable uncertainty of +1-2%. Koga et al. [13] calculatedKT as 0.1 MPa and 298.14 K from speed-of-sound and other measurements;their corresponding value is within the lower bound of our probable uncer-tainty at x1 =0.006934 but smaller by an amount exceeding the combinedmaximum uncertainties at x1 = 0.01596. The isobaric KT for x1 =0.007 and0.01596 initially are less than, and have a similar temperature dependence
Fig. 2. Excess molar volumes for 2-n-butoxyethanol (1) + water at0.1 MPa and 298.14 K for mole fractions x1 > 0.055. Symbols as inthe legend to Fig. 1.
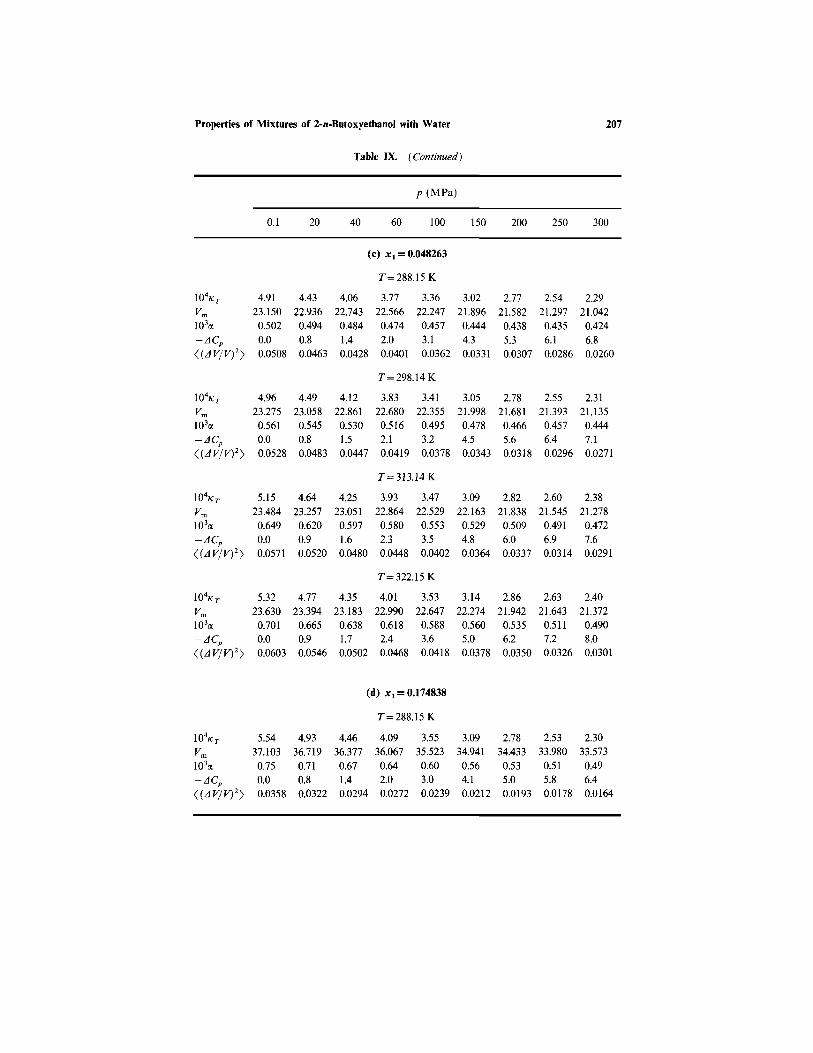
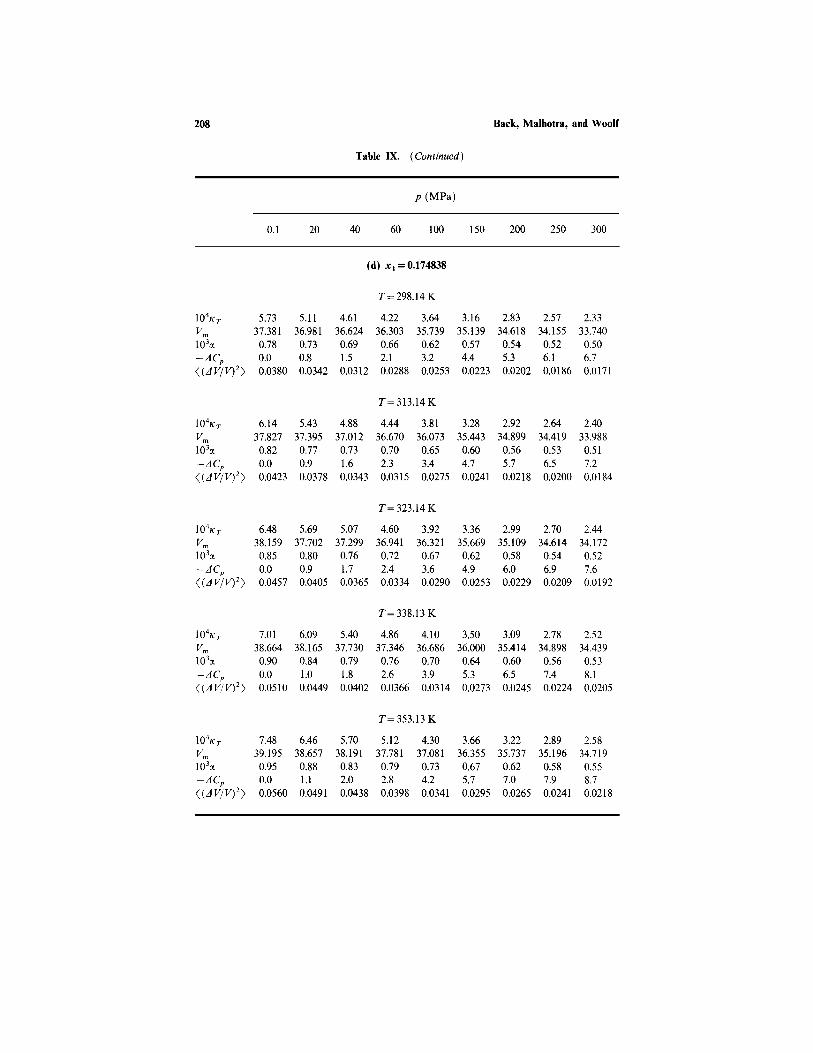
Properties of Mixtures of 2-n-Butoxyethanol with Water 205
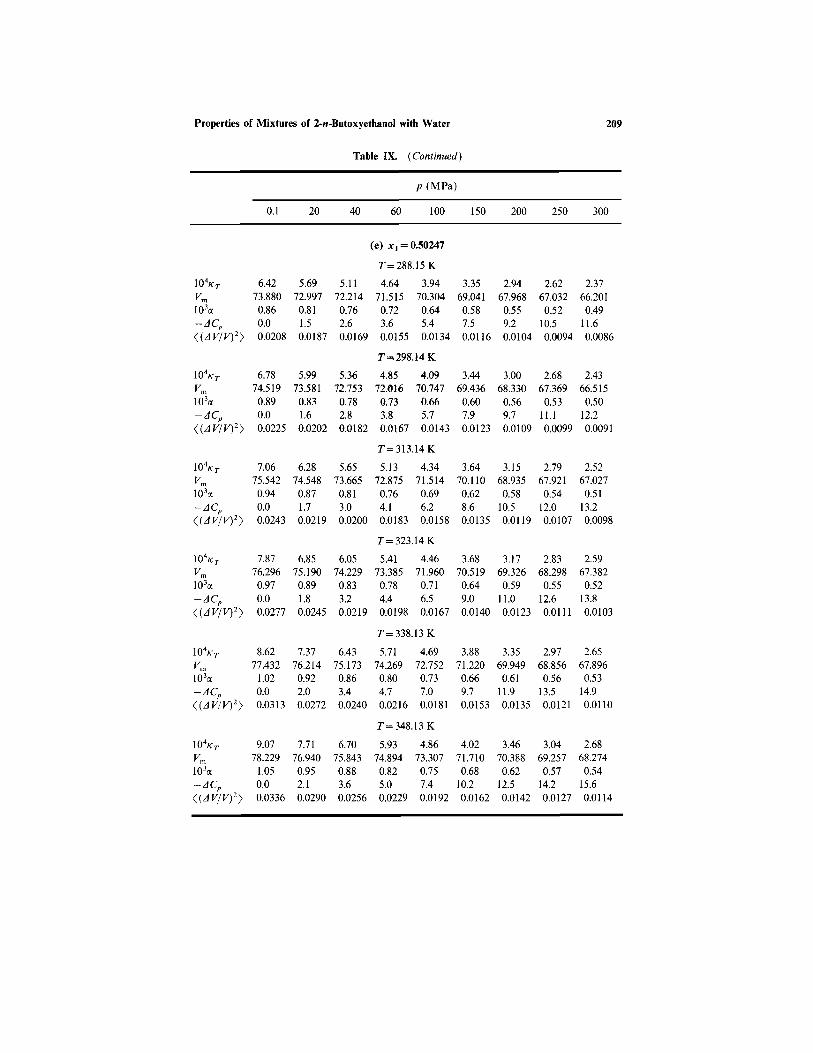
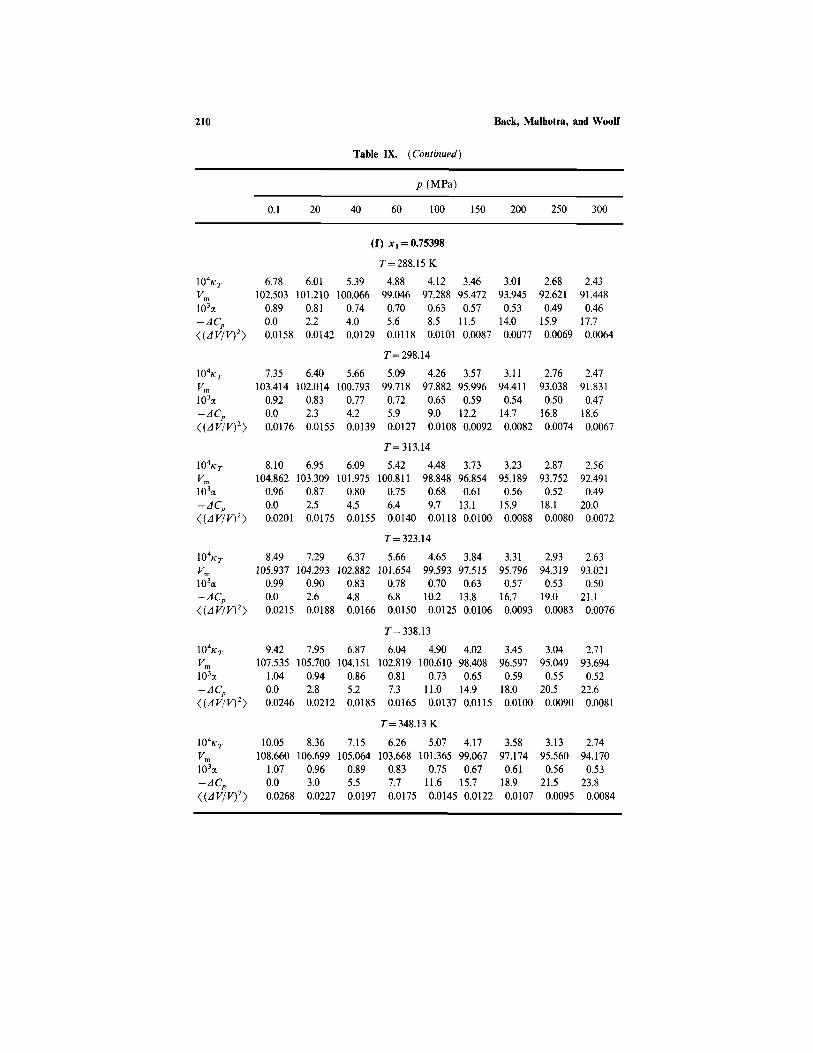
Table IX. Isothermal Compressibilities (KT; MPa - 1) , Molar Volumes (Vm; cm3 .mol - 1) ,Isobaric Expansivities (A;K -1), Volume Fluctuations <(/(DV/V)2>), and Change in Molar
Heat Capacity (DCP; J . m o l - 1 . K - 1 ) in 2-Butoxyethanol (1) + Water (2)
p (MPa)
0.1 20 40 60 100 150 200 250 300
(a) x, = 0.0069337
104KT
vm103A-DCp
<(DV/V) 2 >
T = 278.15K
4.7218.7190.1200.00.0584
4.4718.5490.1570.80.0557
4.2318.3880.1891.50.0532
4.0218.2370.2172.10.0510
3.6617.9590.2643.10.0471
3.2817.6510.3114.10.0430
2.9817.3770.3474.70.0396
2.7217.1320.3745.20.0367
2.5016.9100.3935.50.0342
T=288.15K
104/KT
vm103A-Dcp<(DV/V)2>
4.5318.7460.2030.00.0580
4.3018.5820.2290.90.0555
4.0918.4260.2521.60.0532
3.9018.2800.2722.20.0511
3.5618.0100.3073.30.0473
3.2017.7090.3424.20.0433
2.9117.4410.3694.90.0400
2.6717.1990.3895.40.0371
2.4616.9810.4045.80.0347
T= 298.14 K
104KT
vm103A
-Dcp< ( D V / V ) 2 >
4.4118.7910.2860.00.0582
4.2018.6310.3000.90.0558
4.0018.4790.3141.70.0537
3.8218.3350.3272.30.0516
3.4918.0690.3503.40.0479
3.1517.7720.3744.40.0440
2.8717.5070.3915.20.0407
2.6417.2670.4045.70.0379
2.4517.0490.4156.00.0357
T=313.14K104KT
vm103A
-DcP<(DV/V)2>
4.3818.8930.4100.00.0604
4.1618.7330.4081.00.0579
3.9618.5810.4091.80.0555
3.7818.4380.4102.50.0534
3.4518.1730.4153.60.0495
3.1217.8780.4214.70.0454
2.8417.6140.4255.50.0420
2.6317.3750.4286.10.0394
2.4617.1560.4316.40.0373
T= 323.14 K
104KT
Vm103A-Dcp<(Dv/v) 2 >
4.4818.9790.4920.00.0634
4.2018.8160.4801.00.0600
3.9718.6630.4721.90.0572
3.7718.5190.4665.60.0547
3.4518.2540.4583.80.0507
3.1317.9570.4524.90.0468
2.8717.6900.4475.80.0436
2.6317.4490.4436.30.0405
2.3917.2310.4426.70.0372
T=338.13K
104KT
vm103A
-DCP<(DV/V)2>
4.5819.1340.6160.00.0673
4.3118.9660.5881.10.0638
4.0718.8080.5662.00.0608
3.8518.6590.5492.80.0581
3.5018.3870.5234.10.0535
3.1518.0850.4995.30.0490
2.8817.8150.4816.20.0454
2.6417.5710.4666.80.0423
2.4417.3490.4587.20.0395

206 Back, Malhotra, and Woolf
Table IX. (Continued)
p(MPa)
0.1 20 40 60 100 150 200 250 300
(b) x1=0.015965
T=288.15K
104kTvm103a-AC,<(Dv/v)2>
4.4819.6690.3160.00.0546
4.1719.5010.3090.80.0512
3.9219.3440.3071.50.0485
3.7019.1970.3092.20.0462
3.3818.9280.3183.40.0428
3.0918.6250.3334.70.0397
2.8518.3500.3485.70.0373
2.6418.1000.3586.60.0349
2.4017.8730.3637.40.0322
T = 298.14K
104KTVm
103a
-Dcp<(DV/V)2>
4.4219.7320.3820.00.0555
4.1319.5650.3730.80.0523
3.8819.4090.3691.60.0496
3.6819.2630.3672.30.0473
3.3618.9950.3693.50.0438
3.0618.6930.3764.90.0406
2.8318.4200.3836.00.0381
2.6218.1710.3896.90.0357
2.4017.9440.3907.70.0332
T=313.14K
104KT
Vm103a-Dcp<(DV/V)2>
4.6019.8620.4820.00.0609
4.2419.6890.4700.90.0566
3.9419.5280.4611.70.0531
3.7119.3800.4542.40.0503
3.3619.1090.4453.80.0462
3.0518.8060.4395.20.0427
2.8318.5310.4366.40.0401
2.6218.2810.4347.40.0377
2.4018.0520.4318.20.0350
T= 323.14 K
104KTVm103a-DCP<(DV/V)2>
4.6419.9680.5480.00.0624
4.2819.7920.5340.90.0581
3.9919.6290.5221.80.0547
3.7619.4780.5122.50.0518
3.4019.2020.4964.00.0475
3.0818.8950.4825.50.0438
2.8418.6180.4716.70.0409
2.6318.3650.4647.70.0384
2.4118.1350.4598.60.0357
T= 338.13 K
104KT
Vm103a
-AC,<(DV/V)2>
4.8720.1480.6480.00.0679
4.4519.9620.6301.00.0626
4.1219.7930.6141.90.0585
3.8519.6360.5992.70.0551
3.4619.3520.5734.30.0503
3.1319.0370.5455.90.0462
2.8818.7530.5247.20.0432
2.6718.4950.5098.30.0405
2.4418.2600.5009.20.0375
T= 348.13 K
104KT
Vm103a-DCp<(DV/V)2>
4.8320.2820.7140.00.0690
4.4620.0950.6951.00.0643
4.1619.9230.6762.00.0604
3.9119.7630.6572.90.0573
3.5319.4720.6244.50.0525
3.1919.1490.5886.10.0482
2.9218.8590.5597.50.0448
2.6818.5970.5398.70.0417
2.4418.3600.5279.70.0384
Properties of Mixtures of 2-n-Butoxyethanol with Water 207
Table IX. (Continued)
p (MPa)
0.1 20 40 60 100 150 200 250 300
(c) x1 = 0.048263
T=288.15K
104KT
vm103a
-Dcp( (DV/V) 2 )
4.9123.1500.5020.00.0508
4.4322.9360.4940.80.0463
4.0622.7430.4841.40.0428
3.7722.5660.4742.00.0401
3.3622.2470.4573.10.0362
3.0221.8960.4444.30.0331
2.7721.5820.4385.30.0307
2.5421.2970.4356.10.0286
2.2921.0420.4246.80.0260
T = 298.14 K
104KT
Vm
103a-DCp
<(DV/V) 2 >
4.9623.275
0.5610.00.0528
4.4923.0580.5450.80.0483
4.1222.8610.5301.50.0447
3.8322.680
0.5162.10.0419
3.4122.3550.4953.20.0378
3.0521.9980.4784.50.0343
2.7821.6810.4665.60.0318
2.5521.3930.4576.40.0296
2.3121.1350.4447.10.0271
T=313.14K
104KT
Vm
103a
-Dcp<(DV/V)2>
5.1523.4840.6490.00.0571
4.6423.2570.6200.90.0520
4.2523.0510.5971.60.0480
3.9322.8640.5802.30.0448
3.4722.5290.5533.50.0402
3.0922.1630.5294.80.0364
2.8221.8380.5096.00.0337
2.6021.545
0.4916.90.0314
2.3821.2780.4727.60.0291
T= 322.15 K
104KT
Vm
103a-DCp
<(DV/V)2>
5.3223.630
0.7010.00.0603
4.7723.394
0.6650.90.0546
4.3523.1830.6381.70.0502
4.0122.9900.6182.40.0468
3.5322.6470.5883.60.0418
3.1422.274
0.5605.00.0378
2.8621.942
0.5356.20.0350
2.6321.643
0.5117.20.0326
2.4021.3720.4908.00.0301
(d) x1 = 0.174838
T = 288.15K
104KT
vm103a-Dcp<(DV/V)2>
5.5437.103
0.750.00.0358
4.9336.719
0.710.80.0322
4.4636.377
0.671.40.0294
4.0936.0670.642.00.0272
3.5535.5230.603.00.0239
3.0934.9410.564.10.0212
2.7834.433
0.535.00.0193
2.5333.980
0.515.80.0178
2.3033.5730.496.40.0164
208 Back, Malhotra, and Woolf
Table IX. (Continued)
p (MPa)
0.1 20 40 60 100 150 200 250 300
(d) x1 = 0.174838
T= 298.14 K
104KTvm103A-DCp
<(DV/V)2>
5.7337.3810.780.00.0380
5.1136.9810.730.80.0342
4.6136.6240.691.50.0312
4.2236.3030.662.10.0288
3.6435.7390.623.20.0253
3.1635.1390.574.40.0223
2.8334.6180.545.30.0202
2.5734.1550.526.10.0186
2.3333.7400.506.70.0171
T=313.14K
104KT
Vm
103A-DCP
<(DV/V)2>
6.1437.8270.820.00.0423
5.4337.3950.770.90.0378
4.8837.0120.731.60.0343
4.4436.6700.702.30.0315
3.8136.0730.653.40.0275
3.2835.4430.604.70.0241
2.9234.8990.565.70.0218
2.6434.4190.536.50.0200
2.4033.9880.517.20.0184
T= 323.14 K
10V
Vm103A-DCp<(DV/V)2>
6.4838.1590.850.00.0457
5.6937.7020.800.90.0405
5.0737.2990.761.70.0365
4.6036.9410.722.40.0334
3.9236.3210.673.60.0290
3.3635.6690.624.90.0253
2.9935.1090.586.00.0229
2.7034.6140.546.90.0209
2.4434.1720.527.60.0192
T=338.13K
10V
vm103A-DCp<(DV/V) 2>
7.0138.6640.900.00.0510
6.0938.1650.841.00.0449
5.4037.7300.791.80.0402
4.8637.3460.762.60.0366
4.1036.6860.703.90.0314
3.5036.0000.645.30.0273
3.0935.4140.606.50.0245
2.7834.8980.567.40.0224
2.5234.4390.538.10.0205
T= 353.13 K
104KT
Vm
103A-DCP
<(DV/V)2>
7.4839.1950.950.00.0560
6.4638.6570.881.10.0491
5.7038.1910.832.00.0438
5.1237.7810.792.80.0398
4.3037.0810.734.20.0341
3.6636.3550.675.70.0295
3.2235.7370.627.00.0265
2.8935.1960.587.90.0241
2.5834.7190.558.70.0218
Properties of Mixtures of 2-n-Butoxyethanol with Water
Table IX. (Continued)
p (MPa)
0.1 20 40 60 100 150 200 250 300
(e) x1 = 0.50247
104KT
vm103a-DCp
<(DV/V)2>
6.4273.8800.860.00.0208
5.6972.997
0.811.50.0187
T=288.15K
5.1172.2140.762.60.0169
4.6471.515
0.723.60.0155
3.9470.3040.645.40.0134
3.3569.041
0.587.50.0116
2.9467.968
0.559.20.0104
2.6267.032
0.5210.50.0094
2.3766.201
0.4911.60.0086
T = 298.14K
104KT
vm103a-AC,< ( D V / V ) 2 >
104KT
Vm
103a
-Dcp<(DV/V)2>
104KT
Vm103a-Dcp<(DV/V)2>
104kT
Vm103a-Dcp<(DV/V)2>
104KT
Vm
103a-Dcp<(DV/V)2>
6.7874.519
0.890.00.0225
7.0675.542
0.940.00.0243
7.8776.296
0.970.00.0277
8.6277.432
1.020.00.0313
9.0778.229
1.050.00.0336
5.9973.5810.831.60.0202
6.2874.548
0.871.70.0219
6.8575.190
0.891.80.0245
7.3776.214
0.922.00.0272
7.7176.940
0.952.10.0290
5.3672.753
0.782.80.0182
4.8572.0160.733.80.0167
4.0970.7470.665.70.0143
3.4469.436
0.607.90.0123
T= 313.14 K
5.6573.665
0.813.00.0200
6.0574.229
0.833.20.0219
5.1372.875
0.764.10.0183
T=323.
5.4173.385
0.784.40.0198
4.3471.5140.696.20.0158
14 K
4.4671.960
0.716.50.0167
3.6470.110
0.628.60.0135
3.6870.519
0.649.00.0140
T= 338.13 K
6.4375.1730.863.40.0240
5.7174.269
0.804.70.0216
4.6972.752
0.737.00.0181
3.8871.2200.669.70.0153
T= 348.13 K
6.7075.843
0.883.60.0256
5.9374.894
0.825.00.0229
4.8673.307
0.757.40.0192
4.0271.710
0.6810.20.0162
3.0068.330
0.569.70.0109
3.1568.935
0.5810.50.0119
3.1769.326
0.5911.00.0123
3.3569.949
0.6111.90.0135
3.4670.388
0.6212.50.0142
2.6867.3690.53
11.10.0099
2.7967.921
0.5412.00.0107
2.8368.298
0.5512.60.0111
2.9768.856
0.5613.50.0121
3.0469.257
0.5714.20.0127
2.4366.515
0.5012.20.0091
2.5267.027
0.5113.20.0098
2.5967.382
0.5213.80.0103
2.6567.896
0.5314.90.0110
2.6868.274
0.5415.60.0114
209
210 Back, Malhotra, and Woolf
Table IX. (Continued)
p (MPa)
0.1 20 40 60 100 150 200 250 300
(f) x1 = 0.75398
T= 288.15 K
104KT
vm103A-DCp<(DV/v)2>
6.78102.5030.890.00.0158
6.01101.2100.812.20.0142
5.39100.0660.744.00.0129
4.8899.0460.705.60.0118
4.1297.2880.638.50.0101
3.4695.4720.5711.50.0087
3.0193.9450.5314.00.0077
2.6892.6210.4915.90.0069
2.4391.4480.4617.70.0064
T= 298.14
104KTvm103A-DCp<(DV/V)2>
7.35103.4140.920.00.0176
6.40102.0140.832.30.0155
5.66100.7930.774.20.0139
5.0999.7180.725.90.0127
4.2697.8820.659.00.0108
3.5795.9960.5912.20.0092
3.1194.4110.5414.70.0082
2.7693.0380.5016.80.0074
2.4791.8310.4718.60.0067
T=313.14
104KTVm103A
-DCP<(DV/V)2>
8.10104.8620.960.00.0201
6.95103.3090.872.50.0175
6.09101.9750.804.50.0155
5.42100.8110.756.40.0140
4.4898.8480.689.70.0118
3.7396.8540.6113.10.0100
3.2395.1890.5615.90.0088
2.8793.7520.5218.10.0080
2.5692.4910.49
20.00.0072
T= 323.14
10Vvm103A-DCP<(DV/V)2>
8.49105.9370.990.00.0215
7.29104.2930.902.60.0188
6.37102.8820.834.80.0166
5.66101.6540.786.80.0150
4.6599.5930.7010.20.0125
3.8497.5150.6313.80.0106
3.3195.7960.5716.70.0093
2.9394.3190.5319.00.0083
2.6393.0210.50
21.10.0076
T= 338.13
104KTvm103A-DCP<(DV/V)2>
9.42107.535
1.040.00.0246
7.95105.7000.942.80.0212
6.87104.1510.865.20.0185
6.04102.8190.817.30.0165
4.90100.6100.7311.00.0137
4.0298.4080.6514.90.0115
3.4596.5970.5918.00.0100
3.0495.0490.55
20.50.0090
2.7193.6940.52
22.60.0081
T= 348.13 K
104KTVm103A-DCP<DV/V)2>
10.05108.660
1.070.00.0268
8.36106.6990.963.00.0227
7.15105.0640.895.50.0197
6.26103.6680.837.70.0175
5.07101.3650.7511.60.0145
4.1799.0670.6715.70.0122
3.5897.1740.6118.90.0107
3.1395.5600.56
21.50.0095
2.7494.1700.53
23.80.0084

Properties of Mixtures of 2-n-Butoxyethanol with Water 211
to, those of pure water [14]. The decrease with increase in temperature ofthe KT for the first composition does not persist much above 313.14 K, andfor X1 = 0.01596 the KT have increased to exceed those for water before thattemperature is reached. The isobaric KT for [ acetonitrile (1) +water] [15]and [methanol (1) + water] [14] have KT which remain below those forwater to much higher compositions: 0.1 < x1 < 0.2 for (acetonitrile + water)and 0.25 <x1 <0.35 for (methanol + water).
3.3. Volume Fluctuations
Table IX includes normalized volume fluctuations [16], <(DV/V)2>,defined by Eq. (4)
where Vm is the molar volume, to extend those obtained by Koga andWesth [17] at 0.1 MPa and 298.14 K. The <(DV/V)2> have an estimatederror of +1-2%. The Vm in Table IX were calculated as a function of tem-perature at chosen pressures from the densities at 0.1 MPa and the volume
Fig. 3. Temperature dependence of normalizedvolume fluctuations, <(DV/V)2>, in 2-n-butoxy-ethanol (1) + water at 0.1 MPa. (O) x1 =0.007;(A) x1 =0.016; (S) x1= 0.05; (D) x1 = 0.175;(T) x1 = 0.502; ( + ) water.
212 Back, Malhotra, and Woolf
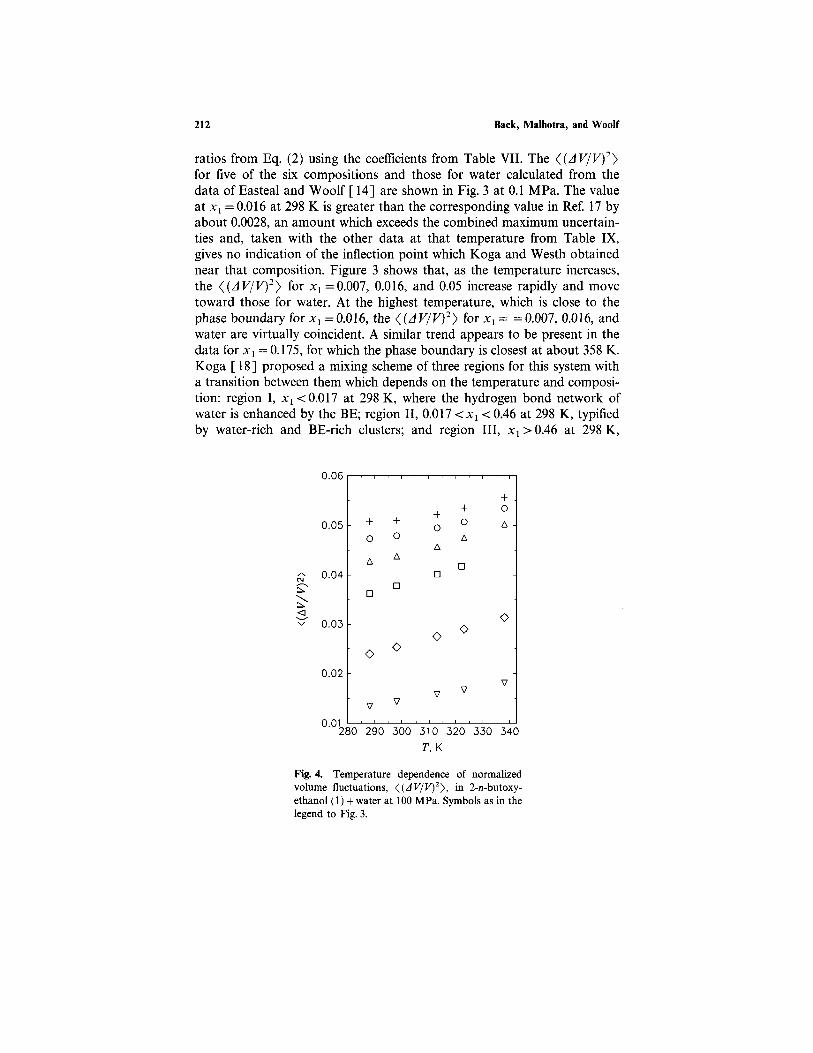
ratios from Eq. (2) using the coefficients from Table VII. The <(DV/V)2>for five of the six compositions and those for water calculated from thedata of Easteal and Woolf [ 14] are shown in Fig. 3 at 0.1 MPa. The valueat x1 =0.016 at 298 K is greater than the corresponding value in Ref. 17 byabout 0.0028, an amount which exceeds the combined maximum uncertain-ties and, taken with the other data at that temperature from Table IX,gives no indication of the inflection point which Koga and Westh obtainednear that composition. Figure 3 shows that, as the temperature increases,the <(DV/V)2> for x1 = 0.007, 0.016, and 0.05 increase rapidly and movetoward those for water. At the highest temperature, which is close to thephase boundary for x1 =0.016, the <(DV/V)2> for X1 = = 0.007, 0.016, andwater are virtually coincident. A similar trend appears to be present in thedata for x1 = 0.175, for which the phase boundary is closest at about 358 K.Koga [18] proposed a mixing scheme of three regions for this system witha transition between them which depends on the temperature and composi-tion: region I, x1 < 0.017 at 298 K, where the hydrogen bond network ofwater is enhanced by the BE; region II, 0.017 <x1 < 0.46 at 298 K, typifiedby water-rich and BE-rich clusters; and region III, x1 > 0.46 at 298 K,
Fig. 4. Temperature dependence of normalizedvolume fluctuations, <(DV/V)2>, in 2-n-butoxy-ethanol (1) + water at 100 MPa. Symbols as in thelegend to Fig. 3.
where micelles are significant. The rapid change in <(DV/V)2> for x1 ~0.016 shown in Fig. 3 begins close to the temperature of 298 K identified byKoga [18] as the temperature for transition of this composition from I toII at 0.1 MPa. In contrast, his data indicate that the I-II transition at thesame pressure for x1 .~ 0.007 was near 348 K. Figure 4 shows that themovement of the <(DV/V)2> of the mixtures towards those for water seenin Fig. 3 is not detectable at 100 MPa. The suppression of the phaseseparation [2, 3] before this pressure is reached would be expected fromthe influence of pressure in disrupting the hydrogen bond structure inregion I, and adversely affecting the formation and stability of clusters andmicelles in regions II and III.
3.5. Isobaric Expansivities
Isobaric expansivities, a, also given in Table IX, were calculated byfitting the Vm at a chosen pressure to a quadratic in T and differentiatinganalytically
3.4. Isobaric Molar Heat Capacity, Cp
The effect of pressure on the isobaric molar heat capacity is given by
where Cp (0.1 MPa) is the isobaric molar heat capacity at 0.1 MPa, M isthe molar mass, and p is the density of the liquid at p. The a wereexpressed by a quadratic equation in T to enable analytic differentiation.The error in the DCp is estimated to be +1 J . (mol . K - 1 ) . The change inthe Cp with either temperature or pressure is not very large at low x1 butincreases more rapidly at higher compositions. Apparent molal heatcapacities and molar heat capacities at 0.1 MPa are available [10, 21] forsome of the temperatures and compositions of the data in Table IX.
Properties of Mixtures of 2-n-Bntoxyethanol with Water 213
The a have an estimated error of +2-4%. The values at 0.1 MPa at x1 =0.5025 and 0.7540 for 298.14 and 323.14 K agree within 1% with thoseinterpolated from the data of Onken [19]. A direct comparison with themeasurements of Davies et al. [20] is not possible, as their data are nottrue thermal expansivities.
4. CONCLUSION
The volumetric data have provided values for the normalized volumefluctuations in this system over an extensive range of temperature, pressure,and composition. The magnitude of the fluctuations moves close to thosefor the major component, water, as the phase boundary is approached. Theinflection point in the normalized volume fluctuations at low x1 at 0.1 MPaand 298 K observed by Koga and Westh [15] has not been detected.
ACKNOWLEDGMENT
The authors wish to express their gratitude for the meticulousmeasurements of the densities at atmospheric pressure by Z. J. Derlacki.
REFERENCES
1. H. Mensah-Brown and W. A. Wakeham, Int. J. Thermophys. 16:237 (1995).2. G. Schneider, Z. Phys. Chem. N.F. 37:333 (1963).3. G. M. Schneider, in Water: A Comprehensive Treatise, F. Franks, ed. (Plenum, New York,
1972), p. 381.4. C. M. Ellis, J. Chem. Educ. 44:405 (1967).5. R. Malhotra and L. A. Woolf, J. Chem. Thermodyn. 25:1189 (1993).6. R. Malhotra and L. A. Woolf, Int. J. Thermophys. 14:1021 (1993).7. R. Malhotra and L. A. Woolf, Int. J. Thermophys. 16:901 (1995).8. R. Malhotra and L. A. Woolf, Fluid Phase Equil 94:227 (1994).9. Y. Koga, J. Kristiansen, and A. Hvidt, J. Chem. Thermodyn. 25:31 (1993).
10. G. Roux, G. Perron, and J. E. Desnoyers, J. Solut. Chem. 7:639 (1978).11. M. I. Davis, M. C. Molina, and G. Doheret, Thermochim. Acta 131:153 (1988).12. G. Douheret, A. Pal, and M. I. Davis, J. Chem. Thermodyn. 22:99 (1990).13. Y. Koga, K. Tamura, and S. Murakami, J. Solut. Chem. 24:1125 (1995).14. A. J. Easteal and L. A. Woolf, J. Chem. Thermodyn. 17:49 (1985).15. A. J. Easteal and L. A. Woolf, J. Chem. Thermodyn. 20:693 (1988).16. Y. Koga, J. Phys. Chem. 100:5172 (1996).17. Y. Koga and P. Westh, Bull. Chem. Soc. Japan 69:1505 (1996).18. Y. Koga, J. Phys. Chem. 96:10466 (1992).19. U. Onken, Z. Electrochem. 63:321 (1959).20. J. V. Davies, F. W. Lau, L. T. N. Le, T. T. W. Lai, and Y. Koga, Can. J. Chem. 70:2659
(1992).21. T. Atake and Y. Koga, Natsu Sokutei 21:130 (1994).
214 Back, Malhotra, and Woolf