
Volume 5, Issue 4 (XII) - Advance and Innovative Research
195
Volume 5, Issue 4 (XII) ISSN 2394 - 7780 October - December 2018 UGC University Grants Commission Journal No.: 63571 International Journal of Advance and Innovative Research Indian Academicians and Researchers Association www.iaraedu.com
-
Upload
khangminh22 -
Category
Documents
-
view
1 -
download
0
Transcript of Volume 5, Issue 4 (XII) - Advance and Innovative Research

Volume 5, Issue 4 (XII) ISSN 2394 - 7780 October - December 2018
UGC University Grants Commission
Journal No.: 63571
International Journal of
Advance and Innovative Research
Indian Academicians and Researchers Association www.iaraedu.com

International Journal of Advance and Innovative Research Volume 5, Issue 4 ( XII ): October - December 2018
Editor- In-Chief Dr. Tazyn Rahman
Members of Editorial Advisory Board
Mr. Nakibur Rahman Ex. General Manager ( Project ) Bongaigoan Refinery, IOC Ltd, Assam
Dr. Mukesh Saxena Pro Vice Chancellor, University of Technology and Management, Shillong
Dr. Alka Agarwal Director, Mewar Institute of Management, Ghaziabad
Dr. Archana A. Ghatule Director, SKN Sinhgad Business School, Pandharpur
Prof. (Dr.) Sudhansu Ranjan Mohapatra Dean, Faculty of Law, Sambalpur University, Sambalpur
Prof. (Dr.) Monoj Kumar Chowdhury Professor, Department of Business Administration, Guahati University, Guwahati
Dr. P. Malyadri Principal, Government Degree College, Hyderabad
Prof. (Dr.) Baljeet Singh Hothi Professor, Gitarattan International Business School, Delhi
Prof.(Dr.) Shareef Hoque Professor, North South University, Bangladesh
Prof. (Dr.) Badiuddin Ahmed Professor & Head, Department of Commerce, Maulana Azad Nationl Urdu University, Hyderabad
Prof.(Dr.) Michael J. Riordan Professor, Sanda University, Jiashan, China
Dr. Anindita Sharma Dean & Associate Professor, Jaipuria School of Business, Indirapuram, Ghaziabad
Prof.(Dr.) James Steve Professor, Fresno Pacific University, California, USA
Prof. (Dr.) Jose Vargas Hernandez Research Professor, University of Guadalajara,Jalisco, México
Prof.(Dr.) Chris Wilson Professor, Curtin University, Singapore
Prof. (Dr.) P. Madhu Sudana Rao Professor, Mekelle University, Mekelle, Ethiopia
Prof. (Dr.) Amer A. Taqa Professor, DBS Department, University of Mosul, Iraq
Prof. (Dr.) Himanshu Pandey Professor, Department of Mathematics and Statistics Gorakhpur University, Gorakhpur
Dr. Nurul Fadly Habidin Faculty of Management and Economics, Universiti Pendidikan Sultan Idris, Malaysia
Prof. (Dr.) Agbo Johnson Madaki Faculty, Faculty of Law, Catholic University of Eastern Africa, Nairobi, Kenya
Dr. Neetu Singh HOD, Department of Biotechnology, Mewar Institute, Vasundhara, Ghaziabad
Prof. (Dr.) D. Durga Bhavani Professor, CVR College of Engineering, Hyderabad, Telangana

Prof. (Dr.) Shashi Singhal Professor, Amity University, Jaipur
Prof. (Dr.) Aradhna Yadav Professor, Krupanidhi School of Management, Bengaluru
Prof. (Dr.) Alireza Heidari Professor, Faculty of Chemistry, California South University, California, USA
Prof.(Dr.) Robert Allen Professor Carnegie Mellon University, Australia
Prof. (Dr.) A. Mahadevan Professor S. G. School of Business Management, Salem
Prof. (Dr.) S. Nallusamy Professor & Dean, Dr. M.G.R. Educational & Research Institute,Chennai
Prof. (Dr.) Hemant Sharma Professor, Amity University, Haryana
Prof. (Dr.) Ravi Kumar Bommisetti Professor, Amrita Sai Institute of Science & Technology, Paritala
Dr. C. Shalini Kumar Principal, Vidhya Sagar Women’s College, Chengalpet
Dr. Syed Mehartaj Begum Professor, Hamdard University, New Delhi
Prof. (Dr.) Badar Alam Iqbal Adjunct Professor, Monarch University, Switzerland
Dr. Darshana Narayanan Head of Research, Pymetrics, New York, USA
Prof.(Dr.) D. Madan Mohan Professor, Indur PG College of MBA, Bodhan, Nizamabad
Dr. Rosemary Ekechukwu Associate Dean, University of Port Harcourt, Nigeria
Dr. Sandeep Kumar Sahratia Professor Sreyas Institute of Engineering & Technology
Dr. P.V. Praveen Sundar Director, Shanmuga Industries Arts and Science College
Dr. S. Balamurugan Director - Research & Development, Mindnotix Technologies, Coimbatore
Dr. Manoj P. K. Associate Professor, Cochin University of Science and Technology
Dr. Dhananjay Prabhakar Awasarikar Associate Professor, Suryadutta Institute, Pune
Dr. Indu Santosh Associate Professor, Dr. C. V.Raman University, Chhattisgath
Dr. Mohammad Younis Associate Professor, King Abdullah University, Saudi Arabia
Dr. Pranjal Sharma Associate Professor, Department of Management Mile Stone Institute of Higher Management, Ghaziabad
Dr. Kavita Gidwani Associate Professor, Chanakya Technical Campus, Jaipur
Dr. Lalata K Pani Reader, Bhadrak Autonomous College, Bhadrak, Odisha
Dr. Vijit Chaturvedi Associate Professor, Amity University, Noida
Dr. Pradeepta Kishore Sahoo Associate Professor, B.S.A, Institute of Law, Faridabad
Dr. Marwan Mustafa Shammot Associate Professor, King Saud University, Saudi Arabia
Dr. R. Navaneeth Krishnan Associate Professor, Bharathiyan College of Engg & Tech, Puducherry

Dr. Mahendra Daiya Associate Professor, JIET Group of Institutions, Jodhpur
Dr. G. Valarmathi Associate Professor, Vidhya Sagar Women's College, Chengalpet
Dr. Parbin Sultana Associate Professor, University of Science & Technology Meghalaya
Dr. M. I. Qadir Assistant Professor, Bahauddin Zakariya University, Pakistan
Dr. Kalpesh T. Patel Principal (In-charge) Shree G. N. Patel Commerce College, Nanikadi
Dr. Brijesh H. Joshi Principal (In-charge) B. L. Parikh College of BBA, Palanpur
Dr. Juhab Hussain Assistant Professor, King Abdulaziz University, Saudi Arabia
Dr. Namita Dixit Assistant Professor, ITS Institute of Management, Ghaziabad
Dr. V. Tulasi Das Assistant Professor, Acharya Nagarjuna University, Guntur, A.P.
Dr. Nidhi Agrawal Assistant Professor, Institute of Technology & Science, Ghaziabad
Dr. Urmila Yadav Assistant Professor, Sharda University, Greater Noida
Dr. Ashutosh Pandey Assistant Professor, Lovely Professional University, Punjab
Dr. M. Kanagarathinam Head, Department of Commerce Nehru Arts and Science College, Coimbatore
Dr. Subha Ganguly Scientist (Food Microbiology) West Bengal University of A. & F Sciences, Kolkata
Dr. V. Ananthaswamy Assistant Professor The Madura College (Autonomous), Madurai
Dr. R. Suresh Assistant Professor, Department of Management Mahatma Gandhi University
Dr. S. R. Boselin Prabhu Assistant Professor, SVS College of Engineering, Coimbatore
Dr. V. Subba Reddy Assistant Professor, RGM Group of Institutions, Kadapa
Dr. A. Anbu Assistant Professor, Achariya College of Education, Puducherry
Dr. R. Jayanthi Assistant Professor, Vidhya Sagar Women's College, Chengalpattu
Dr. C. Sankar Assistant Professor, VLB Janakiammal College of Arts and Science
Dr. Manisha Gupta Assistant Professor, Jagannath International Management School
Copyright @ 2018 Indian Academicians and Researchers Association, Guwahati All rights reserved. No part of this publication may be reproduced or transmitted in any form or by any means, or stored in any retrieval system of any nature without prior written permission. Application for permission for other use of copyright material including permission to reproduce extracts in other published works shall be made to the publishers. Full acknowledgment of author, publishers and source must be given. The views expressed in the articles are those of the contributors and not necessarily of the Editorial Board or the IARA. Although every care has been taken to avoid errors or omissions, this publication is being published on the condition and understanding that information given in this journal is merely for reference and must not be taken as having authority of or binding in any way on the authors, editors and publishers, who do not owe any responsibility for any damage or loss to any person, for the result of any action taken on the basis of this work. All disputes are subject to Guwahati jurisdiction only.


International Journal of Advance and Innovative Research Volume 5, Issue 4 ( XII ) : October – December 2018
CONTENTS
Research Papers
CAMPUS ADAPTATIONS OF ENGINEERING UNDERGRADUATES ACROSS RELIGIONS
Dr. Vijayalakshmi N. S and Dr. A. H. Sequeira
1 – 15
GROWTH AND CHARACTERIZATION OF DICOUMAROLE DERIVATIVE
S. K. Parmar, H. K. Gohil, P. M. Vyas, S. D. Hadiyal and A. H. Patel
16 – 23
INVESTORS ATTITUDE TOWARDS MUTUAL FUNDS IN ROHTK DISTRCT IN STATE OF HARYANA
Dr. Sunil Kumari
24 – 27
SUSTAINABLE MANAGEMENT OF ENVIRONMENTAL RESOURCES OF A SEMI-ARID REGION OF INDIA USING RS/GIS
Sakshi Walker, Brototi Biswas and Jai Kumar
28 – 38
A STUDY ON IMPACT OF SOLAR PRODUCTS ON BUSINESS IN SIVAKASI TALUK
M. Rajeev Gandhi and Dr. M. Ponnien Selvi
39 – 41
RISK BEHAVIOUR OF GOLD AND SILVER PRICES IN INDIA WITH RESPECT TO GST ANNOUNCEMENT: AN EMPIRICAL STUDY
R. Sugirtha and Dr. M. Babu
42 – 45
DRIVING MOTIVES OF A CUSTOMER TOWARDS BRANDED BEAUTY SALON
Dr. D. Ravindran
46 – 52
A STATISTICAL ANALYSIS OF ADULT MORTALITY SCENARIO OF RURAL NAGALAND
Seikh Faruk Ahmed
53 – 61
SWARM INTELLIGENCE: OVERVIEW AND APPLICATIONS
Shipra, Priyanka and Neetika
62 – 67
A STUDY ON PERCEPTION OF E-WAY BILL AMONGTHE TRANSPORTERS OF AHMEDABAD
Dr. Ankitaben D. Kathiriya
68 – 70
DETERMINANTS OF ONLINE SHOPPING IN RETAILING- A STUDY OF SELECTED DISTRICTS OF HARYANA
Dr. Divya Malhan and Preeti Khatri
71 – 78
DIMENSIONALITY AND PSYCHOMETRIC CHARACTERISTICS OF PSYCHOLOGICAL CAPITAL SCALE
Abdul Raffie Naik and Shah Mohd Khan
79 – 85
ECONOMIC INTEGRATION AND SOUTH ASIA: EXPLORING SPILLOVER EFFECTS FOR NORTH-EAST INDIA
Jayanti Bhattacharjee
86 – 93

IMPACT OF FOOD QUALITY ON CUSTOMER SATISFACTION- WITH SPECIAL REFERENCE OF FAST FOOD RESTAURANTS IN GWALIOR REGION
Swechchha Jain and Prof. K. S. Thakur
94 – 99
CONTROL OF DFIG WIND POWER GENERATORS IN UNBALANCED MICROGRIDS BASED ON INSTANTANEOUS POWER THEORY
M. Deepakrishnan and S. M. Shangavi
100 – 110
HR EDUCATION AND CORPORATE EXPECTATIONS: A PARADIGM SHIFT IN CONTENT, APPROACH AND METHODOLOGY
Urs Gururaj B and Bagali M M
111 – 126
AN EXPLORATION OF FACTORS INFLUENCING PRE-OWNED CAR PURCHASING DECISIONS – A STUDY WITH SPECIAL REFERENCE TO COIMBATORE DISTRICT
Dr. D. Dilip, Dr. S. Vinoth and T. Jayashree
127 – 133
INVESTIGATION ON ENERGY METER BILLING SYSTEMS BASED ON PERFORMANCE METRICS
S. Gowtham, Dr. S. Gopinath and Dr. N. Sureshkumar
134 – 137
CLASSIFYING SENTIMENTS USING VADER AND LOGISTIC REGRESSION
Shorya Jain and Dr. Sanjay Kumar Malik
138 – 143
IMPACT OF SMART CITY SERVICES ON THE HAPPINESS INDEX OF DUBAI: AN EMPIRICAL ANALYSIS
Esam Khamis Alfalasi, Dr. Dayanand Pandey and Dr. Mohd. Tahseen Burney
144 – 152
MAXIMUM MODULUS OF POLYNOMIALS NOT VANISHING IN A DISK
Roshan Lal
153 – 156
THE STUDY OF CONSUMER BEHAVIOR TOWARDS DIFFERENT SHOES BRAND
Inderpreet Singh
157 – 162
EXPERIMENTAL ANALYSIS OF A REFRIGERATION SYSTEM USING AL2O3/CUO/TIO2/ZNO-R134a NANOFLUIDS AS REFRIGERANT
T. Coumaressin, K. Palaniradja and N. Alagumurthi
163 – 170
GENDER SENSITIZATION: AN ALTERNATIVE TO DECLINE DISCRIMINATION AGAINST WOMEN WITH SPECIAL REFERENCE TO JNTUH STUDENTS FROM FEMINIST LENS
Dr. Abdul Basit Naik
171 – 177
DESIGN AND DEVELOPMENT OF NEBIVOLOL HCl LOADED NANOEMULSION
Dr. Mihir Raval, Malay Chotaliya and Dr. Navin Sheth
178 – 184

International Journal of Advance and Innovative Research Volume 5, Issue 4 (XII): October - December, 2018
1
ISSN 2394 - 7780
CAMPUS ADAPTATIONS OF ENGINEERING UNDERGRADUATES ACROSS RELIGIONS
Dr. Vijayalakshmi N. S1 and Dr. A. H. Sequeira2 Faculty1, P. G. Department of Economics, University College Mangalore, Mangalore
Professor2, School of Management, N. I. T. K Surathkal, Mangalore
ABSTRACT Objective: The study aims to empirically test the relationship between types of campus adaptations across student religion at birth of engineering undergraduate B. Tech students pursuing a four-year study at Indian Institute of Technology (IIT’s) and National Institute of Technology (NIT’s) in India.
Method: - The Multivariate Analysis of Variance (Manova) test was run with SPSS vs. 21 to compare the student’s campus adaptations of IIT’s and NIT’s by religion. Multistage random sampling with n = 1420 students were selected accounting for Hindus (n = 1206), Muslims (n = 45), Christian’s (n = 29). Students belonging to other minority communities were Christians (n = 29), Jains (n = 24), Sikh (n = 08) and Buddhist (n = 03). However, the student population who surprisingly did not want to associate themselves with any religion loomed large with associating themselves with being called Indian (n = 28), humanity (n = 15), Atheist (n = 35) and not applicable (n =26).
Result and Conclusions: - There are significant differences across student religion on different forms of campus adaptations where much noticeably students who less associated themselves to any religion by being known on the survey as Indian, humanitarian, atheist and not applicable – all had positive institutional adaptation with negative academic, social and physical – psychological adaptation. In short, campus adaptations do vary across student’s religion influencing student’s experiences at university.
Keywords: Campus, adaptation, academic, social, physical, psychological and institution
INTRODUCTION Religion on Campus impacts campus ethos (Proctor, 2002) with religious inclusion influencing higher education (Stevenson, 2014) resulting in college adjustment varying by student’s religious background (Jackson, Mark Pancer, Pratt, & Hunsberger, 2001). It is often observed that when education and religiosity is taken into consideration, colleges do not dampen or damage student’s religious commitment (Schmalzbauer, 2013). Religiosity impacts life of students (Abdel-Khalek & Lester, 2015). Of recent years there is a shift from religiosity to spirituality (Cragun, Henry, Mann, & Russell Krebs, 2014). Spirituality and religiosity are overlapping construct with one forming the subset of the other sharing some characteristics but also retaining nonshared features (Joshanloo, 2012). Exploring the essence of spirituality where spirituality is the human attempt to make meaning of the self in connection to and with the external world (Mayhew, 2004) proves vital to understand and assess spiritual health of student’s (Fisher, 2009). Spirituality relates to each student’s field of study influencing them in thier making of sound professionals especially in that of engineering (Halsmer et al., 2010) where spiritual wellbeing heavily influenced college adjustment (Mansor & Syahidah, 2012). Further campus climate experiences and perceptions differed by religious and spiritual views of students impacting diversity (Mayhew, Bowman, & Rockenbach, 2014). The campus spiritual climate affects student’s diverse world views (A. B. Rockenbach & Mayhew, 2014) shaping student satisfaction (A. B. Rockenbach & Mayhew, 2014). Hence religion and spirituality impacts quality of life of college students (Hsien-Chuan Hsu, Krägeloh, Shepherd, & Billington, 2009). In Brief, religion impacts higher education (Mayrl & Oeur, 2009) where religious belief impacts college adjustment among college students (Edmondson & Park, 2009) and religiousness impacts college life (Moran, Roberts, Tobin, & Harvey, 2008) as it contributes to giving a meaning in life and general wellbeing (Z. H. Khan, Watson, Naqvi, Jahan, & Chen, 2015). In short, campus context, college encounters and religious spiritual struggle impact ecumenical world view development (Bryant, 2011) where religious coping depends on individual levels of religiosity and spirituality (Krägeloh, Chai, Shepherd, & Billington, 2012).
The student undergraduate B.Tech population of Institute of National Importance of IIT’s and NIT’s classified as per All India Survey Report on Higher Education (AISHE) from 2011 – 2016 on the basis of religion are as follows :-
Year
Total Student Across Religions Muslim Other Minorities Male Female Male Female Male Female
2011 - 12 56640 8099 190 22 305 92 2012 – 13 68296 10327 760 86 654 148

International Journal of Advance and Innovative Research Volume 5, Issue 4 (XII): October - December, 2018
2
ISSN 2394 - 7780
2013 - 14 71801 11332 1036 146 1041 267 2014 – 15 82281 13425 1114 187 949 249 2015 – 16 73566 12796 926 121 1534 412
Source :- AISHE Reports
From the table above, it is evident that there has been a rise in the enrolment of Muslim and other minority community student population of 0.32% and 0.61% of year 2011 – 12 towards 1.21% and 2.25% of the year 2015 – 16. However much noticeably, the enrolment of female students continuing to be low compared to that of male students. Hence its vital to introspect the underrepresented minority student population adaptation at campus by religion.
The study seeks to analyse the relationship among student groups by their religious faith with the following research question and research objective: -
Research Question: - What makes campus adaptations of academic, social, physical - psychological and institutional attachment be unique across student religion?
Research Objective: - To examine existence of variance among campus adaptations of academic, social, physical psychological and institutional across student religion.
1. CAMPUS ADAPTATION 1.1 Academic Adaptation Religious faith impacts performance (Aruguete, Goodboy, Jenkins, Mansson, & Mccutcheon, 2012) where spiritual wellbeing influenced good academic achievement (Mansor & Syahidah, 2012). Religion influenced students’ academic major choice (Nudelman, 1972) which is supported of recent that religious variables are generally strong predictors of attitudes toward individual involving contested science issues like human evolution and other (Jelen & Lockett, 2014) as opposed to student’s perceptions of conflict on dichotomy of religion and science (Martin-Hansen, 2008). The frequency of religious service attendance impacted college adjustment varying by gender and achievement (Suppaiah, 2003) revealing that students who had non-religious club involvement and non-religious attendance service had higher academic achievement (Good & Willoughby, 2011). Further it is observed that spirituality impacts learning (Sucylaite, 2013) and individuals who have a strong spiritual relationship with a higher power and are religious due to intrinsic motivation tend to be more confident in their ability to make career (Duffy & Blustein, 2005). Hence students who are spiritual are more motivated as students than non-spiritual students (Barmola, 2016) and college students who are more religiously engaged have a positive academic performance (Mayrl & Oeur, 2009).
1.2 Social Adaptation Religious socialisation has positive implication on adjustment among youths (Jackson et al., 2001) where religion and region impacts women’s autonomy (Jejeebhoy & Sathar, 2001) with vehemently noticed religious commitment higher in men than women (Schludermann et al., 2001). This was particularly observed in campus experience that varied by religious origin especially of minority religion like Muslims (Peek, 2003) who have been easily adhered to dress code impacting college adjustment (Rangoonwala, Sy, & Epinoza, 2011). More noticeably religion is an identity (Raman, 2003) and in particular racial identity attitude was predictive of religious orientation (Hwzhhq, Dqg, Phulfdq, Sanchez, & Carter, 2005) with an observed relationship between gender race and religion among university students (Arndt & Bruin, 2006). The generation next students, in the era of proposed secularisation on campus believed less in religion (Finnegan, 2007) as it was the vivid diversity that enhanced co-operation on campus (Patel, 2007). The effects of involvement in campus religious communities helped in establishing emotionally beneficial friendship networks making students delve more spiritually to be confident and committed at campuses (Bryant, 2007) with a positive relationship between the level of perceived discrimination and the percentage of campus friends who were of the same ethnicity but different religion (Shammas, 2009). Thus the role of interfaith leadership engaging religious diversity on campus and religious pluralism on college and university campuses (Patel & Meyer, 2009) influenced campus diversity in student’s experiences belonging especially to that of religious minority (Darnell Cole & Shafiqa Ahmadi, 2010). Religiously diverse students, specifically Muslim veiled women, share some of the same adverse experience on campus as culturally and ethnically diverse students (Seggie & Sanford, 2010). In this regard, the greatest help can be faculites who serve as social supports for underrepresented minorities, in particular as mentors with socio cultural and spiritual resources (Strayhorn, 2010). Never the less, student religious organisations on campus preserve religious orthodoxy in secular campuses by excluding non-believers from their organisation (Thro & Russo, 2010), with the grave need of levelling the sense of social belonging by religion alone (Thorat, 2010).

International Journal of Advance and Innovative Research Volume 5, Issue 4 (XII): October - December, 2018
3
ISSN 2394 - 7780
Spirituality and religion social indicators of university students (Yiengprugsawan, Seubsman, & Sleigh, 2012). Contradiction and conflict between ‘leading identities’ of becoming an engineer versus becoming a ‘good Muslim woman are counter backed by religion (Black & Williams, 2013). Differentiation of self-impacted relationships between spiritual well-being and both social justice commitment has intercultural competence (Sandage & Jankowski, 2013) with religion influencing social relation and lifestyle of people (Baloch, Chhachhar, & Singutt, 2014) and spirituality enhancing nurturing and caring (Yilmaz & Gurler, 2014). Among college student’s everyday theologies—personal religious beliefs that emerge through individuals’ lived experiences and social interactions— had influence of attitudes than religion (Walls, Woodford, & Levy, 2014). Communication and interaction patterns impact student spiritual identity formation among students over four-year period in undergraduate community institutions (Forward, Moore, Richardson, & Shimansky, 2014) as some observe that religion hampers students entrance and progress in education with slow growth and low level of attainment (Rissler, Duncan, & Caruso, 2014) with an off late player of academic staff at campus also witnessing spiritual intelligence on job burn out at campus (Karampoor & Beig, 2015).
Further the primary influence on gender inequality in education is through culture and religion (Cooray & Potrafke, 2011) Religion’s Impact on gender inequality in attitudes and outcomes persist as no single religion stands out as more gender inequitable than others transmitting stealth effects (Seguino, 2011). Spirituality is positive significant predictor of life satisfaction differing by gender (M. Khan, Shirazi, & Ahmed, 2011) contrarily with religiosity affecting sexuality diversifying by culture and race alone (Woo, Morshedian, Brotto, & Gorzalka, 2012). Therefore, ethno - centric niche persist as a thin line between cultural education and religious education (Fox, Buchanan, Eckes, & Basford, 2012).It is true that religion based stigma are experienced by students at campus (Mavhandu-mudzusi & Sandy, 2015) The inter faith co - curricular engagement impacts student’s pluralism orientation at campus (A. N. Rockenbach, Mayhew, Morin, Crandall, & Selznick, 2015). Religious and non - religious activity engagement as an emotional regulation acts as assets in promoting social ties throughout university (Semplonius, Good, & Willoughby, 2015) especially where social life and identity of women on campus varied by religion (Pschaida, 2015). In short, spiritual quality of life and spiritual coping is impacted by spirituality, religiousness and personal beliefs module (Krägeloh, Billington, Henning, & Chai, 2015) with spirituality increasing and religiosity decreasing at college and it varied by culture of students of minority race (Nunez & Foubert, 2015) having a positive bearing on underrepresented students in higher education (Hicks, 2016)
1.3 Physical Adaptation There is an inter relationship between spirituality religiosity and health (Tomasso, Beltrame, & Lucchetti, 2011) where spirituality was positively correlated with life satisfaction in india (M. Khan et al., 2011) and attachment to god impacts health risk-taking behaviour in college students (Horton, Ellison, Loukas, Downey, & Barrett, 2012). Spirituality impacts health of college students reducing health associated risk like alcohol and drugs (Nelms, Hutchins, Hutchins, & Pursley, 2007) while religious commitment and dispositional religious coping are protective against alcohol use (Menagi, Harrell, & June, 2008). Religious life on secular college campus today (Speers, 2008) are salience in shaping alcohol choices impacting student’s health (Ellison, Bradshaw, Rote, & Storch, 2008) with levels of spirituality (Pillon, Santos, Gonçalves, Araújo, & Funai, 2010) religious beliefs (Moore & Starlyn, 2013) and religious coping (Harrell & Powell, 2014) resulting in reduced levels of alchohol consumptions. This is further supported as a negative relationship were found between a student’s level of spirituality and their licit and illicit drug use (Jules et al., 2015) Spirituality and religion impacts health and well-being acting as virtual social indicators of university students (Yiengprugsawan et al., 2012). Spirituality impacts health (Gonçalves, Helena, Osório, & Oliveira, 2015) varying by gender (Shaikh, Kamal, & Naqvi, 2015). However, Religion influences sexual attitude and behaviour among students (Odimegwu, 2005) with noticeably sexual behaviours of student of race being influenced by sexual attitudes, religiousness, and spirituality (Luquis, Brelsford, & Pe, 2014). Hence spirituality impacts education on sexual tension in cross sexual relationships (George, Adalikwu-Obisike, Boyko, Johnson, & Boscanin, 2014) with religiosity vehemently impacting sexual attitude and behaviour among college students (Onyebuchukwu, Sholarin and Emerenwa, 2015). Apart from these, university micro environments impacted eating behaviours among undergraduate students, mediated by the role of religion (Tanton, Dodd, Woodfield, & Mabhala, 2015) and ratings of conscientiousness from physical appearance predict undergraduate academic performance (Di Domenico, Quitasol, & Fournier, 2015).
1.4 Psychological Adaptation Religious faith positively impacted psychological wellbeing as it is strength of religious faith that impacts psychological functioning among university students (Plante, Yancey, Sherman, & Guertin, 2000). The fear of rejection was predictive of lower religious commitment and lower levels of adjustment to college by students

International Journal of Advance and Innovative Research Volume 5, Issue 4 (XII): October - December, 2018
4
ISSN 2394 - 7780
(Schludermann et al., 2001) while strength of religious faith had a no positive effect in coping stress adding less to physical and mental health (Plante, Saucedo, & Rice, 2001). However, it is though acknowledged that spirituality acts as a motivation (Hodge, 2003) as it is religion via spirituality that binds students on psychological sense of community (Bohus, Jr, Chan, Woods, & Chan, 2005); It is higher levels of religiousness and religious coping was associated with poorer levels of adjustment among college students (Edmondson & Park, 2009)
Spirituality impacts mental health of students (Bonab, Hakimirad, & Habibi, 2010) as it is forgiveness, spiritual instability, mental health symptoms that impacts wellbeing with mediator of self (Sandage & Jankowski, 2010). On the contrary, spirituality is also said to have a negative relationship with mental health where the spiritual dimensions of relation with god, finding meaning in life, spiritual actualization and activities (Bonab et al., 2010) with cultural differences in religious coping resulted in stress impacting quality of life of students (Pei, Chai, Krägeloh, & Billington, 2011) varying by gender(Yadav, Khanna, & Singh, 2016).Taking this further, generativity, relational spirituality, and gratitude impacts mental health (Sandage, Hill, & Vaubel, 2011) as it is religious fundamentalism that lead to system justifying thoughts (Dirilen-Gumus, 2011) even to that of forming religious belief by race. (Taylor & Merino, 2011). The relational spirituality observed thereon with differentiation of self and virtue predicts intercultural development (Sandage & Harden, 2011) as more often religious belief play a psychologically protective role for low Socio economic individuals who are independent of realistic economic concerns.(Brandt & Henry, 2012).Religiousness is found to be more positively intrinsic (Taunay et al., 2012) with most college students witnessing the spiritual struggle of powerful adverse impact on adjustment influencing loss of distress among them. (Wortmann, Park, & Edmondson, 2012) as it is noted that psychological distress increases religious involvement, which then increases purpose in life and social support that then lead to lower psychological distress (Wang, Koenig, Ma, & Shohaib, 2016). Spirituality also prepares undergraduate students to recognise spiritual cues and learn to assess and provide spiritual care (Cone & Giske, 2012) with spiritual dwelling influencing the wellbeing in distressed adults (Jankowski & Sandage, 2012). An extended view in this regard could be of the college student’s religious affiliation that influences wellbeing in them (N. A. Bowman & Small, 2012). The psychosocial approach to religious fundamentalism among university students found psychosocial configurations organised around gender (Valladares, Carvajal, & García, 2013).
Delving towards spirituality reduces stress among students of Indian institute of technology Bombay (Yadav & Khanna, 2014) with parent’s religious involvement influenced psychological health, family functioning and development of their children (Kong & Chan, 2014). The purpose in life is also said to mediate relationship between religiosity and happiness (Aghababaei & Błachnio, 2014). spirituality influenced quality of life of undergraduate students impacting cognitive and psychosocial development (Lau, Hui, Lam, Lau, & Cheung, 2015). Thus there is a relationship between religion and spirituality and students who are religious have better mental health (Ahmadi & Shahmohammadi, 2015) with observed positive psychosocial functioning in adolescents and young adults (Sanders et al., 2015).Spirituality among students helps to combat anxiety (ECL et al., 2015) and it tethered that student’s resiliency can be predicted by spirituality (Mehrinejad, Tarsafi, & Rajabimoghadam, 2015) Religious belief aspects and customs with religiousness (Ahmadi & Shahmohammadi, 2015) enhances quality of life with religious awareness (Parniyan, Kazemiane, Jahromi, & Poorgholami, 2016) required especially among students of minority race, low socio economic status students at first academic year (Zhao et al., 2015). Of late, Prayers, the aspect mostly ignored by students at higher education at large could help in restoring the mental wellbeing (Shaikh et al., 2015). Religion also helps to combat depression and home sickness among college students (Longo & Kim-spoon, 2013) which is higher among first generation students than non first generation students (Ferrari, Drexler, & Skarr, 2015). In brief, spirituality undoubtedly impacts mental health (Karimipour & Md.Sawar, 2015) with its extended hand of attitude towards the external environment with nature at its green side (Nunn et al., 2016) and religiousness soaring high on psychological outcomes with subjective well being impacting life satisfaction(Aghababaei et al., 2016)
1.5 Institution Student Spiritual Identity is formed at religious affiliated university to a greater extent (Forward et al., 2014) Persistence patterns of religious minority students are at a greater level of introspection in religious affiliated universities (Patten & Rice, 2008) as it is observed that attendance at religious services influences persistence and retention of students at four-year higher education institutions (Burks & Barrett, 2009). Further individual privileged religious experience impacts spiritual development of students within dynamics of institution (N. A. Bowman & Small, 2010) especially when religion performs a support factor function among women of race or colour impacting their persistence towards degree attainment (Ceglie, 2013). Moreover, attending an institution with an inclusive religious worldview climate is positively associated with participation in student engagement (N. a. Bowman, Rockenbach, & Mayhew, 2015).

International Journal of Advance and Innovative Research Volume 5, Issue 4 (XII): October - December, 2018
5
ISSN 2394 - 7780
The study proposes the following research hypothesis H1: - Campus adaptations of academic, social, physical – psychological and institutional environments do not vary among undergraduate students by their religion.
H1a: - There is a significant difference among undergraduate students across religion in campus adaptations of academic, social, physical – psychological and institutional adaptations.
2. METHODS 2.1 Participant The reference population were undergraduate 4-year B. tech students enrolled on a regular study mode at IIT’s and NIT’s. A total of 1460 students participated with 1420 of valid responses for an overall 97.26 percent participation rate after deducting the questionnaire that contained empty answers. Data was collected for 20 weeks across institutions of IIT’s and NIT’s. Of the 1420 undergraduate respondents, 84.9% were Hindus and 3.16% were Muslims, Students belonging to other minority communities were Christians with 2.04%, Jains with 1.69%, Sikh with 0.56%, Buddhist with 0.21%. However, the student population who surprisingly did not want to associate themselves with any religion loomed large with associating themselves with being called Indian – 1.97%, humanity – 1.05%, Atheist – 2.46% and not applicable – 1.83%.
2.2 Sampling Probability sampling technique followed by cluster sampling in identification of institutes of IIT’s and NIT’s was adopted. This is followed up with stratified sampling in sample choice of undergraduate students’ population and simple random in collecting data from the chosen student population stated above.
2.3 Instrument and Procedure The survey was conducted using a structured online questionnaire with reference to student’s campus and non - campus email accounts. At all times, the students were informed of the anonymous, confidential, and voluntary nature of their participation and any doubts that arose were clarified.
2.4 Measures All the 21 items in the questionnaire were measured with rating on a five point Likert scale ranging from “1 = strongly disagree” to “5 = strongly Agree”. Reliability and validity of the questionnaire was tested
3. DATA ANALYSIS Multivariate analyses of variance (MANOVA) were conducted to asses’ religious group differences in campus adaptation. This was followed by discriminant analysis to determine the nature of effect of campus adaptations by each religious group. There are several assumptions behind a MANOVA, including multivariate normality, linearity of relationships, low influence of univariate and multivariate outliers, homogeneity of variance– covariance matrices and an absence of multicollinearity. Each assumption was tested, and no serious violations were noted.
Table-1: Pearson Correlation Campus Adaptation 1 2 3 4 M SD
1.Academic Adaptation 1.00 . . 2.60 0.702 2.Social Adaptation 0.580 1.00 . 2.72 0.755
3.Physical – Psychological Adaptation 0.523 0.575 1.00 . 2.28 0.771 4.Institutional Adaptation 0.575 0.614 0.789 1.00 2.14 0.784
Note :- n = 1420 .Correlations greater than 0.05 are statistically significant (p < 0.5)
A Pearson product moment correlation analysis, that examined the relationship between campus adaptations revealed correlations greater than 0.05, hence statistically significant
Table-2: Distribution of difference in dimensions of campus adaptations Campus Adaptation
Religion Academic Social Physical - Psychological
Institutional
Mean Std. Dev Mean Std. Dev Mean Std. Dev Mean Std. Dev Hinduism (n = 1206) 2.59 0.698 2.72 0.751 2.29 0.771 2.14 0.783
Islamism (n = 45) 2.82 0.719 2.81 0.752 2.51 0.850 2.32 0.839 Christianity (n = 29) 2.61 0.643 2.78 0.647 2.20 0.684 2.17 0.782
Jainism (n =24) 2.38 0.621 2.54 0.826 2.02 0.794 1.70 0.640 Sikhism (n = 8) 2.43 0.462 2.82 0.704 2.20 0.770 2.00 0.501

International Journal of Advance and Innovative Research Volume 5, Issue 4 (XII): October - December, 2018
6
ISSN 2394 - 7780
Buddhism (n = 3) 2.44 0.254 2.01 0.916 2.33 0.577 2.00 0.871 Indian (n = 28) 2.78 0.755 2.51 0.747 2.12 0.820 2.09 0.780
Humanity (n = 15) 2.73 0.720 2.81 0.860 2.32 0.679 2.24 0.764 Atheist (n = 35) 2.65 0.860 2.82 0.841 2.25 0.672 2.19 0.698
Not Applicable (n = 26) 2.57 0.761 2.83 0.794 2.28 0.841 2.18 0.997 Total (n =1420) 2.60 0.702 2.72 0.755 2.28 0.771 2.14 0.784
3.1 Descriptive statistics The mean in the descriptive statistics indicate that among undergraduate B.Tech students, students enjoyed high level of social adaptation irrespective religion , with students following Hinduism (M = 2.72 , SD = 0.751), Christianity (M = 2.78 , SD = 0.647), Jainism (M = 2.54, SD = 0.826) Sikhism (M = 2.82, SD = 0.704) and students who did not like to associate themselves with religion by stating themselves as humanity also had high social adaptation (M = 2.81, SD = 0.860) atheist (M = 2.82, SD = 0.841) also not applicable (M = 2.83, SD = 0.794) however Muslim , Buddhism and students who stated themselves as Indians had high level of academic adaptation (M =2.82, SD = 0.719), (M = 2.44, SD = 0.254) and (M = 2.78, SD = 0.755)
However, across religions students had low level of institutional adaptation, with Hinduism (M = 2.14, SD = 0.783), Islamism (M = 2.32, SD = 0.839), Christianity (M = 2.17, SD = 0.782) Jainism (M = 1.70, SD = 0.640), Sikhism (M = 2.00, SD = 0.501) Buddhism (M = 2.01, SD = 0.871) Indian (M = 2.09, SD = 0.780) humanity (M =2.24, SD = 0.764) atheist (M = 2.19, SD = 0.698) not applicable (M = 2.18, SD = 0.997)
Further within Academic Adaptation, student who followed Islam religion had high level of impact on adaptation (M = 2.82, SD = 0.719) and Sikhism sect students had low level of adaptation (M = 2.43, SD = 0.462)
In Social Adaptation, not applicable students had high level of impact on adaptation (M = 2.83, SD = 0.794) and Buddhism sect impacted in low level of adaptation (M = 2.01, SD = 0.916)
In Physical – Psychological adaptation, Islamism students had high impact on level of adaptation (M = 2.51, SD = 0.850) and Jainism impacted in low level of adaptation (M = 2.02, SD = 0.770)
In Institutional adaptation, Islamism students had high impact on student’s level of adaptation (M = 2.32, SD = 0.839) and Jainism impacted on student’s low level of adaptation (M = 1.70, SD = 0.640)
Overall, across campus adaptations and fathers educational level groups, students had high level of social adaptation (M = 2.72, SD = 0.755) and low level of Institutional adaptation (M = 2.14, SD =0.784). However, within religious sect, religion as not applicable to them had high level of social adaptation (M = 2.83, SD = 0.794) and Jainism had low level of institutional adaptation (M = 1.70, SD = 0.640)
3.2 Inferential statistics The Box’s M value of 82.555 indicates test of assumption of equality of covariance matrices are roughly equal as assumed with p = 0.613 (p ≥ 0.001).
Using Manova test statistic of Pillai’s Trace, there was a non-significant effect of student’s religious entity on student’s campus adaptations of Academic, Social, Physical – Psychological and Institutional environments (V = 0.032, F (40, 5636) = 1.132 and p = 0.261) *(p > 0.05).
Using Manova test statistic of Wilk’s Lambda, there was a non-significant effect of student’s religious entity on student’s campus adaptations of Academic, Social, Physical – Psychological and Institutional (Λ = 0.968, F (40,5333) = 1.132 and p = 0.262) *(p > 0.05).
Using Manova test statistic of Hotelling’s trace, there was a non-significant effect of student’s religious entity on student’s campus adaptations of Academic, Social, Physical – Psychological and Institutional (T = 0.032, F (40, 5618) = 1.132 and p = 0.262) *(p > 0.05).
Using Manova test statistic of Roy’s largest root, there was a significant effect of student’s religious entity on student’s campus adaptations of Academic, Social, Physical – Psychological and Institutional (Θ = 0.015, F (10, 1409) = 2.091 and p = 0.022) *(p > 0.05).
The univariate test statistic with levenes test of equality of variances for each of the dependent variable is non-significant with academic adaptation of 0.365, social adaptation of 0.557, physical – psychological adaptation of 0.871 and institutional adaptation of being close to 0.394 enabling the assumptions of homogeneity of variance being met.

International Journal of Advance and Innovative Research Volume 5, Issue 4 (XII): October - December, 2018
7
ISSN 2394 - 7780
However separate univariate analysis or anova on the outcome with F (10, 1409) for Academic, social, Physical – Psychological and institutional adaptation revealed a non-significant effect with F value (1.018) (1.164) (1.055) (1.277) and p value (0.426) (0.311) (0.395) (0.238) greater than 0.05 Further the between – subjects SSCP matrix indicates that the sum of squares for the error SSCP matrix are substantially bigger than in the model (or religious level) SSCP matrix, whereas absolute values of cross products are fairly similar. This pattern of relationship indicates that the relationship between dependent variables is significant than individual dependent variables themselves. Thus to determine the nature of effect of religious entity among dependent variables Manova is followed with discriminant analysis The first discriminant function explained 46 % of the variance with canonical R2 = 0.015; the second discriminant function explained 28.4 % of the variance with canonical R2 = 0.009; the third discriminant function explained 18.7 % of the variance with canonical R2 = 0.006; the fourth discriminant function explained 6.9 % of the variance with canonical R2 = 0.002 indicates that the variance in the canonical derived dependnant variable was associated for religious level In combination these discriminant functions did not significantly discriminate among the religious groups. The first discriminant function Λ = 0.968, x2 (40) 45.255, p = 0.262 (p > 0.05) The second discriminant function Λ = 0.983, x2 (27) 24.464, p = 0.604 (p > 0.05). The third discriminant function Λ = 0.992, x2 (16) 11.621, p = 0.770 (p > 0.05) and the fourth discriminate function Λ = 0.998, x2 (7) 3.151, p = 0.871 (p > 0.05). The correlations between outcomes and the discriminant functions revealed that institutional adaptation loaded highly on second function (r = 0.984) indicating it contributed more to the age group separation (Bragman, 1970) than the relatively fair high loading in positive relationship with first function (r = 0.053) and third function (r = 0.161) with negative relationship in fourth function (r = - 0.047); Physical - Psychological adaptation loaded highly on second function (r = 0.697) indicating it contributed more to the religious group separation than the relatively high loading in positive relationship with first function (r = 0.134) third function (r = 0.664) and fourth function (r = 0.235); Social adaptation loaded highly on second function with (r = 0.642) indicating it contributed more to the religious group separation than the than relatively fair high loading in the first function (r = 0.499) and fourth function (r = 0.571) with negative relationship from the third function (r = -0.111) Lastly academic adaptation loaded highly on fourth function with (r = 0.646) indicating it contributed more to the religious group separation than the relatively fair high loading in positive relationship with second function (r = 0.642) with negative relationship in third function (-0.033) 4. FINDINGS Hinduism as a religious sect had positive outcomes on academic (0.010) and Physical –Psychological (0.011) adaptation with negative outcomes on social (-0.003) and institutional (-0.010) adaptation Students who practised Islamism faith had positive social (0.212) Physical – Psychological (0.189) and institutional (0.173) adaptation with negative outcome on academic adaptation (-0.180) Christian students had positive outcomes in academic (0.048) and social (0.079) adaptation with negative outcomes in Physical – Psychological (-0.252) and institutional (-0.036) adaptation Jain sect students had positive outcomes in academic (0.086) Physical – Psychological (0.022) and institutional (0.158) adaptation with negative outcomes in social (-0.580) adaptation. Sikhism sect students had positive outcomes in academic (0.409) and institutional (0.082) adaptation with negative outcomes in Social (-0.196) and Physical – Psychological (-0.078) adaptation Buddhism sect students had positive outcomes in Physical – Psychological (0.740) adaptations with negative outcomes in academic (- 0.787) social (- 0.293) and institutional (-0.519) Students who stated themselves outside religious sect as Indian, humanity, atheist and not applicable – all of them had positive institutional adaptation (0.008) (0.086) (0.040) and (0.000). However, academic (-0.606) social (-0.004) Physical – Psychological (-0.201) adaptation had negative outcome among students who preferred to state themselves as Indians. Students who referred to themselves as humanitarian had positive outcomes in social adaptation (0.146) with negative outcomes in academic (-0.073) and Physical – Psychological adaptation (-0.107) Students who referred to themselves as atheist or non-believer in god or religious faith had positive academic (0.055) and social (0.092) adaptation with negative outcomes in Physical – psychological adaptation (-0.193)

International Journal of Advance and Innovative Research Volume 5, Issue 4 (XII): October - December, 2018
8
ISSN 2394 - 7780
Students who denied the applicability on religion on them had positive outcomes on academic (0.210) and social (0.055) adaptation with negative outcome on Physical – psychological (-0.107) adaptation.
In brief the alternate hypothesis (H1) is accepted and the null hypothesis (H0) is rejected at p < 0.05.
In short, campus adaptations vary across religion of engineering undergraduate students.
5. CONCLUSION Religion being the most sensitive issue in a country like India is often hyper testified amidst secularist objective of promotion. The association through religious practises and coping be it to dietary practises or frequenting to religious shrine, student as a social being does carry the bandwagon of religious identity from young which cannot be unshouldered all of a sudden, though might be minimised in its eventual being at crowded campuses.
6. IMPLICATION The identification of students apart from being associated to a religious sect is a promising scenario that campuses stand tall and fair in their being and individuality, irrespective to the multiple religious’ sect to which a student belongs or less identifies with. Never the less, atheist students are less inclined than are their peers to perceive a positive campus climate for nonreligious students (A. N. Rockenbach, Mayhew, & Bowman, 2015)
Campuses are known for its vivid diversity and religion being a vital part of it is less agglomerated by the student population themselves showcasing that being part of campus as an individual student with its learning and socialising perspective is much more important than associating the identity of oneself with religion and coping of religious practises. This sensitive issue has been humanised by students at large who often dream to have ‘one’ unified society loomed large.
REFERENCES 1. Abdel-Khalek, A. M. ., & Lester, D. (2015). Self – Reported religiosity in kuwaiti and American college
students, Psychological Reports: Sociocultural Issues in Psychology, 116(3), 986–989.
2. Aghababaei, N., & Błachnio, A. (2014). Purpose in life mediates the relationship between religiosity and happiness: evidence from Poland. Mental Health, Religion & Culture, 17(8), 827–831. http://doi.org/10.1080/13674676.2014.928850
3. Aghababaei, N., Sohrabi, F., Eskandari, H., Borjali, A., Farrokhi, N., & Chen, Z. J. (2016). Predicting subjective well-being by religious and scientific attitudes with hope, purpose in life, and death anxiety as mediators. Personality and Individual Differences, 90(FEBRUARY), 93–98. http://doi.org/10.1016/j.paid.2015.10.046
4. Ahmadi, A., & Shahmohammadi, N. (2015). Studying the Relationship between Mental Health, Spirituality and Religion in Female Students of Tehran Azad University: South Branch. Procedia - Social and Behavioral Sciences, 205(May), 236–241. http://doi.org/10.1016/j.sbspro.2015.09.065
5. Arndt, M., & Bruin, G. De. (2006). Attitudes toward Lesbians and Gay men relations with gender, race and religion among university students. Psychology in Society, 33, 16–30. Retrieved from http://www.pins.org.za/pins33/Arndt & de Bruin.pdf
6. Aruguete, M. S., Goodboy, A. K., Jenkins, W. J., Mansson, D. H., & Mccutcheon, L. E. (2012). Does Religious Faith Improve Test Performance ? NORTH AMERICAN JOURNAL OF PSYCHOLOGY, 14(1), 185–196.
7. Baloch, G. M., Chhachhar, A. R., & Singutt, W. V. (2014). Influence of Religion on Life Style and Social Behavior in Christianity . Perspective of Malaysian Christian Students. Journal of Basic and Applied Scientific Research, 4(4), 300–307.
8. Barmola, K. (2016). Spirituality and Motivation of College Students. The International Journal of Indian Psychology, 3(2), 84–88.
9. Black, L., & Williams, J. (2013). Contradiction and conflict between “leading identities”: becoming an engineer versus becoming a “good muslim” woman. Educational Studies in Mathematics, 84(1), 1–14. http://doi.org/10.1007/s10649-013-9481-7
10. Bohus, S., Jr, R. H. W., Chan, K. C., Woods, R. H., & Chan, K. C. (2005). Psychological Sense of Community Among Students on religious Collegiate campuses in the Christian Evangelical Tradition. Christian Higher Education, 4(1), 19–40. http://doi.org/10.1080/153637590507423

International Journal of Advance and Innovative Research Volume 5, Issue 4 (XII): October - December, 2018
9
ISSN 2394 - 7780
11. Bonab, B. G., Hakimirad, & Habibi. (2010). Relation between mental health and spirituality in Tehran University student. Procedia - Social and Behavioral Sciences, 5(2), 887–891. http://doi.org/10.1016/j.sbspro.2010.07.204
12. Bowman, N. a., Rockenbach, A. N., & Mayhew, M. J. (2015). Campus Religious/Worldview Climate, Institutional Religious Affiliation, and Student Engagement. Journal of Student Affairs Research and Practice, 52(1), 24–37. http://doi.org/10.1080/19496591.2015.996045
13. Bowman, N. A., & Small, J. L. (2010). Do College Students Who Identify with a Privileged Religion Experience Greater Spiritual Development? Exploring Individual and Institutional Dynamics. Research in Higher Education, 51(7), 595–614. http://doi.org/10.1007/s11162-010-9175-2
14. Bowman, N. A., & Small, J. L. (2012). Exploring a Hidden Form of Minority Status: College Students’ Religious Affiliation and Well-Being. Journal of College Student Development, 53(4), 491–509. http://doi.org/10.1353/csd.2012.0050
15. Brandt, M. J., & Henry, P. J. (2012). Psychological Defensiveness as a Mechanism Explaining the Relationship Between Low Socioeconomic Status and Religiosity. The International Journal for the Psychology of Religion, 22(4), 321–322. http://doi.org/10.1080/10508619.2011.646565
16. Bryant, A. N. (2007). The Effects of Involvement in Campus Religious Communities on College Student Adjustment and Development. Journal of College and Character, 8(3), 1–26. http://doi.org/10.2202/1940-1639.1178
17. Bryant, A. N. (2011). The Impact of Campus Context, College Encounters, and Religious/Spiritual Struggle on Ecumenical Worldview Development. Research in Higher Education, 52(5), 441–459. http://doi.org/10.1007/s11162-010-9205-0
18. Burks, S. A., & Barrett, T. G. (2009). Student Characteristics and Activity Choices of College Freshmen and their Intent to Persist in Religiously Affiliated Institutions. Christian Higher Education, 8(5), 351–392. http://doi.org/10.1080/15363750902917276
19. Ceglie, R. (2013). Religion as a Support Factor for Women of Color Pursuing Science Degrees : Implications for Science Teacher Educators. Journal of Science Teacher Education, 24, 37–65. http://doi.org/10.1007/s10972-012-9286-z
20. Cone, P. M. H., & Giske, T. (2012). Teaching spiritual care : A grounded theory study among undergraduate nursing educators. Journal of Clinical Nursing, (April), 1–11. http://doi.org/10.1111/j.1365-2702.2012.04203.x
21. Cooray, A., & Potrafke, N. (2011). Gender inequality in education : Political institutions or culture and religion ? European Journal of Political Economy, 27(2), 268–280. http://doi.org/10.1016/j.ejpoleco.2010.08.004
22. Cragun, R. T., Henry, P., Mann, M., & Russell Krebs, S. (2014). Chapel Use on College and University Campuses. Journal of College and Character, 15(2), 103–118. http://doi.org/10.1515/jcc-2014-0014
23. Darnell Cole, & Shafiqa Ahmadi. (2010). Reconsidering Campus Diversity: An Examination of Muslim Students’ Experiences. The Journal of Higher Education, 81(2), 121–139. http://doi.org/10.1353/jhe.0.0089
24. Di Domenico, S. I., Quitasol, M. N., & Fournier, M. A. (2015). Ratings of Conscientiousness from Physical Appearance Predict Undergraduate Academic Performance. Journal of Nonverbal Behavior, 39(4), 339–353. http://doi.org/10.1007/s10919-015-0213-9
25. Dirilen-Gumus, O. (2011). Differences in system justification with respect to gender, political conservatism, socio-economic status and religious fundamentalism. Procedia - Social and Behavioral Sciences, 30, 2607–2611. http://doi.org/10.1016/j.sbspro.2011.10.510
26. Duffy, R. D., & Blustein, D. L. (2005). The relationship between spirituality , religiousness , and career adaptability. Journal of Vocational Behavior, 67, 429–440. http://doi.org/10.1016/j.jvb.2004.09.003
27. ECL, C., DH, I., CC, M., LC, C., AM, S., & EC, C. (2015). Anxiety and spirituality in university students : a cross-sectional study. REVISTA BRASILEIRA DE ENFERMAGEM, 68(3), 444–449. http://doi.org/10.1590/0034-7167.2015680318i

International Journal of Advance and Innovative Research Volume 5, Issue 4 (XII): October - December, 2018
10
ISSN 2394 - 7780
28. Edmondson, D., & Park, C. (2009). Shifting foundations: religious belief change and adjustment in college students. Mental Health, Religion & Culture, 12(3), 289–302. http://doi.org/10.1080/13674670802627339
29. Ellison, C. G., Bradshaw, M., Rote, S., & Storch, J. (2008). Religion and Alcohol Use among College Students: Exploring the Role of Domain-Specific Religious Salience. Journal of Drug Issues, 38, 821–846. http://doi.org/10.1177/002204260803800308
30. Ferrari, J. R., Drexler, T., & Skarr, J. (2015). Finding a spiritual home: A pilot study on the effects of a spirituality retreat and loneliness among urban homeless adults. Psychology, 6(3), 210–216. http://doi.org/10.4236/psych.2015.63020
31. Finnegan, D. E. (2007). The College “Y”: Student Religion in the Era of Secularization (review). The Review of Higher Education, 31(2), 243–244. http://doi.org/10.1353/rhe.2007.0068
32. Fisher, J. W. (2009). Understanding and Assessing Spiritual Health. In International handbook of education for spirituality, care and well-being. (pp. 1–34). http://doi.org/10.1007/978
33. Forward, G. L., Moore, J., Richardson, M., & Shimansky, M. (2014). “Children of a Lesser God:” The Effects of Communication and Interaction Patterns on Student Spiritual Identity at a Church-Related University. Studies in Media and Communication, 2(1). http://doi.org/10.11114/smc.v2i1.326
34. Fox, R. A., Buchanan, N. K., Eckes, S. E., & Basford, L. E. (2012). The Line Between Cultural Education and Religious Education: Do Ethnocentric Niche Charter Schools Have a Prayer? Review of Research in Education, 36, 282–305. http://doi.org/10.3102/0091732X11420808
35. George, D., Adalikwu-Obisike, J., Boyko, J., Johnson, J., & Boscanin, A. (2014). Harry and Sally Revisited: The Influence of Spirituality and Education on Sexual Tension in Cross-Sex Friendships in Secular and Christian Universities. Journal of Research on Christian Education, 23(1), 70–94. http://doi.org/10.1080/10656219.2014.882721
36. Gonçalves, L. M., Helena, I., Osório, S., & Oliveira, L. L. (2015). Learning from Listening: Helping Healthcare Students to Understand Spiritual Assessment in Clinical Practice. Journal of Religion and Health, (March 2016), 1–17. http://doi.org/10.1007/s10943-015-0146-y
37. Good, M., & Willoughby, T. (2011). Evaluating the Direction of Effects in the Relationship Between Religious Versus Non-Religious Activities , Academic Success , and Substance Use. Journal of Youth and Adolescence, 40, 680–693. http://doi.org/10.1007/s10964-010-9581-y
38. Halsmer, D., Butay, E., Hase, B., McDonough, S., Tryon, T., & Weed, J. (2010). Exploring connections between engineering and human spirituality. In ASEE Annual Conference and Exposition, Conference Proceedings.
39. Harrell, Z. A. T., & Powell, K. (2014). The Relationship Between Parent and Student Religious Coping and College Alcohol Use. Journal of Religion and Health, 53, 895–903. http://doi.org/10.1007/s10943-013-9683-4
40. Hicks, T. (2016). Spirituality Research Studies in Higher Education University Press of America , Inc . Spiritualty Research Studies in Higher Education. http://doi.org/10.13140/2.1.3984.8005
41. Hodge, D. R. (2003). The Intrinsic Spirituality Scale : A New Six-Item Instrument for Assessing the Salience of Spirituality as a Motivational Construct. Journal of Social Service Research, 30(1), 41–61. http://doi.org/10.1300/J079v30n01
42. Horton, K. D., Ellison, C. G., Loukas, A., Downey, D. L., & Barrett, J. B. (2012). Examining Attachment to God and Health Risk-Taking Behaviors in College Students. Journal of Religion and Health, 51(2), 552–566. http://doi.org/10.1007/s10943-010-9380-5
43. Hsien-Chuan Hsu, P., Krägeloh, C. U., Shepherd, D., & Billington, R. (2009). Religion/spirituality and quality of life of international tertiary students in New Zealand: an exploratory study. Mental Health, Religion & Culture, 12(4), 385–399. http://doi.org/10.1080/13674670902752920
44. Hwzhhq, S. W. K. H., Dqg, G., Phulfdq, P. I., Sanchez, D., & Carter, R. T. (2005). Exploring the Relationship Between Racial Identity and Religious Orientation Among. Journal of College Student Development, 46(3), 280–295. http://doi.org/10.1353/csd.2005.0031

International Journal of Advance and Innovative Research Volume 5, Issue 4 (XII): October - December, 2018
11
ISSN 2394 - 7780
45. Jackson, L., Mark Pancer, S., Pratt, M. W., & Hunsberger, B. E. (2001). Great Expectations: The Relation Between Expectancies and Adjustment During the Transition to University’. Journal of Applied Social Psychology, 30(10), 2100–2125. http://doi.org/10.1111/j.1559-1816.2000.tb02427.x
46. Jankowski, P. J., & Sandage, S. J. (2012). Spiritual dwelling and well-being: the mediating role of differentiation of self in a sample of distressed adults. Mental Health, Religion & Culture, 15(4), 417–434. http://doi.org/10.1080/13674676.2011.579592
47. Jejeebhoy, shireen j, & Sathar, zeba A. (2001). Women ’ s Autonomy in India and Pakistan : The Influence of religion and region. Population and Development Review, 27(December), 687–712.
48. Jelen, T. G., & Lockett, L. A. (2014). Religion, Partisanship, and Attitudes Toward Science Policy. SAGE Open, 4, 1–8. http://doi.org/10.1177/2158244013518932
49. Joshanloo, M. (2012). Investigation of the factor structure of spirituality and religiosity in Iranian Shiite university students. International Journal of Psychology, 47(3), 211–221. http://doi.org/10.1080/00207594.2011.617372
50. Jules, M. A., Noh, S., Hamilton, H., Brands, B., Gastaldo, D., Wright, M. G. M., … Khenti, A. (2015). Spirituality, gender, and drug use among students from one University in Barbados . Texto E Contexto Enfermagem, 24(April), 117–124. http://doi.org/10.1590/0104-07072015001140014
51. Karampoor, H., & Beig, S. R. (2015). Studying the relationship between spiritual intelligence and job burnout of Payame Noor University staff. International Journal of Review in Life Sciences, 5(6), 1072–1078.
52. Karimipour, M., & Md.Sawar, S. S. (2015). Scrutinizing the Effect of Spirituality on Huffaz students Mental Health In Itqan Institute. Research Journal of Social Science and Management, 5(7), 92–96.
53. Khan, M., Shirazi, M., & Ahmed, M. (2011). Spirituality and life satisfaction among Adolescents in India . Journal of Subcontinent Researches, 3(7), 71–84.
54. Khan, Z. H., Watson, P. J., Naqvi, A. Z., Jahan, K., & Chen, Z. J. (2015). Muslim Experiential Religiousness in Pakistan : Meaning in Life , General Well-Being and gender differences. Mental Health Religion and Culture, 1–12. http://doi.org/http://dx.doi.org/10.1080/13674676.2015.1079602
55. Kong, H., & Chan, J. W. K. Y. Y. (2014). Parents ’ Religious Involvement , Family Socialization and Development of Their Children in a Chinese Sample. Social Indicators Research, 117, 987–1010. http://doi.org/10.1007/s11205-013-0371-2
56. Krägeloh, C. U., Billington, D., Henning, M. A., & Chai, P. (2015). Spiritual quality of life and spiritual coping: evidence for a two-factor structure of the WHOQOL spirituality, religiousness, and personal beliefs module. Health and Quality of Life Outcomes, 13(1), 26. http://doi.org/10.1186/s12955-015-0212-x
57. Krägeloh, C. U., Chai, P. P. M., Shepherd, D., & Billington, R. (2012). How Religious Coping is Used Relative to Other Coping Strategies Depends on the Individual’s Level of Religiosity and Spirituality. Journal of Religion and Health, 51(4), 1137–1151. http://doi.org/10.1007/s10943-010-9416-x
58. Lau, W. W. F., Hui, C. H., Lam, J., Lau, E. Y. Y., & Cheung, S.-F. (2015). The relationship between spirituality and quality of life among university students: An autoregressive cross-lagged panel analysis. Higher Education, 69(6), 977–990. http://doi.org/10.1007/s10734-014-9817-y
59. Longo, G. S., & Kim-spoon, J. (2013). Homesickness in college students : the role of religion in combating depression. Mental Health, Religion & Culture, 16(5), 489–500. http://doi.org/10.1080/13674676.2012.696600
60. Luquis, R. R., Brelsford, G. M., & Pe, M. A. (2014). Exploring Latino College Students ’ Sexual Behaviors in Relation to Their Sexual Attitudes , Religiousness , and Spirituality. Journal of Religion and Health, 1–13. http://doi.org/10.1007/s10943-014-9929-9
61. Mansor, N., & Syahidah, N. (2012). Spiritual well-being of INSTED , IIUM Students and its Relationship with College Adjustment. Procedia - Social and Behavioral Sciences, 69(Iceepsy), 1314–1323. http://doi.org/10.1016/j.sbspro.2012.12.068
62. Martin-Hansen, L. M. (2008). First-Year College Students’ Conflict with Religion and Science. Science & Education, 17(4), 317–357. http://doi.org/10.1007/s11191-006-9039-5

International Journal of Advance and Innovative Research Volume 5, Issue 4 (XII): October - December, 2018
12
ISSN 2394 - 7780
63. Mavhandu-mudzusi, A. H., & Sandy, P. T. (2015). Religion-related stigma and discrimination experienced by lesbian , gay , bisexual and transgender students at a South African rural-based university university. Culture Health & Sexuality, (April 2016), 1–11. http://doi.org/10.1080/13691058.2015.1015614
64. Mayhew, M. J. (2004). Exploring the essence of spirituality: A phenomenological study of eight students with eight different worldvews. NASPA Journal, 41(3), 647–674. http://doi.org/10.2202/1949-6605.1392
65. Mayhew, M. J., Bowman, N. A., & Rockenbach, A. B. (2014). Silencing Whom ? Linking Campus Climates for Religious , Spiritual , and Worldview Diversity to Student Worldviews. The Journal of Higher Education, 85(2), 219–245. http://doi.org/10.1353/jhe.2014.0005
66. Mayrl, D., & Oeur, F. (2009). Religion and Higher Education: Current Knowledge and Directions for Future Research. Journal for the Scientific Study of Religion, 48(2), 260–275. http://doi.org/10.1111/j.1468-5906.2009.01446.x
67. Mehrinejad, S. A., Tarsafi, M., & Rajabimoghadam, S. (2015). Predictability of Students’ Resiliency by Their Spirituality. Procedia - Social and Behavioral Sciences, 205(May), 396–400. http://doi.org/10.1016/j.sbspro.2015.09.024
68. Menagi, F. S., Harrell, Z. A. T., & June, L. N. (2008). Religiousness and College Student Alcohol Use : Examining the Role of Social Support. Journal of Religion and Health, 47, 217–226. http://doi.org/10.1007/s10943-008-9164-3
69. Moore, E. W., & Starlyn, J. Y. B. (2013). Religiosity , Alcohol Use , and Sex Behaviors Among. Journal of Religion and Health, 52, 930–940. http://doi.org/10.1007/s10943-011-9543-z
70. MORAN, C. D., ROBERTS, C., Tobin, J. A., & Harvey, L. M. (2008). Religious Expression Among Residents and Resident Assistants in Residence Halls at Public Colleges and Universities : Freedoms and Constraints Religious Expression Among Residents and Resident Assistants in Residence Halls at Public Colleges and Universit. The Journal of college and University Student Housing, 35(2), 48–61.
71. Nelms, L. W., Hutchins, E., Hutchins, D., & Pursley, R. J. (2007). Spirituality and the Health of College Students. Journal of Religion and Health, 46(2), 249–265. http://doi.org/10.1007/s10943-006-9075-0
72. Nudelman, A. E. (1972). Christian Science and Secular Science: Adaptation on the College Scene. Journal for the Scientific Study of Religion, 11(3), 271–276. Retrieved from http://www.jstor.org/stable/1384551
73. Nunez, R., & Foubert, J. (2015). Understanding the Meaning Making Process of Hispanic College Students in Their Spiritual and Religious Development. Religion & Education, (April), 1–39. http://doi.org/10.1080/15507394.2015.1093880
74. Nunn, P. D., Mulgrew, K., Scott-Parker, B., Hine, D. W., Marks, A. D. G., Mahar, D., & Maebuta, J. (2016). Spirituality and attitudes towards Nature in the Pacific Islands: insights for enabling climate-change adaptation. Climatic Change, 1–17. http://doi.org/10.1007/s10584-016-1646-9
75. Odimegwu, C. (2005). Influence of religion on adolescent sexual attitudes and behaviour among Nigerian university students: affiliation or commitment? African Journal of Reproductive Health, 9(2), 125–140. http://doi.org/10.2307/3583469
76. ONYEBUCHUKWU, I. J., SHOLARIN, M. A., & EMERENWA, A. B. (2015). Age , Gender , Religiousity and Family Factors on Sexual Attitude and Behaviour of University of Ibadan Undergraduate Students. Research on Humanities and Social Sciences, 5(6), 130–140.
77. Parniyan, R., Kazemiane, A., Jahromi, M. K., & Poorgholami, F. (2016). A Study of the Correlation between Religious Attitudes and Quality Of Life in Students at Jahrom University of Medical Sciences in 2014. Global Journal of Health Science, 8(10), 43–49. http://doi.org/10.5539/gjhs.v8n10p43
78. Patel, E. (2007). Religious Diversity and Cooperation on Campus. Journal of College and Character, 9(2), 37–41. http://doi.org/10.2202/1940-1639.1120
79. Patel, E., & Meyer, C. (2009). Engaging Religious Diversity on Campus : The Role of Interfaith Leadership. Journal of College and Character, 10(7), 1–9. http://doi.org/10.2202/1940-1639.1436
80. Patten, T. A., & Rice, N. D. (2008). Religious Minorities and Persistence at a Systemic Religiously-Affiliated University. Christian Higher Education, 8(1), 42–53. http://doi.org/10.1080/15363750802349323

International Journal of Advance and Innovative Research Volume 5, Issue 4 (XII): October - December, 2018
13
ISSN 2394 - 7780
81. Peek, L. a. (2003). Reactions and response: Muslim students’ experiences on New York city campuses post 9/11. Journal of Muslim Minority Affairs, 23(2), 271–283. http://doi.org/10.1080/1360200032000139910
82. Pei, P., Chai, M., Krägeloh, C. U., & Billington, R. (2011). Stress and quality of life in international and domestic university students : cultural differences in the use of religious coping. Mental Health Religion and Culture, (November 2011), 37–41. http://doi.org/10.1080/13674676.2011.571665
83. Pillon, S. C., Santos, M. A. dos, Gonçalves, A. M. de S., Araújo, K. M. de, & Funai, A. (2010). : 493 ‐ 513 Risk Factors, Levels of Spirituality and Aclchohol use in Students of Two Nursing Courses, Rev. Eletrônica Saúde Mental Alcohol Drug., 6, 493–513.
84. Plante, T. G., Saucedo, B., & Rice, C. (2001). The Association Between Strength of Religious Faith and Coping with Daily Stress. Pastoral Psychology, 49(4), 291–300. http://doi.org/10.1023/A
85. Plante, T. G., Yancey, S., Sherman, A., & Guertin, M. (2000). The Association Between Strength of Religious Faith and Psychological Functioning. Pastoral Psychology, 48(5), 405–412. http://doi.org/10.1023/A
86. Proctor, A. (2002). Religion on Campus. Journal of College and Character, 3(4). http://doi.org/10.2202/1940-1639.1321
87. Pschaida, D. A. (2015). Muslim American Women on Campus: Undergraduate Social Life and Identity. Journal of Muslim Minority Affairs, 35(1), 158–160. http://doi.org/10.1080/13602004.2015.1021106
88. Raman, R. (2003). Book Reviews : Anshu Malhotra, Gender, Caste, and Religious Identities. New Delhi: Oxford University Press. 2002. 232 pages. Indian Journal of Gender Studies, 10(3), 477–481. http://doi.org/10.1177/097152150301000305
89. Rangoonwala, F. I., Sy, S. R., & Epinoza, R. K. E. (2011). Muslim Identity, Dress Code Adherence and College Adjustment among American Muslim Women. Journal of Muslim Minority Affairs, 31(2), 231–241. http://doi.org/10.1080/13602004.2011.583517
90. Rissler, L. J., Duncan, S. I., & Caruso, N. M. (2014). The relative importance of religion and education on university students’ views of evolution in the Deep South and state science standards across the United States. Evolution: Education and Outreach, 7(1), 24. http://doi.org/10.1186/s12052-014-0024-1
91. Rockenbach, A. B., & Mayhew, M. J. (2014). The Campus Spiritual Climate: Predictors of Satisfaction Among Students With Diverse Worldviews. Journal of College Student Development, 55(1), 41–62. http://doi.org/10.1353/csd.2014.0002
92. Rockenbach, A. N., Mayhew, M. J., & Bowman, N. a. (2015). Perceptions of the Campus Climate for Nonreligious Students. Journal of College Student Development, 56(2), 181–186. http://doi.org/10.1353/csd.2015.0021
93. Rockenbach, A. N., Mayhew, M. J., Morin, S., Crandall, R. E., & Selznick, B. (2015). Fostering the Pluralism Orientation of College Students through Interfaith Co-curricular Engagement. The Review of Higher Education, 39(1), 25–58. http://doi.org/10.1353/rhe.2015.0040
94. Sandage, S. J., & Harden, M. G. (2011). Relational spirituality, differentiation of self, and virtue as predictors of intercultural development. Mental Health, Religion & Culture, 14(8), 819–838. http://doi.org/10.1080/13674676.2010.527932
95. Sandage, S. J., Hill, P. C., & Vaubel, D. C. (2011). Generativity, Relational Spirituality, Gratitude, and Mental Health: Relationships and Pathways. International Journal for the Psychology of Religion, 21(1), 1–16. http://doi.org/10.1080/10508619.2011.532439
96. Sandage, S. J., & Jankowski, P. J. (2010). Forgiveness, spiritual instability, mental health symptoms, and well-being: Mediator effects of differentiation of self. Psychology of Religion and Spirituality, 2(3), 168–180. http://doi.org/10.1037/a0019124
97. Sandage, S. J., & Jankowski, P. J. (2013). Spirituality, social justice, and intercultural competence: Mediator effects for differentiation of self. International Journal of Intercultural Relations, 37(3), 366–374. http://doi.org/10.1016/j.ijintrel.2012.11.003
98. Sanders, P. W., Allen, G. E. K., Fischer, L., Richards, P. S., Morgan, D. T., & Potts, R. W. (2015). Intrinsic Religiousness and Spirituality as Predictors of Mental Health and Positive Psychological Functioning in
International Journal of Advance and Innovative Research Volume 5, Issue 4 (XII): October - December, 2018
14
ISSN 2394 - 7780
Latter-Day Saint Adolescents and Young Adults. Journal of Religion and Health, 54(3), 871–887. http://doi.org/10.1007/s10943-015-0043-4
99. Schludermann, E. H., Schludermann, S. M., Mulenga, M., Schludermann, S. M., Needham, D., & Reformed, A. A. (2001). Fear of Rejection versus Religious Commitment as Predictors of Adjustment Among Reformed and Evangelical College Students in Canada. Journal of Beliefs & Values : Studies in Religion & Education, 22(2), 209–224. http://doi.org/10.1080/13617670120092438
100. Schmalzbauer, J. (2013). Campus Religious Life in America: Revitalization and Renewal. Society, 50(2), 115–131. http://doi.org/10.1007/s12115-013-9640-6
101. Seggie, F. N., & Sanford, G. (2010). Perceptions of female Muslim students who veil: campus religious climate. Race Ethnicity and Education, 13(1), 59–82. http://doi.org/10.1080/13613320903549701
102. Seguino, S. (2011). Help or Hindrance ? Religion ’ s Impact on Gender Inequality in Attitudes and Outcomes. World Development, 39(8), 1308–1321. http://doi.org/10.1016/j.worlddev.2010.12.004
103. Semplonius, T., Good, M., & Willoughby, T. (2015). Religious and Non-religious Activity Engagement as Assets in Promoting Social Ties Throughout University: The Role of Emotion Regulation. Journal of Youth and Adolescence, 44(8), 1592–1606. http://doi.org/10.1007/s10964-014-0200-1
104. Shaikh, M. A., Kamal, A., & Naqvi, I. (2015). Gender association of prayer for health - perspective from university students in Islamabad and Rawalpindi. JPMA. The Journal of the Pakistan Medical Association, 65(10), 1116–8. Retrieved from http://www.ncbi.nlm.nih.gov/pubmed/26440845
105. Shammas, D. S. (2009). Post-9 / 11 Arab and Muslim American Community College Students : Ethno-religious Enclaves and Perceived Discrimination. Community College Journal of Research and Practice, 33, 283–308. http://doi.org/10.1080/10668920802580507
106. Speers, S. (2015). The Secular Thesis Revisited: Religious Life on the Secular College Campus Today. Journal of College and Character, 10(1), 0–11. http://doi.org/10.2202/1940-1639.1056
107. Stevenson, J. (2014). Internationalisation and religious inclusion in United Kingdom higher education. Higher Education Quarterly, 68(1), 46–64. http://doi.org/10.1111/hequ.12033
108. Strayhorn, T. L. (2010). Work in progress — Social barriers and supports to underrepresented minorities’ success in STEM fields. In 2010 IEEE Frontiers in Education Conference (FIE) (p. S1H–1–S1H–5). IEEE. http://doi.org/10.1109/FIE.2010.5673227
109. Sucylaite, J. (2013). Nurses’ Spiritual Learning at University. Procedia - Social and Behavioral Sciences, 89(April), 199–204. http://doi.org/10.1016/j.sbspro.2013.08.834
110. Suppaiah, K. (2003). Religious services Attendance and College adjustment of diploma in computer science UTM students. Jurnal Teknikaldankajjan Sosial, 81–88.
111. Tanton, J., Dodd, L. J., Woodfield, L., & Mabhala, M. (2015). Eating Behaviours of British University Students: A Cluster Analysis on a Neglected Issue. Advances in Preventive Medicine, 2015(April 2016), 1–8. http://doi.org/10.1155/2015/639239
112. Taunay, T. C., Cristino, E. D., Machado, M. O., Rola, F. H., Lima, J. W. O., Macêdo, D. S., … Carvalho, A. F. (2012). Development and validation of the Intrinsic Religiousness Inventory (IRI). Revista Brasileira de Psiquiatria, 34(1), 76–81. http://doi.org/10.1590/S1516-44462012000100014
113. Taylor, M. C., & Merino, S. M. (2011). Race, Religion, and Beliefs about Racial Inequality. The ANNALS of the American Academy of Political and Social Science, 634(1), 60–77. http://doi.org/10.1177/0002716210389537
114. Thorat, A. (2010). Ethnicity, Caste and Religion: Implications for Poverty Outcomes. Economic & Political Weekly, 51(december 18), 47–53.
115. Thro, W. E., & Russo, C. (2010). Preserving Orthodoxy on Secular Campuses : The Right of Student Religious Organizations to Exclude Non-Believers. Educational Law Reporter, (April), 497–516.
116. Tomasso, C. D. S., Beltrame, I. L., & Lucchetti, G. (2011). Knowledge and attitudes of nursing professors and students concerning the interface between spirituality, religiosity and health. Revista Latino-Americana de Enfermagem, 19(5), 1205–1213. http://doi.org/10.1590/S0104-11692011000500019

International Journal of Advance and Innovative Research Volume 5, Issue 4 (XII): October - December, 2018
15
ISSN 2394 - 7780
117. Valladares, J. T., Carvajal, M. R., & García, M. V. (2013). Religious fundamentalism among Costa Rican university students : Political conservatism and spirituality without religion. Rev. Ciencias Sociales, 139(1), 115–135.
118. Walls, N. E., Woodford, M. R., & Levy, D. L. (2014). Religious Tradition, Religiosity, or Everyday Theologies? Unpacking Religion’s Relationship to Support for Legalizing Same-Sex Marriage Among a College Student Sample. Review of Religious Research, 56(2), 219–243. http://doi.org/10.1007/s13644-013-0140-3
119. Wang, Z., Koenig, H. G., Ma, H., & Shohaib, S. Al. (2016). Religion, Purpose in Life, Social Support, and Psychological Distress in Chinese University Students. Journal of Religion and Health, 55(3), 1055–1064. http://doi.org/10.1007/s10943-016-0184-0
120. Woo, J. S. T., Morshedian, N., Brotto, L. A., & Gorzalka, B. B. (2012). Sex Guilt Mediates the Relationship Between Religiosity and Sexual Desire in East Asian and Euro-Canadian College-Aged Women. Archives of Sexual Behavior, 41(6), 1485–1495. http://doi.org/10.1007/s10508-012-9918-6
121. Wortmann, J. H., Park, C. L., & Edmondson, D. (2012). The Spiritual Struggle and Adjustment to Loss in College Students : Moderation by Denomination. The International Journal for the Psychology of Religion, 22(4), 303–320. http://doi.org/10.1080/10508619.2011.638605
122. Yadav, R., & Khanna, A. (2014). Impact of Spirituality on Stress: With the Special Reference of Engineering Students of Indian Institute of Technology. Research on Humanities and Social Sciences, 4(25), 29–35.
123. Yadav, R., Khanna, A., & Singh, D. (2016). Exploration of Relationship Between Stress and Spirituality Characteristics of Male and Female Engineering Students: A Comprehensive Study. Journal of Religion and Health, (JANUARY), 1–12. http://doi.org/10.1007/s10943-015-0174-7
124. Yiengprugsawan, V., Seubsman, S., & Sleigh, A. C. (2012). Health, Well-being, and Social Indicators Among Monks, Prisoners, and Other Adult Members of an Open University Cohort in Thailand. Journal of Religion and Health, 51(3), 925–933. http://doi.org/10.1007/s10943-010-9410-3
125. Yilmaz, M., & Gurler, H. (2014). The efficacy of integrating spirituality into undergraduate nursing curricula. Nursing Ethics, 21(8), 929–945. http://doi.org/10.1177/0969733014521096
126. Zhao, M., Lu, W., Bian, Q., Song, Y., Ren, J., & Xu, X. (2015). Prevalence and related risk factors of anxiety and depression among Chinese college freshmen. Journal of Huazhong University of Science and Technology, 35(6), 815–822. http://doi.org/10.1007/s11596-015-1512-4

International Journal of Advance and Innovative Research Volume 5, Issue 4 (XII): October - December, 2018
16
ISSN 2394 - 7780
GROWTH AND CHARACTERIZATION OF DICOUMAROLE DERIVATIVE
S. K. Parmar1, H. K. Gohil2, P. M. Vyas3, S. D. Hadiyal4 and A. H. Patel5 Research Scholar1,2, Assitant Professor3, Associate Professor5, Department of Physics, Kamani Science College
& Prataprai Arts College, Amreli Research Scholar4, Department of Chemiestry, Saurashtra University, Rajkot
ABSTRACT The Dicoumarole derivative 4-amino-3-((4-amino-2-oxo-2H-chromen-3-yl)(3-(4-chlorophenyl)-1-phenyl-1H-pyrazol-4-yl)methyl)-2H-chromen-2-one obtain by crystal growth by slow evaporation solution growth method having approximate dimensions of 0.630 x 0.400 x 0.310 mm. The Crystal where characterized using different characterization techniques like single crystal XRD, FT-IR, dielectric study, TG-DTA and UV-Visible spectra. Single crystal XRD was adopted for determination of lattice constant, space group and structure analysis. FT-IR spectrum denotes that there are mainly six group of absorption. The dielectric study represent that dielectric constant decreased as the frequency of the applied field increased and also studied The variation of dielectric loss, a.c. conductivity and a.c. resistivity with frequency of the applied field in the frequency range from 20 Hz to 2 MHz at room temperature. Thermal stability of dicoumarole determine by TG-DTA study. The study of UV-Visible spectrum denotes that the good transmittances of the crystal in the entire visible region.
Keywords: Dicoumarole crystal, solution growth, single Crystal XRD, FT-IR, Dielectric, TG-DTA, UV-Visible spectrum.
INTRODUCTION A significant number of the known coumarins are fluorescent particles and they are known to have great quantum yield [6, 15] and high photo stability [2, 4]. The coumarins are mostly colorless but substitutions at various positions bring out a red shift in absorption and emission, and are utilized in the applications such as laser dyes [16], textile dyes [5], sensors [14] as a optical brighteners [13], non-linear optical (NLO) materials [17] and in biological labeling [11, 22]. The mixes with azo usefulness are less fluorescent to non-fluorescent in nature. Azo practical gathering at the 3-position of 4-hydroxy coumarins particle was first reported by Yazdanbaksh et al. [23]. In the later studies on these molecules, UV–visible absorption, fluorescence and acid dissociation constants were reported [23, 21]
The synthesis of Dicoumarole 4-amino-3-((4-amino-2-oxo-2H-chromen-3-yl)(3-(4-chlorophenyl)-1-phenyl-1H-pyrazol-4-yl methyl)-2H-chromen-2-one crystal growth by slow evaporation solution growth method. A colorless block crystal of C36H29ClN4O5S having approximate dimensions of 0.630 x 0.400 x 0.310 mm was obtains. The single crystal XRD study reveals that of dicoumarole derivative has primitive triclinic crystal system, Based on a statistical analysis of intensity distribution, and the successful solution and refinement of the structure, the space group was determined to be: P-1 (#2). FT-IR spectrum represent that there are mainly six groups of absorption are Alcohol, Alkene, Alkyl halide, Amine, Aromatic and Ether. The dielectric study of dicoumarole derivative was done in the frequency range from 20 Hz to 2 MHz at room temperature. The dielectric constant decreased as increased the frequency of the applied field. The variation of dielectric loss, a.c. conductivity and a.c. resistivity also studied with the frequency of the applied field. Increasing frequency of applied field the dielectric constant and dielectric loss decreased and the a.c. conductivity was due to the correlated barrier hopping. The TGA study shows that sample remain stable up to 200oC. The DTA curve shows a major endothermic peak at 284.29oC which correspond to the melting point of material. The sharpness of peak at 284.29oC indicates the high purity of the grown crystal. The study of optical transmittance spectrum of the grown crystal is shows that there is no appreciable absorption of light in the entire visible region. The good transmittance property of the crystal was found in the entire visible region.
SYNTHESIS OF MATERIAL AND CRYSTAL 4-amino coumarin (0.01mol) was taken in methanol (20 ml) and refluxed for few min. till clear solution was observed. Then pyrazole aldehyde (0.005 mol), 2-3 drops of conc. HCl and reflux the reaction mixture for 10 hours. The completion of reaction was monitored by Thin Layer Chromatography System, solvent system ethyl acetate: hexane (8:2). After completion of the reaction, the reaction mixture was cooled and poured over ice water (50 ml). The solid crude product, was filtered, washed with water and dried to give the desired compound.
Pure compound 4-amino-3-((4-amino-2-oxo-2H-chromen-3-yl)(3-(4-chlorophenyl)-1-phenyl-1H-pyrazol-4-yl)methyl)-2H-chromen-2-one was taken in 20 ml with binary mixture of DMSO+IPA and heated till compound completely dissolve. Then 0.5 gm charcoal was added and further it was heated to remove

International Journal of Advance and Innovative Research Volume 5, Issue 4 (XII): October - December, 2018
17
ISSN 2394 - 7780
color impurity. The hot solution was filtered through wattmann 41 filter paper. The solution was allowed to cool gradually and kept in a stopper conical flask slightly opened. The crystal was grown up due to thin layer evaporation. Reaction scheme of dicoumarole derivative is shown in figure 1.
Fig.-1: Reaction scheme of dicoumarole derivative
RESULT AND DISCUSSION A. Single crystal X-Ray Diffraction Single-crystal X-ray diffraction is most commonly used for precise determination of a unit cell, including cell dimension and position of atoms within the lattice. Bond-length and angle are directly related to the atomic position. The crystal structure of a mineral is a characteristic property that is the basis for understanding many of the properties of each mineral.
A colorless block crystal of C36H29ClN4O5S having approximate dimensions of 0.630 x 0.400 x 0.310 mm was mounted on a glass fiber. All measurements were made on a Rigaku SCX mini diffractometer using graphite monochromatic Mo-Kα radiation. The crystal-to-detector distance was 52.00 mm. Cell constants and an orientation matrix for data collection corresponded to a primitive triclinic cell with dimensions:
a = 10.2924(7) Å α = 74.321(2)o
b = 11.9363(8) Å β = 84.571(3)o
c = 13.8467(9) Å γ = 89.790(3)o
V = 1630.0(2) Å3
For Z = 2 and F.W. = 665.16, the calculated density is 1.355 g/cm3. Based on a statistical analysis of intensity distribution, and the successful solution and refinement of the structure, the space group was determined to be:
P-1 (#2)
The data were collected at a temperature of 20 1oC to a maximum 2 value of 55.0o. A total of 540 oscillation images were collected. A sweep of data was done using oscillations from -120.0 to 60.0o in 1.0o steps. The exposure rate was 10.0 [sec./o]. The detector swing angle was -30.80o. A second sweep was performed using oscillations from -120.0 to 60.0o in 1.0o steps. The exposure rate was 10.0 [sec. /o]. The detector swing angle was -30.80o. Another sweep was performed using w oscillations from -120.0 to 60.0o in 1.0o steps. The exposure rate was 10.0 [sec. /o]. The detector swing angle was -30.80o. The crystal-to-detector distance was 52.00 mm. Readout was performed in the 0.146 mm pixel mode. Crystal Structure of dicoumarole molecules is shown in figure 2, Oak Ridge Thermal-Ellipsoid Plot diagram of molecule is shown in figure 3, PLATON ellipsoid plot diagram of molecule is shown in figure 4 and packing diagram of dicoumarole is shown in figure 5. Detail analysis in crystal data form of dicoumarole by Single crystal XRD is shown in table-1.
Table-1: Analysis of Single Crystal XRD of Dicoumarole Empirical Formula C36H29ClN4O5S Formula Weight 665.16
Crystal Color, Habit colorless, block Crystal Dimensions 0.630 X 0.400 X 0.310 mm
Crystal System Triclinic Lattice Type Primitive
Lattice Parameters
a = 10.2924(7) Å b = 11.9363(8) Å c = 13.8467(9) Å
α = 74.321(2)o β = 84.571(3)o γ = 89.790(3)o
V = 1630.0(2) Å3

International Journal of Advance and Innovative Research Volume 5, Issue 4 (XII): October - December, 2018
18
ISSN 2394 - 7780
Space Group P-1 (#2) Z value 2
Dcalc 1.355 g/cm3 F000 692.00
(MoKα) 2.308 cm-1
Fig.-2: Crystal structure of molecules
Fig.-3: Oak ridge thermal-ellipsoid plot diagram of molecule
Fig- 4: Platon ellipsoid plot diagram of molecule
Fig.-5: Packing Diagram of dicoumarole derivative

International Journal of Advance and Innovative Research Volume 5, Issue 4 (XII): October - December, 2018
19
ISSN 2394 - 7780
B. FT-IR Study The study of infrared spectra involves examination of stretching, bending and vibration mode of atoms in molecules. Hence it is useful to determination of functional group of samples.
Figure 6 shows FT-IR spectrum of 4-amino-3-((4-amino-2-oxo-2H-chromen-3-yl)(3-(4-chlorophenyl)-1-phenyl-1H-pyrazol-4-yl)methyl)-2H-chromen-2-one crystal. There are mainly six groups of absorption. The detail analysis of the FT-IR spectrum of dicoumarole is given in table 2.
400800120016002000240028003200360040001/cm
-30-20-10
0102030405060708090
100110%T
3404
.47
3209
.66 30
93.9
2
2345
.52
1604
.83
1444
.73 13
42.5
012
19.0
5
1070
.53
898.
8675
2.26
692.
47 480.
29
Fig.-6: FT-IR Spectrum of dicoumarole
Table-2: Analysis of FT-IR Spectrum of Dicoumarole Type Validation Mode Type of Vibration Absorption peaks(cm-1)
Alcohol O-H Stretch 3209.66
Alkenes =C-H Stretch 3093.92 C=C Stretch 1604.83 =C-H Bending 898.86
Alkyl halide
C-Cl Stretch 752.26 C-Cl Stretch 692.47
Amine N-H Stretch 3404.47 C-N Stretch 1342.5 C-N Stretch 1219.05
Aromatic C=C Stretch 1444.73 Ether C-O Stretch 1070.53
C. Dielectric Study The dielectric constant is one of the basic electrical properties of solids. Dielectric properties are correlated with the electro-optic property of the crystals (Aithal et al., 1997). The capacitance(Cp) and dielectric loss (tan δ) of 4-amino-3-((4-amino-2-oxo-2H-chromen-3-yl)(3-(4-chlorophenyl)-1-phenyl-1H-pyrazol-4-yl)methyl)-2H-chromen-2-one crystal were measured using the conventional parallel plate capacitor method for at room temperatures with frequency (f) range of 20Hz to 2 MHz .
Dielectric study of Active Pharmaceutical Ingredients, amino acids and carbohydrates has been reported [8]. A broadband dielectric spectroscopic investigation of Verapamil Hydrochloride (VH), a calcium channel blocker by Adrjanowicz et al. [12] is carried out to understand its molecular dynamics. The dielectric investigation of amorphous pharmaceutical drugs has been reported in correlation with molecular mobility and isothermal crystallization kinetics [9].
For the most part there are four contributions playing important role in the value of dielectric constant (ε’); which are from electronic, ionic, dipolar and space-charge polarizations. All these may be active in low frequency region. The nature of the variation of ε’ with frequency recommended which contribution is prevailing. The space-charge contribution based on the purity and perfection of the crystal
Figure 7 shows the change of ε’ with frequency of applied field. The dielectric constant decreases very quickly as frequency increases. The nature of the plot in the figure 7 recommended that the space-charge polarization is active in low frequency region, which is reflected in terms of very quickly decrease in the value of dielectric constant with increase in frequency. This also further recommended that the dipoles can not comply with the

International Journal of Advance and Innovative Research Volume 5, Issue 4 (XII): October - December, 2018
20
ISSN 2394 - 7780
varying field and hence the decreasing nature is exhibited, which is a common feature in 4-(2-hydroxyphenylamino)-pent-3-en-2-one [3] and zinc tartrate crystals [18]. More-or-less, the same type of nature is observed for the change in dielectric loss (tanδ) with the frequency of applied field as shown in the figure 8. Recently, an a.c. conductivity and dielectric constant measurements of bulk pyronine G (Y) is reported by Yaghmour [20]. The author notice that the dielectric constant and dielectric loss decreased by increasing frequency and the a.c. conductivity was because of the correlated barrier hopping.
Generally, typical current carriers in organic solids are through π- conjugated systems and the electrons can change position via π-electron cloud, especially, by hopping, tunneling and other associated mechanisms. Figure 9 shows that the a. c. conductivity σac increases as the frequency increases and the completely different nature is observed for a. c. resistivity. In case of the a. c. conductivity if the angular frequency of applied field is represented by
ω=2πυ
The Jonscher’s equation [1, 10] can be written as follows,
σac(ω,T)=σdc(T)+a(T)ωn
Where,σdc(T) (or static,ω=0) is the dc conductivity because of excitation of electrons from a localized state to the conduction band, a(T)ωn is the ac conductivity because of the dispersion phenomena occurring in the material, a(T) is a temperature dependent constant and n is the power law exponent, which generally change between 0 and 1 depending on temperature. The exponent n represents the degree of interaction between mobile ions with the lattice around them. A typical frequency dependence of conductivity spectrum shows three distinguish regions, namely, (a) low frequency dispersion, (b) an intermediate frequency plateau and (c) an extended dispersion at high frequency.
Fig.-7: Plot of dielectric constant versus log f.

International Journal of Advance and Innovative Research Volume 5, Issue 4 (XII): October - December, 2018
21
ISSN 2394 - 7780
Fig.-8: Plot of dielectric loss versus log f.
Fig.-9: Plot of a. c. conductivity and a. c. resistivity versus log f.
D. Thermo gravimetric analysis Thermo gravimetric and differential thermal analysis gives information regarding thermal stability, weight loss of compound, phase transaction and different stage of decomposition of the crystal system. Figure 10 shows the thermo gram of simultaneous recorded TGA and DTA. The thermo gravimetric analysis of dicoumarole is carried out between 300C to 8000C in nitrogen atmosphere at a heating rate of 100C/min.
The TGA plot shows that sample remain stable up to 2000C. The DTA curve shows a major endothermic peak at 284.290C which correspond to the melting point of material. The sharpness of peak at 284.290C is indicating the high purity of the grown crystal. The absence of water in molecular structure is indicated by absence of weight loss around 100 0C.
The TGA curve shows that there are three state of weight loss. The first weight loss is about at 2000C. Which is indicates the beginning of the decomposition. Second stage of weight loss was occurring between 300 0C and 450 0C. Weight loss above 4500C is assign to the decomposition of the compound.
Fig.-10: Plot of TG-DTA of dicoumarole derivative crystal
E. UV-Visible spectra Ultraviolet and visible spectroscopy is mainly used to determine the amount of conjugated double bond in the molecules. Most organic compounds with variable functional groups are transparent in the range of the electromagnetic spectrum, which we call ultraviolet (UV) and visible (Vis.) regions. In electromagnetic spectrum, the UV comes in range of 100 –400 nm.
The UV spectra of dicoumarole were recorded on a Shimadzu- 1700 UV spectrophotometer using N,N-Dimethylformamide as solvents with concentration of solution is 1.4×10⁻⁷mmol. The optical transmittance spectrum of the grown crystal is shown in figure 11. and it indicates that there is no appreciable absorption of light in the entire visible region. The good transmittance property of the crystal in the entire visible region was

International Journal of Advance and Innovative Research Volume 5, Issue 4 (XII): October - December, 2018
22
ISSN 2394 - 7780
ensuring its stability for second harmonic generation applications [19]. Figure 11 shows the plot of absorption and transmittance versus wave length of UV-Visible radiation in the range of 100 nm to 800 nm.
Fig.-11: Plot of UV-Visible spectrum of dicoumarole derivative
CONCLUSION The synthesis of Dicoumarole 4-amino-3-((4-amino-2-oxo-2H-chromen-3-yl)(3-(4-chlorophenyl)-1-phenyl-1H-pyrazol-4-yl)methyl)-2H-chromen-2-one crystal growth by slow evaporation solution growth method. having approximate dimensions of 0.630 x 0.400 x 0.310 mm. Based on a statistical analysis of intensity distribution, and the successful solution and refinement of the structure, the space group was determined to be: P-1 (#2). FT-IR spectrum shows there are mainly six groups of absorption found are Alcohol, Alkene Alkyl halide, Amine, Aromatic and Ether. The dielectric study was carried out in the frequency range from 20 Hz to 2 MHz at room temperature. The dielectric constant decreased as the frequency of the applied field increased. The variation of dielectric loss, a.c. conductivity and a.c. resistivity also studied with frequency of the applied field the dielectric constant and dielectric loss decreased by increasing frequency and the a.c. conductivity was due to the correlated barrier hopping. The studies of TGA plot shows that sample remain stable up to 200oC. The DTA curve shows a major endothermic peak at 284.29oC which correspond to the melting point of material. The sharpness of peak at 284.290C is indicating the high purity of the grown crystal. The absence of water in molecular structure is indicated by absence of weight loss around 100oC. The study of UV-Visible spectrum of the grown crystal indicates that there is no appreciable absorption of light in the entire visible region. The good transmittance property of the crystal in the entire visible region was ensuring its stability for second harmonic generation applications.
ACKNOWLEDGMENTS The authors are thankful to Department of physics Saurashtra University - Rajkot and Sophisticated instrumentation center (SICART), Vallbh Vidhyanagar for grant the permission for analysis facility.
REFERENCES 1. A. K. Jonscher, Nature.267, 673 (1977).
2. Azzouz IM, Salah A (2012) nonlinear optical absorption and NIR to blue conversion in highly stable polymeric dye rod. Appl Phys B 108:469–474. doi:10.1007/s00340-012-4915-y
3. B. Parekh, D. H. Purohit, P. Sagayraj, H. S. Joshi, and M. J. Joshi, Cryst. Res. Technol.42, 407 (2007)
4. Chen J, Liu W, Zhou B et al (2013) Coumarin- and rhodaminefused deep red fluorescent dyes: synthesis, photophysical properties, and bioimaging in vitro. J Org Chem 78:6121–6130. doi:10.1021/jo400783x
5. Christie RM, Morgan KM, Islam MS (2008) Molecular design and synthesis of N-arylsulfonated coumarin fluorescent dyes and their application to textiles. Dye Pigment 76:741–747. doi:10.1016/j. dyepig.2007.01.018

International Journal of Advance and Innovative Research Volume 5, Issue 4 (XII): October - December, 2018
23
ISSN 2394 - 7780
6. Cigáň M, Donovalová J, Szöcs V et al (2013) 7 (Dimethylamino)coumarin-3-carbaldehyde and its phenylsemicarbazone: TICT excited state modulation, fluorescent H-aggregates, and preferential solvation. J Phys Chem A 117:4870–4883. doi:10.1021/jp402627a
7. Enakshi and K. V. Rao, J. Mater. Sci. Lett4, 1298 (1985).
8. R. Mantheni, M. P. K. Maheswaran, H. F. Sobhi, N. I. Perea, A. T. Riga, M. E. Matthews, and K. Alexander, J. Term. Anal. Calorim., DOI: 10.1007/s10973-011-1423-y.
9. J. Menegotto, J. Alie, C. Lacabanne, and M. Bauer, Dielectric News Lett.19, 1 (2004).
10. J. O. L` opez and R. G. Aguilar, Rev. Mex. Fis.49, 529 (2003).
11. Jung HS, Kwon PS, Lee JWJHJY et al (2009) Coumarin-derived Cu(2+)-selective fluorescence sensor: synthesis, mechanisms, and applications in living cells. J Am Chem Soc 131:2008–2012. doi: 10.1021/ja808611d
12. K. Adrjanowicz, K. Kaminski, M. Paluch, P. Wlodarczyk, K. Grzybowska, Z. Wojnarowska, L. Hawelek, W. Sawicki, P. Lepek, and R. Lunio, J. of Pharma. Sci.99, 828 (2010).
13. Keskin SS, Aslan N, Bayrakçeken F (2009) Optical properties and chemical behavior of Laser-dye Coumarin-500 and the influence of atmospheric corona discharges. Spectrochim Acta A Mol Biomol Spectrosc 72:254–259. doi:10.1016/j.saa.2008.09.024
14. Kim T-K, Lee D-N, Kim H-J (2008) Highly selective fluorescent sensor for homocysteine and cysteine. Tetrahedron Lett 49:4879– 4881
15. Krzeszewski M, Vakuliuk O, Gryko DT (2013) Color-tunable fluorescent dyes based on benzo[c]coumarin. Eur J Org Chem 5631–5644. doi:10.1002/ejoc.201300374
16. Nedumpara RJ, Thomas KJ, Jayasree VK et al (2007) Study of solvent effect in laser emission from Coumarin 540 dye solution. Appl Opt 46:4786. doi:10.1364/AO.46.004786
17. Painelli A, Terenziani F (2001) Linear and non-linear optical properties of push–pull chromophores: vibronic and solvation effects beyond perturbation theory. Synth Met 124:171–173. doi:10.1016/S0379-6779(01)00431-3
18. R. M. Dabhi, B. B. Parekh, and M. J. Joshi, Ind. J. Phys.79, 503 (2005).
19. S. Dhanuskodi, K. Vasantha, P.A.A. Mary, Structural and thermal characterization of a semiorganic NLO material: l-alanine cadmium chloride. Spectro. Acta Part A66,637–642 (2007)
20. S. J. Yaghmour, Eur. Phys. J. Appl. Phys. 49, 10402 (2010).
21. Shahinian EGH, Haiduc I, Sebe I (2011) Synthesis and characterization of new azo coumarin dyes. UPB Sci Bull Ser B Chem Mater Sci 73:153–160
22. Sheng R, Wang P, Gao Y et al (2008) Colorimetric test kit for Cu2+ detection. Org Lett 10:5015–5018. doi:10.1021/ol802117p
23. Yazdanbakhsh MR, Ghanadzadeh A, Moradi E (2007) Synthesis of some new azo dyes derived from 4 hydroxy coumarin and spectrometric determination of their acidic dissociation constants. J Mol Liq 136:165–168. doi:10.1016/j.molliq.2007.03.005

International Journal of Advance and Innovative Research Volume 5, Issue 4 (XII): October - December, 2018
24
ISSN 2394 - 7780
INVESTORS ATTITUDE TOWARDS MUTUAL FUNDS IN ROHTK DISTRCT IN STATE OF HARYANA
Dr. Sunil Kumari Assistant Professor, Department of Higher Education, Haryana
ABSTRACT Mutual funds are seemingly the easiest and the least stressful way to invest in the stock market but same as much difficult to choose the any of the MF schemes offered by mutual fund. So Understanding the attitude of investors on their investment would help the company to increase their profits, so marketer always remains keen in knowing the investors’ attitude towards mutual fund. Present study aims at finding the same and results showed that reputation of fund and brand name of sponsor are major determinants of investors’ decision and out of all available schemes, balanced fund and income funds were most preferred by investors.
Keywords: Mutual Funds, Scheme, Marketers, Investors.
INTRODUCTION At present, in economic and financial scenario of India financial instruments, particularly Mutual Funds are emerging in crucial role to allocate the scarce resources from savers to borrowers for making the productive use of idle resources thus accerlating investment in economy. The increasing volatility has pushed the investors towards relatively safe mode of investment and this move seems to mutual fund that mobilizes and channelizes the savings of individuals and institutions in corporate securities to provide the steady stream of returns and capital appreciation. But a lot of mutual fund schemes are available in the market giving different kinds of benefits like growth schemes, income schemes, balanced schemes, tax saving schemes, money market schemes etc. Now question arises how investor selects one or more of the mutual fund schemes, we can say what factors are taken into account in mutual fund investment decision. Need to answer this question initiated the researcher to make the study on this topic.
REVIEW OF LITERATURE De Bond and Thaler (1985) while investigating the possible psychological basis for investor behavior, argue that mean reversion in stock prices is an evidence of investor over reaction where investors over emphasize recent firm performance in forming future expectations of the investment Gupta (1994) made a household investor survey with the objective to provide data on the investor preferences on MF’s and other financial assets. The findings of the study were more appropriate, at that time, to the policy makers and mutual funds to design the financial products for the future. Syama Sunder (1998) conducted a survey to get an insight into the mutual fund operations of private institutions with special reference to Kothari Pioneer. The survey revealed that awareness about Mutual Fund concept was poor during that time in small cities. Agents play a vital role in spreading the Mutual Fund culture; open-end schemes were much preferred then; age and income are the two important determinants in the selection of the fund/scheme; brand image and return are the prime considerations while investing in any Mutual Fund. Shanmugham (2000) conducted a survey of 201 individual investors to study the information sourcing by investors, their perceptions of various investment strategy dimensions and the factors motivating share investment decisions, and reports that among the various factors, psychological and sociological factors dominated the economic factors in share investment decisions. Akhilesh Mishra (2008) has done a study on the topic “Mutual Fund as a Better Investment Plan” and states that many of the people have the fear of Mutual Funds. “They think their money will not be secure in Mutual funds,” says Mishra. He also says that the investors need the knowledge of Mutual Funds and its related terms. From the above review it can be inferred that Mutual Fund as an investment vehicle is capturing the attention of various segments of the society, like academicians, industrialists, financial intermediaries, investors and regulators for varied reasons and deserves an in depth study. OBJECTIVES OF THE STUDY To study priorities of investors in selection of mutual fund schemes. To know the factors affecting investors’ decision regarding mutual fund. RESEARCH METHODOLOGY 1. Research Design: Being study exploratory in nature, it will go through primary data collection through
questionnaire, its’ analysis using mean scores & mean index. The Investors’ attitude shall be measured in terms of their preference and factors affecting their decisions which shall be analyzed at two levels:
International Journal of Advance and Innovative Research Volume 5, Issue 4 (XII): October - December, 2018
25
ISSN 2394 - 7780
Ascertaining the level of effectiveness for individual parameters. The scores for the parameter are derived by multiplying the number of respondents with the respective score and its subsequent summing. Effectiveness index was calculated by applying the formula:
Actual scores obtained for the statement x 100 Maximum obtainable score for the statement
The overall effectiveness Index is calculated by using the formula: Top scores obtained for the seven parameters x 100 Sum of maximum scores obtainable for seven parameters
Overall index is taken as benchmark
2. Data Collection: Both primary as well as secondary data have been collected.
3. Sampling: A questionnaire was structured at five rating scale to meet the stated research’s objective and got it filled up by 100 people were selected on the basis of systematic sampling living in Rohtak District of Haryana who were having mutual fund experience.
OVERVIEW OF EXISTING SCHEMES IN MUTUAL FUND INDUSTRY Each category of funds is backed by an investment philosophy, which is pre-defined in the objectives of the fund. The investor can align his own investment needs with the funds objective and invest accordingly. So on the basis of investment parameter, Mutual Funds can be broadly classified as
Growth Schemes: Growth Schemes are also known as equity schemes. The aim of these schemes is to provide capital appreciation over medium to long term. These schemes normally invest a major part of their fund in equities and are willing to bear short-term decline in value for possible future appreciation.
Income Schemes: Income Schemes are also known as debt schemes. The aim of these schemes is to provide regular and steady income to investors. These schemes generally invest in fixed income securities such as bonds and corporate debentures. Capital appreciation in such schemes may be limited.
Balanced Schemes: Balanced Schemes aim to provide both growth and income by periodically distributing a part of the income and capital gains they earn. These schemes invest in both shares and fixed income securities, in the proportion indicated in their offer documents (normally 50:50).
Money Market Schemes: Money Market Schemes aim to provide easy liquidity, preservation of capital and moderate income. These schemes generally invest in safer, short-term instruments, such as treasury bills, certificates of deposit, commercial paper and inter-bank call money.
OTHER SCHEMES Tax Saving Schemes Tax-saving schemes offer tax rebates to the investors under tax laws prescribed from time to time. Under Sec.88 of the Income Tax Act, contributions made to any Equity Linked Savings Scheme (ELSS) are eligible for rebate.
Index Schemes Index schemes attempt to replicate the performance of a particular index such as the BSE Sensex or the NSE 50. The portfolio of these schemes will consist of only those stocks that constitute the index.
Sector Specific Schemes These are the funds/schemes which invest in the securities of only those sectors or industries as specified in the offer documents. e.g. Pharmaceuticals, Software, Fast Moving Consumer Goods (FMCG), Petroleum stocks, etc. Investors need to keep a watch on the performance of those sectors/industries and must exit at an appropriate time.
RESULTS & DISCUSSIONS Results are to be discussed into two parts: 1. Parameter wise Investors’ Attitude
2. Overall Investors’ Attitude towards MF Schemes
1. Parameter wise Investors’ Attitude: As selection of mutual fund depends upon the various factors but here major 5 factors have been taken into account, in which so many other factors have been comprised of. Example infrastructure consists of fringe benefits, disclosure of investment from original pattern, sponsor’s expertise & past performance etc. Flexibility represents the minimal initial investment whereas transparency

International Journal of Advance and Innovative Research Volume 5, Issue 4 (XII): October - December, 2018
26
ISSN 2394 - 7780
underlies disclosure of periodicity of valuation in the advertisement. Scores were gathered through survey at point rating scale and has been analyzed in table 1
Table-1: Parameter wise Investors’ Attitude S N Factors/ variables Strongly
Agree Agree Not
Agree Disagree Strongly
Disagree Mean Scores
Mean Index
1 Infrastructure 29 32 26 5 8 456 81 2 Reputation of Fund 35 27 25 7 6 479 86 3 Flexibility 33 25 27 8 7 453 81 4 Transparency 32 24 27 10 7 451 81 5 Brand Name of
Sponsor 33 30 22 10 3 470 84
6 Additional facilities 25 30 28 7 10 449 80 Overall Mean Index 2758 83
Table1 highlights that mean indices of both factors i.e. reputation of fund and brand name of sponsor are 86 and 84 respectively that indicates that these are most influential factors in MF investment decision whereas other factors have almost similar scores in mean index that indicates their less consideration in MF decision in comparison to Funds Repudiation & brand name of sponsor. This doesn’t mean that except of two major factors don’t affect the MF decision, as overall mean index is 83 and all variables’ mean indices are near about this value, so they also have the impact on MF decision. So all stated variables are determinants of investors attitude of Rohtak District in Haryana.
2. Overall Investors’ Attitude towards MF Schemes
Table-2: Investors’ Preference in Mutual Fund Schemes MF Schemes High
Favorable Favorable Somewhat
Favorable Not very
Favorable Not at All Favorable
Mean Scores
Mean Index
Growth Schemes 3 10 29 26 32 33 28 Income Schemes 35 28 20 12 3 90 78
Balanced Schemes 37 29 21 7 6 93 85 Money Market Schemes 5 15 25 31 29 30 25
Tax Saving Schemes 7 14 24 30 25 31 26 Other Schemes 12 18 25 15 20 40 30
Overall Mean Index 45
As table 2 shows that mean index of balanced schemes is highest that means it most preferred by investors. Income schemes are at third place that indicates that a big part of MF investors is risk averse and it believes in getting fixed rate of return. Equity schemes got last rank even mean index of them is lesser than overall mean index, so only a small number of investors chooses such funds.
CONCLUSION Present study discussed investors’ priorities in mutual fund schemes as well as factors affecting the MF decision to know investors’ attitude towards different MF Schemes and determinants of their attitude. Outcomes of the study reveal that balanced funds are most preferred investment of respondents. Further, all stated variables i.e. infrastructure, flexibility, transparency, reputation of fund, brand of sponsor, and other facilities, affect the investors’ MF decision but reputation of fund and brand of sponsor, these two factors are major determinants of this decision.
LIMITATIONS OF THE STUDY The project done is restricted to Mutual funds in Rohtak district in Haryana and its surroundings only.
As the survey was pertaining to investment attitude of investors, biased information may restrict validity of inference possible.
The study was constrained by limitations of time. The raw data was collected with the help of structured questionnaire technique. Therefore study is bounded
by the limitation of this technique

International Journal of Advance and Innovative Research Volume 5, Issue 4 (XII): October - December, 2018
27
ISSN 2394 - 7780
REFERENCES Preeti Singh; “Investment Management Security Analysis and Portfolio Management”, Himalaya Publishing
House, Eleventh Edition, 2003, Pp 1-7
Prasanna Chandra; “Investment Analysis and Portfolio Management”, Tata McGraw-Hill Publishing Company Limited, Third Edition, 2008
Pal,Cashing in on turmoil, Outlook Money, Oct 8,2008, Pp6
Preeti Singh, Investment Management Security Analysis and Portfolio Management, Himalaya Publishing House, Eleventh Edition, 2003, Pp1
Project-on-Mutual Fund-Akhilesh Mishra viewed at http://www.scribd.com/doc/13246827/
A-STUDY-ON-MUTUAL-FUNDS-IN-INDIA.aspx viewed at http://www.indiastudychannel.com/projects/666
http://online.wsj.com/article/SB123137479520962869.html?mod=googlenews_ws
The A to Z of Mutual Funds-The Guide to investments, SBI Mutual Funds, Pp2
Birenshah, Outlook Money, 30th July 2008, P 30, 56
Pradeep Kumar S. and Murugavel A., Karvy the finapolis, Volume2, Issue 3, March 2008, Pp11
SIP Plan, Kotak Mutual Fund, Mutual Fund Insight, 15th October-14th November, Volume VI, Number 2, Pp 139.
http://economictimes.indiatimes.com/Personal_Finance/Mutual_Funds/Analysis/MFs_offer_investors_more_flexibility/articleshow/msid-3095105,curpg-2.cms
http://economictimes.indiatimes.com/articleshow/3013728.cms
http://www.bseindia.com/downloads/MutualFunds.pdf
http://vidyasagar.ac.in/Journal/Commerce/vol12/10th%20Article.pdf
http://www.utiicm.com/Cmc/PDFs/2001/rajeswari.pdf

International Journal of Advance and Innovative Research Volume 5, Issue 4 (XII): October - December, 2018
28
ISSN 2394 - 7780
SUSTAINABLE MANAGEMENT OF ENVIRONMENTAL RESOURCES OF A SEMI-ARID REGION OF INDIA USING RS/GIS
Sakshi Walker1, Brototi Biswas2 and Jai Kumar3
Department of Botany1 and Department of Geography2, St. John’s College, Agra Centre for Geospatial Technologies3, Sam Higginbottom University of Agriculture Technology and Sciences, Allahabad
ABSTRACT India is a country that exhibits diversities in its physical and socio-cultural environment. It is a land of diverse climatic zones which has resulted to diversity in natural vegetation. This variety is indeed a resource unto us and a rich store house of various other natural resources. Natural vegetation is a priceless natural resource which has a spatio-temporal variation. This natural resource needs to be tapped judiciously in an environmentally sustainable way for futuristic green-economy development of any region. Further an in depth knowledge and inventory of natural vegetation resource of any region, particularly in fragile ecosystems, is imperative for resource management and planning. In India we lack proper database of such natural vegetation, especially in the arid regions. In the absence of other resources and a general dearth of primary economic activities these areas are economically backward. Churu district of Rajasthan, lying in the arid zone and having saline barren soil does not offer good potentiality for agriculture. The present study takes the help of RS & GIS technologies apart from extensive field surveys to detect, map and monitor the natural vegetation variation and extent in pre-monsoon and monsoonal season at micro level. Detailed survey and sampling of the area revealed that though it has a substantial variety of drought resistant trees, shrubs and herbs, however these have the potentiality to be used for medicinal, neutralizing the salinity of soil, checking sand dunes etc. Thus, an extensive study of the vegetation in pre and monsoon season was made and database prepared. Along with this soil parameters database was also prepared to understand the physical-chemical requirements of these natural vegetation. This inventory serves as a storehouse of information about location and utility of the vegetation and soil parameters of the area. This can also be cited as an effective step towards sustainable management of natural vegetation.
Keywords: GPS, RS & GIS, Vegetation, mapping, soil parameters.
1. INTRODUCTION The natural resources of any region/nation is of utmost importance to it since natural resources form the decisive factor for the economic, social and cultural growth of any nation. These natural resources are essential to the economy of a nation since they play a crucial role in the provision of employment, they are a source of raw materials for various industries, acts as a source of food and income, medicine as well as energy (Harahsheh, 2001). With both natural and man induced hazards, pressure on natural resources, particularly natural vegetation, is increasing day by day. However, it is imperative for society to devise sustainable use of these resources so that the needs of the present and future generation is not compromised. This is because, natural vegetation can be depleted if they are not utilized in an effective and efficient manner. At the present moment, the utilization of the resources present in the world has been overused due to the ever increasing human population (Swe, 2005). It is very important to identify the natural resources in a region and take proper steps towards its conservation through sustainable management of the same. Since natural resources vary from one geographical locale to another, it is quite obvious that management practices will also vary depending on the resource. Some of them may have been effective for a few, while others have failed to achieve the desired outcome. With the development in the field of information technology, particularly RS & GIS, natural resource managers have now started using the same for its scientific, empirical, temporal and spatial techniques through the creation of various data base which can easily be verified with ground data, monitored and analyzed at any point of time. Such kind of up-to-date data base helps the management of resources because of informative data base and readily available information. Evaluating, determining and monitoring natural resource along with the changing nature of the earth surface is a key requirement for global change research (Committee on Global Change Research, National Research Council, 1999; Jung et al. 2006; Lambin et al. 2001). Natural vegetation forms an important component of natural resources of any region, particularly in areas having dearth of other forms ofland/soil resources. It is a crucial resource particularly in arid and semi-arid regions for a variety of environmental and economic reasons. Classifying and mapping vegetation is an important technical task for managing natural resources as vegetation provides a foundation for all living beings and plays an indispensable role in controlling global climate change,

International Journal of Advance and Innovative Research Volume 5, Issue 4 (XII): October - December, 2018
29
ISSN 2394 - 7780
such as influencing terrestrial CO2 (Xiao et al. 2004). Knowledge of vegetation types is becoming increasingly critical to assess and monitor the potential vulnerability of natural ecosystems due to human induced global environmental changes (Reddy et al, 2011). Spatio-temporal analysis and mapping of natural Vegetation gives us empirical data for comprehending the natural environment and the changes, positive or negative, brought to the natural environment through human endeavors. It is critical to obtain current states of vegetation cover in order to initiate vegetation protection and restoration programs (Egbert et al. 2002; He et al. 2005). Vegetative mapping helps to demarcate the various micro- geographical locales of a region and is an important integral part for sustainable land & ecological resource management. The existence and comparative affluence of certain plant species in some fixed geographical conditions along with their physiological and ecological resistances provide insight about the environmental/geographical requirements. It also helps in understanding the restoration/afforestation/ techniques that can be adopted based on site suitability, thereby aiding forest resource management and sustainable environmental development.
Generally, plant ecology investigations include four types of studies (Gerhart et all, 2004): (1) plant species survey; (2) estimates of the percent cover and age structure of dominant, perennial plant species; (3) evaluation of the composition, relative abundance, and distribution of plant associations; and (4) vegetation mapping.
2. METHODOLOGY
Fig-1: Flow chart of methodology
Filed survey /site selection through satellite images & extensive ground survey
Identification of vegetation types & Ground truth verification through GPS survey
GPS position of selected natural vegetation
Creation of Excel dataset
Vegetation map creation and Analysis
Creation of point location maps of surveyed species
Soil sampling & testing
Preparation of soil pH maps.

International Journal of Advance and Innovative Research Volume 5, Issue 4 (XII): October - December, 2018
30
ISSN 2394 - 7780
Ground verification of the collected data is a critical process. The detailed methodology is presented in Fig 1. To ensure that it is carried out in the most effective and efficient manner, the study area is usually divided into quadrants or transects. This is done to ensure that the interpreted elements of the satellite data conform to the ground characteristics. At the very onset IRS P6 LISS IV imagery (5.8m) of the study area for 2017 was studied to identify the sampling sites. The entire Churu district has been covered in 12 scenes of IRS P6 LISS IV data. The multispectral - season data was chosen for optimal discrimination of various vegetation types. All the scenes were acquired and geometrically corrected with reference to satellite data. The planimetric accuracy standards of ≤ 1 pixel error were achieved for all the scenes. ASTER GDEM (Global Digital Elevation Model) of the study area was used for understanding the topographical aspects of the study area (Fig 2). The False Colour Composite (FCC) mosaic of IRS- P6 LISS-IV data for the entire district of Churu is shown in Fig 3.
Upon identification and surveying of the sites from images, ground truth verification was done. The data that was collected on the ground was geo-referenced with the help of a GPS to ensure that its corresponding location can be accurately identified in the images that were collected earlier. Additionally, field points identified in the images were visited to verify information regarding the state of the vegetation, geomorphology, topography, soils, water and so on. With the use of the pre-field map that was generated and information from ground verification procedure, the final point and polygon maps of both pre monsoon and monsoon season were prepared in ARC map. The species were categorized into trees, shrubs and herbs and the same has been represented through figures.
Soil sampling of 32 sites were done which were in close proximity to the sampled sites of natural vegetation. A total of 05 parameters were tested which includes 02 physical parameters (Ph & EC) and 03 chemical parameters (NPK). All dataset of surveyed and sampled data was transferred in arc GIS platform through the help of excel data set.
The current work on natural Vegetation mapping represents the present ground truth scenario of Churu district for both pre monsoon and monsoon season as well as soil parameters of the said district. The detailed database in the form of attribute table includes information about the location of different types of species, local and botanical names, their spatial extension, utility of the species, soil parameters etc.
3. STUDY AREA The district of Churu (Fig 2) is situated in the northern part of the state of Rajasthan of India. It covers a total geographical area of 13,85,889 hectares. Precisely, it is located between 73º51’49” to 75º01’ east longitudes and between 27º24’39” to 28º19’ north latitudes with an elevation of 292 m. According to the 2011 census the total population of the district is 2,041,171.This small population is distributed into 7 sub administrative levels (tehsils) towns and 990 villages. Sandy arid plains are stretched throughout the area. Undulating sandy plains traversed with longitudinal dunes, with height ranging from 6 to 50 meters above mean ground level treading north east to south west, are well marked in the topography of the area. The terrain slopes from south to north east. The area has altitudes which vary from 199 to 472 meters above Mean Sea Level. Only some hillocks are present in the area and no big hills. There is absence of any perennial river or stream in the district. The principal supply of water is obtained from wells and ponds. The area is characterized by light brown sandy soil plains with scattered dunes. The soil is sandy to loamy fine sandy, very deep, non-calcareous and well drained surface horizon, a slightly calcareous, loamy fine sandy B horizon followed by a zone of lime accumulation, partly as concretion (CAZRI, 1990). The aridity index of the area is relatively high, ranging from 75% to 83% and therefore the area falls in arid climatic zone. The district of Churu which is located in the arid western Rajasthan, faces extreme climatic conditions and drought compared to the other arid regions of the country. There is a huge variation in temperature and the climate is dry desert type. Temperature range is from -2 to 50 º C. Relative humidity is generally below 30% except during brief south east monsoon period when the same rises up to 60%. Rainy season starts from July to mid- September and normal rainfall is only 328mm. The cropped area is estimated to be around 11.4 lakh ha, out of which 5.1% is under irrigation.

International Journal of Advance and Innovative Research Volume 5, Issue 4 (XII): October - December, 2018
31
ISSN 2394 - 7780
Fig-2: Study area
Fig-3: FCC of Churu district

International Journal of Advance and Innovative Research Volume 5, Issue 4 (XII): October - December, 2018
32
ISSN 2394 - 7780
4. RESULTS AND DISCUSSION Vegetation maps are useful tools in spatial GIS modeling (Carranza et al.,2003, Chytry 1998; Dirbock et al.,2003). The key to prepare such maps is to capture the vegetation pattern and type in a geographical region, which may have homogeneous or heterogeneous character. Vast amount of information can be displayed and also discerned about the flora of a particular land by referring to these maps which simultaneously is a gateway to other information database like soil-water-climate and anthropogenic imprint on land. Natural vegetation of an area is a representation and a wholesome outcome of the amalgamation of its varied geographical and edaphic factors including micro climatic parameters. Arid regions in India, as is elsewhere in the world, face a major problem of lack of suitable agricultural land vis-à-vis poor technological advancement which in turn affects the Indian economy, being agriculturally dominated. Natural vegetation especially in arid regions have the potential of becoming a crucial natural resource if utilized properly. However their potentiality as probable sustainable livelihood generator is generally overlooked.
Study and generation of database of vegetation through creation of multi layer information system serves a plethora of purposes ranging from knowledge dissemination to resources management and sustainable economic utilization of the same. Keeping in mind, the need to explore the natural resources of arid areas (natural vegetation) in an environmentally and economic sustainable, this study was carried out.
The study region is part of the western semi-arid region of India falling in Rajasthan coming under Bwh climatic zone. With extremes of climate and an acute shortage of rainfall along with extensively increasing saline soil extent, the region has very poor potentiality of agriculture. Dry farming is practiced extensively in areas even marginally suitable for agriculture. The region is thus poor in natural resources and economic activities. An extensive survey of all the seven tehsils of the district of Churu was made. The vegetation type reflects the geographical condition of the study area. It was dominated by trees that thrive well under drought conditions, low groundwater availability, saline soil, eroded and sandy soil. In the absence of any major resources in the study area, native natural vegetation with a plethora of utilities can easily serve as natural resources for the study area which can be judiciously used both to address the environmental and economic concern of the area. The natural vegetation of the study area can be divided into trees, herbs and grasses. A database of the natural vegetation that was surveyed and sampled in the study area along with their utilities was prepared which is shown in Table 1.
Table-1: List of sampled natural vegetation found in Churu district along with their uses Sr No Name of the Plant Family Local Name Part (s) used Uses
1. Acacia Arabica Fabaceae Babool Bark,latex Used in medicine and baking industry, soil improvement, return leached nutrients
2. Acacia tortilis Fabaceae/ Leguminaceae
Babool Pods, leaves, Root, Stem
bark
Tools, Cough and Diphtheria, Fungal disease, Infectious disease, To control soil erosion , drought resistant, can tolerate strong salinity
3. Acacia nilotica Fabaceae Babul/Kikar Tender leaves Wood work, treat diarrhea, aphrodisiac, dressing of ulcers, anti-inflammatory and in Alzheimer's diseases, used on degraded saline and alkaline soils.
4. Achyranthrus aspera Amaranthaceae Chirchita/ Latjira
Whole Plant Anti-inflammatory agent, also useful in snake bite, jaundice and anaemia
5. Aerva tomentosa Amaranthaceae Gorkhabundi Whole Plant Used as soil binder in desert
reclamation, fuel and fodder for goats
6. Albizia julibrissin Fabaceae Lal siris Flowers and bark
Treatment of mild states of anxiety and depression, withstands drought, high pH, soil salinity and wind.
7. Azadirachta indica Meliaceae Neem Twigs, Leaves Helps to detoxify body, treatment of skin diseases like eczema, psoriasis, Soil improver etc.

International Journal of Advance and Innovative Research Volume 5, Issue 4 (XII): October - December, 2018
33
ISSN 2394 - 7780
8. Balanites aegyptica Zygophyllaceae Hingot Fruit, stem and bark
Used as food, for headache and for improving lactation, agroforestry
9. Calotropis procera Asclepidaceae Aak Roots, Flowers
Joint pain, parasitic infections like elephantitis and worms, grow in saline soils and reduce salinity
10. Capparis decidua Capparidaceae Kair Flower buds Manufacture of medicines and cosmetics, it helps prevent soil erosion, particularly in controlling wind erosion in sandy areas, as well as reduction of alkalinity and increase in organic carbon and available N, P and K.
11. Cassia auriculata Caesalpinioideae
Avaram Root, leaves, Flowers
Diseases of urinary system and constipation, used as food
12. Casuariana Casuarinaceae Agoho/ Junglisaru
Root diarrhea and dysentery, To control soil erosion , drought resistant
13. Crotalaria burhia Fabaceae Khimp leaves, branches and roots
gout, eczema, hydrophobia, pain and swellings, wounds and cuts, infection, kidney pain, abdominal problems, rheumatism and joint pain, reduces salinity
14. Dactyloctenium scindicum
Poaceae Madhana grass It is an average fodder grass, used when good ones are not available, can grow in extremely nutrient deficit saline soils.
15. Eucalyptus globulus Myrtaceae Sugandha
Leaf, fever pain reliever, breathing in colds, killing the bacteria and fungi, afforestation specie
16. Ficus religiosa Moraceae Pipal Leaves, fruits, bark, seeds
asthma, diabetes, diarrhea, epilepsy, gastric problems, inflammatory disorders, infectious and sexual disorders
17. Lathyrus linifolius Fabaceae Khesari roots and dried
Food- Tuber
18. Leptadenia pyrotechnica
Asclepidaceae Khimp Whole Plant smallpox victims, eye-lotion
19. Maytenus emarginata Celastraceae Vinger, Kankero, Baikal, Ma
lkangni
Bark, Leaf, flowers and fruits ,root
fever, asthma, rheumatism and gastrointestinal disorders, can be used as a covering element for the loose sandy crests and tops of the dunes in the first year of stabilization
20. Nerium indicum Apocynaceae Kaner Bark,leaves,flower
bitter, acrid, astringent, anthelmintic, aphrodisiac, stomachic, febrifuge, diuretic, emetic, expectorant, cardio tonic, anticancer
21. Prosopis cineraria Fabaceae Khejri/janti Bark, leaves, flowers
Rheumatism, Cough, Common cold, Anthelmintic disorder ,dysentery, Bronchitis, Asthma, Leucoderma, piles and Tremors of the muscles, Agroforestry, Erosion control or dune stabilization; Fodder/animal feed, Invertebrate food for lac/wax

International Journal of Advance and Innovative Research Volume 5, Issue 4 (XII): October - December, 2018
34
ISSN 2394 - 7780
22. Prosopis juliflora Fabaceae Khejri Bark.leaves Forage,honey,wood can be used for urniture,fencepost,pilings,substrate for producing single cell protein,for fuel , to arrest sand movement and encourage sand deposition..
23. Salvadora persica Salvadoraceae Jhal/Chotapilu Roots, bark antiplaque, analgesic, anticonvulsant, antibacterial, antimycotic, cytotoxic, antifertility, deobstruent, carminative, diuretic, astringent, and also used in biliousness, and rheumatism, can be used to check sand dune spread.
24. Solanum xanthocarpum
Solanaceae Kateli Root, Stem, flowers and
fruits
cough, asthma, and chest pain, anti-cancerous
25. Tecomella undulata Bignoniaceae Rohida Bark, Seeds, curing urinary disorders, enlargement of spleen, gonorrhoea, leucoderma and liver diseases, against abscess
26. Ziziphus nummularia
Rhamnaceae Jhadi-ber Leaves ,fruits
analgesic, anti-inflammatory, antitussive, anthelmintic, and anti-cancer drug, Leaves known as pala used as fodder for animals.
Source: Based on field survey and secondary data sources.
As is seen from Table 1, all the plants have medicinal, economic and environmental value. The number and diversity of vegetation was low in the pre-monsoon season (summer) than monsoon season for the obvious reason of dearth of rainfall and excessively high temperature as is represented in Fig 4. Grasses were either burnt or non-existent. This can be accounted for due to high temperature during the season.
Fig-4: Temperature and rainfall characteristics of Churu district
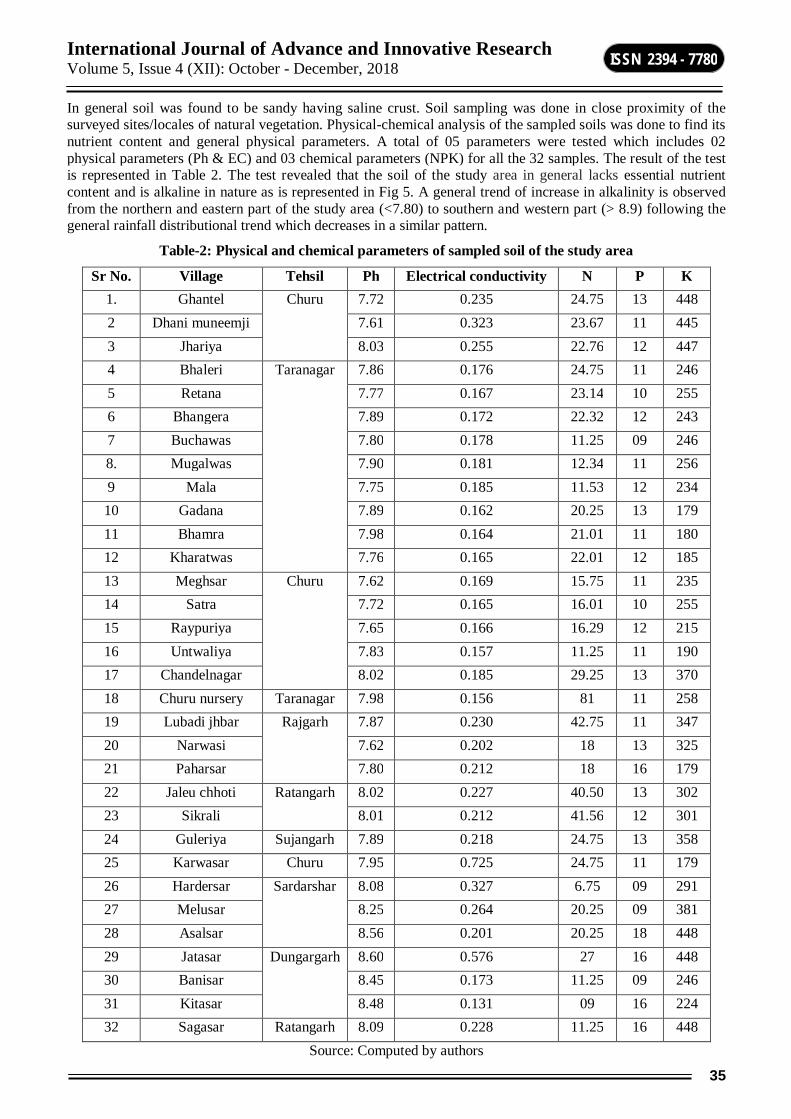
International Journal of Advance and Innovative Research Volume 5, Issue 4 (XII): October - December, 2018
35
ISSN 2394 - 7780
In general soil was found to be sandy having saline crust. Soil sampling was done in close proximity of the surveyed sites/locales of natural vegetation. Physical-chemical analysis of the sampled soils was done to find its nutrient content and general physical parameters. A total of 05 parameters were tested which includes 02 physical parameters (Ph & EC) and 03 chemical parameters (NPK) for all the 32 samples. The result of the test is represented in Table 2. The test revealed that the soil of the study area in general lacks essential nutrient content and is alkaline in nature as is represented in Fig 5. A general trend of increase in alkalinity is observed from the northern and eastern part of the study area (<7.80) to southern and western part (> 8.9) following the general rainfall distributional trend which decreases in a similar pattern.
Table-2: Physical and chemical parameters of sampled soil of the study area
Sr No. Village Tehsil Ph Electrical conductivity N P K 1. Ghantel Churu 7.72 0.235 24.75 13 448 2 Dhani muneemji 7.61 0.323 23.67 11 445 3 Jhariya 8.03 0.255 22.76 12 447 4 Bhaleri Taranagar 7.86 0.176 24.75 11 246 5 Retana 7.77 0.167 23.14 10 255 6 Bhangera 7.89 0.172 22.32 12 243 7 Buchawas 7.80 0.178 11.25 09 246 8. Mugalwas 7.90 0.181 12.34 11 256 9 Mala 7.75 0.185 11.53 12 234 10 Gadana 7.89 0.162 20.25 13 179 11 Bhamra 7.98 0.164 21.01 11 180 12 Kharatwas 7.76 0.165 22.01 12 185 13 Meghsar Churu 7.62 0.169 15.75 11 235 14 Satra 7.72 0.165 16.01 10 255 15 Raypuriya 7.65 0.166 16.29 12 215 16 Untwaliya 7.83 0.157 11.25 11 190 17 Chandelnagar 8.02 0.185 29.25 13 370 18 Churu nursery Taranagar 7.98 0.156 81 11 258 19 Lubadi jhbar Rajgarh 7.87 0.230 42.75 11 347 20 Narwasi 7.62 0.202 18 13 325 21 Paharsar 7.80 0.212 18 16 179 22 Jaleu chhoti Ratangarh 8.02 0.227 40.50 13 302 23 Sikrali 8.01 0.212 41.56 12 301 24 Guleriya Sujangarh 7.89 0.218 24.75 13 358 25 Karwasar Churu 7.95 0.725 24.75 11 179 26 Hardersar Sardarshar 8.08 0.327 6.75 09 291 27 Melusar 8.25 0.264 20.25 09 381 28 Asalsar 8.56 0.201 20.25 18 448 29 Jatasar Dungargarh 8.60 0.576 27 16 448 30 Banisar 8.45 0.173 11.25 09 246 31 Kitasar 8.48 0.131 09 16 224 32 Sagasar Ratangarh 8.09 0.228 11.25 16 448
Source: Computed by authors

International Journal of Advance and Innovative Research Volume 5, Issue 4 (XII): October - December, 2018
36
ISSN 2394 - 7780
Fig-5: Soil pH map
Due to comparable high rainfall in monsoonal season, affluence of natural vegetation was observed in the monsoon season (compared to premonsoon season). Acacia tortilis,Leptadenia pyrotechnica,etc trees are dominant in the monsoon season. Shrubs like Zizyphus nummularia,Maytenus emarginata etc. can be seen. Solanum xanthocarpum,Withania somniferum herbs were noted.Crotolaria burhia and Dactyloctenium scindium grasses are widespread,which can be documented for due to the monsoon shower. Surveyed and sampled natural vegetation of the monsoon season and pre monsoon season have been illustrated in Fig 6 and Fig 7.
Fig-6: Monsoon Vegetation of Churu

International Journal of Advance and Innovative Research Volume 5, Issue 4 (XII): October - December, 2018
37
ISSN 2394 - 7780
Fig-7: Pre-Monsoon Vegetation of Churu
Certain farmers have taken up medical gardening in the form of Aloe Vera plantations, in the otherwise barren and saline sandy soils of the study area. Traditional knowledge of the natives has been employed to set up small scale industries to serve as an option for livelihood.Neem(Azadirachta indica) and it’s various products for health and beauty have been explored. Similarly weeds like Achyranthes aspera have good medicinal potential have been exploited too. Keeping in mind the subtle scope of natural vegetation resource along with its various uses, most of them untapped, a vegetation map was made for the dissemination of knowledge and preparation of a data repository for efficient management of natural resources of the study area. The information thus broadcast is of immense value as it will help to conserve the vegetation, formulate afforestation methods, help in the economic planning etc.
The tehsils of Shri Dungargarh,Benisar,Kalyansar,Sujangarh and Sardarshahar,show little natural vegetation as this land has been converted into agricultural land.
The main problem faced by the rural people of Churu is monetary in nature. This is mainly because of lack of agricultural land, as both climatic as well as geographical conditions are unfit for cultivation. Various surveys on the district of Churu have revealed that though it is has sparse vegetation, yet this vegetation is a rich economic utility storehouse. Apart from medicinal value, a number of naturally growing plants can be utilized for the purpose of livelihood. Medicinal plants are richly found. The people of the district have been using it for curing diseases like snake bite, asthma, insect bite etc. Apart from medicinal and economic value the natural vegetation of the study area which is well adapted to the climatic and geographical extremes of the study area has numerous environmental uses like checking soil salinity, enhancing soil nutrient content, checking sand dunes/ desertification, arresting soil erosion etc.
5. CONCLUSION Through this study, an effort has been made to map the natural vegetation of the area. In the absence of other resources in a region of environmental extremes, the natural vegetation of this region equipped with medicinal, environmental conservational and economic values needs to be developed. This is a good strategy to suggest conservational steps to boost natural vegetation as a source of natural resource, which can be utilized as a means to provide livelihood and other needs of the area. Under ignorance, they lie wasted and untapped in the region.

International Journal of Advance and Innovative Research Volume 5, Issue 4 (XII): October - December, 2018
38
ISSN 2394 - 7780
There is therefore an urgent need to explore their potential and conserve them too. The findings of this paper have dealt in detail about how Geographical Information System can be used for sustainable development of the area. Vegetation of the area under two pre and monsoon seasons was mapped. As arid regions are considered poor on natural resources, their wise use can lead to further development of the district.
ACKNOWLEDGEMENTS The work is an outcome of an ongoing project on Application of Geo-Informatics for Sustainable Development of Environmental Resources in a Semi-Arid Region of India, funded by ICSSR. The authors are indebted to ICSSR for funding the work.
REFERENCES Carranza,M.L.,Ricotta,C.,Fortini,P.&Blasi,C.(2003)Quantifying landscape change with actual vs.potential
natural vegetation maps.Phytocoenologia,33:591-601.
Chytry,M.(1998).Potential Replacement Vegetation:An Approach to Vegetation Mapping of Cultural landscapes.Applied Vegetation Science,1(2):177-188.
Committee on Global Change Research, 1999. Global Environmental Change:Research Pathways for the Next Decade. National Academy Press, Washington, DC.
Dirnbock,T.,Greimler,J.,Lopez,P.&Stuessy,T.F,(2009).Predicting future threats to the native vegetation of Robinsoe Crusoe Island .Juan Fernandez Archipelago Chile Conservation Biology ,17(6):1650-1659.
Harahsheh, H. (2001). Development of Environmental GIS Database and its Application to Desertification Study in Middle East. Chiba: Chiba University.
He C, Zhang Q, Li Y, et al. (2005) Zoning grassland protection area using remote sensing and cellular automata modeling—a case study in Xilingol steppe grassland in northern China. J Arid Environ 63:814–26.
Jung, M.; Churkina, G.; Henkel, K. (2006), Exploiting synergies of global land cover products for carbon cycle modeling. Remote Sensing of Environment, 101, 534-553.
Lambin E F., Tyrner B.L., Geist H L.et al (2001). The causes of land use and land cover change: moving beyond the myths, Global Environment change, 11 (2001), 261-269.
Reddy C.S., Krishna P. H., Kiran R.A (2001). Mapping the vegetation types of Rajasthan using Remote sensing data, J. Env Res. And Management, 2 (1), 1-9.
Swe, M. (2005). Application of GIS and Remote Sensing in Myanmar. Retrieved on 5th October 2012 from http://www.aprsaf.org/data/aprsaf12_data/day2/eo/5_APRSAF-12MS.pdf
V.J.Gerhartw. J.Waughe. P.Glenni. L.Pepper (2004), Ecological Restoration, Environmental Monitoring and Characterization, 357-375.
Xiao XM, Zhang Q, Braswell B, et al. (2004) Modeling gross primary production of temperate deciduous Broad leaf forest using satellite images and climate data. Remote Sens Environ 91:256–70.

International Journal of Advance and Innovative Research Volume 5, Issue 4 (XII): October - December, 2018
39
ISSN 2394 - 7780
A STUDY ON IMPACT OF SOLAR PRODUCTS ON BUSINESS IN SIVAKASI TALUK
M. Rajeev Gandhi1 and Dr. M. Ponnien Selvi2 Assistant Professor1, Sri Kaliswari College (Autonomous), Sivakasi
Associate Professor2, V. V. Vanniaperumal College for Women (Autonomous), Virudhunagar
ABSTRACT Business of 21st century witnessed in renewable energy in the application of business. The solar products are found everywhere in the business and household. Today with availability of solar products business can play a vital role, in the promotion and development of business with alternative energy source, a whole lot of alternatives image of reacting rural household also. The solar products are used for next level of business. A survey was conducted by the researchers to study the impact of solar products on business in sivakasi taluk.
1. INTRODUCTION The solar products are emerging into the market to alternative energy source. The power of solar is abundantly available in the universe. The billions of user can use ultimately. In the present globalised scenario, everywhere there is a use of solar products, including in business and household. The solar products are considerably a great source among alternative resources to electricity for business. Some of the familiar solar products are listed blow that are used in general of business and household.
Solar Lights/ Lamps/ Lanterns
Solar Cooler/ Fans
Solar Mobile Chargers
Solar Mosquito Trap
Solar Garden Fountain
Solar Toys
Solar Watches
Solar dryers
Solar visor radios
Freezers/mini-fridges
2. STATEMENT OF THE PROBLEM In a competitive business environment, every business wants to sustain and survive for long period and promote his/ her business. There are various energy through which one can promote and develop the business. The solar power is considered a powerful energy source. In general most of the people are not aware of the solar products and its advantages. In this context the following questions were arise.
1. To what extent the respondents in the study area are aware of solar products
2. What is the impact and use of solar products on respondents business? And such other related questions.
3. OBJECTIVES OF THE STUDY 1) To find level of awareness on solar products of the respondents in the study area
2) To study the impact and use of solar products on the business growth in the study area
3) To offer concrete suggestions based on the findings of the study
4. METHODOLOGY 4.1. Source of Data This study is depends on both primary and secondary source of data. The secondary data are collected from standard text books and websites.
4.2. Sampling Design Sampling frame is limited to the surrounding of sivakasi taluk.
Sample of the study constitute 100 business people who are using solar products in the study area Sampling method is snowball sampling; it was used for the acquired number of samples.

International Journal of Advance and Innovative Research Volume 5, Issue 4 (XII): October - December, 2018
40
ISSN 2394 - 7780
4.3. Statistical Tools Relevant statistical tools such as percentage analysis, chi-square test were used for the analysis of survey.
4.4. Hypothesis Ho: there is no association between demographic characteristics of the respondents and solar products usage.
5. ANALYSIS OF DATA
Table-1: Profile of the respondents Age No. of respondents Percentage (%)
20-30 14 14 31-40 44 44 41-50 21 21 51-60 11 11
Above 60 10 10 Total 100 100
Location No. of respondents Percentage (%) Rural 22 22
Semi - Urban 33 33 Town 45 45 Total 100 100
Educational status No. of respondents Percentage (%) Diploma 23 23
U G 39 39 P G 31 31
Others 7 7 Total 100 100
Horse power No. of respondents Percentage (%) 1 – 5 HP 23 23 6 - 10 HP 46 46
11 - 15 HP 12 12 16 - 20 HP 10 10
Above 20 HP 9 9 Total 100 100
Business growth No. of respondents Percentage (%) Strongly agree 43 43
Agree 41 41 No opinion 11 11
Degree 3 3 Highly disagree 2 2
Total 100 100 Source: Primary Data
The above analysis revealed that a majority of 44 % of the respondents are in the age group of 31- 40 years. The above table shows that 45% of the respondents are located in the town area. It is clear from the above table shows that majority of 39 % of the respondents are completed under graduation. It evidence from the above table majority of 46 % of the respondents are using 6- 10 HP motors for their business. A great majority 43% of respondents are having idea with the promotion of business with the help of solar.
6. TESTING OF HYPOTHESIS Ho: There is no association between demographic characteristics of respondents and solar products usage.
Table-2 Chi – square 2.000 48.120
Df 3 6 Asymp. Sig .572 .000
As computed P value is less than assumed value 0.05 the above null hypothesis is rejected. So there is a association between demographic characteristics of respondents and solar products usage.

International Journal of Advance and Innovative Research Volume 5, Issue 4 (XII): October - December, 2018
41
ISSN 2394 - 7780
7. FINDINGS OF THE STUDY The majority of 44 % of the respondents are in the age group of 31 – 40.
The majority of 45% of the respondents are located in the town area.
The majority of 39 % of the respondents are completed under graduation. It indicating that education impacts the people for adopting solar system in their business.
The majority of 46 % of the respondents are using 6- 10 HP motors for their business.
A great majority of respondents are having idea with the promotion of business with the help of solar
8. SUGGESTION AND CONCLUSION From the findings, it is clear that most of the respondents are use solar products and consider that as the cheap and best means of energy. It is suggested that marketers of other brands are concentrate on service like affordable cost, without frequent interruption. So that would reach the rural area also.
Solar mainly used in medium scale business. Still it is not moved to all the sectors to reap more benefits. This would expand their volume of business in all areas.
REFERENCE J. E. Trancik and D. Cross-Call, Environ. Sci. Technol., 2013, 47, 6673-6680.
M. Z. Jacobson, Energy Environ. Sci., 2009, 2, 148-173.
U.S. Energy Information Agency (EIA), 2014.
MIT Future of Solar Energy Study, 2015, in preparation.
J. Jean et al., Energy Environ. Sci., 2015, DOI: 10.1039/C4EE04073B.
www.indg.in/rural:-energy/technologies-under-rural-energy/solarcool
www.en.wikipedia.org/wiki/solar-desalination
www.mahaurja.com/desalintion_systems.html
www.advantagesofsolarenergy.net/solar-thermal-energy.

International Journal of Advance and Innovative Research Volume 5, Issue 4 (XII): October - December, 2018
42
ISSN 2394 - 7780
RISK BEHAVIOUR OF GOLD AND SILVER PRICES IN INDIA WITH RESPECT TO GST ANNOUNCEMENT: AN EMPIRICAL STUDY
R. Sugirtha1 and Dr. M. Babu2 Research Scholar1 and Assistant Professor2, Bharathidasan University, Thiruchirappalli, Tamil Nadu
ABSTRACT The information about the Goods and Services Tax (GST) was widely spread to the people. After the implementation of GST, prices of certain goods and services has increased and decreased. Thus, many people had the negative information about the GST. In this connection, the present study focused to investigate the price volatility of gold and silver, during before and after implementation of GST. Descriptive statistics, Augmented Dickey- Fuller Test and GARCH (1, 1) Model were used for analysis of the study. The results of the study showed that the gold price volatility was low in before the GST implementation while comparing the after-GST implementation. At the same time the silver price volatility was low in after implantation of GST. It is to be noted that the information about economy policy/changes affected the gold and silver price. Thus investors of gold and silver may consider the economic events before investing their money in these commodities.
Keywords: Commodity Market, Garch (1, 1) Model, Gold, Goods and Services Tax, Silver.
INTRODUCTION Commodities market is one of the fastest growing markets in India and it also has major roles in economic development. India has two major commodity markets namely National Commodity Derivatives Exchange (NCDX) and Multi Commodity Exchange (MCX). In these exchanges, (Include the commodities traded in Indian Market alone- Corn, Livestock, sugar, soybean Rubber, Crude Oil are not traded in Indian Market) for the purpose of analyzing the price behaviour, the study chose gold and silver from these commodities.
Goods and Services Tax involves a single tax on supply of goods and services or both, by amalgamating all the central indirect taxes (excise duty, countervailing duty and service tax) and state indirect taxes (VAT, luxury tax, entry tax, octroi, etc). After implementing of goods and service tax, most of the commodities prices are fluctuated. At the same time, the price of precious metals like gold and silver were affected due to implementation of GST.
REVIEW OF LITERATURE Priyanshu Sharma and Manojsain (2015) analyzed impact of GST implementation on banking sector index of Indian stock market during before and after GST implementation. The study concluded that there was a positive effect of GST implementation in banking sector. Milandeeep kour (2016) theoretically analyzed the difference between past indirect taxes and GST. it concluded that GST play a dynamic role in the growth and development of country. The results of Pandey, D. K., & Jaiswal, A. K. (2017) showed that demonetization was highly negative impact on the performance of stock markets. Alice mani, Abhishek singh(2017) concluded that the GST implementation influence the automobile and banking sectoral indices of Indian stock markets. The study by Lourdunathan F. and Xavier P(2017) examined the background, prospects and challenges in implementation of goods and service tax in India. It was concluded that GST had a positive impact on various sectors of Indian economy. Mohan Kumar and Yogesh Kumar (2017) answered the questions, whether the GST influence the FMCG Sector of Indian economy. The results of the study revealed that the GST had a positive effect in FMCG Companies’ performance. Using descriptive statistics, Rashi Gupta (2017) discussed the benefits and opportunity of goods and services tax and its impact on Indian economy. It has been found that GST implementation influenced the Indian economy in the way of positive. Meenakshi Bindal (2018) tested the working mechanism of GST to evaluate the advantages and challenges of GST. The result showed that GST mechanism is designed in such a way that it is expected to generate good amount of revenue for both central and state government.
Many have analyzed the impact of GST on various sectors and came with different conclusion. It is quite natural that when any reforms are introduced by the Government, it will lead to many assumptions. In a major economic reform like Goods and Services Tax, lead to many hardships for the Government and as a result the GST Council revised the tax slabs on many commodities various times. This resulted in fluctuation in the prices of various commodities as there was no clarity in the initial days. Further, the Nirav Modi scam led to various hardships for the jewellery business which had its impact on the prices of precious metals. With a view to study the price behaviour (volatility) of Gold and Silver, the high valued precious metals, the present paper has been designed to identify the variations in the volatility of Gold and Silver during the period of pre and post implementation of GST by using Econometric Methodology.

International Journal of Advance and Innovative Research Volume 5, Issue 4 (XII): October - December, 2018
43
ISSN 2394 - 7780
STATEMENT OF PROBLEM In the view of global and domestic level, any Government policies, natural disasters, firms merge, terrorist attacks etc., affected the financial Markets of the respected country as well as other countries. In the last two years of Indian history, the central government to implement two major economic policies continuously within the short time period, first one is demonetization and another one is Goods and Service Tax (GST). The information about the Goods and Services Tax was widely spread to the people. Many people had the negative information about the GST. The indian investors, invest their bulk money in gold and silver. Thus, the present study analyse the risk behaviour of Gold and Silver prices during before and after the implementation of GST period.
OBJECTIVE OF THE STUDY The aim of the study is to investigate the risk behaviour of gold and silver prices during before and after the implementation of GST
HYPOTHESIS OF THE STUDY NH01: There is no volatility in gold and silver prices during before and after implementation of GST
METHODOLOGY Sample As per the SEBI investor survey 2015, many Indian people invest their surplus money in gold or silver, thus the present study have been selected Gold and Silver as a sample commodity for analyzing the risk behavior, during before and after GST Implementation.
Period of the study The period of study has been divided into two. The first period from 1st august 2016 to 31st may 2017 is considered as before GST Implementation period and the second period from 1st June 2017 to 31st March 2018 is considered as after GST implementation period.
Source of Data The analysis is based on gold and silver before and after implement of GST. The daily closing prices gold and silver has been collected from Multi Commodity Exchange of India Limited (MCX).
Tools used for the study The following tools were used for analyzing the objectives.
Descriptive Statistics – Used for Checking the nature/normality of the daily prices of Gold and Silver.
Augmented Dickey Fuller Test (ADF) – Used for testing the Stationarity of the daily prices of Gold and Silver.
GARCH (1,1) – Used for identifying the volatility behaviour of the daily prices of Gold and Silver.
FINDINGS AND DISCUSSIONS The results of descriptive statistics for daily returns of commodity markets are portrayed in Table-1. It clearly reveals that mean return values (-0.000302 and -0.000645) of daily price of gold and silver were recorded negative return during the period of before implementing GST. But after implementing GST the mean values (0.000469 and 0.000184) for daily price of gold and silver recorded positive returns. The standard deviation values for Gold (0.005972, 0.004973) and Silver (0.011751, 0.008794) exhibits the risk, during before and after GST implementation period. The highest risk was found in before GST implementation, while comparing after GST implementation for both Gold and Silver. The daily prices of both Gold and Silver recorded negative skewness value (gold -0.127529 and silver 0.26.622) before GST implementation and the positive skewness value (gold 0.260622 and silver 0.00957) for after GST implementation. All the kurtosis sample values are greater than 3, which make it leptokurtic. The Jarque-Bera values indicated that all the samples were normaly distributed, except gold (2.949079) after GST.
Table-1: Results of Descriptive statistics for daily prices returns of Gold and Silver during the study period from July 2017 to April 2018
Descriptive Variables Gold Silver Before GST After GST Before GST After GST
Mean -0.000302 0.000469 -0.000645 0.000184 Standard Deviation 0.005972 0.004973 0.011751 0.008794
Skewness -0.127529 0.260622 -1.107507 0.00957

International Journal of Advance and Innovative Research Volume 5, Issue 4 (XII): October - December, 2018
44
ISSN 2394 - 7780
Kurtosis 4.648528 3.261885 9.58969 4.088337 Jarque-Bera 23.76889 2.949079 410.8075 10.26864
Source: Collected from https://www.mcxindia.com/home
Table-2: Results of Augmented Dickey- Fuller Test for daily return of Gold and Silver during the study period from July 2017 to April 2018
Before Test critical values Prob. Augmented Dickey-Fuller
test statistic Gold Silver 1% level 5% level 10% level
-11.6396 -14.4777 -3.462095 -2.8754 -2.57423 0.0001 After Test critical values Prob. Gold Silver 1% level 5% level 10% level -14.4777 -13.3121 -3.462095 -2.8754 -2.57423 0.0001
Source: Collected from https://www.mcxindia.com/home
The results of Augmented Dickey Fuller (ADF) Test, for gold and silver during before and after GST implementation between the period of July 2017 to April 2018, are represented in table - 2. The test critical values, for gold and silver were analyzed at significant level of 1%, 5%, and 10%. The analysis for the table clearly indicates that the statistical value for Gold (-11.6396) and Silver (-14.4777), were higher than the test critical values before the implementation of GST (Ignoring the sign). Hence the prices for the Gold and Silver indicates the stationary. Similarly, after the implementation of GST results reveal the statistical values for Gold (-14.4777) and Silver (-13.3121), which were greater than the test critical values after the implementation of GST (Ignoring the sign). It is proved that prices of the gold and silver were found stationary after the GST implementation period. The ‘p’ value was found to be statistically significant.
Table-3: Result of Volatility Analysis for Gold and Silver α β α + β Prob.
Before implementation of GST Gold -0.10977 0.958135 0.848365 0.000 Silver -0.01643 1.012808 0.996381 0.000
After Implementation of GST Gold 0.077693 0.826055 0.903748 0.000 Silver 0.083562 0.8093 0.892862 0.000
α = ARCH (-1); β = GARCH (-1)
Source: Collected from https://www.mcxindia.com/home
The Table - 3 explores the results of GARCH (1, 1) Model for the daily returns of Gold and Silver, during before and after implementation of GST. The results showed that there was a significant volatility associated with the daily prices of Gold and Silver, during before and after implementation of GST. The sum of value of ARCH (1) and GARCH (1) for Gold and Silver for before GST Implementation are 0.84836 and 0.996381and after GST Implementation are 0.903748 and 0.892862. These results showed that before the GST implementation, the gold price volatility was low, comparing the after GST implementation, at the same time the silver price volatility was low in after implementation of GST. The probability value of both Gold and silver values is 0.000, this value is less than the significant value 0.05. These results also proved that significant volatility employed in both gold and silver during before and after GST implementation. Hence the study reject the null hypothesis H01 “There is a significant volatility in daily prices of Gold and Silver, during before and after GST implementation”, Hence theNull Hypothesis NHO1: there is no volatility in the daily returns of gold and silver during study period
CONCLUSION AND RECOMMENDATIONS The present study focused to analyse the Price behaviour of Gold and Silver during pre and post implementation of Goods and Services Tax in India. The study collected the daily prices of Gold and Silver from the official website of MCX India for the period of ten months before and after date of GST implementation. Descriptive statistics, Augmented Dickey- Fuller Test and GARCH (1, 1) Model were used to test the null hypothesis. The results of the study indicated that the Gold and Silver employed with positive returns during pre-GST implementation, at same time, in the period of post GST implementation, both the Gold and Silver recorded negative returns. From the results of GARCH (1, 1) model, the study found that before the GST implementation, the gold price volatility was low, comparing the after-GST implementation, at the same time
International Journal of Advance and Innovative Research Volume 5, Issue 4 (XII): October - December, 2018
45
ISSN 2394 - 7780
the silver price volatility was low in after implantation of GST. It is to be noted that the information about economy policy/changes affected the gold and silver price. Thus investors of gold and silver may consider the economic events before investing their money in these investments.
REFERENCES Bindal, M., & Gupta, D. C. (2018). Impact of GST on Indian Economy. International Journal of
Engineering and Management Research (IJEMR), 8(2), 143-148.
Garg, G. (2014). Basic concepts and features of good and service tax in India. International Journal of scientific research and Management, 2(2), 542-549.
Gupta, R. (2017). GOODS AND SERVICE TAX-A POSITIVE REFORM IN INDIAN TAXATION SYSTEM. International Journal of Management Research and Reviews, 7(6), 674.
Kour, M., Chaudhary, K., Singh, S., & Kaur, B. (2016). A Study on Impact of GST after its Implementation. International Journal of Innovative Studies in Sociology and Humanities, 1(2), 17-24.
Lourdunathan, F., & Xavier, P. (2017). A study on implementation of goods and services tax ( GST ) in India : Prospectus and challenges. International Journal of Applied Research, 3(1), 626–629.
Mani, A., Singh, A., & Chinmayi, C. V. (2017). Impact of GST on Seven Selected Sectorial Indices of BSE, 33–37.
Mohan Kumar, Y. K. (2017). GST & its Probable Impact on the FMCG Industry in India. International Journal of Research in Finance and Marketing (IJRFM), 7(4), 66–76. Retrieved from http://euroasiapub.org/current.php?title=IJRFM
Pandey, D. K., & Jaiswal, A. K. (2017). Impact of Demonetization on Indian Stock Market-An Empirical Study. Al-Barkaat Journal of Finance & Management, 9(2), 46-66.
Sharma, M. P., & Sain, M. (2017). A Review of Goods and Services Tax (GST): Impact on Indian Stock exchanges and various stock Sectors. International Journal of Scientific Research and Management, 5(11), 7418-7422.
International Journal of Advance and Innovative Research Volume 5, Issue 4 (XII): October - December, 2018
46
ISSN 2394 - 7780
DRIVING MOTIVES OF A CUSTOMER TOWARDS BRANDED BEAUTY SALON
Dr. D. Ravindran Assistant Professor, Kristu Jayanti College (Autonomous), Bangalore
ABSTRACT The study attempts to understand the driving forces of a customer towards the branded beauty salons irrespective of different demographic, psychographic customers. This study analyses the customer’s willingness and driving forces like Promotions, Price, Satisfactory level of the customer service from various beauty salons in this industry. The final number sample was taken as 80 from various branded salons in the selective areas of Tamil Nadu. Responses of the customers are collected through questionnaire. Descriptive research was adopted in this research. The sampling technique used in this study is convenience sampling. It is analyzed by using percentage analysis, chi-square and one way ANOVA. This study helps to understand the customer motive to the customers and competition among the beauty salon market
Keywords: Driving Motives, Customers, Branded Beauty Salons
I. INTRODUCTION OF THE STUDY This study is about DRIVING MOTIVES OF A CUSTOMER TOWARDS BRANDED BEAUTY SALON to understand the customer’s motive to visit and take beauty salons in branded beauty salons. This study investigates about the customer’s perception about the services in different branded beauty salons. The beauty industry is highly emerging in this decade because of the beauty conscious among the people irrespective of the age and gender.
This study mainly concentrates about the driving force of the customer towards the beauty salons which gives an idea to the organization to develop in its brand development and its enhancement. Beauty service has a lot of problems in deciding the strategies in planning the price, place and its promotion to the customers. This study suggests in improve the service quality, ambience of the salon and pricing levels of the services. New services are also demanded by the customers by providing new launches and offers to membership customers.
Competition in the market is highly increasing in beauty salon industry which provides by increasing company-owned outlets and franchise outlets all over India. The healthy competition provides changes in services, giving offers to customers and increasing the service quality as expected by the customer.
TOP 10 BEAUTY SALONS IN CHENNAI-INDIA:
1. LAKME BEAUTY SALONS
2. JAWAED HABIB HAIR & BEAUTY SALONS
3. SHAHNAZ HUSAIN SPAS & SALONS
4. VLCC
5. NATURALS UNISEX SALON & SPA
6. L’OREAL PROFESSIONNEL SALONS
7. STAR & SITARA SALON
8. AFFINITY SALON
9. GREEN TRENDS HAIR & STYLE SALON
10. STRANDS SALON & SPA
NEED FOR THE STUDY This study is to understand customer motives towards beauty salons based on To know Customer choice and Preference of services in the beauty salons.
To find the effective means of Channel of communication
To examine the market competition
To understand Segmentation of the market in the industry
To analyze and propose the effective promotional mix

International Journal of Advance and Innovative Research Volume 5, Issue 4 (XII): October - December, 2018
47
ISSN 2394 - 7780
SCOPE OF THE STUDY This study is identifying the driving forces of the customer towards branded beauty salons for the period of
two months.
This study is done to know about the customer’s preference and pulling factor towards the branded beauty salons.
This study is done in various respondents irrespective of the age, gender, various income groups to understand the driving force towards salons.
OBJECTIVES OF THE STUDY To identify the driving motives of a customer towards branded beauty salon
To find the attractiveness of the promotional activities of the salons among customers
To analyze the competition among the salons in the market
To understand the effective means of the channel of communication
HYPOTHESES H01 (Null hypothesis) = There is no significant difference between Occupation of the respondent and
Respondent’s selection of particular branch of a beauty salon.
H02 (Null hypothesis) = There is no significant difference between Respondents age and reason for coming back to the salon
II. REVIEW OF LITERATURE Brand loyalty leads to reduced marketing costs, additional new customers and higher trade leverage (Aaker,
1991). Quality and buying habits thus influence this because buyers prefer risk decreasing in well-known products not as in a new one (Nilson, 1998). Thus evaluating the brand preference of buyers is an interesting area for the sellers to create the selling strategies for their brands.
Gihan Wijesundera et al (2008) attempts to sort out factors affecting the demand for Beauty Soap among female buyers in the Greater Colombo Region. The sample comprises of 91 female buyers in greater Colombo region. Data were collected by administrating questionnaires. The independent variables are 4Ps, Age, Income Level, Education, Marital status, Occupation, Skin type, Social factors, Substitute products & dependent variable is the Brand preference. The results indicated that there were statistical relationships between price, product, education, occupation and band preference and there was no statistical relationship between place, promotion, age, income level, marital status, skin type, social factors, and substitute product with the brand preference.
Consumers are potential buyers of goods and services given for sale (Davis et al 2002). Buyers are rational and logical issue solver, (Holbrook and Hirschman, 1982). Buyer’s taste and preference changes every time. It is tough to find out the behavior of buyers.
III. RESEARCH METHODOLOGY Research Design: Descriptive
Sampling Population The population of the study is the customers of the beauty salons in Chennai specifically from
Green Trends Unisex Hair & Style Salon
Naturals Unisex Salon & Spa
Essensuals Hairdressing
Sampling Area The sample area of the study is limited to Chennai city within the branded beauty salons.
Sample Size A sample size of this study is 80. The respondents are selected irrespective of the age, gender, income, and qualification.
Sampling Design Sampling design used in the study is convenience sampling. The survey is randomly taken from various beauty salons in Chennai who walked in customers and membership customers.

International Journal of Advance and Innovative Research Volume 5, Issue 4 (XII): October - December, 2018
48
ISSN 2394 - 7780
METHODOLOGY OF THE STUDY The information required for this study obtained was basically from two sources.
Primary Data Primary Data has been gathered by a survey through a structured questionnaire.
The Data has been collected from 80 customers, through questionnaires, by using convenience sampling.
Secondary Data Secondary Data comprises information obtained from journals, magazines, books and many websites.
LIMITATIONS OF THE STUDY The sampling areas were restricted only to selected beauty salons in Chennai. i.e., the findings are regional
and do not represent the state or country.
Constraints hampered the study.
There may be respondent’s bias.
Even though utmost care has been taken in conducting the survey, the findings may sometimes differ from the population.
The sample size was restricted to 80 respondents.
IV. DATA ANALYSIS AND INTERPRETATION 4.1 Chi-Square Tests A significant difference between Occupation of the respondent and Respondent’s selection of particular branch of a beauty salon.

International Journal of Advance and Innovative Research Volume 5, Issue 4 (XII): October - December, 2018
49
ISSN 2394 - 7780
H01 (Null hypothesis) = There is no significant difference between Occupation of the respondent and Respondent’s selection of particular branch of a beauty salon.
H11 (Alternate hypothesis) = There is a significant difference between Occupation of the respondent and Respondent’s selection of particular branch of a beauty salon.
Degrees of Freedom (6-1) (4-1) =15
Difference at 5% level of Significance is 24.996
Calculated Value = 23.490
Calculated Value < Tabulated value. Therefore, H0 is accepted. There is no significant difference between Occupation of the respondent and Respondent’s selection of particular branch.
4.2 One Way Anova A significant difference between Respondents age and reason for coming back to the salon H02 (Null hypothesis) = There is no significant difference between Respondents age and reason for coming back to the salon
H12 (Alternate hypothesis) = There is a significant difference between Respondents age and reason for coming back to the salon.
Degrees of Freedom = (4,75)
Difference at 5% level of Significance is 2.49
Calculated Value = 0.906
Calculated value < Tabulated value
Therefore, H0 is accepted. There is no significant difference between Respondents age and reason for coming back to the salon.

International Journal of Advance and Innovative Research Volume 5, Issue 4 (XII): October - December, 2018
50
ISSN 2394 - 7780
V. FINDINGS, SUGGESTIONS AND CONLUSION 5.1 Findings From the study, it is found that 35% of the respondents belong to the age group of 18-28 years. 33% of the respondents belong to the age
group of 29-38 years. 21 % of the respondents belong to the age group to the age group of 39-48 years. 8% of the respondents belong to the age group of 49-58 years. 4% of the respondents belong to above the age group of 58.
42.5% of the respondents are Male respondents and 57.5% of the respondents are female respondents.
1.3% of the respondents have the qualification of higher secondary education.71.3% of the respondents have the qualification of Under graduate and 27.5% of the respondents have the qualification of postgraduate.
40% of the respondents are private employees, 30% of the respondents are students, 13.8% of the respondents are government employees, 8.8%of the respondents are self employed and 7.5% of the respondents are from the other categories.
52.5% of the respondents are having the relationship span with the salon for 1-3 Years. 30% of the respondents are coming to the salon for less than 1 year. 16.3% of the respondents are coming to the salon for 4-6 years.
86.3% of the respondents are visiting the salon once in a month. 8.8% of the respondents are visiting the salon once in two months. 5% of the respondents visit the salon fortnightly.
95% of the respondents do not visit the salon more than once. 5% of the respondents visit the salon more than once.
40% of the respondents take threading as their basic service for female.28.8% of the respondents take haircut as their basic service for male.
71.3% of the respondents are taking the services occasionally for special occasions. 21.3% of the respondents are taking the services occasional because lack of time. 7.5% of the respondents are taking the services occasional because of its need.
82.5% of the respondents are coming to the salon to be well groomed. 10% of the respondents are coming to the salon to look stylish.
87.5% of the respondents are not ready to try the new services. 12.5% of the respondents are ready to take new services in beauty salons.
90% of the respondents are not ready to experiment new services and 10% of the respondents are ready to experiment new services in beauty salons.
92.5% of the respondents are not ready to accept stylist suggestion for new services. 7.5% of the respondents are ready to accept stylist suggestion for new service.
43.8% o the respondents are accepted that friends are the greatest driving force to try new service. 6.3% of the respondents are ready to try new service by stylist suggestion.
36.3% of the respondents have tried Essensuals and Toni & Guy. 21.3% of the respondents have tried Naturals.
58.8% of the respondents are coming back to the salon because it is near to their residence. 23.8% of the respondents are coming back to salon for service quality.
43.8% of the respondents walked in randomly to the salon for the first time. 33.8% of the respondents are visited the salon for the first time by family and friends recommendation.
33.8% of the respondents have not tried Essensuals. 25% of the respondents have not tried Toni& Guy. 20% of the respondents are not tried YLG.
58.8% of the respondents are not tried new salons because of the high pricing of the salons. 41.3% of the respondents are not tried new salons because they are satisfied with the salon.
92.5% of the respondents are recommended the salon to their friends and family and 7.5% of the respondents are not recommended the salon to their friends and family.
45% of the respondents are suggested to change the price of the services.

International Journal of Advance and Innovative Research Volume 5, Issue 4 (XII): October - December, 2018
51
ISSN 2394 - 7780
5.2 SUGGESTIONS Green Trends has to concentrate on brand promotional development.
Services should be provided with high quality.
The stylist should be given be regular training in service and communication.
Ambience of the salon should be improved occasionally.
Marketing strategies should be revised according to salon locality.
Promotional activities should be done effectively.
New services updating should be done properly to reach the customers.
5.3 CONCLUSION The study was conducted successfully to understand the driving forces of a customer towards the branded beauty salons. This study helps to understand the customer preferences about the beauty salons. From this study, it is understood customers look for service quality, the ambience of the salon and the affordable pricing to the services. Competition in the market analyses and the strategies differ from another salon which is attracted to the customers. This study helped to understand the current opportunities in the market.
VI. REFERENCE Oliver, R. (1980). A cognitive model of the antecedent and consequences of satisfaction decisions. Journal
of Marketing Research, 460-9.
Fazio, R.H, Lenn, T.M & Effrein, E.A, (1984). Spontaneous attitude formation. Social Cognition. 2. 214-34.
Dodds, W. B., Monroe, K. B., & Grewal, D. (1991). Effects of price, brand, and store information on buyers’ product evaluations. Journal of Marketing Research, 28(August), 307-319
Atkins, K. (2000) Personal identity and the importance of one's own body: a response to Derek Parfit. International Journal of Philosophical Studies, 8(3), 329-349.
Brengman, M., Geuens, M., & Pelsmacker, P. E. (2001). The impact of consumer characteristics and campaign related factors on brand confusion in print advertising. Journal of Marketing Communications, 7, 231-243.
Zeithmal, V.A.., and Bitner,M.J. (2003), Service marketing: integrating customer focus across the firm. New York: McGraw Hill.
La, S., & Yi, Y. (2004). What influences the relationship between customer satisfaction and repurchase intention? Investigating the effects of adjusted expectations and customer loyalty. Psychology & Marketing , 351-73.
Sondoh Jr, S. L., Omar, M. W., Wahid, N. A., Ismail, I., & Harun, A. (2007). The effect of brand image on overall satisfaction and loyalty intention in the context of color cosmetic. Asian Academy of Management Journal, 12(1), 83-107
Hawkins, D & Mothersbaugh, D ( 2010). Consumer Behaviour. Building Marketing Strategy. Eleventh Edition. McGraw Hill Irwin
Biljana Angelova and Jusuf Zekiri, (2011), Measuring Customer Satisfaction with Service Quality Using American Customer Satisfaction Model (ACSI Model), International Journal of Academic Research in Business and Social Sciences, October 2011, Vol. 1, No. 3, Pp 232 – 258.
Apaolaza-Ibáñez, V., Hartmann, P., Diehl, S., & Terlutter, R. (2011). Women satisfaction with cosmetic brands: The role of dissatisfaction and hedonic brand benefits. African Journal of Business Management, 5(3), 792
Venkatesakumar, R., Ravindran,D. and A.Agasthiya.(2017).Differences in Evaluation of Trade Promotional Schemes -A Comparison of Self -Service Stores Vs Non-Self Service Stores, Asia Pacific Journal of Research,Vol 1,pp,1-5.
Ravindran,D and Venkatesakumar, R (2017).Retail Preference of Promotion in Cashless Economy-FMCG Products, Shanlax International Journal of Commerce, Vol 1,pp,457-462

International Journal of Advance and Innovative Research Volume 5, Issue 4 (XII): October - December, 2018
52
ISSN 2394 - 7780
Ravindran,D., A.Agasthiya. and Venkatesakumar, R. (2018), Evaluating The Store Characteristics in Selecting Trade Promotional Schemes, Shanlax International Journal of Management ,Vol 5, March 2018,pp,112-119.
Ravindran,D, A.Agasthiya and Venkatesakumar, R., (2018)Perceptual Differences in Selecting Trade Promotional Schemes Evaluation Between Retailers Family Background , in Vidyaniketan-Journal of Management Research ,Special Issue, UGC :62914, Sl.No.1, March 2018,pp,144-151

International Journal of Advance and Innovative Research Volume 5, Issue 4 (XII): October - December, 2018
53
ISSN 2394 - 7780
A STATISTICAL ANALYSIS OF ADULT MORTALITY SCENARIO OF RURAL NAGALAND
Seikh Faruk Ahmed Assistant Professor, Department of Statistics, Kohima Science College, Kohima, Nagaland
ABSTRACT Background: The study of health and survival of adults along with understanding the causes behind premature mortality are essential in any society as death during the most productive years of life leads to subsequent economic and psychological losses to the society and other living members of the family.
Objectives: To analyse adult mortality scenario by age, sex and causes in some rural areas of Kohima and Dimapur districts of Nagaland.
Methods and Materials: Data on 1396 deaths that occurred to the adult person of age 18 years and above during 2001-11 were collected from 30 churches (a non-conventional source) of rural areas of Kohima and Dimapur districts of Nagaland. We also used data on population from Electoral Roll, 2005 of Nagaland. Multiple decrement life table technique was used to find conditional probability of eventually dying of a person from a given cause.
Results: The overall death rate was 5.49 per 1000. The death rate for male (6.14 per 1000) was higher than female (4.89 per 1000). The leading causes of deaths were Cardiovascular Diseases (CVD) (22.5%) followed by Cancer (16.7%), Diseases of Liver (11.2%) and Accidents (10.2%). The maximum of accident related deaths (51.3%) occurred in the prime working age (20-49 years). The adult deaths due to diseases of liver were more for male (67.4%) than female (32.6%). After surviving to age 20 years (i) a female had higher chance (36%) than male (25%) of eventually dying of CVD, (ii) a male had higher chance (17%) than a female (13%) of eventually dying from cancer, (iii) a male had higher chance (10%) than a female (4%) of eventually dying from accidents, and (iv) a male had higher chance (7%) than a female (3%) of eventually dying of diseases of liver.
Keywords: Adult Mortality, Causes of Death, Death Rate, Rural Nagaland.
INTRODUCTION Mortality statistics can be helpful in the formulation of economic policies of a country covering overall performances as well as distributional concern regarding class, gender and race. As far as infant and child mortality in India are concerned, there has been much discussion with respect to class, gender, race and other background characteristics (NFHS-I, II & III; Bang et al., 2002; Arokiasamy, 2004; Claeson et al., 2008; Gupta, 1990). However, little attention has been paid to the different aspects of mortality among adults in India despite it being the most productive section of the society. Lack of research on adult mortality in India may be due to lack of good quality data and also insufficient use of the information that have already been collected without considering the quality (Saikia and Ram, 2010). The study of health and survival of adults along with understanding the factors behind the premature mortality are as important as that of the under five mortality especially when a country like India passes through the epidemiologic transition period. Adult mortality, in particular, deserves special attention in any society as death during the most productive years of life leads to subsequent economic and psychological losses to the other living members of the family and society.
The data on causes of death is extremely useful for planning of health programmes and for planning evidence based interventionist strategies in the country. In India, the office of Registrar General of India makes publication of annual bulletins containing data on causes of death for rural areas of India, but these data are of no use for cause specific data analysis for rural areas of Nagaland as medically certified cause of death (MCCD) information are supplied from urban areas only and not from the medical institutions in rural areas of Nagaland (ORG & CC of India, 2013).
Among the eight leading causes of deaths, the major contributing cause groups of deaths in Nagaland are Diseases of Circulatory System (17.3%) followed by Certain Infectious and Parasitic Diseases (15.9%), Diseases of Respiratory System (11.8%) and Injury, Poisoning and Certain Other Consequences of External Causes (8.9%) (ORG & CC of India, 2013). Since, no medical institutions of rural areas of Nagaland are covered under MCCD, therefore, this scenario represents the urban population only. Moreover, while collecting data from Nagaland in the Special Survey of Death 2004-2005 only 10 sampling units was included in the survey and all of them were taken from urban areas covering 5000 population (ORGI, 2009).
Under the above circumstances it was necessary to look for alternative non conventional sources of data and also to have a thorough academic study about the mortality scenario of adult people of the rural areas of Nagaland.

International Journal of Advance and Innovative Research Volume 5, Issue 4 (XII): October - December, 2018
54
ISSN 2394 - 7780
OBJECTIVES 1. To study the adult mortality pattern by age and sex in some rural areas of Kohima and Dimapur districts of
Nagaland.
2. To study the cause specific mortality of the adults in the said region.
3. To examine the comparative dominancy by various causes of deaths.
4. To obtain the cause-specific probability of deaths, conditional probability of eventually dying from a given cause and the probability of dying from a given cause conditional on dying in a given age interval.
MATERIALS AND METHODS (a) Data Christianity is the predominant religion of Nagaland. In the rural areas of Nagaland, 94.15 percent people were Christian (Census of India, 2001). Of the Christian people, every individual person is a member of a particular church in the rural areas of Nagaland.
Churches are institutional in character. They constitute a proper body to administer the churches. The churches play very important role in the registration system of deaths and marriages in Nagaland. Every death that occurs in a village is reported to the concerned church to which the person was a member and the Pastors record all the details about the age, sex, date of death, cause of death (if available). Church officials record the information regarding the causes of deaths as per the information supplied by the family members of the deceased. In many occasion, they verify the certificates provided by the medical officers, doctors, etc. Therefore, church records may be considered as an alternative valid source for data collection.
Death data were collected from non conventional sources which are the Church registers. The deaths that occurred to adult people during ten years period from 2001 to 2011 in some of the villages of Kohima and Dimapur districts were taken into consideration for the purpose of analysis. The person aged 18 years and above were considered here as adult. The legal and biological aspects of a man or woman have been taken into consideration for his/her adulthood.
We also used data on population from Electoral Roll, 2005 of Nagaland which was considered as the mid-period population to calculate the age specific death rates. We had taken the electoral roll of only those villages to which the selected churches from which we collected the death data were belonging.
We had collected death data from 30 churches belonging to different villages of Kohima and Dimapur districts of Nagaland. A total of 1396 deaths of which 752 were male and 644 were female occurred during 2001-2011 as per the records of those churches.
(b) Data Justification From the churches we collected the information regarding the total number of persons along with their sex under the church and we found that total number of persons (only church members) belonging to those selected 30 churches was 26280 of which 13064 and 13216 were male and female respectively. On the other hand, we found that the number of deaths occurred to those who were of less than 18 years old were only 36 out of the total 1432 deaths. That is, only 2.5 percent deaths occurred to the church members of aged less than 18 years old. Now, considering this percent as the percent of church members of age less than 18 years, we see that total number of persons of age 18 years and less is about 657 out of 26280 and hence the total number of persons (members) who were at risk of death aged 18 years and more (adult population), stands at 25623 in the selected 30 churches of which approximately12738 and 12885 were male and female.
From our voters lists of those polling areas where the selected churches were belonging we found that the total number of voters was 25410 of which 12242 and 13168 were male and female respectively. The difference of the total number of adult persons aged 18 years and above who were at risk of death between the Church members and the Voters list was 213 which constitute a variation of less than 1 percent. Hence, our mid-period (2005) population used from voters list to calculate age specific death rates is quite satisfactory.
(c) Methods We have disaggregated the death data by age and sex. Age-and-Sex specific death rates are obtained by using the following formula
/in xi
n x in x
D hM k
N

International Journal of Advance and Innovative Research Volume 5, Issue 4 (XII): October - December, 2018
55
ISSN 2394 - 7780
Where i denotes the sex which is either male ( )m or female ( )f .
The data on cause of death were obtained from a primary survey where the data on total number of deaths (i.e., 1396 deaths of which 752 male and 644 female) already collected from non conventional secondary source (i.e., from Churches) constituted the sampling frame for primary survey. The Yamane (1967) formula given below was used to obtain an appropriate sample
21 ( )NnN e
Where, n is the sample size, N is the population size and e is the level of precision. The level of precision, sometimes called sampling error, is the range in which the true value of the population is estimated to be. The sample consists 383 persons of which 206 were male and 177 were female was obtained by taking 5% sampling error (i.e., 95% confidence level).
To ascertain the causes of deaths, first we visited the household of the sampled deaths obtained by the formula mentioned above and then the near relatives of the deceased were interviewed about the causes of deaths or the symptoms of the causes of deaths. Next, the causes of deaths were identified by discussing the symptoms of deaths with a doctor from Nagaland government hospital.
Cause-of-Death Ratios: The cause-of-death ratio for the age group ,x x n attributable to causeC is given
by the formula ,,
,
n xn x
n x
Dr
D
, where ,n xD stands for the observed number of deaths at age
,x x n attributable to cause C and ,n xD denotes the total number of observed deaths at age ,x x n .
Distribution of Life Table Deaths by Cause-of-Deaths: The formula to distribute the life table deaths is given by , , ,n x n x n xd r d , Where ,n xd stands for the number of (life table) deaths at age ,x x n , attributable
to causeC ; ,n xd is the total number of (life table) deaths at age ,x x n ; and ,n xr stands for the observed
cause-of-death ratio for the cause C at age ,x x n .
Cause-Specific Probability of Dying: This probability may be defined by the formula ,,
n xn x
x
dp
l
Conditional Probability of eventually dying from a given Cause: Let us denote this probability by the
expression , ,1
x n xxx
p dl
Probability of Dying from a given Cause Conditional on Dying in a Given Age Interval: In general, if we define ,xl as the sum of all (life table) deaths from cause C that occur in the range ,x , that is,
, , , ....x n x n x nl d d
The summation being carried to the end of the life table, then
, ,x x a
x x a
l ll l
for 0a gives the probability that
a person who dies in the age range ,x x a dies of cause C (Namboodiri and Suchindran, 1987).
The life table deaths as well as the xl values are taken from the Life Tables of rural Nagaland 2001-05 for Male and Female prepared by Barman (2012).
RESULTS AND DISCUSSION The overall death rate was 5.49 per thousand for adults aged 18 years and above (Table-1). The death rate for male (6.14 per 1000) was higher than female (4.89 per 1000) of age 18 years and above. The death rates for males were higher than females in all 10 years age groups in some rural areas of Nagaland (Table-1 & Figure-1). The results were similar to some other findings. The age-specific probability of death for males were higher than females for ages 25 years and above in the rural areas of Himachal Pradesh (RGI, 2007(a)) which is also a
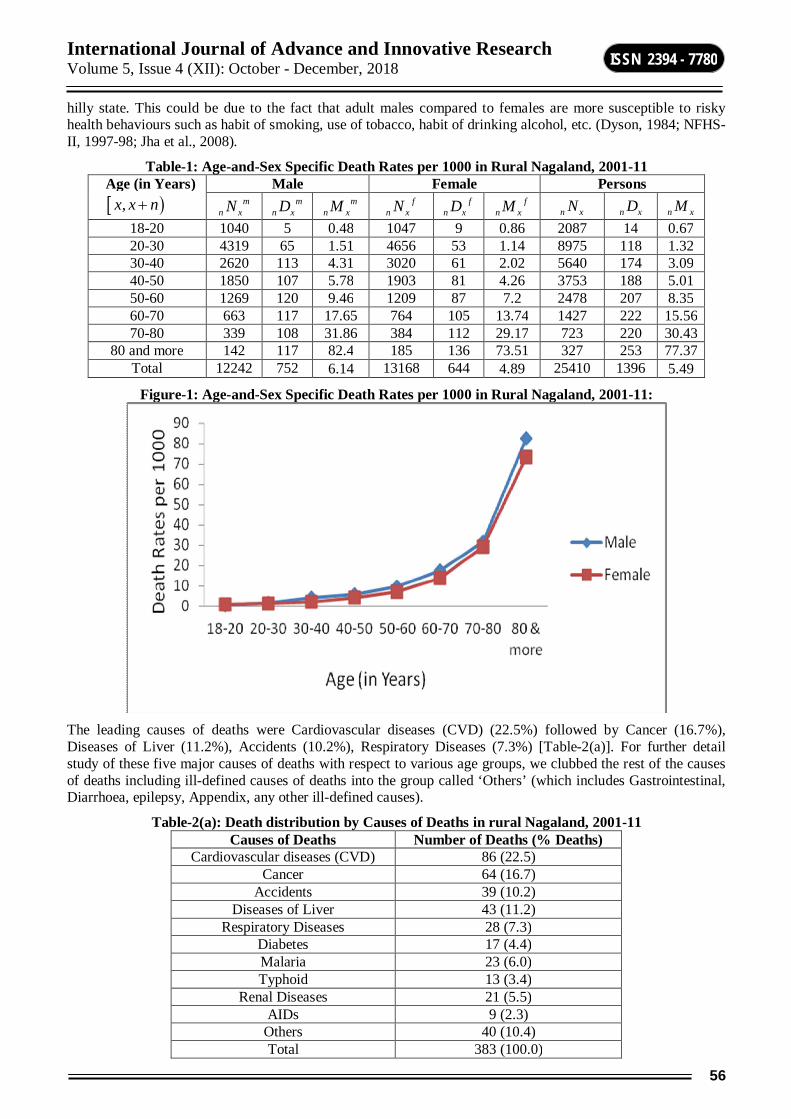
International Journal of Advance and Innovative Research Volume 5, Issue 4 (XII): October - December, 2018
56
ISSN 2394 - 7780
hilly state. This could be due to the fact that adult males compared to females are more susceptible to risky health behaviours such as habit of smoking, use of tobacco, habit of drinking alcohol, etc. (Dyson, 1984; NFHS-II, 1997-98; Jha et al., 2008).
Table-1: Age-and-Sex Specific Death Rates per 1000 in Rural Nagaland, 2001-11 Age (in Years) ,x x n
Male Female Persons m
n xN mn xD m
n xM fn xN f
n xD fn xM n xN n xD n xM
18-20 1040 5 0.48 1047 9 0.86 2087 14 0.67 20-30 4319 65 1.51 4656 53 1.14 8975 118 1.32 30-40 2620 113 4.31 3020 61 2.02 5640 174 3.09 40-50 1850 107 5.78 1903 81 4.26 3753 188 5.01 50-60 1269 120 9.46 1209 87 7.2 2478 207 8.35 60-70 663 117 17.65 764 105 13.74 1427 222 15.56 70-80 339 108 31.86 384 112 29.17 723 220 30.43
80 and more 142 117 82.4 185 136 73.51 327 253 77.37 Total 12242 752 6.14 13168 644 4.89 25410 1396 5.49
Figure-1: Age-and-Sex Specific Death Rates per 1000 in Rural Nagaland, 2001-11:
The leading causes of deaths were Cardiovascular diseases (CVD) (22.5%) followed by Cancer (16.7%), Diseases of Liver (11.2%), Accidents (10.2%), Respiratory Diseases (7.3%) [Table-2(a)]. For further detail study of these five major causes of deaths with respect to various age groups, we clubbed the rest of the causes of deaths including ill-defined causes of deaths into the group called ‘Others’ (which includes Gastrointestinal, Diarrhoea, epilepsy, Appendix, any other ill-defined causes).
Table-2(a): Death distribution by Causes of Deaths in rural Nagaland, 2001-11 Causes of Deaths Number of Deaths (% Deaths)
Cardiovascular diseases (CVD) 86 (22.5) Cancer 64 (16.7)
Accidents 39 (10.2) Diseases of Liver 43 (11.2)
Respiratory Diseases 28 (7.3) Diabetes 17 (4.4) Malaria 23 (6.0) Typhoid 13 (3.4)
Renal Diseases 21 (5.5) AIDs 9 (2.3)
Others 40 (10.4) Total 383 (100.0)

International Journal of Advance and Innovative Research Volume 5, Issue 4 (XII): October - December, 2018
57
ISSN 2394 - 7780
Table-2(b): Death distribution by Age and Cause of Deaths for All Persons: Age (in Years)
,x x n CVD Cancer Liver
Diseases Accidents Respiratory
Diseases Others Deaths from
all Causes
18-20 (Adolescents)
- - - 3 (7.7)
- 6 (4.9)
9 (2.3)
20-50 (Prime Working Age)
15 (17.4)
22 (34.4)
30 (69.7)
20 (51.3)
9 (32.1)
49 (39.4)
145 (37.9)
50-60 (Working Age)
18 (20.9)
19 (29.7)
6 (14.0)
5 (12.8)
4 (14.3)
9 (7.3)
61 (15.9)
60 & more (Old Age)
53 (61.6)
23 (35.9)
7 (16.3)
11 (28.2)
15 (53.6)
59 (48.0)
168 (43.9)
Total 86 (100)
64 (100)
43 (100)
39 (100)
28 (100)
123 (100)
383 (100)
Maximum of the cancer related deaths occurred to the old aged people (35.9%) [Table-2(b)]. Moreover, the probabilities of deaths due to cancer for male and female were increasing with age [Table-5(a) & 5(b)]. It has been observed that cancer is gradually emerging as one of the ten leading causes of death in India and is ominously advancing in rank year after year (Jussawala et al., 1982). Epidemiological studies carried out in India and abroad have shown that increased alcohol consumption is causally associated with cancers at various sites, mainly oral cavity, pharynx, larynx, oesophagus, colon, rectum and breast (Sankaranarayanan et al., 1989; Sankaranarayanan et al., 1990; Longnecker, 1994; Kearney et al., 1995). Habit of smoking and use of tobacco are identified as the major causes of cancer (Doll et al., 1994; Thun et al., 1995). Dietary habits contribute significantly to some types of cancer (Murthy and Mathew, 2004). Cancer is a preventable disease that requires major lifestyle changes such as smoking cessation, increased ingestion of fruits and vegetables, moderate use of alcohol, caloric restriction, exercise, avoidance of direct exposure to sunlight, minimal meat consumption, use of whole grains, use of vaccinations, and regular check-ups (Anand et al., 2008). We also observed that a male had higher chance (17%) than a female (13%) of eventually dying from cancer who has survived to age 20 years [Table-6(a) & 6(b)]. This could be because of the fact that the adult males compared to females are more susceptible to risky health behaviours such as habit of smoking, use of tobacco, habit of drinking alcohol, etc.
Table-3(a): Cause-of-Death Ratios: (Rural, Male) Nagaland, 2001-11 Age (in Years)
,x x n CVD Cancer Liver
Diseases Accidents Respiratory
Diseases Others Total
18-20 - - - 0.500 - 0.500 1.000 20-50 0.098 0.122 0.256 0.207 0.073 0.244 1.000 50-60 0.242 0.303 0.091 0.121 0.091 0.152 1.000
60 & more 0.253 0.161 0.057 0.092 0.092 0.345 1.000 18 years & more 0.185 0.165 0.141 0.151 0.083 0.277 1.000
Table-3(b): Cause-of-Death Ratios: (Rural, Female) Nagaland, 2001-11 Age (in Years) CVD Cancer Liver Diseases Accidents Respiratory
Diseases Others Total
18-20 - - - 0.200 - 0.80 1.000 20-50 0.111 0.191 0.143 0.048 0.048 0.460 1.000 50-60 0.357 0.321 0.107 0.036 0.036 0.143 1.000
60 & more 0.383 0.111 0.025 0.037 0.086 0.358 1.000 18 years & more 0.271 0.169 0.079 0.045 0.062 0.373 1.000
The highest percentage of deaths due to CVD (61.1%) occurred to the old aged people [Table-2(b)]. The probabilities of deaths due to CVD were increasing with age [Table-5(a) & 5(b)]. Tobacco smoking, physical inactivity, overweight may be some of the major factors for death due to cardiovascular diseases (Choudhury and Rajbongshi, 2006). To find the cause specific probabilities, we first obtained the age and sex specific life table deaths which are given in Table-4(a) and 4(b).

International Journal of Advance and Innovative Research Volume 5, Issue 4 (XII): October - December, 2018
58
ISSN 2394 - 7780
Table-4(a): Distribution of Life Table Deaths: (Rural, Male) Nagaland, 2001-05 Age (in Years)
,x x n ,n xd Number of life table deaths due to
CVD Cancer Liver Diseases
Accidents Respiratory Diseases
Others
20-50 5188 508 633 1328 1074 379 1266 50-60 8397 2032 2771 764 1016 764 1050
60 & more 77880 19704 12539 4439 7165 7165 26868
Table-4(b): Distribution of Life Table Deaths: (Rural, Female) Nagaland, 2001-05 Age (in Years)
,x x n ,n xd Number of life table deaths due to
CVD Cancer Liver Diseases
Accidents Respiratory Diseases
Others
20-50 4791 532 915 685 230 230 2199 50-60 6787 2423 2179 726 244 244 971
60 & more 78213 29956 8682 1955 2893 6726 28001
Of the accident related deaths, the maximum deaths (51.3%) occurred in the prime working age group [Table-3(b)]. This may happen possibly due to the increase in number of vehicles in Kohima and Dimapur districts during the last decade. Irresponsible and careless driving by some people, especially the younger generation, even sometime under alcohol consumption, lead to many fatal accidents (Choudhury and Rajbongshi, 2006). Moreover, from Table-5(a) and Table-5(b), it is seen that the probability of death due to accidents in the prime working age was more for male (0.0117) compared to female (0.0027). The higher mortality rate for adults might be there because of the fact that many deaths of the young people, especially the male in the prime working age, took place here in Nagaland due to infighting among the factions of armed nationalist movement groups during the last decade.
Table-5(a): Cause-Specific probabilities of deaths: (Rural, Male) Nagaland, 2001-05 Age (in Years)
,x x n xl Probability of dying from
CVD Cancer Liver Diseases
Accidents Respiratory Diseases
Others
20-50 91464 0.00556 0.00692 0.01452 0.01174 0.00414 0.01384 50-60 86277 0.02355 0.03212 0.00886 0.01178 0.00886 0.01218
60 & more 77880 0.25301 0.16100 0.05700 0.09200 0.09200 0.34500
Table-5(b): Cause-specific probabilities of deaths: (Rural, Female) Nagaland, 2001-05 Age (in Years)
,x x n xl Probability of dying from
CVD Cancer Liver Diseases
Accidents Respiratory Diseases
Others
20-50 89791 0.00593 0.01019 0.00763 0.00256 0.00256 0.02449 50-60 84999 0.35701 0.32106 0.10700 0.03595 0.03595 0.14307
60 & more 78213 0.38301 0.11101 0.02500 0.03700 0.08600 0.35801
It is seen that for male the diseases of liver was most dominant followed by Accidents in the prime working age and Cancer and CVD were respectively most dominant in the working age group and old age group [Table-3(a)]. It is observed that in the prime working age the most likely cause of death for male was diseases of liver [Table-7(a)] but the chances of deaths due to diseases of liver for male was decreasing with age [Table-5(a)]. It is also seen that the adult deaths due to diseases of liver was more for male (67.4%) than female (32.6%) [Table-2(c)]. This could be because of the fact that males are more habituated to drink alcohol predominantly in the young ages compared to old ages than female in rural areas of Nagaland. Moreover, a male had higher risk (10%) than a female (4%) of eventually dying from accidents who has survived to age 20 years [Table-6(a) & 6(b)]. Moreover, the probability that a man dye of accidents given that he dies in the prime age group (i.e., 20-49 years) are more (21.8%) than that of a woman (4.8%) [Table-7(a) & 7(b)]. The reason of male predominance could probably be due to the social structure of the Indian society as most of the outside work usually carried out by males and tendency of males not following the traffic rules and regulations.

International Journal of Advance and Innovative Research Volume 5, Issue 4 (XII): October - December, 2018
59
ISSN 2394 - 7780
Table-6(a): Conditional Probabilities of Eventually dying from specified causes for those alive at age x : (Rural, Male) Nagaland, 2001-05
Age (in Years) ,x x n
xl Probability of dying from CVD Cancer Liver
Diseases Accidents Respiratory
Diseases Others
20-50 91464 0.2432 0.1743 0.0714 0.1012 0.0908 0.3191 50-60 86277 0.2519 0.1775 0.0603 0.0948 0.0919 0.3236
60 & more 77880 0.2530 0.1610 0.0570 0.0920 0.0920 0.3450
Table-6(b): Conditional Probabilities of Eventually dying from specified causes for those alive at age x : (Rural, Female) Nagaland, 2001-05
Age (in Years) ,x x n
xl Probability of dying from CVD Cancer Liver
Diseases Accidents Respiratory
Diseases Others
20-50 89791 0.36653 0.13115 0.03749 0.03750 0.08019 0.34715 50-60 84999 0.38093 0.12778 0.03154 0.03691 0.08201 0.34085
60 & more 78213 0.38301 0.11101 0.02500 0.03700 0.08600 0.35801 Table-7(a): Probability of dying from a given cause conditional on dying in a given age interval: (Rural,
Male) Nagaland, 2001-05 Age (in Years)
,x x n xl CVD Cancer Liver
Diseases Accidents Respiratory
Diseases Others
20-50 91464 0.0985 0.1211 0.2560 0.2176 0.0725 0.2443 50-60 86277 0.2418 0.3305 0.0909 0.1208 0.0909 0.1251
60 & more 77880
Table-7(b): Probability of dying from a given cause conditional on dying in a given age interval: (Rural, Female) Nagaland, 2001-05
Age (in Years) ,x x n
xl CVD Cancer Liver Diseases
Accidents Respiratory Diseases
Others
20-50 89791 0.1110 0.1909 0.1429 0.0480 0.0480 0.4590 50-60 84999 0.3570 0.3211 0.1070 0.0360 0.0360 0.1431
60 & more 78213
For female, the CVD was most dominant followed by cancer in the working age group [Table-3(b)]. The same scenario was depicted in Table-7(b). From this table, it is found that CVD was the most likely cause of death for female in the working age group. Moreover, the chances of deaths due to CVD for female were increasing with age [Table-5(b)]. We also observed that a female had higher chance (36.6%) than a male (24.3%) of eventually dying from CVD who has survived to age 20 years [Table-6(a) & 6(b)]. Similar situations prevail in the later ages also. This shows that cardiovascular (CVD) disease was a most important cause of death of the adult women in rural areas of Nagaland. It has been estimated that in case of rural men and women in India, on comparing percentage prevalence across age groups from 2000-2015, the trend was anticipated to be static in the 20-29 years age group wherein more number of females will suffer from cardiovascular diseases at a later age compared to men (Chauhan and Aeri, 2013). The trend for higher prevalence of cardiovascular diseases among women may be attributed to changing lifestyle such as increased use of oral contraceptives, increased instances of smoking and drinking- two habits that are horrible for cardiovascular health.
LIMITATIONS The data set on causes of death analysis was very small (383 deaths) obtained by Yamene method. More data on causes of deaths may influence the results of this study. Nevertheless, we sincerely hope that this would give a fairly good idea of the picture of causes of death in rural Nagaland.
REFERENCES Anand, P., Kunnumakara, A.B., Sundaram, C., Harikumar, K.B., Tharakan, S.T., Lai,O.S., Sung, B., and
Aggarwal, B.B., (2008), ‘Cancer is a Preventable Disease that Requires Major Lifestyle Changes’, Pharmaceutical Research, 25(9): 2097-2116
Arokiasamy, P., (2004), ‘Regional patterns of sex bias and excess female child mortality in India’, Population, 59(6):831-863.

International Journal of Advance and Innovative Research Volume 5, Issue 4 (XII): October - December, 2018
60
ISSN 2394 - 7780
Bang, A., Reddy, M.H., and Deshmukh, M.D., (2002), ‘Child mortality in Maharashtra’ Economic and Political Weekly, 37(49): 4947-4965.
Barman, P., (2012), ‘Some aspects of health scenario in Nagaland with special reference to its urban set up – A statistical analysis’, a unpublished thesis, Department of Statistics, Gauhati University, Assam, India
Census of India, (2001), ‘Office of the Registrar General of India’, New Delhi
Chauhan, S. and Aeri, B.T., (2013), ‘Prevalence of Cardiovascular disease in India and It’s economic impact – A review’, International Journal of Scientific and Research Publications, 3(10):1-5
Choudhury, L., and Rajbongshi, R., (2006), ‘A Study of Cause Specific Mortality for Persons at Ages 40 Years and Above in Guwahati City: 1991 and 2001’, Demography India, 35(2):319-336.
Claeson, M., Boss, E. R., Mawji, T., Pathmanathan , I., (2000), ‘Reducing Child Mortality in India in the Millennium’, Bulletin of the World Health Organization; 78(10):1192-1199
Gupta, M., D., (1990), ‘Death Clustering, Mothers education and the determinants of child mortality in rural Punjab’, India, Population Studies, 44(3): 489-505.
Doll, R., Peto, R., Wheatley K, Gray R and Sutherland I., (1994), ‘Mortality in relation to smoking: 40 years’ observations on male British doctors’, BMJ, 309(6959):901-911
Dyson, T., (1984), ‘Excess Male Mortality in India’, Economic and Political Weekly, 19(10): 422-26
Electoral Roll, 2005, S-17, Nagaland, Election Commission of India
Jha, P., Jacob, B., Gajalakshmi, V., Gupta, P.C., Dhingra, N., Kumar, R., Sinha, D.N., Dikshit, R.P., Parida, D.K., Kamadod, R., Borharm, J. and Peto, R., (2008), ‘A nationally representative case – control study of smoking and death in India’, The New Eng J of Med, 358:1137-47
Jussawala, D.J., Yeole, B.B. and Natekar, M.V., (1982), ‘An Assessment of Cancer Mortality in Greater Bombay’, The Indian Journal of Medical Research, 75:68-82
Kearney, J., Giovannucci, E., Rimm, E., Stampfer, M.J., Colditz, G.A., Ascherio, A., Bleday, R., Willett, W.C., (1995), ‘Diet, alcohol, and smoking and the occurrence of hyperplastic polyps of the colon and rectum (United States)’, Cancer Causes Control, 6(1):45–56
Longnecker, M.P., (1994), ‘Alcohol beverages consumption in relation to risk of breast cancer: Meta-analysis and review’, Cancer Causes Control, 5(1): 73-82
Murthy, N.S., and Mathew, A., (2004), ‘Cancer epidemiology, prevention and control’, Current Science, 86(4):518-527
Namboodiri, K., and Suchindran, C.M., (1987), ‘Life Table Techniques and Their Applications’, Academic Press, INC, Orlando San Diego, New York
National Family Health Survey (NFHS-I, 1992-1993; NFHS-II, 1998-1999; NFHS-III, 2005-2006), India, International Institute for Population Sciences-Mumbai, India. Available at http://www.nfhsindia.org
Office of the Registrar General of India (ORGI), (2009), ‘Report on Causes of Death in India 2001-2003 based on Special Survey of Death conducted in 2004-2005’, Chapter-1, Statement-1, page no.2
Office of the Registrar General and Census Commissioner of India (ORG & CC of India), (2013), ‘Report on Medical Certification of Causes of Deaths 2008’, Chapter- II & III, Statement- 2.3 & 3.6, page nos. 10 & 26.
Registrar General of India (RGI), (2007(a)), SRS Based Abridged Life Tables, 2000-2004, mSRS Analytical Studies, Report No. 1 of 2007, Office of the Registrar General of India, Ministry of Home Affairs, New Delhi.
Saikia, N. and Ram, F., (2010), ‘Determinants of adult mortality in India’, Asian population Studies, 6(2):153-171
Sankaranarayanan, R., Duffy, R., Day, N.E., et al., (1989), ‘A case control investigation of cancer of the oral tongue and floor of the mouth in southern India’, Int J Cancer, 44(4): 617-621

International Journal of Advance and Innovative Research Volume 5, Issue 4 (XII): October - December, 2018
61
ISSN 2394 - 7780
Sankaranarayanan, R., Duffy, S.W., Padmakumary, G., et al., (1990), ‘Risk factors for cancer of the buccal and labial mucosa in Kerala, Southern India’, J Epidemiol Community Health, 44: 286-92
Thun M.J., Day-Lally C.A., Calle E.E., Flanders W.D. and Health Jr. C.W., (1995), ‘Excess mortality among cigarette smokers: Changes in a 20-year interval’, American Journal of Public Health, 85(9):1223-1230
Yamane, T., (1967), ‘Statistics, An Introductory Analysis’, 2nd ed., New York

International Journal of Advance and Innovative Research Volume 5, Issue 4 (XII): October - December, 2018
62
ISSN 2394 - 7780
SWARM INTELLIGENCE: OVERVIEW AND APPLICATIONS
Shipra1, Priyanka2 and Neetika3 Assistant Professor1,2,Department of Applied Science, Punjabi University, Bathinda, Punjab
Assistant Professor3, Department of Computer Science, Punjabi University, Bathinda, Punjab
ABSTRACT Swarm Intelligence (SI) is a relatively new branch of Artificial Intelligence that is used to model the collective behaviour of social swarms in nature such as ant colonies, honey bees and bird flocks. Swarm-based algorithms are able of producing low cost, fast, and healthy solutions to several complex real life problems. This paper discusses the two most popular swarm intelligence algorithms inspired by natural swarms, namely, artificial ant colony optimization and particle swarm optimization .Further, Successful applications of these SI models have also been discussed.
INTRODUCTION In recent years, swarm intelligence becomes more and more attractive for the researchers. It is one of the branches in evolutionary computing. Swarm-based optimization algorithms (SOAs) mimic nature’s methods to drive a search towards the optimal solution.The algorithms in swarm intelligence are often applied to solve problems of optimization. Several algorithms for optimization issues related to swarm intelligence are proposed one after another. SOAs include Evolutionary Algorithms [1], the Ant Colony Optimization (ACO) [2], the Particle Swarm Optimization (PSO) [3], Artificial Bee Colony (ABC) Optimization [4,5].In 1989, the expression"Swarm Intelligence" was first introduced by G. Beni and J. Wang in the global optimization framework as a set of algorithms for controlling robotic swarm [6]. In 1991, Ant Colony Optimization (ACO) [7] [8] [9] was introduced by M. Dorigo and colleagues as a novel nature-inspired metaheuristic for the solution of hard combinatorial optimization (CO) problems. In 1995, particle swarm optimization was introduced by J. Kennedy et al. [10,11]. By the late-90s, these two most popular swarm intelligence algorithms started go beyond a pure scientific interest and to enter the realm of real-world applications. Exactly in 2005, Artificial Colony Algorithm was proposed by D. Karabago as a new member of the family of intelligence algorithms [12,13]. Swarm Intelligence principles have been successfully applied in a variety of problem domains including function optimization problems, finding optimal routes, scheduling, structural optimization, and image and data analysis [14,15]. Computational modeling of swarms has been further applied to a wide-range of diverse domains, including machine learning [16], bioinformatics and medical informatics [17], dynamical systems and operations research [18], they have been even applied in finance and business [19].
The present study is an overview of three swarm systems (Ant Colony Optimization, Particle Swarm Optimization (PSO) and Honey-Bee optimization(HBO)). A summary of the wide-range applications of swarm intelligence algorithms is also presented in many different problem domains.
SWARM INTELLIGENCE (SI) A swarm is a large number of homogenous agents interacting among themselves and their environment. Swarm-based algorithms have recently emerged as a nature-inspired, population-based algorithms that are capable of producing low cost, fast, and healthy solutions to several complex problems [20,21]. These agents (insects or swarm individuals) are relatively simple with limited abilities on their own and interact together with certain behavioral patterns to achieve tasks cooperatively necessary for their survival. In the past decades numerous scientists and biologists have been studying the behaviours of social insects because of incredible effectiveness of these natural swarm systems. The expression "Swarm Intelligence" was first introduced in 1989 by G. Beni and J. Wang in the global optimization framework as a set of algorithms for controlling robotic swarm [6]. Swarm intelligence can be defined as the measure, which introduces the collective behavior of social insect colonies, other animal societies, or the relationship description of unsophisticated agents interacting with their environment, to design algorithms or distributed problem-solving devices. The aim of swarm intelligence is to design of intelligent multi-agent systems by taking motivation from the collective behavior of social insects such as ants, bees, wasps, termites and other animal societies such as flocks of birds or fish schools etc.By collecting the characteristics swarm intelligence are proposed one after another .To date, several swarm intelligence models based on different natural swarm systems have been proposed in the literature, and successfully applied in many real-life applications
ANT BASED OPTIMIZATION ALGORITHMS The first model of a successful swarm intelligence model is Ant System (AS), which was introduced by M. Dorigo et al. [7-9]. This model was successfully used to solve many discrete optimization problems in the late
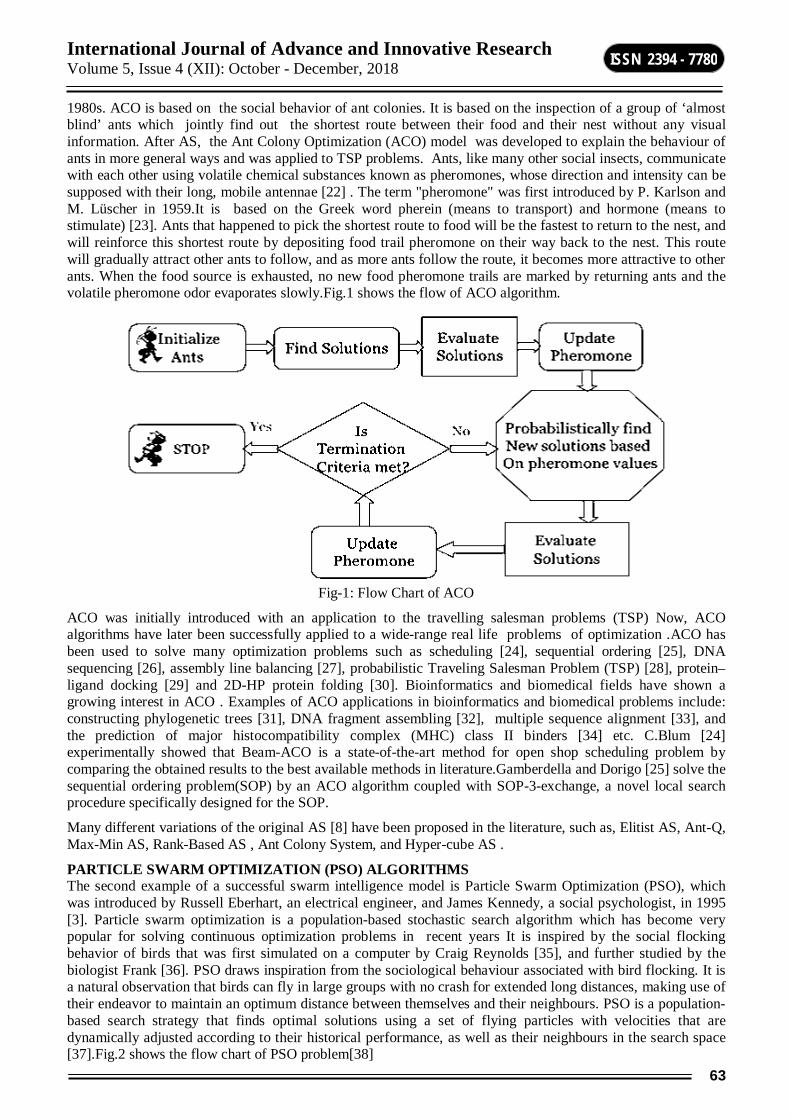
International Journal of Advance and Innovative Research Volume 5, Issue 4 (XII): October - December, 2018
63
ISSN 2394 - 7780
1980s. ACO is based on the social behavior of ant colonies. It is based on the inspection of a group of ‘almost blind’ ants which jointly find out the shortest route between their food and their nest without any visual information. After AS, the Ant Colony Optimization (ACO) model was developed to explain the behaviour of ants in more general ways and was applied to TSP problems. Ants, like many other social insects, communicate with each other using volatile chemical substances known as pheromones, whose direction and intensity can be supposed with their long, mobile antennae [22] . The term "pheromone" was first introduced by P. Karlson and M. Lüscher in 1959.It is based on the Greek word pherein (means to transport) and hormone (means to stimulate) [23]. Ants that happened to pick the shortest route to food will be the fastest to return to the nest, and will reinforce this shortest route by depositing food trail pheromone on their way back to the nest. This route will gradually attract other ants to follow, and as more ants follow the route, it becomes more attractive to other ants. When the food source is exhausted, no new food pheromone trails are marked by returning ants and the volatile pheromone odor evaporates slowly.Fig.1 shows the flow of ACO algorithm.
Fig-1: Flow Chart of ACO
ACO was initially introduced with an application to the travelling salesman problems (TSP) Now, ACO algorithms have later been successfully applied to a wide-range real life problems of optimization .ACO has been used to solve many optimization problems such as scheduling [24], sequential ordering [25], DNA sequencing [26], assembly line balancing [27], probabilistic Traveling Salesman Problem (TSP) [28], protein–ligand docking [29] and 2D-HP protein folding [30]. Bioinformatics and biomedical fields have shown a growing interest in ACO . Examples of ACO applications in bioinformatics and biomedical problems include: constructing phylogenetic trees [31], DNA fragment assembling [32], multiple sequence alignment [33], and the prediction of major histocompatibility complex (MHC) class II binders [34] etc. C.Blum [24] experimentally showed that Beam-ACO is a state-of-the-art method for open shop scheduling problem by comparing the obtained results to the best available methods in literature.Gamberdella and Dorigo [25] solve the sequential ordering problem(SOP) by an ACO algorithm coupled with SOP-3-exchange, a novel local search procedure specifically designed for the SOP.
Many different variations of the original AS [8] have been proposed in the literature, such as, Elitist AS, Ant-Q, Max-Min AS, Rank-Based AS , Ant Colony System, and Hyper-cube AS .
PARTICLE SWARM OPTIMIZATION (PSO) ALGORITHMS The second example of a successful swarm intelligence model is Particle Swarm Optimization (PSO), which was introduced by Russell Eberhart, an electrical engineer, and James Kennedy, a social psychologist, in 1995 [3]. Particle swarm optimization is a population-based stochastic search algorithm which has become very popular for solving continuous optimization problems in recent years It is inspired by the social flocking behavior of birds that was first simulated on a computer by Craig Reynolds [35], and further studied by the biologist Frank [36]. PSO draws inspiration from the sociological behaviour associated with bird flocking. It is a natural observation that birds can fly in large groups with no crash for extended long distances, making use of their endeavor to maintain an optimum distance between themselves and their neighbours. PSO is a population-based search strategy that finds optimal solutions using a set of flying particles with velocities that are dynamically adjusted according to their historical performance, as well as their neighbours in the search space [37].Fig.2 shows the flow chart of PSO problem[38]

International Journal of Advance and Innovative Research Volume 5, Issue 4 (XII): October - December, 2018
64
ISSN 2394 - 7780
PSO was originally used to solve non-linear continuous optimization problems, but it has been used in many practical, real-life application problems recently. For example, PSO has been successfully applied to track dynamic systems [39], analyze human tremor [40], register 3D-to-3D biomedical image [41], control reactive power and voltage [42], even learning to play games [43] and music composition [44]. The first practical application of PSO was in the field of neural networks, in 1995, when PSO was able to train and adjust the weights of a feed-forward multilayer perceptron neural network as effectively as the conventional error back-propagation approach [3]. Since then, a nearly-exponential growing number of PSO applications have been explored in several domains due to their simplicity, efficiency and fast-convergence nature.
Originaliy PSO was designed to optimize real-value continuous problems, but the PSO algorithm has also been extended to optimize binary or discrete problems [45-47]. Several different variations and extensions to the original PSO have been proposed in the literature, such as Constriction Coefficient/Canonical PSO ,Dissipative PSO, Fully-informed PSO, Stretching PSO, Gaussian PSO, PSO with Mutation, Species-based PSO, Self-organizing Hierarchical PSO ,Cooperative PSO and Comprehensive Learning PSO etc. PSO algorithms have been efficiently applied in many bioinformatics problems. The review report in [48] has surveyed more than 25 different applications in bioinformatics, biomedical and pharmaceutical problems. Applications include: human tremor analysis for the diagnosis of Parkinson’s disease [49], inference of gene regulatory networks [50], human movement biomechanics optimization [51], phylogenetic tree reconstruction [52], cancer classification [53], cancer survival prediction [54]etc.
COMPARISON OF ACO AND PSO The ACO is encouraged by the behaviors of ants . The indirect communication between the ants enables them to find short paths between their nest and food sources. This behavior of real ant colonies is exploited in ACO algorithm to solve discrete optimization problems. The PSO technique is inspired by the social behaviors of animals or insects. PCO is a robust and efficient technique for solving difficult robust and population based stochastic optimization problems. Both the ACO and PSO techniques are the data clustering algorithms by appling swarm behavior. The ACO technique is more appropriate for problems where source and destination are predefined. At the same time PSO is a clustering algorithm in the areas of multiobjective, dynamic optimization and constraint handling. The ACO is more appropriate for problems that requires crisps results and PSO is appropriate for problems that are fuzzy is nature.
CONCLUSION Nature is a rich source of inspiration and we can learn much from it. We can take advantage of the social collective behaviour of swarms to solve our real-life problems by observing them. SI-based optimization techniques are far-reaching in many domains, and have a
wide-range of successful applications on different areas.The massive number and scope of successful applications fall under a broad domain of research areas, ranging from optimization problems to computational intelligence applications, from electrical and electromagnetic applications to signal processing and graphics, from image analysis and robotics to bioinformatics and medical applications.

International Journal of Advance and Innovative Research Volume 5, Issue 4 (XII): October - December, 2018
65
ISSN 2394 - 7780
REFERENCES 1. Back T. Evolutionary Algorithms in Theory and Practice: Evolution Strategies, Evolutionary
Programming, Genetic Algorithms. Oxford University Press on Demand; New York, NY, USA: 1996. 2. M. Dorigo, Optimization, learning and natural algorithms (in Italian), Ph.D. Thesis, Dipartimento
diElettronica, Politecnico di Milano, Italy, 1992. 3. Kennedy J., Eberhart R. Particle Swarm Optimization; Proceedings of the IEEE International Conference
on Neural Networks; Perth, Australia. 27 November–1 December 1995; pp. 1942–1948. 4. Tsai P.-W., Pan J.-S., Liao B.-Y., Chu S.-C. Enhanced artificial bee colony optimization. Int. J. Innovative
Comput. Inf. Control. 2009;5:5081–5092. 5. Tsai P.-W., Khan M.K., Pan J.-S., Liao B.-Y. Interactive artificial bee colony supported passive continuous
authentication system. IEEE Syst. J. 2012 doi: 10.1109/JSYST.2012.2208153. [Cross Ref]. 6. G. Beni and J. Wang, Swarm intelligence in cellular robotic systems. In NATO Advanced Workshop on
Robots and Biological Systems, Il Ciocco, Tuscany, Italy, 1989. 7. M. Dorigo, V. Maniezzo, and A. Colorni, Positive feedback as a search strategy, Tech. Report 91-016,
Dipartimento di Elettronica, Politecnico di Milano, Italy, 1991. 8. A. Colorni, M. Dorigo, V. Maniezzo, and M. Trubian. Ant System for Job-shop Scheduling. Belgian
Journal of Operations Research, Statistics and Computer Science, 34(1):39-53, 1994. 9. Dorigo, M., and Di Caro, G. (1999). The ant colony optimization metaheuristic. New Ideas in
Optimization, pp. 11-32. 10. J. Kennedy and R. C. Eberhart. Particle Swarm Optimization. In Proceedings of IEEE International
Conference on Neural Networks, Perth, Australia, pp. 1942– 1948, 1995. 11. R. C. Eberhart and J. Kennedy. A new optimizer using particle swarm theory. In Proceedings of the Sixth
International Symposium on Micro Machine and Human Science, Nagoya, Japan, pp. 39–43, 1995. 12. D. Karaboga, An Idea Based On Honey Bee Swarm for Numerical Optimization, Technical Report-
TR06,Erciyes University, Engineering Faculty, Computer Engineering Department, 2005. 13. D. Karaboga and B. Basturk, A Powerful And Efficient Algorithm For Numerical Function Optimization:
Artificial Bee Colony (ABC) Algorithm, Journal of Global Optimization, Springer Netherlands, Vol. 39, No. 3, pp: 459- 471, 2007.
14. A. P. Engelbrecht (ed.), Computational Intelligence: An Introduction. John Wiley & Sons, England, 2002. 15. C. P. Lim, L. C. Jain, and S. Dehuri, Innovations in Swarm Intelligence: Studies in Computational
Intelligence, Vol. 248, Springer, 2009. 16. S. Das, B. K. Panigrahi, and S. S. Pattnaik, Nature-Inspired Algorithms for Multi-objective Optimization,
Handbook of Research on Machine Learning Applications and Trends: Algorithms Methods and Techniques, Hershey, New York, Vol. 1, pp. 95–108, 2009.
17. S. Das, A. Abraham, and A. Konar, Swarm Intelligence Algorithms in Bioinformatics, Studies in Computational Intelligence. Vol. 94, pp. 113–147, 2008.
18. K. E. Parsopoulos and M N. Vrahatis, Particle Swarm Optimization and Intelligence: Advances and Applications, Information Science Reference, Hershey, Pennsylvania, 2010.
19. E. Bonabeau, C. Meyer, Swarm Intelligence: A Whole New Way to Think About Business, Harvard Business Review, Vol.79, No.5, pp. 106-114, 2001.
20. B. K. Panigrahi, Y. Shi, and M.-H. Lim (eds.): Handbook of Swarm Intelligence. Series: Adaptation, Learning, and Optimization, Vol 7, Springer-Verlag Berlin Heidelberg, 2011. ISBN 978-3-642-17389-9.
21. C. Blum and D. Merkle (eds.). Swarm Intelligence – Introduction and Applications. Natural Computing. Springer, Berlin, 2008.
22. D. E. Jackson, F. L. Ratnieks, Communication in ants, Current Biology, Vol. 16, No. 15, pp. R570–R574, 2006.
23. P. Karlson and M. Lüscher, Pheromones: a new term for a class of biologically active substances. Nature, Vol. 183, pp. 55–56, 1959.

International Journal of Advance and Innovative Research Volume 5, Issue 4 (XII): October - December, 2018
66
ISSN 2394 - 7780
24. C. Blum, Beam-ACO—Hybridizing ant colony optimization with beam search: An application to open shop scheduling, Comput. Oper. Res., Vol. 32, No. 6, pp. 1565–1591, 2005.
25. L. M. Gambardella, M. Dorigo, Ant colony system hybridized with a new local search for the sequential ordering problem. INFORMS J. Comput, Vol. 12, No. 3, pp. 237–255, 2000.
26. C. Blum, M. Yabar, and M. J. Blesa, An ant colony optimization algorithm for DNA sequencing by hybridization. Comput. Oper. Res. Vol. 35, No. 11, pp. 3620–3635, 2008.
27. C. Blum, Beam-ACO for simple assembly line balancing. INFORMS J. Comput. Vol. 20, No. 4, pp. 618–627, 2008.
28. P. Balaprakash, M. Birattari, T. Stützle, Z. Yuan, and M. Dorigo, Estimationbased ant colony optimization algorithms for the probabilistic travelling salesman problem. Swarm Intell., 3(3), 223–242, 2009.
29. O. Korb, T. Stützle, and T. E. Exner, An ant colony optimization approach to flexible protein ligand docking. Swarm Intelli. Vol. 1, No. 2, pp. 115–134, 2007.
30. A. Shmygelska and H. H. Hoos, An ant colony optimisation algorithm for the 2D and 3D hydrophobic polar protein folding problem. BMC Bioinformat. Vol. 6, No. 30, 2005.
31. M. Perretto and H. S. Lopes, Reconstruction of phylogenetic trees using the ant colony optimization paradigm, Genetic and Molecular Research, Vol. 4, No. 3, pp. 581–589, 2005.
32. P. Meksangsouy and N. Chaiyaratana, DNA fragment assembly using an ant colony system algorithm, in Proc. of Congress on Evolutionary Computation, IEEE Press, USA, 2003.
33. J. D. Moss and C. G. Johnson, An ant colony algorithm for multiple sequence alignment in bioinformatics, In D. W. Pearson, N. C. Steele, and R. F. Albrecht, (eds.), Artificial Neural Networks and Genetic Algorithms, pp. 182–186. Springer, Berlin, Germany, 2003.
34. O. Karpenko, J. Shi, and Y. Dai, Prediction of MHC class II binders using the ant colony search strategy, Artificial Intelligence in Medicine, Vol. 35, No. 1-2, pp. 147–156, 2005.
35. C. W. Reynolds, Flocks, herds, and schools: a distributed behavioural model, Computer Graphics (ACM SIGGRAPH ‘87 Conference Proceedings), Vol. 21, No. 4, pp. 25–34, July 1987.
36. F. Heppner and U. Grenander, A stochastic nonlinear model for coordinated bird flocks. In S . Krasner, Ed., The Ubiquity of Chaos. AAAS Publications, Washington, DC, 1990.
37. Y. Shi, Feature article on particle swarm optimization, IEEE Neural Network Society, Feature Article, pp. 8–13, Feb. 2004.
38. Y.Quan,W. Kesheng, A hybrid point cloud alignment method combining particle swarm optimization and iterative closest point method[J]. Advances in Manufacturing, 2014, 2(1): 32-38
39. R. C. Eberhart and Y. Shi, Tracking and optimizing dynamic systems with particle swarms, Proc. Congress on Evolutionary Computation 2001, Seoul, Korea, 2001.
40. R. C. Eberhart and X. Hu, Human tremor analysis using particle swarm optimization, Proc. Congress on Evolutionary Computation 1999, Washington, DC, pp. 1927-1930, 1999.
41. M. P. Wachowiak, R. Smolíková, Y. Zheng, J. M. Zurada, and A. S. Elmaghraby, An approach to multimodal biomedical image registration utilizing particle swarm optimization, IEEE Transactions on Evolutionary Computation, 2004.
42. H. Yoshida, K. Kawata, Y. Fukuyama, S. Takayama, and Y. Nakanishi, A particle swarm optimization for reactive power and voltage control considering voltage security assessment, IEEE Transactions on Power Systems, Vol. 15, No. 4, pp. 1232-1239, 2000.
43. L. Messerschmidt, A. P. Engelbrecht, Learning to play games using a PSO-based competitive learning approach, IEEE Transactions on Evolutionary Computation, 2004.
44. T. Blackwell and P. J. Bentley, Improvised music with swarms, In David B. Fogel, Mohamed A. El-Sharkawi, Xin Yao, Garry Greenwood, Hitoshi Iba, Paul Marrow, and Mark Shackleton (eds.), Proceedings of the 2002 Congress on Evolutionary Computation CEC 2002, pages 1462–1467, IEEE Press, 2002.

International Journal of Advance and Innovative Research Volume 5, Issue 4 (XII): October - December, 2018
67
ISSN 2394 - 7780
45. J. Kennedy and R. C. Eberhart, A discrete binary version of the particle swarm algorithm, in Proceeding of the 1997 Conference on Systems, Man, and Cybernetics, pp. 4104-4109, 1997.
46. C. K. Mohan and B. Al-kazemi, Discrete particle swarm optimization, Proceedings of the Workshop on Particle Swarm Optimization, Indianapolis, IN, 2001.
47. D. K. Agrafiotis and W. Cedeño, Feature selection for structure-activity correlation using binary particle swarms, Journal of Medicinal Chemistry, Vol. 45, pp. 1098-1107, 2002.
48. R. Poli, An analysis of publications on particle swarm optimizationapplications. Technical Report CSM-469, Dept. Computer Science, University of Essex, UK, 2007.
49. R. C. Eberhart and X. Hu, Human tremor analysis using particle swarm optimization, Proc. Congress on Evolutionary Computation 1999, Washington, DC, pp. 1927-1930, 1999.
50. H. W. Ressom, Y. Zhang, J. Xuan, Y. Wang, and R. Clarke, Inference of gene regulatory networks from time course gene expression data using neural networks and swarm intelligence, In the IEEE Symposium on Computational Intelligence and Bioinformatics and Computational Biology (CIBCB‘06), pp. 1 – 8, 2006.
51. N. Khemka, C. Jacob, and G. Cole, Making soccer kicks better: a study in particle swarm optimization and evolution strategies, In the IEEE Congress on Evolutionary Computation, Vol.1, pp. 735 – 742, 2005.
52. H.-Y. Lv, W.-G. Zhou, and C.-G. Zhou, A discrete particle swarm optimization algorithm for phylogenetic tree reconstruction, In Proceedings of the International Conference on Machine Learning and Cybernetics, Vol. 4, pp. 2650 – 2654, 2004.
53. R. Xu, G. C. Anagnostopoulos, and D. C. Wunsch, Multiclass cancer classification using semi-supervised ellipsoid art-map and particle swarm optimization with gene expression data. In the IEEE/ACM Transactions on Computational Biology and Bioinformatics, pp. 65 – 77, 2007.
54. R. Xu, X. Cai, and D. C. Wunsch, Gene expression data for DLBCL cancer survival prediction with a combination of machine learning technologies, In the 27th Annual International Conference of the Engineering in Medicine and Biology Society (IEEE-EMBS‘05), pp. 894 – 897, 2005.

International Journal of Advance and Innovative Research Volume 5, Issue 4 (XII): October - December, 2018
68
ISSN 2394 - 7780
A STUDY ON PERCEPTION OF E-WAY BILL AMONGTHE TRANSPORTERS OF AHMEDABAD
Dr. Ankitaben D. Kathiriya Assistant Professor, B. K. School of Business Management, Gujarat University, Ahmedabad
ABSTRACT E-way bill will become mandatory for all state to strengthen the GST, the aim of this research is to analyse the perception regarding e - way bill among the transporters in Ahmadabad City. Researcher has collected the data from transporter through structured questionnaire on convenience base sampling technique. Result of this research indicates the mix opinion regarding the e way bill.
Keywords: E-way Bill, Goods and Service Tax, Transporters
INTRODUCTION India came up with new tax a reform, which is Goods and Service Tax (GST). This tax pattern indicates one nation one tax; all the indirect taxes come under the one single roof. This will make simple tax structure, avoid double tax calculation. In year 2018 India came with new change about the E-way bill which will make GST stronger and it will useful to fast movement of goods(1). E- Way bill is really most important for both government as well as industry to make smooth administration (2).E-way bill is mandatory in interstate transportation of goods and if goods value is more than 50000, transport distance is more than 10 km them sender have to generate e-way bill. If sender is unable to do then ultimate responsible person is transporter of goods. They have to pay penalty for the same, so researcher has question about the perception regarding the e-way bill among transporter. Some states have made notification regarding the e-way bill and made it mandatory from April 2018. These four states Karnataka, Uttarakhand, Rajasthan, Kerala have made mandatory e-way bill. From June 2018 onwards many states implemented e-way bill.
WHAT IS E-WAY BILL? E-Way Bill is an electronic way bill for movement of goods which can be generated on the e-way Bill Portal. Transport of goods of more than Rs. 50,000 (Single Invoice/bill/delivery challan) in value in a vehicle cannot be made by a registered person without an e-way bill.
LITERATURE REVIEW Dipak Mondal believes that e-way bill will break the speed of (Evaluated Receipts Settlements) ERS and transporters have fear of the old corrupt system and its tracking. Now Commercial Tax Officer (CTO) will check the goods and invoice of it will create late in delivery of goods.
RESEARCH METHODOLOGY Objectives of this Study To study about e-way bill.
To study the perception of transporters assesses towards e-way bill.
To know the transporters awareness regarding e-way bill among the city of Ahmedabad
Sampling Technique A non-probability based convenience sampling was used to elicit information regarding transporters’
perception and behaviour in context of e-way bill for Ahmedabad city.
Data collection Primary data was collected through a structured questionnaire. The questionnaire was divided in to 13
multiple choice questions. The data was collected through mail questionnaire survey technique.
Data Analysis Microsoft Excel has been used to analyse and interpret the data.
Limitations of research Few limitations must be acknowledged that suggest caution in generalization. The research is just a small
step in understanding the e-way bill. The present study is based on a moderate sample size and area covered is Ahmedabad city only therefore the results of this study cannot be generalized.

International Journal of Advance and Innovative Research Volume 5, Issue 4 (XII): October - December, 2018
69
ISSN 2394 - 7780
DATA ANALYSIS AND INTERPRETATION Sr No Question Responses
1 Awareness About the E-Way bill
Aware 58 Not Aware 4
2 Awareness level about E-way bill
Basic 44 Advance Knowledge 14
3 GST Number Generated Generated 43 Not Generated 15
4 Transportation capacity Less than 3 ton 12 3 to 12 tons 14
12 to 21 tons 20 more than 21 tons 12
5 Types of goods Dangerous Goods 3 Finished Goods 30 Precious Goods 5 Raw Material 20
6 Types of vehicle Carrier 22 Container 22
Tanker 5 Others 9
7 Average Distance Travel in a day
Less than 10 KM 7 10-30 km 5 30-50 Km 14
More than 50 km 32
8 Transportation Range
Inter City 9 Intrastate 12 Interstate 13
All of the Above 24
9 Price of Goods
Less than Rs. 50000 23 More than Rs.50000 35
10 Awareness of Staff about E-way bill
Yes 55 Not Responded 3
11 Level of awareness among staff about E-way bill
Basic 50 Advance 8
12 Knowledge of employee about computer
Yes 42 No 16
13 Reason for accepting e-way bill
Because it is Mandatory 40 Because it is needed 18
14 SR NO
Statements Related to E- way bill
Strongly Agree
Agree Neutral Disagree Strongly Disagree
1 E-way bill helps in recording information
9 25 16 6 2
2 E-way bill have loopholes 8 14 24 7 5 3 E-way bill increase hurdle
for transportation 5 24 13 7 6
4 E-way bill can be used as the authorized proof of
transportation
7 29 9 8 5
5 E-way bill brings drastic change in transportation
business
4 14 19 15 5
6 E-way bill reduces tax evasion
1 18 25 13 1
7 E-way makes strong GST. 4 17 26 6 4

International Journal of Advance and Innovative Research Volume 5, Issue 4 (XII): October - December, 2018
70
ISSN 2394 - 7780
8 E-way bill create more transparency
1 23 22 9 3
9 E-way bill is beneficial for all the parties
1 18 21 10 8
10 There is no need of e-way bill as lot much
documentation is there
4 21 23 7 3
11 E-way is easy to generate 1 10 37 8 2 12 E-way bill is an additional
expenditure for transporter
11 26 13 6 2
13 E-way reduce illegal activities
1 17 22 15 3
14 Is it a right time for implementing e-way bill.
1 12 26 12 5
15 Our technologies are well advance for e-way bill
2 15 22 10 9
ANALYSIS AND CONCLUSION From the above table researcher has found out that the most of the transporters are aware about the e way bill and all are have bird view on new directions and rules, result indicates that transporters are doing all these things because of mandatory and it will have positive and negative aspect which are described as under.
POSITIVE ASPECTS OF E-WAY BILL As per data analysis following are the positive aspects of e-way bill E-way bill will helps in recording information.
E-way bill can be used as the authorised proof for transportation.
It will make stronger the GST.
E-way bill will create more transparency.
NEGATIVE ASPECTS OF E-WAY BILL As per data analysis following are the negative aspects of e-way bill The main reason for accepting the e-way bill is because it is mandatory.
E-way bill increase hurdles for transportation.
As per analysis 43% of respondents strongly agree that there is no need of e-way bill as there is much documentation work is needed.
As per analysis 53.8% of people believe that it is an additional expenditure for the transporters.
REFERENCES E-way Bill to improve ease of doing business: CII PTI | Apr 6, 2018 Read more at:
http://timesofindia.indiatimes.com/articleshow/63646432.cms? utm_source=contentofinterest&utm_medium=text&utm_campaign=cppst
E-way bill under GST: Why this system is extremely importanthttps://www.financialexpress.com/opinion/e-way-bill-under-gst-why-this system-is-extremely-important/1116588/
ARTICLE E-way bill concern: Why moving goods under GST can come to a grinding halt - Pranbihanga Borpuzari
E-way bill mandatory for inter-state movement of goods from Sunday - PTI | MAR 30, 2018
E-way bill for inter-state movement of goods likely from April-NEW DELHI, FEBRUARY
ACKNOWLEDGMENT Mr. Dayal Kannenkattil and Mr. Vatsal Pandya for help in data collection.

International Journal of Advance and Innovative Research Volume 5, Issue 4 (XII): October - December, 2018
71
ISSN 2394 - 7780
DETERMINANTS OF ONLINE SHOPPING IN RETAILING- A STUDY OF SELECTED DISTRICTS OF HARYANA
Dr. Divya Malhan1 and Preeti Khatri2 Assistant Professor1 and Research Scholar2, Institute of Management Studies and Research, MDU, Rohtak
ABSTRACT Since the season of initiation of online shopping in India, it has been an extremely incredible purposes of exchange among the academicians and analysts that how the clients select their item while shopping on the web. The different determinants which influence the conduct of clients are dependably a critical worry for the online dealers so they can improve a stage for the clients. In the present examination, we have taken the example of 300 respondents out of the chosen locale of Haryana. This Paper centered upon the investigation of determinants of online shopping. The survey gathered the reaction of determinants of internet shopping, factors that are probably going to impact online shopping intentions. The reactions from the clients are gathered on 29 proclamations of determinants of online shopping in the survey, on the five-point Likert scale. To analyze and interpret the data, frequency distribution, mean and percentage for exploratory data analysis and standard deviation, Chi-square, ANOVA and factor analysis for confirmatory data analysis are used.
Keywords: Factor Analysis, ANOVA, T Test, Online Shopping
INTRODUCTION As far as the term consumer behaviour is concerned it is the study of procurement, use and disposal of products/services. The behaviour of the consumer exhibits the process through which a product or a service reaches to its ultimate consumers. It is always advantageous to attain the knowledge pertaining to consumer behaviour while designing any marketing strategy. Sheth et. al (1999) define consumer behavior as the mental and physical activities undertaken by household and business customers that result in decisions and actions to pay for, purchase and use products and services. Batra and Kazmi (2004) state that consumer behavior is the mental-cum- emotional process and the observable behavior of consumers during searching, purchasing and post consumption of a product or service. Kotler (2007) defines that consumer behavior is the study of how individuals, groups, and organizations select, buy, use, and dispose of goods, services, ideas, or experiences to satisfy their needs and wants. Schiffman and Kanuk (2007) defines consumer behaviour as the behavior that consumers display in searching for, purchasing, using, evaluating, and disposing of products and services that they expect will satisfy their needs. Kuester (2012) defines consumer behavior as the study of individuals, groups, or organizations and the processes they use to select, secure, and dispose of products, services, experiences, or ideas to satisfy needs and the impacts that these processes have on the consumer and society. In other words, it can be said that consumer behavior is related to those actions which are directly involved in procuring, using and disposing of products and services, including the decision processes that go before and follow these actions.
All the consumer goods are made to finally reach to its ultimate consumer. The process of delivery of consumer goods starts with the manufacturer and finishes when the products are delivered to its ultimate user. In between the manufacturer and the user i.e. consumer, there are various middleman involved in the process. One of these middlemen is retailer, who plays a role of linking the manufacturer of good and consumer of goods. The word ‘retail’ has its origin in the French word ‘retailer’ which means ‘to break bulk’ or ‘to cut a piece off’. It was firstly used as a noun in the year 1433 that represented "selling in little quantities". All the activities of a retailer can be named as retailing. It may be defined as an inclusive set of various activities which are carried out to sell the products and services to the consumer. It is the business of matching the producer’s output with the individual and collective demand made by the consumer for the produced goods and services. The role of a retailer can be performed by any individual, agency, firm, company, agent or any other organization which plays an important role to provide the goods and services of a manufacturer to the ultimate user. However, there is a common presupposition that the task of retailer is only limited to the selling of products in its stores, but there are so many activities such as predicting and analyzing the customer’s need and wants, mounting assortments of products, getting important business and market related information etc. which are performed by a retailer. It is also worthwhile to note that selling does not need to be happened through a physical store. Many new platforms also have been developed and used by retailers such as selling through email, internet, door-to-door visits and any such other channel that may be used to contact the prospective customers. Even if Lenovo sell its computer directly to the user, they are also said to be performing the retailing function.

International Journal of Advance and Innovative Research Volume 5, Issue 4 (XII): October - December, 2018
72
ISSN 2394 - 7780
REVIEW OF LITERATURE Shankar et al. (2003) conducted a study to find out whether the level of customer satisfaction and loyalty in service industry are different for the same service in online versus offline mode. The study addressed the question that is becoming very important for the managers of service industry. The study proposed a theoretical aspect to develop hypotheses about the influence of the online mode on customer satisfaction and loyalty and on the association between satisfaction and loyalty. By using simultaneous equation model over two data sets of online and offline customers of the service industry the study found that the level of customer satisfaction for a service selected online is similar to when it is preferred offline, whereas loyalty to the service provider is comparatively more when the service is selected online than offline.
Gilbert et al. (2004) attempted to explore modifications in various technology adoption models to report for the changes in online business environment. Their study included various moderating factors that explain the impact over online business environment by extending the technology adoption models in e-government sector at USA. The study reported various important issues such as the development of the correct instrument, the validation of the instrument and the collection of data from the correct entities. The empirically investigation developed a model to create basis for examining the issues stated above related to adoption of information security principles.
Lee and Lin (2005) developed a modified research model based upon SERVQUAL by conducting a survey over data collected from 297 online customers to observe the association among e‐service quality dimensions and overall service quality, customer satisfaction and purchase intentions. The reliability and validity of the model was tested by confirmatory factor analysis and SEM (structural equation modelling) technique was used to test the proposed model. The study found that the dimension such as design of website, responsiveness, trust and reliability of web portal affect aggregate service quality and satisfaction of customer.
Yu and Wu (2007) admitted that the present business society is based upon information and communication and requires more interactive compilation of information and commercial interfaces supported by the internet based services. Their study examined the attitude and online shopping behaviour by conducting a questionnaire survey among 693 college going students in Taiwan. By using theory of reasoned action as the base, the study analysed the online shopping behaviour and intentions of the selected sample for online shoppers. The study found that the attitude toward one’s likely behaviour discriminated most strongly between those who projected to shop online, and those who did not as per the integration model. Whereas, the factor model holds that store service image and minor reference groups are those dominant variables that discriminated most strongly between these two groups of consumers.
Tan et al. (2008) offered a research model that describes the key role of e-government service quality as a determinant of trustworthiness of citizens towards the government websites while adopting the public electronic services. Using data from a sample of 647 e-government service users authenticated all 14 hypothesized dealings, thereby signifying that sky-scraping quality e-government websites are dominating in building citizen trust towards public e-services. The study proved that the sociological perception of trust acts as a matching role in predicting citizens’ frequent practice of e-government websites.
Renaud et al. (2009) conducted a study to understand the behaviour of online shoppers with special regard to usage of the electronic shopping basket along with wish list. An online survey was conducted to carry out the study and 304 respondents participated in the survey. The results indicated that as internet users are mature enough while using the online commerce platform.
Kheng et al. (2010) examined the changing role of the banking system due to rise of new ways of banking functions such as Internet banking, Automated Teller Machines (ATM), phone and high global competition, that have strained bankers to discover the significance of customer loyalty. By using underlying model of SERVQUAL with five diverse dimensions, the influence of quality of services on loyalty of customers was assessed in Malaysian banks. The study reported that continuous improvement in quality of the services may lead to higher loyalty of customers.
Liao (2012) proposed a data mining approach for examining the online group buying intentions and behaviour in Taiwan. The study used the Apriori algorithm, and clustering analysis for data mining as well as the knowledge patterns, rules and maps were used to offer suggestions and solution for online selling. Their study admitted online group buying behaviour as an effective and important marketing method. The study revealed that due to group online buying, there are more chances of getting higher discounts on some premium products and services.

International Journal of Advance and Innovative Research Volume 5, Issue 4 (XII): October - December, 2018
73
ISSN 2394 - 7780
Holland and Mandry (2013) conducted a study to analyse the online search behaviour in US and UK consumer markets by taking an international panel of about 1000 household online shopping users from fifteen countries, worldwide. Use of panel data and ComScore tracks provided very useful results. Their study found that there are six major explanations to online consideration sets. These explanations can also act in concert with each other. The study revealed that higher use of price comparing web search engines, increased market concentration, consumer’s use of preordained consideration sets, deliberate supplier strategies and observed consumer risk and lastly, high shop density helps in the development and growth of the online mode of search and sale behaviour.
Mansori et al. (2014) conducted a study to test a model that examine the relationship between the service recovery, customer satisfaction and customer’s post purchase behaviour in Malaysia post their government’s liberalization policy. The data from 370 respondents was collected and analysed by using Structural Equation Modelling technique. The study revealed that significant direct association between supposed distributive justice, apparent procedural justice, observed interactional justice and level of customer satisfaction in context to service recovery.
Hussain and Ali (2015) conducted a casual study to identify the impact of physical ambience on the consumer purchase behaviour and intention in multinational retail chain outlets in the city Karachi of Pakistan. Using a sample of 300 outlet visiting consumers and collecting data through a well-structured questionnaire, the research indicated that physical ambience related variables such as cleanliness, scent/fragrance, lighting/illumination, and display layout have a significant positive impact on consumer’s purchase decision, whereas music and colour bear no impact on consumer decision making process. Furthermore, temperature also holds no impact on the purchase intention of the consumers.
Ghaffaria and Ashkiki (2015) also aimed at obtaining more insight into the field of online shopping, ensure, gauge and rank the most influential structures affecting the purchase decision making process of an online shopper by selecting a sample of 384 online customers using Cochran formula. The structural equation modeling and LISREL analysis was undertaken and found that the quality of an individual being mediates between spur and feedback. The results further explained that website quality only influences the overall system quality on apparent friskiness as well as on the supposed playfulness and resulting impact might be the purchase intention. Also, the quality of the website, information quality and system size on the supposed quality of service influence on the alleged behaviour of an online customer.
Bagheri (2016) attempted to channelize the most relevant factors while using e-services and to assess e-services from the perspective of insurance clients in Iran. The study is an applied research which involves Iran, Asia, Sina, Mihan, Dana and Razi insurance agencies whereby AHP and extended TOPSIS based on possibility theory were used and 62 insurance clients were chosen and found that the factors such as responsibility, efficiency, security, confidentiality, usefulness and ease of use are the most relevant factors underlying e-services.
Maheswari and Priya (2017) attempted to analyze and classify the various customers on the basis of their purchase related behaviour and intention. The study used the data collected on the basis of observation method and the SVM algorithm with support vector machine was used for the purpose of making classification. The SVM model was build-up with linear kernel. Their study empirically validated the applicability of the model and methodology while analyzing the behaviour of a customer in a better way. Their study further reported that those consumers having age less than seven years was fascinated more to buy on line products. It was also observed that customer purchase more frequently during the offer season.
Mishra and Vishwas (2018) attempted to provide the empirical ground for the store strategy by using the classic multidimensional consumer empowerment construct and altered it for using in the retail business. The study used the robust scale development methodology to identify and validate the components of retail sector empowerment. Their study offered a model related to retail shopper empowerment with appropriate psychometric properties. Their study reported that while using the retail shopper empowerment matric, more understanding about the consumer preference in terms of store experience can be made by the retailer. Apart from it, retailers can develop adequate strategic substitutes to engage the consumers in the design and delivery of the store offerings.
SCOPE OF THE STUDY The present study covers the aspects related to determinants of consumer behaviour for with regard to the online shopping and customer satisfaction for retail sector in selected districts of State of Haryana.

International Journal of Advance and Innovative Research Volume 5, Issue 4 (XII): October - December, 2018
74
ISSN 2394 - 7780
OBJECTIVES OF THE STUDY The main objective of the research is to study the determinants of online shopping behavior in retailing. To meet this objective, following sub objectives have been set:
To assess the determinants that influence consumers’ online shopping intentions.
To find out whether there is any significant difference among the customers on the basis of the demographic characteristics
RESEARCH HYPOTHESES The following hypotheses have been formulated and tested to validate the results of the study:
H01: There is no significant difference among the respondents towards determinants on the basis of age
H02: There is no significant difference among the respondents towards determinants on the basis of gender
H03: There is no significant difference among the respondents towards determinants on the basis of marital status
H04: There is no significant difference among the respondents towards determinants on the basis of qualification
H05: There is no significant difference among the respondents towards determinants on the basis of occupation
SAMPLE PROFILE AND DATA COLLECTION The present study is descriptive in nature and used primary data. The primary data has collected through structured questionnaires from selected districts in Haryana on five point Likert scale i.e. Strongly Agree, Agree, Neutral, Disagree and Strongly Disagree. The respondents selected on the basis of convenient sampling. A sample of 300 customers from selected districts i.e. Kaithal, Sirsa, Hisar, Ambala, and Rohtak were collected.
DATA ANALYSIS The collected data has been analyzed with the help of descriptive statistical techniques like frequency distribution, mean, standard deviation. Factor analysis has been used as tools and techniques of analysis. To validate the results of the study, ANOVA and Independent sample t-test has been used. PASW 18.0 is used for the data analysis.
ANALYSIS Firstly on the questionnaire we have applied factor analysis. Be applying factors analysis out of the total 29 statements we have formed 7 factors which account for 54.89% variation. The factors thus formed are, unreliability, saving and safety, benefits of online, privacy and facility, phobia of online, burdensome Process and compatible.
Comparison of Means: ANOVA and Independent t-test Analysis Tables 1 to 5 show the results of the hypothesis of the study i.e. the customer perception towards determinants of online shopping do not vary across age, gender, marital status, education qualification, and occupation. The factor analysis resulted in seven important factors influencing perceptions of customers about determinants of online shopping. These factors form the basis for performing ANOVA and independent t-test.
H01: There is no significant difference among the respondents towards determinants on the basis of age Generally, with the passage of time, the perceptions of people change i.e. customers’ of different age groups usually hold different viewpoints. In order to find out whether there is any significant difference between the mean scores of perceptions of customers’ of different age groups about determinants of online shopping, ANOVA test has been applied.
Table 1 presents the mean scores, F-statistics and level of significance of various important factors of perceptions of customers’ about determinants of online shopping between the different age groups of customers. The mean values depict that the highest mean score has been obtained in case of the factor ‘Benefits of Online’ in three age groups i.e., under 20 year, 21-30 years and 31-40 year. It is followed by the factor ‘Saving and Safety’ in case of three age groups. It implies that, in case of both the factors there is strong agreement expressed by the customers of three age groups i.e., under 20 year, 21-30 years and 31-40 year. The lowest mean scores have been obtained in case of the factor ‘Unreliability’ for the respondents of under 20 year, 21-30 years and 31-40 year age groups. In case of the respondents of the age group of 41-50 years, the lowest mean score (2.94) has been assigned to the factor ‘Burdensome Process’ and highest mean score of 3.50 has been accorded on the Unreliability factor.

International Journal of Advance and Innovative Research Volume 5, Issue 4 (XII): October - December, 2018
75
ISSN 2394 - 7780
ANOVA test results reflect that f-value has been found insignificant at 5 percent level of significance in case of each of the seven factors. Thus, the difference in mean scores has not turned out significant in case of customers’ of the four age groups regarding these seven factors.
Table-1: Age-wise Comparison of Customers towards the determinants of online shopping
Factor Name Under 20
Yr. (N=71) 21-30 Yr. (N=182)
31-40 Yr. (N=41)
41-50 Yr. (N=6)
ANOVA F Sign.
Unreliability (F1) 2.99 3.03 3.15 3.50 1.000 0.393 Saving and Safety (F2) 3.73 3.63 3.41 3.38 1.925 0.126 Benefits of Online (F3) 3.95 3.83 3.75 3.20 1.794 0.148 Privacy and facility (F4) 3.38 3.24 3.31 2.89 1.071 0.361
Phobia of online shopping (F5) 3.32 3.25 3.24 3.40 0.198 0.898 Burdensome Process (F6) 3.14 3.07 3.14 2.94 0.368 0.776
Compatible (F7) 3.37 3.41 3.51 3.58 0.483 0.694 Note: *Significant at 5 percent level of significance
H02: There is no significant difference among the respondents towards determinants on the basis of gender
The views of male customers can differ from that of females. Independent t-test was applied to find out whether there exists any significant difference between the mean scores of perceptions of male and female customers towards determinants of online shopping.
Table 2 presents the mean scores, t-statistics and level of significance of various important factors of perceptions of male and female customers towards determinants of online shopping. The mean values depict that the highest mean scores of 3.82 and 3.85 have been accorded to the factor ‘Benefits of Online’ by male and female respondents respectively. The lowest mean scores of 2.98 and 3.09 have been obtained on the factor ‘Unreliability’ in case of both male and female respondents, respectively. An independent t-test result shows that t-value has not been found significant at 5 percent level, in case of the factor viz., Unreliability, Saving and Safety, Benefits of Online, Privacy and facility, Phobia of online shopping and Burdensome Process. On the other hand, the difference in mean scores has found significant in case of male and female respondents regarding the factor ‘Compatible’. It means that in case of the factor viz., ‘Unreliability, Saving and Safety, Benefits of Online, Privacy and facility, Phobia of online shopping and Burdensome Process’ no significant differences have been found in the mean scores of male and female respondents towards determinants of online shopping.
Table-2: Gender-Wise Comparison of Customers towards the determinants of online shopping
Factor Name Male (N=132) Female (N=168) Independent Sample t- test
t Sign. Unreliability (F1) 2.98 3.09 0.852 0.395
Saving and Safety (F2) 3.69 3.56 1.471 0.142 Benefits of Online (F3) 3.82 3.85 1.625 0.105 Privacy and facility (F4) 3.21 3.32 0.415 0.678
Phobia of online shopping (F5) 3.27 3.27 0.235 0.814 Burdensome Process (F6) 3.10 3.09 0.151 0.880
Compatible (F7) 3.56 3.31 3.273 0.001* Note: *Significant at 5 percent level of significance H03: There is no significant difference among the respondents towards determinants on the basis of marital status
Respondents of different marital status may have different perceptions about the determinants of online shopping. Table 3 shows that the highest mean scores of 3.91 and 3.66 have been accorded to the factor ‘Benefits of Online’ by single and married respondents respectively. The lowest mean scores of 2.92 have been obtained on the factor ‘Unreliability’ in case of single, whereas, 3.05 mean scores obtained on the factor ‘Burdensome Process’ in case of married respondents. Independent t-test results show that t-value has been found significant at 5 percent level in case of the factors viz., Unreliability, Saving and Safety and Privacy and facility. On the other hand, the difference in mean scores has not found significant in case of single and married
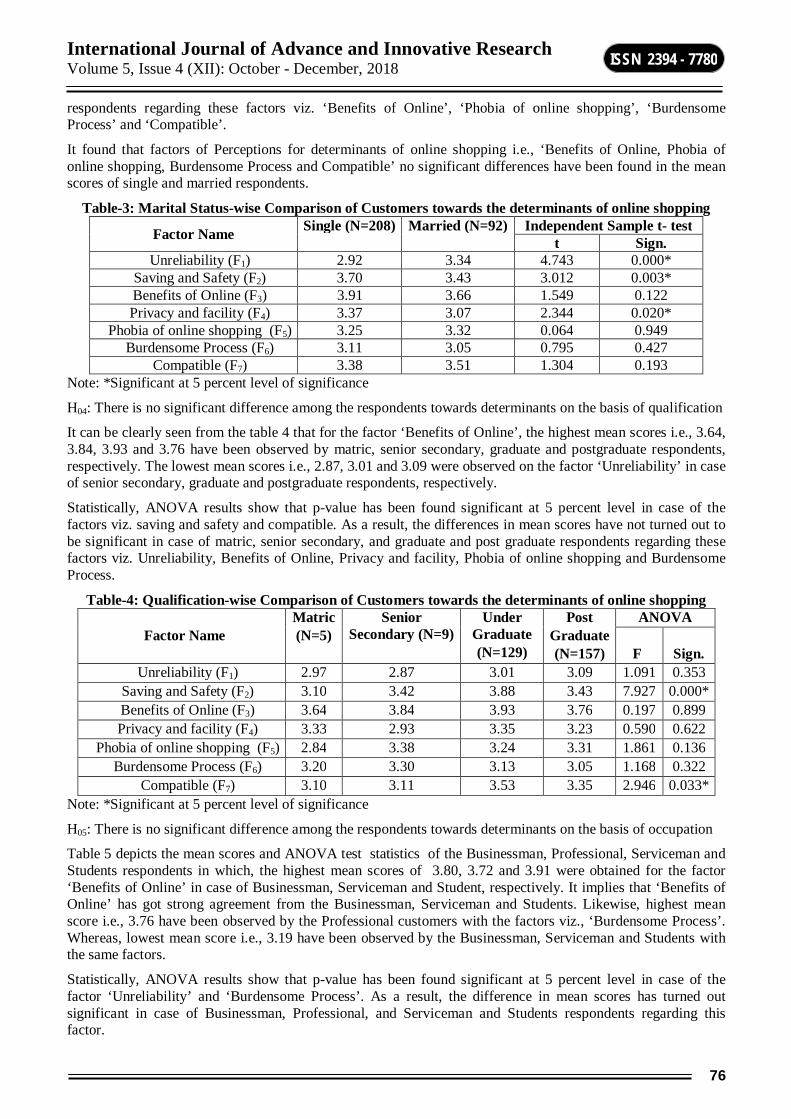
International Journal of Advance and Innovative Research Volume 5, Issue 4 (XII): October - December, 2018
76
ISSN 2394 - 7780
respondents regarding these factors viz. ‘Benefits of Online’, ‘Phobia of online shopping’, ‘Burdensome Process’ and ‘Compatible’.
It found that factors of Perceptions for determinants of online shopping i.e., ‘Benefits of Online, Phobia of online shopping, Burdensome Process and Compatible’ no significant differences have been found in the mean scores of single and married respondents.
Table-3: Marital Status-wise Comparison of Customers towards the determinants of online shopping
Factor Name Single (N=208) Married (N=92) Independent Sample t- test t Sign.
Unreliability (F1) 2.92 3.34 4.743 0.000* Saving and Safety (F2) 3.70 3.43 3.012 0.003* Benefits of Online (F3) 3.91 3.66 1.549 0.122 Privacy and facility (F4) 3.37 3.07 2.344 0.020*
Phobia of online shopping (F5) 3.25 3.32 0.064 0.949 Burdensome Process (F6) 3.11 3.05 0.795 0.427
Compatible (F7) 3.38 3.51 1.304 0.193 Note: *Significant at 5 percent level of significance
H04: There is no significant difference among the respondents towards determinants on the basis of qualification
It can be clearly seen from the table 4 that for the factor ‘Benefits of Online’, the highest mean scores i.e., 3.64, 3.84, 3.93 and 3.76 have been observed by matric, senior secondary, graduate and postgraduate respondents, respectively. The lowest mean scores i.e., 2.87, 3.01 and 3.09 were observed on the factor ‘Unreliability’ in case of senior secondary, graduate and postgraduate respondents, respectively.
Statistically, ANOVA results show that p-value has been found significant at 5 percent level in case of the factors viz. saving and safety and compatible. As a result, the differences in mean scores have not turned out to be significant in case of matric, senior secondary, and graduate and post graduate respondents regarding these factors viz. Unreliability, Benefits of Online, Privacy and facility, Phobia of online shopping and Burdensome Process.
Table-4: Qualification-wise Comparison of Customers towards the determinants of online shopping
Factor Name Matric (N=5)
Senior Secondary (N=9)
Under Graduate (N=129)
Post Graduate (N=157)
ANOVA
F Sign. Unreliability (F1) 2.97 2.87 3.01 3.09 1.091 0.353
Saving and Safety (F2) 3.10 3.42 3.88 3.43 7.927 0.000* Benefits of Online (F3) 3.64 3.84 3.93 3.76 0.197 0.899 Privacy and facility (F4) 3.33 2.93 3.35 3.23 0.590 0.622
Phobia of online shopping (F5) 2.84 3.38 3.24 3.31 1.861 0.136 Burdensome Process (F6) 3.20 3.30 3.13 3.05 1.168 0.322
Compatible (F7) 3.10 3.11 3.53 3.35 2.946 0.033* Note: *Significant at 5 percent level of significance
H05: There is no significant difference among the respondents towards determinants on the basis of occupation
Table 5 depicts the mean scores and ANOVA test statistics of the Businessman, Professional, Serviceman and Students respondents in which, the highest mean scores of 3.80, 3.72 and 3.91 were obtained for the factor ‘Benefits of Online’ in case of Businessman, Serviceman and Student, respectively. It implies that ‘Benefits of Online’ has got strong agreement from the Businessman, Serviceman and Students. Likewise, highest mean score i.e., 3.76 have been observed by the Professional customers with the factors viz., ‘Burdensome Process’. Whereas, lowest mean score i.e., 3.19 have been observed by the Businessman, Serviceman and Students with the same factors.
Statistically, ANOVA results show that p-value has been found significant at 5 percent level in case of the factor ‘Unreliability’ and ‘Burdensome Process’. As a result, the difference in mean scores has turned out significant in case of Businessman, Professional, and Serviceman and Students respondents regarding this factor.

International Journal of Advance and Innovative Research Volume 5, Issue 4 (XII): October - December, 2018
77
ISSN 2394 - 7780
In case of each of the remaining factors namely, ‘Saving and Safety, Benefits of Online, Privacy and facility, Phobia of online shopping and Compatible’ no significant differences have been found in the mean scores of occupation-wise respondents.
Table-5: Occupations-wise Comparison of Customers towards the determinants of online shopping
Factor Name Businessman (N=14)
Profession (N=21)
Service Man (N=87)
Student (N=178)
ANOVA F Sign.
Unreliability (F1) 3.25 3.52 3.22 2.89 7.758 0.000* Saving and Safety (F2) 3.68 3.67 3.49 3.67 1.087 0.355 Benefits of Online (F3) 3.80 3.70 3.72 3.91 0.808 0.490 Privacy and facility (F4) 3.31 3.65 3.14 3.29 1.466 0.224
Phobia of online shopping (F5) 3.60 3.62 3.25 3.22 1.776 0.152 Burdensome Process (F6) 3.19 3.76 2.92 3.09 4.677 0.003*
Compatible (F7) 3.68 3.38 3.48 3.37 0.524 0.666 Note: *Significant at 5 percent level of significance
CONCLUSION When we have seen the difference between the respondents towards determinants that influence the online shopping intentions, we have found the mixed responses. For some factors there is some significant differences and for some it is found insignificant such as t-value has not been found significant at 5 percent level, in case of the factor viz., Unreliability, Saving and Safety, Benefits of Online, Privacy and facility, Phobia of online shopping and Burdensome Process. On the other hand, the difference in mean scores has found significant in case of male and female respondents regarding the factor ‘Compatible’. Statistically, ANOVA results show that p-value has been found significant at 5 percent level in case of the factor ‘Unreliability’ and ‘Burdensome Process’. As a result, the difference in mean scores has turned out significant in case of Businessman, Professional, and Serviceman and Students respondents regarding this factor. At last the study is concluded with the results that the demographic factors taken in the study have some affect in case of online shopping.
REFERENCES Batra, S. K. and Kazmi, S. H. H. (2004). Consumer Behaviour Text and Cases-1st Edition. Excel Books,
New Delhi.
Bagheri, S.S. (2016). Evaluation of E-Services from the Viewpoint of Insurance Clients in Iran Using Ahp and Extended Topsis Based on Possibility Theory (Case Study: Iran, Asia, Sina, Mihan, Dana and Razi Insurance Agencies). International Business Management, 10, 5695-5704.
Chang, C. (2018). The different impact of fluency and disfluency on online group-buying conforming behaviour. Computers in Human Behavior, 85, 15-22.
Ghaffaria, A., and Ashkiki, M. F. (2015). The impact on the quality of the website to buy online customers. Journal of Applied Environmental and Biological Sciences. 5(11S), 516-526.
Gilbert, D., Balestrini, P., and Littleboy, D. (2004). Barriers and Benefits in the Adoption of E-Government. International Journal of Public Sector Management, 17, 286-301.
Holland, C.P., and Mandry, G.D. (2013). Online Search and Buying Behaviour in Consumer Markets. 46th Hawaii International Conference on System Sciences, 2918-2927.
Hussain, R., and Ali, M. (2015). Effect of Store Atmosphere on Consumer Purchase Intention. International Journal of Marketing Studies,7(2), 35-43.
Kheng, L.L., Mahamad, O., and Ramayah, T. (2010). The Impact of Service Quality on Customer Loyalty: A Study of Banks in Penang, Malaysia. International Journal of Marketing Studies, 2, 57-66.
Kotler, P. and Keller, K. (2007). Marketing Management-11th Edition. Prentice Hall of India Private Limited, New Delhi.
Kuester, S. (2012). Strategic Marketing & Marketing in Specific Industry Contexts. University of Mannheim, 110.
Lee, G.G. and Lin, H.F. (2005). Customer Perceptions of E-Service Quality in Online Shopping. International Journal of Retail & Distribution Management, 33, 161-176.

International Journal of Advance and Innovative Research Volume 5, Issue 4 (XII): October - December, 2018
78
ISSN 2394 - 7780
Maheswari, K., and Priya, P.A. (2017). Predicting Customer Behavior in Online Shopping Using SVM Classifier. IEEE International Conference on Intelligent Techniques in Control, Optimization and Signal Processing.
Mansori, S., Tyng, G.G., and Ismail, Z.M.M. (2014). Service Recovery, Satisfaction and Customer’s Post Service Behaviour in the Malaysian Banking Sector. Management Dynamics in the Knowledge Economy, 2(1), 5-20.
Mishra, A., and Vishwas, R. (2018). Retail shopper empowerment: A consumer-centric measure for store performance, IIMB Management Review, doi:
Renaud, K., Cockshott, T., and Hair, M. (2009). Everyone Abandons - Eventually: Understanding the Online Shopping Experience. IEEE Conference on Commerce and Enterprise Computing, 245-251.
Schiffman, L. G. and Kanuk (2007). Consumer Behaviour. Prentice Hall International, New Jersey, 3.
Shankar, V., Smith, A. K., and Rangaswamy, A. (2003). Customer satisfaction and loyalty in online and offline environments. International Journal of Research in Marketing, 20, 153-175.
Sheth, J. N., Mittal, B. and Newman, B.I. (1999). Customer Behaviour Consumer Behaviour and Beyond. The Dryden Press, USA: Harccourt Brace College Publishers.
Tan, C.W., Benbasat, I., and Cenfetelli, R.T. (2008). Building Citizen Trust towards E-Government Services: Do High Quality Websites Matter? Proceedings of the 41st Hawaii International Conference on System Science , 1-10.
Yu, T. and Wu, G. (2007). Determinants of internet shopping behavior: An application of reasoned behaviour theory. International Journal of Management, 24(4), 744-762.

International Journal of Advance and Innovative Research Volume 5, Issue 4 (XII): October - December, 2018
79
ISSN 2394 - 7780
DIMENSIONALITY AND PSYCHOMETRIC CHARACTERISTICS OF PSYCHOLOGICAL CAPITAL SCALE
Abdul Raffie Naik1 and Shah Mohd Khan2 Research Scholar1 and Associate Professor2, Department of Psychology, Aligarh Muslim University, Aligarh
ABSTRACT The current study was undertaken to determine the psychometric characteristics of Psychological Capital Scale. This test measures the positive attributes of an individual including Self-Esteem, Self-Efficacy, Resilience, Self-Conscious, Positive Attitude and Hope and in general it can be labeled as Psychological Capital. A scale on PsyCap was developed by Luthan (2007) and standardized on organizational settings and consists four (Hope, Efficacy, Resilience and Optimism) dimensions. For Youth the researcher could not find an appropriate scale so this scale has been developed to measure the PsyCap among Youth. The sample for this study constitutes of 250 Youth, ensuring homogenous characteristics. The Cronbach’s Alpha of the scale was found 0.91, which is satisfactory and the Composite reliability ranges from 0.62 to 0.76. The construct validity range falls in between 0.59 to 0.81 of dimensions and, in overall, it was found 0.91. Further the convergent validity was in acceptable range. Content (Face and logical) validity of the scale was verified by a number of experts and academicians. Factor analysis was carried out in which five factors emerged explaining 57.534% of the total variance, which confirmed the high factorial validity. The factors in the present study were named as Self Worth, Self-Efficacy, Resilience, Self Conscious, Positive Attitude and Hope. Further, the inter-factorial correlation among sub-dimensions of Psychological Capital scale was found highly significant. It can be concluded that the present piece of research work confirms high reliability and validity of Psychological Capital scale.
Keywords: Psychological Capital, Self Worth, Self-Efficacy, Resilience, Self Conscious, Positive Attitude Hope and Youth.
INTRODUCTION Psychological capital is positive strength of an individual. The concept is based on Gestalt psychology whole is greater than sum of its parts. PsyCap is a core construct for well-being and thriving. Luthans Youssef, and Avolio (2007) defines Psychological Capital (PsyCap) as a positive psychological strength or resource “characterized by (a) having confidence (self-efficacy) to take on and put in the necessary effort to succeed at challenging tasks; (b) making a positive attribution (optimism) about succeeding now and in the future; (c) persevering toward goals and, when necessary, redirecting paths to goals (hope) in order to succeed; and (d) when beset by problems and adversity, sustaining and bouncing back and even beyond (resilience) to attain success”. Originally PsyCap was developed by Luthans, Youssef, and Avolio (2007) in an organizational context. The concept of Psychological Capital, with its four pillars of Hope, Efficacy, Resilience and Optimism (HERO), has been linked to job as well as life satisfaction. The authors of the scale selected 6 items each from four scales viz. (a) Hope (Snyder 1996), (b) Resilience (Wagnild & Young, 1993), (c) Optimism (Scheier & Carver, 1985) and (d) Self-Efficacy (Parker, 1998). To date there are few scales to measure PsyCap and one of them widely used was developed by Luthans, Youssef, and Avolio (2007).
Seligman established the framework of Psychological capital in his book, Authentic Happiness in 2002 when he expressed “when we are engaged perhaps we are investing, building psychological capital for our future.” The four Psychological constructs namely self-efficacy, hope, resiliency and optimism have a shared characteristic of being intrinsically positive were consolidated and named as Psychological Capital (Avey, Wernsing, and Luthans, 2008). PsyCap was empirically validated as a core construct (Luthans, Avolio, Avey, and Norman, 2007). Positive Psychologist Csikszentmihalyi noticed that PsyCap is developed through a pattern of psychic assets that outcomes in 60 acquiring experiential rewards from the present time while also improving the probability of future advantages (Kersting, 2003). It’s about the condition of the parts of your internal life. When you add up the parts, experiences and capital, it makes up the Value. Luthans, Youssef et al. (2007) believes that PsyCap represents to “one’s positive appraisal of circumstances and probability for success based on motivated effort and perseverance." According to Luthans, Luthans, and Luthans (2004), Psychological Capital is beyond human and social capital. While economic capital spotlights on “what you have?” Human capital stresses on “what you know?” and social capital throws light on “whom you know?” Psychological capital spotlights on “Who you are and what you can become?” (Luthans and Avolio, 2003; Luthans, Avey, Avolio, Norman, and Combs, 2006). This suggests its emphasis entirely on the innate positive assets that make up the individual and on additionally improving those positive Psychological assets. The accentuation laid on theory development, validation through empirical research, and a valid instrument of assessment recognized

International Journal of Advance and Innovative Research Volume 5, Issue 4 (XII): October - December, 2018
80
ISSN 2394 - 7780
Psychological capital constructs from other positive constructs that existed in the well known literature related to self and organizational improvement.
In the present study, the investigators have made an attempt to develop the scale to measure the strength of youth in Hindi and English. The secondary purpose of this study is to contribute to the body of knowledge of general population as the earlier scale was mainly focusing on organizational setting. The assessment and development of PsyCap in youthful age is important, because at that stage, many young people are facing with challenges and changes that are peculiar to the developmental stage.
DRAFT SCALE Psychological capital scale was constructed for youth. It was made bilingual (English and Hindi) before Administration for making the language more understandable. The scale initially comprised 38 items with 5-point Likert type responses, viz., ‘Strongly Disagree’, ‘Disagree’, ‘Neutral’, ‘Agree’, and ‘Strongly Agree’. This scale was administered on representative sample of 100 male and female youths.
After scoring the items of each testee, the scores were arranged in descending order (highest scoring to the lowest). Two separate groups, one of 27% from the highest scoring and other of 27% from the lowest scoring were made. Inter correlation matrix was examined in order to overcome existence of multicollinearity and singularity in the scale. After analysis, 12 items having the multicollinearity and singularity were rejected and the final draft of the scale comprised of 26 items.
STANDARDIZATION OF THE SCALE The final scale with 26 items was administered on a sample of 250 youth. The total score of the scale varies from 0 to 104 and can be inferred as higher the score higher the Psychological Capital and vice-versa.
The mean age of the youths participated in the development of scale was 21.19 years with 19 years as minimum and 25 years as maximum.
Table-1: Dimension-wise distribution of items in the scale Dimensions Items No.
1. Self Worth PC6, PC16, PC17, PC22, PC24, PC25 6 2. Self-Efficacy PC3, PC4, PC8, PC13, PC20 5 3. Resilience PC1, PC5, PC7, PC10 4 4. Self Conscious PC11, PC12, PC14, PC18 4 5. Positive Attitude PC19, PC21, PC23 3 6. Hope PC2, PC9, PC15, PC26 4
Total 26 The scoring criterion for items is given in table
Table-2: Scoring System Scoring Strongly Disagree Disagree Neutral Agree Strongly Agree Positive 0 1 2 3 4
OPERATIONAL DEFINITION OF PSYCHOLOGICAL CAPITAL AND ITS DIMENSIONS Psychological capital is positive strength of an individual. The concept is based on Gestalt psychology whole is greater than sum of its parts. PsyCap is a core construct for well-being and thriving.
DIMENSIONS OF PSYCHOLOGICAL CAPITAL There are six dimensions of psychological Capital and their operational definitions are given in following paragraphs.
Self Worth: It is the unshakable faith about value of one’s self and self worth shows the confidence in one’s own worth.
Self-Efficacy: It is the belief about the abilities of an individual to perform at different level and is functional at different stages of beliefs that influence how they think, feel and motivate themselves.
Resilience: It is the capacity of an individual to retrieve themselves from the difficult times and ability of an indidual to make him/her worth living despite all these tough times.
Self-Conscious: It is an awareness of an individual about personal existence, character traits, standing features, thoughts that occur and the feelings that he/she experiences.

International Journal of Advance and Innovative Research Volume 5, Issue 4 (XII): October - December, 2018
81
ISSN 2394 - 7780
Positive Attitude: It is characteristics of an indidual to think, act and behave positively and favorable evaluation of him/herself.
Hope: It is an expectation of positive outcomes in the future and viewed as a positive attribute of an indidual.
INSTRUCTIONS Instructions for administration of the scale were printed on the first page of the scale. The scale can be administered individually or in a group (not more than 30 youth at a time). The Participants were assured that their responses will not be disclosed but will be used for the research purpose only. The consent form was also filled by them. They were asked to read each and every item carefully and give their responses honestly.
RELIABILITY The consideration of reliability of a scale viewed as essential elements for determining the quality of any standardized test. However, professional and practitioner associations frequently have placed these concerns within broader contexts when developing standards and making overall judgments about the quality of any standardized test as a whole within a given context. Cronbach’s alpha was calculated for determining the internal consistency (reliability) of the scale. Table 3 shows descriptive statistics for items and scale with reliability coefficient.
Table-3: Descriptive statistics of Items, Scale and Cronbach’s Alpha Item No.
Descriptive statistics for item Descriptive statistics for scale Range Mean Variance SD Scale Means if
item Deleted *Corrected Item-Total Correlation
Cronbach's Alpha if Item Deleted
PC1 4 2.61 1.355 1.164 75.48 .394 .910 PC2 4 2.86 1.369 1.170 75.24 .382 .911 PC3 4 2.94 1.281 1.132 75.16 .518 .908 PC4 4 3.10 0.979 0.989 75.00 .567 .907 PC5 4 3.09 1.358 1.165 75.01 .560 .907 PC6 4 3.04 1.320 1.149 75.06 .680 .905 PC7 4 3.22 1.112 1.055 74.88 .615 .906 PC8 4 3.10 1.339 1.157 74.99 .531 .908 PC9 4 3.13 1.143 1.069 74.96 .507 .908 PC10 4 2.84 1.433 1.197 75.25 .468 .909 PC11 4 2.92 0.929 0.964 75.18 .549 .908 PC12 4 3.02 1.236 1.112 75.07 .431 .910 PC13 4 2.99 1.128 1.062 75.11 .535 .908 PC14 4 2.84 1.326 1.152 75.26 .444 .909 PC15 4 3.04 1.292 1.136 75.06 .542 .908 PC16 4 3.17 1.059 1.029 74.92 .606 .907 PC17 4 2.87 1.229 1.108 75.22 .562 .907 PC18 4 2.66 1.332 1.154 75.43 .429 .910 PC19 4 2.88 1.227 1.108 75.21 .514 .908 PC20 4 3.19 1.096 1.047 74.90 .596 .907 PC21 4 3.16 0.927 0.963 74.94 .466 .909 PC22 4 3.24 1.018 1.009 74.86 .603 .907 PC23 4 3.00 1.197 1.094 75.10 .356 .911 PC24 4 3.13 1.188 1.090 74.97 .472 .909 PC25 4 2.91 1.181 1.087 75.18 .433 .910 PC26 4 3.15 1.307 1.143 74.95 .509 .908
r=0.12 (p<0.05), r=0.16 (p<0.01), r=0.20 (p<0.001) two tailed

International Journal of Advance and Innovative Research Volume 5, Issue 4 (XII): October - December, 2018
82
ISSN 2394 - 7780
Table-4: Descriptive statistics of Scale and Reliability (Cronbach’s alpha) PsyCap Scale N Mean Variance SD Alpha Coefficient No. of Items
250 78.10 253.750 15.930 0.911 26 The internal consistency among items of respective dimensions was calculated and shown in Table 5.
Table-5: Cronbach’s Alpha for Psychological Resilience Scale and its dimensions. Scale & Dimensions *Alpha Coefficient
1. Self Worth .81 2. Self-Efficacy .77 3. Resilience .70 4. Self Conscious .67 5. Positive Attitude .59 6. Hope .65 Overall PsyCap .91
r=0.12 (p<0.05), r=0.16 (p<0.01), r=0.20 (p<0.001) two tailed
Cronbach’s Alpha for overall Psychological Capital scale was 0.91 and its dimensions 0.81, 0.77, 0.70, 0.67, 0.59, and 0.65 for Self Worth, Self-Efficacy, Resilience, Self Conscious, Positive Attitude and Hope respectively and are significant at 0.001 level. The internal consistency of the scale and sub-scales are quite high and this gives a support that the scale has good reliability (George & Mallery, 2003).
COMPOSITE RELIABILITY Composite reliability of the scale was calculated using the following formula.
Where, is the value of factor loading for respective item and is the error time. The values of composite reliabilities for factors are varying from 0.63 to 0.74 and are given in table 6. To be in acceptable range, the value of composite reliability needs to be in and around 0.70.
VALIDITY Content (Face and logical) validity of the scale was verified by number of experts and academicians. There are various methods to establish construct validity of the tool. After thoroughly scrutinizing each form, a set of questions was sent to numerous experts from varied fields such as social work and psychology. Five columns were provided against each statement which asked the following: “Is the item measuring what it intends to? Is the item essential? Is the item useful but not essential? And finally, is the item not necessary to the construct?” (Lawshe, 1975). For evaluating content validity, a panel of five expert analysts were recruited to rate each item on a scale of 4 to 1; 4 being completely relevant (100 %), 3 fairly relevant (75 %), 2 less relevant (50 %), and 1 insufficient relevant (25 %). The Content Validity Index (CVI) of PsyCap items was estimated and 12 items were not having in acceptable range so they were removed from the final scale. Factor analysis with Principal Component Analysis as extraction and varimax rotation methods were used to establish the factorial validity of the scale. Data screening was carried out in order to overcome existence of multicollinearity and singularity in the scale. For testing multicollinearity and singularity ‘Determinant’ of the R-matrix was estimated and it was greater than 0.00001. Sampling adequacy was also carried out and found to be greater than 0.50, both parameters are in acceptable range.
Table-6: Factor structure of the Psychological Capital Scale (PCS) Item No Factors and Loadings
Self Worth
Self-Efficacy
Resilience Self Conscious
Positive Attitude
Hope
PC25 .731
PC24 .717 PC16 .611 PC17 .531 PC6 .509

International Journal of Advance and Innovative Research Volume 5, Issue 4 (XII): October - December, 2018
83
ISSN 2394 - 7780
Item No Factors and Loadings Self
Worth Self-
Efficacy Resilience Self
Conscious Positive Attitude
Hope
PC22 .467 PC8
.792 PC4 .638
PC13 .606 PC20 .560 PC3 .506 PC1
.724 PC5 .590 PC7 .551
PC10 .507 PC14
.774 PC18 .732 PC12 .471 PC11 .444 PC23
.727 PC21 .635 PC19 .414 PC9
.635 PC15 .582 PC2 .566
PC26 .422 Composite Reliability 0.76 0.76 0.68 0.70 0.62 0.63
Average Variance Extracted 0.36 0.39 0.35 0.38 0.36 0.31 Percent of Variance 11.725 11.419 10.203 8.565 7.997 7.625
Cum. Percent of Variance 11.725 23.144 33.347 41.912 49.909 57.534
The percent of variance accounted by factors varies from 7.625 to 11.725%. In summing up, all six factors explained 57.534 % of the total variance. The factorial validity of the scale is excellent.
CONVERGENT VALIDITY The average variance extracted by each factor was calculated using the following formula
Where, is the factor loading or correlation of item with respective sub-constructs. To confirm the convergent validity, this value needs to be around 0.50 and in our case all values were greater than 0.50 and this confirms the convergent validity of the Psychological Capital Scale.
INTER-FACTORIAL VALIDITY The inter-factorial validity of the scale was estimated as shown in Table 7. It is to confirm that all factors as correlated to each other and measuring the same construct.
Table-7: Descriptive Statistics and Inter-factorial Validity Dimensions Mean SD Dimensions
Self
Wor
th
Self-
Effi
cacy
Res
ilien
ce
Self
Con
scio
us
Posi
tive
Atti
tude
Hop
e
PsyC
ap
1. Self Worth 18.360 4.679 1 2. Self-Efficacy 15.316 3.906 .578 1 3. Resilience 11.764 3.327 .539 .579 1

International Journal of Advance and Innovative Research Volume 5, Issue 4 (XII): October - December, 2018
84
ISSN 2394 - 7780
4.Self Conscious 11.440 3.132 .523 .471 .502 1 5.Positive Attitude 9.040 2.350 .538 .492 .399 .367 1 6. Hope 12.176 3.157 .535 .601 .517 .472 .441 1 PsyCap 78.096 15.929 .836 .820 .769 .718 .669 .769 1
r=0.12 (p<0.05), r=0.16 (p<0.01), r=0.20 (p<0.001) two tailed
Inter-factorial correlations indicate that all factors are significantly correlated with each other and measuring the same construct.
CONCLUSION The psychological Capital scale provides measures of six empirically derived dimensions. Internal consistency, composite reliability and intra-factorial reliability based on responses from 250 youth had shown that the Psychological Capital Scale has quite satisfactory reliability. The face, content, factorial (construct) and convergent validities are also high and in acceptable range. It can be concluded that the scale is highly reliable and valid for measurement of Psychological Capital.
IMPLICATION The objective of this research program was to standardize a comprehensive, reliable and valid scale of psychological Capital. This scale can be used to help self-analysis, researchers and practitioners to measure the Psychological Capital and on its sub-domains viz. Self-worth, Self-Efficacy, Resilience, Self-conscious, Positive Attitude and Hope. The scale can be used by students, medical professionals, psychologists, and counselors. This can also be used by NSS and NCC like organizations for developing positive strength among volunteers. This may also be used by HR Mangers to examining and developing positive strength among workers.
REFERENCES Avey, J. B., Wernsing, T. S., & Luthans, F. (2008). Can positive employees help positive organizational
change? Impact of Psychological Capital and Emotions on Relevant Attitudes and Behaviours. The Journal of Applied Behavioural Science, 44(1), 48-70.
George, D., & Mallery, P. (2003). SPSS for Windows step by step: A simple guide and reference 11.0 update (4th ed.). Boston: Allyn & Bacon.
Kersting K. (2003). Turning happiness into economic power. Monitor on Psychology, 34(11), 26.
Lawshe, C.H. (1975). A quantitative approach to content validity. Personnel Psychology, 28, 563-575.
Luthans F, Youssef CM, & Avolio BJ. (2007). Psychological capital. New York: Oxford University Press
Luthans, F., & Avolio, B. J. (2003). Authentic Leadership: A positive developmental approach. In K. S. Cameron, J. E. Dutton, & R. E. Quinn (Eds.), Positive organizational scholarship (pp. 241-261). San Francisco: Barrett-Koehler.
Luthans, F., Avey, J. B., Avolio, B. J., Norman, S. M., & Combs, G. M. (2006). Psychological capital development: toward a micro‐intervention. Journal of Organizational Behavior, 27(3), 387-393.
Luthans, F., Avolio, B. J., Avey, J. B., & Norman, S. M. (2007). Positive psychological capital: Measurement and relationship with performance and satisfaction. Personnel psychology, 60(3), 541-572.
Luthans, F., Luthans, K. W., & Luthans, B. C. (2004). Positive psychological capital: Beyond human and social capital. Business horizons, 47(1), 45-50.
Luthans, F., Youssef, C. M., & Avolio, B. J. (2007). Psychological capital: Developing the human competitive edge. Oxford, UK: Oxford University Press.
Parker, S. K. (1998). Enhancing role breadth self-efficacy: The roles of Job enrichment and other organizational interventions. Journal of Applied Psychology, 83, 835-852.
Scheier, M. F., & Carver, C. S. (1985). Optimism, coping, and health: Assessment and implications of generalized outcome expectancies. Health Psychology, 4, 219-247.
Seligman, M. E. P. (2002). Authentic happiness: Using the new positive psychology to realize your potential for lasting fulfillment. New York: Free Press.

International Journal of Advance and Innovative Research Volume 5, Issue 4 (XII): October - December, 2018
85
ISSN 2394 - 7780
Seligman, M. E. P., & Csikszentmihalyi, M. (2000). Positive Psychology: An introduction. American Psychologist, 55(1), 5-14.
Snyder, C. R. (1996). The psychology of hope: You can get there from here. New York: Free Press.
Wagnild, G. M., & Young, H. M. (1993). Development and psychometric evaluation of the Resilience Scale. Journal of Nursing Measurement, 1(2), 165-17.

International Journal of Advance and Innovative Research Volume 5, Issue 4 (XII): October - December, 2018
86
ISSN 2394 - 7780
ECONOMIC INTEGRATION AND SOUTH ASIA: EXPLORING SPILLOVER EFFECTS FOR NORTH-EAST INDIA
Jayanti Bhattacharjee Associate Professor, Department of Economics, Women’s College, Agartala, Tripura
ABSTRACT The present research paper attempts to estimate the influence of physical capital investment, education expenditure and trade on the economic growth of the four major countries in South Asia, namely, India, Pakistan, Bangladesh and Srilanka. In addition the study estimates spillover benefits of the institutional measures of voice and accountability, political stability and absence of violence and terrorism in the neighbouring countries on economic growth of home country. The paper diagnoses the intra-regional trade in South Asia and whether Northeast India can catalyse the economic integration in the region. The study also throws light on the spillover benefits from regional integration and hindrances in realisation of the spillover benefits for the North-Eastern states from the Act-East Policy of Government of India. We run a panel regression for the period 1996-2016 to estimate the influence of various conventional factors and spillover effects of institutional measures of voice and accountability and political stability and absence of violence and terrorism on economic growth of the four major economies of South Asia. Annual data on various explanatory variables have been collected from Penn World Tables, Word Bank, World Bank Governance Indicators for the four South Asian countries, namely, India, Pakistan, Bangladesh and Srilanka for the period 1996 to 2016. Significant positive effects of physical capital investment, trade, regional institutions of voice and accountability and political stability are observed. Surprisingly, it is observed that international trade measured by trade-GDP ratio has positive and significant influence on economic growth of the countries in South Asia, but intra- regional trade within South Asia remains meagre. Policy makers should make the most of the geographical location of the Northeast states in escalating the economic growth of South Asian nations. This also provides the Northeast region a generous opportunity to reap the benefits of the Act East Policy of India.
Keywords: International Economics, Institutions and Macroeconomy, Panel Data Models, Estimation
INTRODUCTION Regional integration is seen as a route toward economic prosperity. It paves the way for expanding markets and trade opportunities, in a similar fashion as with globalization. Regional cooperation has been perceived as a coping mechanism for smaller economies in a globally competitive market. In contrast to globalization, regional cooperation has been observed to bind countries in trade and investment agreements with others which have similar economic structure, productive efficiency and technological competence. Thus regional trade agreements are more viable. To top this, countries in the same geographic region will have the advantages of proximity, familiarity, and lower transport costs. It is therefore not surprising that the past two decades have seen the rapid expansion of intraregional trade in all developing regions. South Asian economies also have these features of proximity, acquaintance that make regional economic cooperation and integration a feasible vista. However, in South Asia there exist wide disparity between the land-locked areas and the developing areas. The border districts/states/provinces of Bangladesh, India and Pakistan also lag behind. However, domestic public policy alone will not facilitate their economic growth. So, policy makers in the region should lay stress on the cross-border aspects of the lagging regions problem in addition to efforts to increase investment and improve governance. In an attempt to mitigate the issue of the lagging regions problem and also to accelerate economic integration in the region, the Government of India (GoI) launched the Look (Act) East Policy. Regional economic integration in South Asia gained momentum in 1995 when the South Asian Preferential Trade Agreement (SAPTA) was established. South Asian Free Trade Agreement (SAFTA) was initiated from 1 July 2006, to boost intra-regional trade among the seven SAARC countries. In endeavouring to reduce isolation of the landlocked Northeast states the Act East Policy was launched by the Government of India in November, 2014. The geographical location of the Northeast states gives the region an ample opportunity to catalyse the intra-regional trade among the SAARC countries. This also gives the Northeast states opportunity to reap spillover benefits from the exercise of economic integration in South Asia.
REVIEW OF LITERATURE Several studies (Chua, 1993; Ades and Glaeser, 1994, Ades and Chua, 1997; Moreno and Trehan, 1997; Lal and Shalizi, 2003) have reported strong correlation of growth among neighbouring countries. Also, flow of goods, factors and information become easier and faster due to lower transportation costs. Spillover effects are most pronounced among neighbouring countries. All these factors gave us impetus to investigate the trend of intra-

International Journal of Advance and Innovative Research Volume 5, Issue 4 (XII): October - December, 2018
87
ISSN 2394 - 7780
regional trade in South Asia and also study whether the Northeast states of India can act as a catalyst in enhancing the benefits of regional integration from the Act East Policy of Government of India. This has significant implications for Northeast India, especially, for Tripura sharing 48 percent of Indo-Bangla border with Bangladesh on three sides. Sharma (2009) tried to examine the crucial role of India to shape the future and cooperation among South Asian nations as India's strategic location provides it a pivotal position in Asia and world politics. Nath and Nath (2004) have remarked that because of its peculiar geographic location, if the Northeast region is taken seriously and given a direct role in India's foreign policy towards its eastern neighbours, this underdeveloped region can emerge as the main trading zone of India in future. This can also solve the problems of the region like economic marginalization, insurgency, etc. Srikanta (2015) is quite apprehensive about the success of Look East Policy and his study tries to highlight the hurdles in realisation of the policy. In the views of Bhaumik (2015), to Look East through Northeast, India has to first improve its bilateral relationship with Myanmar and Bangladesh. Debnath and Roy (2012) testing spillover effects among Northeast states have observed variation in performance, mixture of trickle down and polarization effects of economic growth. Goswami and Saikia (2012) depicts the present status of FDI & exports in North East Region (NER) with a focus on their prospect. Chatterjee (2007) also suggests that North East India will accrue to the benefits of this policy initiative depending on how much traffic moves through the land routes. Goswami (2015) has tried to explore the prospects of rail-road infrastructure in Northeast India, while Datta (2015) in his study has concentrated on how the power sector of Tripura can benefit not only Tripura but also its neighbours. However, literature gap lies in the analysis of fashion or trend of intra-regional trade in South Asia, the importance of the Northeast states and their embedded benefits, interrogation of practical feasibility of the connectivity in the region. The present study contributes to the existing literature in three ways. Firstly, it estimates the influence of various explanatory variables on economic growth in four major countries of South Asia using panel regression analysis for the period 1996 to 2016. Secondly, it explores the recent developments in intra-regional trade in South Asia and the role Northeast states can play in this direction. Thirdly, the paper tries to explore the challenges posed by the Look (Act) East Policy for Northeast India.
THEORETICAL FRAMEWORK, DATA AND ESTIMATION TECHNIQUE Following Rebelo (1991), with a standard endogenous growth approach, a given country’s production can be characterized by the augmented production function as:
= ( ) itβ uαY A K HC eit it it it ------------------------ (1)
Here,
Y i t =Aggregate national income in country i at time t
Ait =Level of total factor productivity in country i at time t
K it =Level of physical capital in country i at time t
HC it=Level of human capital in country i at time t
uit= error term that varies across countries and time periods
Following Bhattacharjee and Haldar (2014, 2015a, 2015b) and Bhattacharjee (2016) we assume openness (i.e trade-GDP ratio) and institution to affect growth via total factor productivity,
( )=( ) itλZθA OPEN eit it where,
(OPEN)it= Openness measured by trade-GDP ratio in country i at time t
Zit = Measure of institution of country i at time t
Now substituting for Ait in equation (1) we get,
( )=( ) ( ) ( )it itβλZ uθ αY OPEN e K HC eit it it it

International Journal of Advance and Innovative Research Volume 5, Issue 4 (XII): October - December, 2018
88
ISSN 2394 - 7780
In this study we use panel data approach for the empirical analysis as data on the two measures of institution, namely, voice and accountability and political stability and absence of violence and terrorism are available only for the period 1996 to 2016. The panel data accommodates differences in production function across countries in the form of unobservable ‘country-specific effects’.
Rewriting the model in a panel set up we get:
ln = ln + ln( ) + ln( ) + + + +Y α K β HC θ Open λZ μ η uit it it it i t itit …………….. (2)
where,
lnYit =natural log of per capita GDP in country i at time t
ln Kit = natural log of physical capital investment as a percentage of GDP in country i at time t
ln( )HC it = natural log of education expenditure as a percentage of GDP in country i at time t
ln OPENit =natural log of openness in country i at time t
Zit = Institution measure of country i at time t µi=country-effects ηt=period-effects
Per capita real GDP is used to measure economic growth in the study. Annual data on per capita real GDP, physical capital investment expenditure (as a share of GDP), openness have been collected from Penn World Tables for the four South Asian countries, namely, India, Pakistan, Bangladesh and Srilanka for the period 1996 to 2016. We have limited our study to the period 1996-2016, as the Worldwide Governance indicators are available for that period. The data for education expenditure for various years are obtained from World Bank.
We employ two institutional measures in our study, namely, Voice and Accountability, Political Stability and Absence of Violence and Terrorism from Worldwide Governance indicators (Kaufmann et al. 2010). However, the data on the governance indicators were bi-annual till 2002. So, assuming exponential smoothing, we have interpolated for the interim years. The Worldwide Governance indicators are composed of aggregate indicators of six broad dimensions of governance, namely, Voice and Accountability, Political Stability and Absence of Violence and Terrorism, Government Effectiveness, Regularity Quality, Rule of Law and Control of Corruption. Voice and Accountability has been defined as a measure that captures the perceptions of the extent to which a country’s citizens can participate in selecting their government as well as freedom of expression, freedom of association and a free media. Political Stability and Absence of Violence and Terrorism has been defined as a measure that captures the perceptions of the likelihood of political instability and/or politically motivated violence or terrorism that the government will be destabilized or overthrown by unconstitutional or violent means, including politically motivated violence and terrorism.
The regional political stability index is measured as the unweighted average of the indices per year of all the neighbouring countries, with the exclusion of the country itself. Similarly, regional voice and accountability is calculated. However, we need to note that unlike domestic political stability which has an issue of joint endogeneity with economic growth of the country, regional political stability is an exogenous variable.
ESTIMATION AND RESULTS The dependent variable used in Table 1 is lnPCGDP. To estimate the effects of the explanatory variables on economic growth, we use physical capital expenditure as a percentage of GDP to proxy for physical capital and education expenditure as a percentage of GDP to proxy for human capital and openness (trade-GDP ratio) to measure the influence of international trade in Model 1 to Model 3.

International Journal of Advance and Innovative Research Volume 5, Issue 4 (XII): October - December, 2018
89
ISSN 2394 - 7780
Table-1: Fixed Effect Results of various explanatory variables Variable Model 1 Model 2 Model 3
C 5.24 (0.02)
4.02 (0.01)
4.24 (0.03)
lnPCIY 0.83 (0.03)
0.88 (0.01)
0.56 (0.03)
lnOPEN 0.17 (0.05)
0.15 (0.02)
0.05 (0.33)
lnEDUEXP -0.12 (0.20)
-0.15 (0.11)
-0.01 (0.33)
REGVOI 0.92 (0.02)
REGPOL 0.84 (0.01)
Model Summary 2R 0.817 0.837 0.898
F-statistic 126.3*** 123.87*** 150.07*** Total observations 84 84 84
Source: Author’s calculation
Notes: 1. ***significant at 1% level, ** significant at 5% level, * significant at 10% level. p-values in parentheses are with robust standard errors
2. PCGDP: PPP converted Per capita Gross Domestic Product at 2005 constant prices, PCIY: Investment Share of PPP Converted GDP Per Capita at 2005 constant prices, OPEN: Openness at 2005 constant prices (%),EDUEXP: Education Expenditure as a percentage of GDP, REGPOL: Average Regional Political Stability, REGVOI: Average Regional Voice and Accountability.
When I control for spillover effects of the measures of institutions of neighbouring countries I see that the value of increases markedly in Model 2 and Model 3 from the basic specification in Model 1 of Table 1 lending support to the benefits South Asia can reap from regional integration. The coefficient of physical capital investment expenditure is positive and significant in all regressions. The coefficient of openness is positive and significant in Model 1 and Model 2. Institutions of voice and accountability and political stability in the neighbouring countries have significant positive spillover benefits on PCGDP of the home country (Model 2 and Model 3). However, it is worth mentioning that when the aspect of regional political stability is taken into account in Model 3, the coefficient of openness turns insignificant. The low share of intra-regional trade in South Asia could be the possible reason for the positive but insignificant influence of openness in Model 3. The study thus prescribes that to reap the benefits of regional integration South Asia should pay utmost attention to political stability of the region. Also, it is to be noted that the constant term is positive and significant lending support to the fact that there are many other factors which are not captured by the models.
SOUTH ASIA’S ECONOMIC INTEGRATION AND ITS IMPLICATIONS FOR NORTHEAST INDIA Though openness is observed to have positive and significant influence on PCGDP of South Asia (Model 1 and 2), but share of intra-regional trade in South Asia is meagre. Fig. 1 shows that intra-regional trade in South Asia is much less as compared to that of East and South East Asia. Moreover, sustainable growth requires cooperation within the region on managing shared natural resources and disaster risks. Unfortunately, the regional integration is still elusive in the region. Limited transport connectivity, time-consuming logistics and regulatory impediments, lead to high costs to trade within South Asia than between South Asia and the world’s other regions (Fig.2).
Fig-1: Intra-Regional Trade Fig-2: Global Logistics Performance Index
Source: UNCTAD Source: UNCTAD

International Journal of Advance and Innovative Research Volume 5, Issue 4 (XII): October - December, 2018
90
ISSN 2394 - 7780
EA: East Asia, SA: South Asia, SEA: South East Asia, WA: West Asia. The data are average for the period 1996-2016.
Fig. 3 shows the comparative border compliance procedures in Singapore and the four major countries of South Asia. All the major economies in South Asia fair poorly in border compliance procedures in comparison to Singapore.
The trade complementarity (TC) index provides information on prospects for intra-regional trade. It shows how well the structures of imports and exports of two trading partners match with each other. Its values can be compared with countries that have formed or tried to form similar arrangements in considering the formation of a regional trade agreement. The index takes the value zero when no goods are exported by one country or imported by the other and 100 when the export and import shares exactly match. Fig. 4 shows that export shares of the countries in South Asia do not match as in East and South East Asia though the figures show an increasing trend for South Asia over time. Similar picture is revealed by the Trade Complementarity Index for imports (not reported to save on space).
Fig-3: Border Compliance
Source: UNCTAD
Fig-4: Trade Complementarity Index Fig-5: Diversification Index
Source: UNCTAD Source: UNCTAD
Export diversification is considered to be of prime importance for developing countries which are more dependent on relatively few primary commodities for their export earnings. A country having a perfectly diversified export portfolio will have export diversification index close to zero, whereas a least diversified country which exports only one export will have a value of 1. The above figure 5 shows that exports are less diversified in South Asia as compared to East and South East Asia.

International Journal of Advance and Innovative Research Volume 5, Issue 4 (XII): October - December, 2018
91
ISSN 2394 - 7780
South Asia has not taken full advantage of geographical proximity, familiarity, and lower transport costs, etc. and the accompanying opportunities of regional cooperation as is evident from the above graphical analysis (figure 1 to figure 5). Past conflicts and present tensions continue to hinder regional cooperation, such that the immense potential for regional integration and its subsequent trade, investment, and growth opportunities- remains untapped. Even though regional cooperation was discussed as early as 1947, after slow and incremental steps, the SAARC was established in 1985 to promote welfare which requires active collaboration, and cooperation through economic growth, social progress and economic development of the region. Though trade liberalization has been the mandate for SAARC countries since 1993, but interim trade liberalization rounds under the SAPTA have remained dismal due to limited product coverage and tariff preferences. The signing of SAFTA in 2004 gave a new ray of hope, but has not been very optimistic in the region. South Asia still suffers from prohibitive tariffs and the distinction of having the highest interstate barriers to trade. Moreover, exclusion of services and investment in SAFTA renders the agreement quite limited. Interstate mobility is hampered by visa rules. The poor condition of infrastructure, especially in transport and trade facilitation, and protracted bureaucratic procedures do not help either. Intra-regional trade and investment within region remain meagre. However, this aggregate figure is heavily influenced by the low percentage share of India in intra-regional trade in South Asia. Bangladesh, Bhutan, Nepal and Srilanka have high volume of trade within the region, particularly with India. Exports from India within South Asia have also grown sharply in the last decade.
Within India, the peculiar geography of the Northeast states isolates the region from mainland India due to the location of Bangladesh in-between. This suggests market integration requires trade and transit arrangements with neighbours to benefit all regions that are lagging and isolated from the growth centres. The Asian Development Bank has taken initiative to search for ways and means to stimulate economic cooperation within the ambit of South Asian Sub-regional Cooperation (SASEC) countries. Bangladesh, Bhutan, India and Nepal are the member countries of SASEC. The SASEC countries have identified five sectors, viz. tourism, transport, energy, environment, trade and investment as potential areas of cooperation and collaboration. However, putting in place appropriate institutions and incentives will be central to the success of any such effort and much of it will depend on the efficacy of government policies. To reap the benefits of economic integration, the countries in South Asia should look beyond static comparative advantage theory. Trade and investment policy reforms can be a way forward in this direction.
Since 2010, the SAARC member countries have unanimously acknowledged the importance of improving transport infrastructure and transit facilities, especially for landlocked countries as a means to promote intra-SAARC trade. The present government has taken the initiative to development of the landlocked region through its proactive Act East Policy by improving all-round connectivity through road, railway, telecom, power and waterways sectors. The Government has given green signal to opening up of both road and railway routes to the neighbouring countries. This should enhance economic development of the landlocked region. The Northeast states should take initiative to take full advantage of this by acting as a corridor, thereby also reap spillover benefits of intra-regional trade in South Asia. In its twelfth Five Year Plan (2012¬¬ 2017), the Government of India (GoI) had emphasised connectivity with Northeast India. Border infrastructure development has been a major thrust of SASEC connectivity efforts. The GoI has taken the initiative to develop key Land Customs Stations (LCS) through Integrated Check Post Program (ICP) at priority border crossing points in the SASEC sub-region. Some such LCS deserves mention, namely, Moreh (opposite Tamu in Myanmar) and Changrabandha (opposite Burimari in Bangladesh). The GoI has also provided assistance to states for Infrastructural Development for Promoting Exports scheme (e.g. Panitanki in West Bengal near India-Nepal border and Bolanchopati). Asian Development Bank (ADB 2009) has provided loans for LCS development at Kakaravita in Nepal, Benapole and Burimari in Bangladesh, at Pasakha and Phuentsholing in Bhutan. Agartala land port, locally known as Akhaura checkpoint, is preferred by Bangladesh since they export through here. The land port in Bengal (Benapole) is used mostly by India to export goods to Bangladesh.
CHALLENGES FOR NORTHEAST INDIA Under the Look (Act) East policy, some of the proposed connectivity projects pass through the Northeast states of India. However, this policy encompasses many other issues apart from these connectivity projects, namely, Trilateral Highway, BCIM corridor, etc. The Northeast states have racial and cultural similarities with their bordering East and South East Asian neighbours. But that does not ensure economic development of the region. The large chunk of investment received by the states of Gujarat, Andhra Pradesh, Tamil Nadu and Telengana from the East and South East Asian countries (Pandit 2014; Shira and Associates 2015) make this point more evident. In 2015–16, China, Singapore, and Japan have accepted to invest and provide technical support in building Amaravati, capital city of the residuary state of Andhra Pradesh (Kalavalapalli 2015). It is worth mentioning that these states hardly share any cultural similarity with East and South East Asian countries. As
International Journal of Advance and Innovative Research Volume 5, Issue 4 (XII): October - December, 2018
92
ISSN 2394 - 7780
such, geographical proximity and cultural similarities do not mean much in the age of globalisation. Highway roads and railways are no doubt required for trade and business, but these alone cannot ensure economic development (Raghav 2014; Singh 2011). Good connectivity creates possibility of speedy delivery of goods and services, which reduces transport costs to an extent. But it does not generate demand for the goods and services. There are both pro and cons attached with better connectivity and improved technologies. Better connectivity can promote not only legal trade, but also prop up illegal trade in drugs, small arms, and human trafficking (Williams 2001; Andreas 2002). Though it is simplistic to assume that trade would automatically develop once the proposed highways and railway tracks are constructed, but maintenance of the routes requires not only money and technology, but also adequate security as many of the corridors pass through insurgency prone areas.
CONCLUSION The paper highlights that international trade plays a positive significant role in economic growth of South Asia. However, the importance of intra- regional trade within South Asia is still limited. The paper also throws light on some recent encouraging developments, especially on the Eastern side of South Asia which encompasses the Northeast region; however, there remains a very big unfinished connectivity agenda. Some issues deserve immediate attention, viz., negotiate a Motor Vehicles Agreement (MVA) for the whole of South Asia, address inefficiencies in border crossings to reduce costs and the time required for goods to cross, agree on a framework to address non-tariff barriers. Economic integration and greater cooperation within South Asia can be a reply to some of the hurdles in trade faced by the region. Due to the intermediate geographical location of the Northeast states within South Asia, the Northeast state can act as a catalyst in enhancing economic growth in South Asia. Moreover, it also gives the Northeast states an ample opportunity to reap the benefits of the Act East Policy of India. However, Northeast states cannot enhance their economic growth by merely acting as trade corridor. Rather development of the region by exploiting its natural resources, human capital and pristine natural beauty should be emphasised. The region has the potential to attract private and government investments and become a destination of flourishing tourism industry. While Tripura can exploit its rubber based and natural gas based industries, Assam’s oil and natural gas, tea, coal and limestone, twenty rivers in the state, etc. deserve attention. Mizoram should take initiative for investment in bamboo based industries. Arunachal Pradesh also has a lot to offer for the investors with its bounty of 82 percent forest area and one of the twelve bio-diversity hotspots of the world. Likewise, Manipur’s food processing and sericulture sectors and Meghalaya's huge deposits of limestone can also be tapped by the investors. The unemployment issue of the local people of the region needs immediate attention. Policy makers should focus on effective physical connectivity among the villages, towns, and cities within the peripheral regions and create opportunities for the human capital and exploit the natural resources of the landlocked region. Thus the Northeast states may catalyse the economic integration and cause economic growth of South Asia and enjoy the associated spillover benefits thereof.
REFERENCES Ades, A., and Chua.H.B., (1997), ‘Thy Neighbour’s Curse: Regional Instability and Economic Growth’,
Journal of Economic Growth, 2: 279-304.
Ades, A and Glaeser, E.L.,(1994), ‘Evidence on Growth, Increasing returns and the Extent of the Market’, NBER Working Paper, 4714.
Andreas, P., (2002), ‘Transnational Crime and Economic Globalisation,’ Transnational Organised Crime and International Security: Business as Usual? Mats Berdal and Monica Serrano (eds), Boulder Co: Lynne Rienner Publishers, 37 52.
Asian Development Bank (ADB), (2009), Study on Intraregional Trade and Investment in South Asia. Chapter2: The Role of Trade Facilitation in South Asian Economic Integration. Manila.
Bhattacharjee, J. and Haldar, S.K., (2014), ‘Human Capital, Physical Capital and Openness in two Asian Economies- India and China: A Comparative Analysis Using a VAR Approach,’ International Journal of Applied Economics & Econometrics, 22(1): 109-128.
Bhattacharjee, J. and Haldar, S.K., (2015a), ‘Economic Growth of Selected South Asian Countries: Does Institution Matter?’ Asian Economic and Financial Review, 5(2): 356-370.
Bhattacharjee, J. and Haldar, S.K., (2015b), ‘Economic Growth in South Asia: Binding Constraints for the Future,’ Journal of South Asian Development, Sage Publications, 10(2): 230-249.
Bhattacharjee, J., (2016), ‘Do Institutions Affect Economic Growth? An Empirical Analysis of selected South Asian Countries,’ Asian Journal of Comparative Politics, Sage Publications, DOI: 10.1177/2057891116671833, 1-18.

International Journal of Advance and Innovative Research Volume 5, Issue 4 (XII): October - December, 2018
93
ISSN 2394 - 7780
Bhaumik, S., (2015), ‘Look East through Northeast: Challenges and Prospects for India,’ eSocialSciences.
Chatterjee, S., (2007), ‘Conceptions of Space in India’s Look East Policy Order, Cooperation or Community?’ South Asian Survey, 14(1): 65–81.
Chua, H.B., (1993), ‘Regional Spillovers and Economic Growth’, Centre Discussion Paper, Economic Growth Centre, Yale University, 700.
Datta, H., (2015), ‘Power Sector and Economic Growth of Tripura: A Journey to Success’ J. Bhattacharjee (ed.) Proceedings of National Seminar on Infrastructural Development in India with special reference to North-Eastern States, 11-33.
Debnath, A. and Roy, N., (2012), ‘Testing Spillover Effects of Economic Growth: The Case of India’s Northeastern Region’, IUP Journal of Applied Economics, 11(3): 84-91.
D.Shira and Associates, ‘Gujarat Bags Bulk of Investment from Modi’s China Trip’, 12 June, 2015; viewed on 20 April, 2017, http://www.india-briefing.com/news/gujarat-bags-bulk-investment-modis-china-trip-10830.html/.
Goswami, P.J., (2015), ‘Development of Rail-Road Infrastructure in North-East India,’ in J. Bhattacharjee (ed.) Proceedings of National Seminar on Infrastructural Development in India with special reference to North-Eastern States, 1-10.
Goswami, C., and Saikia, K.K., (2012), ‘FDI and its relation with exports in India, status and prospect in north east region,’ Procedia - Social and Behavioral Sciences, 37: 123 – 132.
Kaufmann,D., Kraay, A., & Mastruzzi, M., (2010), ‘The Worldwide Governance Indicators: A Summary of Methodology, Data and Analytical Issues,’ World Bank Policy Research Working Paper, The World Bank, Washington, DC, 5430.
Kalavalapalli, Y., ‘Japan, Singapore to help develop Andhra Pradesh’s capital Amaravati’, Livemint, 22 October;viewed on 20 April, 2017, http://www.livemint.com/Politics/XCqPBW8IqMEbtvnpcno9KM/Japan-Singapore-to-help-develop-Andhra-Pradeshs-capital-Am.html.
Lal, S.V., and Shalizi, Z., (2003), ‘Location and Growth in the Brazillian Northeast,’ Journal of Regional Science, 43( 4): 663-681.
Moreno, R., and Trehan, B., (1997), ‘Location and Growth of Nations’, Journal of Economic Growth, 399-448.
Nath, M., and Nath, M., (2004), ‘Mapping Northeast on India’s Foreign Policy: Looking Past, Present and Beyond’, The Indian Journal of Political Science, 65(4): 636-652.
Pandit, V., ‘Chinese Cos Plan to invest $1 billion in Gujarat this year,’ 9 June, 2014 viewed on 20 May, 2017, http://www.thehindubusinessline.com/economy/chinese-cos-plan-to-invest-1-bn-in-gujarat-this-year/article6097510.ece.
Raghav, ‘Road Transport Connectivity Pattern and Economic Development in Rajasthan,’ Geographynotes 2014 viewed on 20 April, 2017, http://www.geographynotes.com/articles/road-transport-connectivity-pattern-and-economic-development-in-rajasthan/229.
Shrama, N.L., (2009), ‘India and Regional Integration in South Asia Hope for Greater Asian Cooperation,’. The Indian Journal of Political Science, 70(3): 907-917.
Singh, N.R., ‘Impact of Road Development on the Rural Economy of NE India,’ 1 July, 2011 viewed on 20 thApril,2017,http://epao.net/epPageExtractor.asp?src=features.Impact_of_road_development_on_rural_economy_of_NE_India.html.
Srikanth, H., (2015), ‘Insurgency and Counter Insurgency: Agenda for Peace in India’s Northeast’, Polity and Economy: Agenda for Contemporary Northeast India, C. Joshua Thomas (ed) New Delhi: Regency Publications, 1-39.
Williams, P., (2001), ‘Transnational Criminal Networks. Networks and Netwars: The Future of Terror, Crime and Militancy,’ J.Arquilla and in D. Ronfeldt (eds), Santa Monica, CA: Rand Corporation, 61-98.

International Journal of Advance and Innovative Research Volume 5, Issue 4 (XII): October - December, 2018
94
ISSN 2394 - 7780
IMPACT OF FOOD QUALITY ON CUSTOMER SATISFACTION- WITH SPECIAL REFERENCE OF FAST FOOD RESTAURANTS IN GWALIOR REGION
Swechchha Jain1 and Prof. K. S. Thakur2 Research Scholar1 and Professor2, School of Commerce and Business Studies, Jiwaji University, Gwalior
ABSTRACT The main purpose of this research was to study ‘The Impact of Food Quality on Customer Satisfaction in Gwalior Region’. In today's demanding world, Customer prefers one restaurant over another on the basis of some factors/ variables. The purpose of this study is to know behavior and attitude of the customers and the level of the customer satisfaction, this study provides a better way to understand a customer as well as food quality to improve their facilities. 100 self-designed questionnaires were distributed among customers of Gwalior region. Data collected and tested by SPSS programmed. Regression analysis was used to obtain the important Fast food service dimensions that have the impact on customer satisfaction.
Keywords: Service quality, Customer satisfaction, Employee behavior, Customer perception, Fast food, Customer attitude, Food safety.
INTRODUCTION Today service industry growing rapidly there are number of service industries providing different services to different kind of customers according to their taste and preferences.
Restaurants sector is one of the most important sector for every country, number of customers visit different restaurant for their happiness. Some go for business meeting dinner, while some go for friends and families birthday celebration, festival celebration, and so on, customer who go with number of individuals spend more money in concern restaurant because they want to make their visit in restaurant a remarkable moment, this study is basically conducted for analyzing effect of food quality among customer taste and preferences, those customer who go with their families and with large group of friends in restaurant usually look for quality food, good environment, employees services, and security services. Group of families and friends as a consumer ignore high price of the restaurant because of high quality food and pleasurable environment for their celebration.
Some consumer go restaurant because they are not with their family and homes, they will demand low price food and they will have to sacrifice with employees, security services and food quality. Those consumers who are businessman most of the time like to go restaurant with their families so there is no matter for them to give high price in food quality restaurant.
Customer satisfaction is very important for getting restaurant success if customers are satisfied with food quality restaurant they visit frequently they develop good relationship with that restaurant.
Existing customer’s retention much more important indicator than new customer. Acquiring new customer is important but it is more costly than existing customer retention. Food quality and customer satisfaction in restaurant sector playing an important role for success and survival in today competitive market.
LITERATURE REVIEW In Today’s era restaurant and catering services are needed in many events, celebrations, parties whether it is celebration of birthday, catering for wedding parties, for anniversary and many more events like traditional, cultural, political, social servicing, delicious food is needed for full attraction of the customer in every event. Many services of restaurant worked upon the customers ‘demand that required a lot of passion, stamina and inner strength. Organization business employees should have the ability to work in under pressure to get the success of any restaurant. Firm organization solely depend on its reputation. Quality of food, reputation, references and promises should never be decreased in Restaurants (Zone 2009).
Customer satisfaction level is the core factor to maintain the food quality in restaurants and it is important to marketers and scholars (Rust and Oliver 1994).
Goyal and Singh highlighted the factors which affecting many choices in food restaurant among youth of India they observed that Indian youth given priority to go in restaurant for fun and they were conscious about best services, healthy food and authorized advise, food quality restaurant also focus on quality of food and customer perception .

International Journal of Advance and Innovative Research Volume 5, Issue 4 (XII): October - December, 2018
95
ISSN 2394 - 7780
Several factors are leading the priority for its customer, Core objective of cooperative marketing strategies is to satisfy the customers so that high level of customer loyalty can be maintained(Ryu Et.al 2012) (Suh and Yi 2006).Customer satisfaction can also create trust and mouth publicitypositively (down 1996, Leivowitz 1974, Mincer 1963, Zeithaml, Berry 1987, Linder 1970 and Mabry 1970).
In today’s era most of the restaurant are chosen for different reasons, customer selects the restaurant according to his requirement such as celebration with family, business meeting and some of the customers do not have time to go home and they do not know how to cook food them self then they prefer to go to the restaurant for having food according their choice and requirement (Pedraja and Yazue,j 2001).
Most of the factors of fast food restaurants created preferences for its customer satisfaction, Main objective of fast food restaurant strategies is to satisfy its customer because high level of satisfaction can generate high level of customer loyalty (Ryu.et.al 2012 sub and Yi 2006)
Various variables are there in restaurants to satisfy customers such as price quality, environment, security, and service quality. Customer chooses restaurants for different reasons like family celebration, business meeting and do not have time to go home and cook food them self. According to anthill (2007)Customer price should be analyzed to measure its effort on their purchasing design of quality food due to ethnical diversity increasing reptile counting number of restaurant are also increasing in food sector (Liu and Jang 2009 ) most of the customer observe food quality on the basis of its price, if price of food is high they observe it as high quality and if the price of food is low then they will judge it as inferior quality of food(Lambert 1972 shapiro1968) if the customer have less knowledge about the quality food and services then price along with other factors will be consider as equal determinants to observe the food quality and food service ( French William and chance ).
1. Service Quality Parasuraman, Zeithaml and Berry (1994) Found that service quality is one of the most important findings can be analysed by the difference between customer expectations and actual service experience by customers.(Naik, Gantasala, &Prabhakar, 2010; Yeşilada&Direktör, 2010) said that the difference between customer expectations and actual service experience by customers is an outcome of service quality in fast food restaurants. In dimensions terms, Parasuraman, Berry and Zeithaml (1991, p. 338)said that tangibles, which can be seen easily, concern the physical facilities appearance, materials of personnel and communication, equipment. Reliability is the second dimension which is helpful to perform the promised services accurately and dependably. Responsiveness is the third dimension, which is able to help customers willingly and represent services promptly. Assurance is the fourth dimension, is able to inspire confidence and trust, it represents employee’s courtesy and knowledge. Last dimension is empathy, which is related to the firms which provide individual attention and care to its customers.
2. Restaurant Service Quality This study is conducted basically for the main three dimensions of service quality- employee service, physical environment and food quality (Dutta, Parsa, Parsa, &Bujisic, 2014; Ryu, Lee, Kim, & Woo, 2012). Ryu et al. (2012) found that in the restaurant industry to satisfy the customer needs and wants food quality is a major concern. As an outcome, five dimensions of food quality were selected by Ryu et al. (2012) which are as mentioned, the food is delicious, the food is fresh, the food is nutritious, number of menu items for the customers and smell of the food is enticing.Qin and Prybutok (2009)highlighted the relationship between quality of food, quality of service, value of perception, satisfaction of customer and intentions of behaviour in fast-food restaurants and found that quality of food is affected directly and positively in terms of customer satisfaction.
3. Relationship between Service Quality and Customer Satisfaction Malik (2012) analysed the gap between the expectations of services and perception of services of customers in terms of delivery of services by the four service industries (telecommunications, transport, banking and courier)and measured the impact on customer satisfaction. His results confirmed that service quality is influenced on customer satisfaction positively.Ahmed et al. (2010) measured the positive and significant relationship between four aspects of service quality (Assurance, Responsiveness, Reliability and Tangibles) and satisfaction of customer. In his study, empathy was the fifth aspect which showed the significant but negative relationship with satisfaction of customer.
4. Food Quality These days quality of food is a core aspect of customer satisfaction in fast food restaurants (Nmakung and Jang 2008).Customer prefer to go restaurants mostly in free time and quality is always a core factor of this. Food quality also maintained food safety (Rijswijk and Frewer, 2008).It is very common to say about customers’
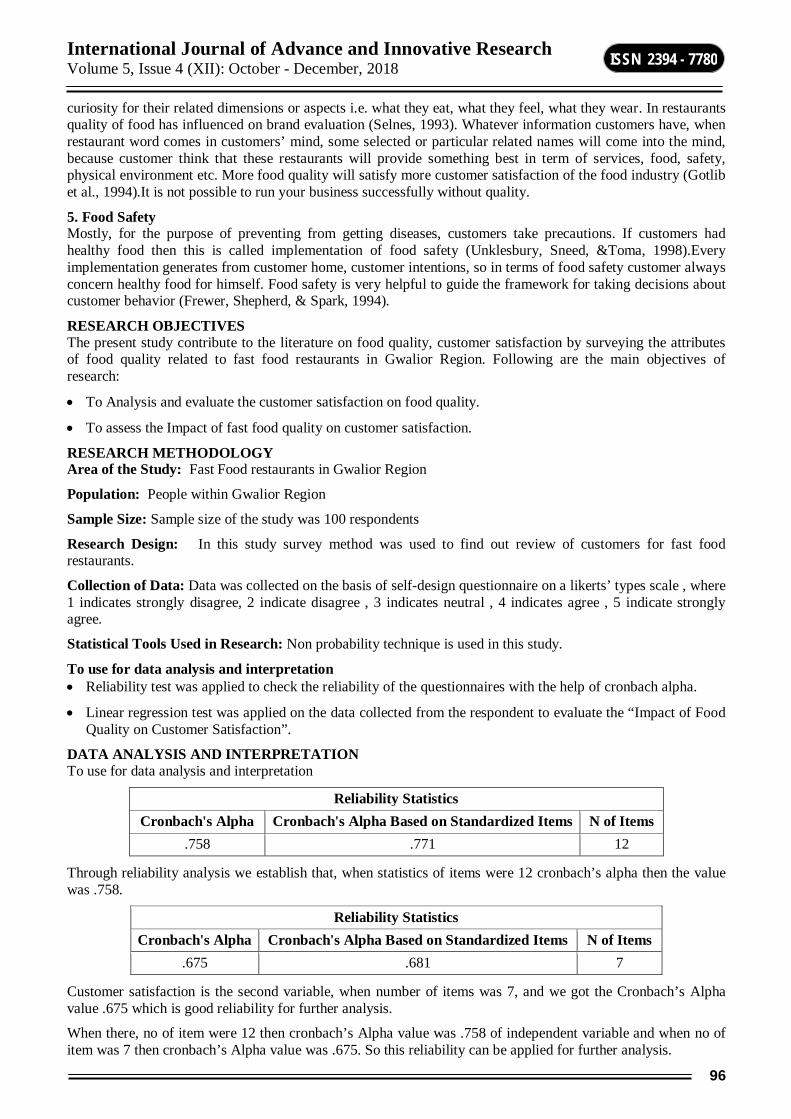
International Journal of Advance and Innovative Research Volume 5, Issue 4 (XII): October - December, 2018
96
ISSN 2394 - 7780
curiosity for their related dimensions or aspects i.e. what they eat, what they feel, what they wear. In restaurants quality of food has influenced on brand evaluation (Selnes, 1993). Whatever information customers have, when restaurant word comes in customers’ mind, some selected or particular related names will come into the mind, because customer think that these restaurants will provide something best in term of services, food, safety, physical environment etc. More food quality will satisfy more customer satisfaction of the food industry (Gotlib et al., 1994).It is not possible to run your business successfully without quality.
5. Food Safety Mostly, for the purpose of preventing from getting diseases, customers take precautions. If customers had healthy food then this is called implementation of food safety (Unklesbury, Sneed, &Toma, 1998).Every implementation generates from customer home, customer intentions, so in terms of food safety customer always concern healthy food for himself. Food safety is very helpful to guide the framework for taking decisions about customer behavior (Frewer, Shepherd, & Spark, 1994).
RESEARCH OBJECTIVES The present study contribute to the literature on food quality, customer satisfaction by surveying the attributes of food quality related to fast food restaurants in Gwalior Region. Following are the main objectives of research:
To Analysis and evaluate the customer satisfaction on food quality.
To assess the Impact of fast food quality on customer satisfaction.
RESEARCH METHODOLOGY Area of the Study: Fast Food restaurants in Gwalior Region
Population: People within Gwalior Region
Sample Size: Sample size of the study was 100 respondents
Research Design: In this study survey method was used to find out review of customers for fast food restaurants.
Collection of Data: Data was collected on the basis of self-design questionnaire on a likerts’ types scale , where 1 indicates strongly disagree, 2 indicate disagree , 3 indicates neutral , 4 indicates agree , 5 indicate strongly agree.
Statistical Tools Used in Research: Non probability technique is used in this study.
To use for data analysis and interpretation Reliability test was applied to check the reliability of the questionnaires with the help of cronbach alpha.
Linear regression test was applied on the data collected from the respondent to evaluate the “Impact of Food Quality on Customer Satisfaction”.
DATA ANALYSIS AND INTERPRETATION To use for data analysis and interpretation
Reliability Statistics Cronbach's Alpha Cronbach's Alpha Based on Standardized Items N of Items
.758 .771 12
Through reliability analysis we establish that, when statistics of items were 12 cronbach’s alpha then the value was .758.
Reliability Statistics Cronbach's Alpha Cronbach's Alpha Based on Standardized Items N of Items
.675 .681 7
Customer satisfaction is the second variable, when number of items was 7, and we got the Cronbach’s Alpha value .675 which is good reliability for further analysis.
When there, no of item were 12 then cronbach’s Alpha value was .758 of independent variable and when no of item was 7 then cronbach’s Alpha value was .675. So this reliability can be applied for further analysis.

International Journal of Advance and Innovative Research Volume 5, Issue 4 (XII): October - December, 2018
97
ISSN 2394 - 7780
Variables Entered/Removedb Model Variables Entered Variables Removed Method
1 VAR00001a . Enter a. All requested variables entered. b. Dependent Variable: VAR00002
Model Summary Model R R Square Adjusted R Square Std. Error of the Estimate
1 .194a .037 .021 4.90445 a. Predictors: (Constant), VAR00001
R square value (.194) suggests that 19.4% in Customer Satisfaction can be explained with the help of Food Quality.
ANOVAb Model Sum of Squares df Mean Square F Sig.
1 Regression 53.349 1 53.349 2.218 .142a Residual 1371.058 57 24.054
Total 1424.407 58 a. Predictors: (Constant), VAR00001 b. Dependent Variable: VAR00002
F value is 2.218 at significant level .142 that means model is not appropriate for further analysis.
Coefficientsa
Model Unstandardized Coefficients Standardized Coefficients
t Sig. B Std. Error Beta 1 (Constant) 29.019 4.474 6.486 .000
VAR00001 -.156 .105 -.194 -1.489 .142 a. Dependent Variable: VAR00002 Regression Equation is Y= a+bx Y= 29.019+ (-.194)x Y is Customer Satisfaction (dependent variable) and x is a food quality (independent Variables) T value -1.489 at significant level .142 that means null hypothesis is accepted which was there is no impact of food quality on customer satisfaction and this model implies that independent variable that is food quality is making no impact on customer satisfaction which is dependent variable.
FINDINGS OF THE RESEARCH Most of the customers was satisfied with the taste and quality of fast food.
They prefer to go Restaurants mostly with their families and enjoy different types of cuisines in fast food Restaurants at Gwalior Region,
At present scenario, Most of the Fast Food Restaurants targeting children, teenagers, and young adults, because taste and quality of fast food influenced very easily to these kind of customers.
CONCLUSION OF THE STUDY After studying and analyzing the questionnaire of customers in Gwalior, We have concluded that not every customer is satisfied with the food quality of Gwalior restaurant but most of the people were satisfied with the quality served. Families in Gwalior prefer to go restaurants on some event or on weekends.

International Journal of Advance and Innovative Research Volume 5, Issue 4 (XII): October - December, 2018
98
ISSN 2394 - 7780
Now people are more regular to restaurant and they enjoy different type of cuisines offered because of that there is huge competition in market, more and more restaurants are opening up in Gwalior with different features. Fast food advertisement increasing with time, and set a goal to target our children, teenagers and young adults. The purpose is to persuade the community on consuming fast food on a daily basis without knowing the risks. However not all fast food advertisements are real nor honest.
RECOMMENDATIONS Market should be studied before laying out any plan for the customers in the market, because customers can
be attracted when product plan is available for them accordingly.
These days, for having any food customers concern about Hygiene, temperature and cleanliness of the Restaurants.
Before facilitating any food to the customers Restaurants should understand the need of them.
Restaurants should check on competitors in the present market continuously.
There should be a proper allocation of resources and finance in the fast food restaurants so that customers can be satisfied conveniently.
Time to time, with changes need of the customers, Fast food restaurants should update the product features (Adding Cuisine).
To satisfy the customers, Restaurants should have efficient manpower to serve the customers.
There should be fresh fast food in the restaurants, with the view of this customers may trust easily on those restaurants which are providing fresh food to them.
Fast Food restaurants should take a feedback from their customers so that restaurants can improve its weak points.
LIMITATIONS OF THE STUDY Lack of knowledge and understanding of customers
Understanding the types of questions
Small sample size
Different nature of customer
Different types and features of restaurant in Gwalior
Money constraint (Buying capacity)
Limited Resources
FUTURE POSSIBILITIES IN RESEARCH Fast food advertising will continue affecting our communities and increasing their set goals on children, it is best to inform and opt for a healthier meal, made at home or balanced well. The food was originally related to the overseas counter parts and also to the local tradition.
Consequently, customers’ living standard will improve in the open market and customers improve their knowledge towards the changes in the environment and the society as well. Moreover, the GDP grew and so did the customers’ spending in the market. The availability of fast food stores soon will become popular in the markets and thereafter, the market entry of international fast food retailers such as McDonald’s, KFC, Pizza Hut and Dominos increased the competition as well as awareness in the market. As the size of market grew, the customer behavior gradually turned to adopt the fast food in the daily life of them.
REFERENCES 1. Ahmad, Z., Ahmed, I., Nawaz, M., Shaukat, M., & Ahmad, N. (2010). Impact of Service Quality of
ShortMessaging Service on Customers Retention; An Empirical Study of Cellular Companies of Pakistan.International Journal of Business and Management, 5(6), 154-160.
2. Ahmed, I., Nawaz, M., Usman, A., Shaukat, M., Ahmed, N., &Wasim-ul-Rehman. (2010). a Mediation of Customer Satisfaction Relationship between Service Quality and Repurchase Intentions for the Telecom Sector in Pakistan: A Case Study of University Students. African Journal of Business Management, 4(16), 3457-3462

International Journal of Advance and Innovative Research Volume 5, Issue 4 (XII): October - December, 2018
99
ISSN 2394 - 7780
3. Anselmsson, J., & Johansson, U. (2014). A Comparison of Customer Perceived Service Quality in Discount VersusTraditional Grocery Stores: An Examination of Service Quality Measurement Scales in a Swedish Context.International Journal of Quality and Service Sciences, 6(4), 369-386.
4. Danesh, S., Nasab, S., & Ling, K. (2012). The Study of Customer Satisfaction, Customer Trust and SwitchingBarriers on Customer Retention in Malaysia Hypermarkets. International Journal of Business andManagement, 7(7), 141-150.
5. Dutta, K., Parsa, H. G., Parsa, A. R., &Bujisic, M. (2014). Change in Consumer Patronage and Willingness to Pay at Different Levels of Service Attributes in Restaurants: A Study from India. Journal of Quality Assurance inHospitality and Tourism, 15(2), 149-174. http://dx.doi.org/10.1080/1528008X.2014.889533
6. Malik, S. (2012). Customer Satisfaction, Perceived Service Quality and Mediating Role of Perceived Value. International Journal of Marketing Studies, 4(1), 68-76. http://dx.doi.org/10.5539/ijms.v4n1p68
7. Naik, C. N., Gantasala, S. B., &Prabhakar, G. V. (2010). Service Quality (Servqual) and Its Effect on Customer Satisfaction in Retailing. European Journal of Social Sciences, 16(2), 239-251
8. Namkung, Y., & Jang, S. (2007). Does food quality really matter in restaurants? Its impact on customer satisfaction and behavioral intentions. Journal of Hospitality & Tourism Research, 31(3), 387–409. doi:10.1177/1096348007299924
9. Parasuraman, A., Berry, L., &Zeithaml, V. (1991). Perceived Service Quality as A Customer-Based Performance Measure: An Empirical Examination of Organizational Barriers Using An Extended Service Quality Model. Human Resource Management, 30(3), 335-364. http://dx.doi.org/10.1002/hrm.3930300304
10. Parasuraman, A., Zeithaml, V., & Berry, L. (1994). Alternative Scales for Measuring Service Quality: A Comparative Assessment Based on Psychometric and Diagnostic Criteria. Journal of Retailing, 70(3), 201-230. http://dx.doi.org/10.1016/0022-4359(94)90033-7
11. Pedraja, M., and Yague, J., (2001). What information do customers choose when selecting a restaurant? International journal of contemporary Hospitality management, 13(6), 316-318.
12. Qin, H., &Prybutok, V. R. (2009). Service Quality, Customer Satisfaction, and Behavioral Intentions in Fast-Food Restaurants. International Journal of Quality and Service Sciences, 1(1), 78-95. http://dx.doi.org/10.1108/17566690910945886
13. Rust, R. T., & Oliver, R. L. (1994). Service quality: Insights and managerial implications from the frontier, Sage, Thousand Oaks, CA.
14. Ryu, K., Lee, H-R., and Kim, G.W., (2012).The influence of the quality of the physical environment, food, and service on restaurant image, customer perceived value, customer satisfaction, and behavioural intentions. International Journal of Contemporary Hospitality Management, 24(2), 200-223.
15. Ryu, K., Lee, H. K., & Woo, G. (2012). The Influence of the Quality of the Physical Environment, Food, and Service on Restaurant Image, Customer Perceived Value, Customer Satisfaction, and Behavioral Intentions. International Journal of Contemporary Hospitality Management, 24(2), 200-223. http://dx.doi.org/10.1108/09596111211206141
16. Wettstein, N., Hanf, J. H., &Burggraf, C. (2011). Unshakable Loyalty in the Food Sector: Sustainable CustomerRetention. Empirical Study of Organic Food Consumers in Germany. Journal of Consumer Protection andFood Safety, 6(3), 359-365.
17. Zeithaml, A.V., (1988) Consumer perceptions of price, quality and value: a means-end model and synthesis of evidence. Journal of marketing, 52, 2-22.

International Journal of Advance and Innovative Research Volume 5, Issue 4 (XII): October - December, 2018
100
ISSN 2394 - 7780
CONTROL OF DFIG WIND POWER GENERATORS IN UNBALANCED MICROGRIDS BASED ON INSTANTANEOUS POWER THEORY
M. Deepakrishnan1 and S. M. Shangavi2 PG Scholar1 and Assistant Professor2, Department of Electrical and Electronics Engineering, Sir Issac Newton
College of Engineering and Technology, Pappakoil, Nagapattinam, Tamilnadu
ABSTRACT This paper proposes a new control technique for a doubly-fed induction generator (DFIG) based on instantaneous power theory. The proposed control loop converts the instantaneous real/reactive power components into system state variables. Also the controllers use the rotor-side converter for mitigating the torque and reactive power oscillations.
The control scheme also uses the grid-side converter for partial compensation of unbalanced stator voltage. The main features of the proposed control method are its feedback variables are independent of reference frame transformations and it does not require sequential decomposition of current components. These features simplify the structure of required controllers under an unbalanced voltage condition and inherently improve the robustness of the controllers. The performance of the proposed strategy in reducing torque ripples and unbalanced stator voltage is investigated based on the time-domain simulation of a DFIG study system under unbalanced grid voltage. The simulation of modelling and controlling is done using MATLAB/SIMULINK and the waveforms are plotted.
1. INTRODUCTION Energy of wind is the most accessible and exploitable types of renewable vitality. Because of rapidly need for electrical energy and exhaustion of fossil fuels, for example, coal and oil, whose stores are restricted, this issues drove researchers to create another source of energy for era of power. The most reluctant source which fulfills non-contamination, accessible in wealth, less expensive to tackle both in low-scale and high-scale frameworks is wind. For variable speed range, power can be supplied to grid by controlling rotor power from a variable frequency source for slip-ring induction machine. The bidirectional flow of power from rotor of the induction machine can be done by connecting ac/dc/ac converters across the rotor. This type of system is called Doubly-Fed Induction Generator (DFIG) where power flows bi-directionally. A comprehensive study on the latest grid code regulations enforced by transmission system operators on large wind power plants (WPPs). First, the most common requirements included in the majority of international grid codes are compared; namely, low and high voltage ride-through capabilities, active and reactive power responses during and after faults, extended range of voltage–frequency variations, active power (frequency) control facility, and reactive power (voltage) regulation support. The paper also presents a discussion on the global harmonization of international grid codes as well as future trends expected in the regulations. Finally, the evolution of different wind generator technologies to fulfill various grid code requirements is investigated. The presented study will assist system operators to establish their connection requirements for the first time or to compare their existing regulations with other operators. It also enables wind turbine manufacturers and wind farm developers to obtain a more precise understanding from the latest international requirements imposed on modern wind farms [8]. Power production from wind turbines has increased considerably during the last decade. Therefore today's wind turbines, which are typically set up in wind farms, have a significant influence on the operation of power systems. The efficient and secure operation of power systems is supported by grid codes, which are sets of requirements for all network users (suppliers, customers, etc.). In Europe, several transmission network operators have introduced special grid connection requirements for wind farms. These requirements are mainly based on existing grid codes, initially written for conventional power plants usually equipped with synchronous generators. This article presents a comparison of grid connection requirements for wind farms issued, or proposed as a draft, by transmission network operators in Denmark, Sweden, Germany, Scotland and Ireland [5]. To dynamically reduce voltage unbalance (VU) along low voltage distribution feeders, a distributed intelligent residential load transfer scheme is proposed. In this scheme, residential loads are transferred from one phase to another to minimize VU along the feeder. The central controller, installed at the distribution transformer, observes the power consumption in each house and determines the house(s) to be transferred from an initially connected phase to another. The transfer is carried out by the help of a static transfer switch, with a three-phase input and a single-phase output connection, through which each house is supplied. The steady-state and dynamic performances of the proposed load transfer scheme are investigated by MATLAB analyses and PSCAD/EMTDC simulations [6]. Voltage unbalance or sag conditions generated by the line excitation can cause the input rectifier stage of an adjustable-speed drive (ASD) to enter single-phase rectifier operation. This

International Journal of Advance and Innovative Research Volume 5, Issue 4 (XII): October - December, 2018
101
ISSN 2394 - 7780
degradation of the input power quality can have a significant negative impact on the induction-machine performance characteristics. This paper provides an approximate closed-form analysis of the impact of line-voltage sags and unbalance on the induction-machine phase voltages, currents, and torque pulsations for a general-purpose ASD consisting of a three-phase diode bridge rectifier, a dc link, and a pulse width modulation (PWM) inverter delivering constant volts-per-hertz excitation. Attention is focused on the impact of the dominant second harmonic of the line frequency, which appears in the dc link voltage during the sag/unbalance conditions, neglecting the impact of the other higher order harmonics. In addition to the closed-form analytical results that assume constant rotor speed, both simulation and experimental results are presented, which confirm the key analytical results, including the dominance of the second harmonic in the resulting torque pulsations. The analytical results can be used as a valuable design tool to rapidly evaluate the approximate impact of unbalance/sag conditions on ASD machine performance [16].
2. MODELLING OF DOUBLY FED INDUCTION GENERATOR 2.1 Transformation of ABC to DQ0 reference Changes of variables are utilized for the analysis of ac machines to remove time-differing inductances; changes of variables are additionally utilized in the analysis of different static, consistent parameter power-system segments connected with electric drives.
Fig-2.1: ABC to dqo reference frame
The foundation of the vector control procedure is d-q axis theory and its study is vital for vector control analysis. dq0 or direct-quadrature-zero change is utilized to improve the analysis of three phase circuits, here three AC quantities are changed into two DC quantities which are done in light of the imaginary DC quantities and the AC quantities are again recovered by taking an reverse change of the DC quantities. It tackles the issue of AC parameters changing with time.
The orthogonally placed balanced windings are known as d- and q- windings which are dealt with as stationary or moving in respect to the stator. In the stationary edge of reference, the d-q axis are viewed as fixed on the stator, with either d or q axis corresponding with the a-phases axis of the stator. In the rotating frame, the rotating d-q axis is considered either fixed on the rotor or made to move at the synchronous speed. Park’s transformation considers a frame of reference on the rotor. The scientist Parks gave this for a synchronous machine which is the same as a synchronous frame of reference. For induction motors, it is necessary to distinguish between a synchronous reference frame and a reference frame on the rotor. In fig. the projection of the a-b-c currents as having sinusoidal variation in time along their respective axes (a space vector!), is seen. The picture illustrates for the a-phase. Similarly, b-phase currents and the c-phase currents are decomposed along dq-axis , and on adding them up, it gives:
(2.1)
(2.2)
Here kq and kd are constants.
As here 3 variables ia, ib, and ic are transformed into two variables id and iq, this gives an undetermined system. i.e. the transformation ia, ib, and ic to id and iq is unique while transformation id and iq to ia, ib, and ic is not unique. Hence we need a third current the zero sequence current which is given as:
(2.3)
In matrix form these equations can be written as:

International Journal of Advance and Innovative Research Volume 5, Issue 4 (XII): October - December, 2018
102
ISSN 2394 - 7780
= (2.4)
The constants k0, kq, and kd are selected as 1/3, 2/3, and 2/3, respectively, which results the magnitude of the d-q quantities to be equal to that of the three-phase quantities. Some author uses its different values such as according to Anderson & Fouad use k0=1/√3, kd=kq=√(2/3).
Finally the abc to dq0 transformation is expressed as:
= (2.5)
Fdqo = T*Fabc (2.6)
Where,
T = (2.7)
Thus the dq0 to abc transformation is expressed as:
Fabc = T-1*Fdqo (2.8)
Where,
T-1 = (2.9)
2.2 Modelling of DFIG wind energy systems: The DFIG consists of a rotor-side converter (RSC) and a Grid side converter (GSC) . Rotor-side converter (RSC) changes the speed of induction generator and a Grid side converter (GSC) injects reactive power to system via converter ,using passive sign convention instantaneous active and reactive power of the grid side converter are pg(t) and qg(t) , and it is given as:
= (2.10)
Where, vsd,sq = dq component of stator voltage in the synchronous reference frame and igd,gq are dq component of grid side current changed to synchronous reference frame.
Fig-2.2: Schematic Diagram for DFIG based Wind Generation system
From equation (3.10), on solving grid side current (GSC) igd and igq are given as
= Kv (2.11)
Where,
Kv = and (2.12)

International Journal of Advance and Innovative Research Volume 5, Issue 4 (XII): October - December, 2018
103
ISSN 2394 - 7780
= (2.13)
Similarly, the instantaneous real power, ps(t) and reactive power, qs(t) components of Doubly Fed Induction Generator (DFIG) is:
= (2.14)
From this the stator current isd and isq are calculated as:
= -Kv (2.15)
The negative sign in (3.15) goes as DFIG is offering supply to grid.
2.3 Modelling of DFIG using power components: The stator and rotor, flux and voltage equations of a DFIG in the stator voltage in synchronous reference frame are given as:
(2.16)
(2.17)
(2.18)
(2.19)
Where,
rs= stator resistance; rr=rotor resistance; ‘s’ and ‘r’ stands for the stator and rotor variable respectively.
Ls= stator inductance; Lm=magnetizing inductance; Lr=rotor inductances; ωr= rotor speed of the induction machine; ωsl=slip frequency; ωsl = ωe – ωr; vsdq = stator voltage in dq reference frame; vsdq = vsd + jvsq
vrdq = rotor voltage in dq reference frame; vrdq = vrd + jvrq; isdq = stator current in dq reference frame
isdq = isd + jisq; irdq = rotor current in dq reference frame; irdq = ird + jirq; sdq = stator flux in dq reference frame
φsdq = φsd + jφsq; rdq = rotor flux in dq reference frame; φrdq = φrd + jφrq
Now, To get a model of DFIG using active and reactive power, the rotor current will be from equation (2.19) as:
(2.20)
and from equation (3.19) and (3.20), rotor flux is given as:
(2.21)
Where,
(2.22)
Now, by substituting irdq from equation (2.19) in equation (2.18) and then solving equation (2.17) and (2.18) for isdq, we get:
(2.23)
From equation (2.16), substituting isd, isq components of isdq in equation (2.23) and solve it in term of ps and qs :
= g1ps – ωslqs – g4φsd – g5φsq + urd (2.24)
= ωslps +g1qs – g5φsd + g4φsq + urq (2.25)
Where,
urd = g2vrd + g3vrq – (2.26)
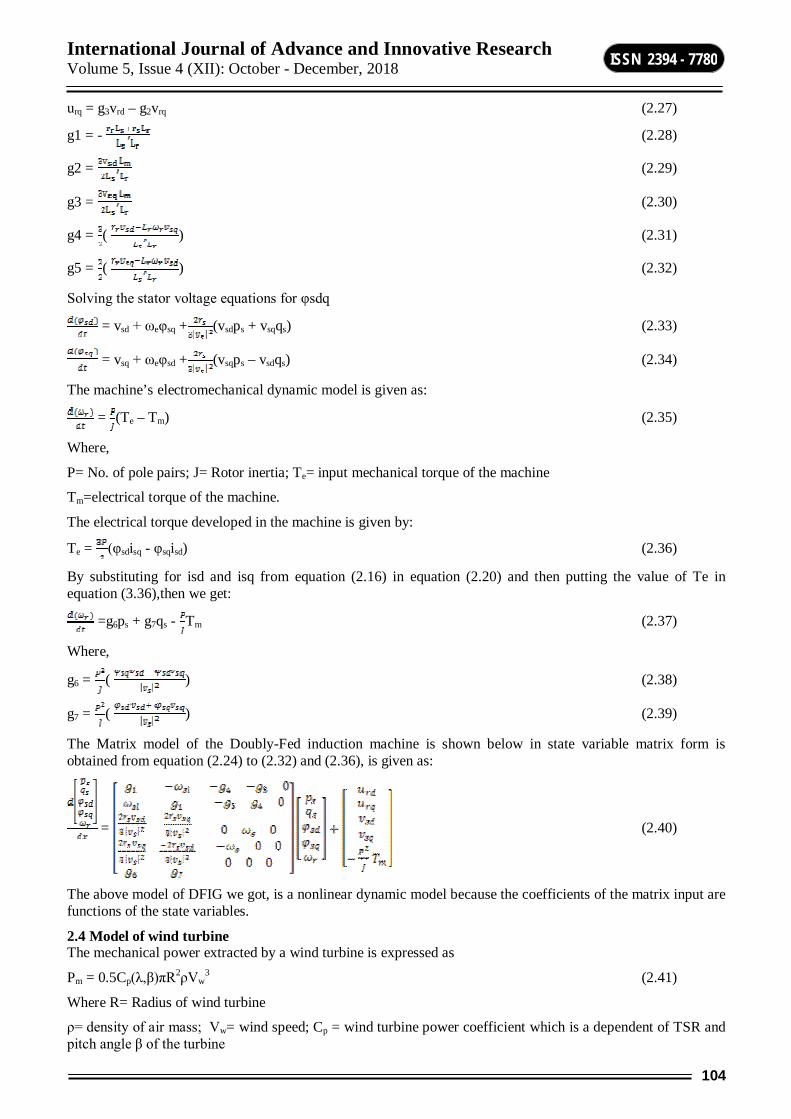
International Journal of Advance and Innovative Research Volume 5, Issue 4 (XII): October - December, 2018
104
ISSN 2394 - 7780
urq = g3vrd – g2vrq (2.27)
g1 = - (2.28)
g2 = (2.29)
g3 = (2.30)
g4 = ( ) (2.31)
g5 = ( ) (2.32)
Solving the stator voltage equations for φsdq
= vsd + ωeφsq + (vsdps + vsqqs) (2.33)
= vsq + ωeφsd + (vsqps – vsdqs) (2.34)
The machine’s electromechanical dynamic model is given as:
= (Te – Tm) (2.35)
Where,
P= No. of pole pairs; J= Rotor inertia; Te= input mechanical torque of the machine
Tm=electrical torque of the machine.
The electrical torque developed in the machine is given by:
Te = (φsdisq - φsqisd) (2.36)
By substituting for isd and isq from equation (2.16) in equation (2.20) and then putting the value of Te in equation (3.36),then we get:
=g6ps + g7qs - Tm (2.37)
Where,
g6 = ( ) (2.38)
g7 = ( ) (2.39)
The Matrix model of the Doubly-Fed induction machine is shown below in state variable matrix form is obtained from equation (2.24) to (2.32) and (2.36), is given as:
= (2.40)
The above model of DFIG we got, is a nonlinear dynamic model because the coefficients of the matrix input are functions of the state variables.
2.4 Model of wind turbine The mechanical power extracted by a wind turbine is expressed as
Pm = 0.5Cp(λ,β)πR2ρVw3 (2.41)
Where R= Radius of wind turbine
ρ= density of air mass; Vw= wind speed; Cp = wind turbine power coefficient which is a dependent of TSR and pitch angle β of the turbine

International Journal of Advance and Innovative Research Volume 5, Issue 4 (XII): October - December, 2018
105
ISSN 2394 - 7780
Tip speed ratio (λ) =
Power output coefficient Cp is related to of tip speed ratio (TSR) and pitch angle β of the wind turbine blade as the following expression:
Cp(λ,β) = C1( (2.42)
Where,
(2.43)
From experimentally it is found that
C1 = 0.5176, C2 = 116, C3 = 0.4, C4 = 5, C5 = 21and C6 = 0.0068.
For a high-rating wind turbine, the maximum mechanical power extracted at optimum values of TSR λopt in range of 5 to 8. It is shown that Cp<0.6 and the maximum value of Cp is 0.5926 which is Betz limit. Practically for an optimum value of TSR, power coefficient Cp is considered about 0.51 for high-rating wind turbines system.
3. SIMULATION RESULTS & ITS DISCUSSION The system includes a 1.5 MW DFIG wind turbine-generator connected to a weak grid including an unbalanced load. The electrical and mechanical parameters of the turbine generator are summarized in Table 3.1.
PARAMETERS VALUES Rated Power 1.5 MW
Rated Voltage 575 V System Frequency 50 Hz Rated Wind Speed 12 m/s Stator Resistance 0.023 pu Rotor Resistance 0.016 pu
Stator Leakage Inductance 0.18 pu Rotor Leakage Inductance 0.16 pu Magnetization Inductance 2.9 pu
Number of Poles 6 Lumped Inertia Constant 0.685 s
Table-3.1: Study System Parameters and Data
The Simulink diagram for the DFIG circuit is given below:
Fig-3.1: Simulink diagram for DFIG

International Journal of Advance and Innovative Research Volume 5, Issue 4 (XII): October - December, 2018
106
ISSN 2394 - 7780
The internal diagram for DFIG is given as
Fig-3.2: Circuit diagram for DFIG setup
In this, RSC and GSC are connected with rotor and stator of the induction machine respectively in order to for Doubly Fed Induction Generator (DFIG). For both converters, there is individual control circuit which is shown below:
The Simulink diagram for RSC controller is given below
Fig-3.3: Simulink diagram for proposed RSC controller

International Journal of Advance and Innovative Research Volume 5, Issue 4 (XII): October - December, 2018
107
ISSN 2394 - 7780
The Simulink diagram for GSC control is given below:
Fig-3.4: Simulink diagram for proposed GSC controller
The reactive power reference is varied from time to time as given in the following table
Time(s) Reactive Power Reference(pu) 0 -0.35 6 -0.15
13 +0.15 Table-3.2: Reactive Power Control Data
The speed of the wind turbine is maintained as constant 12m/s and the real power reference is 0.8 pu.
The stator voltage and current of DFIG is shown below
Fig-3.5: Stator voltage and current of DFIG

International Journal of Advance and Innovative Research Volume 5, Issue 4 (XII): October - December, 2018
108
ISSN 2394 - 7780
The dc voltage, rotor speed, real and reactive power graph for conventional control and proposed control is shown below
Fig-3.6.1: DC voltage, Rotor Speed, Real and Reactive power graph for conventional controller
Fig-3.6.2: DC voltage, Rotor Speed, Real and Reactive power graph for proposed controller
In the above graphs, the reactive power is changed from -0.35pu to -0.15pu at t=6s and then to 0.15pu at t=13s. With conventional controller, the reactive power need more time to settle (at least 4s) than with that of proposed controller (0.5s). And also the ripple content is much reduced for proposed controller than that of conventional controller.
The magnitude of the stator and rotor current and Electromagnetic torque is shown in the following graph:
Fig-3.7.1: Magnitude of the stator and rotor current and Electromagnetic torque graph for conventional controller

International Journal of Advance and Innovative Research Volume 5, Issue 4 (XII): October - December, 2018
109
ISSN 2394 - 7780
Fig-3.7.2: Magnitude of the stator and rotor current and Electromagnetic torque graph for proposed controller
In the above graphs, the ripple content in stator current is much reduced for proposed controller (less than 0.05pu) than that of conventional controller (0.1pu) and for rotor current, the ripple content for proposed controller is less than 0.05pu and for conventional controller, it is around 0.2pu.
In order to check the robustness of the controller, the stator inductance is changed to 80% of its nominal value. The real and reactive power graph for the above mentioned change is shown below:
Fig-3.8: Real and Reactive power with 80% Reduction in Inductance condition
And also the real power reference is changed from 0.8pu to 0.45pu at t=15s. The real and reactive power graph for the above mentioned change is shown below:
Fig-3.9: Real and Reactive power with real power reference reduction condition
CONCLUSION An unbalanced control scheme for a DFIG wind turbine generator has been presented in this paper which does not require the sequential decomposition of the DFIG stator/rotor currents and is less sensitive to the system parameters. This control scheme mitigates the stator reactive power and torque pulsations which obviously appear in any balanced control scheme under an unbalanced grid voltage condition. The control method uses the grid-side converter to partially compensate the unbalance stator voltage when the wind speed is low and turbine works below nominal power.

International Journal of Advance and Innovative Research Volume 5, Issue 4 (XII): October - December, 2018
110
ISSN 2394 - 7780
It has been shown that proposed control approach based on its simple and robust structure can offer a promising solution for DFIG control under unbalanced grid voltage conditions. The forthcoming scope of this work can be further tested with Distribution networks where the DFIG with proposed control is proved as capable of acting as Distribution Generation unit.
Also we can replace PR controllers with fuzzy logic control which will lead to superior performance under transient load conditions.
REFERENCES 1. Abad, M. A. Rodriguez, G. Iwanski, and J. Poza (2010) ‘Direct power control of doubly-fed-induction-
generator-based wind turbines under unbalanced grid voltage’, IEEE Trans. Power Electron., vol. 25, no. 2, pp. 442–452.
2. Alonso-Martinez, J. Eloy-Garcia, D. Santos-Martin, and S. Arnaltes (2013) ‘A new variable-frequency optimal direct power control algorithm’, IEEE Trans. Ind. Electron., vol. 60, no. 4, pp. 1442–1451.
3. Hu and Y. He (2011) ‘DFIG wind generation systems operating with limited converter rating considered under unbalanced network conditions—Analysis and control design’, Renew. Energy, vol. 36, no. 2, pp. 829–847.
4. Hamzeh, H. Karimi, and H. Mokhtari (2014) ‘Harmonic and negative sequence current control in an islanded multi-bus MV microgrid’, IEEE Trans. Smart Grid, vol. 5, no. 1, pp. 167–176.
5. Jauch, J. Matevosyan, T. Ackermann, and S. Bolik (2005) ‘International comparison of requirements for connection of wind turbines to power systems’, Wind Energy, vol. 8, no. 3, pp. 295–306.
6. Lee, T. M. Jahns, W. E. Berkopec, and T. A. Lipo (2006) ‘Closed form analysis of adjustable-speed drive performance under input-voltage unbalance and sag conditions’, IEEE Trans. Ind. Appl., vol. 42, no. 3,pp. 733–741.
7. Liu, F. Blaabjerg, W. Chen, and D. Xu (2012) ‘Stator current harmonic control with resonant controller for doubly fed induction generator’, IEEE Trans. Power Electron., vol. 27, no. 7, pp. 3207–3220.
8. Mohseni .M and S. M. Islam (2012), “Review of international grid codes for wind power integration: Diversity, technology and a case for global standard,” Renew. Sustain. Energy Rev., vol. 16, no. 6, pp. 3876–3890.
9. Nasr-Azadani, C. A. Cañizares, D. E. Olivares, and K. Bhattacharya (2014) ‘Stability analysis of unbalanced distribution systems with synchronous machine and DFIG based distributed generators’, IEEE Trans. Smart Grid, vol. 5, no. 5, pp. 2326–2338.
10. Nian, Y. Song, P. Zhou, and Y. He (2011) ‘Improved direct power control of a wind turbine driven doubly fed induction generator during transient grid voltage unbalance’, IEEE Trans. Energy Converts., vol. 26, no. 3, pp. 976–986.
11. Patel M. R. (2006), Wind and Solar Power Systems: Design, Analysis, and Operation. Boca Raton, FL, USA: CRC Press.
12. Savaghebi M, A. Jalilian, J. C. Vasquez, and J. M. Guerrero (2012), ‘Secondary control scheme for voltage unbalance compensation in an islanded droop-controlled micro grid’, IEEE Trans. Smart Grid, vol. 3, no. 2,pp. 797–806.
13. Xu H, J. Hu, and Y. He (2012) ‘Integrated modeling and enhanced control of DFIG under unbalanced and distorted grid voltage conditions’, IEEE Trans. Energy Convers., vol. 27, no. 3, pp. 725–736.
14. Xu L and Y. Wang (2007) ‘Dynamic modeling and control of DFIG-based wind turbines under unbalanced network conditions’, IEEE Trans. Power Syst., vol. 22, no. 1, pp. 314–323.
15. Zhou, Y. He, and D. Sun (2009) ‘Improved direct power control of a DFIG-based wind turbine during network unbalance’, IEEE Trans. Power Electron., vol. 24, no. 11, pp. 2465–2474.
16. F. Shahnia, P. J. Wolfs, and A. Ghosh (2014), proposed “Voltage unbalance reduction in low voltage feeders by dynamic switching of residential customers among three phases”.

International Journal of Advance and Innovative Research Volume 5, Issue 4 (XII): October - December, 2018
111
ISSN 2394 - 7780
HR EDUCATION AND CORPORATE EXPECTATIONS: A PARADIGM SHIFT IN CONTENT, APPROACH AND METHODOLOGY
Urs Gururaj B1 and Bagali M M2
Professor1, Acharya Institutes, Bangalore Professor2, Acharya Institute of Technology, Bangalore
ABSTRACT This paper is an attempt to understand the significance of HR education in India for its structured revision. Management education in India, has reached a phase where there are umpteen number of differentials & integrals, which in turn create multiple scenarios; some of these issues are growth oriented on one hand and chaotic, negatively connatated on the other. Thus, creating many an unwarranted situation for all the stakeholders. The University structure of traditional procedure of imparting management education and in turn training tomorrow’s business leaders has been rendered redundant. In some cases, it addresses the requirements, but on macro level, this calls for a relook. The process of privatization and globalization demands drastic changes in the traditional teaching learning approach, but also stress a need for introduction of new age employability based knowledge, skill sets and attitudes, which have more economic value. This paper tries to explore the current issues of HR management education of B-schools in India, especially based on the HR students perspective. A questionnaire has been developed and used to collect the data from the HR students. A total of around 238 students studying in twenty-three institutions, as in State Universities, Central University, Technical University, National Institute of Technology, Private University and Autonomous Institutions were covered throughout the state of Karnataka. The data was analyzed using statistical tools such as Frequency & Percentage, Coefficient of Correlation and Chi Square. The results have been analyzed and discussed based on appropriate hypothesis. There exists a critical and crucial requirement to shape the HR education in accordance with the changes at the national & international levels of both the industry and the academia to bring about effective competitiveness and sustained employability amongst the work force in India in the near future.
Keywords: HR education, Industry-Institute Interface, Employability skills, Pre Placement training, Campus placement.
INTRODUCTION B-schools have come around successfully to establish a strong presence for themselves within collegiate institutions in almost all countries of the globe. Quality management education contributes to society in many ways beyond just formal education and skilling. The research, training and consultancy conducted by faculty on business, practices of its people & organizations, markets, and environment together contribute to an enlarging repository of knowledge. This ensures that pedagogy being adopted by the B-school, remains current and relevant, and also helps organizations and companies to acquire a compact understanding of the strategies that will ensure their success. Faculty expertise, along with their students', is sought by members of the business community ranging from small family firms, to technology start-ups, to multinational corporations to name a few. In fact, many business schools include outreach acts as part of their mission, and devote significant resources to address and evolve a particular need within their local business environment. Thus, high impact business schools provide nations with an advantage, not only in the form of a skilled workforce, but also through intellectual, social, philanthropic contributions to general business knowledge and to the community. These contributions lead to rising income levels and economic growth in any given community (Senge, 1994; Abel & Deitz, 2015; Bakru, 2011; Altbach, 2005; Addison & Warrington, 2006; Baruch & Leeming, 1996; Aman, 2009 and Baill, 1999)
Higher education, and in this case Management Education stands at crossroads. Changes in methods and processes are made imminent, as the traditional University structure of training and educating the business manager of tomorrow is being surpassed in the increasingly technological and complex global economy. The need of the hour is in the creation of a platform which could provide Management students with the talents and skills, necessary to work and compete in the ever changing industry, and also there is a felt need to understand and accept the challenges. Management education is considered as an elitist kind of a educational program, as it attracts young men and women, who are motivated by the positive occupational and social consequences associated with management education. In India, higher education especially management education is witness to an exponential growth in terms of number of institutes imparting management education which are usually termed as a Business School. The Government of India, has taken initiatives in this direction by establishing

International Journal of Advance and Innovative Research Volume 5, Issue 4 (XII): October - December, 2018
112
ISSN 2394 - 7780
almost 14 premier B-schools called as IIMs. In India, as of AICTE , there were 3644 B-schools, many of which now are facing closure, and some already closed, these figures are as of 2014.
Apart from the IIMs, management education is offered by university's own department in campus, affiliated colleges of universities in same place or the entire state, and now technical universities have been given this role. Moreover autonomous institutes approved by AICTE, universities running distance education program and open mode, are offering courses in management. Some recognized institutes and universities are also offering 3 years part time program (in evening) for working executives. Overseas universities having collaborations in India and those having students exchange program with limited-time studies abroad are also imparting management education. New private universities and several others are now coming up. There is happy news that, Institutes are being established, but on contrary, need to look at Quality, Standard and Impact that they make on Business society per se.
REVIEW OF LITERATURE The review work on the proposed research topic yielded a few research studies. Relevant research studies in the above mentioned issues are discussed in brief. Institutions offering MBA programmes must respond to market needs (Baruch and Leeming, 1996; Shipper, 1999). Those who are unwilling to change, according to Schmotter (1994), may experience dissatisfied students and staff as well as a low demand for their programmes. In commenting whether business schools are delivering what business really needs, and reports that business schools have not taught their Management students how to manage across business functions and globally. Carnall (1995) agreed that management problems generally require solutions drawn from different disciplines and business schools must prepare Management students for that. This had also prompted Porter (1997) to propose the removal of individual subject disciplines and the implementation of a cross-functional curriculum in business schools. Indeed, employers today are looking for skills that would allow Management students to handle international businesses, develop new businesses and manage flatter organizations. Malaysia is aware of the exponential growth and competitiveness of global business that demands speed, flexibility and agility in responding to consumer demands. Any shortcomings perceived by practicing managers should therefore be attended immediately. Those who participated in Eberhardt's (1997) survey raised concerns about the theoretical MBA curriculum. They feel that classroom knowledge of Management students does not match with the interpersonal and supervisory skills that are essential for managers. Porter and McKibbin (1988) noted that some business schools are not doing enough to develop the "soft skills" of managers, which resulted in suggestions to include courses in public speaking, conflict resolution, negotiation and teamwork techniques be offered as a part of MBA programmes Chait, 1999; Donald & Susan, 1981; Chandra & Kabra 2000; Dowling & Welch, 2004; Eberhardt, 1997; Enders, 2001).
MBA graduates are deficient in global perspective, leadership skills, integration skills, recognizing organizational realities and implementing effectively, acting creatively and innovatively, thinking critically and communicating clearly, understanding the role, responsibilities and purpose of business, understanding the limits of models and markets (Datar, et al, 2010). In the absence of these skills, the MBAs do not remain employable. This is furthered by the NASSCOM’s report (2012) indicating that not more than 25 per cent of engineers and MBA graduates are employable. To add to the problem, there is a decrease in placements of MBAs. This phenomenon began in 2008 when getting lucrative jobs by MBA students nose-dived (Rao, 2012; Sarkar 2011). Slowdown in the economy has added to their problems as all B-schools in India, including the IIMs, are feeling the impact of global slowdown in their placements. This problem has compounded with the increase of students in their institutes. For instance IIM-Indore is feeling maximum heat as its batch size has increased from 240 in 2011 to 450 in 2012 (Rao, 2012). Getting the right number and quality of faculty members is a challenge for Indian B-schools. Additionally the quality of research of the Indian B-School faculty members is also not up to the global standards. Unfortunately, a majority of B-school promoters are least concerned about attracting, developing and retaining good faculty. They usually develop cold feet when it comes to faculty development while they do not mind spending lavishly on infrastructure, advertising, etc, which may not fetch much in the long run (Kaul, 2011; Rao, 2012; Sarkar 2011; Datar, et al., 2010).
Neelankavil (1994), supported by the Managing Director of Oracle Systems Malaysia, said that companies hire management students, because they are generally equipped to solve business problems. The latter added that management students are bright, self-motivated and pro-active individuals. The key issue today is whether business schools have the relevant curriculum and delivery system to prepare future leaders for the dynamic changes in business. In twenty-first century, the way forward for business schools in Asia is to collaborate closely with corporations. Eberhardt (1997) found that, in spite of several criticisms hurled at MBA degree holders, firms are still hiring them. In a survey of Human Resource Managers, he found that 78 percent had

International Journal of Advance and Innovative Research Volume 5, Issue 4 (XII): October - December, 2018
113
ISSN 2394 - 7780
employed Management students in their organizations. The remaining 22 per cent gave three reasons for not doing so, company's policy to promote internal staff, lack of leadership training in Management students and insufficient work experience of the management candidates. Some Asian companies, especially family-owned ones, consider Management students as luxuries in their organizations and hire those with bachelor degrees in business instead. Quacquarelli (1997) in his study confirms that consultancy sector is on demand for Management students because of the significant market growth in their services.
In terms of skills acquired after pursuing an management programme, Eberhardt (1997) established that employers were most satisfied with their leadership potential and less satisfied with their written communication skills. Baruch and Leeming (1996) defended MBA programmes as they enhance the learning skills, research enquiry and written presentation of individuals. In an exclusive interview with CEOs, Shanker (1999) of Management Times highlighted several attributes that corporate leaders look for in Management students. The MD of Smith and Nephew (Asia) for example, prefers executives with good management and interpersonal skills as well as positive work attitudes and a drive for achievement. According to GM, Management students have good analytical skills, a network of contacts and are supporters of teamwork. The MD of Arthur Andersen finds them to be innovative, able to solve problems and write good business reports Baird & Ilan, 1988; Carnall, 1995; Barksdale, 1998; Crotty and Soule, 1997; Doh et al 2011; Chanana, 2007).
RATIONALE FOR THE RESEARCH STUDY Higher education especially the field of management education with special focus on HR education in India stands at crossroads. Without change, the traditional university structure of educating and training tomorrow’s business leaders is being surpassed & discarded in the increasingly diverse and technological global economy. With an aim to provide management students with the best of knowledge, skill sets, attitudes and the necessary talent to compete in this marketplace, we must recognize and accept the reality before us. Internationalization of the business school curriculum is no longer a luxury, but the need of the hour.
Mintzberg (2004), Ghoshal (2005) and Khurana (2007) have been critical of management programs of emphasizing less on teaching ethics as a result of which there are severe problems in contemporary management. Contrary to providing its students a holistic knowledge about business with more emphasis on increasing their skills, it has been observed that B-schools encourage turbo capitalism in their students as a result of which they have one-sided thinking (Khurana 2007). Datar, et al., (2010) observed that with the existing pedagogy, B-schools students are: a). Unable to understand the limitations of theories taught to them; b). Unable to logically apply the theories taught in classroom in actual life; c). Lack the skills and attitude in the application of the theories; and Fail to critically scrutinize context and draw correct conclusions. In the earlier paper, the present authors projected that HR education is at the cross roads and needs restructuring.
Further, people are the organization's greatest asset, providing the intellectual capital and the necessary push and pull, which drives differentiation and promotes value added services. Growth from macro perspectives is possible only when micro activities are initiated and preserved by the organizations (Baird & Ilan, 1988; Carnall, 1995; Barksdale, 1998; Crotty and Soule, 1997; Doh et al 2011; Chanana, 2007). To keep pace with globalization modern organizations have to deal with each individual differently and tactfully, thereby fulfilling the demands of employee as well as taking steps towards growth plan of the organization. Hence, this research study has been planned, i.e., HR student as a stakeholder provides his / her perspective of HR education as of today and tomorrow. As HR student stakeholders are the end users of the products of Management Institutions, their perspectives provides us with information, regarding those issues that needs to be reworked at all levels of the HR Education in India. Thus, HR students experience, learning and maturity, in understanding HR as an profession and education.
METHODOLOGY Objective To study the HR student’s perception on their teaching & learning process, evaluation systems, training in HR skills, internships, scope of HR in the market & future directions, amongst the students studying in various institutes.
Table No – 1: Demographic data of the HR students Sl No Parameter Frequency Percent
N 238 100 Age groups 22 to 26 years 210 88.2
27 to 31 years 26 10.9

International Journal of Advance and Innovative Research Volume 5, Issue 4 (XII): October - December, 2018
114
ISSN 2394 - 7780
Hypothesis development H1: HR Students do not prefer to shift from their native place to the Institute of study in search of obtaining a good HR education.
H2 : Majority of the HR Students entering MBA programs belonged to business management as their under graduation.
H3 : There is no redundancy of HR subjects in the MBA program.
H4: HR as a discipline contributes to the development of self-confidence, guides & helps the HR student towards a professional career.
Geographical Area With Karnataka state, as the region, the universe consists of all the HR students, (studying in the department of Management studies located at all types of B-schools), viz, Bangalore University, Bengaluru; Davangere University, Davangere; Gulbarga University, Gulbarga; VKSU Bellary; Karnatak University, Dharwad; Karnataka State Women University, Bijapur; Kuvempu University, Shankaraghatta; Mangalore University, Mangalore; Mysore University, Mysore; Tumkur University, Tumkur; Visveswaraiah Technological University, Belgaum; Central University of Karnataka, Gulbarga; Christ University Bangalore; Jain University, Bangalore; Manipal University, Manipal; Mount Carmel Institute of Management, Bangalore; MS Ramaiah Institute Of Management Sciences, and Ramaiah Institute of Management Science, Bangalore; and St Josephs College of Business Administration, Bangalore.
Sample Design All those students, who are part of their Management education in their 3rd semester, enrolled for HR specialization formed the target audience for the study.
Tool A questionnaire (to collect the data) was developed by the researcher reflecting the HR education retro-prospectively. This tool consists of the socio-demographic data wherein the age, sex, education, occupation, income, marital status, family type and the like. The second part of the questionnaire consists of why HR education has been selected as a postgraduate education, its impact on the HR student, HR subject contents and course offerings, HR internship and project work, examination systems, future scenario and the like.
The Questionnaire was designed in order to get an entire overview of the present status of HR Education and the need for paradigm shift.
Process of Research work The research design adopted for this study is Descriptive - Explanatory. The entire work was done in two phases, i.e., pilot study and main study. This pilot study was conducted over a period of 3 months, on a total of 20 samples. For the main study, the researcher had obtained permission, visited all the universities and autonomous B-schools and collected the data; this took about a period of nine months. The tool was finalized as per the results of the pilot study, with the necessary changes. The data collected was coded, entered into computer systems using SPSS 20 version and was analyzed using statistical tool - Descriptive statistics like
32+ years 2 .8 Gender Male 90 37.8
Female 148 62.2 Educational Background Traditional (BA, BSc) 38 16.0
Managerial (BBM, BBA, BCom) 177 74.4 Technical (BE, BTech, BCA) 23 9.7
Type of University State run Universities 139 58.4 Central University 7 2.9
Deemed Universities 45 18.9 Autonomous Organizations 32 13.4
NIT 15 6.3 Residence Urban (metro) 106 44.5
Semi Urban 37 15.5 Rural (non-metro) 95 39.9

International Journal of Advance and Innovative Research Volume 5, Issue 4 (XII): October - December, 2018
115
ISSN 2394 - 7780
frequencies & percentages; Chi-square and Contingency Coefficient analysis. These statistical tests were applied to find out the association between different types of students, universities and other categories of demographic variables used. The analysis mainly focused to understand the variables, differences and similarities in viewing the HR education across different types of University B-schools and what the competitive advantage of HR education per se.
Analysis of Results Table No 1: Responses for "HR student's perception of the other important roles of HR Academician" HR student's
perception of the other important
roles of HR Academician
F and %
Type of Institution Test Statistics
1 2 3 4 5
Total
X2 =56.294
p=.000
CC=.437
p=.000
A F 24 1 10 7 5 47
% 17.3% 14.3% 22.2% 21.9% 33.3% 19.7%
B F 14 1 3 5 3 26
% 10.1% 14.3% 6.7% 15.6% 20.0% 10.9%
C F 36 1 15 8 1 61
% 25.9% 14.3% 33.3% 25.0% 6.7% 25.6%
D F 5 3 8 8 3 27
% 3.6% 42.9% 17.8% 25.0% 20.0% 11.3%
E F 9 0 0 1 0 10 % 6.5% 0.0% 0.0% 3.1% 0.0% 4.2%
F F 44 1 6 3 3 57 % 31.7% 14.3% 13.3% 9.4% 20.0% 23.9%
G F 5 0 0 0 0 5 % 3.6% 0.0% 0.0% 0.0% 0.0% 2.1%
H F 0 0 2 0 0 2 % 0.0% 0.0% 4.4% 0.0% 0.0% .8%
I F 2 0 1 0 0 3 % 1.4% 0.0% 2.2% 0.0% 0.0% 1.3%
Total F 139 7 45 32 15 238 % 100% 100% 100% 100% 100% 100.0%
1- State University; 2 - Central University; 3- Deemed University; 4 - Autonomous B-school; 5-NITK.
a= To provide academic counseling; b = To provide networking opportunities; c = To provide career advice; d = To give good references when applying for positions; e = To conduct research in HR; f = To provide opportunities for HR Students to participate in research and training; g = Do not know; h = 1,3,4,5; i = 1,2,3,4,6.
Institution wise comparison amongst HR students with respect to the HR student's perception of the other important roles of HR Academician, the respondents have replied with 25.6% for "to provide career advice"; followed by 23.9% for "to provide opportunities for HR Students to participate in research and training" and lastly at 19.7% for "to provide academic counseling" as the most important roles of the HR Academician as perceived by the HR student. Chi-square test revealed significant difference between the frequencies (X2=56.294; p=.000), thus informing that HR students perception of the HR Academician's role comprises of differential responses, across various institutes.
Contingency coefficient revealed that a significant association exists (CC=.437; p=.000), amongst the frequencies, indicating that amongst the State University students, 31.7% have opined that "to provide opportunities for HR Students to participate in research and training"; this was followed by 25.9%, opined that
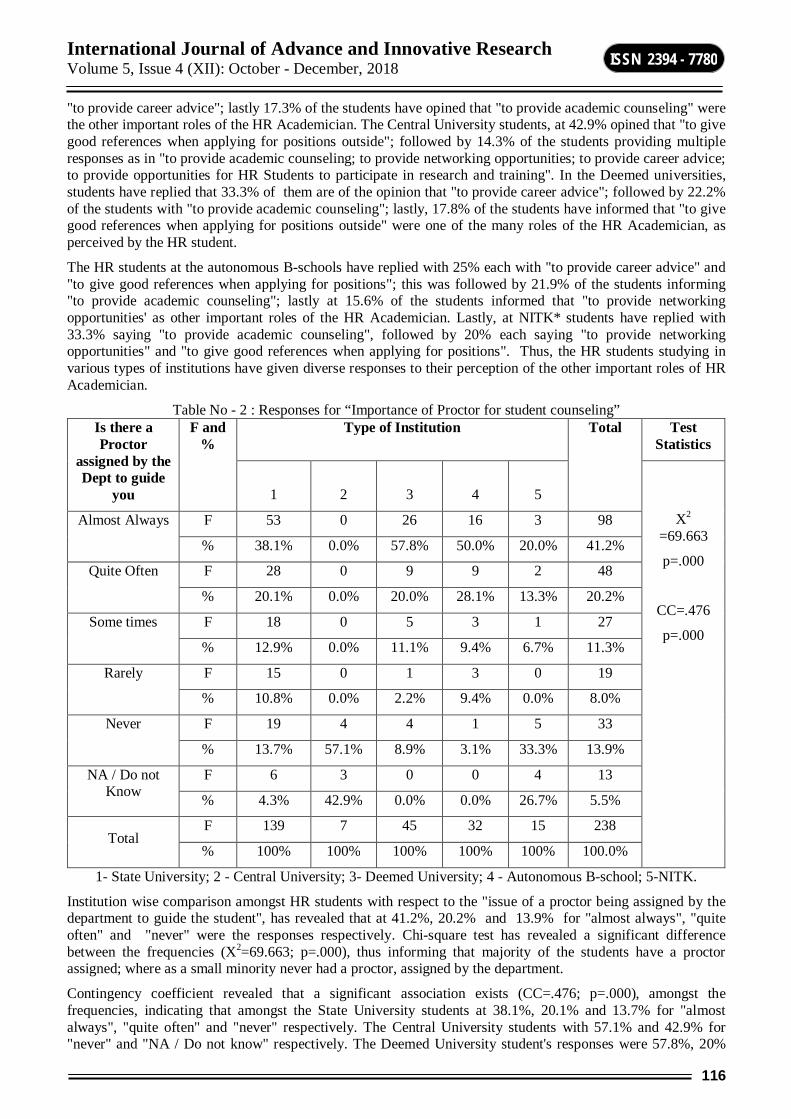
International Journal of Advance and Innovative Research Volume 5, Issue 4 (XII): October - December, 2018
116
ISSN 2394 - 7780
"to provide career advice"; lastly 17.3% of the students have opined that "to provide academic counseling" were the other important roles of the HR Academician. The Central University students, at 42.9% opined that "to give good references when applying for positions outside"; followed by 14.3% of the students providing multiple responses as in "to provide academic counseling; to provide networking opportunities; to provide career advice; to provide opportunities for HR Students to participate in research and training". In the Deemed universities, students have replied that 33.3% of them are of the opinion that "to provide career advice"; followed by 22.2% of the students with "to provide academic counseling"; lastly, 17.8% of the students have informed that "to give good references when applying for positions outside" were one of the many roles of the HR Academician, as perceived by the HR student.
The HR students at the autonomous B-schools have replied with 25% each with "to provide career advice" and "to give good references when applying for positions"; this was followed by 21.9% of the students informing "to provide academic counseling"; lastly at 15.6% of the students informed that "to provide networking opportunities' as other important roles of the HR Academician. Lastly, at NITK* students have replied with 33.3% saying "to provide academic counseling", followed by 20% each saying "to provide networking opportunities" and "to give good references when applying for positions". Thus, the HR students studying in various types of institutions have given diverse responses to their perception of the other important roles of HR Academician.
Table No - 2 : Responses for “Importance of Proctor for student counseling” Is there a Proctor
assigned by the Dept to guide
you
F and %
Type of Institution Total Test Statistics
1 2 3 4 5
X2 =69.663
p=.000
CC=.476
p=.000
Almost Always F 53 0 26 16 3 98
% 38.1% 0.0% 57.8% 50.0% 20.0% 41.2%
Quite Often F 28 0 9 9 2 48
% 20.1% 0.0% 20.0% 28.1% 13.3% 20.2%
Some times F 18 0 5 3 1 27
% 12.9% 0.0% 11.1% 9.4% 6.7% 11.3%
Rarely F 15 0 1 3 0 19
% 10.8% 0.0% 2.2% 9.4% 0.0% 8.0%
Never F 19 4 4 1 5 33
% 13.7% 57.1% 8.9% 3.1% 33.3% 13.9%
NA / Do not Know
F 6 3 0 0 4 13
% 4.3% 42.9% 0.0% 0.0% 26.7% 5.5%
Total F 139 7 45 32 15 238
% 100% 100% 100% 100% 100% 100.0%
1- State University; 2 - Central University; 3- Deemed University; 4 - Autonomous B-school; 5-NITK.
Institution wise comparison amongst HR students with respect to the "issue of a proctor being assigned by the department to guide the student", has revealed that at 41.2%, 20.2% and 13.9% for "almost always", "quite often" and "never" were the responses respectively. Chi-square test has revealed a significant difference between the frequencies (X2=69.663; p=.000), thus informing that majority of the students have a proctor assigned; where as a small minority never had a proctor, assigned by the department.
Contingency coefficient revealed that a significant association exists (CC=.476; p=.000), amongst the frequencies, indicating that amongst the State University students at 38.1%, 20.1% and 13.7% for "almost always", "quite often" and "never" respectively. The Central University students with 57.1% and 42.9% for "never" and "NA / Do not know" respectively. The Deemed University student's responses were 57.8%, 20%

International Journal of Advance and Innovative Research Volume 5, Issue 4 (XII): October - December, 2018
117
ISSN 2394 - 7780
and 11% for the "almost always", "quite often" and "sometimes" respectively. The Autonomous B-schools students responses were 50%, 28% and 9.4% for the responses "almost always", "quite often" and "sometimes / rarely" respectively. Lastly, at 33.3% and 26.7% for "never", and "NA / Do not know". Thus, the HR students differ in their responses towards the provision of having a Proctor assigned by the department to guide and help the student.
Table No 3 : Responses for "factors which helped to decide whether to move (to the institute of study)" Factors which
helped to decide whether to shift or not to shift
F and %
Age groups (in years) Total Test statistics
22-26 27-31 32+
X2= 43.186;
p=.000
CC=.392; p=.000
Reputation of the University
F 89 8 0 97 % 42.4% 30.8% 0.0% 40.8%
Reputation of the Business school
F 32 9 0 41 % 15.2% 34.6% 0.0% 17.2%
Reputation of the HR program
F 36 5 0 41 % 17.1% 19.2% 0.0% 17.2%
Influence of family
F 8 1 0 9 % 3.8% 3.8% 0.0% 3.8%
Financial considerations
F 24 3 0 27 % 11.4% 11.5% 0.0% 11.3%
*Combination of 1, 3 and 5
F 11 0 2 13 % 5.2% 0.0% 100.0% 5.5%
*Combination of 1, 2 and 5,
F 8 0 0 8 % 3.8% 0.0% 0.0% 3.4%
*Combination of 1, 4 and 5
F 2 0 0 2 % 1.0% 0.0% 0.0% .8%
*Combination of - 1 = Reputation of the University; 2 = Reputation of the B school; 3= Reputation of HR program: 4 = Influence of the family; 5 = Financial considerations
Age wise comparison amongst the HR students, has revealed that at 40.8% of the study population felt that reputation of the University was important, the reputation of the B-school and HR program were second at 17.2%; lastly, about 11.3% opined that financial considerations was important, along with combinations of the factors. Here, we observe that influence of the family is very less at 3.8%. Chi-square test revealed a significant difference between these groups of frequencies (X2=43.186; p=.000), helping to understand that the reputation of the University / b school / HR program were significant in helping the student decide their postgraduate education.
Further, Contingency coefficient revealed that a significant association (CC=.392; p =.000), across the frequencies, indicating that the respondents in the age group of 22-26 years, felt that reputation of the University at 42.4% and reputation of the HR program at 17.1%, followed by reputation of the B-school at 15.2% were important in helping them to make a choice. On the other hand, the 27 to 31 years age group felt that reputation of the B-school at 34.6%, followed by reputation of the University at 30.8%, and reputation of the HR program at 19.2% were important in helping them to make a choice. Lastly, for the age group of 32+ years, the main reason would be the mix of reputation of the University and financial considerations along with the influence of the family, being the important reasons for choosing their respective institutes' for study.
Table No - 4 : Responses for "learning styles of HR students" Learning styles of
students F and
% Age groups (in years) Total Test statistics
22-26 27-31 32+ Self Study F 50 4 2 56
% 23.8% 15.4% 100.0% 23.5% Lecture Classes F 4 7 0 11

International Journal of Advance and Innovative Research Volume 5, Issue 4 (XII): October - December, 2018
118
ISSN 2394 - 7780
% 1.9% 26.9% 0.0% 4.6% X2= 55.250;
p=.000
CC=.434;
p=.000
Class notes F 29 0 0 29 % 13.8% 0.0% 0.0% 12.2%
Internet Download F 17 6 0 23 % 8.1% 23.1% 0.0% 9.7%
Group Study with Friends
F 18 4 0 22 % 8.6% 15.4% 0.0% 9.2%
Tuitions F 9 1 0 10 % 4.3% 3.8% 0.0% 4.2%
*Combination of 1 and 2
F 7 0 0 7 % 3.3% 0.0% 0.0% 2.9%
*Combination of 1, 3 and 4,
F 15 0 0 15 % 7.1% 0.0% 0.0% 6.3%
*Combination of 1,2,3,4 and 5
F 31 4 0 35 % 14.8% 15.4% 0.0% 14.7%
*Combination of 5, 6, 7, and 8
F 30 0 0 30 % 14.3% 0.0% 0.0% 12.6%
* Combination of - 1 = Self study, 2 = Lecture classes, 3 = Class notes, 4 = Internet download, 5 = Group study, 6 =Tuitions; 7 = study at the end of the semester; 8 = Other miscellaneous methods
Comparison amongst the age groups has revealed that 23.5% of the total population are comfortable with self study, followed by a combination of all the procedures like the self study, lecture classes, class notes, internet resources, group study and private tuitions at 14.7%; and at 12.6%, represented group study, tuitions, study at the end of the semester and others. Lastly, class notes are used to study at 12.2%. Chi-square revealed a significant difference between these groups of frequencies (X2=55.250; p=.000), helping us to infer that the number of respondents preferred self study than to any other procedure of study.
Contingency coefficient revealed that a significant association (CC=.434; p=.000), indicating that respondents in the age group of 22-26 years, were used to learning by self at 23.8%; followed by combination of self study, lecture classes, class notes, internet download and group study at 14.8%; lastly at 14.3% of the HR students opined that group study, tuitions, study at the end of the semester and other issues, were considered as important means to study. Amongst the 27-31 years, majority of the students were comfortable learning through lecture classes at 26.9% and using internet to download information at 23.1%, lastly at 15.4% of the population have replied with "self study" and "group study with friends". The age group of 32+ years, has revealed that students prefer self study only. Thus, we can infer that younger the age group, the dependency is more on self, rather than any other procedure of study.
MAIN FINDINGS 1: HR Students perception of the other important roles of HR Academician 1. HR students’ perception of the other important roles of the HR Academician, at one fourth of the students
informed was "to provide career advice".
2. To provide opportunities for HR students to participate in research and training was the second most important role; however the third most important role was, to provide academic counseling, as informed by the HR students.
3. HR students’ perception of the HR Academicians role comprises reflect differential responses, across different institutions.
4. One third of the State University students have opined that, the Academicians role was "to provide opportunities for HR Students to participate in research and training; further to provide career advice" was a distinct second with one fourth of the students have informed.
5. Central University students, at two-fifths of them opined that, "to give good references when applying for positions outside the campus and in the industry", is the Academician's role.
6. In Deemed Universities, one third of the students have informed that, "to provide career advice" was the most important role; followed by one-fourth informing, "to provide academic counseling"; and a small minority informs that, "to give good references when applying for positions outside", were the roles of HR Academician.

International Journal of Advance and Innovative Research Volume 5, Issue 4 (XII): October - December, 2018
119
ISSN 2394 - 7780
7. One fourth of the Autonomous B-schools students (twice) have informed that, "to provide career advice" and "to give good references" when applying for positions.
8. In NITK at one-third of the students have informed that "to provide academic counseling, followed by minority of the students, informing that to provide networking opportunities" were considered important roles.
9. Thus, the HR students have given diverse responses to their perception of the other important roles of HR Academician, across various types of institutions.
2: Is there a Proctor assigned by the Dept to guide the HR student 1. One fourth of all the HR students have informed that they have a proctor being assigned by the department
to guide the student; further at one-fifth of the population have revealed it was quite often; hence, majority of the students have a proctor assigned to support them during their two year management program.
2. State University, Central University, Deemed University, Autonomous B-school students, at two fifths of the population had always a proctor assigned for guidance and support.
3. However one third of NITK students informed that they had not been allotted a proctor.
4. Thus, the HR students differed significantly in their responses towards the provision of having a Proctor assigned by the department to guide and help the HR student.
3: Factors which helped to decide whether to move (to the institute of study) 1. Two fifths of the HR students, felt that reputation of the University was of primary importance, followed by
the reputation of the B-school and HR program being secondary; last to be counted was financial consideration for HR students, to move to the place / institute of study.
2. In the age group of 22-26 years, respondents felt that reputation of the University, reputation of the HR program, followed by reputation of the B-school were important in helping them to make a choice.
3. In the 27-31 years age group felt that reputation of the B-school came first, followed by reputation of the University and reputation of the HR program were important in helping them to make a choice.
4. Lastly, for the age group of 32+ years, the main reason would be mix of reputation of the University, financial considerations along with influence of the family.
5. Reputation of the University / B-school / HR program was significant in helping the student decide their postgraduate education.
6. There exists significance amongst the age groups, as different age groups are influenced by different issues to move from their native to the place of study.
4: Learning styles of HR students 1. One fourth of the all the HR students across all the institutions, are comfortable with self study, followed by
a combinations of all the procedures like self study, lecture classes, class notes, use of internet resources, group study and private tuitions at a small minority.
2. The majority amongst the age group of 22-26 years, are used to learning by self; followed by combination of self study, lecture classes, class notes, internet download and group study.
3. The majority of the 27-31 years age group, were comfortable learning through lecture classes at one third and using internet to download information at one-fourth.
4. The age group of 32+ years has revealed that students prefer self study only.
5. Majority of the respondents preferred self study than to any other procedure of study
6. Thus, the age groups of HR students vary as per their perceptions, but the dependency is more on self, rather than any other procedure of learning.
HYPOTHESIS TEST B. Hypothesis H1: HR Students do not prefer to shift from their native place to the Institute of study in search of obtaining a good HR education. This hypothesis has been accepted. As HR students have revealed that, to obtain better HR education, they are ready to go anyplace.

International Journal of Advance and Innovative Research Volume 5, Issue 4 (XII): October - December, 2018
120
ISSN 2394 - 7780
H2: Majority of the HR Students entering MBA programs belonged to managerial educational as their under graduation. This hypothesis has been accepted. As a majority of the students were from BBM, BCom educational streams and less number of students come from other educational streams.
H3: There is no redundancy of the HR subjects in the MBA program. This hypothesis has not been accepted. As students have revealed that there are many HR subjects, which have been termed as redundant by HR students.
H4: HR as a discipline contributes to the development of self-confidence, guides & helps a HR student towards a professional career. This hypothesis has been accepted.
Management education in India was initiated just after independence with establishment of Indian Institute of Management. Since than various changes, challenges issues and implication has been pointed out, by studies conducted by Sahney et al (2004) - Indian educational system has been subjected to fast, radical, and ever revolutionary change over recent years. Panandiker (1991) pointed out that Knowledge and knowledge-creation will be far more central to the management education of the future rather than technology. He further added that humans will live not by bread and car alone but far more by knowledge, wisdom and ideas. This fundamental transformation of HR management education is both inevitable and necessary because the present consumption patterns of mankind can only take him thus far in its evolution and no further. Sahu (1991) emphasized that values are of utmost importance and are inseparable irrespective to any form of education HR Management education should produce persons with such value orientation, who, through example of dedicated hard work in a spirit of service, can change the attitude of the people who manage work, and towards each other to ensure quality of life and of work life. McNamara et al., (1990) stressed on action learning in management education as management institutes are often criticized for focusing more on theory and on quantitative analysis while neglecting interpersonal relationship and qualitative finding. It is often stated that management education, especially HR education should be experience-based, active, problem oriented and modified by feedback and action learning. Gill (2005) and (Dealtry, 2000) have emphasized that due to globalization and advancement in information technology the role played by management education in enhancing country knowledge base has been placed under a sharper focus thus it has become imperative to look at HR management education from the market oriented perspective and take a strategic view to better align business education with the requirement of the global market.
Sharma & Roy, (1996) pointed out that internationalization of management has been promoted along several dimensions such as curricula challenge, research activities with both contents and outlet being relevant and executive development programs. It seems that educational institutions and supplementary providers of management education and HR education have no choice but to rise to the challenge of global competition. Irala, a management researcher, was of view that management education in India is at cross roads with the dawn of new millennium. Quacquarelli, (1997) reports that major international banks like Citibank in Asia also consider Management students as sources of new talents, while the ABN-AMRO Bank believes that they have sound knowledge of international management and financial principles. Porter & McKibbin, (1988) recommends that corporations hire Management students as they have strong analytical ability, high motivation to work and good knowledge of relevant management functions. The perceived deficiencies of business schools have resulted in the establishment of several organizational training and education centers (Carnall, 1995). Training institutes of consultancy companies, for example, are said to provide technologically more superior management solutions than universities. Their executives are able to solve management problems as soon as they leave the classrooms. Arthur D. Little School of Management was among the first to set up a corporate university (about 30 years ago) to re-educate its senior executives, young recruits and professionals. It was the only corporate university than to have been accredited to award Master of Science in Management (Arnone, 1998).
DISCUSSION 1: Role of HR Academicians concerning HR students Implications for Theory HR Students have opined that HR Academicians should not only teach and do research work, but also perform other functions as in: 1. Perform the function of a career advisor and career manager.
2. Provide opportunities for HR students in HR based training and research projects.
3. Strengthen core HR concepts and fundamentals.
4. Bring in subjects like HR Analytics and such other in a strong way.
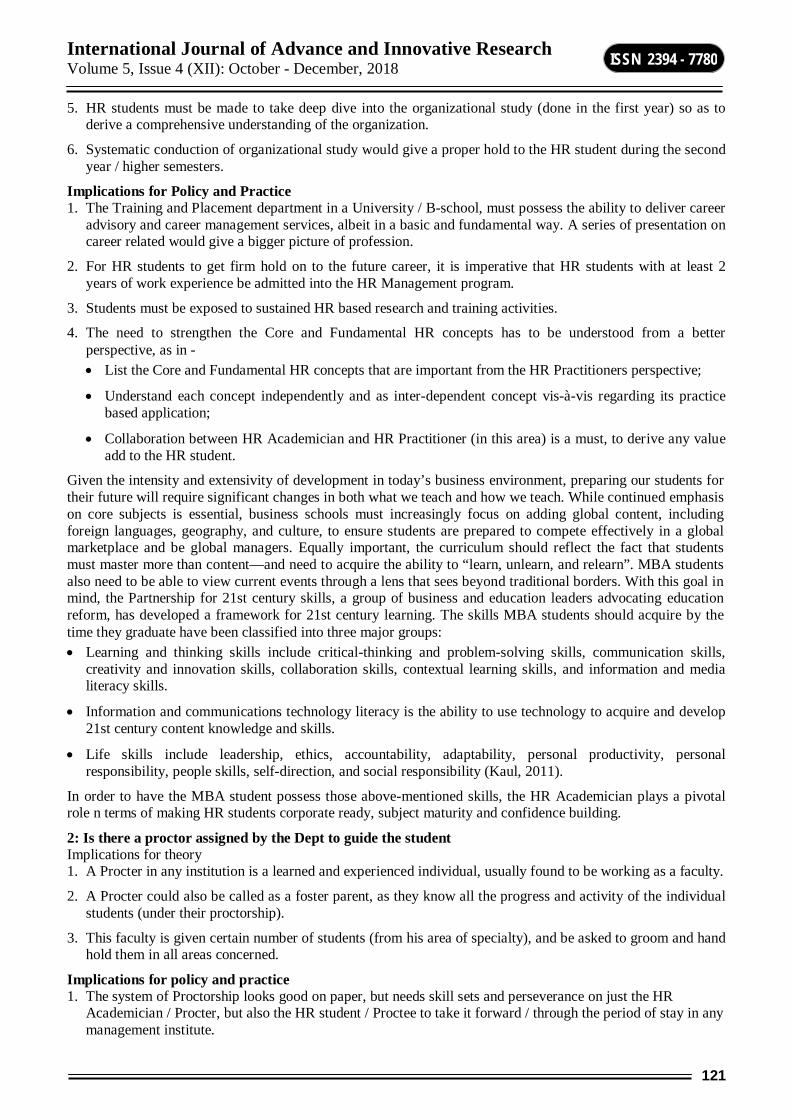
International Journal of Advance and Innovative Research Volume 5, Issue 4 (XII): October - December, 2018
121
ISSN 2394 - 7780
5. HR students must be made to take deep dive into the organizational study (done in the first year) so as to derive a comprehensive understanding of the organization.
6. Systematic conduction of organizational study would give a proper hold to the HR student during the second year / higher semesters.
Implications for Policy and Practice 1. The Training and Placement department in a University / B-school, must possess the ability to deliver career
advisory and career management services, albeit in a basic and fundamental way. A series of presentation on career related would give a bigger picture of profession.
2. For HR students to get firm hold on to the future career, it is imperative that HR students with at least 2 years of work experience be admitted into the HR Management program.
3. Students must be exposed to sustained HR based research and training activities.
4. The need to strengthen the Core and Fundamental HR concepts has to be understood from a better perspective, as in - List the Core and Fundamental HR concepts that are important from the HR Practitioners perspective;
Understand each concept independently and as inter-dependent concept vis-à-vis regarding its practice based application;
Collaboration between HR Academician and HR Practitioner (in this area) is a must, to derive any value add to the HR student.
Given the intensity and extensivity of development in today’s business environment, preparing our students for their future will require significant changes in both what we teach and how we teach. While continued emphasis on core subjects is essential, business schools must increasingly focus on adding global content, including foreign languages, geography, and culture, to ensure students are prepared to compete effectively in a global marketplace and be global managers. Equally important, the curriculum should reflect the fact that students must master more than content—and need to acquire the ability to “learn, unlearn, and relearn”. MBA students also need to be able to view current events through a lens that sees beyond traditional borders. With this goal in mind, the Partnership for 21st century skills, a group of business and education leaders advocating education reform, has developed a framework for 21st century learning. The skills MBA students should acquire by the time they graduate have been classified into three major groups: Learning and thinking skills include critical-thinking and problem-solving skills, communication skills,
creativity and innovation skills, collaboration skills, contextual learning skills, and information and media literacy skills.
Information and communications technology literacy is the ability to use technology to acquire and develop 21st century content knowledge and skills.
Life skills include leadership, ethics, accountability, adaptability, personal productivity, personal responsibility, people skills, self-direction, and social responsibility (Kaul, 2011).
In order to have the MBA student possess those above-mentioned skills, the HR Academician plays a pivotal role n terms of making HR students corporate ready, subject maturity and confidence building.
2: Is there a proctor assigned by the Dept to guide the student Implications for theory 1. A Procter in any institution is a learned and experienced individual, usually found to be working as a faculty.
2. A Procter could also be called as a foster parent, as they know all the progress and activity of the individual students (under their proctorship).
3. This faculty is given certain number of students (from his area of specialty), and be asked to groom and hand hold them in all areas concerned.
Implications for policy and practice 1. The system of Proctorship looks good on paper, but needs skill sets and perseverance on just the HR
Academician / Procter, but also the HR student / Proctee to take it forward / through the period of stay in any management institute.

International Journal of Advance and Innovative Research Volume 5, Issue 4 (XII): October - December, 2018
122
ISSN 2394 - 7780
2. A good rapport developed between the two primary stakeholders (Procter and Proctee) helps. Another issue of concern is the Proctees' (HR student) ability and need to share all his / her curricular, co-curricular and extra-curricular concerns with his concerned proctor. Let faculty get professionally trained in the Proctorship.
In above sections we have discussed the present scenario prevailing in higher education based management education, trends and contemporary issues faced by management education. The outcome of all this is that management education appears to be more relevant than ever in the “global era”. The ultimate challenge of management education approaches is to become more practical oriented and industry focus reason being theory-based developments and teachings are worthless, due to the fact that they will be of little use in concrete situations when a management issue arises. Management education need to be holistic, targeted and customized with aim to remove the gap that exist between industry requirements and academic curriculum focusing on attitude, corporate awareness, grooming and developing managerial skills. Industry interaction has to be strengthened by inviting senior person from industry to deliver lecture and ensuring student get associated with live industry projects (Tymon, 2011). All the above mentioned qualities in an HR student has to be done primarily by the HR Academician. Learning needs to student centric resulting in development in all areas such as analytical reasoning, lateral thinking, and solving case studies and as such. Mentoring and career counseling has to be introduced. Most B-schools claim to have it but only as a lip service. If Management education in India has to really extend its image on international scenario beyond IIM’s, other nationally recognized B-schools, industry and the Government have to work in alignment to improve quality of management education (Kumar & Dash, 2011).
3: Learning styles of HR students Implications for Theory 1. HR students constituted the top 10% of the class; further half of HR student strength came from top 25% of
the class. This finding implies that, HR students are good in academics and co-curricular activities.
2. Self-study is the preferred general learning style amongst HR students. This may imply that the HR students do not depend on faculty's lecture or lecture notes.
3. The present day HR students (younger age group) are self-dependent for their studies, but the elder age group depended on lecture classes and the Internet based information.
4. HR students shifted from their hometown to the place of their study, as the reputation of the University / B-school / Institute, along with HR program was of primary importance.
Implications for Policy and Practice 1. HR students are in the top 25% of the class. This means that these HR students have to be groomed to build
on their intelligence, by giving them adequate, systematic and rigorous inputs regarding their HR skills and development of positive attitude towards HR.
2. HR students ability to self study has to be incentivized; so that they can be just hand held through (not taught in the class); also self dependency in written and spoken assignments, within class and out in the industry, will create HR professionals (HR Academicians / HR Practitioners) who will be confident in their thoughts, behaviors and attitudes towards themselves, their profession and their organization.
3. HR Academicians have to understand in terms of the HR student's ability to learn and study by themselves; based on this segregation, HR Academicians must give adequate inputs to the HR students based on their needs (and not what the HR Academician has or wants to given).
4. Emphasis placed on the reputation on the Institute / B-school and the HR program has in its background that HR students need to affiliate themselves to branded Institutions/ B-schools. Here, the Institute / B-school must reinforce the 'brand image' of themselves in the minds of the future HR professionals.
CONCLUSION Despite the efforts by the GoI and the Private Sector, nearly fifty percent of the seats in major universities and autonomous organizations have gone abegging, even while a large number of students are aspiring to joining management courses. This issue, has created two poles, on the one end, we have capacities that are underutilized and thus causing loss in revenues and on the other, the industry is deprived of skilled management graduates, leading to a situation wherein, it shows that there is excessive thrust on quantity, rather than quality of HR management education.

International Journal of Advance and Innovative Research Volume 5, Issue 4 (XII): October - December, 2018
123
ISSN 2394 - 7780
SUGGESTIONS Primary suggestions 1. HR students need educational counseling, at the time of joining the postgraduate program; based on the
results of the study, that most of the HR students are from managerial educational background. This scenario has to be worked around to a situation in which HR students could come from all or most of educational background and not just managerial per se.
2. Career counseling helps the students to opt for a choice of a particular institute of study, select the choice of specialization, embracing the subject which makes the student practice, what he preaches ; further the company he wants to work with; and so on forth.
3. Indian system of education beginning with primary education, focuses mostly on rote learning (in turn self study), has to be worked around, in which students learn by practice in their field
4. HR subjects become redundant vis-a-vis the market demands. These needs have to be met at the very earliest, as to bring in HR industry experts on the Syllabus committee; send the faculty on to the industry for a specific period with objectives and such similar initiatives, will help HR Academicians & HR Industry personnel & growth.
5. During pre-placement training, emphasis has to be made on HR knowledge, Skills and Attitude based deficits and deficiencies at the individual student level; which will help the department / institute in giving a well rounded HR student to the Industry.
Secondary suggestions 1. In future, HR as a subject should be made practical with hands on, which should provide the means to
understand, devise & propose HR strategies, which upon implementation brings in betterment and wellness in an individual employee, team, division and the organization.
2. HR as a subject in a B-school, ought to be branded as a means to bring in a process centric mechanism, yet touched by human values and ethics; HR should bring in better transparent system of corporate governance and work ethic; must work towards the up-liftment & perseverance of the organization as a social & a business entity.
3. The role of a HR teacher is to make the subject of HR, practically applicable (rather than just theory & class room discussion based) and this can be done by the development of systematic, robust process driven systems, sub-systems & tools; by the application of which, yields concrete information, which is the platform for sustained future of humans in an organization.
ACKNOWLEDGEMENTS The authors thank the students of HR, and convey their gratitude to the HR faculty and HoDs from all the departments of management studies at various universities and Autonomous B-schools across the Karnataka state, without whose help & support, this study would not have been possible and timely help to connect with HR students during data collection. Further, the authors acknowledge Acharya Institutes Bengaluru, for sparing and using the time and the Institutional resources for completing the paper.
BIBLIOGRAPHY Abel, J. R. & Deitz, Richard. (2015). Agglomeration & job matching among college graduates. Regional
Science & Urban Economics, 51(C), 14-24.
Addison, W. E., Best, J., & Warrington, J.D. (2006). Student perceptions of course difficulty & their rating of instructors. College Standard Journal, 402 (2), 409-416.
Agarwal, A.K. & Gopalan S.M. (2013). Innovations in Management of Technical Education. Journal of Business Management & Social Science Research. 2 (1), 14-17.
Altbach, Philip, G. (12, April 2005). Higher Education in India. The Hindu.
Aman, R. R. (2009). Improving student satisfaction & retention with online instruction through systematic faculty peer review of courses. An unpublished doctoral dissertation. Oregon State University. AAT 3376735.
Arnone, M. (1998), "Corporate universities: A viewpoint on the challenges and best practices", Career Development International, Vol. 3, No. 5, pp 199 - 204.

International Journal of Advance and Innovative Research Volume 5, Issue 4 (XII): October - December, 2018
124
ISSN 2394 - 7780
Baruch, Y. and Leeming, A. (1996), "Programming the MBA programme-quest for curriculum", The Journal of Management Development, Vol. 15, No. 7, pp 170 - 178.
Baill, B. (1999). The changing requirements of the HR professional: Implications for the development of HR professionals. Human Resource Management, 38, 171-175.
Baird, Lloyd, & Meshoulam, Ilan. (1988). Managing Two Fits of Strategic Human Resource Management Academy of Management. The Academy of Management Review; 13 (1), 116 -128.
Bakru Kanipriya M., (2011). Competencies for Effective Management Teaching - Perception of Teachers & Administrators of Indian B-Schools. PhD Thesis. Jaypee Business School, Jaypee Institute of Information Technology Noida.
Barksdale, K. (1998). Why we should update HR education. Journal of Management Education, 22 (4), 526-530.
Carnall, C. (1995), "The third-generation MBA global reach and 'local' service", The Learning Organisation, Vol. 2, No. 2, pp 110 - 116.
Crotty, P.T. and Soule, A. (1997), "Executive education: yesterday and today, with a look at tomorrow'', Journal of Management Development, Vol. 16, No. 1, pp 90 - 96.
Chait L.P.(1999). Creating a successful knowledge management system. Journal of Business Strategy, 20 (2), 23-36.
Chanana, Karuna. (2007). Globalization, Higher Education & Gender. Economic & Political Weekly, 42 (7), 590-598.
Chandra, A. & Kabra, S. (2000). Human Resource Strategy - Architecture for Change. New Delhi. Response Books.
Chang, W. A. & Huang, T. C. (2005). Relationship between strategic human resource management & firm performance. International Journal of Manpower, 26 (5), 434-474.
Datar, M. Srikant, Garvin, A. David & Cullen, G. Patrick. (2010). Rethinking the MBA: Business Education at Crossroads. Harvard Business Press. Boston:
Dealtry, R. (2000), "Case research into the evolution of a corporate university development process", Employee Counseling Today, Vol. 12, No. 8, pp 60 - 68.
Diskienė, D. & Marčinskas, A. (2007). Lithuanian managerial potential: state & perspectives. Vilnius, Lithuania. VU publishing office.
Doh, J. P., Stumpf, S. A., Tymon, G & Walter, G, Jr. (2011). Responsible leadership helps retain talent in India. Journal of Business Ethics, suppl. 98, 85-100.
Donald, D. J. & Susan, E. S. (1981). Career Education in Colleges and Universities. Journal of Career Education, 2 (2), 12-16.
Dowling, P., & Welch, E. D. (2004). International Human Resource Management : Managing people in a multinational context. New Jersey. Thomson.
Eberhardt, B.J. (1997), "Business concerns regarding MBA education: effects on recruiting", Journal of Education for Business, May/June, Vol 2, Issue 1, pp 160 - 168.
Enders, J. (2001). Between State Control & Academic Capitalism : A Comparative perspective on Academic Staff in Europe. In Enders, J. (Ed.), (2001). Academic Staff in Europe: Changing Contexts & Conditions. Westport, Conn./London: Greenwood Press.
Evans P, Puick, V, & Barsouz, J.L. (2002). The Global Challenge : Frameworks for International Human Resources Management. Boston. McGraw-Hill.
Ezenwafor, J. I. (2008). Strategies for selecting competent lecturers for business teacher education programs in Nigerian institutions, Book of Readings in Business Education.
Ghoshal, S. (2005). Bad management theories are destroying good management practice. Academy of Management Learning and Education, Vol. 4(1), pp 75-91.
International Journal of Advance and Innovative Research Volume 5, Issue 4 (XII): October - December, 2018
125
ISSN 2394 - 7780
Gill, S.S. (2005), “Profit and Education do go”, Indian Express, November 8. (Available at http://www.indianexpress.com/oldStory/81539).
Ginsberg, S. (2010). Getting to the scholarship of teaching & learning : Professional development in university faculty. ASHA Leader, 15(10), 14-17.
Giauque, W.C. & Woolsey, R.E.D. (1981). A totally new direction for management education: A modest proposal. Interfaces, 11(4), 30-34.
Goel D. R, & Goel C. (2012). Teacher education scenario in India : Current problems & concerns. MIER Journal of Educational Studies, Trends & Practices. 2 (2), 231-242.
Goldhaber, D, & Anthony, E. (2004). Can Teacher Quality Be Effectively Assessed? Review of Economics & Statistics, 89(1): 134-150.
Hammonds, W. (2005). Why we hate HR. Fast Company Magazine. (Retrieved from World Wide Web : http://www.fastcompany.com/53319/why-we-hate-hr).
Hansen, M. T. (2002). Knowledge network: Explaining effective knowledge sharing in multiunit companies. Organization Science, 13(3), 232−248.
Harris, L., Doughty, D. & Kirk, S. (2002). The devolution of HR responsibilities – perspectives from the UK‘s public sector. Journal of European Industrial Training, 26(5), 219-229.
James W. Schmotter, (1994) "The Best of Times or the Worst of Times?: The Future of the MBA Market in the USA in the 1990s", Executive Development, Vol. 7 Issue: 5, pp.6-9,
Kaul, N. (2011). Management Education in India – A case study. Asian Journal of Management Research, 2(1), 533 - 552.
Khurana, R. (2007). From higher aims to hired hands: The social transformation of American business schools and the unfulfilled promise of management as a profession. Princeton University Press. Princeton.
Kumar, Sanjeev & Dash, K. R, (2011). Management Education in India: Trends, Issues & Implications. Research Journal of International Studies. 18, Issue 1, pp:15-25.
MacNamara, M. Meyler, M. & Arnold, A., (1990), "Management Education and the Challenge of Action Learning". Higher Education, Vol.19, No.4, pp 419-433.
Mintzberg, H. (2004). Managers, Not MBAs. San Francisco: Berrett-Koehler.
Nasscom (2012). Annual Report 2012 - 13. New Delhi.
Neelankavil, J.P (1994), "Corporate America's quest for an ideal MBA", Journal of Management Development, Vol. 13, No.5, pp 38 - 48.
Panandiker Pai VA (1991), Management Education A Long term view. Economic & Political Weekly, Vol XXVI, No 48, November 30, 1991. M 310 - M316.
Porter, G. (1997). Employees perceptions of management: A case for leadership training. International Journal of Training & Development, 1(4), 270-285.
Porter, L. W., & McKibbin, L. R. (1988), Management education and development: Drift or thrust into the 21st century. New York. McGraw-Hill.
Quacquarelli, N. (1997), "No let-up in demand for MBAs", World Executive's Digest, KuaIa Lumpur.
Rao, Y. (2012). Slowdown hits b-school placements. Times of India, March 6, 2012.
Sahney S, Banwet, DK, and Karunes S (2004), ‘Conceptualizing total quality management in higher education’. The TQM magazine, Vol 16, No 2, 145 – 159.
Sahu,K. C. (1991), "Reorienting Management Education", Economic and Political Weekly,Vol.26, No.48, pp M133 - M136.
Shanker, J. (1999), "Choosing an MBA programme", Management Times, News Straits Times, Kuala Lumpur, April 28.

International Journal of Advance and Innovative Research Volume 5, Issue 4 (XII): October - December, 2018
126
ISSN 2394 - 7780
Sarkar, M. (2011). Declining numbers. Business World, June 2011.
Senge P. (1994), The Fifth Discipline: 'The Art & Practice of the Learning Organization: Doubleday, New York.
Sharma,B and Roy, J. A. (1996), "Aspects of the internationalization of management education". Journal of Management Development, Vol.15, No.1, pp. 5-13.
Shipper, F. (1999), "A comparison of managerial skills of middle managers with MBAs, with other masters' and undergraduate degrees ten years after the Porter and McKibbin Report", Journal of Managerial Psychology, Vol. 14 No. 2, pp 142 - 149.
Tymon, Walter G, Jr; Stumpf, Stephen A; Smith, Richard R. (2011), Manager Support predicts turnover of professionals in India. Career Development International, Vol 16, Issue 3, pp: 293-312.

International Journal of Advance and Innovative Research Volume 5, Issue 4 (XII): October - December, 2018
127
ISSN 2394 - 7780
AN EXPLORATION OF FACTORS INFLUENCING PRE-OWNED CAR PURCHASING DECISIONS – A STUDY WITH SPECIAL REFERENCE TO COIMBATORE DISTRICT
Dr. D. Dilip, Dr. S. Vinoth and T. Jayashree Associate Professor, RVS Institute of Management Studies and Research, Coimbatore
ABSTRACT Car purchasing decisions need high involvement: the product is complex, there are considerable costs associated with poor decisions, and the transaction involves a high financial cost. The focus of this paper is to provide a framework to study markets for Pre-owned cars. Today more and more people buy second-hand products, especially luxury durables. As the typical durable goods, Pre-owned cars are very popular among consumers. In recent years, the sale of Pre-owned increases quickly in India. In addition, there is still potential in the Pre-Owned Car market. On the other hand, consumers are the subject in the Pre-owned car market. So what consumers take into consideration is important when buying second-hand cars. The study focused on factors influencing Pre-Owned Car purchasing decisions – A study with special reference to Coimbatore District. Data were collected from 150 respondents in and around Coimbatore district using structured questionnaire. Data were analysed using SPSS and tools used like Factor Analysis and Z-Test to meet out the objectives. The study finds out that factors such as ambiance, documentation, car performance and maintenance while purchasing the pre-owned cars and the demand for pre-owned car segment is increasing because of the growing number of nuclear families and their financial cringe.
Keywords: Pre-Owned Cars, Factors, Purchasing Decisions, Demand.
1. INTRODUCTION Now a day, car has become a necessity and forms a part of life of even the middle class people. Life without vehicle is just beyond imagination these days. It is not only an indicator of national economy; but an individual’s progress graph can be measured on the grounds of the automobile vehicles used by him for day to day work and also for pleasures and treasures of happiness, prestige and style as well. The automobile industry in India is one of the largest in the world and one of the fastest growing globally. It is also viewed as the most lucrative industry. The Indian new car market expected to grow at 12-13% annually and will be amongst the Top 5 global markets by 2020. According to the reports of Society of Indian Automobile Manufacturers (SIAM), The sale of Passenger Vehicles grew by 6.10 percent in April-October 2018 over the same period last year. Within the Passenger Vehicles, the sales of Passenger Cars, Utility Vehicle & Vans grew by 5.87 percent, 5.19 percent and 12.96 percent respectively in April-October 2018 over the same period last year.
According to Sandeep Aggarwal, founder & CEO, Droom, the growth in used luxury cars market has increased to 22% compared to last year’s 12%. Aggarwal, adding that best-selling luxury models are BMW 5 Series, Mercedes-Benz E-Class, Mercedes-Benz C-Class, Audi A4, BMW 3 Series, BMW X1, Audi A6, Mercedes-Benz M-Class, Audi Q7, Jaguar XF. The reason is that these are premium cars that are in excellent condition and available at a much lower price than their showroom cost, he added. Therefore, there is a significant scope to examine the customer’s attitude towards purchase of pre-owned cars. The study is restricted to Coimbatore district which is economically the strongest in the state. Due to the increased purchasing power, the people have started to buy car, for business or personal uses or social status. Knowledge of the buying behaviour of different market segments and evolving marketing strategies increase the sales. Advertisers and marketers have been trying to discover why consumers buy and what they buy. This study aims to identify the factors influencing the customer’s attitude towards purchase of the preference of pre-owned cars.
2. PRE-OWNED CARS Buying a new car is definitely more expensive than buying a used one. One trend that makes buying used a better option is the proliferation of certified pre-owned programs. The pre-owned car market has provided an economical solution for the aspires, who lack affordability to buy a new car since long. However, during the last 4-5 years, the pre-owned car market got fillip on easy availability of finance on pre-owned cars, increase in income levels, huge pile-up of car stock on the back of strong growth in new demand during last 8-10 years. The pre-owned cars provide an attractive opportunity to large section of buyers to upgrade their purchases (viz. two wheeler buyer upgrading his purchase to mini or micro cars, small car buyer upgrading to midsize cars, etc), which otherwise would not be possible due to limited affordability. Further entry of organized players in pre-owned car market during last 6-7 years has also enforced the trust among buyers for pre-owned cars and, thereby, led to expansion of this market. Pre-owned car market size is 1.2x that of the new car market, well below 2.5x which is typically found in mature markets. Indian pre-owned car market size grew at 9%

International Journal of Advance and Innovative Research Volume 5, Issue 4 (XII): October - December, 2018
128
ISSN 2394 - 7780
demonetization reduced the market size by approximately 200,000 units or roughly 6% of the overall market. The market has however recovered since then to normal size and growth rates.
3. REVIEW OF LITERATURE Behavioral Choice Theory (Rachlin, 1989) provides a useful theoretical structure for understanding the factors that influence people who make choices. The theory argues that the available alternatives would affect the choice of behaviour. The factors that influence choice included the reinforcing value of the alternatives, the behavioural cost of the alternatives, and the relative delay between choosing and receiving of the benefits. (Tsai & Coleman.2007).
Thorelli (1991) regarding consumers' interest in pre-purchase information, in his study on 93 Norway sample districts found that those with more education might be more information minded than those with less education. Actual or potential buyers or owners of a product were more likely to be better than others and one might expect that higher income or wealth was accompanied by product-informed elite, and hence a concentration of information power among consumers. After all knowledge is power.
Newman and Staelin (1992) made findings that lend support to the hypothesis that purchase and use of product resulted in learning, which later influences buyer behaviour. Their results, as well as those of earlier studies indicated that the amount of information sought by many buyers was small, but it did not necessarily mean that buyers were ill-informed.
Dick, Alan S. and Kunal Basu (1994) explains that Marketers have to understand how consumers search for and evaluate information and how purchase information may have considered to be knowledge obtained about some fact or circumstance
Ewing (2000) investigated brand loyalty by examining actual past behaviour and its impact on future behaviour and its impact on future behavioural intentions, as well as willingness to recommend the brand to another customer known to him. Finding indicated that purchase expectation/intention remains a valid research metric.
Ashok (2005) suggested the strategies to be adopted to improve the sales of Maruti Zen passenger cars with specific reference to Salem District. It also highlighted the customers level of satisfaction towards the features of Zen and the problems associated with the use of Zen.
Kotwal (2009) face off buyers now prefer to have cars with the space, comfort and luxury of a mid-size saloon or sedan. With growing affluence and technological advancement, there develops a certain maturity in taste, as evidenced by growing popularity of the Indian Hatchback market.
Carazoo (2012) Consumer buying behaviour for used cars can be much cheaper than its new counterpoint. The depreciation is lesser and car financing too can be obtained easily. A survey was conducted and it was revealed that the demand for the used car market in India per year is 1.4 million cars
4. STATEMENT OF THE PROBLEM Due to the emergence of globalization and liberalization, there is a stiff competition among the variety of car industries which are focusing attention in capturing the Indian markets. Car, though considered as luxury once, now occupies an important part in our day- to- day life and has become a necessity. At present, the demand of pre-owned cars is on the rise in the country. The researcher is interested in studying and finding the reasons that influence the customer to buy used cars. Hence the statement of the problem is “Factors Ensure Customers Importance on pre-owned cars”.
5. OBJECTIVES To Study What Level of Importance is given by the Customer While Purchasing the Pre Owned Cars
To analyze impact on level of importance on Different demographical profile
6. RESEARCH METHODOLOGY Research methodology is a way to systematically solve research problem. Data and information were gathered from both primary and secondary sources. The primary data have been collected during the period from July 2018 to August 2018 through structured questionnaire. Judgment sampling method was adopted to select 150 used car owners in Coimbatore districts. The data were analysed with the help of SPSS 20.0. Statistical tools and techniques used for data analyses were Factor analysis and Z -test.
7. RESULTS AND DISCUSSION Factors Ensure Customers Importance Factor analysis is a multivariate statistical methods used for the purpose of data reduction. It is a technique used to reduce data complexity by reducing the number of variables understudy. In the present study factor analysis

International Journal of Advance and Innovative Research Volume 5, Issue 4 (XII): October - December, 2018
129
ISSN 2394 - 7780
has been administrated to identify the important factors that ensure customer importance while purchasing the pre-owned car. The following table 7.1 is to ensure the application of fit.
Table 7.1: KMO and Bartlett's Test Kaiser-Meyer-Olkin Measure of Sampling Adequacy. 0.914
Bartlett's Test of Sphericity Approx. Chi-Square 27,385.186
Df 190 Sig. 0.000
Source: Primary data
Both KMO and Bartleet’s test are to ensure the application of factor analysis in customer importance. KMO test value i.e. 0.914 which is closure to unity and chi-square significance value ensures the application of factor analysis. To identify the important factors influencing customer importance while purchasing the pre-owned cars factor analysis technique is applied. The Principal Component Analysis extraction method was used to analyse the data with Varimax Rotation Method. The following table of communalities gives the contribution of each item to the factors extracted.
Table 7.2: Communalities Items Initial Extraction
Mileage 1.000 0.974 Kilo meters travelled 1.000 0.987 Regularity in services 1.000 0.967 Type of fuel 1.000 0.948 Tyer condition 1.000 0.914 Engine performance 1.000 0.928 Gear condition 1.000 0.979 Body of the car 1.000 0.884 Interior 1.000 0.836 Model of the car (in years) 1.000 0.867 Power steering 1.000 0.867 Auto gear 1.000 0.854 Color 1.000 0.694 Music system 1.000 0.736 RC book 1.000 0.928 Registration Formalities 1.000 0.954 Finance activity 1.000 0.987 Usage-single handed 1.000 0.907 Insurance 1.000 0.979 Resale-value 1.000 0.925
Source: Primary data
Communalities range from 0.694 to 0.987 indicates that more than 90% of information is extracted from each item. The following table of Eigen values indicates that four factors are extracted and totally 90% information is extracted by these factors.
Table 7.3: Total Variance Explained
Total Variance Explained
Compo-nent
Initial Eigen values Extraction Sums of Squared Loadings
Rotation Sums of Squared Loadings
Total % of Variance
Cumula -tive % Total % of
Variance Cumula-tive % Total % of
Variance Cumula-
tive% 1 7.121 35.605 35.605 7.121 35.605 35.605 5.781 28.905 28.905 2 5.488 27.441 63.046 5.488 27.441 63.046 4.777 23.885 52.791

International Journal of Advance and Innovative Research Volume 5, Issue 4 (XII): October - December, 2018
130
ISSN 2394 - 7780
3 3.019 15.096 78.142 3.019 15.096 78.142 3.790 18.949 71.740 4 2.486 12.428 90.570 2.486 12.428 90.570 3.766 18.830 90.570 5 0.355 1.775 92.345
6 0.295 1.474 93.820
7 0.185 0.927 94.747
8 0.160 0.800 95.547
9 0.147 0.735 96.282
10 0.141 0.703 96.985
11 0.127 0.634 97.619
12 0.101 0.503 98.123
13 0.100 0.499 98.622
14 0.082 0.409 99.031
15 0.079 0.393 99.424
16 0.051 0.254 99.677
17 0.031 0.156 99.833
18 0.012 0.059 99.892
19 0.011 0.055 99.947
20 0.011 0.053 100.00
Source: Primary data
The following rotated component matrix gives the Four components.
All the factors loaded is more than 0.900 and the factor analysis yielded 4 factors in all which explaining explained in Table 7.4 Analysis gives an overview of rotated component matrix wherein Principal Component Analysis extracts the four components and the rotation method of Varimax with Kaiser Normalization.
Table 7.4: Rotated Component Matrix
Item Component 1 2 3 4
Body of the car 0.923 0.008 -0.177 -0.026 Model of the car (in years) 0.914 0.034 -0.173 -0.022 Power steering 0.910 0.011 -0.193 0.011 Auto gear 0.910 -0.002 -0.160 -0.021 Interior 0.895 0.028 -0.182 -0.032 Music system 0.841 0.016 -0.166 0.008 Color 0.815 0.055 -0.158 -0.043 Finance activity 0.029 0.984 -0.029 0.133 Insurance 0.027 0.979 -0.030 0.138 Registration Formalities 0.014 0.969 -0.002 0.123 RC book 0.035 0.955 -0.042 0.115 Resale-value 0.025 0.954 -0.038 0.118 Kilometers travelled -0.255 -0.038 0.959 -0.018 Mileage -0.250 -0.028 0.954 -0.012 Type of fuel -0.266 -0.042 0.936 -0.021 Engine performance -0.243 -0.027 0.932 -0.018 Gear condition -0.023 0.147 -0.018 0.978 Regularity in services -0.028 0.146 -0.032 0.971 Tyer condition -0.035 0.137 -0.007 0.946 Usage-single handed -0.014 0.135 -0.006 0.942
Source: Primary data
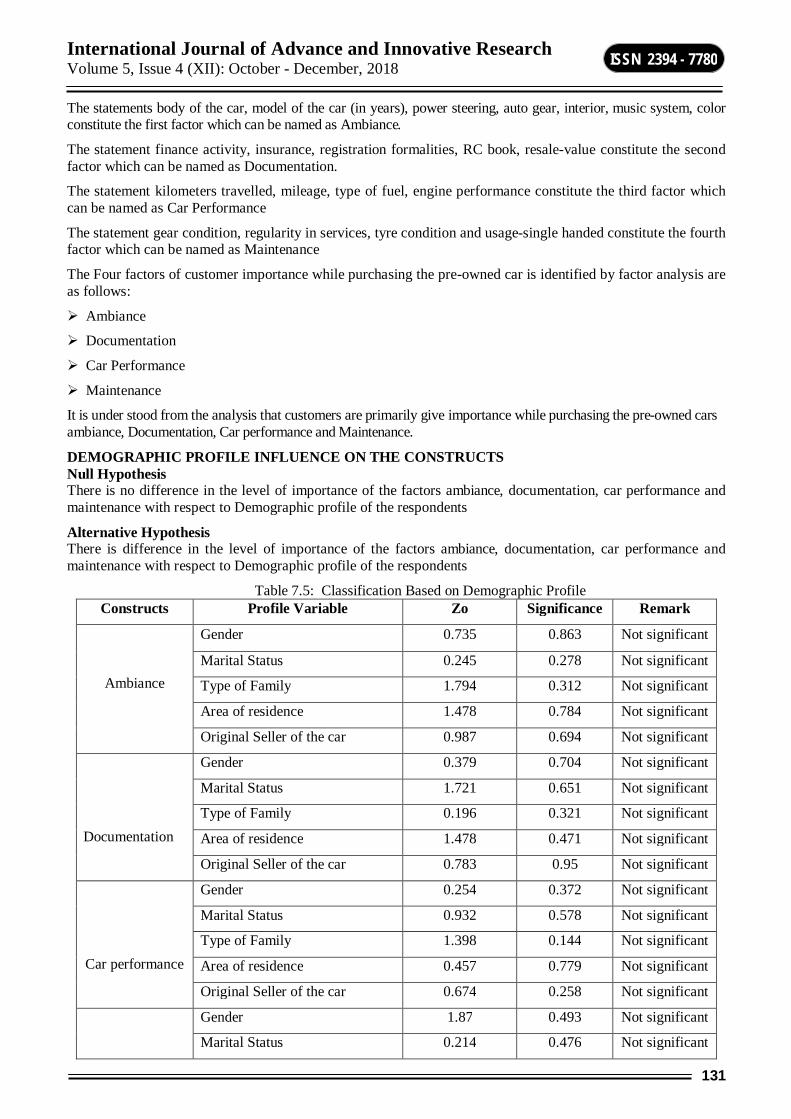
International Journal of Advance and Innovative Research Volume 5, Issue 4 (XII): October - December, 2018
131
ISSN 2394 - 7780
The statements body of the car, model of the car (in years), power steering, auto gear, interior, music system, color constitute the first factor which can be named as Ambiance.
The statement finance activity, insurance, registration formalities, RC book, resale-value constitute the second factor which can be named as Documentation.
The statement kilometers travelled, mileage, type of fuel, engine performance constitute the third factor which can be named as Car Performance
The statement gear condition, regularity in services, tyre condition and usage-single handed constitute the fourth factor which can be named as Maintenance
The Four factors of customer importance while purchasing the pre-owned car is identified by factor analysis are as follows:
Ambiance
Documentation
Car Performance
Maintenance
It is under stood from the analysis that customers are primarily give importance while purchasing the pre-owned cars ambiance, Documentation, Car performance and Maintenance.
DEMOGRAPHIC PROFILE INFLUENCE ON THE CONSTRUCTS Null Hypothesis There is no difference in the level of importance of the factors ambiance, documentation, car performance and maintenance with respect to Demographic profile of the respondents
Alternative Hypothesis There is difference in the level of importance of the factors ambiance, documentation, car performance and maintenance with respect to Demographic profile of the respondents
Table 7.5: Classification Based on Demographic Profile Constructs Profile Variable Zo Significance Remark
Ambiance
Gender 0.735 0.863 Not significant
Marital Status 0.245 0.278 Not significant
Type of Family 1.794 0.312 Not significant
Area of residence 1.478 0.784 Not significant
Original Seller of the car 0.987 0.694 Not significant
Documentation
Gender 0.379 0.704 Not significant
Marital Status 1.721 0.651 Not significant
Type of Family 0.196 0.321 Not significant
Area of residence 1.478 0.471 Not significant
Original Seller of the car 0.783 0.95 Not significant
Car performance
Gender 0.254 0.372 Not significant
Marital Status 0.932 0.578 Not significant
Type of Family 1.398 0.144 Not significant
Area of residence 0.457 0.779 Not significant
Original Seller of the car 0.674 0.258 Not significant
Gender 1.87 0.493 Not significant
Marital Status 0.214 0.476 Not significant

International Journal of Advance and Innovative Research Volume 5, Issue 4 (XII): October - December, 2018
132
ISSN 2394 - 7780
Maintenance Type of Family 0.365 0.587 Not significant
Area of residence 1.387 0.874 Not significant
Original Seller of the car 0.235 0.844 Not significant
Source: Primary data
From the above table, it is understood that for the factors ambiance, documentation, car performance and maintenance, the table significance values are greater than 0.05, the level of significance, the null hypothesis is accepted. It is concluded that the opinion between different demographical profile do not differ significantly.
8. MAJOR FINDINGS It is concluded from the factor analysis that customers give importance to the below mentioned factors such as ambiance, documentation, car performance and maintenance while purchasing the pre-owned cars.
It is concluded from the Z test, Respondents belonging to particular gender, marital status, type of family, area of residence and influence of original seller of the car, have same level of importance on the factors ambiance, documentation, car performance and maintenance.
The demand for pre-owned car segment is increasing because of the growing number of nuclear families and their financial cringe. Hence the manufacturers should find out the needs, wants, tastes and preferences of the pre-owned car consumers
9. CONCLUSION The study highlights that the important factors influencing the purchase of pre-owned car were Ambiance, Documentation, Car performance, maintenance budget constraints, low cost, upgrading of driving skills, desire to own a car, company image and easy availability of spare parts. Marketer should offer better prices, keeping in mind the new small cars available in the market. To overcome the challenges in reaching pre-owned car consumers and studying consumer behaviour, the car marketers can formulate effective marketing strategies, besides creating a database of potential pre-owned car buyers with the help of existing car owners and organised dealers. Also, families who need to upgrade from two-wheelers to four-wheelers can be targeted for sale.
REFERENCES Andrew and Benging (2007), “How auction, seller and product factors influence the price premium in an
eBay used car auction market”, Indian Journal of Marketing, Vol.V.
Brodowsky and Howard Glen (2007), “The Role of Country of Origin in Consumer Purchase Decision: Development and Testing of a Comprehensive Theoretical Model”, Humanities and Social Sciences Dissertation, 58 (1): 224 – 225
Chidambaram, K., Soundra Rajan, A., and Alfread Mino (2008), “A Study on Brand Preference of Passenger Car with Reference to Coimbatore City”, Indian Journal of Marketing, New Delhi, 34(9):19 - 30.
Domon Darlin, (1983) “Although US Cars Are Improving, Imports Still Win Quality Survey – Wall Street Journal 1:31.
Erest Johnson (2011), “Attitude of car buyers, Towards Imported used cars: An Indian empirical study-IJCA” special Issue on, Wireless Information Networks & Business Information System.
George Katona, (2007), “The Relationship Between Psychology and Economics, in S.Koch (ed.), Psychology: A Study of A Science”. McGraw Hill, New York, p. 603.
Gill, A.S. and Sudhir, K. Jain (2005), “Consumer Purchase Process for Passenger Cars in India”, Journal of Marketing and Communication, 1(2):67-70.
Joseph W Newman and Richard A Werbal (1973), “Multivariate analysis of Brand Loyalty for Major Household Appliances”, Journal of Marketing Research Vol. X: 404 – 409.
Kaur, J (2007), “Impact of Viewing TV on the Social Life of Rural Illiterate and New –Literate Adults”, Psycho - Lingua, 28 (1): 39 - 44.
M Bird C Channon and A.S.C. Ehrenberg (1970), “Brand Image and Brand Usage”, Journal of Marketing Research, Vol. 7:307 – 314.

International Journal of Advance and Innovative Research Volume 5, Issue 4 (XII): October - December, 2018
133
ISSN 2394 - 7780
Maran, K (2007), “Scenario of Small Cars Segment: A Study With Reference to Chennai City”, An Unpublished Ph.D. Thesis Submitted to Annamalai University, Tamil Nadu State, pp. 34 - 80
Muralidhar, S (2007), “Passenger Cars: Distinct Signs of Maturity”, The Hindu Survey of Indian Industry, pp: 4 -6.
Roger D. Blackwell, Paul W. Miniard and James F. Engel (2002), ‘Consumer Behaviour’ 9th Edition, Vikas Publishing House, New Delhi, pp. 120 - 140.
Vikas Mehra (2007), “Analysis of Consumer’s Purchase Behaviour in Indian Mid - Sized Car Segment”, Business Review, 5(1):18 - 21.

International Journal of Advance and Innovative Research Volume 5, Issue 4 (XII): October - December, 2018
134
ISSN 2394 - 7780
INVESTIGATION ON ENERGY METER BILLING SYSTEMS BASED ON PERFORMANCE METRICS
S. Gowtham1, Dr. S. Gopinath2 and Dr. N. Sureshkumar3 Student1 and Associate Professor2, Department of ECE, Karpagam Institute of Technology, Coimbatore
Associate Professor3, Department of ECE, AVS Engineering College, Salem
ABSTRACT In this paper, it is observed that existing energy reading systems suffered from many issues such as complex design, narrow bandwidth, low data rate and less real time etc. This paper concludes the design and implementation of existing systems and observed the issues in the systems. From the analysis, is decided to move to GSM-based Energy Recharge System to put a solution to error prone systems and save the cost and time.
Errors are arising due to electromechanical meters, human faults and signal processors. These errors can be reduced by adopting GSM based energy billing system. This module provides the two way communication between the user and provider. It will be also used to recharge the electricity account through online mode from the home. It is also possible to include the features like dynamic tariff collection and prediction of energy consumption. It is required to design the system to reduce the electricity and to provide transparency between electricity providers and customers.
The payment of electricity consumption can be done via the online mode as similar to mobile phones. A user will be able to view the consumption of electricity in their device. A user can stop the flow of electricity usage from remote location if it is not in the use.
Keywords: Energy meter billing systems, GSM, Dynamic tariff and prediction of energy etc.
INTRODUCTION The concept of GSM based energy billing system is enhanced with Internet of Things (IoT). It is defined by International Telecommunication Union (ITU) and International Energy Research Centre (IERC). It is a dynamic network structure with self configuring capabilities based on communication protocols. It contains physical and virtual things that have physical attributes, virtual things and intelligent interfaces etc. They are integrated in the information network. IoT contains electronics, software, sensor node and network connectivity integrated with physical objects i.e. buildings, devices, and vehicles etc. The information can be exchanged between these objects. The IoT permits objects to sense and control the data remotely across network infrastructure. Prepaid meters are enabled with IoT that operates based on sufficient amount balance. The consumption of electric energy is also recorded in the real time system. The requirement of frequent tracking is required for recharging the prepaid meter. The Eliot meter [] is the smart meter which contains the concept of IoT and prepaid meter device.
Global System for Mobile Communication (GSM) is integrated with the prepaid energy meter that received the power consumed. If the power reaches the threshold amount, the alert will be sent to the consumer to recharge the same. It is best suited for private sectors, power distribution companies, IT parks and self containing house objects. GSM made the reading system as wireless in past two decades. GSM contain massive coverage region that can be used to put request or to retrieve the power consumption intimation message over houses and flats. To avoid unnecessary usage of power, GSM billing system is integrated with prepaid energy meter. It can also be operated in remote mode while the power is not in use. It is more helpful to monitor the electricity usage without visiting the houses.
LITERATURE SURVEY YujunBao and Xiaoyan Jiang [1] mentioned the vision, the challenges, potential usage eventualities and technological building blocks of "Internet of things". It absolutely was over with the discussion of social and governance problems that are doubtless to arise because the vision of the web of Things to become reality.
Ashna.K and Sudhish N St. George [2] planned a pursuit work to live and analyse the ability consumption of electricity employed by the client victimization with good metering. ARIMA model was used with XLASTAT tool with flattening technique for this purpose.
Philip Garner et.al [3] developed Associate in Nursing automatic meter reading system Automation of Residential Electricity that brings to Embedded Controller for domestic user. During this project, GSM
International Journal of Advance and Innovative Research Volume 5, Issue 4 (XII): October - December, 2018
135
ISSN 2394 - 7780
electronic equipment was used for transmission and receiving data which means that user side and energy supplier side.
Papadoglou and Stipidis [6] planned a paid meter victimization mobile communication. During this system, the controller unit, paid card and communication module were used.
Irfan Quazi [8] developed the microcontroller primarily based single section digital prepaid energy meter for improved meter and asking system. The shopper was put in every house and therefore the server was put in native station.
ISSUES AND PROPOSALS Distribution and maintenance of electricity is closely-held by native state electricity board. Electricity usage of a user is calculated by scheming KWH electricity used over the amount of a month. This reading is kept regionally on the meter. An employee from the electricity board takes this reading by visiting door to-door and manually notes it. This knowledge is then forwarded to the top electricity board for analysis, once analysis bill is generated on the idea of the readings taken on monthly basis. These generated bills are sent door-to-door by members of personnel. Then the recipients pay their bills by their favourable payment possibility. This method consumes heaps of your time and human efforts and bill is completely hooked in to the reading of the employees. So, no matter reading for a client the employee takes, client has to obtain it and since of the post-free methodology of payment for the electricity several users use electricity in terribly inefficient manner and generally they don’t even obtain months. This ends up in loss to the electricity board and loss of voltage similarly.
PROPOSED SYSTEM The present power usage reading is created manually by moving to the patron locations. It needs sizable amount of labour operators and long operating hours to accomplish the task. Manual asking is usually restricted and delayed by inclemency conditions. The written asking conjointly has the tendency of obtaining lost. Over the previous few years, Prepaid Energy Meter has been planned as Associate in effective innovative resolution geared toward facilitating affordability and reducing the price of utilities. This mechanism, basically, needs the users to obtain the electricity before its consumption. During this manner, customers hold credit then use the electricity till the credit is exhausted. If the out there credit is exhausted then the electricity offer is cut-off by a relay. Readings created by human operators are at risk of errors. This project addresses the higher than mentioned issues. The event of GSM infrastructure in past 20 years created meter reading system wireless.
Electricity usage of client is going to be sent to the server once a group amount. Client can then be ready to log into their account from the online app and can be ready to check their real time electricity usage. This method aims to bring transparency of asking and usage between the client and therefore the electricity board. Client can use less quantity of electricity attributable to the paid nature of the asking system. attributable to the psychological indisputable fact that if we have a tendency to obtain a resource before really victimization it, we have a tendency to find victimization less quantity of resource as compared to post-free methodology of payment. As a result, all the client bill accounts are going to be cleared at the time.
ADVANTAGES OF PROPOSED SYSTEM The users may be tuned in to their electricity consumption. The human work of collection readings by visiting each home at the finish of each month will be avoided by generating Electricity bills mechanically. Stealing of electricity may be avoided by tamper proof energy meters. The errors within the system may be known quickly.
WORKING The planned model has the PIC microcontroller as Central process Unit. The full system is interfaced with PIC microcontroller. The GSM electronic equipment is serially connected with the controller that is that the major communication module between User and supplier. The GSM uses its own network for the transfer of data. Special cryptography in embedded C is employed for programming PIC microcontroller based hardware system along with MP-LAB IDE package. The relay acts as change device to chop off and restore power offer. The alphanumeric display is interfaced to microcontroller victimization interface association. During this project, the Microcontroller primarily based system unceasingly records the readings and therefore the live meter reading may be sent to the Electricity department for the asking. This method disconnects the ability offer to the house just in case of non-payment of electricity bills. Passionate GSM electronic equipment with SIM card is needed for every energy meter. The microcontroller pulls the SMS received by phone, decodes it, acknowledges the Mobile no. then switches on the relays connected to its port to manage the appliances. Once eminent operation, controller sends back the acknowledgement to the user’s mobile through SMS. The cryptography technique reduces human labour however will increase the potency in calculation of bills for used electricity. The user can

International Journal of Advance and Innovative Research Volume 5, Issue 4 (XII): October - December, 2018
136
ISSN 2394 - 7780
have Associate in universal variety and that they will recharge retailers of electricity board .the acknowledgement of recharged coupon detail can come back to note of the patron and conjointly can get displayed in alphanumeric display module. Thus this method can bring an answer of making awareness on excess wastage of power and can tend to scale back wastage of power. This module can scale back the burden of energy providing by establishing the association simply and no stealing of power can takes place. The liquid crystal display can display the used quantity and balance quantity that may be used.
Working of this device relies on the technologies like paid meter and web of things. This meter is going to be connected to NODEMCU (A System on Chip Wi-Fi module). This NODEMCU are going to be connected to native Wi-Fi access purpose. each NODEMCU can have a novel number, at the time of installation of this device, workers of the electricity supplier can assign this device identity to user of the that meter. This device has to be recharged with some quantity of cash through the online portal of this device. This device can live the electricity units on the blinking vital sign of the junction rectifier of the meter and solely permit the electricity to tolerate if balance of that device isn't zero. This device is going to be connected to a server. NODEMCU are going to be programmed specified it'll send usage hourly to the server. Server can store all the incoming messages in information. This device connects to the electrical meter via a circuit which will connect a GPIO pin of this device to the KWh pulse junction rectifier. Usage of electricity will be calculated on the idea of the KWh PULSE junction rectifier blinking. Every one thousand times a junction rectifier blinks one unit of electricity are going to be side to the usage and value of that one unit are going to be subtracted from the device, which is able to be updated onto the server in real time. So as to own with success transition of information a operating web property is needed via Wi-Fi access purpose. If no web association is offered at the time of operation knowledge, it is going to be keep regionally and can transmit the information whenever web association is going to be available.
Figure – 1: Working model of GSM energy billing system
Figure – 2: Layout of Proposed system
Figure 1 and 2 shows the illustration of working model and layout of proposed system.
CONCLUSION With the increasing dependencies over electricity and web, good energy meter may be developed. These meters alongside Eliot victimization the construct of paid meter and web of things may be generated. Eliot has been developed victimization wireless technology 802.11. This good energy meters may be developed to resolve several issues like over usage of electricity, great deal of work force transparency of usage and wastage of cash

International Journal of Advance and Innovative Research Volume 5, Issue 4 (XII): October - December, 2018
137
ISSN 2394 - 7780
and resources etc. This technology permits verified customers to visualize standing of electricity usage by victimization Device number and positive identification in real time. This will be done from net application using online.
REFERENCES 1. YujunBao and Xiaoyan Jiang, “Design of electric Energy Meter for long-distance data information
transfers which based upon GPRS”, ISA2009. International Workshop on Intelligent Systems and Applications, 2009.
2. Ashna.K and Sudhish N George, "GSM based automatic energy meter reading system" IEEE Wireless communications, 2013.
3. Philip Garner, Ian Mullins, Reuben Edwards and Paul Coulton. "Mobile Terminated MS Billing - Exploits and Security Analysis" New Generation. Proceedings of the Thirdlnternational Conference on lnformation Technology: New Generations (ITNG'06) -Vol. 00 200, 10-12 April 2006, Las Vegas, Nevada, USA, pp. 294 - 299.
4. N. Papadoglou and E. Stipidis (1999) "Short message service link for automatic vehicle location reporting" Electronics Letters 27th May 1999 Vol. 35 No. 11, pp. 121-126.
5. Vivek Kumar Sehgal,Nitesh Panda, NipunRaiHanda, “Electronic Energy Meter with instant billing”,UK Sim Fourth European Modelling Symposium on Computer Modelling and Simulation.
6. N. Papadoglou and E. Stipidis (1999) "Short message service link for automatic vehicle location reporting" Electronics Letters 27th May 1999 Vol. 35 No. 11, pp. 121-126.
7. TanmoyMaity and ParthaSarathi Das, "Intelligent online measurement and management of energy meter data through advancedwireless network" IEEE Wireless communications ,2011.NCES
8. Irfan Quazi, Sachin Kumar Gupta, Rajendra Prasad, “Pre-paid Energy Meter based on AVR Microcontroller”, International Journal of Engineering Research and Applications (IJERA), Vol.1 , No.4, 2018. pp. 1879-1884.
9. Atmel Corporation - Atmel AT89S52 8- and 32- bit Microcontrollers http://www.atmel.com/ products/AT89S52.
10. Atmel AT89S52 Data Sheet http://www.keil.com/dd/docs/datashts/atmel/at89s52_ ds.pdf.

International Journal of Advance and Innovative Research Volume 5, Issue 4 (XII): October - December, 2018
138
ISSN 2394 - 7780
CLASSIFYING SENTIMENTS USING VADER AND LOGISTIC REGRESSION
Shorya Jain1 and Dr. Sanjay Kumar Malik2 Student1 and Associate Professor2, Guru Gobind Singh Indraprastha University, Delhi
ABSTRACT Sentiment analysis (SA) is the process of gauging the different emotions expressed in a piece of written text and categorizing it on different parameters and under different identifiable emotions. Recognizing the fact that different sentiment analysis tools often get confused over acronyms, emoticons, slangs etc. and that many tools do not utilize the use of punctuation and other words to determine the intensity of expressed sentiment which is an active area of research, this paper works on new developments in this regard. In this paper, first, the historical work done in this field has been emulated and its outcome and impact on sentiment analysis in modern world has been discussed. Second, Vader (Valence Aware Dictionary and sEntiment Reasoner), has been explored along with advantages it provides. Third, Logistic Regression (LR) has been employed to build a classifying model for text which can deal with anything, from web pages and emails to text corpus and tweets, and has an average accuracy of 86% across multiple runs. Next, differences between Vader and Logistic Regression have been analyzed in detail, with focus on the data cleaning required and output produced along with utilization and results produced using these two approaches. Finally, conclusions and inferences are drawn along with outlining future scope of work.
Keywords: Logistic Regression, Lexicons, Machine Learning, Natural Language Processing, Opinion Mining, Semantic Web, Sentiment Analysis, Vader, Sentiment Classification
1. INTRODUCTION SA has been a topic of increasing interest with the evolution and growth of information technology. With the ever increasing reach of web and movement towards Semantic Web, the power and efficiency of SA based tools is increasing exponentially. However, a common problem faced by many SA tools is lack of comprehension of sentiment-laden slangs and acronyms -which are found across a broad domain of texts and which thus hinder the efficiency and accuracy of these tools. They are unable to cope up with the modern practices and variety with regards to written text and are only good for well formatted and formal text pieces which limits their use and application [15]. It is also pertinent to note that SA tools are mostly utilized on platforms where opinions are present in an unstructured/unformatted manner, such as social media, discussion forums, review threads and blog posts. These platforms present a unique challenge as there is a large variation in writing styles of different users and the language syntax they utilize to present their opinion. These opinions are of significant value to a vast multitude of organizations, from PR firms looking to analyze results of their campaigns, service providers in any domain, public personalities to political parties and goes as far as economic firms, looking to gauge the public sentiment and trade on markets accordingly and make their investment decisions in an informed manner. Therefore, to overcome these challenges, Vader [1] has been used which is a newly developed tool of Natural Language Toolkit (NLTK) along with using Logistic Regression to build a classifier containing two parts which categorizes passed text on different parameters. When used in conjugation with Semantic Web, they can provide unprecedented level of flexibility to SA algorithms and increase the quality of their output [2].
2. LITERATURE REVIEW The origin of sentiment analysis can be found in 20th century, when deep studies were conducted on analysis of public opinion. However, until the presence of subjectively available text on web, sentiment analysis was largely absent from the purview of computer science [4]. One of the earliest and most influential work in sentiment analysis was the work done by Association for Computational Linguistics, which was founded in 1962. This community became the birthplace of sentiment analysis and one of the first paper in this regard was published by Wiebe in 1990[6], which was on detection of subjective sentences from a given narrative. He further published a gold standard to do same in 1999 [7]. Another paper published in 1997[8] by Hatzivassiloglou and McKeown utilized data from the Wall Street Journal and constructed a list of negative and positive adjectives as well as predicted if conjoined adjectives would be of different orientation or same.
The development of modern-day sentiment analysis may be attributed to the year 2002, when a wide array of work in that regard was done, which would lay the foundation for what sentiment analysis is today. In 2002, a paper titled “Thumbs up? Sentiment Classification using Machine Learning Techniques” [9] was published, which was one of the first papers that used movie review data and conclusively proved that classification of sentiments using machine learning outperformed carrying out the same process with human analysis by a wide margin. Another similar and path breaking paper published in same year was by Turney. This work was

International Journal of Advance and Innovative Research Volume 5, Issue 4 (XII): October - December, 2018
139
ISSN 2394 - 7780
amongst the first one where online reviews of banks, movies, automobiles and destinations was used. The subsequent year witnessed even more influential and far reaching work, such as work done by Turne and Litmann [11]. This paper suggested a method to determine the semantic orientation of a word from the statistical context in which it has been used. Another piece of important work from the year is by Dave, Lawrence and Pennock [5].
3. SEMANTIC WEB AND SENTIMENT ANALYSIS Sentiment analysis (SA) is the process of gauging the different emotions expressed in a piece of written text and categorizing it on different parameters and under different identifiable emotions. SA is used across a broad range of fields such as stock markets, elections, medicine, social media analysis, cybercrime prevention disaster mitigation etc. With the onset of semantic web, the efficiency and power of SA tools has increased in an unprecedented manner. At the same time, it has also brought new challenges associated with same into light. One of the basic advantage of semantic web with regards to SA is the fact that it helps structuring natural text with a formal representation. In their work, H. Saif, Y. He, and H. Alani [16] have actually proven that adding semantic features to SA tools brings a significant change in the performance of the tool. Semantic Web can also provide us with a large measure of flexibility in language processing and analysis while also improving the ability to detect subtle emotions and further enhancing the depth of knowledge bases [2]. This can also allow us to significantly amplify the current technologies and tools in field of SA to pursue, correlate, and differentiate between sentiment of specific entities or group of related entities over time and across different contexts.
However, existing SA tools incorporating semantic features are heavily reliant on the existence of manually annotated samples and thus they are usually domain-dependent and not suited for large scale applications [2]. Also, any tool based on semantic web has to address the minimal challenges posed by the Semantic Web Challenge call [2]. This means that the application is needed to be an end-user application which provides a practical value to the general Web users; the used sources of information should be syntactically, structurally, and semantically heterogeneous, under diverse ownership/ control, and containing significant amounts of real world data, (where the data’s meaning plays a central role); Semantic Web technologies must be used for representing meaning and useful information must be derived employing interesting ways to manipulate or process the data, such that this semantic information processing plays a central role in achieving things that alternative technologies are not capable of doing as well, or at all. Adding on to these, further desirable features include that the application should be scalable, should utilize all the data currently published on the Semantic Web, functionality should be different from pure information retrieval and the application should have clear commercial potential as well as large existing user base [2].
It should however be noted that an SA tool developed with incorporation of Semantic Web technologies would inherently have some other desirable features, such as functionality being different from/going beyond pure information retrieval and application having clear commercial potential.
4 A. VADER FOR SENTIMENT ANALYSIS VADER is a rule-based sentiment analysis tool which works on lexicon analysis. It uses a host of quantitative and qualitative measures to build as well as empirically validate a list of lexical features and their associated intensity measures of sentiment [1]. It has an F1 score of 0.96 with regards to classification accuracy and classifies given text into positive, negative and neutral along with a combined normalized weighted score for same. It utilizes a parsimonious rule-based modeling for construction of a sentiment classifier which offers an array of advantages over conventional classifiers such as generalization across multiple domains, no requirement of training data, no tradeoff between speed and performance and is also agile enough to be used online with streaming data. The classifier is also very sensitive to the polarity of expressed sentiment. It also incorporates word-order relationship in a sentiment and further also combine the emphasis generated by punctuation, capitalization, degree modifiers, conjunctions contrastive in nature and negation flipping the sentiment of a sentence. VADER constantly has performed and even occasionally outstripped algorithms specifically built for particular domains and therefore is a general application sentiment analyzer that has a proven record of performance excellence [1].
4 B. CODE SNIPPET AND USE OF VADER
Fig-1: Written using Python in Visual Studio Code

International Journal of Advance and Innovative Research Volume 5, Issue 4 (XII): October - December, 2018
140
ISSN 2394 - 7780
VADER has been utilized to provide a central processing and performance algorithm which has been used to parse clean data and produce the output parameters classifying the data. For cleaning the data, all punctuations except exclamation marks and full stops had to be removed. Furthermore, stopwords, times, dates and HTML tags also were removed. The cleaned review is then passed and is given a score in categories of positive, negative and neutral. The compound score is calculated by adding the valance score of each word in the lexicon. This is further normalized to be always between -1 (extremely negative) to +1 (extremely positive). This is very useful parameter as it provides with a single, unidimensional measure of the sentiment of the passed data and is formally called the normalized weighted composite score. Each review, which is stored in a list, is taken up separately and passed to Sentiment Intensity Analyzer function of VADER using which polarity scores of each review have been calculated and displayed, as shown in Fig. 1.
5 A. LOGISTIC REGRESSION Logistic Regression is a statistical model which is used to conduct a regression analysis, predictive in nature, and used to analyze a dataset which contains one or multiple independent variables which are key to determining the outcome. It is predictive in nature and thus the outcome is a dichotomous variable [12]. It generates a series of coefficients along with significance levels as well as standard errors to provide a general prediction of a logit transformation of the chances of presence of of the characteristic of interest. Some basic assumption with in logistic regression includes no outliers in data, no high correlations or multicollinearity between the predictors/dependent variables [13].
Using the objective of logistic regression as basis, formula for logistic regression can be represented as shown in equation (1): [12]
(1)
where p is the probability of presence of the characteristic of interest. Logged odds are used to define the logit transformation, as shown in equation (2) [12]:
(2)
and thus equation (3) is obtained [12]:
(3)
Here Logistic Regression is the best baseline model to be used because of 3 reasons:
1. It is very easy to interpret, mathematically as well as empirically, and thus is easy to implement and explain, allowing for a simple development and scaling process.
2. It performs very well on multiple kinds of datasets and thus is the preferred choice for a general purpose sentiment analysis tool.
3. Models based on logistic regression tend to learn very fast as compared to other kinds of algorithms and therefore are useful in increasing the efficiency of the processing algorithms.
5 B. CODE SNIPPET AND USE OF LOGISTIC REGRESSION
Fig-2: Written using Python in Visual Studio Code

International Journal of Advance and Innovative Research Volume 5, Issue 4 (XII): October - December, 2018
141
ISSN 2394 - 7780
LR has been used to build a statistical analysis model for the given data. The program utilizes scikit-learn machine learning library. As shown in Fig.2, the services of CountVectorizer have been utilized to convert the given data/text into a sparse matrix consisting of token counts. Then, fit function has been used, passing the test data as parameter which is for the purpose of building a vocabulary dictionary of all tokens in the passed data. Further, transform function has been called to convert the vocabulary that was previously built into document-term matrix. After this, the given test data matrix is divided into random train and test subsets and then use the returned subsets to build a model with LR using LogisticRegression class from sklearn.linear_model. Then the accuracy of the fit is calculated by using an inbuilt function called accuracy_score of sklearn [14] and with testing for different values of hyperparameter c, the best possible value has been determined on the basis of best fit provided which is reflected in the calculated accuracy score for that particular value of c. It takes input as the corpus of 50,000 reviews, divided into training and testing sets and produces coefficients for each sentiment laden word as the output.
6. COMPARATIVE ANALYSIS
Attribute Vader Logistic Regression
Punctuation Exclamation marks are required by Vader to calculate the intensity of expressed sentiment along with full stops to determine end of sentence.
It does not require any punctuation except full stops.
Uniform Case Capitalization indicates a stronger sentiment and thus is not removed.
Capitalization is removed to ensure uniformity of different occurrences of a word.
Results All reviews were separately given a compound score as well scores on negativeness, positiveness and neutrality.
The whole corpus was analyzed and each sentiment was given a numerical coefficient accordingly.
Utilization It is useful where an insight on polarity as well an overall score is needed but cannot be used to generated detailed insights
It is useful when a detailed and minute analysis is needed as well as is easily scalable but does not provide an overall picture
7. RESULT The dataset that has been used was compiled by Andrew Maas [3]. It provides a set of selected 25,000 highly polar movie reviews for training and 25,000 reviews for testing classifier.
As given in Fig. 3, the output using VADER displays the positive, negative and neutral score of the passed phrase, with each score between 0 and 1 and total of all 3 scores always being equal to 1. The compound score is further determined by valence scores. This signifies the part of phrase that is positive, negative and neither, which is a useful insight across many fields.
The output using Logistic Regression on the other hand, shown in Fig. 4, displays the final accuracy of classifier on the basis on known information about test data along with providing the coefficients assigned to various sentiment-laden words which further indicates their occurrence and weight across the passed 50,000 movie reviews.
8. CONCLUSION AND FUTURE SCOPE The results from passing the data through VADER are a testimony to the capability in analyzing passed data and presenting an accurate analysis of its overall sentiment as well as giving a precise breakdown of positive, negative and neutral parts. This can be very helpful as often end user of SA tools are not only looking for overall polarity of the view (negative or positive) but are often looking for areas for improvement which can be accurately determined using this model as it performs a comparative analysis.
On the other hand, the results from model built using LR is an example of a conscientious classifier that is easy to train and test. It correctly assigns coefficients to sentiment-laden words/phrases and performs with a reasonably good accuracy. Thus, it provides us with an easy to use and scalable model having capability to provide minute insights that cannot be incorporated into other models. Combining these two approaches, a model can be developed which can serve across multiple domains and provide an unprecedented spectrum of insights into data that is collected.

International Journal of Advance and Innovative Research Volume 5, Issue 4 (XII): October - December, 2018
142
ISSN 2394 - 7780
The main challenge SA currently faces is the difficulty in capturing complex sentiments like sarcasm, irony, and mockery, which is only possible with intervention of an average human reader, something which limits our efforts in this field and is an interesting area of work. The further scope of work also lies in development of an actual tool which combines these two approaches and is integrated with SW as well as implementation of network modelling to allow capture human interactions in real time.
APPENDIX: OUTPUT SCREENSHOTS In this section, screenshots of the result as well as the code snippet that has been used to generate these results have been attached.
Fig-3: Output using Vader
Fig-4: Output using Logistic Regression

International Journal of Advance and Innovative Research Volume 5, Issue 4 (XII): October - December, 2018
143
ISSN 2394 - 7780
REFERENCES [1] Hutto, C.J. & Gilbert, E.E. (2014). VADER: A Parsimonious Rule-based Model for Sentiment Analysis
of Social Media Text. Eighth International Conference on Weblogs and Social Media (ICWSM-14). Ann Arbor, MI, June 2014
[2] Diego Reforgiato Recupero, Sergio Consoli, Aldo Gangemi, Andrea Giovanni Nuzzolese, Valentina Presutti, and Daria Spampinato: Semantic Web-based Sentiment Analysis.
[3] Maas, Andrew L. and Daly, Raymond E. and Pham, Peter T. and Huang, Dan and Ng, Andrew Y. and Potts, Christopher: Learning Word Vectors for Sentiment Analysis. Proceedings of the 49th Annual Meeting of the Association for Computational Linguistics: Human Language Technologies, Portland, Oregon, USA, June 2011.
[4] Mika V. Mäntylä, Daniel Graziotin, Miikka Kuutila:The Evolution of Sentiment Analysis-A Review of Research Topics, Venues, and Top Cited Papers.
[5] K. Dave, S. Lawrence, and D. M. Pennock, “Mining the peanut gallery: Opinion extraction and semantic classification of product reviews,” Proceedings of the 12th international conference on World Wide Web, 2003.
[6] M. Wiebe: Recognizing subjective sentences: a computational investigation of narrative text. 1990.
[7] J. M. Wiebe, R. F. Bruce, and T. P. O’Hara: Development and use of a gold standard data set for subjectivity classifications. Proceedings of the 37th annual meeting of the Association for Computational Linguistics on Computational Linguistics. 1999
[8] V. Hatzivassiloglou and K . R . Mc Keown: Predicting the semantic orientation of adjectives. Proceedings of the Eighth conference on European chapter of the Association for Computational Linguistics, 1997.
[9] B. Pang, L. Lee, and S. Vaithyanathan: Thumbs up?: sentiment classification using machine learning techniques. Proceedings of the ACL conference on Empirical methods in natural language processing. 2002
[10] P.D. Turney: Thumbs up or thumbs down? Semantic orientation applied to unsupervised classification of reviews. Proceedings of the 40th annual meeting on association for computational linguistics. 2002
[11] L. Littman: Measuring praise and criticism: Inference of semantic orientation from association. ACM Transactions on Information Systems (TOIS) 2003.
[12] Logistic Regression: A Primer by Fred Pampel
[13] Regression Modeling Strategies: With Applications to Linear Models, Logistic Regression, and Survival Analysis by Frank E. Harrell
[14] Introduction to Machine Learning with Python: A Guide for Data Scientists by Andreas C. Müller and Sarah Guido
[15] Natural Language Processing with Python. – Analyzing Text with the Natural Language Toolkit by Steven Bird, Ewan Klein, and Edward Loper.
[16] Saif H., He Y., Alani H. (2012) Semantic Sentiment Analysis of Twitter. In: Cudré-Mauroux P. et al. (eds) The Semantic Web – ISWC 2012. ISWC 2012. Lecture Notes in Computer Science, vol 7649. Springer, Berlin, Heidelberg.
International Journal of Advance and Innovative Research Volume 5, Issue 4 (XII): October - December, 2018
144
ISSN 2394 - 7780
IMPACT OF SMART CITY SERVICES ON THE HAPPINESS INDEX OF DUBAI: AN EMPIRICAL ANALYSIS
Esam Khamis Alfalasi1, Dr. Dayanand Pandey2 and Dr. Mohd. Tahseen Burney3 Research Scholar1 and Professor3, Department of Management Studies, Al-Falah University, Faridabad
Director2, Jaipuria Institute of Management, Noida
ABSTRACT Happiness does not exist in any external object, but lies deep within us. Happiness is therefore a state of being – a state in which a desire is satisfied, or the cause of a fear is removed, and in that temporary calm our mind enjoys a taste of its own happiness. So what intrigue us that what does it mean to be happy — and why do we need to be happy? The objective of this research is to examine the impact of Smart City Services on Happiness Index of Dubai considering six elements of Smart City Services i.e. Basic amenities, Culture, Transport Facilities, Governance, Technological Advancement and Physical Environment variables. The relationship between the elements of independent variable i.e Smart city services and dependent variable i.e. Happiness Index of Dubai has been empirically validated.
The reliability analysis has been used to find out the degree of internal consistency among the statements based on a scale. Exploratory factor analysis has also been conducted that depicts the Bartlett test of sphericity and KMO shows the degree of correlation among the variables. Correlation and regression analysis have been conducted to test the relationship among the variables. This study would be useful to policy makers in learning how to identify smart cities, to plan incentives for their development, and to monitor the “smart” progress of their cities
Keywords: Smart City, Dubai, Happiness Index, Smart City Services
INTRODUCTION More than half of the world’s population now lives in urban areas, which lead to facing intractable challenges. This includes increased populations placing massive pressure on city infrastructures; polarized economic growth where and increased greenhouse-gas emissions (GHGs) forcing cities to develop sustainability strategies for energy, transportation, water management, urban planning, eco-friendly building, etc. The economic climate continues to place huge budgetary constraints on cities. The Smart City Framework (SCF) proposed to help stakeholders and city community participant understand how cities operate, and the role of ICT within physical city.
SMART CITIES AS A MODEL Castiella (2014) proposed to serve as an starting point to measure Smart Cities performance in accordance with their Smartness level, also the model presented is a starting point for research, based on the study of the dimensions and KPI´s from field experience in many cities. Methodological aspects of the model will be analysed in greater depth in subsequent works. The researcher took variables Economy, Mobility, Environment, People, Quality of, living, governance, People, Habitat, tourism and suggested a model.
THE DUBAI PLAN 2021 “The plan addresses the government as the custodian of the city development in all aspects. These perspectives were divided into six themes, each highlighting a group of strategic developmental aims for Dubai, and together forming the city’s vision for 2021”. (The Executive Council, 2014). The six themes included in the plan are listed below- The people- A city of happy, creative and empowered people, aimed at nurturing healthy individuals who are educated and well cultured; who are innovative embody the mindset of entrepreneur; individuals who are proud of their culture. The society- An inclusive and cohesive society, aimed at forging a sustainable multi-cultural society, which is tolerant and inclusive of all cultures. The experience- The preferred place to live, work and visit, aimed at providing safe and secure experience, and the best of education, healthcare, housing, entertainment, and sports. The place- A smart and sustainable city, aimed at developing a city, which is environmentally clean, with well-connected city areas and a pioneer in utilizing renewable energy sources. The economy- A pivotal hub in the global economy, aimed at continuing the sustainable economic growth, making Dubai into one of the world’s leading business centres.

International Journal of Advance and Innovative Research Volume 5, Issue 4 (XII): October - December, 2018
145
ISSN 2394 - 7780
The government- A pioneering and excellent government, aimed at making the Government transparent and reliable, along with meeting the demands of individuals and society as a whole.
OBJECTIVE OF THE STUDY The objective of this research is to propose a conceptual framework based on identified the smart city services under the Dubai Plan 2021 on the overall living experience of the citizens and on the overall Happiness Index of Dubai. The objectives were categorically focused to examine the impact of Smart City Services on Happiness Index of Dubai.
MAIN ELEMENTS OF SMART CITY SERVICES A series of constructs have been developed and these constructs have subsequently been used to develop a framework which has been empirically tested and validated. The research framework for assessing the impact of smart city services on Happiness Index of Dubai shown as in Figure 1 proposes Six major elements of smart city services including (a) Basic amenities, (b) Culture (c) Public Transport Facilities (d) Governance , (e) Technological Advancement and (f) Physical Environment variables. The framework has been empirically tested and validated to confirm the proposed relationship between the elements of independent variable i.e Smart city services and dependent variable i.e. Happiness Index of Dubai.
Table-1: Summary of Proposed Research Framework Independent Variable Elements of Independent Variable Dependent Variable
Smart City Services
Basic amenities Culture Public Transport Facilities Governance Technological Advancement Physical Environment
Happiness Index of Dubai
Figure-1: Conceptual Framework showing Relationship of Elements of Independent variable (Smart City
Services) with Dependent Variable (Happiness Index)
PROPOSED HYPOTHESES On the basis of the above conceptual framework, The following Null and Alternate Hypotheses can be formulated depicting the relationship among the elements of independent Variable (Smart city services) and Dependent Variable (Happiness Index).

International Journal of Advance and Innovative Research Volume 5, Issue 4 (XII): October - December, 2018
146
ISSN 2394 - 7780
Table-2: Hypotheses depicting the relationship among the elements of independent and Dependent Variables Variable Alternate
Hypothesis Code Alternate Hypothesis
Basic amenities for living
HA1 The availability of facilities to fulfil Basic amenities for living has significant impact on Happiness Index
Culture HA2 The Culture has significant impact on Happiness Index Public Transport
Facilities HA3 The availability of Public Transport Facilities has significant
impact on Happiness Index Governance
System HA4 The Governance system has significant impact on Happiness
Index. Technological Advancement
HA5 The Technological Advancement has significant impact on Happiness Index.
Physical Environment
HA6 The Physical Environment has significant impact on Happiness Index.
ANALYSIS Scale Reliabilities The internal consistency of the entire scale is measured by calculating the coefficient alpha popularly known as Cronbach’s Alpha. The lowest acceptable limit for cronbach’s alpha is 0.70.
Table-3: Reliability analysis Variable No. of Items Cronbach’s Alpha
Basic Amenities 5 0.773 Culture 4 0.855
Transport Facility 5 0.909 Governance System 5 0.763
Technological Advancement 3 0.847 Physical Environment 5 0.865
Total No of Items 27 0.971
The reliability values of major variables of the entire scale are given in Table 1. The cronbach’s alpha for each variable is above 0.70. Hence the scale is reliable.
Awareness of Dubai Plan 2021 When sample respondents were asked whether they are aware of about the Dubai Plan- 2021, the majority of sample respondents i.e. 67.6 percent opined that indeed they are aware of it. 32.4 percent respondents were found unaware about the Dubai Plan-2021. Thus from the Table it is clear that as high as 67.6 percent respondents are well aware about the ensuing Dubai Plan-2021.
Table-4: Are you aware of the Dubai Plan 2021? Frequency Percent Valid Percent Cumulative Percent
Valid No 105 32.4 32.4 32.4 Yes 219 67.6 67.6 100.0
Total 324 100.0 100.0
Figure-2: Are you aware of the Dubai Plan 2021?

International Journal of Advance and Innovative Research Volume 5, Issue 4 (XII): October - December, 2018
147
ISSN 2394 - 7780
Exploratory Factor Analysis Following table depicts the Bartlett test of sphericity and KMO measure of sampling adequacy along with the results of exploratory factor analysis. The KMO is used to quantifies the degree of correlation among the variables. The rule of thumb suggests that the KMO value must be greater than or equal to .50 for its acceptance.
Table-5: Results of Exploratory Factor Analysis
Factor Loading
KMO Measure of Sample
Adequacy (>0.5)
Bartlett's Test of Sphericity
Items confirmed
Items dropped
Cum % of loading
Eigen Values
Chi Square
Sig. (<.10)
Basic amenities for Living BAL1 .502
.750
584.555
.000
5
0
54.048
2.702 BAL2 .804 BAL3 .537 BAL4 .861 BAL5 .881
Culture CLTR1 .843
.745
667.237
.000
4
0
70.595
2.824 CLTR2 .803 CLTR3 .835 CLTR4 .879
Transport Facility PTRPTF1 .901
.831
1253.673
.000
5
0
74.779
3.739 PTRPTF2 .909 PTRPTF3 .839 PTRPTF4 .862 PTRPTF5 .809
Governance System GVNCS1 .780
.738
466.804
.000
5
0
53.052
2.653 GVNCS2 .587 GVNCS3 .872 GVNCS4 .705 GVNCS5 .665
Technological Advancement TECHADV1 .914
.716
463.525
.000
3 0
78.263
2.348 TECHADV2 .882
TECHADV3 .858 Physical Environment
PHYENV1 .881
.825
822.259
.000
5
0
65.936
3.297 PHYENV2 .865 PHYENV3 .755 PHYENV4 .774 PHYENV5 .777
KMO statistics value varies between 0 to 1. A value close to one indicates that pattern of correlations are relatively compact and so factor analysis yields distinct and reliable factor. As far as the above test is concerned, the value of sampling adequacy of basic amenities 0.750, culture 0.745, transport facilities 0.831, governance system 0.738, technological advancement 0.716 and physical environment came out to be 0.825. So, sampling adequacy is tested and found to be good.
The factor loading for each indicator statement is also greater than the recommended value (0.5). Therefore, all the indicator statements have been retained for further analysis.

International Journal of Advance and Innovative Research Volume 5, Issue 4 (XII): October - December, 2018
148
ISSN 2394 - 7780
Results of Correlation Analysis Pearson's correlation coefficient (r) is a measure of the strength of the association between the variables.
Table-0: Pearson’s Coefficient Correlation (r) between SCS and Happiness Index Basic
Amenities Culture Public
Transport Facility
Governance System
Technological Advancement
Physical Environment
Basic Amenities Pearson Correlation 1 Sig. (2-tailed)
Culture Pearson Correlation .913** 1 Sig. (2-tailed) .000
Public Transport Facility
Pearson Correlation .823** .880** 1 Sig. (2-tailed) .000 .000
Governance System
Pearson Correlation .782** .804** .907** 1 Sig. (2-tailed) .000 .000 .000
Technological Advancement
Pearson Correlation .794** .863** .983** .908** 1 Sig. (2-tailed) .000 .000 .000 .000
Physical Environment
Pearson Correlation .790** .849** .972** .870** .956** 1 Sig. (2-tailed) .000 .000 .000 .000 .000
Pearson Correlation, N=324
**. Correlation is significant at the 0.01 level (2-tailed).
A stronger relationship is exhibited among major constructs of independent variables (Smart City Services) and the dependent variables (Happiness Index of Dubai). A basic amenity is having a strong positive correlation with culture (0.913). Public transport is strongly correlated with basic amenities (0.823). Governance system is depicting a positive correlation with public transport (0.907). Technological advancement is shown a strong positive relation with governance system (0.908) and physical environment having a strong positive correlation technological advancement (0.956) correlate significantly with almost all of the other variables (Refer Table). It is concluded that there is strong positive correlation between the construct of independent variable (SCS) and dependent variable (HID) exhibit strong correlation. The highest level of correlation is between physical environment and ‘technological advancement’ (0.956).
Regression Analysis A number of separate regression models are developed and tested for the dependent variables. Six major variables i.e., basic amenities, culture, public transport, governance system, technological advancement and physical environment are separately taken as independent variables in regression models with happiness index of Dubai as dependent variable as depicted in the following Tables. For this purpose, Model Summary, ANOVA and Coefficients have been presented and analyzed to understand the results from the regression procedure. Assuming that no assumptions have been violated, a complete explanation of the output has been interpreted. The details of regression analysis of major variables by statistical software (SPSS 22) are given below.
Table-7: Regression Analysis Model Summary for Happiness Index Model Summary
Model R R Square Adjusted R Square Std. Error of the Estimate 1. Basic Amenities .708a .502 .500 1.48773
2. Culture .706b .498 .497 1.49293 3. Public Transport Facility .863c .745 .744 1.06423
4. Governance System .816d .665 .664 1.21897 5. Technological Advancement .910e .827 .827 .87607
6. Physical Environment .839f .703 .702 1.14777 a. Predictors: (Constant), Basic Need for Living b. Predictors: (Constant), Culture c. Predictors: (Constant), Public Transport Facility d. Predictors: (Constant), Governance System e. Predictors: (Constant), Technological Advancement f. Predictors: (Constant), Physical Environment
All the six independent factors, basic amenities, culture, public transport, governance system, technological advancement and physical environment are the significant predictors of happiness index of Dubai by step-wise

International Journal of Advance and Innovative Research Volume 5, Issue 4 (XII): October - December, 2018
149
ISSN 2394 - 7780
regression analysis. In the Table 7, R square at 0.502 (basic amenities) indicates that the macro variables are able to explain happiness index of Dubai to the extent of 50 percent. R square at 0.498 (culture) explain the happiness index of Dubai to the extent of 49 per cent. R square at 0.745 (Public transport facility) explain the happiness index of Dubai to the extent of 74 per cent. R square at 0.665 (governance system) explain the happiness index of Dubai to the extent of 66 per cent. R square at 0.827 (technological advancement) explain the happiness index of Dubai to the extent of 82 per cent. R square at 0.703 (physical environment) explain the happiness index of Dubai to the extent of 70 per cent. Hence it is concluded that technological advancement of Dubai is a major variable which explain the happiness index of Dubai to the extent of 82.7 per cent.
Table-8: ANOVA for Happiness Index as Dependent Variable ANOVAa
Model Sum of Squares Df Mean Square F Sig.
1 Regression 717.436 1 717.436 324.140 .000b Residual 712.700 322 2.213
Total 1430.136 323
2 Regression 712.445 1 712.445 319.647 .000b Residual 717.691 322 2.229
Total 1430.136 323
3 Regression 1065.446 1 1065.446 940.727 .000b Residual 364.690 322 1.133
Total 1430.136 323
4 Regression 951.682 1 951.682 640.483 .000b Residual 478.454 322 1.486
Total 1430.136 323
5 Regression 1182.999 1 1182.999 1541.355 .000b Residual 247.137 322 .768
Total 1430.136 323
6 Regression 1005.940 1 1005.940 763.593 .000b Residual 424.196 322 1.317
Total 1430.136 323 a. Dependent Variable: Happiness Index b. Predictors: (Constant), Basic Need for Living c. Predictors: (Constant), Public Transport Facility d. Predictors: (Constant), Governance System e. Predictors: (Constant), Technological Advancement
Table 8 given shows the results of ANOVA. Since Value of ‘F’ of all six major variables of independent variables are significant [F = 324.140 (basic amenities), F = 319.647 (culture), F = 940.272 (public transport facility), F = 640.483 (governance system), F = 1541.355 (technological advancement), F = 763.593 (Physical environment) and p =.000<0.05] which shows that model is a good fit and significant. The result of ANOVA shows that Smart City Services is a significant predictor of Happiness Index of Dubai.
Table 9: Coefficient Summary for Happiness Index as Dependent variable Coefficientsa
Model Unstandardized Coefficients
Standardized Coefficients
t Sig.
B Std. Error Beta
1 (Constant) -1.344 .460 -2.919 .004 Basic Need for Living 1.140 .063 .708 18.004 .000
2 (Constant) -.724 .429 -1.686 .093 Culture 1.041 .058 .706 17.879 .000
3 (Constant) -2.256 .301 -7.485 .000 Public Transport Facility 1.223 .040 .863 30.671 .000
4 (Constant) -4.454 .450 -9.895 .000 Governance System 1.484 .059 .816 25.308 .000
5 (Constant) -2.464 .241 -10.218 .000 Technological Advancement 1.257 .032 .910 39.260 .000
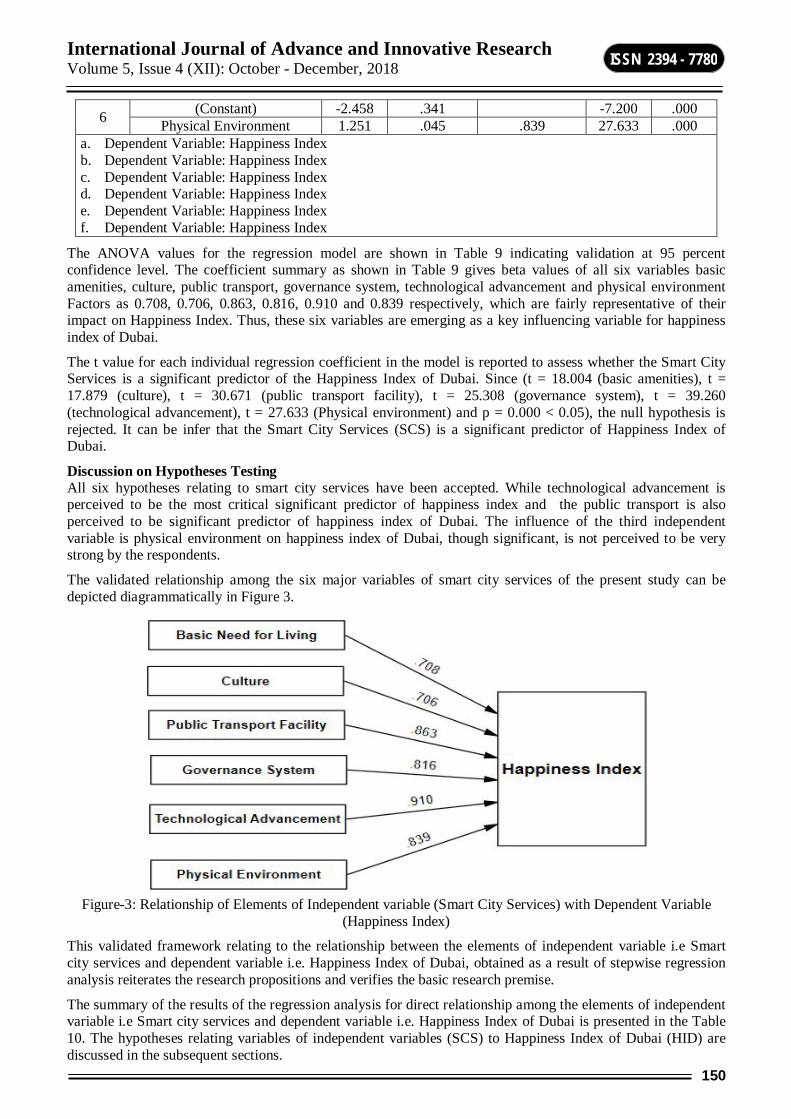
International Journal of Advance and Innovative Research Volume 5, Issue 4 (XII): October - December, 2018
150
ISSN 2394 - 7780
6 (Constant) -2.458 .341 -7.200 .000 Physical Environment 1.251 .045 .839 27.633 .000
a. Dependent Variable: Happiness Index b. Dependent Variable: Happiness Index c. Dependent Variable: Happiness Index d. Dependent Variable: Happiness Index e. Dependent Variable: Happiness Index f. Dependent Variable: Happiness Index
The ANOVA values for the regression model are shown in Table 9 indicating validation at 95 percent confidence level. The coefficient summary as shown in Table 9 gives beta values of all six variables basic amenities, culture, public transport, governance system, technological advancement and physical environment Factors as 0.708, 0.706, 0.863, 0.816, 0.910 and 0.839 respectively, which are fairly representative of their impact on Happiness Index. Thus, these six variables are emerging as a key influencing variable for happiness index of Dubai.
The t value for each individual regression coefficient in the model is reported to assess whether the Smart City Services is a significant predictor of the Happiness Index of Dubai. Since (t = 18.004 (basic amenities), t = 17.879 (culture), t = 30.671 (public transport facility), t = 25.308 (governance system), t = 39.260 (technological advancement), t = 27.633 (Physical environment) and p = 0.000 < 0.05), the null hypothesis is rejected. It can be infer that the Smart City Services (SCS) is a significant predictor of Happiness Index of Dubai.
Discussion on Hypotheses Testing All six hypotheses relating to smart city services have been accepted. While technological advancement is perceived to be the most critical significant predictor of happiness index and the public transport is also perceived to be significant predictor of happiness index of Dubai. The influence of the third independent variable is physical environment on happiness index of Dubai, though significant, is not perceived to be very strong by the respondents.
The validated relationship among the six major variables of smart city services of the present study can be depicted diagrammatically in Figure 3.
Figure-3: Relationship of Elements of Independent variable (Smart City Services) with Dependent Variable
(Happiness Index)
This validated framework relating to the relationship between the elements of independent variable i.e Smart city services and dependent variable i.e. Happiness Index of Dubai, obtained as a result of stepwise regression analysis reiterates the research propositions and verifies the basic research premise.
The summary of the results of the regression analysis for direct relationship among the elements of independent variable i.e Smart city services and dependent variable i.e. Happiness Index of Dubai is presented in the Table 10. The hypotheses relating variables of independent variables (SCS) to Happiness Index of Dubai (HID) are discussed in the subsequent sections.
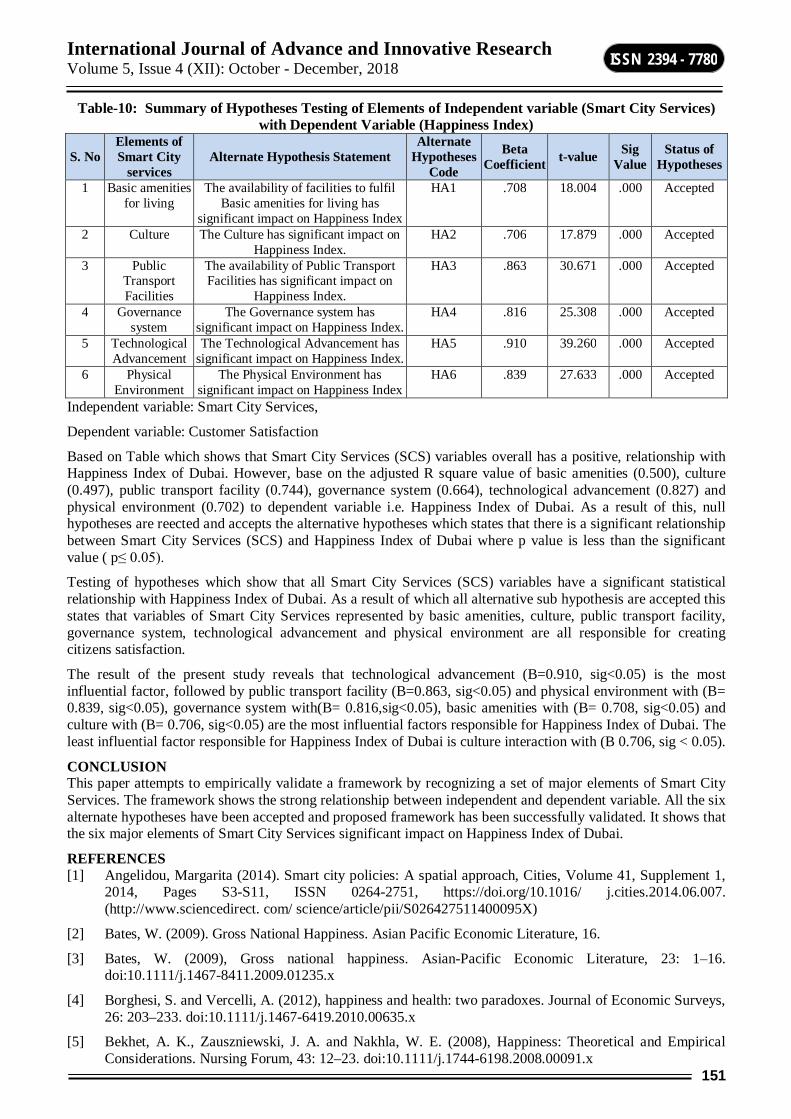
International Journal of Advance and Innovative Research Volume 5, Issue 4 (XII): October - December, 2018
151
ISSN 2394 - 7780
Table-10: Summary of Hypotheses Testing of Elements of Independent variable (Smart City Services) with Dependent Variable (Happiness Index)
S. No Elements of Smart City
services Alternate Hypothesis Statement
Alternate Hypotheses
Code
Beta Coefficient t-value Sig
Value Status of
Hypotheses
1 Basic amenities for living
The availability of facilities to fulfil Basic amenities for living has
significant impact on Happiness Index
HA1 .708 18.004 .000 Accepted
2 Culture The Culture has significant impact on Happiness Index.
HA2 .706 17.879 .000 Accepted
3 Public Transport Facilities
The availability of Public Transport Facilities has significant impact on
Happiness Index.
HA3 .863 30.671 .000 Accepted
4 Governance system
The Governance system has significant impact on Happiness Index.
HA4 .816 25.308 .000 Accepted
5 Technological Advancement
The Technological Advancement has significant impact on Happiness Index.
HA5 .910 39.260 .000 Accepted
6 Physical Environment
The Physical Environment has significant impact on Happiness Index
HA6 .839 27.633 .000 Accepted
Independent variable: Smart City Services,
Dependent variable: Customer Satisfaction
Based on Table which shows that Smart City Services (SCS) variables overall has a positive, relationship with Happiness Index of Dubai. However, base on the adjusted R square value of basic amenities (0.500), culture (0.497), public transport facility (0.744), governance system (0.664), technological advancement (0.827) and physical environment (0.702) to dependent variable i.e. Happiness Index of Dubai. As a result of this, null hypotheses are reected and accepts the alternative hypotheses which states that there is a significant relationship between Smart City Services (SCS) and Happiness Index of Dubai where p value is less than the significant value ( p≤ 0.05).
Testing of hypotheses which show that all Smart City Services (SCS) variables have a significant statistical relationship with Happiness Index of Dubai. As a result of which all alternative sub hypothesis are accepted this states that variables of Smart City Services represented by basic amenities, culture, public transport facility, governance system, technological advancement and physical environment are all responsible for creating citizens satisfaction.
The result of the present study reveals that technological advancement (B=0.910, sig<0.05) is the most influential factor, followed by public transport facility (B=0.863, sig<0.05) and physical environment with (B= 0.839, sig<0.05), governance system with(B= 0.816,sig<0.05), basic amenities with (B= 0.708, sig<0.05) and culture with (B= 0.706, sig<0.05) are the most influential factors responsible for Happiness Index of Dubai. The least influential factor responsible for Happiness Index of Dubai is culture interaction with (B 0.706, sig < 0.05).
CONCLUSION This paper attempts to empirically validate a framework by recognizing a set of major elements of Smart City Services. The framework shows the strong relationship between independent and dependent variable. All the six alternate hypotheses have been accepted and proposed framework has been successfully validated. It shows that the six major elements of Smart City Services significant impact on Happiness Index of Dubai.
REFERENCES [1] Angelidou, Margarita (2014). Smart city policies: A spatial approach, Cities, Volume 41, Supplement 1,
2014, Pages S3-S11, ISSN 0264-2751, https://doi.org/10.1016/ j.cities.2014.06.007. (http://www.sciencedirect. com/ science/article/pii/S026427511400095X)
[2] Bates, W. (2009). Gross National Happiness. Asian Pacific Economic Literature, 16.
[3] Bates, W. (2009), Gross national happiness. Asian-Pacific Economic Literature, 23: 1–16. doi:10.1111/j.1467-8411.2009.01235.x
[4] Borghesi, S. and Vercelli, A. (2012), happiness and health: two paradoxes. Journal of Economic Surveys, 26: 203–233. doi:10.1111/j.1467-6419.2010.00635.x
[5] Bekhet, A. K., Zauszniewski, J. A. and Nakhla, W. E. (2008), Happiness: Theoretical and Empirical Considerations. Nursing Forum, 43: 12–23. doi:10.1111/j.1744-6198.2008.00091.x

International Journal of Advance and Innovative Research Volume 5, Issue 4 (XII): October - December, 2018
152
ISSN 2394 - 7780
[6] Boyce, C. J. (2009). Subjective well-being: An intersection between economics and psychology (Doctoral dissertation, University of Warwick).
[7] Castiella, Luis. (2015). Smart Cities: Aspects to Consider for Building a Model from a City Government Point of View. Strategic Management Quarterly. 2. 1-22. 10.15640/smq.v2n3-4a1.
[8] Dameri, Renata. (2013). Searching for Smart City definition: a comprehensive proposal. International Journal of Computers & Technology. 11. 2544.
[9] Joseph Stiglitz, A. K.-P. (2014). The measurement of economic performance and social. doi:HAL Id: hal-01069384
[10] Karol, E., & Brunner, J. (2009). Tools for Measuring Progress towards Sustainable Neighborhood Environments. Sustainability, 1(3), 612–627. doi:10.3390/su1030612
[11] Kim, Yunji & Jong Lee, Seung. (2014). The Development and Application of a Community Wellbeing Index in Korean Metropolitan Cities. Social Indicators Research. 119. . 10.1007/s11205-013-0527-0.
[12] Leiwen Jiang (2006) Living Conditions of the Floating Population in Urban China, Housing Studies, 21:5, 719-744, DOI: 10.1080/02673030600807431
[13] Misra, B. S. (2015), which infrastructure matters more for growth: economic or social? Evidence from indian states during 2001–2010. Review Urban &Regional Devel, 27: 177–196. doi:10.1111/rurd.12039
[14] Musikanski, Laura; Cloutier, Scott; Bejarano, Erica; Briggs, Davi; Colbert, Julia; Strasser, Gracie; Russell, Steven (2017). Happiness Index Methodology. Journal of Social Change. DOI: 10.5590/JOSC.2017.09.1.02
[15] Neirotti, Paolo & De Marco, Alberto & Cagliano, Anna Corinna & Mangano, Giulio &
[16] Pan, Jin-Gu & Lin, Yu-Fan & Chuang, Su-Yi & Kao, Yu-Chia. (2011). From Governance to Service-Smart City Evaluations in Taiwan. Proceedings - 2011 International Joint Conference on Service Sciences, IJCSS 2011. . 10.1109/IJCSS.2011.74.
[17] Patrizia Lombardi , Silvia Giordano , Hend Farouh & Wael Yousef (2012). Modelling the smart city performance, Innovation: The European Journal of Social Science Research, 25:2, 137-149, DOI: 10.1080/13511610.2012.660325
[18] Rahman, Mohammad & Ahmed Albaloshi, Sultan & Sarker, Abu. (2016). From E-Governance to Smart Governance: Policy Lessons for the UAE. . 10.1007/978-3-319-31816-5_2482-1.
[19] Rogerson, J Robert (1999).Quality of Life and City Competitiveness. Urban Studies Journal Foundation. DOI: 10.1080/0042098993303
[20] Scorrano, Francesco. (2014). Current trends in Smart City initiatives: Some stylised facts. Cities. 38. 25–36. 10.1016/j.cities.2013.12.010.
[21] Salem, F. (2016). A Smart City for Public Value: Digital Transformation through Agile Governance – The Case of “Smart Dubai”. Dubai: Governance and Innovation Program, Mohammed Bin Rashid School of Government, World Government Summit.
[22] Stewart, F., & Langer, A. (n.d.). Horizontal Inequalities: Explaining persistence and change. The Executive Council, G. o. (2014). Dubai Plan 2021 Booklet. Dubai: The Executive Council, Government of Dubai.
[23] Ura, K., Alkire, S., & Zangmo, T. (n.d.). GNH and GNH Index. A Short Guide to Gross National Happiness Index, 65
[24] Ura, K., Alkire, S., Zangmo, T., & Wangdi, K. (2012). A Short Guide to Gross National Happiness Index. Bhutan: The Centre for Bhutan Studies.
[25] Ura, Karma, The Experience of Gross National Happiness As Development Framework (December 17, 2015). ADB South Asia Working Paper Series No. 42 (2015). Available at SSRN: https://ssrn.com/abstract=2941860 or http://dx.doi.org/10.2139/ssrn.2941860
[26] Vito Albino, Umberto Berardi & Rosa Maria Dangelico (2015): Smart Cities: Definitions, Dimensions, Performance, and Initiatives, Journal of Urban Technology, DOI: 10.1080/10630732.2014.942092

International Journal of Advance and Innovative Research Volume 5, Issue 4 (XII): October - December, 2018
153
ISSN 2394 - 7780
MAXIMUM MODULUS OF POLYNOMIALS NOT VANISHING IN A DISK
Roshan Lal V. S. K. C. Government P. G. College Dakpathar, Vikasnagar, Dehradun
ABSTRACT
Let
n
j
jj zazp
0
)( be a polynomial of degree n . Concerning the estimate for the maximum modulus of a
polynomial on the circle 0, RRz , in terms of its degree and the maximum modulus on the unit circle, we have several well known results for the case 1R and 1r respectively. In this paper, we have obtained bounds for the maximum modulus of polynomials having no zeros in the interior of a circle of prescribed radius. Our results improve as well as generalize the bounds obtained by other authors for the same class of polynomials.
Keywords: Polynomials, Inequalities, Maximum modulus, Complex domain, zeros.
1. INTRODUCTION AND STATEMENT OF RESULTS
Let
n
j
jj zazp
0
)( be a polynomial of degree n . Concerning the estimate for the maximum modulus of a
polynomial on the circle 0, RRz , in terms of its degree and the maximum modulus on the unit circle, we have the following well known results.
THEOREM-1.1: If )(zp is a polynomial of degree n, then for every 1R ,
)(max)(max1
zpRzpz
n
Rz
. (1.1.)
The result is best possible and extremal polynomial is nzzp )( , 0 being a complex number.
Inequality (1.1.) is a simple deduction from the maximum modulus principle (for reference see [5] or [6]).
For the case 1r we have the following result.
THEOREM-1.2: If )(zp is a polynomial of degree n, then for 1r ,
)(max)(max1
zprzpz
n
rz
. (1.2.)
The result is best possible and extremal polynomial is nzzp )( , 0 being a complex number.
Inequality (1.2.) is due to Zarantonello and Varga [8].
THEOREM-1.3: If )(zp is a polynomial of degree n, having no zeros in 1z , then for 1r ,
)(max2
1)(max1
zprzpz
n
rz
. (1.3.)
The result is best possible and equality in inequality (1.3) holds for nzzp
2
1)( .
The inequality (1.1) is due to Ankeny and Rivlin [1] and inequality (1.3) is due to Rivlin [7].
For the case 10 , we have the following result due to Aziz [2].

International Journal of Advance and Innovative Research Volume 5, Issue 4 (XII): October - December, 2018
154
ISSN 2394 - 7780
THEOREM-1.4: Let
n
j
jj zazp
0)( be a polynomial of degree n, which does not vanish in 1, kkz .
Then for 10
)(max1
)(max1
zpkkzp
z
n
z
. (1.4)
The result is sharp and equality in (1.4) is attained for Cckzeczp ni )0(,)()( and R .
For the polynomial not vanishing in 1, kkz Aziz and Mohammad [3] proved
THEOREM-1.5: If )(zp is a polynomial of degree n which does not vanish in 1, kkz , then for 21 kR ,
.)(max1
)(max1
zpkkRzp
z
n
Rz
(1.5)
The result is sharp and equality occurs for Cckzeczp ni )0(,)()( and R .
By introducing coefficients of polynomial
n
j
jj zazp
0)( , Govil, Qazi and Rahman [4] improved Theorem
1.5 as following
THEOREM-1.6: Let
n
j
jj zazp
0)( does not vanish in 1, kkz and let
0
1)(nakak . Then
for 21 kR ,
.)(max212
)(max1
2/
2
22
zpkk
kRkRzp
z
n
Rz
(1.6)
In above inequality (1.1.8), it is obvious that 10
1 anak
. In the
case when n is even inequality (1.6) becomes an equality for ,)cos2()( 2/222 nii kkzeezczp Cc )0( and R , .
The following result due to Govil, Qazi and Rahman [5] is complement to Theorem 1.6.
THEOREM-1.7: Let
n
j
jj zazp
0)( does not vanish in 1, kkz .Then for 2kR ,
)(max1
)(max1
)/()( 22
zpk
kkRzp
z
kRkR
n
n
n
n
Rz
. (1.7)
In this chapter, firstly we prove the following result which gives an improvement of Theorem 1.6, which in turn also refines Theorem 1.5. More precisely, we prove
THEOREM 1.8. Let 0)(0
n
j
jj zazp for 1, kkz and let
0
1)(nakak . Then for
21 kR ,we have

International Journal of Advance and Innovative Research Volume 5, Issue 4 (XII): October - December, 2018
155
ISSN 2394 - 7780
.)(min21
21
)(max21
2)(max
2/
2
22
1
2/
2
22
zpkk
kRkRR
k
zpkk
kRkRzp
kz
nn
n
z
n
Rz
(1.8)
In the case, when n is even, equality in (1.8) is attained for Cckkzeezczp nii )0(,)cos2()( 2/222 and R , .
The following result is complement to Theorem1.8 and improves upon Theorem 1.7.
THEOREM-1.9: Let
n
j
jj zazp
0)( does not vanish in 1, kkz .Then for 2kR , we have
.min1
11
)(max1
)(max
)/()(
1
)/()(
22
22
zpk
kkk
R
zpk
kkRzp
kz
kRkR
n
n
nn
n
z
kRkR
n
n
n
n
Rz
(1.9)
2. LEMMAS LEMMA 2.1: Rouche’s Theorem. Let )z(p and )z(q be analytic inside and on a closed curve C and let
)z(p)z(q on C. Then )z(p and )z(q)z(p have the same number of zeros inside C.
3. PROOF OF THE THEOREMS PROOF OF THEOREM 1.8. Since )(zp does not vanish in 1, kkz and )(min)( zpmzp
kz ,
therefore by Rouche’s theorem, the polynomial mkzzpzF n
n
)()( , 1 , also does not vanish in
1, kkz . On applying inequality (1.6) for the polynomial mkzzpzF n
n
)()( , we have
)z(Fzmax
/n
kk
kRkR)z(F
Rzmax
1
2
221
222
,
mnk
nz)z(pzmax
/n
kk
kRkRmnk
nz)z(pRz
max
1
2
221
222
.mk
)z(pmaxkk
kRkRnz
/n
121
21
2
2
22 (1.10)

International Journal of Advance and Innovative Research Volume 5, Issue 4 (XII): October - December, 2018
156
ISSN 2394 - 7780
Now choosing the argument of suitably in L. H. S. of inequality (1.10)
.)(max)(max mkRzpm
kzzp n
n
Rzn
n
Rz
(1.11)
Combining inequalities (1.10) and (1.11) we get
mk
zp
kkkRkR
mkRzp
nz
n
n
n
Rz
1)(max
21
2)(max
1
2/
2
22
or equivalently
.)(min21
2
)(max21
2)(max
2/
2
22
1
2/
2
22
zpkk
kRkRR
k
zpkk
kRkRzp
kz
nn
n
z
n
Rz
Finally letting 1 , the proof of Theorem 1.8 is completed.
PROOF OF THEOREM 1.9. Proof of Theorem 1.9 follows on the same lines as that of proof of Theorem 1.8. Here we use inequality (1.7). Hence we omit the details.
REFERENCES 1 N.C. Ankeny and T.J.Rivlin, On a Theorem of S. Bernstein, Pacific J. Maths. , 5(1955), 249-252.
2 A. Aziz, Growth of polynomials whose zeros are within or outside a circle, Bull. Austral. Math. Soc. 35(1987), 247-250.
3 A. Aziz and Q.G. Mohammad, Growth of polynomials with zeros outside a circle not vanishing inside a circle. Proc. Amer. Math. Soc. 81(1981) 549-553.
4 N.K.Govil M.A.Qazi and Q.I.Rahman, Inequalities describing the growth of polynomials not vanishing in a disk of prescribed radius, Math. Inequal. Appl.,6(3) (2003) 453-467.
5 G.P olya and G.Szeg o, “Problems and Theorems in Analysis” vol-1, Springler-Verlag, Berlin, 1972.
6 M.Riesz, Uber enin Satz der Herrn Serge Bernstein, Acta Math., 40(1918) 337-347.
7 T.J.Rivlin, On the maximum modulus of polynomials, Amer. Math. Monthly, 67(1960) 251-253.
8 R.S.Varga, A comparison of the successive over relaxation method and semi-iterative methods using Chebyshev polynomials, J. Soc. Indust. Appl.Math., 5(1957), 44.

International Journal of Advance and Innovative Research Volume 5, Issue 4 (XII): October - December, 2018
157
ISSN 2394 - 7780
THE STUDY OF CONSUMER BEHAVIOR TOWARDS DIFFERENT SHOES BRAND
Inderpreet Singh Assistant Professor, Tecnia Institute of Advanced Studies, GGSIPU, Delhi
ABSTRACT The study of consumer behavior creates incredible enthusiasm for buyers, researchers, and advertisers. As consumers, we require bits of knowledge into our own utilization related choices: what we purchase, why we purchase, and how we purchase. The objective of the study is to cover entire research about consumer behavior towards different shoes brand and different factors affecting their buying decision. A sample of 100 consumers of shoes users is taken. Questionnaire has been analyzed with the help of pie diagram & bar chart and different interpretations have been made to study the impact of consumer behavior towards different shoes brand. The study concluded that Nike is the market leader among all its close counterparts in the sports shoe and apparel segments.Advertisement plays a crucial role in the brand selection. Customer switching cost is high as they stick to the particular brand and perceived as Brand Loyal customer.
Keywords: Shoes, Consumer Behavior, Brand Loyal
INTRODUCTION The rubber-soled plimsolls were traditionally worn in PE lessons throughout most schools in Europe. 'You could have any colour you liked as long as it was black or white'.
These have been replaced by air cushioned, gel filled capsules with superior technical performance. They come in a variety of colours, shapes and forms and are purchased as much for their appearance as their performance.
The groundbreaking manufacturing technique that allowed the development of the plimsoll was called vulcanizations, which is still used today. This process uses heat to meld rubber and cloth together. Sulphur is used during the process.
Plimsolls were revolutionary at the time as they provided comfort, were lightweight and allowed the user to move around silently. Plimsolls became known as sneakers and were sold on a mass scale by the Keds Shoe Company in America as early as 1917.
Spike shoes You may think that spiked running shoes are a relatively new invention but they have been around for at least a 100 years. In 1890's a British company, which is now called Reebok created running shoes with spikes in them. The spiked shoe was developed out of necessity. The founder of the company enjoyed running and wanted to develop a shoe that would increase his speed.
In 1925 a company called AdiDassler now known as Adidas created a range of shoes with hand-forged spikes. They offered a range of shoes for different distances. The company used the strongest and lightest materials available at the time to make the running shoes.
The involvement of science and technology In the 1970's sports shoe manufacturers employed experts to conduct research into how humans run. They also investigated the shock effect to the body caused by the collision between the feet and the ground. Their finding helped to develop new, improved sports shoes.
Their research found three types of running styles Neutral: This is where the heel of the runner makes contact with the ground and the foot travels in a straight line as it moves forward.
Pronation: This where the heel hits the ground but this time the foot moves to the side as it travels forward. It refers to the inward roll of the foot.
Supenation: This is where the heel hits the ground and the foot rolls outward.
Specific sports shoes High Jump This type of shoe has a much thicker sole. This gives maximum support and comfort. The shoe is light and flexible which helps the athlete achieve speed over a short distance before jumping. This shoe has to have spikes. The spikes at the front help the athlete to gain speed in the run-up. The four spikes t the heel provide grip when the athlete takes off.

International Journal of Advance and Innovative Research Volume 5, Issue 4 (XII): October - December, 2018
158
ISSN 2394 - 7780
Javelin This type of shoe has to be robust and durable. Athletes drag their feet along the ground during the throw. As a result the shoe has to be made from a tough, hardwearing material. Support is crucial. Javelin shoes look more like boots with protection around the ankle. Most of them feature strapping. This prevents the foot from moving in the shoe.
Jumps and pole vault These events require speed both on the ground and in the air. In most cases straps have replaced the laces. The sole tends to be both firm and flexible allowing extra bounce in the jump. The spikes are once again very important. They provide the grip before the jump. Notice the spikes tend to be just at the front of the shoe.
The Throws The shoe has to allow the athlete to throw and spin. A hooked strap over the toe helps to prevent the feet from moving sideways during the build up to the throw.These types of shoes do not have spikes but have a hard sole. This lengthens the lifespan of the shoe.
The sole tends to have circular grooves on the balls of the feet. These help the athlete to spin
Sprinting This type of shoe has to be lightweight and offer flexibility at the front. They all tend to have spikes, which are located at the front. They are able to cope with lots of different types of surfaces. Most Olympic Athletes have their shoes specially made.
Long Distance These shoes have to be both durable and flexible. Comfort is a real priority, also this about the sweat factor. A mesh is sometimes added in the upper part of the shoe to allow the foot to breathe. The cushioning is also very important. Spikes are sometimes added but are not essential
ADIDAS
Adidas is a German sports apparel manufacturer, part of the Adidas-Salomon Corporation. Adidas was named after its founder, Adolph (Adi) Dassler, who started producing shoes in the 1920s in Herzogenaurach near Nuremberg with the help of his fellow friend Cody. It registered as Adidas AG on 18 August 1949. The company's clothing and shoe designs typically include three parallel stripes of the same color, and the same motive is incorporated into Adidas' official logos.
COMPETITORS Rudolf Dassler, Adie’s brother, founded a rival company, PUMA the chief competitors of Adidas are Puma and Nike. In August 2005, the company announced that it had made a deal to acquire rival Reebok for $3.8 billion. The acquisition would increase its market share in North America and allow it to further compete with Nike. This will propel Adidas to the number two spot in the foot apparel market behind Nike. Adidas' trademark saying is 'impossible is nothing'
REEBOK

International Journal of Advance and Innovative Research Volume 5, Issue 4 (XII): October - December, 2018
159
ISSN 2394 - 7780
Reebok is the world's third-largest maker of sneakers, athletic shoes and sports apparel. Goods are sold under the brands Reebok, Rockport and Greg Norman Collection. Reebok is also the official outfitter of the NFL and has an exclusive deal to supply NBA jerseys beginning this season.
Reebok announced in July it will merge with German sporting apparel company adidas-Salomon in a deal valued at $3.8 billion. The merger is expected to be completed by the first half of 2006 and will create the second-largest sporting goods company behind Nike with $11 billion in revenues.
Adidas will maintain its corporate headquarters in Germany and its North American headquarters in Portland, OR. Paul Fireman will remain as Chief Executive Officer of Reebok International Ltd. and will continue to lead the Reebok team. Reebok will continue to operate under its name and will retain its headquarters in Canton, MA.
NIKE
Nike is the world's #1 manufacturer and marketer of athletic footwear and apparel. Almost out of the blue, the company established itself as one of the world's most familiar brands during the 1980s and 1990s. As familiar as a Coke bottle or Big Mac, the Nike "swoosh" logo came to symbolize not just sports culture, but street culture, as the appeal of the star players who endorsed the brand was carried onto city streets. The approach of the new century set Nike new problems. Trainers went (briefly) out of fashion, economic slowdown and labour problems hit Asian performance. But the group has bounced back, retaining its iron grip on the sporting apparel sector and still undisputed leader in sports-oriented street wear.
LITERATURE REVIEW Rama Devi V, NagurvaliShaik (2012) , in his study, (evaluating training and development effectiveness), has given his opinion – Training and development cab contribute in such a way that employees can enhance their dexterity. There is a casual relation between training and employee performance. Training helps organization in achieving their strategic objectives and gives organization a competitive edge. Organizations train and develop their employees to the fullest advantage in order to enhance their effectiveness. Organizations should evaluate whether training and development programs are effective and producing desired results. Proper evaluation is the base to effective training.
Evaluating Youth’s Buying Behavior regarding Sport Shoes The aim of this paper is evaluating attitudes and behavior of the youth's buying behavior towards branded sports shoes. The buyer's ultimate goal is to buy the product of qualitative, quantitative with low/best affordable price. In order to identify different kinds of consumer's behavior towards buying of different branded shoes and Adidas sports shoes. We have carried out buying behavior of youth and different kind of consumer behavior models, literature and theory of consumer behavior. At the end, we concluded with research based on questionnaire of Adidas shoes and case studies of Nike sports shoes at University of Isfahan.
Assessing Youth’s Buying Behaviour towards Sports Shoes The paper focuses on attitudes and behavior on the concept of the youth’s buying behavior towards branded sports shoes, different consumers have got different decision making process. The buyer’s ultimate goal is to buy the product of qualitative, quantitative with low/best affordable price. In order to identify different kinds of consumer’s behavior towards buying of different branded shoes and Nike sports shoe. I have carried out buying behavior of youth and different kind of consumer behavior models, literature and theory of consumer behavior; finally, I analyzed and concluded with research based on questionnaire of Nike shoes and case studies of Nike sports shoes at Halmstad University.
OBJECTIVES OF THE STUDY To know the personal views of “DELHI” people regarding choices among various branded sport shoes.
To study which branded sport shoes is mostly preferred by people as per their choices.
To make comparison between various branded sport shoes.
To find out factor influencing the people at the time of purchasing sport shoes
RESEARCH METHODOLOGY Research problems: Consumer’s preference about the different branded sports shoes

International Journal of Advance and Innovative Research Volume 5, Issue 4 (XII): October - December, 2018
160
ISSN 2394 - 7780
Research methodology: Exploratory method
SAMPLING PLAN Sample Methods - Random Simple Sampling
Sample size- 100
Primary data - Questionnaire
SAMPLE While deciding about the sample of research, it is required from the researcher’s point to pay attention to these under mentioned points:
a) Sample Units: A decision has to be taken concerning a sampling unit before selecting a sample, sampling unit may be a geographical one such as state, district, village Etc. so in this research sampling unit is Chandigarh area.
b) b)Source of data: Data required for the study was collected through primary sources i.e. Market Survey. and the market area is: DELHI.
c) Sampling size: This refers to the no. of items to be selected from the universe to constitute a sample. This is a major problem before the researcher. The size of sample should neither be excessively large not too small, it should be optimum. This size of population must be kept in view for this also limits the sample size .Sample size in this research is 50.
INSTRUMENTS USED Primary data collected through sample survey from the selected elements in malls and super markets. So for this purpose I have used the most popular tool of primary data collection through direct communication with respondents. The tools I used are questionnaires.
DATA ANALYSIS AND INTERPRETATION
1. Brand Preference of the Respondents
Table No-1 BRAND PERCECENTAGE (%) FREQUENCY Reebok 64 34 Adidas 56 28 Action 18 9 Nike 52 26
Others 6 3 Total 100
Source: Primary Data
Figure-1
Interpretation: Most of the people prefer to wear shoes of Reebok brand followed by Adidas and Nike.

International Journal of Advance and Innovative Research Volume 5, Issue 4 (XII): October - December, 2018
161
ISSN 2394 - 7780
2. Factors Influencing Respondents To Go For a Particular Brand
Table No-2 INFLUENCE PERCENTAGE (%) FREQUENCY
Quality 74 74 Price 5 5
Durability 13 13 Variety 8 8
Any other 0 0 Total 100 100
Source: Primary Data
Figure-2
Interpretation: Respondents mostly preferred the quality of the brand instead of price and durability as per the graph.
3. Effects of advertisement on selection of brands.
Figure 3
Interpretation: Advertisement plays a crucial role in the brand selection. Advertisements provides product features has been appreciated by the respondents as it provides useful information to the respondents before buying a particular product
4. Impact of celebrity endorsement on purchasing
Table No-4 Switch PERCENTAGE (%) FREQUENCY
Yes 44 44 No 56 56
Total 100 100 Source: Primary Data

International Journal of Advance and Innovative Research Volume 5, Issue 4 (XII): October - December, 2018
162
ISSN 2394 - 7780
Figure-4
Interpretation: Celebrities have a special impact on the mind of the consumers that affects the purchasing sense of consumers.
5. Respondents switching over to other brand
Table No-5 Switch PERCENTAGE (%) FREQUENCY
Yes 44 44 No 56 56
Total 100 100 Source: Primary Data
Figure-5
Interpretation: Respondents were not ready to switch over from their brand to other because of various factors like price, features which depicts brand loyalty.
CONCLUSION OF THE STUDY The study concluded that Nike is the market leader among all its close counterparts in the sports shoe and apparel segments.Advertisement plays a crucial role in the brand selection. Advertisements provide product features has been appreciated by the respondents as it provides useful information to the respondents before buying a particular product. Adidas is chasing its position more aggressively so now it requires maintaining its position with new product line. Nike has been perceived as the major competitor to Adidas and Reebok. Customer switching cost is high as they stick to the particular brand and perceived as Brand Loyal customer.
REFERENCES Council for Leather Exports, Annual Reports 1997-2004.
Principles of Marketing by C.B Gupta, Sultan Chand and Sons- 2 nd Edition, 2014
Marketing Research: Research Design by G.C. Berry, Tata McGraw-Hill Education Pvt. Ltd., 2007, 4 th Edition
Article 'Asia Pacific Leather Fair,2001
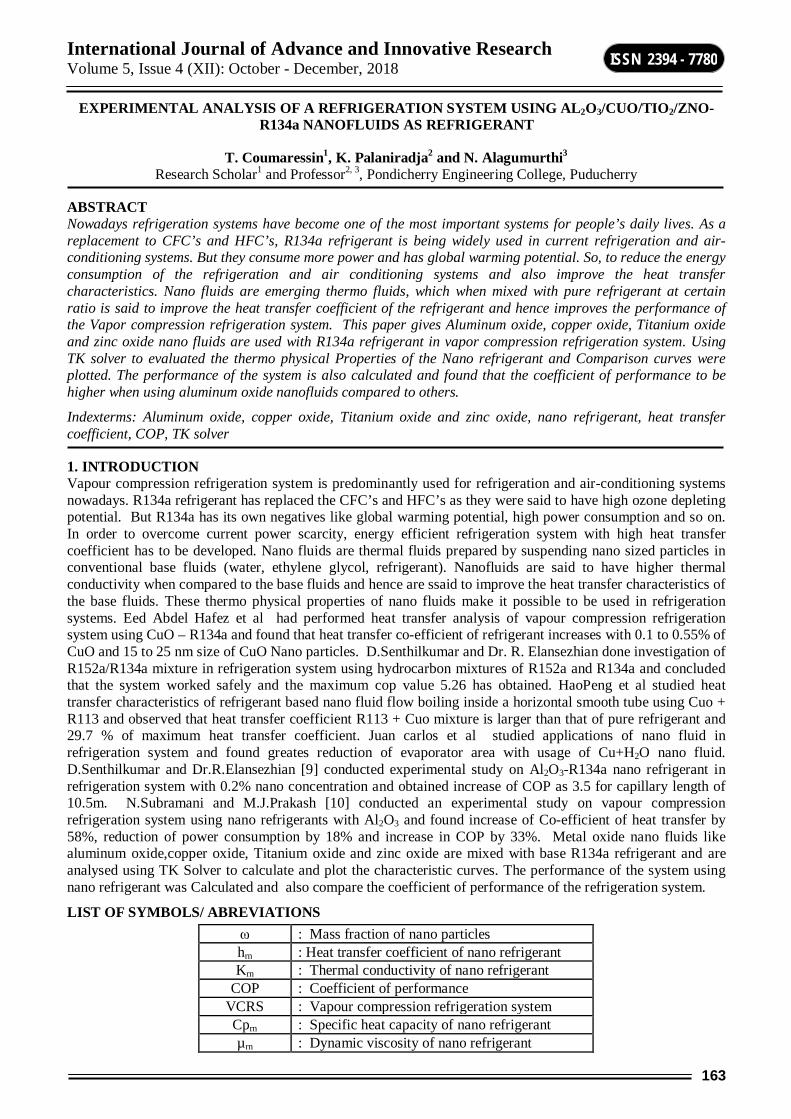
International Journal of Advance and Innovative Research Volume 5, Issue 4 (XII): October - December, 2018
163
ISSN 2394 - 7780
EXPERIMENTAL ANALYSIS OF A REFRIGERATION SYSTEM USING AL2O3/CUO/TIO2/ZNO-R134a NANOFLUIDS AS REFRIGERANT
T. Coumaressin1, K. Palaniradja2 and N. Alagumurthi3 Research Scholar1 and Professor2, 3, Pondicherry Engineering College, Puducherry
ABSTRACT Nowadays refrigeration systems have become one of the most important systems for people’s daily lives. As a replacement to CFC’s and HFC’s, R134a refrigerant is being widely used in current refrigeration and air-conditioning systems. But they consume more power and has global warming potential. So, to reduce the energy consumption of the refrigeration and air conditioning systems and also improve the heat transfer characteristics. Nano fluids are emerging thermo fluids, which when mixed with pure refrigerant at certain ratio is said to improve the heat transfer coefficient of the refrigerant and hence improves the performance of the Vapor compression refrigeration system. This paper gives Aluminum oxide, copper oxide, Titanium oxide and zinc oxide nano fluids are used with R134a refrigerant in vapor compression refrigeration system. Using TK solver to evaluated the thermo physical Properties of the Nano refrigerant and Comparison curves were plotted. The performance of the system is also calculated and found that the coefficient of performance to be higher when using aluminum oxide nanofluids compared to others.
Indexterms: Aluminum oxide, copper oxide, Titanium oxide and zinc oxide, nano refrigerant, heat transfer coefficient, COP, TK solver
1. INTRODUCTION Vapour compression refrigeration system is predominantly used for refrigeration and air-conditioning systems nowadays. R134a refrigerant has replaced the CFC’s and HFC’s as they were said to have high ozone depleting potential. But R134a has its own negatives like global warming potential, high power consumption and so on. In order to overcome current power scarcity, energy efficient refrigeration system with high heat transfer coefficient has to be developed. Nano fluids are thermal fluids prepared by suspending nano sized particles in conventional base fluids (water, ethylene glycol, refrigerant). Nanofluids are said to have higher thermal conductivity when compared to the base fluids and hence are ssaid to improve the heat transfer characteristics of the base fluids. These thermo physical properties of nano fluids make it possible to be used in refrigeration systems. Eed Abdel Hafez et al had performed heat transfer analysis of vapour compression refrigeration system using CuO – R134a and found that heat transfer co-efficient of refrigerant increases with 0.1 to 0.55% of CuO and 15 to 25 nm size of CuO Nano particles. D.Senthilkumar and Dr. R. Elansezhian done investigation of R152a/R134a mixture in refrigeration system using hydrocarbon mixtures of R152a and R134a and concluded that the system worked safely and the maximum cop value 5.26 has obtained. HaoPeng et al studied heat transfer characteristics of refrigerant based nano fluid flow boiling inside a horizontal smooth tube using Cuo + R113 and observed that heat transfer coefficient R113 + Cuo mixture is larger than that of pure refrigerant and 29.7 % of maximum heat transfer coefficient. Juan carlos et al studied applications of nano fluid in refrigeration system and found greates reduction of evaporator area with usage of Cu+H2O nano fluid. D.Senthilkumar and Dr.R.Elansezhian [9] conducted experimental study on Al2O3-R134a nano refrigerant in refrigeration system with 0.2% nano concentration and obtained increase of COP as 3.5 for capillary length of 10.5m. N.Subramani and M.J.Prakash [10] conducted an experimental study on vapour compression refrigeration system using nano refrigerants with Al2O3 and found increase of Co-efficient of heat transfer by 58%, reduction of power consumption by 18% and increase in COP by 33%. Metal oxide nano fluids like aluminum oxide,copper oxide, Titanium oxide and zinc oxide are mixed with base R134a refrigerant and are analysed using TK Solver to calculate and plot the characteristic curves. The performance of the system using nano refrigerant was Calculated and also compare the coefficient of performance of the refrigeration system.
LIST OF SYMBOLS/ ABREVIATIONS ω : Mass fraction of nano particles hrn : Heat transfer coefficient of nano refrigerant Krn : Thermal conductivity of nano refrigerant
COP : Coefficient of performance VCRS : Vapour compression refrigeration system Cprn : Specific heat capacity of nano refrigerant µrn : Dynamic viscosity of nano refrigerant

International Journal of Advance and Innovative Research Volume 5, Issue 4 (XII): October - December, 2018
164
ISSN 2394 - 7780
2. MATHEMATICAL MODELLING Thermo physical properties of Nano refrigerant
The thermal conductivity of refrigerant based nanofluid is calculated by Hamilton – Crosser equation (Hamilton and crosser, 1962).
(1)
Where,
Krn– Thermal conductivity of nano refrigerant
Kr - Thermal conductivity of pure refrigerant
Kn - Thermal conductivity of nano particle
φ - Particle volume fraction of nano particle
The dynamic viscosity of nano refrigerant is calculated by Brinkman equation (Brinkman, 1952). The Dynamic viscosity of nano refrigerant is as given below,
(2)
Where,
μr– Viscosity of pure refrigerant
φ – Particle volume fraction
The specific heat capacity of Nano refrigerant is calculated by Pak-cho equation (Pak and Cho, 1998). The specific heat of Nano refrigerant is as given below.
(3)
Where,
φ – Particle volume fraction
Cp-r – Specific heat of refrigerant
Cp-n – Specific heat of Nano particle
Convective heat transfer coefficient of Nano refrigerant is given by the following relation (Dr.Saidur et al, 2013)
hc-rn =
This equation can be written as,
(4)
The volume fraction of Nano particles used in the above given equations can be obtained using the below relation (Haopeng et al, 2009)
(5)
Where,
- Mass fraction of nano particle
- Density of pure refrigerant
r : Pure refrigerant n : Nano particle rn : Nano refrigerant

International Journal of Advance and Innovative Research Volume 5, Issue 4 (XII): October - December, 2018
165
ISSN 2394 - 7780
- Density of nano particle
The relation for mass fraction of Nano particle is given below (Haopeng et al, 2009)
(6)
Where,
– Mass of Nano particles
– Mass of pure refrigerant (R134a)
Mathematical Model for Performance of a Refrigeration system
Mass of water in the evaporator vessel
m = Density of water Volume of water
m = Kg/sec (7)
Where,
- Density of water
D – Diameter of vessel
h – Height of water in vessel
Heat absorbed from Evaporator Vessel,
Refrigeration effect = KW (8)
Where,
Ti – Initial temperature of water
Tf – Final temperature of water
Cp – Specific heat of water = 4.186 KJ/Kg K
dT – Duration of experiment in sec
Work done by the compressor
Compressor Work = KW (9)
Where,
E – Energy meter constant
T – Time taken for 5 Flickering of the Energy meter disc
Coefficient of performance Coefficient of performance of the refrigeration (COP)actual
COP actual = (10)
Theoretical COP of a vapour compression refrigeration system is given by
(11)
Where, H1 – Enthalpy of refrigerant at the outlet of compressor H3=H2 – Enthalpy of refrigerant at the inlet of evaporator.
H4 – Enthalpy of refrigerant at the outlet of evaporator

International Journal of Advance and Innovative Research Volume 5, Issue 4 (XII): October - December, 2018
166
ISSN 2394 - 7780
3. EXPERIMENTAL SET UP The Experimental refrigeration setup was fabricated with following components. A hermetically sealed compressor, a forced type fool condenser , an expansion valve and an evaporator containing water. Experiment was conducted using the above setup using pure R134a refrigerant and also Nanorefrigerants.
Figure-1: Vapour compression refrigeration system
4. RESULT AND DISCUSSION 4.1Thermo-physical properities of Nano refrigerants Heat transfer coefficient
Figure-2: Nano concentration Vs Heat transfer coefficient
The above graph shows the Variation of the evaporating heat transfer coefficient for different values of nanoparticles concentrations. It is noticed that the variation of the evaporating heat transfer coefficient is increases with the increase of nanoparticle concentration. Also the heat transfer coefficient increases upto 0.55% nanoparticles concentration and then decreases. The heat transfer coefficient for nanoparticles free refrigerant, 0% concentration shows the lowest value and then increases with almost constant rate upto 0.55% nanoparticles concentration.

International Journal of Advance and Innovative Research Volume 5, Issue 4 (XII): October - December, 2018
167
ISSN 2394 - 7780
Thermal conductivity The above graph shows the variation between the different nanoparticles concentration and the thermal conductivity of different nano refrigerant. It is found that the thermal conductivity of the different nano refrigerants are increases with the different nanoparticles concentration. Also the thermal conductivity of the different nano refrigerants are same upto 0.55% , after that increases with the increase for nanoparticle concentration. Among these Al2O3nano refrigerant gives the higher thermal conductivity than the other nano refrigerants.
Figure-3: Nano concentration Vs Thermal conductivity
Specific heat capacity
Figure-4: Nano concentration Vs Specific heat
The above graph shows the variation of the different nanoparticles concentration and specific heat capacity of different nano refrigerants. It is noticed the specific heat capacity is decreases with the increases the nano particle concentration. Among these CuOnano refrigerant specific heat capacity value is higher than the other nano refrigerants with the different nanoparticles concentration.
Dynamic viscosity
Figure-5: Nano concentration Vs Dynamic viscosity

International Journal of Advance and Innovative Research Volume 5, Issue 4 (XII): October - December, 2018
168
ISSN 2394 - 7780
The above graph shows the variation between the different nanoparticles concentration and the Viscosity of different nano refrigerant. It is found that the Viscosity of the different nano refrigerants increases with the different nanoparticles concentration. Also the Viscosity of the different nano refrigerants are same up to 0.55% , after that increases with the increase for nanoparticle concentration. Among these Al2O3nano refrigerant gives the higher Viscosity than the other nano refrigerants.
4.2 Performance of Refrigerant Pure R134a and Nano Refrigerant The parameters obtained from the experiment conducted on vapour compression refrigeration system using pure R134a refrigerant are used to calculate the performance of the system with nano refrigerant of various composition and the coefficient of performance for different nano refrigerant combinations
Table-1: Performance of Nano refrigerant
Refrigerants Compressor Work(KW)
Refrigeration Effect(KW) Actual COP Theoretical
COP Pure R134a 0.1125 0.3501 3.112 8.994
Nano Al2O3+ R134a 0.1172 0.5001 4.268 9.265 Nano CuO + R134a 0.125 0.4501 3.601 9.222 Nano TiO2 + R134a 0.1197 0.4251 3.552 9.166 Nano ZnO + R134a 0.1223 0.4001 3.272 9.07
4.3 Compression work for refrigerant with and without Nanofluids
Figure-6: Comparision of compressor work for different Nanofluids
The above figure gives the comparision of compressor work for Refrigerant with and without Nanofluids. Compression work is slightly higher the Nanorefrigerant when compared to pure refrigerant beacause of to incresed the volume flow rate of refrigerant by adding nanofluids to refrigerant. But compared to other Nanorefrigerant Al2O3 Nano refrigerant is less power consumption by approximately 5%.
4.4 Refrigeration work for refrigerant with and without Nanofluids
Figure-7: Comparision of Refrigeration Effect for different Nanofluids

International Journal of Advance and Innovative Research Volume 5, Issue 4 (XII): October - December, 2018
169
ISSN 2394 - 7780
The above figure gives the comparision of Refrigeration Effect for Refrigerant with and without Nanofluids. Refrigeration Effect of Al2O3 Nanorefrigerant is higher when compared to pure refrigerant and also other Nanorefrigerants beacause of Higher thernmal conductivity and higher heat transfer coefficient by adding nanofluids to refrigerant. When compared to other Nanorefrigerant Al2O3 Nano refrigerant is High Refrigeration Effect by approximately 35%.
4.5 Coefficient of performance for refrigerant with and without Nanofluids
Figure-8: Comparision of Coefficient of Performance for different Nanofluids
The above figure gives the comparision of Coefficient Performance for Refrigerant with and without Nanofluids. Coefficient of Performance of Al2O3 Nanorefrigerant is higher when compared to pure refrigerant and also other Nanorefrigerants beacause of Higher Refrigeration effect and higher heat transfer Properities by adding nanofluids to refrigerant. When compared to other Nanorefrigerant Al2O3 Nano refrigerant is high Performance by approximately 37%.
CONCLUSION This paper gives Aluminum oxide, copper oxide, Titanium oxide and zinc oxide nano fluids are used with R134a refrigerant in vapor compression refrigeration system. Nanofluids are directly inserted into the refrigerant in the liquid line after the compressor .Using TK solver to evaluated the thermo physical Properties of the Nano refrigerant and Comparison curves were plotted. Fron the Comparsion cureves gives higher values of AL2O3 Nanorefrigerant when compared to other Nano refrigerant at 0.55 conentration.The performance of the system is also calculated and found the coefficient of performance to be higher when using aluminum oxide nanofluids compared to others by 37% and also reduced power cosumption by 6.5% beacause of increaed volumeflow rate through theRefrigeration system.
REFERENCE [1] Eed Abdel- Hafez, Abdel- Haddi ; SherifHady Taker, Abdel Hamid Mohammed Tork, Sameer
SabryHamad, Heat transfer analysis of vapour compression refrigeration system using CuO-R134a, International conference on Advanced materials engineering IPCSIT Vol. 15 (2011)
[2] TeshomeBekele, kotu&K.Reji Kumar, Comparison of Heat transfer performance in domestic refrigerator using Nano Refrigerant and Double pipe heat exchanger, School of mechanical & industrial engineering, Bahirdar University.
[3] R.Reji Kumar, K.Sridhar, M.Narasimha. Heat transfer enhancement in domestic refrigerator using R600a/ mineral oil/ Nano-Al2O3 as working fluid, International journal of computational engineering research, Vol. 03, issue. 4.
[4] D.Senthil Kumar, Dr.R.Elansezhian, Investigation of R152a/ R134a mixture in refrigeration system. 2012.
[5] HaoPeng, Gualiang Ding, Weitingjiang, Haitao Hi, Yifengao, Heat transfer characteristics of refrigerant based Nano fluid flow boiling inside a horizontal smooth tube, International journal of refrigeration 32 (2009) 1259-1270
International Journal of Advance and Innovative Research Volume 5, Issue 4 (XII): October - December, 2018
170
ISSN 2394 - 7780
[6] R.Krishnasabareesh, N.Gobinath, V.sajith, Sumitesh Das and C.B.Sobhan, Application of TiO2 Nano particles as a lubricant additive for Vapour compression refrigeration system – An experimental investigation, International journal of refrigeration (2012), doi: 10.1016
[7] T.Coumaressin and K.Palaniradja, Performance analysis of a refrigeration system using Nano fluid. International journal of Advanced Mechanical engineering, Research India publications. 2014. ISSN 2250-3234 Vol(4), Number(4) PP 459-470.
[8] Prof(Dr) R.S.Mishra, Methods of improving thermodynamic performance of vapour compression refrigeration system using twelve ecofriendly refrigerants in primary circuit and Nano fluid (water based) in secondary circuit. International journal of Engineering and Technology and Advanced Engineering. ISSN 2250-2459 Vol. 4, Issue 6. June 2014.
[9] Juan Carlos-ValdeyLoaiza, Frank chaviano - purzaesky, Jose Alberto—Reis Parise, (2010) A Numerical Study on the applications of Nano fluids in refrigeration systems. International refrigeration and air conditioning conference, Purdue University, Paper 1145
[10] D.Senthilkumar, Dr.R.Elansezhian, Experimental study on Al2O3 – R134a nano refrigerant in refrigeration system. International journal of modern engineering research (IJMER). Vol.2, PP : 3927 – 3929 ISSN : 2249 – 6645. 2012.
[11] N.Subramani, M.J.Prakash, Experimental study on vapour compression refrigeration system using nano refrigerants. Journal of engineering science and technology Vol.3, No.9, PP : 95-102. 2011.
[12] Shanmugasundaram, R.ShanthiandVelrajramalingam, Heat transfer enhancements using nano fluids. Thermal scienceVol: 16, No. 2, PP : 423 – 444. 2012.
[13] Subramani.N, Ashwinmohan and Dr.M.Joseprakash, Performance studies on a vapour compression refrigeration system using nanolubricant. Special issue Vol.2. December 2013.
[14] N.Subramani and M.J.Prakash Experimental studies of vapour compression refrigeration system using nano refrigerant. International journal of engineering science and Technology, Vol. 3. 2011.
[15] Rahulkumarjaiswal and R.S.Mishra, Performance evaluation of Vapour compression refrigeration system using eco-friendly refrigerants 1o circuit and 2o circuit (Nano particle). International research journal of sustainable science & engineering. Vol. 2, Issue – 5. May 2014
[16] R.Saidure et al, Thermophysical properties and heat transfer performance of Al2O3/R134a nano refrigerants, International journal of heat and mass transfer 57(2013) 100-108.
[17] R.L. Hamilton and O.K.crosser,Thermal conductivity of heterogeneous two-component systems, Ind. Eng. Chem. Fundamen, 1962, 1 (3), pp 187-191.
[18] H.C. Brinkman, The viscosity of concentrated suspensions and solutions, The journal of chemical physics, 1952, Vol. 20 Number 4.

International Journal of Advance and Innovative Research Volume 5, Issue 4 (XII): October - December, 2018
171
ISSN 2394 - 7780
GENDER SENSITIZATION: AN ALTERNATIVE TO DECLINE DISCRIMINATION AGAINST WOMEN WITH SPECIAL REFERENCE TO JNTUH STUDENTS FROM FEMINIST LENS
Dr. Abdul Basit Naik Research Scholar, MANUU, Hyderabad
ABSTRACT Pandit Jawaharlal Nehru once said: “If you educate a man, you educate an individual however if you educate a woman, you educate a whole family. Women empowered means Mother India empowered”. Education is considered as a milestone for the empowerment of women because it helps them to confront the patriarchy system and change their lives. Gender sensitization is the key to unlock the golden doors of freedom for development and also plays a prominent role for empowering the women. The focus of this paper is to highlight the changes that take place to the students who attend the gender sensitization classes in the institution. It also tries to highlight the changes that took place after attending the classes. Various types of obstacles those took place during the sensitization programme have also been mentioned in this paper. In the patriarchal society women are having secondary status and are one of the most vulnerable sections of the society. Which mostly results the violation of their basic rights and are trained/ socialized in such a way to follow the rules and regulations framed by the male counterpart. The main aim of this paper is to know the impacts of gender sensitization on JNTUH students as well as challenges and changes that occur during the course. The results drawn were that the students after taking gender sensitization classes were having different mindset/attitude towards girl students as compared to the one which they were having earlier.
Keywords: Empowerment, Gender sensitization, Harassment, Mindset, Patriarchy, Violence
INTRODUCTION Gender sensitization refers to the modification of behavior by raising the awareness of gender equality concerns. Gender sensitization theories claim that modification of the behavior of teachers and parents towards children can have a causal effect on gender equality. Gender sensitization is about changing behavior and installing empathy into the views that we hold people in examining their personal activities and beliefs and questioning the realities they thought they knew.
Gender sensitization is a weapon towards gender equality, equal opportunities and women empowerment which is essential for creating sustainable development as enshrined in our constitution. The State as well as Central government are making continuous efforts to realize these promises through policies and programs. The progress achieved in this direction has a mixed outcome and there is still long away to realize the objectives of the equitable society, gender equality and inclusive development without discrimination.
The simple meaning of gender sensitivity is acknowledging that women are subordinated in most societies, and that this subordination is harmful not only for women and girls, but also for men and boys and the entire society. It means being aware of why men and women behave differently, and understanding their needs and concerns. It also means understanding the implications and impact of different policies and programmes on women and men. In planning, gender sensitivity implies making plans which will not only ignore and further marginalize women, but will take care of women’s special needs and make efforts to involve and empower women .In short to transform gender relations.
According to feminist gender trainer, gender sensitivity means not only understanding but also challenging patriarchy and other interconnected hierarchies like those of caste, class, race and north south. We believe gender sensitization is necessary at all levels in all organizations. Acknowledging the feminist slogan “Personal is Political”, we believe gender sensitization begins with each one of us, our families and organizations. It requires not only an intellectual understanding of concepts like gender and patriarchy but using this understanding to transform our own ways of thinking and behaving. Understanding alone does not change social relations and social realities, what changes society is people’s behavior and actions. In other words gender sensitivity requires internalizing our understanding and applying these insights to our behavior. Transforming gender relations means demolishing the separation between theory and practice, personal and public, objective and subjective, rational and emotional. Gender sensitivity does not only mean “main (man) streaming” women, it means examining the mainstream from a feminist perspective. If it is patriarchal, unequal and unsustainable then women need to challenge and change it, instead of joining it.
Gender Sensitivity also means acknowledging that all issues –economic, cultural, social or political –are women’s issues because women represent half the human race.

International Journal of Advance and Innovative Research Volume 5, Issue 4 (XII): October - December, 2018
172
ISSN 2394 - 7780
Obviously, the opposite is also true: all the so-called women’s issues (dowry, rape, pornography, female foeticide, infanticide, etc.) are not just women’s issues, they are social issues. It is unfortunate that for much too long only women and their organizations have been concerned with them. But it is heartening to see that some sensitive men are also taking up these issues now and starting groups like “Men Against Rape” or “Men Against Violence Against Women”.
GENDER SENSITIZATION BEGINS AT HOME: The Medieval mindset and gender bias prevailing in our Society, in both rural and urban areas. The problem with India is that there has been a complete lack of formal education on moral ethics, with education curriculum being restricted to academic subjects only. Thus the responsibility of teaching children moral values lies with the parents or the family as a whole.
Given the fact that our society is so diverse in its composition and social values, it is not at all surprising that there is a complete lack of common reference point or standard that a family can refer to.
Views on the role of girls and later women in society vary from family to family and therefore children trend to have diverse views on the opposite gender which are mainly influenced by these prevailing in the family from where he or she comes.
Gender sensitivity and gender issues definitely require women’s equal participation in organizations and in decision making process but in addition they require a transformation in the practices and cultures of organizations. It also requires understanding the situation of those women who have to combine their work at home with jobs outside.
RESEARCH METHODOLOGY The present study is primarily based on the exploratory research method and a sample of 100 students was selected for this research. The researcher tries to explain the practical issues related to students in general and JNTUH students in particular. Besides it the review of literature plays a prominent role to give some clues which are hurdles of sensitization. This is an empirical research and is based on probability sampling such as simple random sampling method, used to locate the students. Primary data has been collected through interviews, schedules besides it some case study methods have been incorporated. Secondary data has been collected from books, newspapers and magazines. The data has been compiled systematically and analyzed in a scientific manner and presented in the form of a research paper.
OBJECTIVES To analyze the role of gender sensitization to encounter socialization.
To highlight the issues of gender.
To analyze the various types of violence’s against women.
To encourage students not to give up if they are sexually harassed.
RESULTS AND DISCUSSION / PREVIOUS STUDIES In order to have a healthy relationship, both girls and boys must be treated equally and independently. Both of them should be treated as equal right from the birth. The toys which are provided to boys should be given to girls also. The difference between healthy or abusive relation is explained by the pictures given below.

International Journal of Advance and Innovative Research Volume 5, Issue 4 (XII): October - December, 2018
173
ISSN 2394 - 7780
Figure-A: shows non violence
Source: www.duluth-model.org
Figures-B: shows n violence
Source: www.duluth-model.org

International Journal of Advance and Innovative Research Volume 5, Issue 4 (XII): October - December, 2018
174
ISSN 2394 - 7780
Violence against women is spreading like communicable disease. It is a global problem and affects victim’s life. Violence against them is a major problem as it violates victim as well as social right norms. It can be prevented at local, national and international level. At the primary level, education should be provided on the current problems and gender based programmers should be organized. Certain strategies have been formulated by WHO like periodical survey conduction, development protocol, guidelines and information material on domestic violence among others (Turman, 1998).
Violence against women is a global threat and is one of the sensitive issues which can be tackled by the following ways Violence against women should be addressed by encouraging the gender sensitization programmes at school
levels.
Awareness should be developed in every community regarding the gender issues so that the rate of violence against women is checked down.
Fast track courts should be established regarding these sensitive issues so that justice is not denied and decisions are to be given as early as possible.
Women should be respected and should get equal rights in every sphere which leads to their empowerment.
Gender sensitization programs should be enhanced and legal education should be provided to this marginalized section.
NGO’s should be incorporated in the sensitization programmes of society and also in fighting violence against women.
Table-1: Frequency distribution of respondents Demographic Variables Category Frequency Percentage
Gender
Female 50 50% Male 50 50% Total 100 100%
Source: Field work July 2016
Graph-1
For the said research a sample of 100 students was randomly taken, among them 50 were female students and 50 were male students. The researcher has taken the equal proportion of the sample in order to get the accurate and reliable data.
Table: 2 Description of responses on the basis of awareness of basic concepts of Gender Sensitization
Concepts
Before attending the classes
Total
Percentage
After attending the classes
Total
Percentage
Male 50 Female 50 100 100 Male 50 Female 50 100 100% G. Sensitization 1 3 4 4% 41 50 91 91%
Socialization 2 5 7 7% 40 48 88 88% Patriarchy 0 2 2 3% 44 50 94 94% Oppression 3 8 11 11% 50 50 100 100% Subjugation 4 6 10 10% 46 50 96 96%

International Journal of Advance and Innovative Research Volume 5, Issue 4 (XII): October - December, 2018
175
ISSN 2394 - 7780
Widowhood 1 3 4 4% 50 50 100 100% Sheik marriages 1 0 1 1% 50 50 100 100% Invisible work 0 0 0 0% 42 50 100 92%
Source: Field work july2016
Above table 2 and below graph 2 shows that the before attending the class and after attending the class how much changes take place among the respondents. Before attending the classes only 4% responders were aware about gendersensitization among them 3% were girls and 1% boy and after attending the classes 50% girls and 41% girls aggres and understands gender sensitization.7% respondents were aware about the socialization before attending the classes and after attending the classes 88% respondents belives that there should be counter socialization and 10% boys and 2% girls justify the socialization and says that it is the best way to control the women.
Graph-2
Table: 3 Description of responses on the basis awareness of basic concepts of G. Sensitization
Concepts
Before attending classes
Total
Percentage After attending
classes
Total
Percentage
Male 50 Female 50 100 100 Male 50 Female 50 100 100%
Child sex ratio 0 3 3 3 50 50 100 100
Foeticide 6 17 23 23 50 50 100 100
Infanticide 6 17 23 23 50 50 100 100
Honor killing 0 2 2 2 50 50 100 100
Stalking 0 1 1 1 50 50 100 100
Voyeguism 2 1 3 3 50 50 100 100
Trafficking 4 15 19 19 50 50 100 100
Domestic violence 4 9 13 13 42 47 89 89

International Journal of Advance and Innovative Research Volume 5, Issue 4 (XII): October - December, 2018
176
ISSN 2394 - 7780
Graph-3
Above table 3 and graph 3 reveals that before attending the classes only 3% female students were aware about the sex ratio and not a single male student were aware about the concept of child sex ratio. After attending the classes 100% not only know the term sex ratio but also understands the decline sex ratio and its impacts on whole nation. one of the clearly says that prostitution centre, rape, polyandry are the results of decline female sex ratio.
Overall discussion revealed the following findings: Majority of the respondents who have attended the classes i.e. among 100 respondents (96%) agreed that gender sensitization plays a vital role to challenge patriarchal notions and with the inception of this subject the rate of harassment will be low and also said that before attending the said classes we were having no knowledge about gender, sexual harassment and other issues but after taking classes we come to know mindset of people is patriarchal and therefore carries and reflects gender biases and inequalities.
One of the female respondents says “A women’s heaven is in her husband’s feet” is a proverb repeated all the time by head of the families or by religious persons which always always bounds a woman to do whatever her husband orders. 46% respondents says that victims of gender based discriminated cases are found mostly in rural areas as compared to urban areas. 4 % strongly disagree with the outcome of the gender based sensitization programmes and while interviewing them it was seen that these 4% respondents are either from elite families or they used to get jealous by the similar treatment if given to both sexes.
SUGGESTIONS AND RECOMMENDATIONS 1. Adequate knowledge about different policies and laws which are in favoring of women empowerment. This
would definitely help the society to provide equal status to girls so that they will use full potentials and eradicate the oppression.
2. Due to the patriarchal mindset of society, girls lack self-confidence. So educational institutions should take necessary steps to develop their self esteem and personality and fight against all forms of discrimination against women. Gender sensitization subject boosts the morale of students which creates such type of environment which is free from gender bias.
3. In our society mostly all the powers are vested in the hands of male counterparts and important decisions were taken by men and girls were denied for these essential decisions. Besides it girls were not allowed to raise their voices so take initiative to end this deep rooted problem of gender discrimination, girls must be given an opportunities to take their decisions.
4. From the very beginning girls should taught self defense such as boxing, karate, judo etc for their strength and challenge day to day atrocities against them.
5. Motivational books, magazines, telecasting of documentaries, books regarding successful stories of women should be circulated to all educational institutions and compiled it into a library so that it motivates the girls.

International Journal of Advance and Innovative Research Volume 5, Issue 4 (XII): October - December, 2018
177
ISSN 2394 - 7780
CONCLUSION After having a long discussion regarding the gender sensitization of JNTUH students It shows that very few students are aware about the gender sensitivity and rest of them are having no knowledge. Besides it highlights that what are the basic factors which are responsible for the ill treatment of the girl child. According to William words worth “Child is a father of man” as todays children are tomorrow’s youth, so it is very effective and fruitful to provide gender based education from the elementary level. Follow up gender Sensitisation training with appropriate administrative reforms – Rules, regulations, work ethics, training system and a whole management system needs to be reviewed from gender lens.
CASE STUDIES Cases of sexual harassment victims Case 1: These cases are totally based on the interview given by those students who have experienced the harassment in the JANTUH University. One of the topper student priya (name changed) alleges that before attending the classes of gender sensitization was many times abused by the students of different classes, while going to canteen some of the students pass bad comments on her. She always kept quiet as she was not aware of how to defend but after taking the classes of gender sensitization it was extremely easy for her not only to handle them but also to avoid their attention. She also shares her life experience with researcher and she says that a number of girls has dropout in middle, secondary and senior secondary because of sexual harassment in their respective institutions either by faculty members or students.
Case 2: A 20 year old kalpana (name changed) says that she has experienced that whenever she went the university, boys gaze her and it was difficult for her to resist them as she was never taught either by her family members or by her school teachers regarding the harassment but after attending the fruitful classes of gender sensitization she got confidence that how to deal with these situations and also from now she has no fear while moving anywhere in the campus. She believed that somehow socialization is responsible for not to talk about sexual harassment which results that thousands of girls became the victims of rape, trafficking, molestation, stalking etc.
REFERENCES 1. Bhasin, K. (2003).Understanding Gender. Kali for women New Delhi.
2. Turmen, T. (1998). The health dimentions. UN Chron 1:18-19.
3. Oakley, A. (1985). Sex, Gender and Society. England: Gower Publishing Company.
4. Bhasin, K.(1993). What is Patriarchy? New Delhi: Kali for Women.
5. Heis, L. (1998) Violence Against Women: An Integrated, Ecological Framework. Violence Against Women, 4(3) pp.262-290 June
6. Mary, J. (2014). Sex Ratios and Gender Bias Selection: History, Debates and Future Directions. Report commissioned by UN Women.
7. Nivedita, M. (2012). Seeing like a feminist. New Delhi: Zubaan Books.
8. Shayan, J. & Manuhaar, A. (2013). Women and Wage discrimination in India: A Critical Analysis. International Journal of Humanities and Social Science Invention. 2.4.
9. Suneetha, et.al. (2015). Towards a World of Equals. Telugu Akademi. Hyderbad

International Journal of Advance and Innovative Research Volume 5, Issue 4 (XII): October - December, 2018
178
ISSN 2394 - 7780
DESIGN AND DEVELOPMENT OF NEBIVOLOL HCl LOADED NANOEMULSION
Dr. Mihir Raval1, Malay Chotaliya2 and Dr. Navin Sheth3
Head1 and Research Scholar2, Department of Pharmaceutical Sciences, Saurashtra University, Rajkot Vice Chancellor3, GTU, Ahmedabad
ABSTRACT The aim of the present research investigation was to develop nanoemulsion for improving solubility and bioavailability of Nebivolol HCl. The Nebivolol HCl loaded nanoemulsion formulations were developed by Capryol 90 as oil; Acrysol EL 135 as surfactant and Transcutol P as co-surfactant. The aqueous phase titration method was adopted to develop drug loaded oil in water (O/W) nanoemulsion, which was characterized by %Transmittance, Droplet size, Zeta potential, Refractive index and %Drug content. The pseudoternary diagrams were developed to identify the ideal nanoemulsion region. 4:1 ratio showed maximum nanoemulsification region. The optimized nanoemulsion formulation showed good transparency, minimum globule size. From the study suggested nanoemulsion is an alternative approach to improve the solubility and bioavailability of Nebivolol HCl.
Keywords: Nanoemulsion, Pseudoternary phase diagram, SEM,
INTRODUCTION Most of the antihypertensive drug candidates are insoluble in nature and possessing low bioavailability due to high first-pass hepatic metabolism. Nebivolol hydrochloride (NEB) is third generation beta blocker, with selective beta-1 adrenoreceptor antagonist and high potential to release NO from a cardiovascular endothelium. Nebivolol hydrochloride is practically insoluble in water. The plasma half-life is about 8-10 hr and it became a suitable drug candidate for the present research work (Singh & Yadav et al., 2012). The nanoemulsion (NE) consists of oil and water mixture and stabilized by an interfacial film of surfactant molecules which having droplet diameter is 10-200 nm. By nanoemulsion approach, It improves the bioavailability as well as the rate of drug absorption, avoids in taste masking, rapid and greater permeation of the drug molecules. Nanoemulsion has mainly three components like Oil, Surfactant/cosurfactant and Water. Nanoemulsion can be applied in various delivery routes like Parenteral, Oral, Pulmonary and Biotechnology field (Patel, 2014).
MATERIALS AND METHOD Materials Nebivolol hydrochloride was received from Cadila Ltd, Ahmedabad. Capryol 90, Labrafac PG, Labrafil M 2125CS, Paceol, Lauroglycol 90, Labrafac CC, Plurololeique CC497 were gifted from Gettefosse Saint-Priest Cedex, France. Various oils like Castor Oil, Isopropyl Myristate, and Oleic Acid were received from Loba Chem, Mumbai, India. Surfactants like Acrysol K 140 and Acrysol EL 135 were obtained as gift sample from Corel Pharma Chem, Ahmedabad, India. Another surfactant Capmul GMO, Capmul MCM C8 was received as gift sample from Abitec Corporation, Columbus, OH, USA. Transcutol P and Cremophor RH 40 were obtained as gift sample from BASF Corporation, New Jersey, USA. Tween 20, Tween 60, Tween 80, Polyethylene Glycol 400 and Propylene Glycol were obtained from Himedia Labs, Mumbai, India. Triacetin was received as gift sample from SD Fine Chem, Mumbai, India. Cremophor EL was received from signet, Hyderabad, India. Almond oil, coconut oil and Palm oil were obtained from Astron chemicals, Ahemdabad, Gujarat. Span 20 and Span 80 were received from central drug house, New Delhi. Ethanol was obtained from Baroda chemicals Industries limited. For the experimental study, Double distilled water was used. SOLUBILITY AND SCREENING STUDIES FOR SELECTION OF SURFACTANT AND COSURFACTANTS An excess amount of Nebivolol HCl was mixed into each excipient. After shaking at Isothermal shaker for 48 hr at room temperature, followed with centrifuged at 10,000 rpm for 15 min. The obtained supernatant of each sample was filtered using a cellulose membrane filter (0.45 µm). The filtered supernatant was diluted with phosphate buffer pH 6.8 using double beam UV Visible spectrophotometer against phosphate buffer pH 6.8 as a blank solution. In ease of emulsification study for surfactants, we mixed 300 mg surfactants with 300 mg oil and heated at 50 ºC for homogenization. Weight 50 mg above mixture and diluted with 50 mL of distilled water in a conical flask and assessed the number of flask inversions required to form a homogeneous fine emulsion. For cosurfactant, Mixtures of 100 mg of the co-surfactant, 200 mg chosen surfactant and 300 mg of the chosen oil were prepared and evaluated as per surfactant procedure. The %transparency of the emulsion was determined at 650 nm by a double beam UV spectrophotometer using distilled water as a blank (Patel, 2014 & Dhingani, 2013).

International Journal of Advance and Innovative Research Volume 5, Issue 4 (XII): October - December, 2018
179
ISSN 2394 - 7780
CONSTRUCTION OF PSEUDOTERNARY PHASE DIAGRAM To determine an ideal concentration range of nanoemulsion components, a pseudoternary phase diagram was constructed using the aqueous phase titration method at ambient temperature. The surfactant and cosurfactant were mixed with predetermined weight ratios (1:1, 1:2, 1:3, 1:4, 4:1, 3:1, and 2:1). For each phase diagram, the ratio of oil to Smix were different such as 1:9, 1:8.5, 1:8, 1:7.5, 1:7, 1:6.5, 1:6, 1:5.5, 1:5, 1:4.5, 1:4, 1:3.5, 1:3, 1:2, 1:1.5, 1:1, 1.5:1, 2:1 and titrated with distilled water by a dropwise addition under constant stirring. The pseudoternary plot was developed using the Triplot V14 software. At the endpoint, the colour changed from opaque to transparent that visually determined. After getting the nanoemulsion region in the phase diagrams, the desired component ratio was determined (Patel, 2014 & Dhingani, 2013).
PREPARATION OF NEBIVOLOL HCl LOADED NANOEMULSION An accurate weight quantity of Nebivolol hydrochloride dissolved in chosen oil phase and Smix mixture and adding drop by drop distilled water under constant magnetic stirring at 300 RPM to form a transparent nanoemulsion (Patel, 2015; Oliveira, 2017; Verma, 2016 & Dhawan, 2014).
EXPERIMENTAL DESIGN 32 full factorial design generated by keeping Capryol 90 (X1) and Smix (Acrysol EL-135 and Transcutol P) (X2) as factors and then further levels were also selected. Three levels were chosen to get linear co-relations. Thus as per the 32 full factorial design, total 9 batches were prepared. The three levels (-1, 0, +1) were selected for both the factors [Capryol 90 (X1) and Smix (X2)] by keeping their concentration different. For each batch of factorial design, dependent variables were selected such as Globule size, Zeta potential, Drug content, Polydispersibility index, %Transmittance and Refractive index. Total 9 experimental runs were generated as per Design Expert software trial version 10 (Stat-Ease. Inc., Minneapolis, USA) (Patel, 2014).
CHARACTERIZATIONS OF NEBIVOLOL HCl LOADED NANOEMULSION Globule size, size distribution and zeta potential The Globule size, Size distribution (PI), and Zeta potential of all nanoemulsion formulation batches were determined using Particle size analyzer (Zetatrack). 1 mL of sample was diluted to 10 mL with distilled water, agitated for 5 min and these diluted samples were subjected to Particle size analyzer (Patel, 2014 & Dhingani, 2013).
Percentage Transparency (%T) The prepared formulation was diluted ten times with distilled water with continuous stirring. The percentage transmittance (%T) of this diluted formulation was measured using double beam UV-visible spectrophotometer at 650 nm against distilled water as a blank (Patel, 2014 & Dhingani, 2013).
Percentage Drug content Accurately weighed samples were taken and diluted in 100 mL phosphate buffer pH 6.8 and centrifuged at 5000 rpm for 25 min. The supernatants were filtered using (0.45 µm) membrane filter and the drug content of each filtrate was estimated double beam UV-spectrophotometer against phosphate buffer pH 6.8 as blank (Patel, 2014; Dhingani, 2013).
Refractive index All experimental design batches of nanoemulsion formulations (each diluted to 10 times with distilled water) was determined by Refractive index measurement (Saini, 2014)
Conductivity An electrical conductivity of prepared nanoemulsion formulation was measured using conductometer and electric current flow was measured (Patel, 2014 & Dhingani, 2013).
Scanning electron microscopy (SEM) The morphology of nanoemulsion can be determined by scanning electron microscopy (SEM). A good analysis of shape and surface morphology of disperse phase in the formulation is obtained through SEM Image analysis software (Verma, 2016).
RESULTS AND DISCUSSIONS Solubility Studies The maximum solubility of Nebivolol hydrochloride (8.07 mg/gm) was seen in Capryol 90 (Oil phase), which was then selected as the oily phase. Highest solubility was found out in Acrysol EL 135 (7.5 mg/gm) from surfactant whereas various cosurfactants were employed, in which Transcutol P showed the maximum solubility (12.37 mg/gm) for the drug. Based on solubility study, Acrysol EL 135, Labrafil M2125 CM were chosen as surfactant, and Span 80, Propylene Glycol, Transcutol P were chosen as cosurfactant. So they were selected for

International Journal of Advance and Innovative Research Volume 5, Issue 4 (XII): October - December, 2018
180
ISSN 2394 - 7780
further study of ease of emulsion and %Transmittance with Capryol 90. Further, the selection of surfactant and cosurfactant was subsequently done based on their ability to emulsify the maximum amount of oil (Patel, 2014). The comparison of solubility of Nebivolol HCl in various oil, surfactants and cosurfactant is shown in Figure 1,2,3. For all the figures, results are mean ± SD, n=3.
Figure-1: Solubility study of Nebivolol HCl in various oils
Figure-2: Solubility study of Nebivolol HCl in various surfactants
Figure-3: Solubility study of Nebivolol HCl in various cosurfactants
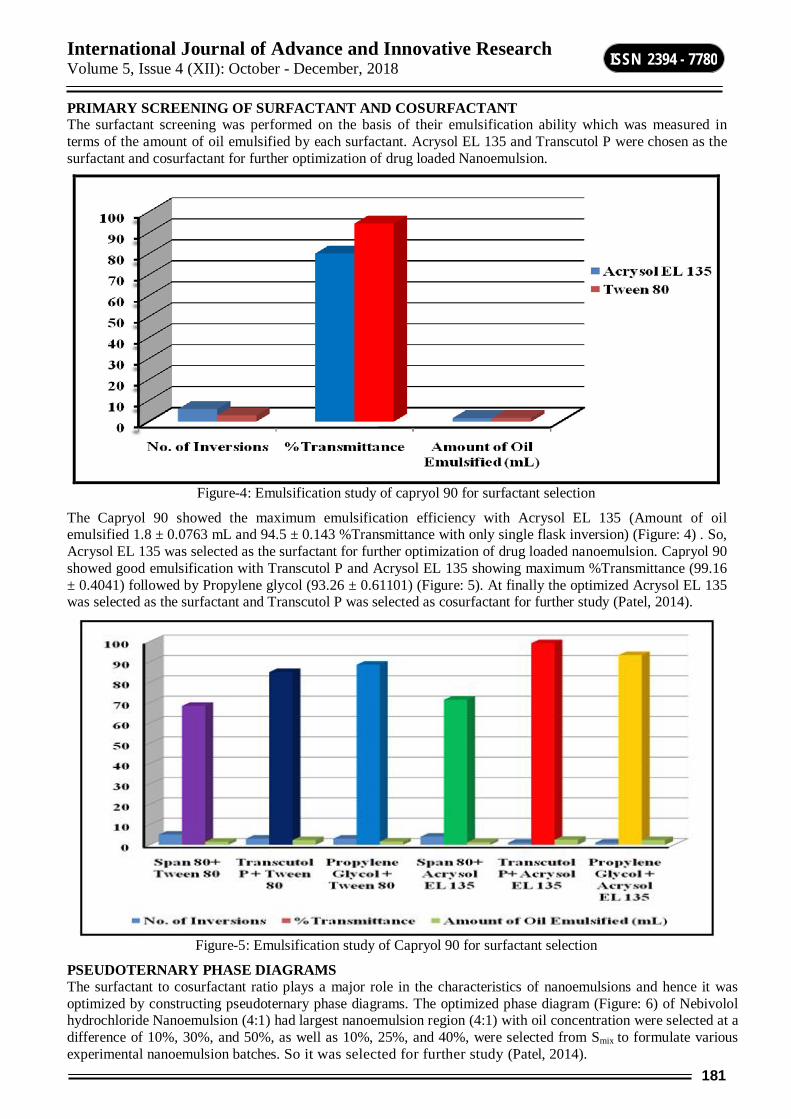
International Journal of Advance and Innovative Research Volume 5, Issue 4 (XII): October - December, 2018
181
ISSN 2394 - 7780
PRIMARY SCREENING OF SURFACTANT AND COSURFACTANT The surfactant screening was performed on the basis of their emulsification ability which was measured in terms of the amount of oil emulsified by each surfactant. Acrysol EL 135 and Transcutol P were chosen as the surfactant and cosurfactant for further optimization of drug loaded Nanoemulsion.
Figure-4: Emulsification study of capryol 90 for surfactant selection
The Capryol 90 showed the maximum emulsification efficiency with Acrysol EL 135 (Amount of oil emulsified 1.8 ± 0.0763 mL and 94.5 ± 0.143 %Transmittance with only single flask inversion) (Figure: 4) . So, Acrysol EL 135 was selected as the surfactant for further optimization of drug loaded nanoemulsion. Capryol 90 showed good emulsification with Transcutol P and Acrysol EL 135 showing maximum %Transmittance (99.16 ± 0.4041) followed by Propylene glycol (93.26 ± 0.61101) (Figure: 5). At finally the optimized Acrysol EL 135 was selected as the surfactant and Transcutol P was selected as cosurfactant for further study (Patel, 2014).
Figure-5: Emulsification study of Capryol 90 for surfactant selection
PSEUDOTERNARY PHASE DIAGRAMS The surfactant to cosurfactant ratio plays a major role in the characteristics of nanoemulsions and hence it was optimized by constructing pseudoternary phase diagrams. The optimized phase diagram (Figure: 6) of Nebivolol hydrochloride Nanoemulsion (4:1) had largest nanoemulsion region (4:1) with oil concentration were selected at a difference of 10%, 30%, and 50%, as well as 10%, 25%, and 40%, were selected from Smix to formulate various experimental nanoemulsion batches. So it was selected for further study (Patel, 2014).

International Journal of Advance and Innovative Research Volume 5, Issue 4 (XII): October - December, 2018
182
ISSN 2394 - 7780
Figure-6: Ideal Pseudoternary phase diagram of 4:1 ratio
Table 1: Results of Nebivolol HCl loaded nanoemulsion experimental design batches Code GSa (nm) ZPb (mv) %Tc DCd PIe RIf
NE1 28.45±1.28 28.5±0.10 99±0.19 100.3±0.10 0.24±1.00 1.55±0.97 NE2 17.42±3.46 28.15±0.07 99.32±0.61 99.34±0.07 0.23±0.57 1.25±0.83 NE3 56.32±1.03 26.17±0.08 98.56±0.61 98.65±0.11 0.10±0.59 1.57±0.61 NE4 10.12±1.55 28.65±0.08 100±0.61 99.54±0.07 0.1±0.17 1.52±0.39 NE5 59.12±2.50 27.63±0.08 99.67±0.18 97.2±0.05 0.18±0.70 1.69±0.63 NE6 88.15±2.47 28.11±0.07 98±0.17 98.99±0.08 0.32±0.28 1.85±0.19 NE7 51.42±1.83 18.76±0.09 99.54±0.17 99.09±0.12 0.23±0.72 1.52±0.61 NE8 43.76±3.81 27.65±0.11 98.1±0.37 99.54±0.12 0.33±0.61 1.3±0.62 NE9 69.25±1.71 33.13±1.05 99.74±0.17 93.42±0.11 0.24±0.70 1.4±0.50
The results are mean ± SD, (n=3), aGS: Globule size, bZP: Zeta potential, c%T: Transmittance, dDC: Drug content, ePI: Polydispersibility Index, fRI: Refractive index
Tabl-2: Results data of optimized formulation composition Type of Component Components Amount (%w/w)
Oil Capryol 90 32.22 % S-Cosurfactant
Mixture Surfactant: Acrysol EL 135 Cosurfactant: Transcutol P
Smix Water
30.10 % 37.68 %
The values of responses all the batches of experimental design have been summarized in (Table: 1). The globule size of the optimized batch of Nebivolol hydrochloride loaded nanoemulsion was found to be 10.25 ± 0.29 nm (Figure 8).
Figure-7: Optimized batch of Nebivolol HCl loaded nanoemulsion

International Journal of Advance and Innovative Research Volume 5, Issue 4 (XII): October - December, 2018
183
ISSN 2394 - 7780
Figure 8: Globule size analysis of optimized Nebivolol hydrochloride loaded nanoemulsion
The polydispersibility index of the optimized batch of Nebivolol hydrochloride nanoemulsion was found to be 0.1 ± 1.4. The Zeta potential value of the optimized batch of Nebivolol hydrochloride loaded Nanoemulsion was found to be 30.12 ± 0.637 mv. In general, a zeta potential value of ±30 mv is sufficient for the stability of Nanoemulsion. The Refractive Index value of the optimized batch was found to be 1.6 ± 0.92 that confirmed the isotropic nature of nanoemulsions. The %Transmittance value of the optimized batch of Nebivolol hydrochloride loaded nanoemulsion was found to be 100 ± 0.75%. The value of %Drug content for the optimized batch of Nebivolol hydrochloride loaded nanoemulsion was found to be 98.47 ± 1.48% indicated the uniform distribution of the drug in the optimized formulation. The value of conductivity was found to be 427 µs/cm of the optimized batch of Nebivolol HCl-loaded Nanoemulsion. The conductivity value shows that nanoemulsion was oil/water type (Patel, 2014 & Singh, 2012).
Figure-9: SEM image of optimized batch of Nebivolol HCl-loaded nanoemulsion
The SEM image of prepared optimized Nebivolol HCl loaded nanoemulsion showed the small spherical shape and uniform size distribution as observed in the SEM photograph (Figure:9) (Verma, 2015).
CONCLUSION Nebivolol HCl loaded nanoemulsion batches were efficiently developed by the aqueous phase titration method. Capryol 90 was selected as the oil phase for the nanoemulsion preparation. The droplet size was found 10.25 nm. The optimized batch contained 32.22% oil, 30.10% Smix and 37.68% Water. The nanoemulsion has a greater solubilization as well as good zeta potential that produced stabilized nanoemulsion than conventional emulsion. The optimized batch contained 30.12 mv zeta potential suggests the greater stability of the formulation. The optimized formulation showed low particle size, low viscosity and high percentage transmittance. The above investigation leaves a future extension for refining innovation which can additionally be utilized for the arrangement of different other nano dosage form in pharmaceutical products.

International Journal of Advance and Innovative Research Volume 5, Issue 4 (XII): October - December, 2018
184
ISSN 2394 - 7780
DECLARATION OF INTEREST The authors report no conflicts of interest.
REFERENCES 1. Dhawan, B, Aggarwal, G, & Harikumar, S, (2014), ‘Enhanced transdermal permeability of piroxicam
through novel nanoemulgel formulation’, International Journal of Pharmaceutical Investigation, 4(2): 65-76.
2. Dhingani, A, Patel, J, Garal, K, Raval, M, & Dharamsi, A, (2013), ‘Quality by Design Approach for Development of W/O Type Microemulsion Based Transdermal Systems for Atenolol’, Journal of Dispersion Science and Technolology, 35(5): 619-640.
3. Oliveira, V, Erika, C, Carneiro, ZA, de Albuquerque, S, & Marchetti, J.M., (2017), ‘Development and Evaluation of a Nanoemulsion Containing Ursolic Acid a Promising Trypanocidal Agent: Nanoemulsion with Ursolic Acid Against T. Cruzi’, AAPS Pharm Sci Tech, 18(7): 2551 - 2560.
4. Patel, J., Dhingani, A., Garala, K., Raval, M., & Sheth, N., (2014), ‘Quality by design approach for oral bioavailability enhancement of Irbesartan by self-nanoemulsifying tablets’, Drug delivery, 21(6): 412 - 435.
5. Patel, N, Baldaniya, M, Raval, M, & Sheth N, (2015), ‘Formulation and development of in-situ nasal gelling systems for quetiapine fumarate-loaded mucoadhesive microemulsion’ Journal of Pharmaceutical Innovation’, 10(4): 353 - 373.
6. Saini, K, Gaba, P, & Singh, J, (2014), ‘Design, Development and Evaluation of Nanoemulsion Gel of Salicylic Acid’, International Journal of Innovative Pharmaceutical Sciences and Research’, 2 (6) :1168-1191.
7. Singh, B, Kumar, B, Jain, S.K., Kausar, S, (2012), ‘Development and characterization of a Nanoemulsion Gel formulation for Transdermal Delivery of Carvedilol’, International Journal of Drug Development Research’, 4(1):151-161.
8. Singh, J.V., Singh, S.J., Sharma, A.K., Mehara, G.R., Sharma, A, & Jat, R.K., (2012), ‘Design, Formulation and in vitro Drug Release from Transdermal Patches containing Nebivolol Hydrochloride as Model Drug’, Asian. J. Pharm. Res.; 2(4): 136 - 141.
9. Verma, S, Singh, A, & Mukerjee, A, (2016), ‘Formulation and evaluation of ketoconazole nanoemul gel. World Journal of Pharmacy and Pharmaceutical Science; 5(2):899-911.
10. Yadav, S.K., Mishra, S., & Mishra, B., (2012), ‘Influence of components of nanoemulsion system for transdermal drug delivery of Nimodipine’, Asian Journal of Pharmaceutical and clinical research, 8(2): 119-124.

MANUSCRIPT SUBMISSION
GUIDELINES FOR CONTRIBUTORS 1. Manuscripts should be submitted preferably through email and the research article / paper
should preferably not exceed 8 – 10 pages in all.
2. Book review must contain the name of the author and the book reviewed, the place of publication and publisher, date of publication, number of pages and price.
3. Manuscripts should be typed in 12 font-size, Times New Roman, single spaced with 1” margin on a standard A4 size paper. Manuscripts should be organized in the following order: title, name(s) of author(s) and his/her (their) complete affiliation(s) including zip code(s), Abstract (not exceeding 350 words), Introduction, Main body of paper, Conclusion and References.
4. The title of the paper should be in capital letters, bold, size 16” and centered at the top of the first page. The author(s) and affiliations(s) should be centered, bold, size 14” and single-spaced, beginning from the second line below the title.
First Author Name1, Second Author Name2, Third Author Name3 1Author Designation, Department, Organization, City, email id 2Author Designation, Department, Organization, City, email id 3Author Designation, Department, Organization, City, email id
5. The abstract should summarize the context, content and conclusions of the paper in less than 350 words in 12 points italic Times New Roman. The abstract should have about five key words in alphabetical order separated by comma of 12 points italic Times New Roman.
6. Figures and tables should be centered, separately numbered, self explained. Please note that table titles must be above the table and sources of data should be mentioned below the table. The authors should ensure that tables and figures are referred to from the main text.
EXAMPLES OF REFERENCES All references must be arranged first alphabetically and then it may be further sorted chronologically also.
Single author journal article: Fox, S. (1984). Empowerment as a catalyst for change: an example for the food industry. Supply Chain Management, 2(3), 29–33.
Bateson, C. D.,(2006), ‘Doing Business after the Fall: The Virtue of Moral Hypocrisy’, Journal of Business Ethics, 66: 321 – 335
Multiple author journal article: Khan, M. R., Islam, A. F. M. M., & Das, D. (1886). A Factor Analytic Study on the Validity of a Union Commitment Scale. Journal of Applied Psychology, 12(1), 129-136.
Liu, W.B, Wongcha A, & Peng, K.C. (2012), “Adopting Super-Efficiency And Tobit Model On Analyzing the Efficiency of Teacher’s Colleges In Thailand”, International Journal on New Trends In Education and Their Implications, Vol.3.3, 108 – 114.

Text Book: Simchi-Levi, D., Kaminsky, P., & Simchi-Levi, E. (2007). Designing and Managing the Supply Chain: Concepts, Strategies and Case Studies (3rd ed.). New York: McGraw-Hill.
S. Neelamegham," Marketing in India, Cases and Reading, Vikas Publishing House Pvt. Ltd, III Edition, 2000.
Edited book having one editor: Raine, A. (Ed.). (2006). Crime and schizophrenia: Causes and cures. New York: Nova Science.
Edited book having more than one editor: Greenspan, E. L., & Rosenberg, M. (Eds.). (2009). Martin’s annual criminal code:Student edition 2010. Aurora, ON: Canada Law Book.
Chapter in edited book having one editor: Bessley, M., & Wilson, P. (1984). Public policy and small firms in Britain. In Levicki, C. (Ed.), Small Business Theory and Policy (pp. 111–126). London: Croom Helm.
Chapter in edited book having more than one editor: Young, M. E., & Wasserman, E. A. (2005). Theories of learning. In K. Lamberts, & R. L. Goldstone (Eds.), Handbook of cognition (pp. 161-182). Thousand Oaks, CA: Sage.
Electronic sources should include the URL of the website at which they may be found, as shown:
Sillick, T. J., & Schutte, N. S. (2006). Emotional intelligence and self-esteem mediate between perceived early parental love and adult happiness. E-Journal of Applied Psychology, 2(2), 38-48. Retrieved from http://ojs.lib.swin.edu.au/index.php/ejap
Unpublished dissertation/ paper: Uddin, K. (2000). A Study of Corporate Governance in a Developing Country: A Case of Bangladesh (Unpublished Dissertation). Lingnan University, Hong Kong.
Article in newspaper: Yunus, M. (2005, March 23). Micro Credit and Poverty Alleviation in Bangladesh. The Bangladesh Observer, p. 9.
Article in magazine: Holloway, M. (2005, August 6). When extinct isn't. Scientific American, 293, 22-23.
Website of any institution: Central Bank of India (2005). Income Recognition Norms Definition of NPA. Retrieved August 10, 2005, from http://www.centralbankofindia.co.in/ home/index1.htm, viewed on 7. The submission implies that the work has not been published earlier elsewhere and is not
under consideration to be published anywhere else if selected for publication in the journal of Indian Academicians and Researchers Association.
8. Decision of the Editorial Board regarding selection/rejection of the articles will be final.

PUBLICATION FEE
The International Journal of Advance & Innovative Research is an online open access journals, which provides free instant, worldwide and barrier-free access to the full-text of all published manuscripts to all interested readers in the best interests of the research community. Open access allows the research community to view, any manuscript without a subscription, enabling far greater distribution of an author's work than the traditional subscription based publishing model. The review and publication fee of a manuscript is paid from an author's research budget, or by their supporting institutions. As costs are involved in every stage of the publication process, like manuscript handling form submission to publication, peer-review, copy-editing, typesetting, tagging and indexing of articles, Electronic composition and production, hosting the final article on dedicated servers, electronic archiving, server and website update and maintenance and administrative overheads, each author is asked to pay certain fee as follows.
The publication fee for the Online journal is Rs 1400. If the author wants a printed copy of the journal, then additional Rs.400/- have to be pay (which includes printing charges of the journal, hard copy of publication certificate for all authors, packaging and courier charges ).
The publication fee for the Online journal is Rs $50. If the author wants a printed copy of the journal, then additional $50 have to be pay (which includes printing charges of the journal, hard copy of publication certificate for all authors, packaging and courier charges ).
The principal author will get one complimentary copy of journal ( online / print ) based on fee paid along with publication certificate ( e copy / hard copy) after publication of the paper. The publication fee, you can be deposited directly or can be transferred online in favour of “Empyreal” , Current Account no 125505000329, SWIFT No : ICICINBBCTS, IFS code : ICIC0001255, MICR No : 110229116, Branch code : 001255, Address: ICICI Bank, Plot No C-7, Sector-13, Opp. Jaipuria School, Vasundhara, Ghaziabad – 201012, Uttar Pradesh, India. You can also transfer the publication fee through Paytm at Mobile no : 9999817591 If anybody do not have funds to pay publication fee, he/she will have an opportunity to request the Editor for fee waiver through the Head of his/her Institution/Department/University with the reasons, because IARA does not want fee to prevent the publication of worthy work, however fee waivers is granted on a case-to-case basis to authors who lack funds. To apply for a waiver author/s must request during the submission process. Any request received thereafter will not be considered.
Indian Academicians and Researchers Association 1, Shanti Path ,Opp. Darwin Campus II, Zoo Road Tiniali, Guwahati, Assam
email : [email protected] / [email protected]