Visual resolution, contrast sensitivity, and the cortical magnification factor
20
Exp. Brain Res. 37, 475-494 (1979) Experimental Brain Research Springer-Verlag 1979 Visual Resolution, Contrast Sensitivity, and the Cortical Magnification Factor V. Virsu 1 and J. Rovamo 2 1 Department of General Psychology, Universityof Helsinki, Ritarikatu 5, SF-00170 Helsinki 17, Finland 2 Institute of Physiology,University of Helsinki, SF-00170 Helsinki 17, Finland Summary. This study shows that photopic contrast sensitivity and resolution can be predicted by means of simple functions derived by using the cortical magnification factor M as a scale factor of mapping from the visual field into the striate cortex. We measured the minimum contrast required for discriminating the direction of movement or orientation of sinusoidal gratings, or for detecting them in central and peripheral vision. No qualitative differences were found between central and peripheral vision, and almost all quantitative differences observed could be removed by means of a size compensation derived from M. The results indicated specificly that (1) visual patterns can be made equally visible if they are scaled so that their calculated cortical representations become equivalent; (2) contrast sensitivity follows the same power function of the cortical area stimulated by a grating at any eccentricity; (3) area and squared spatial frequency are reciprocally related as determinants of contrast sensitivity; and (4) acuity and resolution are directly proportional to M, and the minimum angle of resolution is directly proportional to M -~. The power law of spatial summation expressed in (2) and (3) suggests the existence of a central integrator that pools the activity of cortical neurons. This summation mechanism makes the number of potentially activated visual cells the most important determinant of visibility and contrast sensitivity. The functional homogeneity of image processing across the visual field observed here agrees with the assumed anatomical and physiological uniformity of the visual cortex. Key words: Visual contrast sensitivity - Man - Cortical magnification factor - Spatial summation It has been customary to measure the performance of peripheral vision by using stimuli that have the same retinal size in foveal and peripheral measurements. Offprint requests to." Prof. V. Virsu Ph.D. (address see above) 0014-4819/79/0037/0475/$ 4.00
-
Upload
independent -
Category
Documents
-
view
3 -
download
0
Transcript of Visual resolution, contrast sensitivity, and the cortical magnification factor

Exp. Brain Res. 37, 475-494 (1979) Experimental Brain Research
�9 Springer-Verlag 1979
Visual Resolution, Contrast Sensitivity, and the Cortical Magnification Factor
V. Virsu 1 and J. Rovamo 2
1 Department of General Psychology, University of Helsinki, Ritarikatu 5, SF-00170 Helsinki 17, Finland 2 Institute of Physiology, University of Helsinki, SF-00170 Helsinki 17, Finland
Summary. This study shows that photopic contrast sensitivity and resolution can be predicted by means of simple functions derived by using the cortical magnification factor M as a scale factor of mapping from the visual field into the striate cortex. We measured the minimum contrast required for discriminating the direction of movement or orientation of sinusoidal gratings, or for detecting them in central and peripheral vision. No qualitative differences were found between central and peripheral vision, and almost all quantitative differences observed could be removed by means of a size compensation derived from M.
The results indicated specificly that (1) visual patterns can be made equally visible if they are scaled so that their calculated cortical representations become equivalent; (2) contrast sensitivity follows the same power function of the cortical area stimulated by a grating at any eccentricity; (3) area and squared spatial frequency are reciprocally related as determinants of contrast sensitivity; and (4) acuity and resolution are directly proportional to M, and the minimum angle of resolution is directly proportional to M -~.
The power law of spatial summation expressed in (2) and (3) suggests the existence of a central integrator that pools the activity of cortical neurons. This summation mechanism makes the number of potentially activated visual cells the most important determinant of visibility and contrast sensitivity. The functional homogeneity of image processing across the visual field observed here agrees with the assumed anatomical and physiological uniformity of the visual cortex.
K e y w o r d s : Visual contrast sensitivity - Man - Cortical magnification factor - Spatial summation
It has been customary to measure the performance of peripheral vision by using stimuli that have the same retinal size in foveal and peripheral measurements.
Offprint requests to." Prof. V. Virsu Ph.D. (address see above)
0014-4819 /79 /0037 /0475 /$ 4.00

476 v. Virsu and J. Rovamo
The results have led to the belief that photopic peripheral vision is inferior to central vision and differs from the latter functionally, being more specialized for the analysis of moving stimuli, for example (Sharpe, 1974). These measurements may misrepresent the distribution of sensitivity across the visual field, however, since a much larger number of neural elements analyzes a target having a constant retinal size in foveal than peripheral projections (Holmes, 1945; Cowey and Rolls, 1974; Drasdo, 1977).
We reasoned recently (Rovamo et al., 1978) that the peripheral contrast sensitivity might match that of central vision if the cortical representations of the test targets were made similar for each retinal location, for this operation makes the stimulated neural volumes similar. We scaled the area and spatial frequency of gratings for equal calculated cortical projection images and found the same contrast sensitivity function valid for all retinal locations tested. The invariance of contrast sensitivity functions remained incomplete only at the highest retinal spatial frequencies because they could not be scaled adequately due to the attenuation of contrast in the retinal images (see Campbell and Gubish, 1966).
We calculated the expected cortical projection images of the gratings by using the linear cortical magnification factor M (Daniel and Whitteridge, 1961; Cowey and Rolls, 1974) simply as a scale of mapping from the visual field into the striate cortex (expressed in mm of cortical surface per 1 ~ of visual angle). The exact topography assumed in this calculation does not hold at a microscopic level on the cortex because of the scatter (Hubel and Wiesel, 1974; Albus, 1975) and the functional rearrangement of projections (Hubel and Wiesel, 1974). Nevertheless, our results showed that the calculated cortical projection images were useful as hypothetical constructs. At a cortical macrolevel our calculation is justified in a statistical sense since the scatter is Gaussian (Creutzfeldt et al., 1974; Albus, 1975). Therefore, we use the same method of calculation in the present study. We call M-scaling the procedures by means of which the spatial and temporal frequency contents of visual stimuli are equated in terms of the calculated cortical images.
In the present study we analyze the neural factors that make it possible to predict the photopic contrast sensitivity by means of the cortical magnification factor. We investigate the conditions of visibility of various aspects of gratings at different locations in the nasal and inferior visual field. The results are generalized over the whole visual field in the subsequent study (Rovamo and Virsu, 1979), in which M is estimated for all retinal locations.
Methods
Apparatus and Stimuli
Sinusoidal gratings were generated under computer control on the white phosphor (P4) of a Hewlett-Packard 1300A display by means of a digital grating generator. The optical modulation transfer function of the stimulation system was measured several times during the study (see Virsu and Laurinen, 1977, for the methods of calibration and other details). The calibration values were used as appropriate correction factors in programs. The geometrical aspects of stimulation are explained in Fig. 1.

Visual Resolution and Contrast Sensitivity 477
............................. ~ ........... Z : : .... }/
". ........................ "~- ...........
Fig. 1. Schematic presentation of one experimental condition for the inferior half-meridian of the visual field. The display (D) was fixed to an X-ray stand by means of a tilting and rotating frame so that the screen could be positioned in any manner in the visual field of the subject. Therefore, the subject could retain his straight-ahead fixation of gaze for any eccentricity of the grating; the head was turned or tilted only if occlusion caused by the nose or eyelashes had to be avoided at extreme eccentricities. The head position was stabilized by means of a bite board (B) prepared with the dental impression of the subject. The fixation point (F) was a green LED that could be positioned at any desired distance from the straight edge of the stimulus field. In most experiments the stimulus field was semicircular as shown, having a constant radius of 8 cm for the full circle. The straight edge of the field was then perpendicular to the meridian under study and nearest to the fixation point; eccentricity (E) refers to the angular separation between the edge of the stimulus field and the fixation point. When the stimulus dimensions were scaled by M, viewing distance was changed as a constant multiple of M and the position of the grating relative to the fixation point was readjusted as required. The display was viewed perpendicularly and the middle of the grating was at the same distance from the eye as the fixation point. Fixation was binocular in order to maximize the stability of accommodation and fixation, but the stimulus field was seen by one eye only. This condition was achieved by using an occluder in front of the irrelevant eye. Only the display and the fixation point were visible to the subject, for the experimental room was dark. The subject indicated his responses by pressing either one of the two keys in the response device (R)
The average luminance of the gratings and of the blank field presented between gratings was always 10 cd/m ~. Parameter changes were synchronized so that no visible flashes occurred. Artificial pupils were not used in front of the eye because they cause various optical problems in peripheral vision. The diameter of the natural pupil in the stimulated eye was routinely assessed to the nearest 0.5 mm by means of pupil models: the nearest visually matching size was found for the subject in testing position in the light shone from the display. For the experiments and subjects considered here the pupil diameter varied from 6 to 7 mm. Hence, the average retinal itluminance produced by the gratings and the intervening adaptation field was about 330 photopic trolands (td --= pupillary area mm 2 • luminance). The corresponding scotopic retinal illuminance was 1,060 td, calculated from the scotopic luminance of 32 cd/m 2 that was measured with a Spectra Spotmeter, calibrated recently by Photo Research, Inc.
Because the scotopic illuminance value corresponds to the generally accepted saturation level of the rods, our stimuli can be regarded as photopic. The results of a control experiment supported this conclusion. The average retinal illuminance was increased to 16,000 scotopic td by shining additional light onto the display screen from two projectors and dilating the pupil by means of Cyclogyl; the refraction was corrected by using lenses. At this level of retinal illuminance the rods could not react differentially even to the darkest bars of the gratings shown. Nevertheless, the contrast sensitivity functions obtained at eccentricities of 0 ~ and 30 ~ and their relations were similar to those measured under the standard conditions. This control experiment indicated aiso that the decrease of retinal illuminance caused by the oblique incidence of light into the pupil in peripheral vision (Jay, 1962) had no significant effects on the results.
478 V. Virsu and J. Rovamo
Procedures
Visibility of various aspects of gratings was assessed by means of the contrast sensitivity functions that describe the inverse of contrast thresholds at various spatial frequencies (bar densities of gratings in cycles per degree of visual angle, c/~ Contrast is defined as (Lmax - Lmin)/(Lmax + Lmln), where Lm~x and Lmi. refer to the luminance maxima and minima. Contrast thresholds indicate the contrasts that make correct responses possible at the same known probability for each grating.
We distinguish two main types of contrast thresholds. Detection thresholds refer to the contrasts at which any stimulus feature whatsoever makes it possible for the subject to produce a certain proportion of correct responses when the presence or absence of a grating is to be indicated. Discrimination thresholds refer to the contrasts required for a certain proportion of correct identifications regarding a predetermined set of alternative values in a defined feature, such as orientation or movement . These should not be confused with the classical difference thresholds that indicate the min imum noticeable difference in some st imulus attribute. Term "recognition threshold" can be reserved for the contrast that makes the complete identification of a target possible.
Contrast thresholds are most often est imated by using the method of adjus tment in which, depending on subjective criteria, either detection or recognition thresholds are measured, and the distinction between different types of performance is then unclear. We have developed an objective two-alternative forced-choice method that can be set to measure either detection or discrimination thresholds depending on the tasks selected. The method was used on-line under computer control. Discrimination thresholds were measured in the following way:
In the task requiring discrimination of the direction of movement the blank adaptation field was replaced by a drifting grating for 0.5 s. The grating was accompanied by a sound signal. The subject had to decide whether the grating presented drifted to the left or to the right, if a series of vertical gratings was tested, and up or down, if horizontal gratings were shown. The direction of movemen t varied randomly from trial to trial. The subject indicated the direction of movemen t or his best guess of its direction by pressing one of two keys. If the choice was wrong, a sound signal indicating this event was given. The subject tried to avoid the wrong responses because they made the threshold runs longer-lasting. Each response triggered a new trial with a delay of 0.3 s.
The est imation of threshold contrast took place in two consecutive phases for each spatial frequency. The first phase established a r andom subthreshold starting point for the final threshold estimation, independent of the initial contrast selected. The first contrast shown for each spatial frequency was clearly above threshold. Contrast was decreased by 1 decilog (0.1 loglo unit) after every correct choice during the first phase. The first wrong choice had no effect but the second initiated the final phase that started from the contrast last shown. It was below threshold by an amount dependent on the hit rate of subject 's guesses. Now every wrong choice increased contrast by 1 decilog and four consecutive correct responses led to a contrast decrement by the same amount ; a smaller number of correct choices had no effect. The final phase continued till 7 turns of contrast change occurred; hence, the estimation terminated always after a string of correct responses, which were thus rewarded. The contrast required for the probability of 0.84 of correct choice was est imated from the turning contrasts as described by Wetherill and Levitt (1965).
The same algorithm was applied for est imating the threshold contrasts for orientation discrimination. The gratings shown were randomly either vertical or horizontal, and the subject indicated which one was presented at each trial. The changes of orientation were generated electronically and the two stimuli of each orientation pair were calibrated microphotometricly to be accurately similar. The just perceptible flashes that accompanied orientation changes were suppressed as cues by interposing d u m m y changes of raster angle.
How validly our method measures discrimination thresholds instead of detection thresholds for one of the alternatives depends on how symmetric the alternatives are in visibility. The alternatives for movemen t discrimination were symmetric without exception, that is, movemen t to the left (or up) was equally visible as movement to the right (or down) under all conditions of our experiments. Hence, the thresholds measured in movement discrimination are valid. In orientation discrimination the symmetry failed under some conditions but not so that it would have affected any of our conclusions.
The same method was applied also to the measu remen t of detection thresholds. In this ease two 0.5 s long sound signals were given at each trial. One signal was accompanied by a grating having a
VisuaI Resolution and Contrast Sensitivity 479
non-zero contrast and the other had a zero contrast. The subject decided which signal coincided with the non-zero contrast grating. The pause between the stimuli was 0.7 s.
In order to avoid the adverse influence of the Troxler effect (fading of stable peripheral stimuli), the subject did not trigger the next trial if the blank adaptation field was not visible. If the field did not reappear within a few seconds spontaneously, the subiect closed his eyes for a moment or made a rapid eye movement. Fixation was then steadied for the duration of the whole trial. The number of trials for each threshold varied from 40 to 70.
Subjects
Seven subjects, 25-36 years old, participated in the experiments. A complete set of data for each different experiment was collected from 2 or 3 subjects, and in each case the results of different subjects were similar. All subjects had extensive prior experience of psychophysical experiments requiring steady fixation. For two subjects (PL and VV) evidence was available from eye movement recordings that they were able to fixate even 40 s periods in the presence of moving and flashing suprathreshold gratings without making an occasional eye movement larger than 0.2 ~ The subjects could easily monitor their accuracy of fixation at small eccentricities by paying attention to the afterimages of the dark display edges.
The Snellen decimal acuity values of the subjects varied from 1.4 to 2.0, measured monocularly at a distance of 10 m at a luminance level of 10 cd/m 2. The three subjects whose results will be presented in figures were all emmetropic, but small corrections (0.5 D or less) were applied to maximize the far-acuity when appropriate. No corrective lenses were used for peripheral vision, for their effects were minor for our subjects (cf. Rempt et al., 1976).
The Magnification Factor
A relatively direct estimate for the human M is available at eccentricities of 2-30 ~ in the inferior half of a near-vertical visual-field meridian from Brindley and Lewin (1968). They registered where the sensations of light occurred in the visual field when different regions of the human visual cortex were stimulated eIectrically. Cowey and Rolls (1974) caIculated the values of M for the primary visual cortex from the electrode positions used by Brindley and Lewin. These values correlated well with peripheral visual acuity, and therefore, Cowey and Rolls extrapolated by means of the acuity data of Wertheim (1894) the values of M for foveal and near-foveal regions, where the direct estimates were missing.
We used the calculations of Cowey and Rolls as a starting point but estimated the values of M differently. We drew a smooth curve through the data points of Cowey and Rolls and extrapolated to the center of fovea without considering data on visual acuity (Rovamo et al., 1978). Because Wertheim does not report the absolute acuity values nor the retinal illuminance conditions of their measurement, these data may be misleading in estimations of M. The values of M we obtained and used for scaling the dimensions of retinal images for the experiments were 7.75, 5.25, 3.44, 2.31, 1.24, and 0.49 mm/~ for eccentricities of 0, 1.5, 4, 7.5, 14, and 30 ~ respectively. These values are valid only for the inferior half-meridian of the visual field (see Rovamo and Virsu, 1979, for additional details).
Results
Peripheral Contrast Sens#ivity in Three Different Visual Tasks
F i g u r e 2 p r e s e n t s a c o m p a r i s o n o f c e n t r a l a n d p e r i p h e r a l c o n t r a s t s e n s i t i v i t y
m e a s u r e d w i t h g r a t i n g s h a v i n g a r e l a t i v e l y l a r g e c o n s t a n t r e t i n a l size. T h e
t h r e s h o l d c o n t r a s t s r e q u i r e d f o r d i s c r i m i n a t i n g t h e d i r e c t i o n o f m o v e m e n t ( 2 A )
o r o r i e n t a t i o n ( 2 B ) o f t h e g r a t i n g s , o r f o r m e r e l y d e t e c t i n g t h e m ( 2 C ) w e r e

480 V. Virsu and J. Rovamo
300
>" 100 >
30
lO
o 3
A. M o v e m e n t
3 10 t l
30
B Orientation
\ }~ E ---4 i~ 1 3 10 30
Spatial frequency (c/~
C. Detection
. . . . .
3 10 30
Fig. 2. Contrast sensitivity of central and peripheral vision in three different visual tasks as a function of spatial frequency and eccentricity along the nasal half of the horizontal meridian. Eccentricity (E) was measured here from the middle of the vertical grating as shown in the inset of B. The symbols refer to the same values of E in all figures as indicated in A. The circular gratings were viewed with the right eye at a distance of 228 cm and subtended 5 ~ Presentation time was 0.5 s as a rectangular pulse. A Discrimination of the direction of movement. The translation velocity was a constant 0.78~ for all spatial frequencies. B Discrimination between stationary vertical and horizontal gratings. C Detection of stationary gratings. All the results were obtained from the same subject (VV). The smooth curves were drawn for the best visually judged fit
es t imated for the same subject at various spatial frequencies. The gratings drif ted in 2 A but were stat ionary in 2B and C, for s tat ionary gratings had to be used in or ientat ion discrimination in order to avoid the or ientat ion cue potential ly inferred f rom the direction of movement .
The contrast sensitivity functions for different tasks were quite similar. There was somewhat less a t tenuat ion at low spatial frequencies in the detect ion task, for the on-flash of the rectangular ly presented grating with its high tempora l f requency content made detect ion possible (cf. Kelly, 1977). Otherwise detect ion and or ientat ion discrimination yielded similar thresholds at eccentricities smaller than 20 ~ . At larger eccentricities or ienta t ion discrimination was bet ter because the horizontal or ienta t ion alternative had lower thresholds than the vertical one; only vertical gratings were presented in the o ther tasks. The sensitivity measured by means of m o v e m e n t discrimination was always slightly lower than detect ion sensitivity under similar conditions.
Except for the on-flash effect, the gratings had a similar subjective appearance near threshold in all tasks at cor responding eccentricities: some spatial structure was usually visible. In the periphery, however , the apparen t contrast of gratings at or slightly above threshold was s t ronger than in central vision (cf. P6ppel and Harvey, 1973; Georgeson and Sullivan, 1975).
As a function of retinal eccentricity, the contrast sensitivity functions of all tasks followed the course known f rom the earlier studies in which only detect ion has been measured (Hilz and Cavonius, 1974; R o v a m o et al., 1978; Koender ink et al., 1978a). Contras t sensitivity and resolution (grating acuity) assessed f rom the cut-off frequencies decreased as decelerat ing functions o f eccentricity. The

Visual Resolution and Contrast Sensitivity 481
IOOF
.; Z 30
r
3 O
1 \1t\ 1 3 10 3 0
F B
0,1 0,3 1 3 10 30
Spatial frequency (c/~
Fig. 3. Contrast sensitivity as a function of retinal spatial frequency and eccentricity in the inferior visual field. The subject (JR) had to discriminate whether the gratings moved to the left or to the right during their 0.5 s presentations. The drift rate was 4.1 Hz for all gratings. A The retinal image size was constant. Viewing distance was 458 cm and the radius of the grating subtended 1 ~ (see the inset). B The size of retinal images was varied in order to produce similar calculated cortical projection images at different eccentricities. The retinal image size and spatial frequency were scaled by the inverse of the cortical magnification factor (M -1) for each eccentricity by changing the viewing distance. The viewing distance was 59.1 M cm, display radius 7.75 M -1 degrees, and the range of retinal spatial frequencies studied was 0.129 M -8 .26 M c/~ at each eccentricity. The radius of the grating was then 1 ~ at E = 0 ~ and 1.48, 2.25, 3.35, 6.25, and 15.8 ~ at the other eccentricities. Spatial frequency varied as indicated on the abscissa. The da tum points for E = 0, 4, and 14 ~ have been omitted for clarity; they are shown for E = 0 ~ in A and a part of the rest will be presented in Fig. 5
1 0 0
.>- 3 0
1
A F~ T B
i . j
1 3 10 3 0 0.1 0.3 1 3 10 3 0 S p a t i a l f r e q u e n c y (c/~
Fig. 4. Contrast sensitivity functions measured by using a method that required discrimination between horizontal and vertical gratings. A Retinal images were constant at various eccentricities. B Calculated cortical projections were similar at various eccentricities. Subject PL. Other data are as in Fig. 3
peaks of the contrast sensitivity functions shifted towards lower spatial frequencies, and the shapes of the functions changed because the low-frequency attenuation became weaker and finally disappeared in the periphery.
The Effect of M-scaling on Peripheral Contrast Sensitivity Functions
Figures 3 and 4 compare the contrast sensitivity functions measured with gratings having either similar retinal dimensions (A) or similar calculated

482 V. Virsu and J. Rovamo
cortical projections (B) for different eccentricities; the retinal size of the gratings increased towards the periphery in B. Figure 3 displays results from movement discrimination and Fig. 4 from orientation discrimination. The results of the two tasks were similar as before. There was somewhat less low-frequency attenuation in the results of Fig. 3 than in Fig. 2A because the temporal frequencies of the drifting gratings were now higher at low spatial frequencies (cf. Robson, 1966; Kelly, 1977).
When the retinal images of the gratings were similar at different eccentricities, contrast sensitivity displayed the same behavior as in Fig. 2. When the calculated cortical projections were made equal for different eccentricities by scaling the retinal area and spatial frequency by M -1, contrast sensitivity increased markedly at low retinal spatial frequencies and reached almost the peak foveal level at its maximum in the periphery. Also the shapes and spatial bandwidths of the contrast sensitivity functions were similar, indicating corresponding amounts of low-frequency attenuation, but the functions as a whole were shifted on the spatial frequency axis towards lower frequencies at larger eccentricities because resolution was not much affected by the size scaling. There was an optimal eccentricity for perceiving each spatial frequency: high frequencies were best seen foveaIly but low frequencies had lower thresholds in the periphery. It should be noticed that all increases of stimulus size due to scaling took place in a direction away from the fovea because eccentricity was measured from the centralmost edge of the gratings.
The functions obtained with scaled gratings resemble channels for spatial frequency (Campbell and Robson, 1968; Blakemore and Campbell, 1969) and show that at least a part of the channel phenomena studied psychophysically originate from the fact that different parts of the retina and visual projections are maximally sensitive to different spatial frequencies (cf. van Doorn et al., 1972; Cowan, 1977).
The shifts of the contrast sensitivity functions towards lower retinal spatial frequencies at larger eccentricities were systematic, for they would give virtually the same contrast sensitivity function for all eccentricities if spatial frequency were expressed in cortical terms (cycles/mm of cortex) rather than in retinal terms (c/~ Contrast sensitivity functions plotted completely in cortical terms are presented in Rovamo and Virsu (1979). Figure 5 shows data in a form that makes all deviations easily visible: a part of the data of Figs. 3B and 4B has been presented there as a function of eccentricity for a few calculated cortical spatial frequencies. Our earlier results (Rovamo et al., 1978) from a detection task were similar and some of them have been replotted in Fig. 5C for comparison. In all three different visual tasks, contrast sensitivity for each low or medium "cortical" spatial frequency is constant, independently of eccentricity. The cortical rather than retinal area and spatial frequency of the stimuli determined the peripheral visual sensitivity.
The invariance of the peripheral contrast sensitivity functions in terms of the calculated cortical spatial frequency was not complete, however. A strong but expected variance occurred at calculated frequencies higher than 1 c / m m (indicated by filled-in symbols in Fig. 5). In the periphery, high cortical spatial frequencies result from low retinal spatial frequencies that are little attenuated

Visual Resolution and Contrast Sensitivity 483
100
> 3 0
3
l
A. M o v e m e n t
1 3 10 30
B. O r i e n t a t i o n C. D e t e c t i o n - o/ram ~ 0 ~ ..... .~ . ~ : z x o.s I- " : : ? ~ = y : - A2- '~ - - _
2.8
0 1 3 10 30 0 1 3 10 30
E c c e n t r i c i t y (~
Fig. 5. Contrast sensitivity in three visual tasks as a function of inferior vertical eccentricity and calculated cortical spatial frequency (c/ram of cortex). The retinal dimensions of the gratings were scaled by the magnification factor. The symbols refer to various cortical spatial frequencies as indicated in B. Cortical spatial frequency in c/mm is the retinal spatial frequency in c/~ divided by M. A Discrimination of the direction of movement. The data are from the experiments of Fig. 3B. B Discrimination of orientation. The data are from the experiments of Fig. 4B. C Detection. The data are from the experiments of Rovamo et al. (1978); subject W
by the transfer function of the eye optics because of its low-pass character (Campbel l and Gubish, 1966). In the fovea and near fovea, high cortical spatial f requencies cor respond to high retinal spatial frequencies, and these are considerably a t tenuated in contrast a l ready in the retinal images. Therefore , the apparent cortical resolut ion and h igh-f requency sensitivity must remain much lower in foveal than per ipheral representat ions in spite of the probable deter iorat ion o f optical t ransfer as a function of eccentricity (see R6hler, 1962) when the eye optics transmits the retinal images.
The results shown above were obta ined at relatively low tempora l frequencies. In one control exper iment we studied the detect ion of gratings drifting at a constant t empora l f requency of 18 Hz. The results obta ined with and without size scaling behaved in all respects similarly to what is seen in Figs. 2 - 5 except that overall sensitivity was lower. Therefore , none of our conclusions depends significantly on the t empora l f requency of st imulation (cf. Koender ink et al., 1978a).
In o ther control experiments we decreased the average retinal i l luminance down to scotopic levels. In this case complete ly different results were obtained: foveal thresholds increased drastically and sensitivity elsewhere was almost constant when the retinal size of the gratings was kept constant (cf. Koender ink et al., 1978b). Increases of our s tandard level of retinal i l luminance had no effects as we already pointed out in Methods. Hence , our results are valid for photopic levels of average retinal i l luminance but not in mesopic or scotopic vision.
Contrast Sensitivity as a Function of Cortical Projection Area
The results of Figs. 3 and 4 show that contrast sensitivity can be improved by an order of magni tude at low and med ium spatial frequencies by enlarging the test

484 V. Virsu and J. Rovamo
300 F A. Movement / ~ / 0 / look �9 , / [ 3 / , / / 0 / ~ / z x | " / ,=' ,~ / /
[] >D ~" ~ ; ~ ," i / ~ - / "=" "
l o l �9 ~ o
1 / / / i / O0 1 ....... I
~300
IZ 100 ~o
g~
B. Orientation / ~ o~�9 ~
D ; , ~ " ~ %-" ~ ~,,h "~ . " , ~ 0 r ' / A ,"
" Y o ' '/ ~ * ' ; " o ,o o <> _o.-
s . . / i / " ~J* ,
300
100
10
C. Detection ~//8 .~/ /o @ ' ~
_ 9 , - - / A ' - -
z~/ �9 ,>-" ," ~ o / / 0 ~ ~ , v
/ . / o / - j , j o o o /39 / .Ta ./~.5 jOb . l c/ram
10 100 1000 1 0 0 0 1 0 0 0 1000 Cortical area (ram 2)
Fig. 6. Contrast sensitivity for four calculated cortical spatial frequencies as a function of the stimulated cortical area in movement discrimination (A), orientation discrimination (B), and detection (C). The abscissa values were obtained by calculating the cortical projection area in mm 2 at various eccentricities for the gratings having a constant retinal size in Figs. 2, 3A, and 4A; the detection data for small areas were complemented by data from the previous study (Rovamo et al., 1978, Fig. 1A). The four cortical spatial frequencies were selected at one-octave intervals so that a number of sensitivity values could be obtained directly or by means of linear interpolation from the neighboring frequency values actually studied in the experiments. The data for each subsequent spatial frequency have been shifted to the right by 1 log unit on the abscissa. The short dashed lines indicate where the shifted values should be if sensitivity S = area A in mm 2 for each cortical spatial frequency. The symbols denote the following cortical spatial frequencies: squares, 0.388; circles, 0.776; triangles, 1.55; and diamonds, 3.10 c/ram. Open symbols refer to the data of Fig. 2, in which the retinal images size was 19.6 deg z. Filled symbols denote the data obtained in the experiments of Figs. 3A, 4A, and 1A, in which the retinal image size of the grating was 1.57 deg 2. The long straight lines are power functions fitted to the data separately for each spatial frequency, but the data were pooled over the three visual tasks, three different subjects, and various temporal frequencies. The equations of the functions are indicated in C
gratings. The critical size variable is the cortical projection area, for equalizing the cortical size makes the contrast sensitivity functions similar for different eccentricities whereas equal retinal areas yield widely different functions. Simple and general relations between contrast sensitivity and grating area

Visual Resolution and Contrast Sensitivity 485
emerge if sensitivity is considered as a function of the cortical area stimulated by the gratings at different eccentricities.
Figure 6 presents contrast sensitivity as a function of the cortical area stimulated by gratings having a constant retinal area at various eccentricities. A grating having a constant retinal area stimulates a large cortical area in central vision and a small cortical area in peripheral vision; the area stimulated can be calculated by means of M for any grating. The values of M used in calculating the cortical areas for Fig. 6 were taken from the subsequent study (Rovamo and Virsu, 1979) because these values have been expressed in an analytical form for all principal meridians and because they have a direct neural interpretation also in retinal terms. The calculation was piece-wise for large cortical areas, but small areas were calculated directly from the average M over the area concerned. The retinal spatial frequencies corresponding to four cortical spatial frequencies were also calculated from the average M. The sensitivity values for these retinal spatial frequencies were obtained by means of direct interpolation from the measured logarithmic values of Figs. 2-4. The sensitivity data are shown in Fig. 6 separately for the three visual tasks. The results are combined from several experiments, and plotting of Fig. 6 disregards the variation possibly caused by retinal location (0-30 ~ in the nasal and inferior fields), retinal spatial frequency (0.5-20 c/~ temporal frequency (0.39-12.5 Hz in 6A; stationary gratings in 6B and C), retinal image shape and size (2 of each), and by interindividual differences (3 Ss).
The cortical projection area turned out to be so dominant as a determinant of sensitivity that in spite of mixing the various variables systematic relations are clearly visible in the data of Fig. 6. The data are satisfactorily explained by power functions S = cA m, where S is contrast sensitivity, A is the cortical projection area, and c and m are constants. The long continuous lines depict these relations for different cortical spatial frequencies. The lines were computed by means of least-squares methods from the data pooled over the different tasks since the task variable in itself had no obvious effect on the results.
It is remarkable that retinal location affects very little if at all the parameters of the power functions. The results are similar over the nearly 1 log unit range of areas where the data for different experiments and subjects overlap (filled and open symbols at corresponding abscissa values). In the overlap areas the data were obtained at different eccentricities and meridians but for similar cortical areas. The right-most points in each set of open or filled-in symbols represent foveal measurements, and the values to the left follow the eccentricities studied in the corresponding experiments.
The Relationship Between Grating Area and Spatial Frequency
The results above indicate that contrast sensitivity increases as a power function of the cortical area stimulated by a grating. The simplest interpretation of the result is that contrast sensitivity depends on the number of visual cells stimulated by a grating (see Discussion). If this interpretation is correct, it

486 V. Virsu and J. Rovamo
�9 ~, 100
C
O
c/o
cf"~" o O - o 1 ~ - ~ - ~r_~ 2
i ~ j ~ [] - 4 ~.%~..27 ~ >-+-+-+ =
~ # 7 0 q
S,./_~ "= 2 " ~-'16 /:DD - /v x~ A / ~ i v
~ f
/ ~ ~OJO
v I |174176 i
I " ~ I I I I t . 2 5 4 6 4 1 0 2 4
Grating size (c 2)
Fig. 7. Contrast sensitivity as a function of grating size measured in square cycles (c 2) at different spatial frequencies (c/~ Sensitivity was measured by using the detection method with stationary vertical gratings presented for 0.5 s. The gratings were squares except for a few measurements below 1 c2: in these cases one full cycle was shown but the height of the grating was smaller than width. The size of the grating was controlled by means of an electronically generated rectangular window so that contrast was zero outside the window. Thus, the surrounds of the gratings had the same luminance (10 cd/m 2) as the gratings. Viewing was binocular in this experiment with fixation into the center of the gratings. Since the bandwidth of the display was limited, viewing distance was varied in addition to grating area in order to achieve a large variation in grating size at all frequencies. The sloping lines are least-squares power functions; subject JR
becomes puzzling, however , why the p o w e r rn of the s u m m a t i o n funct ions in Fig. 6 d e p e n d s on spat ia l f requency . Pe rhaps the var ia t ion of rn is caused by sa tu ra t ion and opt ica l a t t enua t i on at high spa t ia l f requencies . Sa tu ra t ion seems to occur at h igher f requencies in Fig. 6, but this was not t a k e n into account in f i t t ing the p o w e r funct ions. O n the o t h e r hand, eccent r ic i ty d e c r e a s e d and re t ina l spa t ia l f r equency inc reased with area, and the re fo re , a s t ronger op t ica l a t t enua t i on occu r r ed with l a rge r a reas pa r t i cu la r ly at h igher cor t ica l f requencies .
W e s tud ied the values of the p a r a m e t e r s in severa l expe r imen t s and found tha t the va lue of m b e c o m e s i n d e p e n d e n t of spat ia l f r equency when sa tu ra t ion is t a k e n in to account and the re t ina l loca t ion of s t imula t ion is kep t constant . In this case the opt ica l a t t e n u a t i o n of con t ras t r e ma ins cons tan t at each spa t ia l f requency.
F igure 7 shows the resul ts of one e x p e r i m e n t done with foveal ly p r e s e n t e d gra t ings having d i f ferent a reas and spa t ia l f requencies . A new unit of gra t ings size, square cycle, is i n t roduced in the figure. Square cycle (c 2) refers to a unit a r ea of gra t ing in which each side is equa l to the length of one spa t ia l per iod . A s s u m i n g tha t one d e t e r m i n a n t of con t ras t sensi t ivi ty is the n u m b e r of visual cells s t imula ted by a grat ing, the square cycle is the most in fo rmat ive unit of size m e a s u r e m e n t because a cons tan t n u m b e r of neu rons is p r o b a b l y s t imula ted by each square cycle when spat ia l f r equency is cons tan t in cor t ica l terms. W h e n the n u m b e r of square cycles in a gra t ing is cons tan t , the gra t ing is large in a rea at low spat ia l f requenc ies and smal l in a r ea at high spa t ia l f requencies , but in bo th cases

Visual Resolution and Contrast Sensitivity 487
the gratings contain the same amount of detail and contour from the point of view of stimulating a two dimensional set of receptive fields having various sizes.
The number of square cycles in a grating having area A and spatial frequency F or period length F -* is A /F -2 = AF 2. This quantity does not depend on the unit of length measurement, and therefore, its value is the same both in retinal and cortical terms. The value of AF 2 does not depend on viewing distance, either.
When grating size increased, contrast sensitivity S improved up to a saturation limit following function S = K (AF2) n, where the value of n was constant for spatial frequencies from 1 to 32 c/~ within the experimental error. In the results of Fig. 7 the values of n varied from 0.313 to 0.433 in the least-squares power functions. The values of K varied from 1.21 at 32 c/~ to 69.9 at 1 c/~ The saturation occurred suddenly at about 144 c 2 at all spatial frequencies in Fig. 7. Because the gratings had a square shape, the number of spatial cycles at saturation was 12 (the square root of 144). Experiments with different grating shapes showed, however, that the number of cycles was not a decisive factor in summation (cf. Howell and Hess, 1978) but the grating size in terms of AF 2 or square cycles.
In comparison with the results of Fig. 6 the values of power n are clearly smaller in Fig. 7. Control experiments indicated that the main reason for this difference is that the surrounds of the gratings were dark in the experiments of Fig. 6 but had the same luminance as the gratings in the experiments of Fig. 7: decreasing surround luminance increases the value of n.
Resolution and Critical Size as Related to M
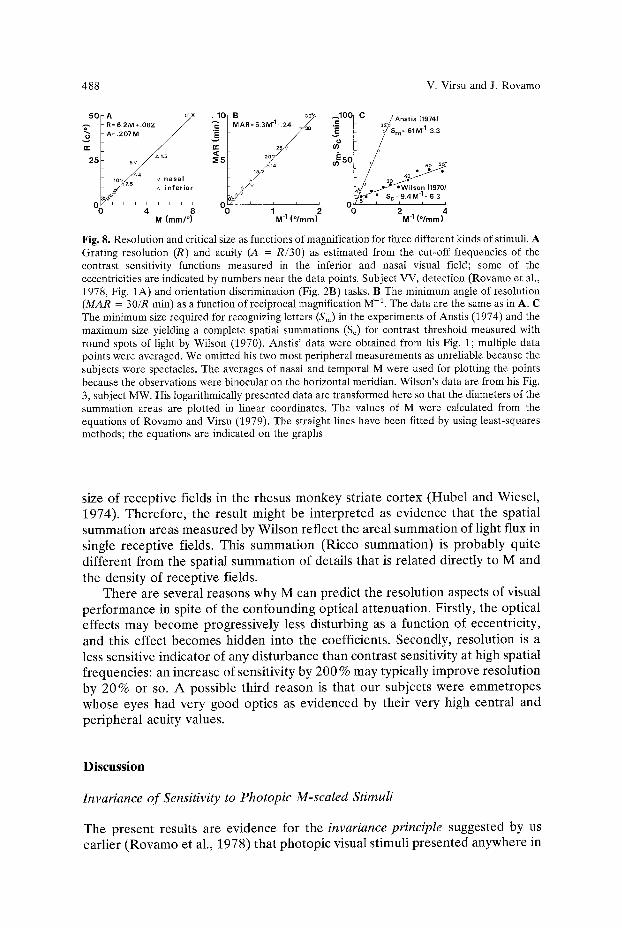
Even though the optical attenuation seems to have different effects in foveal and peripheral vision on cortical high-frequency sensitivity, the optical effects are so regular that also the high-frequency end of the contrast sensitivity functions can be estimated by means of M. The retinal cut-off frequency (grating resolution) is directly proportional to M as is shown in Fig. 8A (see also Rovamo and Virsu, 1979).
The direct proportionality between resolution (or acuity) and M makes sense, for it indicates that if magnification is zero, resolution is also zero: the additive constant of the empirical regression line is negligible and well within the error of measurement. Figure 8B shows that the converse is also true: if M could go to infinity (M -1 = 0), resolution would become infinite. This is indicated by the fact that the minimum angle of resolution (MAR) is directly proportional to M-l : MAR approaches zero when M -1 is zero.
More complex stimuli yield similar relationships. This is illustrated in Fig. 8C that presents as a function of M -1 the minimal size required for recognizing letters in eccentric vision (Sin) as reported by Anstis (1974) and the maximal diameter of the area (So) that still yields a complete spatial summation for contrast threshold as measured with spot stimuli by Wilson (1970). In Wilson's data, a positive constant is obtained and it may deviate significantly from zero. This linear function parallels a similar linear relationship between M -a and the
488 V. Virsu and J. Rovamo
50
e~
25
A o~~ , 10 i B ~ 3o~ ~100
e~ 25 v
~5o
~7 / . . . . ~ i n f e r i o r ~ / ~ ;
< , , ~ , , , ; o o~ , ~ , ~ o M (mm/~ M -1 (~
C / Anstis (1974) /~~ = 61M-1-3.3 32
/~ o 50 SS*
oP .j.~" .~'itso. c197o) / * y * S c = 9.4M -1* 5.3 5 i i i i
2 4 M -1 (o/turn)
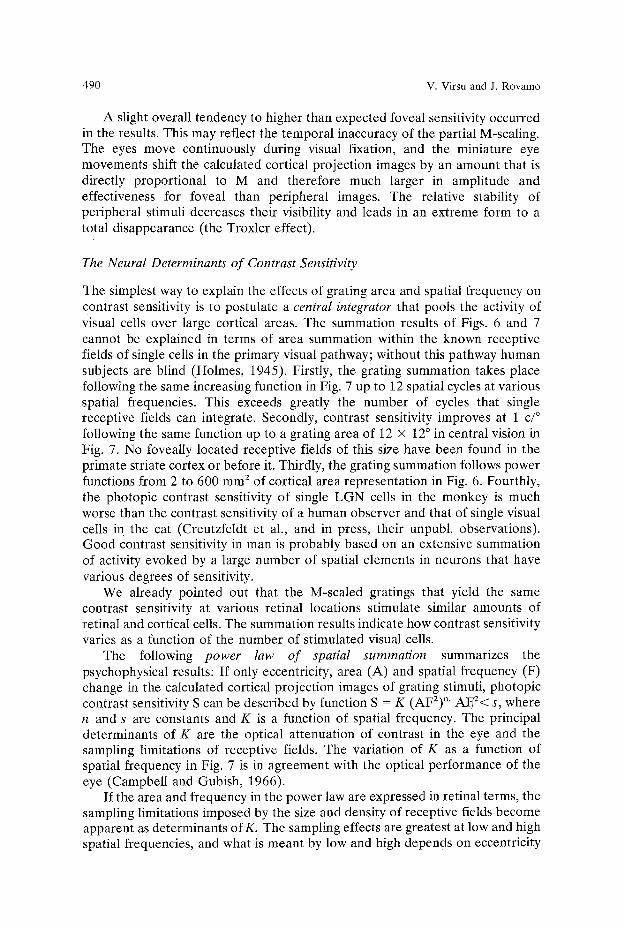
Fig. 8. Resolution and critical size as functions of magnification for three different kinds of stimuli. A Grating resolution (R) and acuity (A = R/30) as estimated from the cut-off frequencies of the contrast sensitivity functions measured in the inferior and nasal visual field; some of the eccentricities are indicated by numbers near the data points. Subject VV, detection (Rovamo et al., 1978, Fig. 1A) and orientation discrimination (Fig. 2B) tasks. B The minimum angle of resolution (MAR = 30/R min) as a function of reciprocal magnification M -1. The data are the same as in A. C The minimum size required for recognizing letters (Sin) in the experiments of Anstis (1974) and the maximum size yielding a complete spatial summations (So) for contrast threshold measured with round spots of light by Wilson (1970). Anstis' data were obtained from his Fig. 1; multiple data points were averaged. We omitted his two most peripheral measurements as unreliable because the subjects wore spectacles. The averages of nasal and temporal M were used for plotting the points because the observations were binocular on the horizontal meridian. Wilson's data are from his Fig. 3, subject MW. His logarithmically presented data are transformed here so that the diameters of the summation areas are plotted in linear coordinates. The values of M were calculated from the equations of Rovamo and Virsu (1979). The straight lines have been fitted by using least-squares methods; the equations are indicated on the graphs
size of r ecep t ive f ields in the rhesus m o n k e y s t r ia te cor tex ( H u b e l and Wiese l , 1974). The re fo re , the resul t might be i n t e r p r e t e d as ev idence tha t the spa t ia l s u m m a t i o n a reas m e a s u r e d by Wi l son ref lec t the a rea l s u m m a t i o n of l ight flux in single r ecep t ive fields. This s u m m a t i o n (Ricco s u m m a t i o n ) is p r o b a b l y qui te d i f fe ren t f rom the spat ia l s u m m a t i o n of deta i l s tha t is r e l a t ed d i rec t ly to M and
the dens i ty of r ecep t ive fields. The re are severa l r easons why M can p red ic t the r e so lu t ion aspects of visual
p e r f o r m a n c e in spite of the con found ing op t ica l a t t enua t ion . First ly, the opt ica l effects may b e c o m e progress ive ly less d i s turb ing as a funct ion of eccentr ic i ty , and this effect becomes h idden into the coeff icients . Secondly , r e so lu t ion is a less sensi t ive ind ica tor of any d i s tu rbance than con t ras t sensi t ivi ty at high spa t ia l f requencies : an increase of sensi t iv i ty by 200 % may typica l ly improve re so lu t ion by 2 0 % or so. A poss ib le th i rd r e a s o n is tha t our sub jec t s were e m m e t r o p e s whose eyes had very good optics as e v i d e n c e d by the i r very high cen t ra l and p e r i p h e r a l acui ty values.
Discussion
Invariance o f Sensitivity to Photopic M-scaled Stimuli
The p re sen t resul ts a re ev idence for the invariance principle sugges ted by us ea r l i e r ( R o v a m o et al., 1978) tha t p h o t o p i c visual s t imuli p r e s e n t e d anywhere in

Visual Resolution and Contrast Sensitivity 489
the visual field are equally visible if the stimuli are equivalent in terms of the calculated cortical projection images, i.e., if they are M-scaled. Perhaps the results are not surprising, for what M-scaling actually does is to equalize the mass of visual cells stimulated so that it becomes independent of retinal location of stimulation. By "stimulation" we mean the presentation of stimuli in the receptive fields of cells.
The values of M we used in scaling are directly proportional to the square root of receptive-field density of retinal ganglion cells (Rovamo and Virsu, 1979). Therefore, our M-scaling adjusts the stimulated retinal area exactly in proportion to cell density so that the number of stimulated retinal ganglion cells and the cortical volume are kept constant. Since the visual cortex is uniform in its cytoarchitecture (Hubel and Wiesel, 1977), M-scaling makes constant also the num~oer of stimulated cortical cells. From the equalized numbers of stimulated ganglion cells and cortical cells it is safe to extrapolate to other levels in the primary visual pathway.
Additional evidence for the invariance principle is presented in the subsequent paper (Rovamo and Virsu, 1979). It is supported also by the independent findings of Koenderink et al. (1978a). They report that if the just resolvable distance at any eccentricity is used as a unit of size measurement, similar detection threshold functions are obtained for moving gratings. As they point out, their results agree with ours because the just resolvable distance correlates with M -~ (Daniel and Whitteridge, 1961; Cowey and Rolls, 1974; Drasdo, 1977). Our results in Fig. 8 confirm empirically the assumption of Cowey and Rolls (1974) that direct proportionalities exist between MAR and M -a, and between acuity and M. By assuming a cortical homogeneity for visual acuity Cowey and Rolls anticipated also the invariance principle that we have found valid for sensitivity at least at low cortical spatial frequencies.
The invariance principle assumes a complete M-scaling that equates perfectly the spatial and temporal properties of the calculated cortical projection images. Optical effects and uncontrolled movements of the retinal images, and the interindividual differences in fixation, ophthalmic properties and magnification make it difficult to perform a complete M-scaling to stimuli. Our M-scaling here was performed simply by changing the viewing distance, and the results get error variance from the sources listed above.
The partial M-scaling was very effective, however, for in comparison to the differences appearing in sensitivity to retinally similar gratings at various eccentricities the functions obtained with the partially M-scaled gratings are virtually identical at low and medium spatial frequencies under all experimental conditions. The deviations that occur at high retinal spatial frequencies are in agreement with what is known about the foveal contrast transfer functions of the eye, but because the peripheral transfer functions of the eye optics are not known yet (cf. R6hler, 1962; Green, 1970; Enoch and Hope, 1973; and Fris6n and Glansholm, 1975), a detailed quantitative assessment of the invariance at high spatial frequencies has to wait for their determination. Since natural accommodation was used and its accuracy improves with pupil size, the relatively large pupil size of our experiments does not affect the optical transfer critically (see van Meeteren, 1974).
490 v. Virsu and J. Rovamo
A slight overall tendency to higher than expected foveal sensitivity occurred in the results. This may reflect the temporal inaccuracy of the partial M-scaling. The eyes move continuously during visual fixation, and the miniature eye movements shift the calculated cortical projection images by an amount that is directly proportional to M and therefore much larger in amplitude and effectiveness for foveal than peripheral images. The relative stability of peripheral stimuli decreases their visibility and leads in an extreme form to a total disappearance (the Troxler effect).
The Neural Determinants of Contrast Sensitivity
The simplest way to explain the effects of grating area and spatial frequency on contrast sensitivity is to postulate a central integrator that pools the activity of visual cells over large cortical areas. The summation results of Figs. 6 and 7 cannot be explained in terms of area summation within the known receptive fields of single cells in the primary visual pathway; without this pathway human subjects are blind (Holmes, 1945). Firstly, the grating summation takes place following the same increasing function in Fig. 7 up to 12 spatial cycles at various spatial frequencies. This exceeds greatly the number of cycles that single receptive fields can integrate. Secondly, contrast sensitivity improves at 1 c/~ following the same function up to a grating area of 12 • 12 ~ in central vision in Fig. 7. No foveally located receptive fields of this size have been found in the primate striate cortex or before it. Thirdly, the grating summation follows power functions from 2 to 600 mm 2 of cortical area representation in Fig. 6. Fourthly, the photopic contrast sensitivity of single LGN cells in the monkey is much worse than the contrast sensitivity of a human observer and that of single visual cells in the cat (Creutzfeldt et al., and in press, their unpubl, observations). Good contrast sensitivity in man is probably based on an extensive summation of activity evoked by a large number of spatial elements in neurons that have various degrees of sensitivity.
We already pointed out that the M-scaled gratings that yield the same contrast sensitivity at various retinal locations stimulate similar amounts of retinal and cortical cells. The summation results indicate how contrast sensitivity varies as a function of the number of stimulated visual cells.
The following power law of spatial summation summarizes the psychophysical results: If only eccentricity, area (A) and spatial frequency (F) change in the calculated cortical projection images of grating stimuli, photopic contrast sensitivity S can be described by function S = K (AF2) n" AE2< S, where n and s are constants and K is a function of spatial frequency. The principal determinants of K are the optical attenuation of contrast in the eye and the sampling limitations of receptive fields. The variation of K as a function of spatial frequency in Fig. 7 is in agreement with the optical performance of the eye (Campbell and Gubish, 1966).
If the area and frequency in the power law are expressed in retinal terms, the sampling limitations imposed by the size and density of receptive fields become apparent as determinants of K. The sampling effects are greatest at low and high spatial frequencies, and what is meant by low and high depends on eccentricity
Visual Resolution and Contrast Sensitivity 491
as indicated by M. The frequencies sampled most effectively change as a function of eccentricity as Figs. 3 and 4 show, but the spatial bandwidths remain constant. Because the sampling limitations are related to M (see Rovamo and Virsu, 1979), M-scaling can compensate for the changes of sampling at various loci and equalize the values of K (except for the optical residual), and this makes the values of S independent of eccentricity as the power law implies. Without M-scaling, sampling limitations decrease sensitivity in the periphery (see Fig. 2).
Although different cells have different transfer properties and respond to the same grating with different amounts of activity, we find it reasonable to assume that in some average sense the number of visual cells activated or potentially activated by a grating increases in a direct proportion to the cortical area stimulated when the cortical spatial frequency of the grating is constant. The power law of spatial summation indicates then that contrast sensitivity improves as a power function of the number of visual cells potentially activated. Visibility of a grating requires probably that some criterion level of activity is reached in the postulated central integrator. The same degree of visibility can be obtained by summing either strong activity of a few cells, evoked by a strong contrast and small grating, or weak activity of many cells, evoked by a low contrast and large grating. In the former case contrast sensitivity is low and in the latter case high.
The central summation takes place over the potentially activated neurons rather than over the stimulated area as the dependence of sensitivity on AF 2 indicates. The summation saturates at a constant number of square cycles (AF 2 = constant) for any spatial frequency independently of grating area, and the power n does not depend on spatial frequency. This fits well the idea of central summation, for it would be quite difficult to understand why the summation of neural activity would be different at different spatial frequencies. The transfer function of the central integrator is k (AF2) n, where k and n are constants.
Earlier results on the effects of grating area and number of cycles on contrast sensitivity measured in central vision (e.g., Hoekstra et al., 1974; Savoy and Mc Cann, 1975; Howell and Hess, 1978; McCann, 1978) are consistent with the power law of spatial summation, but because the stimulation was not considered in neural terms, the results failed to reveal the full extent of spatial summation over grating elements and the validity of the power law at all spatial frequencies and at various retinal locations. The results of McCann (1978) are particularly interesting, for he observed that at low spatial frequencies contrast sensitivity is independent of the distance at which a grating is viewed. The reason for this constancy is that AF 2 is independent of viewing distance and of the units of length measurement in general. As long as function K is not affected by viewing distance, sensitivity remains constant. The value of K is constant in central vision at low spatial frequencies whose transfer is not significantly affected by optical attenuation or sampling limitations.
Functional Homogeneity of the Visual Cortex
There is no indication in our results that the photopic peripheral vision would differ functionally from central vision in any respect when the effects of cortical

492 v. Virsu and J. Rovamo
magnification are taken into account. The information transfer capacity of the visual system is also constant for various positions in the visual field in the sense that the spatial frequency bandwidths and maximum sensitivities are independent of eccentricity. These findings contradict many common beliefs, but they are in good agreement with the uniformity of the visual cortex proposed on the basis of physiological and anatomical observations (Creutzfeldt and Kuhnt, 1973; Hubel and Wiesel, 1974, 1977).
Various qualitative differences between cells in central and peripheral projections of the retina have been reported (see Hughes, 1977), but the evidence is weak at least for primates. The use of retinally constant-size stimuli at different eccentricities may be misleading also in electrophysiology. De Monasterio and Gouras (1975), for example, found that color opponent retinal ganglion cells in the monkey have constant-size receptive fields for the central 20 ~ of eccentricity and these cells disappear at greater eccentricities; only transiently responding broad-band cells were found at larger eccentricities. Nevertheless, psychophysical results indicate that color perception is similar at 0 and 45 ~ eccentricities if the stimuli are small in the fovea and large in the periphery (Gordon and Abramov, 1977), and the size difference required for this equivalence is in agreement with M-scaling. De Monasterio and Gouras used very small stimuli and might have missed the peripheral color selective cells.
On the other hand, rod-dominated responses are easily obtained from peripheral cells and cone-dominated responses from retinally more central cells in the same experiment. If these responses are compared, qualitative differences will be found. Our results concern only photopic vision. Since sensitivity depends on the number of potentially activated cells and not on area or frequency as such, M-scaling cannot work below photopic levels of adaptation because the distribution of potentially activated cortical cells changes radically when the change from cone vision to rod vision takes place.
Acknowledgements. We thank the Finnish Academy, The Finnish National Fund for Research and DeveIopment, and Alexander yon Humboldt Foundation for support. P.K. Lehti6 designed the apparatus and P. Laurinen wrote the computer programs used in this study.
References
Albus, K.: A quantiative study of the projection area of the central and the paracentral visual field in area 17 of the cat. I. The precision of the topography. Exp. Brain Res. 24, 159-179 (1975)
Anstis, S.M.: A chart demonstrating variations in acuity with retinal position. Vision Res. 14, 589-592 (1974)
Blakemore, C., Campbell, F.W.: On the existence of neurones in the human visual system selectively sensitive to the orientation and size of retinal images. J. Physiol. (Lond.) 203, 237-260 (1969)
Brindley, G.S., Lewin, W.S.: The sensations produced by electrical stimulation of the visual cortex. J. Physiol. (Lond.) 196, 479-493 (1968)
Campbell, F.W., Gubish, R.W.: Optical quality of the human eye. J. Physiol. (Lond.) 186, 558-578 (1966)

Visual Resolution and Contrast Sensitivity 493
Campbell, F.W., Robson, J.G.: Application of Fourier analysis to the visibility of gratings. J. Physiol. (Lond.) 197, 551-566 (1968)
Cowan, J.D.: Some remarks on channel bandwidths for visual contrast detection. Neurosci. Res. Progr. Bull, 15, 492-517 (1977)
Cowey, A., Rolls, E.T.: Human cortical magnification factor and its relation to visual acuity. Exp. Brain Res. 21, 447-454 (1974)
Creutzfeldt, O.D., Elepfandt, A., Lee, B.B., Virsu, V.: Light adaptation of LGN cells in the cat and monkey. J. Physiol. (Lond.) (in press) (1979)
Creutzfeldt, O., Innocenti, G.M., Brooks, D.: Vertical organization in the visual cortex (area 17) in the cat. Exp. Brain Res. 21, 315-336 (1974)
Creutzfeldt, O.D., Kuhnt, U.: Electrophysiology and topographical distribution of visual evoked potentials in animals. In: Handbook of sensory physiology, Jung, R. (ed.). Vol. VII/3B, pp. 595-646. Berlin, Heidelberg, New York: Springer 1973
Daniel, P.M., Whitteridge, D.: The representation of the visual field on the cerebral cortex in monkeys. J. Physiol. (Lond.) 159, 203-221 (1961)
De Monasterio, F.M., Gouras, P.: Functional properties of ganglion cells of the rhesus monkey retina. J. Physiol. (Lond.) 251, 167-195 (1975)
Doom, A.J. van, Koenderink, J.J., Bouman, M.A.: The influence of the retinal inhomogeneity on the perception of spatial patterns. Kybernetik 10, 223-230 (1972)
Drasdo, N.: The neural representation of visual space. Nature (Lond.) 266, 554-556 (1977) Enoch, J.M., Hope, G.M.: Interferometric resolution determinations in the fovea and parafovea.
Doc. Ophthal. 34, 143-156 (1973) Fris6n, L., Glansholm, A.: Optical and neural resolution in peripheral vision. Invest. Ophthal. 14,
528-536 (1975) Georgeson, M.A., Sullivan, G.D.: Contrast constancy: Deblurring in human vision by spatial
frequency channels. J. Physiol. (Lond.) 252, 627-656 (1975) Gordon, J., Abramov, I.: Color vision in the peripheral retina. II. Hue and saturation. J. Opt. Soc.
Am. 67, 202-207 (1977) Green, D.G.: Regional variations in the visual acuity for interference fringes on the retina. J.
Physiol. (Lond.) 207, 351-356 (1970) Hilz, R., Cavonius, C.R.: Functional organization of the peripheral retina: Sensitivity to periodic
stimuli. Vision Res. 14, 1333-1337 (1974) Hoekstra, J., Goot, D. P. J. van der, Brink, G. van den, Bilsen, F. A.: The influence of the number of
cycles upon the visual contrast threshold for spatial sine wave patterns. Vision Res. 14, 365-368 (1974)
Holmes, G.: The organization of the visual cortex in man. Proc. Roy. Soc. B 132, 348-361 (1945) Howell, E.R., Hess, R.F.: The functional area for summation to threshold for sinusoidal gratings.
Vision Res. 18, 369-374 (1978) Hubel, D.H., Wiesel, T.N.: Uniformity of monkey striate cortex: A parallel relationship between
field size, scatter, and magnification factor. J. Comp. Neurol. 158, 295-306 (1974) Hubel, D.H., Wiesel, T.N.: Functional architecture of macaque monkey visual cortex. Proc. Roy.
Soc. Lond. B 198, 1-59 (1977) Hughes, A.: The topography of vision in mammals of contrasting life style: Comparative optics and
retinal organisation. In: Handbook of sensory physiology, Crescitelli, F. (ed.). VoI. VII/5, pp. 613-756. Berlin, Heidelberg, New York: Springer 1977
Jay, B.S.: The effective pupillary area at varying perimetric angles. Vision Res. 1, 418-424 (1962) Kelly, D.H.: Visual contrast sensitivity. Optica Acta 24, 107-129 (1977) Koenderink, J.J., Bouman, M. A., Bueno de Mesquita, A. E., Slappendel, S.: Perimetry of contrast
detection thresholds of moving spatial sine wave patterns. IfI. The target extent as a sensitivity controlling parameter. J. Opt. Soc. Am. 68, 854-860 (1978a)
Koenderink, J.J., Bouman, M. A., Bueno de Mesquita, A.E., Slappendel, S.: Perimetry of contrast detection thresholds of moving spatial sine wave patterns. IV. The influence of the mean retinal illuminance. J. Opt. Soc. Am 68, 860-865 (1978b)
McCann, J.J.: Visibility of gradients and low spatial frequency sinusoids: Evidence for a distance constancy mechanism. Photogr. Sci. Eng. 22, 64-68 (1978)
Meeteren, A. van: Calculations on the optical modulation transfer function of the human eye for white light. Optica Acta 21, 395-412 (1974)

494 V. Virsu and J. Rovamo
P6ppel, E., Harvey, Jr. L. O.: Light-difference threshold and subjective brightness in the periphery of the visual field. Psychol. Forsch. 36, 145-161 (1973)
Rempt, F., Hoogerheide, J., Hoogenboom, W. P. H.: Influence of correction of peripheral refractive errors on peripheral static vision. Ophthalmologica (Basel) 173, 128-135 (1976)
Robson, J.G.: Spatial and temporal contrast-sensitivity functions of the visual system. J. Opt. Soc. Am 56, 1141-1142 (1966)
R6hler, R.: Die Abbildungseigenschaften der Augenmedien. Vision Res. 2, 391429 (1962) Rovamo, J., Virsu, V.: An estimation and application of the human cortical magnification factor.
Exp. Brain Res. 37, 1-20 (1979) Rovamo, J., Virsu, V., N~is~inen, R.: Cortical magnification factor predicts the photopic contrast
sensitivity of peripheral vision. Nature (Lond.) 271, 54-56 (1978) Savoy, R.L., McCann, J.J.: Visibility of low-spatial-frequency sine-wave targets: Dependence on
number of cycles. J. Opt. Soc. Am. 65, 343-350 (1975) Sharpe, C.R.: The contrast sensitivity of the peripheral visual field to drifting sinusoidal gratings.
Vision Res. 14, 905-906 (1974) Virsu, V., Laurinen, P.: Long-lasting afterimages caused by neural adaptation. Vision Res. 17,
853-860 (1977) Wertheim, T.: f2ber die indirekte Sehsch~irfe. Z. Psychol. Physiol. Sinnesorg. 7, 172-187 (1894) Wetherill, G.B., Levitt, H.: Sequential estimation of points on a psychometric function. Br. J. Math.
Stat. Psychol. 18, 1-10 (1965) Wilson, M.E.: Invariant features of spatial summation with changing locus in the visual field. J.
Physiol. (Lond.) 207, 611-622 (1970)
Received December 27, 1978