Vertical structure, biomass and topographic association of deep-pelagic fishes in relation to a...
24
Deep-Sea Research II 55 (2008) 161–184 Vertical structure, biomass and topographic association of deep-pelagic fishes in relation to a mid-ocean ridge system $ T.T. Sutton a, , F.M. Porteiro b , M. Heino c,d,e , I. Byrkjedal f , G. Langhelle f , C.I.H. Anderson g , J. Horne g , H. Søiland c , T. Falkenhaug h , O.R. Godø c , O.A. Bergstad h a Harbor Branch Oceanographic Institution, 5600 US 1 North, Fort Pierce, FL 34946, USA b DOP, University of the Azores, Horta, Faial, Azores, Portugal c Institute of Marine Research, P.O. Box 1870, Nordnes 5817, Bergen, Norway d Department of Biology, University of Bergen, P.O. Box 7800, N5020 Bergen, Norway e International Institute for Applied Systems Analysis, A2361 Laxenburg, Austria f Bergen Museum, University of Bergen, Muse´plass 3, N-5007 Bergen, Norway g School of Aquatic and Fishery Sciences, University of Washington, P.O. Box 355020, Seattle, WA 98195, USA h Institute of Marine Research, Flodevigen Marine Research Station, 4817 His, Norway Accepted 15 September 2007 Available online 11 December 2007 Abstract The assemblage structure and vertical distribution of deep-pelagic fishes relative to a mid-ocean ridge system are described from an acoustic and discrete-depth trawling survey conducted as part of the international Census of Marine Life field project MAR-ECO /http://www.mar-eco.noS. The 36-station, zig-zag survey along the northern Mid-Atlantic Ridge (MAR; Iceland to the Azores) covered the full depth range (0 to 43000 m), from the surface to near the bottom, using a combination of gear types to gain a more comprehensive understanding of the pelagic fauna. Abundance per volume of deep-pelagic fishes was highest in the epipelagic zone and within the benthic boundary layer (BBL; 0–200 m above the seafloor). Minimum fish abundance occurred at depths below 2300 m but above the BBL. Biomass per volume of deep-pelagic fishes over the MAR reached a maximum within the BBL, revealing a previously unknown topographic association of a bathypelagic fish assemblage with a mid-ocean ridge system. With the exception of the BBL, biomass per volume reached a water column maximum in the bathypelagic zone between 1500 and 2300 m. This stands in stark contrast to the general ‘‘open-ocean’’ paradigm that biomass decreases exponentially from the surface downwards. As much of the summit of the MAR extends into this depth layer, a likely explanation for this mid-water maximum is ridge association. Multivariate statistical analyses suggest that the dominant component of deep-pelagic fish biomass over the northern MAR was a wide-ranging bathypelagic assemblage that was remarkably consistent along the length of the ridge from Iceland to the Azores. Integrating these results with those of previous studies in oceanic ecosystems, there appears to be adequate evidence to conclude that special hydrodynamic and biotic features of mid-ocean ridge systems cause changes in the ecological structure of deep-pelagic fish assemblages relative to those at the same depths over abyssal plains. Lacking terrigenous input of allochthonous organic carbon, increased demersal fish diversity and biomass over the MAR relative to the abyssal plains may be maintained by increased bathypelagic food resources. The aggregation of bathypelagic fishes with MAR topographic features was primarily a large adult phenomenon. Considering the immense areal extent of mid-ocean ridge systems globally, this strategy may have significant trophic transfer and reproductive benefits for deep-pelagic fish populations. r 2007 Elsevier Ltd. All rights reserved. Keywords: Vertical distribution; Mesopelagic zone; Bathypelagic zone; Mid-ocean ridges; Topography; Benthic boundary layer 1. Introduction The ‘‘deep-pelagic’’ realm of the open ocean, from 200 m depth to just above the bottom, is by far Earth’s largest habitat, containing 95% of the ocean’s volume ARTICLE IN PRESS www.elsevier.com/locate/dsr2 0967-0645/$ - see front matter r 2007 Elsevier Ltd. All rights reserved. doi:10.1016/j.dsr2.2007.09.013 $ This paper is Contribution no. 1661 from the Harbor Branch Oceanographic Institution. Corresponding author. Tel.: +1 772 465 2400; fax: +1 772 468 0757. E-mail address: [email protected] (T.T. Sutton).
Transcript of Vertical structure, biomass and topographic association of deep-pelagic fishes in relation to a...
ARTICLE IN PRESS
0967-0645/$ - se
doi:10.1016/j.ds
$This paper
Oceanographic�CorrespondE-mail addr
Deep-Sea Research II 55 (2008) 161–184
www.elsevier.com/locate/dsr2
Vertical structure, biomass and topographic association of deep-pelagicfishes in relation to a mid-ocean ridge system$
T.T. Suttona,�, F.M. Porteirob, M. Heinoc,d,e, I. Byrkjedalf, G. Langhellef, C.I.H. Andersong,J. Horneg, H. Søilandc, T. Falkenhaugh, O.R. Godøc, O.A. Bergstadh
aHarbor Branch Oceanographic Institution, 5600 US 1 North, Fort Pierce, FL 34946, USAbDOP, University of the Azores, Horta, Faial, Azores, Portugal
cInstitute of Marine Research, P.O. Box 1870, Nordnes 5817, Bergen, NorwaydDepartment of Biology, University of Bergen, P.O. Box 7800, N5020 Bergen, Norway
eInternational Institute for Applied Systems Analysis, A2361 Laxenburg, AustriafBergen Museum, University of Bergen, Museplass 3, N-5007 Bergen, Norway
gSchool of Aquatic and Fishery Sciences, University of Washington, P.O. Box 355020, Seattle, WA 98195, USAhInstitute of Marine Research, Flodevigen Marine Research Station, 4817 His, Norway
Accepted 15 September 2007
Available online 11 December 2007
Abstract
The assemblage structure and vertical distribution of deep-pelagic fishes relative to a mid-ocean ridge system are described from an
acoustic and discrete-depth trawling survey conducted as part of the international Census of Marine Life field project MAR-ECO
/http://www.mar-eco.noS. The 36-station, zig-zag survey along the northern Mid-Atlantic Ridge (MAR; Iceland to the Azores) covered
the full depth range (0 to 43000m), from the surface to near the bottom, using a combination of gear types to gain a more
comprehensive understanding of the pelagic fauna. Abundance per volume of deep-pelagic fishes was highest in the epipelagic zone and
within the benthic boundary layer (BBL; 0–200m above the seafloor). Minimum fish abundance occurred at depths below 2300m but
above the BBL. Biomass per volume of deep-pelagic fishes over the MAR reached a maximum within the BBL, revealing a previously
unknown topographic association of a bathypelagic fish assemblage with a mid-ocean ridge system. With the exception of the BBL,
biomass per volume reached a water column maximum in the bathypelagic zone between 1500 and 2300m. This stands in stark contrast
to the general ‘‘open-ocean’’ paradigm that biomass decreases exponentially from the surface downwards. As much of the summit of the
MAR extends into this depth layer, a likely explanation for this mid-water maximum is ridge association. Multivariate statistical analyses
suggest that the dominant component of deep-pelagic fish biomass over the northern MAR was a wide-ranging bathypelagic assemblage
that was remarkably consistent along the length of the ridge from Iceland to the Azores. Integrating these results with those of previous
studies in oceanic ecosystems, there appears to be adequate evidence to conclude that special hydrodynamic and biotic features of
mid-ocean ridge systems cause changes in the ecological structure of deep-pelagic fish assemblages relative to those at the same depths
over abyssal plains. Lacking terrigenous input of allochthonous organic carbon, increased demersal fish diversity and biomass over the
MAR relative to the abyssal plains may be maintained by increased bathypelagic food resources. The aggregation of bathypelagic fishes
with MAR topographic features was primarily a large adult phenomenon. Considering the immense areal extent of mid-ocean ridge
systems globally, this strategy may have significant trophic transfer and reproductive benefits for deep-pelagic fish populations.
r 2007 Elsevier Ltd. All rights reserved.
Keywords: Vertical distribution; Mesopelagic zone; Bathypelagic zone; Mid-ocean ridges; Topography; Benthic boundary layer
e front matter r 2007 Elsevier Ltd. All rights reserved.
r2.2007.09.013
is Contribution no. 1661 from the Harbor Branch
Institution.
ing author. Tel.: +1772 465 2400; fax: +1 772 468 0757.
ess: [email protected] (T.T. Sutton).
1. Introduction
The ‘‘deep-pelagic’’ realm of the open ocean, from�200m depth to just above the bottom, is by far Earth’slargest habitat, containing 95% of the ocean’s volume
ARTICLE IN PRESST.T. Sutton et al. / Deep-Sea Research II 55 (2008) 161–184162
(Horn, 1972) and thus about �94% of the planet’s water.Encompassing the meso- (200–1000m), bathy- (1000–4000m)and abyssopelagic (44000m) zones, the deep pelagial isessentially boundless in three dimensions for most of itsextent, being structured physically only by the fluidproperties of the water itself (e.g., temperature, salinity,pressure, light absorption, current shear). However, nearcontinental landmasses, seamounts and along mid-oceanridges, the deep-pelagic realm intersects abrupt topo-graphic features of the seafloor. Of these features, mid-ocean ridges are by far the largest.
Large elevations of bottom topography, such as theMid-Atlantic Ridge (MAR), influence local and regionalcirculation patterns (Roden, 1987), which in turn are likelyto affect the distribution of deep-pelagic organisms. TheMAR has an important influence on the deep-watercirculation of the North Atlantic, partly separating deepwaters of the eastern and western basins (Rossby, 1999;Bower et al., 2002). Closer to the surface, the ridge systemmight serve as an important source of ocean mixingthrough generating internal tides, tidally rectified flows andtrapped waves (Holloway and Merrifield, 1999).
In terms of surface area, the mid-ocean ridge system isimmense compared to continental shelf and slope habitats,where considerably more research effort on ecologicalstructure has been focused. Lacking the terrigenousnutrient input received by continental slope communities,the deep-water fauna associated with mid-ocean ridgesultimately depends on the generally very limited localsurface production. The annual primary production in thesouthern portion of the North Atlantic is around 45 gCm�2 (Berger, 1989), though elevated surface chlorophyllconcentrations have been observed in the region of thesubpolar front (�501N; Søiland et al., 2008). Despitegenerally limited surface production, there is evidence ofenhanced near-ridge demersal fish biomass above the MAR(Fock et al., 2002a; Bergstad et al., 2008) and that the mid-ocean ridges are ecologically important for higher trophiclevels relative to the surrounding abyssal plains and theopen ocean (e.g., blue ling, Molva dypterygia, spawningaggregations on the northern MAR; Magnusson andMagnusson, 1995). Three major processes by whichorganic matter can be transferred to the near-ridge zoneinclude: (1) sinking of aggregates (including marine snow)and the carcasses of larger animals; (2) lateral advection oforganic matter from off-ridge sources; and (3) the verticalmigration of living animals (i.e., ‘‘trophic ladder’’; Angel,1997). The latter process has been found to be important atseamounts near the MAR. Fock et al. (2002b) studied thediets of four dominant demersal fish species at the GreatMeteor Seamount and found that their interaction withvertically migrating mesopelagic fauna played a significantrole in the maintenance of these fish stocks.
Along the MAR, the complicated topography and itseffect on the circulation system and production atseamounts probably act to affect the distribution of themesopelagic, bathypelagic and benthopelagic fauna. Up-
welling processes may be strong enough to establish aconsiderable upward flux of near-bottom material into thedeep pelagial. As most previous studies have been basedjust off the continental slopes, or in oceanic basins, theunderstanding of the significance and influence of mid-ocean ridges on biodiversity, distribution and communityecology of the pelagic fauna (and vice versa) is stillrudimentary. In this paper we explore the structure andvertical distribution of the deep-pelagic fish assemblagesover the northern MAR, from Iceland to the Azores, withthe goal of better understanding the nature and magnitudeof the interactions between a deep-pelagic nekton assem-blage, a mid-ocean ridge system and its associated fauna.
2. Methods
Materials and biophysical data for this investigationwere obtained during Leg 1 of the 2004 R/V G.O. Sars
MAR-ECO expedition (see Wenneck et al., 2008, for moremethodological detail) as part of MAR-ECO /www.mar-eco.noS, an international Census of Marine Life(CoML) field project focusing on the ecosystems associatedwith the northern MAR, from Iceland to the Azores. Theprincipal objectives of MAR-ECO are to describe andunderstand the patterns of distribution, abundance andtrophic relationships of organisms inhabiting the mid-oceanic North Atlantic, as well as to identify and modelecological processes that cause variability in these patterns.Leg 1 of the expedition, conducted during summer
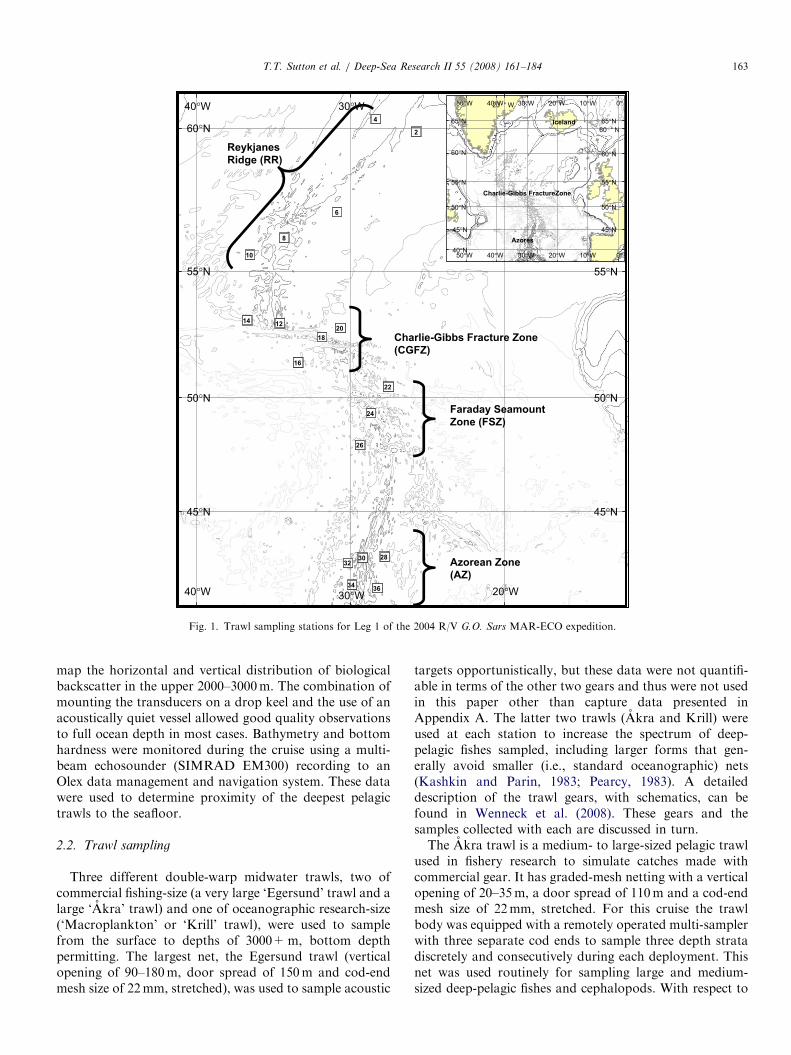
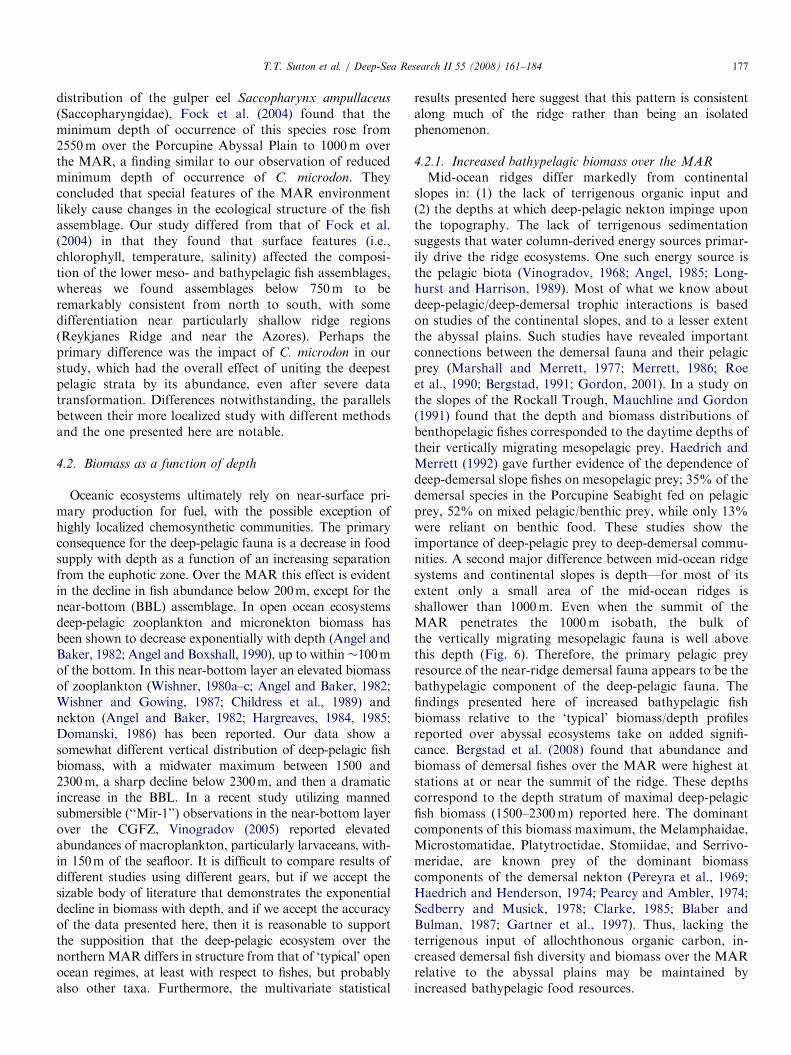
(5 June–3 July), utilized a two-pronged approach to mappingthe pelagic fauna: (1) continuous sampling via acousticmethods along the entire cruise track and (2) point samplingat predefined ‘‘SuperStations’’ (SS) to characterize hydro-graphy and biotic composition, abundance and biomass(Fig. 1). A series of sampling methods was employed at eachSS, including CTD deployments, plankton net tows andpelagic nekton tows. Some opportunistic sampling wasconducted along the track after detection of acoustic featuresof special interest. The a priori station design was chosen tobest utilize the available ship time for the pelagic survey, withsurvey lines set up to allow several transverse crossings of theridge, particularly at key features such as the Charlie-GibbsFracture Zone (CGFZ; Fig. 1). This cruise track did notallow day/night net sampling at each station and as a resultfine-scale diel distributional patterns could not be determinedwithin the spatial and temporal resolution of this survey. Asmost of the net sampling was done below 800m (over 60% ofall samples), the depth below which most diel verticalmigrators reside (Angel and Baker, 1982), and daylightprevailed throughout most of the diel cycle due to latitudeand season, larger-scale distributional patterns were theprimary foci of trawl sampling.
2.1. Acoustic data
A scientific echosounder operating at five frequencies(18, 36, 70, 120, 200 kHz; SIMRAD EK60) was used to
ARTICLE IN PRESS
8
6
4
2
3634
283032
26
24
22
16
20
18
1214
10
40°W
40°W
30°W
30°W
20°W
20 ° W
45°N 45°N
50°N 50°N
55°N
60°N 60 ° N
50°W
50°W
40°W
40°W
30°W
30°W
20°W
20°W
10°W
10°W
0°
0°
40°N
45°N 45°N
50°N 50°N
55°N 55°N
60°N 60°N
65°N 65°N
Azores
Charlie-Gibbs FractureZone
Iceland
55°N
Azorean Zone
(AZ)
Faraday Seamount
Zone (FSZ)
Charlie-Gibbs Fracture Zone
(CGFZ)
Reykjanes
Ridge (RR)
Fig. 1. Trawl sampling stations for Leg 1 of the 2004 R/V G.O. Sars MAR-ECO expedition.
T.T. Sutton et al. / Deep-Sea Research II 55 (2008) 161–184 163
map the horizontal and vertical distribution of biologicalbackscatter in the upper 2000–3000m. The combination ofmounting the transducers on a drop keel and the use of anacoustically quiet vessel allowed good quality observationsto full ocean depth in most cases. Bathymetry and bottomhardness were monitored during the cruise using a multi-beam echosounder (SIMRAD EM300) recording to anOlex data management and navigation system. These datawere used to determine proximity of the deepest pelagictrawls to the seafloor.
2.2. Trawl sampling
Three different double-warp midwater trawls, two ofcommercial fishing-size (a very large ‘Egersund’ trawl and alarge ‘Akra’ trawl) and one of oceanographic research-size(‘Macroplankton’ or ‘Krill’ trawl), were used to samplefrom the surface to depths of 3000+m, bottom depthpermitting. The largest net, the Egersund trawl (verticalopening of 90–180m, door spread of 150m and cod-endmesh size of 22mm, stretched), was used to sample acoustic
targets opportunistically, but these data were not quantifi-able in terms of the other two gears and thus were not usedin this paper other than capture data presented inAppendix A. The latter two trawls (Akra and Krill) wereused at each station to increase the spectrum of deep-pelagic fishes sampled, including larger forms that gen-erally avoid smaller (i.e., standard oceanographic) nets(Kashkin and Parin, 1983; Pearcy, 1983). A detaileddescription of the trawl gears, with schematics, can befound in Wenneck et al. (2008). These gears and thesamples collected with each are discussed in turn.The Akra trawl is a medium- to large-sized pelagic trawl
used in fishery research to simulate catches made withcommercial gear. It has graded-mesh netting with a verticalopening of 20–35m, a door spread of 110m and a cod-endmesh size of 22mm, stretched. For this cruise the trawlbody was equipped with a remotely operated multi-samplerwith three separate cod ends to sample three depth stratadiscretely and consecutively during each deployment. Thisnet was used routinely for sampling large and medium-sized deep-pelagic fishes and cephalopods. With respect to
ARTICLE IN PRESST.T. Sutton et al. / Deep-Sea Research II 55 (2008) 161–184164
fishes, the Akra trawl recorded the highest catches as wellas the highest species numbers. As is the case with large,graded-mesh trawls, the volume of water filtered wasdifficult to estimate. For purposes of comparison with theKrill trawl, the Akra trawl catches were standardizedaccording to catchability (see below) and unit effort (trawldistance).
The Norwegian Krill trawl, with a mouth area of�36m2,is larger than trawls routinely used by oceanographers tosample micronekton. It has a 6� 6-m2 mouth opening,
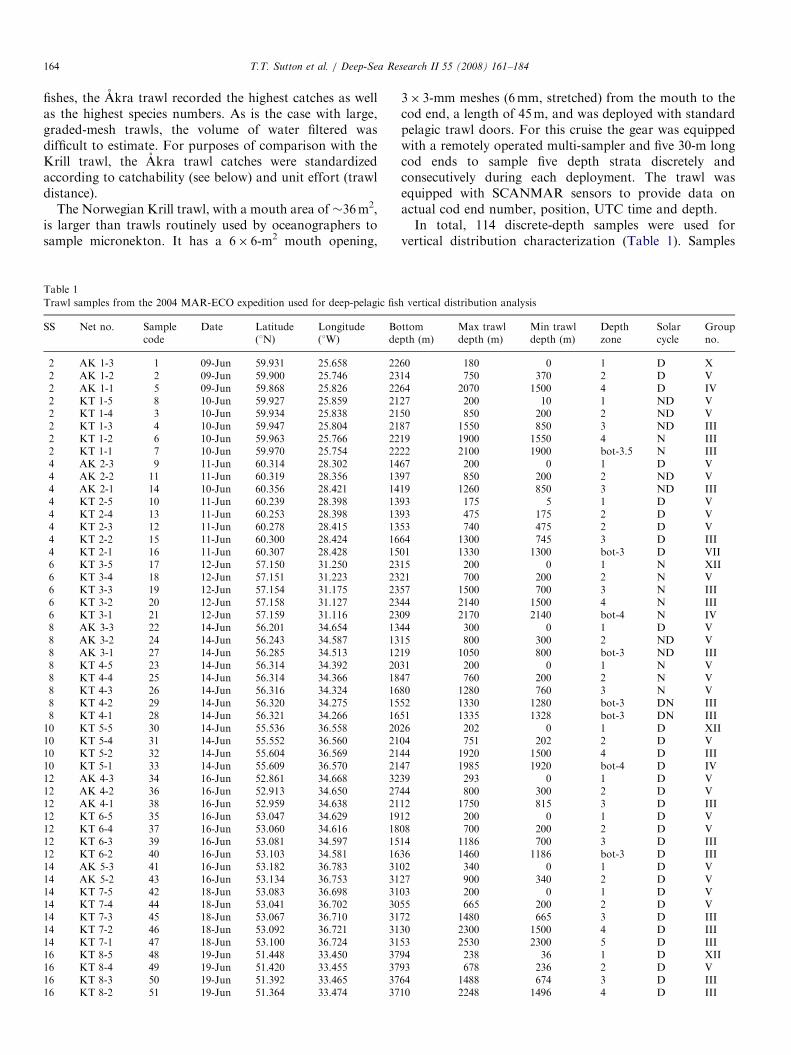
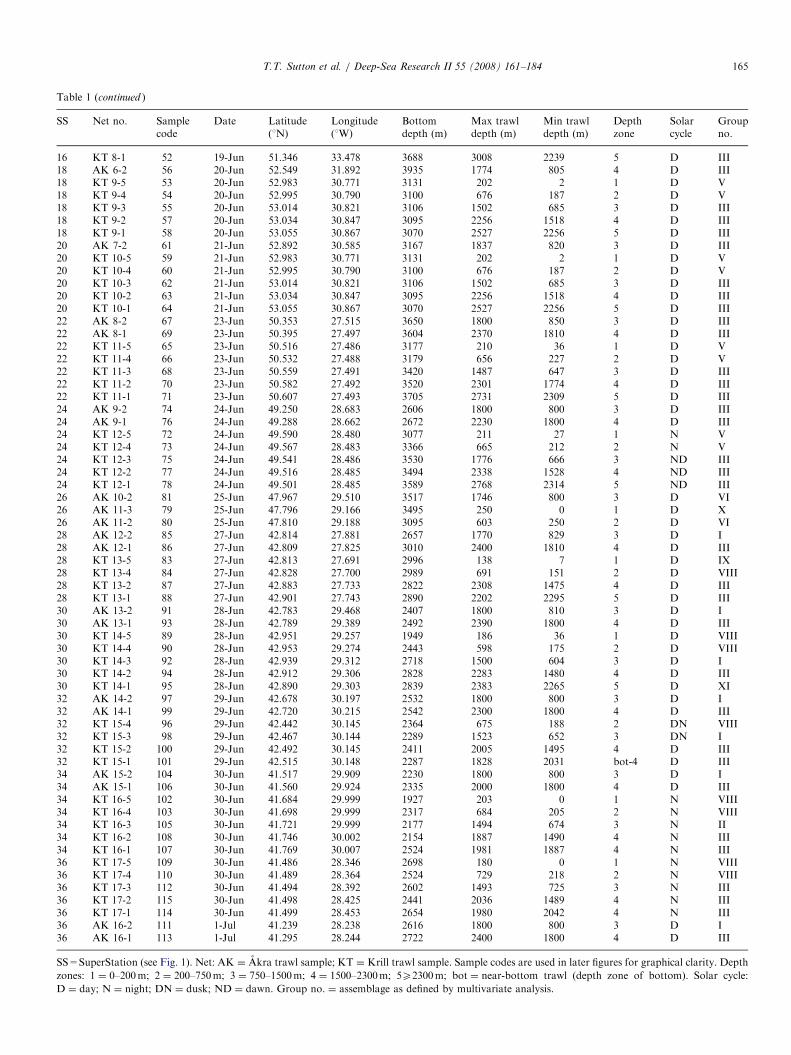
Table 1
Trawl samples from the 2004 MAR-ECO expedition used for deep-pelagic fis
SS Net no. Samplecode
Date Latitude(1N)
Longitude(1W)
Bode
2 AK 1-3 1 09-Jun 59.931 25.658 222 AK 1-2 2 09-Jun 59.900 25.746 232 AK 1-1 5 09-Jun 59.868 25.826 222 KT 1-5 8 10-Jun 59.927 25.859 212 KT 1-4 3 10-Jun 59.934 25.838 212 KT 1-3 4 10-Jun 59.947 25.804 212 KT 1-2 6 10-Jun 59.963 25.766 222 KT 1-1 7 10-Jun 59.970 25.754 224 AK 2-3 9 11-Jun 60.314 28.302 144 AK 2-2 11 11-Jun 60.319 28.356 134 AK 2-1 14 10-Jun 60.356 28.421 144 KT 2-5 10 11-Jun 60.239 28.398 134 KT 2-4 13 11-Jun 60.253 28.398 134 KT 2-3 12 11-Jun 60.278 28.415 134 KT 2-2 15 11-Jun 60.300 28.424 164 KT 2-1 16 11-Jun 60.307 28.428 156 KT 3-5 17 12-Jun 57.150 31.250 236 KT 3-4 18 12-Jun 57.151 31.223 236 KT 3-3 19 12-Jun 57.154 31.175 236 KT 3-2 20 12-Jun 57.158 31.127 236 KT 3-1 21 12-Jun 57.159 31.116 238 AK 3-3 22 14-Jun 56.201 34.654 138 AK 3-2 24 14-Jun 56.243 34.587 138 AK 3-1 27 14-Jun 56.285 34.513 128 KT 4-5 23 14-Jun 56.314 34.392 208 KT 4-4 25 14-Jun 56.314 34.366 188 KT 4-3 26 14-Jun 56.316 34.324 168 KT 4-2 29 14-Jun 56.320 34.275 158 KT 4-1 28 14-Jun 56.321 34.266 1610 KT 5-5 30 14-Jun 55.536 36.558 2010 KT 5-4 31 14-Jun 55.552 36.560 2110 KT 5-2 32 14-Jun 55.604 36.569 2110 KT 5-1 33 14-Jun 55.609 36.570 2112 AK 4-3 34 16-Jun 52.861 34.668 3212 AK 4-2 36 16-Jun 52.913 34.650 2712 AK 4-1 38 16-Jun 52.959 34.638 2112 KT 6-5 35 16-Jun 53.047 34.629 1912 KT 6-4 37 16-Jun 53.060 34.616 1812 KT 6-3 39 16-Jun 53.081 34.597 1512 KT 6-2 40 16-Jun 53.103 34.581 1614 AK 5-3 41 16-Jun 53.182 36.783 3114 AK 5-2 43 16-Jun 53.134 36.753 3114 KT 7-5 42 18-Jun 53.083 36.698 3114 KT 7-4 44 18-Jun 53.041 36.702 3014 KT 7-3 45 18-Jun 53.067 36.710 3114 KT 7-2 46 18-Jun 53.092 36.721 3114 KT 7-1 47 18-Jun 53.100 36.724 3116 KT 8-5 48 19-Jun 51.448 33.450 3716 KT 8-4 49 19-Jun 51.420 33.455 3716 KT 8-3 50 19-Jun 51.392 33.465 3716 KT 8-2 51 19-Jun 51.364 33.474 37
3� 3-mm meshes (6mm, stretched) from the mouth to thecod end, a length of 45m, and was deployed with standardpelagic trawl doors. For this cruise the gear was equippedwith a remotely operated multi-sampler and five 30-m longcod ends to sample five depth strata discretely andconsecutively during each deployment. The trawl wasequipped with SCANMAR sensors to provide data onactual cod end number, position, UTC time and depth.In total, 114 discrete-depth samples were used for
vertical distribution characterization (Table 1). Samples
h vertical distribution analysis
ttompth (m)
Max trawldepth (m)
Min trawldepth (m)
Depthzone
Solarcycle
Groupno.
60 180 0 1 D X14 750 370 2 D V64 2070 1500 4 D IV27 200 10 1 ND V50 850 200 2 ND V87 1550 850 3 ND III19 1900 1550 4 N III22 2100 1900 bot-3.5 N III67 200 0 1 D V97 850 200 2 ND V19 1260 850 3 ND III93 175 5 1 D V93 475 175 2 D V53 740 475 2 D V64 1300 745 3 D III01 1330 1300 bot-3 D VII15 200 0 1 N XII21 700 200 2 N V57 1500 700 3 N III44 2140 1500 4 N III09 2170 2140 bot-4 N IV44 300 0 1 D V15 800 300 2 ND V19 1050 800 bot-3 ND III31 200 0 1 N V47 760 200 2 N V80 1280 760 3 N V52 1330 1280 bot-3 DN III51 1335 1328 bot-3 DN III26 202 0 1 D XII04 751 202 2 D V44 1920 1500 4 D III47 1985 1920 bot-4 D IV39 293 0 1 D V44 800 300 2 D V12 1750 815 3 D III12 200 0 1 D V08 700 200 2 D V14 1186 700 3 D III36 1460 1186 bot-3 D III02 340 0 1 D V27 900 340 2 D V03 200 0 1 D V55 665 200 2 D V72 1480 665 3 D III30 2300 1500 4 D III53 2530 2300 5 D III94 238 36 1 D XII93 678 236 2 D V64 1488 674 3 D III10 2248 1496 4 D III
ARTICLE IN PRESS
Table 1 (continued )
SS Net no. Samplecode
Date Latitude(1N)
Longitude(1W)
Bottomdepth (m)
Max trawldepth (m)
Min trawldepth (m)
Depthzone
Solarcycle
Groupno.
16 KT 8-1 52 19-Jun 51.346 33.478 3688 3008 2239 5 D III18 AK 6-2 56 20-Jun 52.549 31.892 3935 1774 805 4 D III18 KT 9-5 53 20-Jun 52.983 30.771 3131 202 2 1 D V18 KT 9-4 54 20-Jun 52.995 30.790 3100 676 187 2 D V18 KT 9-3 55 20-Jun 53.014 30.821 3106 1502 685 3 D III18 KT 9-2 57 20-Jun 53.034 30.847 3095 2256 1518 4 D III18 KT 9-1 58 20-Jun 53.055 30.867 3070 2527 2256 5 D III20 AK 7-2 61 21-Jun 52.892 30.585 3167 1837 820 3 D III20 KT 10-5 59 21-Jun 52.983 30.771 3131 202 2 1 D V20 KT 10-4 60 21-Jun 52.995 30.790 3100 676 187 2 D V20 KT 10-3 62 21-Jun 53.014 30.821 3106 1502 685 3 D III20 KT 10-2 63 21-Jun 53.034 30.847 3095 2256 1518 4 D III20 KT 10-1 64 21-Jun 53.055 30.867 3070 2527 2256 5 D III22 AK 8-2 67 23-Jun 50.353 27.515 3650 1800 850 3 D III22 AK 8-1 69 23-Jun 50.395 27.497 3604 2370 1810 4 D III22 KT 11-5 65 23-Jun 50.516 27.486 3177 210 36 1 D V22 KT 11-4 66 23-Jun 50.532 27.488 3179 656 227 2 D V22 KT 11-3 68 23-Jun 50.559 27.491 3420 1487 647 3 D III22 KT 11-2 70 23-Jun 50.582 27.492 3520 2301 1774 4 D III22 KT 11-1 71 23-Jun 50.607 27.493 3705 2731 2309 5 D III24 AK 9-2 74 24-Jun 49.250 28.683 2606 1800 800 3 D III24 AK 9-1 76 24-Jun 49.288 28.662 2672 2230 1800 4 D III24 KT 12-5 72 24-Jun 49.590 28.480 3077 211 27 1 N V24 KT 12-4 73 24-Jun 49.567 28.483 3366 665 212 2 N V24 KT 12-3 75 24-Jun 49.541 28.486 3530 1776 666 3 ND III24 KT 12-2 77 24-Jun 49.516 28.485 3494 2338 1528 4 ND III24 KT 12-1 78 24-Jun 49.501 28.485 3589 2768 2314 5 ND III26 AK 10-2 81 25-Jun 47.967 29.510 3517 1746 800 3 D VI26 AK 11-3 79 25-Jun 47.796 29.166 3495 250 0 1 D X26 AK 11-2 80 25-Jun 47.810 29.188 3095 603 250 2 D VI28 AK 12-2 85 27-Jun 42.814 27.881 2657 1770 829 3 D I28 AK 12-1 86 27-Jun 42.809 27.825 3010 2400 1810 4 D III28 KT 13-5 83 27-Jun 42.813 27.691 2996 138 7 1 D IX28 KT 13-4 84 27-Jun 42.828 27.700 2989 691 151 2 D VIII28 KT 13-2 87 27-Jun 42.883 27.733 2822 2308 1475 4 D III28 KT 13-1 88 27-Jun 42.901 27.743 2890 2202 2295 5 D III30 AK 13-2 91 28-Jun 42.783 29.468 2407 1800 810 3 D I30 AK 13-1 93 28-Jun 42.789 29.389 2492 2390 1800 4 D III30 KT 14-5 89 28-Jun 42.951 29.257 1949 186 36 1 D VIII30 KT 14-4 90 28-Jun 42.953 29.274 2443 598 175 2 D VIII30 KT 14-3 92 28-Jun 42.939 29.312 2718 1500 604 3 D I30 KT 14-2 94 28-Jun 42.912 29.306 2828 2283 1480 4 D III30 KT 14-1 95 28-Jun 42.890 29.303 2839 2383 2265 5 D XI32 AK 14-2 97 29-Jun 42.678 30.197 2532 1800 800 3 D I32 AK 14-1 99 29-Jun 42.720 30.215 2542 2300 1800 4 D III32 KT 15-4 96 29-Jun 42.442 30.145 2364 675 188 2 DN VIII32 KT 15-3 98 29-Jun 42.467 30.144 2289 1523 652 3 DN I32 KT 15-2 100 29-Jun 42.492 30.145 2411 2005 1495 4 D III32 KT 15-1 101 29-Jun 42.515 30.148 2287 1828 2031 bot-4 D III34 AK 15-2 104 30-Jun 41.517 29.909 2230 1800 800 3 D I34 AK 15-1 106 30-Jun 41.560 29.924 2335 2000 1800 4 D III34 KT 16-5 102 30-Jun 41.684 29.999 1927 203 0 1 N VIII34 KT 16-4 103 30-Jun 41.698 29.999 2317 684 205 2 N VIII34 KT 16-3 105 30-Jun 41.721 29.999 2177 1494 674 3 N II34 KT 16-2 108 30-Jun 41.746 30.002 2154 1887 1490 4 N III34 KT 16-1 107 30-Jun 41.769 30.007 2524 1981 1887 4 N III36 KT 17-5 109 30-Jun 41.486 28.346 2698 180 0 1 N VIII36 KT 17-4 110 30-Jun 41.489 28.364 2524 729 218 2 N VIII36 KT 17-3 112 30-Jun 41.494 28.392 2602 1493 725 3 N III36 KT 17-2 115 30-Jun 41.498 28.425 2441 2036 1489 4 N III36 KT 17-1 114 30-Jun 41.499 28.453 2654 1980 2042 4 N III36 AK 16-2 111 1-Jul 41.239 28.238 2616 1800 800 3 D I36 AK 16-1 113 1-Jul 41.295 28.244 2722 2400 1800 4 D III
SS=SuperStation (see Fig. 1). Net: AK ¼ Akra trawl sample; KT ¼ Krill trawl sample. Sample codes are used in later figures for graphical clarity. Depth
zones: 1 ¼ 0–200m; 2 ¼ 200–750m; 3 ¼ 750–1500m; 4 ¼ 1500–2300m; 5X2300m; bot ¼ near-bottom trawl (depth zone of bottom). Solar cycle:
D ¼ day; N ¼ night; DN ¼ dusk; ND ¼ dawn. Group no. ¼ assemblage as defined by multivariate analysis.
T.T. Sutton et al. / Deep-Sea Research II 55 (2008) 161–184 165
ARTICLE IN PRESST.T. Sutton et al. / Deep-Sea Research II 55 (2008) 161–184166
generally fell within one of five depth categories: 0–200,200–750, 750–1500, 1500–2300 and 42300m; samples thatcame within 200m of the bottom were noted specifically;other samples that did not fall within this scheme wereexcluded from analysis. Samples were classified as daytime(D), dusk (DN), night (N) or dawn (ND) using sunrise andsunset times calculated for each sampling location andtime. Sunrise and sunset times were calculated using theCBM model of Forsythe et al. (1995) to estimate day lengthand the equation of time and longitude to estimate ‘noon.’Dusk and dawn samples were defined as those that weretaken 1 h before to 1 h after sunset and sunrise, respec-tively. The solar cycle of samples was examined as anexplanatory factor in subsequent multivariate statisticalanalyses.
For qualitative vertical distribution analysis, relativecatch-per-unit-effort data from both trawl types were usedto reveal a broader spectrum of deep-pelagic fish verticaldistribution patterns. In order to integrate data from thedifferent trawl types the Akra trawl (graded mesh) resultswere standardized using the Krill trawl (uniform mesh) asthe reference trawl. Catchability (defined as the ratio ofAkra trawl catch numbers to those of the Krill trawl)coefficients were calculated separately for each fish taxon
(Heino et al., submitted), and the Akra trawl results weredivided by the appropriate catchability coefficient to forman integrated station� species matrix for both trawl types.Most taxa exhibited catchability coefficients much less thanthat predicted by the differences in mouth area alone,indicating that few deep-pelagic fishes are ‘herded’ by thelarge meshes in the mouth of larger trawls. For fully herdedspecies (i.e., highly active swimming fishes), the mouth areaof a large trawl with graded meshes may be similar to itseffective mouth area (Heino et al., submitted). Catchabilitycoefficients varied greatly across taxa, suggesting that thesampled volume for the Akra trawl with graded mesheswas highly taxon-specific, most likely a function of size,mobility and behavior of the individual fish taxon (Rammand Xiao, 1995; Sangster and Breen, 1998). For quantita-tive purposes (abundance and biomass per volume), onlythe Krill trawl data (with known volume filtered) arereported here, with appropriate caveats regarding theunderestimation of larger forms.
2.3. Sample handling
Following trawl retrieval, catches were kept separate ondeck by net number, corresponding to the depth stratumsampled, and taken below decks for further processing.Catches were sorted one at a time to prevent potentialmixing of specimens from different depth strata. Thedeepest net catch was routinely sorted first, with the othercatches stored in a cold room to prevent sample degrada-tion. The total wet weight of each catch was determined ona motion-compensating scale, recorded, and then the entirecatch was rough sorted by major taxonomic group (fish,crustaceans, gelata). Fishes were then sorted by major
taxon and further identified to species by the first twoauthors (TTS and FMP). Each species was enumerated andweighed on a motion-compensating scale (70.1 g) beforefurther handling. One of the major benefits of at-seaweighing is that the biomass data do not suffer the ratherlarge variability imposed by ‘back-calculating’ via volumedisplacement or length–weight regressions. Samples werethen either frozen in lots by species, with an appropriatevolume of seawater, or preserved in formalin in cases ofrarity or taxonomic uncertainty. In cases where speciesdetermination was not feasible in a time appropriate toprevent sample degradation, specimens were frozen orpreserved in lots by family, with species identificationdetermined after closer examination by TTS and/or FMPat the Bergen Museum of Zoology, /http://collections.uib.no/vertebrate/S, the permanent repository for all 2004MAR-ECO expedition pelagic fish specimens. Bioticdatabase updates following taxonomic revisions werehandled by Bergen Museum staff.
2.4. Statistical analysis
The overall goal of this study was to characterize thevertical structure of a collection of pelagic fish assemblagessubject to different uncontrolled factors, namely latitude/water mass, position relative to the ridge axis, time of day,depth and collection (gear) method. The data matricesanalyzed consisted of standardized counts or biomass ofspecies� trawl sample. Some community analyses werecarried out on subsets of the total data matrix. Twomultivariate techniques were employed to discriminatesample groups, using the PRIMER v.6 software package(Clarke and Gorley, 2006): (1) non-metric multi-dimen-sional scaling (MDS, Kruskal and Wish, 1978) and (2)hierarchical unweighted pair-group method using arith-metic averages (UPGMA) cluster analysis (Romesburg,1990). Both methods were based on a triangular matrix ofBray–Curtis similarity coefficients (desirable because jointabsences have no effect; Bray and Curtis, 1957; Faith et al.,1987). The independence of joint absence criterion isparticularly important relative to this study; species canbe absent for many reasons, and in this case it would beinappropriate to infer that two samples are similar becauseneither contains a particular species. As an example, itwould be wrong to suggest that near-surface and lowerbathypelagic samples are similar because neither containsspecies found only in the mesopelagic zone.For multivariate analyses, and prior to construction of
the similarity matrix, the total data matrix was fourth-roottransformed to down-weight the importance of thenumerically dominant species (namely, Benthosema glaciale
and Cyclothone microdon). Ideally, the optimal degree ofdata transformation prior to multivariate analysis wouldbe determined using statistical methods (e.g., dispersion-based weighting, Clarke et al., 2006). However, thesemethods require replication of samples (not possible in thisstudy), so the ‘range of values’ criterion was employed. The
ARTICLE IN PRESST.T. Sutton et al. / Deep-Sea Research II 55 (2008) 161–184 167
(non-zero) abundance values upon which analyses werebased spanned six orders of magnitude (0.005–970.114 ind.per 104m3), calling for a strong transformation todiscriminate assemblage structure beyond the numericallydominant fish species.
A series of similarity permutation tests (ANOSIM, 999iterations, po5%) were run to test the null hypothesis thatthere were no differences between groups of samples as afunction of five a priori defined factors. These factorsincluded: ridge section (Fig. 1); location of sample relativeto ridge axis (east, west, or directly over); solar cycle (day/night); collection gear (Akra vs. Krill trawl); and depthstratum (Table 1). The results of these tests were then usedto: (1) indicate the relative ‘explanatory power’ of eachfactor and (2) to direct further examination (pairwisecomparisons) to determine where the major differencesoccurred relative to each factor. In cases where the nullhypothesis was not rejected, no further pairwise compar-isons were attempted.
In order to assess the appropriate similarity level forassemblage discrimination, similarity profile permutationtests (SIMPROF; 1000 iterations, po5%) were run to testthe null hypothesis that the samples, which were not a
priori divided into groups (as they were for ANOSIM), didnot differ from each other in multivariate structure. Thesimilarity level at which the departure statistic, p, exceededthe 5% probability criterion (i.e., no statistical evidence forsubstructure at higher similarity levels) was used to defineassemblage groups via cluster analysis. This similarity levelwas then overlain on the MDS plot to assess concordance,and pending that, used to define the groupings (i.e., naturalassemblages) for data presentation and pooling forquantitative estimation (abundance and biomass pervolume).
3. Results
3.1. Deep-pelagic fish community structure
A total of 205 fish species were collected by midwatersampling during Leg 1 of the 2004 G.O. Sars expedition(Appendix A). A detailed treatment covering the overallbiogeography and latitudinal variation of the assemblage isunderway (Porteiro et al., in prep.), pending the resolutionof certain taxonomic issues, but a complete species list ispresented for taxon-specific sample size representation. Assome of these fishes are among the rarest known, this listalso serves to highlight the MAR-ECO/CoML contribu-tions in the Bergen Museum Vertebrate Collection. Ofthese 205 species, 197 were collected in 114 discrete-depthtrawl samples, with these data constituting the basis for theremainder of this paper. The primary faunal contributorsto either abundance or biomass will be detailed in afollowing account by depth stratum.
ANOSIM tests revealed that of the five factorsinvestigated, depth was by far the most important (globalR ¼ 0.452, po0.1%), followed by ridge section (global
R ¼ 0.141, po0.1%). Gear type as a factor was weaklysignificant (global R ¼ 0.094, po2.2%). The null hypoth-esis (no differences between groups) could not be rejectedfor position relative to ridge axis (global R ¼ 0.021,po14.6%) or solar cycle (R ¼ �0.029, po67.2%), negat-ing any further analysis. Relative to ridge section, thestrongest differences were found between the Azorean (AZ)samples and those of the two northern regions (ReykjanesRidge, R ¼ 0.273, and CGFZ, R ¼ 0.287, both withpo0.1%). The Faraday Seamount region (FSZ) differedweakly from the region to the north (CGFZ, R ¼ 0.095,po3.8%) and to the south (AZ, R ¼ 0.126, po1.7%).There was no statistical evidence suggesting differencesbetween samples from the Reykjanes Ridge region andeither the CGFZ (R ¼ �0.004, po51.2%) or the FSZ(R ¼ �0.015, po59.1%). As depth proved to be theprimary assemblage composition determinant, the remain-der of this paper will deal primarily with vertical structure,with some treatment of biogeographic differentiation asappropriate.
3.2. Large-scale vertical distribution patterns
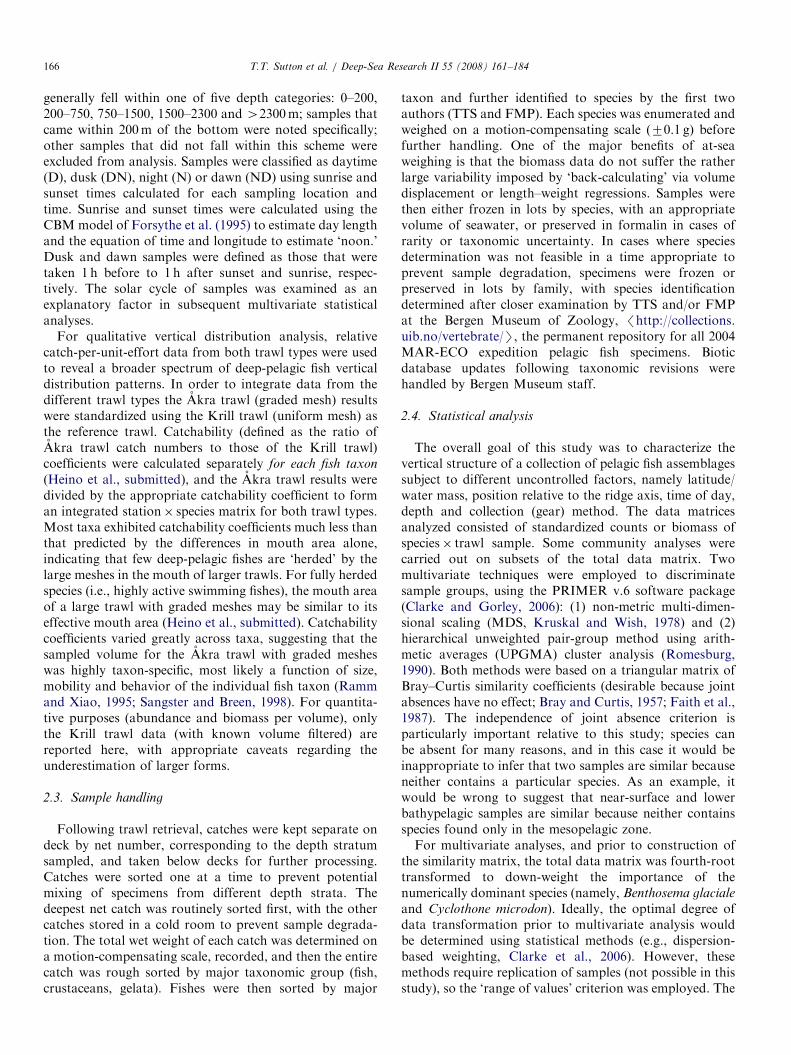
The largest-scale view of the vertical distribution of fishabundance and biomass along the northern MAR is simplyone of depth across the entire region sampled (Iceland tothe Azores). Pooled quantitative data (all 81 Krill trawlsamples) are plotted in Fig. 2 with respect to the five depthintervals sampled, plus a representation of data fromsamples taken within 200m of the ridge, defined here as theMAR benthic boundary layer (BBL), irrespective of depthbelow the surface. Several large-scale features wereapparent from these results. Abundance showed anexpected decline with depth to approximately 1500m, butthen increased by roughly half relative to the overlyingwater before decreasing to a minimum below 2300m.Pelagic fish densities rose dramatically within the BBL,rivaling values from the upper 750m. The trend in biomasswith depth differed from that of abundance, though theincrease in the BBL was even more dramatic. In fact, thehighest biomass values found during this survey occurredin this layer. Biomass values in the top 2300m weresomewhat surprising in that the expected exponentialdecline with depth did not occur; indeed the midwaterbiomass maximum was found between 1500 and 2300m,resulting from the larger average size of fishes taken withinthis stratum (since abundances were lower). Not surpris-ingly, the water column minimum in biomass was observedbelow 2300m but above the top of the BBL. In order toextract explanatory details within this large-scale view, wemust look in more detail at the nature of the samplegroupings.A two-dimensional (2-D) spatial plot of ordination
(MDS) resulted in a stress level (a measure of thedimensionality of an ordination) of 0.17, suggesting thatthe ordination could give a useful 2-D picture if used intandem with another multivariate technique such as cluster
ARTICLE IN PRESS
Abundance (fish 10-6 m-3)
200
750
1500
2300
3000
Depth
(m
)
Biomass (kg ww 10-6 m-3)
100020003000 1 3 4 5 76 9 10
Near bottom
0(2338) (5.51)
(2182) (4.77 )
(1042) (5.44)
(6.30)(1595)
(1.84)(770)
(2219) (8.98)
82
Fig. 2. The pooled vertical distribution of deep-pelagic fish abundance and biomass (ww ¼ wet weight) along the northern Mid-Atlantic Ridge (Reykjanes
Ridge to the Azores archipelago). Exact values listed in parentheses. Results based on 81 discrete-depth Krill trawl samples. ‘‘Near bottom’’ data include
all samples within 200m of the bottom, irrespective of depth from the surface (range ¼ 750–2300m).
T.T. Sutton et al. / Deep-Sea Research II 55 (2008) 161–184168
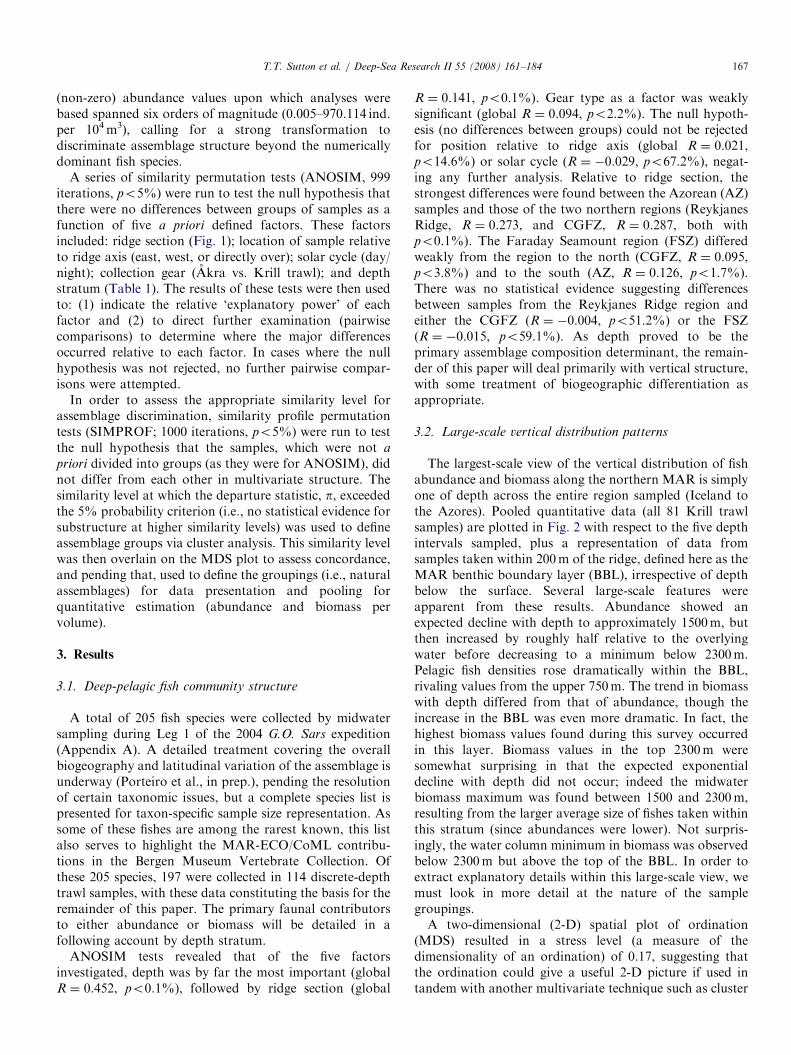
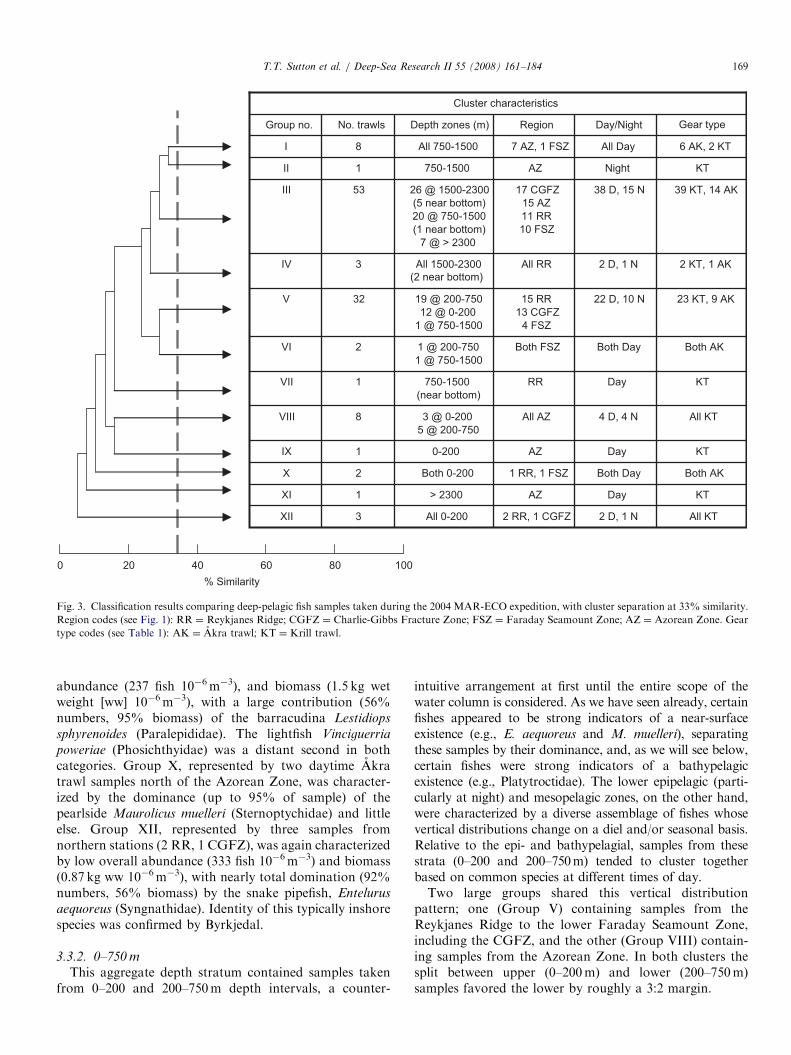
analysis. Three-dimensional (3-D) plots resulted in a lowerstress value, 0.12, but the gain was offset by the increaseddifficulty in visualizing the configuration in 3-D. Similarityprofile tests (SIMPROF) of cluster analysis resultsidentified 12 major assemblages at a similarity level of33% (p ¼ 3.87, po0.1%). SIMPROF found no statisticalevidence for substructure at higher similarity values(at 40% p ¼ 2.92, po20.8%). The dendrogram output ofcluster analysis was too complex to be presented in itsentirety, so a condensed version is provided in Fig. 3, withfactorial characteristics listed for each cluster. Linkingcluster analysis results to the MDS plot (Fig. 4) furthercorroborates this level of discrimination; subclusters werenot organized spatially within major clusters when basedon higher similarity values.
The finding that depth was the predominant factor withrespect to group composition, more so than geographicregion, is evidenced by the characteristics of the largestgroup, Group III. While 52 of the 53 samples included inGroup III were taken at deep meso-/bathypelagic depths,these samples were apportioned almost evenly across thefour main geographic regions (Fig. 3).
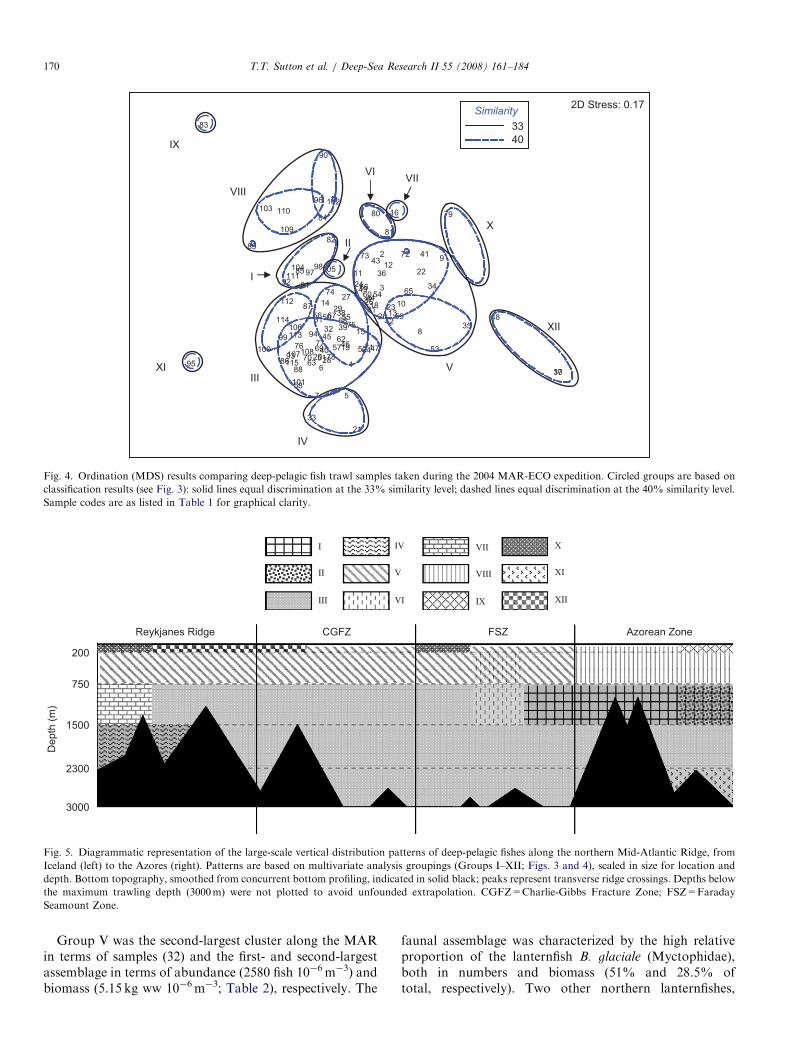
A spatial synopsis of these statistical analyses ispresented in Fig. 5. The dominant feature was thewidespread, deep-living assemblage of fishes between 750and 3000m (Group III), from the northern ReykjanesRidge all the way to the Azores. Some zonation wasapparent in the northern and southern ends of this largedepth stratum, with six smaller assemblages of fishesexhibiting limited distributions. Of these six, the largestwas an assemblage of fishes (Group I) found mainly in theAzorean Zone between 750 and 1500m. Three smallerassemblages were found in close association with the ridgeitself, two (Groups IV and VII) in the Reykjanes Ridgeregion and one (Group XI) in the Azorean Zone, the latterbeing very deep (42300m). An assemblage was observedat night between 750 and 1500m in the Azorean Zone(Group II), and another assemblage was detected spanning250–750m in the Faraday Seamount Zone (Group VI).
As might be expected given the presence of a subpolarfront in the CGFZ (Søiland et al., 2008), much morespatial variation was observed in the upper 750m of thewater column. Within this depth stratum the dominantfeature was an assemblage of fishes (Group V) thatstretched from the Reykjanes Ridge region to the southernend of the Faraday Seamount Zone, but not into theAzorean Zone. An unexpected finding was that for much ofits extent this assemblage spanned the epi- (0–200m) andupper mesopelagic (200–750m) depth intervals. Thisfinding will be treated in more detail in the followingfaunal account. Group V fish assemblage was replaced inthe upper waters of the Azorean Zone by the moresubtropical Group VIII assemblage. The remaining threeassemblage groupings were distributed across the epipela-gic zones of the four geographic regions, one being sharedby the Reykjanes and Faraday Zones (Group X), one beingshared by the Reykjanes and CGFZ (Group XII) and onefound only in the Azorean Zone (Group IX).
3.3. Faunal account by depth stratum
In this section the major groups mentioned above will betreated in more quantitative and taxonomic detail,organized by depth stratum encompassing each group. Insome cases the depth stratum will be an aggregate ofmultiple depth intervals as dictated by the depths of thesamples making up each group. In this passage, the terms‘‘group’’ and/or ‘‘cluster’’ refer to the sample set, while theterm ‘‘assemblage’’ refers to the faunal elements of thesample sets. Any references to numbers, abundance orbiomass are to values per unit volume filtered. Fish familynames are given in parentheses on first usage.
3.3.1. 0–200 m
Of the 12 major groups of trawl samples, three (GroupsIX, X and XII), were contained wholly within the top200m. Group IX, represented by one daytime sample fromthe Azorean Zone, was characterized by overall low
ARTICLE IN PRESS
100806040200
% Similarity
Both AKBoth Day1 RR, 1 FSZBoth 0-2002X
KTDayAZ0-2001IX
KTDayAZ> 23001XI
KTNightAZ750-15001II
39 KT, 14 AK38 D, 15 N17 CGFZ
15 AZ
11 RR
10 FSZ
26 @ 1500-2300
(5 near bottom)
20 @ 750-1500
(1 near bottom)
7 @ > 2300
53III
2 KT, 1 AK2 D, 1 NAll RRAll 1500-23003IV
23 KT, 9 AK22 D, 10 N15 RR
13 CGFZ
4 FSZ
19 @ 200-750
12 @ 0-200
1 @ 750-1500
32V
Both AKBoth DayBoth FSZ1 @ 200-750
1 @ 750-1500
2VI
KTDayRR750-1500
(near bottom)
1VII
XII
VIII
I
Group no.
3
8
8
No. trawls
2 RR, 1 CGFZ
All AZ
7 AZ, 1 FSZ
Region
All 0-200
3 @ 0-200
5 @ 200-750
All 750-1500
Depth zones (m)
All KT2 D, 1 N
All KT4 D, 4 N
6 AK, 2 KTAll Day
Day/Night
Cluster characteristics
Gear type
(2 near bottom)
Fig. 3. Classification results comparing deep-pelagic fish samples taken during the 2004 MAR-ECO expedition, with cluster separation at 33% similarity.
Region codes (see Fig. 1): RR ¼ Reykjanes Ridge; CGFZ ¼ Charlie-Gibbs Fracture Zone; FSZ ¼ Faraday Seamount Zone; AZ ¼ Azorean Zone. Gear
type codes (see Table 1): AK ¼ Akra trawl; KT ¼ Krill trawl.
T.T. Sutton et al. / Deep-Sea Research II 55 (2008) 161–184 169
abundance (237 fish 10�6m�3), and biomass (1.5 kg wetweight [ww] 10�6m�3), with a large contribution (56%numbers, 95% biomass) of the barracudina Lestidiops
sphyrenoides (Paralepididae). The lightfish Vinciguerria
poweriae (Phosichthyidae) was a distant second in bothcategories. Group X, represented by two daytime Akratrawl samples north of the Azorean Zone, was character-ized by the dominance (up to 95% of sample) of thepearlside Maurolicus muelleri (Sternoptychidae) and littleelse. Group XII, represented by three samples fromnorthern stations (2 RR, 1 CGFZ), was again characterizedby low overall abundance (333 fish 10�6m�3) and biomass(0.87 kg ww 10�6m�3), with nearly total domination (92%numbers, 56% biomass) by the snake pipefish, Entelurus
aequoreus (Syngnathidae). Identity of this typically inshorespecies was confirmed by Byrkjedal.
3.3.2. 0–750 m
This aggregate depth stratum contained samples takenfrom 0–200 and 200–750m depth intervals, a counter-
intuitive arrangement at first until the entire scope of thewater column is considered. As we have seen already, certainfishes appeared to be strong indicators of a near-surfaceexistence (e.g., E. aequoreus and M. muelleri), separatingthese samples by their dominance, and, as we will see below,certain fishes were strong indicators of a bathypelagicexistence (e.g., Platytroctidae). The lower epipelagic (parti-cularly at night) and mesopelagic zones, on the other hand,were characterized by a diverse assemblage of fishes whosevertical distributions change on a diel and/or seasonal basis.Relative to the epi- and bathypelagial, samples from thesestrata (0–200 and 200–750m) tended to cluster togetherbased on common species at different times of day.Two large groups shared this vertical distribution
pattern; one (Group V) containing samples from theReykjanes Ridge to the lower Faraday Seamount Zone,including the CGFZ, and the other (Group VIII) contain-ing samples from the Azorean Zone. In both clusters thesplit between upper (0–200m) and lower (200–750m)samples favored the lower by roughly a 3:2 margin.
ARTICLE IN PRESS
Similarity
33
40
1
2
3
4
5
6
7
8
9
10
1112
13
14
15
16
17
18
1920
21
22
23
24
25
26
27
28
29
30
31
32
33
34
35
36
37
38
39
40
41
42
43
44
4546
47
48
49
50
5152 53
54
5556
57
58
59
60
61
62
63
64
6566
6768
6970
71
7273
74
75
76 77
78
7980
8182
83
84
85
86
87
88
89
90
9192
93
94
95
96
9798
99
100
101
102103
104 105
106
107108
109
110
111
112
113
114
115
IX
XI
IV
VIIVI
II
VIII
I
VIII
X
XII
2D Stress: 0.17
Fig. 4. Ordination (MDS) results comparing deep-pelagic fish trawl samples taken during the 2004 MAR-ECO expedition. Circled groups are based on
classification results (see Fig. 3): solid lines equal discrimination at the 33% similarity level; dashed lines equal discrimination at the 40% similarity level.
Sample codes are as listed in Table 1 for graphical clarity.
Reykjanes Ridge CGFZ FSZ Azorean Zone
200
750
1500
2300
3000
De
pth
(m
)
I
II
III
IV
V
VI
VII
VIII
IX
X
XI
XII
Fig. 5. Diagrammatic representation of the large-scale vertical distribution patterns of deep-pelagic fishes along the northern Mid-Atlantic Ridge, from
Iceland (left) to the Azores (right). Patterns are based on multivariate analysis groupings (Groups I–XII; Figs. 3 and 4), scaled in size for location and
depth. Bottom topography, smoothed from concurrent bottom profiling, indicated in solid black; peaks represent transverse ridge crossings. Depths below
the maximum trawling depth (3000m) were not plotted to avoid unfounded extrapolation. CGFZ=Charlie-Gibbs Fracture Zone; FSZ=Faraday
Seamount Zone.
T.T. Sutton et al. / Deep-Sea Research II 55 (2008) 161–184170
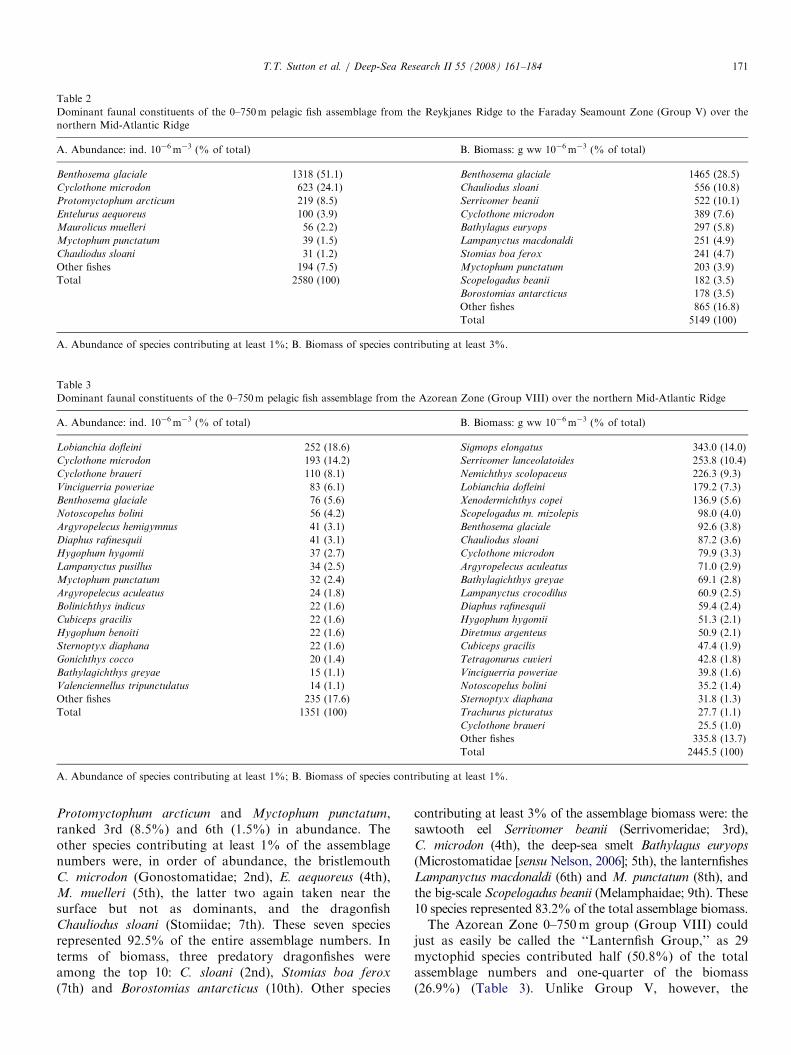
Group V was the second-largest cluster along the MARin terms of samples (32) and the first- and second-largestassemblage in terms of abundance (2580 fish 10�6m�3) andbiomass (5.15 kg ww 10�6m�3; Table 2), respectively. The
faunal assemblage was characterized by the high relativeproportion of the lanternfish B. glaciale (Myctophidae),both in numbers and biomass (51% and 28.5% oftotal, respectively). Two other northern lanternfishes,
ARTICLE IN PRESS
Table 2
Dominant faunal constituents of the 0–750m pelagic fish assemblage from the Reykjanes Ridge to the Faraday Seamount Zone (Group V) over the
northern Mid-Atlantic Ridge
A. Abundance: ind. 10�6m�3 (% of total) B. Biomass: g ww 10�6m�3 (% of total)
Benthosema glaciale 1318 (51.1) Benthosema glaciale 1465 (28.5)
Cyclothone microdon 623 (24.1) Chauliodus sloani 556 (10.8)
Protomyctophum arcticum 219 (8.5) Serrivomer beanii 522 (10.1)
Entelurus aequoreus 100 (3.9) Cyclothone microdon 389 (7.6)
Maurolicus muelleri 56 (2.2) Bathylagus euryops 297 (5.8)
Myctophum punctatum 39 (1.5) Lampanyctus macdonaldi 251 (4.9)
Chauliodus sloani 31 (1.2) Stomias boa ferox 241 (4.7)
Other fishes 194 (7.5) Myctophum punctatum 203 (3.9)
Total 2580 (100) Scopelogadus beanii 182 (3.5)
Borostomias antarcticus 178 (3.5)
Other fishes 865 (16.8)
Total 5149 (100)
A. Abundance of species contributing at least 1%; B. Biomass of species contributing at least 3%.
Table 3
Dominant faunal constituents of the 0–750m pelagic fish assemblage from the Azorean Zone (Group VIII) over the northern Mid-Atlantic Ridge
A. Abundance: ind. 10�6m�3 (% of total) B. Biomass: g ww 10�6m�3 (% of total)
Lobianchia dofleini 252 (18.6) Sigmops elongatus 343.0 (14.0)
Cyclothone microdon 193 (14.2) Serrivomer lanceolatoides 253.8 (10.4)
Cyclothone braueri 110 (8.1) Nemichthys scolopaceus 226.3 (9.3)
Vinciguerria poweriae 83 (6.1) Lobianchia dofleini 179.2 (7.3)
Benthosema glaciale 76 (5.6) Xenodermichthys copei 136.9 (5.6)
Notoscopelus bolini 56 (4.2) Scopelogadus m. mizolepis 98.0 (4.0)
Argyropelecus hemigymnus 41 (3.1) Benthosema glaciale 92.6 (3.8)
Diaphus rafinesquii 41 (3.1) Chauliodus sloani 87.2 (3.6)
Hygophum hygomii 37 (2.7) Cyclothone microdon 79.9 (3.3)
Lampanyctus pusillus 34 (2.5) Argyropelecus aculeatus 71.0 (2.9)
Myctophum punctatum 32 (2.4) Bathylagichthys greyae 69.1 (2.8)
Argyropelecus aculeatus 24 (1.8) Lampanyctus crocodilus 60.9 (2.5)
Bolinichthys indicus 22 (1.6) Diaphus rafinesquii 59.4 (2.4)
Cubiceps gracilis 22 (1.6) Hygophum hygomii 51.3 (2.1)
Hygophum benoiti 22 (1.6) Diretmus argenteus 50.9 (2.1)
Sternoptyx diaphana 22 (1.6) Cubiceps gracilis 47.4 (1.9)
Gonichthys cocco 20 (1.4) Tetragonurus cuvieri 42.8 (1.8)
Bathylagichthys greyae 15 (1.1) Vinciguerria poweriae 39.8 (1.6)
Valenciennellus tripunctulatus 14 (1.1) Notoscopelus bolini 35.2 (1.4)
Other fishes 235 (17.6) Sternoptyx diaphana 31.8 (1.3)
Total 1351 (100) Trachurus picturatus 27.7 (1.1)
Cyclothone braueri 25.5 (1.0)
Other fishes 335.8 (13.7)
Total 2445.5 (100)
A. Abundance of species contributing at least 1%; B. Biomass of species contributing at least 1%.
T.T. Sutton et al. / Deep-Sea Research II 55 (2008) 161–184 171
Protomyctophum arcticum and Myctophum punctatum,ranked 3rd (8.5%) and 6th (1.5%) in abundance. Theother species contributing at least 1% of the assemblagenumbers were, in order of abundance, the bristlemouthC. microdon (Gonostomatidae; 2nd), E. aequoreus (4th),M. muelleri (5th), the latter two again taken near thesurface but not as dominants, and the dragonfishChauliodus sloani (Stomiidae; 7th). These seven speciesrepresented 92.5% of the entire assemblage numbers. Interms of biomass, three predatory dragonfishes wereamong the top 10: C. sloani (2nd), Stomias boa ferox
(7th) and Borostomias antarcticus (10th). Other species
contributing at least 3% of the assemblage biomass were: thesawtooth eel Serrivomer beanii (Serrivomeridae; 3rd),C. microdon (4th), the deep-sea smelt Bathylagus euryops
(Microstomatidae [sensu Nelson, 2006]; 5th), the lanternfishesLampanyctus macdonaldi (6th) and M. punctatum (8th), andthe big-scale Scopelogadus beanii (Melamphaidae; 9th). These10 species represented 83.2% of the total assemblage biomass.The Azorean Zone 0–750m group (Group VIII) could
just as easily be called the ‘‘Lanternfish Group,’’ as 29myctophid species contributed half (50.8%) of the totalassemblage numbers and one-quarter of the biomass(26.9%) (Table 3). Unlike Group V, however, the
ARTICLE IN PRESST.T. Sutton et al. / Deep-Sea Research II 55 (2008) 161–184172
numerically dominant species was the lanternfish Lobian-
chia doefleini, not B. glaciale (ranked 5th), followed closelyby C. microdon. Diversity was higher overall in thisassemblage, with 19 species contributing at least 1% oftotal abundance. This diversity was also manifest in thedistribution of biomass, as no species contributed morethan 15% of the total, and 22 species contributed at least1%. Larger but rarer species contributed more heavily tothe biomass totals of this assemblage, as evidenced by thehigh biomass percentages of fishes such as the bristlemouthSigmops elongatus (Gonostoma elongatum of someauthors), the eels Serrivomer lanceolatoides and Nemichthys
scolopaceus (Nemichthyidae), the smooth-head Xenoder-
michthys copei (Alepocephalidae) and the southern big-scale Scopelogadus mizolepis mizolepis. As is the usual casein lower latitude waters of higher diversity (Hopkins andGartner, 1992), the abundance and biomass of the 0–750massemblage of the Azorean Zone was less than that of theReykjanes-Faraday Zone (Group V), in this case by half(Tables 2 and 3).
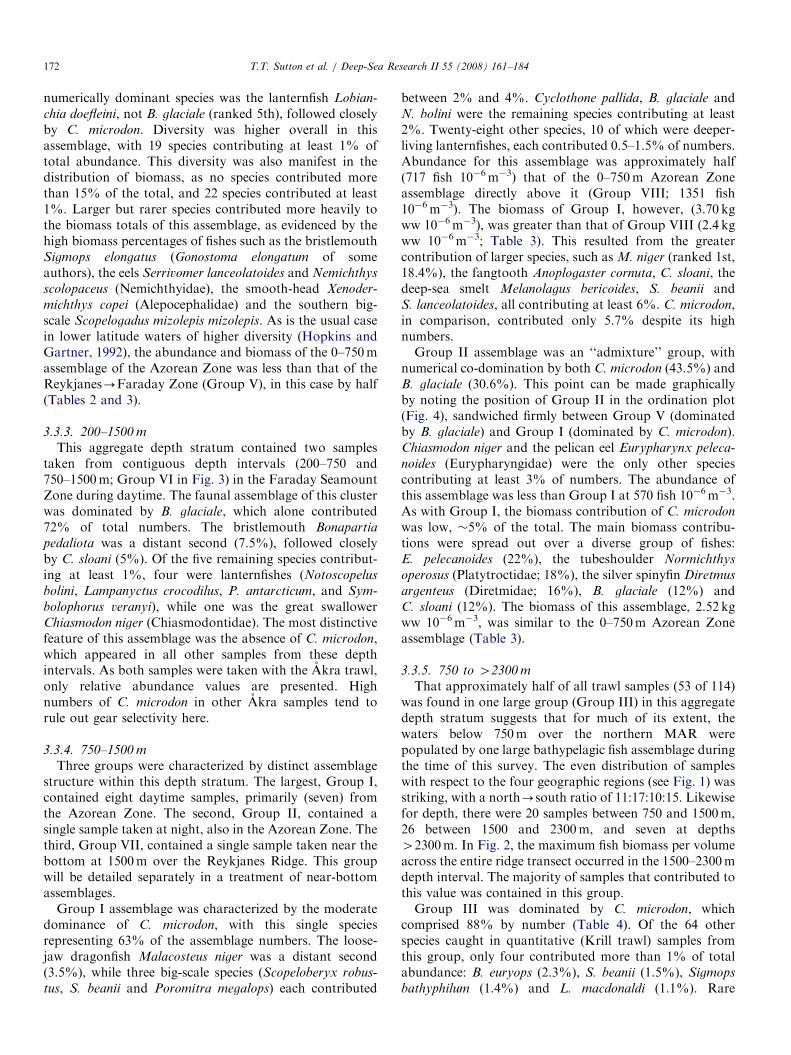
3.3.3. 200–1500 m
This aggregate depth stratum contained two samplestaken from contiguous depth intervals (200–750 and750–1500m; Group VI in Fig. 3) in the Faraday SeamountZone during daytime. The faunal assemblage of this clusterwas dominated by B. glaciale, which alone contributed72% of total numbers. The bristlemouth Bonapartia
pedaliota was a distant second (7.5%), followed closelyby C. sloani (5%). Of the five remaining species contribut-ing at least 1%, four were lanternfishes (Notoscopelus
bolini, Lampanyctus crocodilus, P. antarcticum, and Sym-
bolophorus veranyi), while one was the great swallowerChiasmodon niger (Chiasmodontidae). The most distinctivefeature of this assemblage was the absence of C. microdon,which appeared in all other samples from these depthintervals. As both samples were taken with the Akra trawl,only relative abundance values are presented. Highnumbers of C. microdon in other Akra samples tend torule out gear selectivity here.
3.3.4. 750–1500 m
Three groups were characterized by distinct assemblagestructure within this depth stratum. The largest, Group I,contained eight daytime samples, primarily (seven) fromthe Azorean Zone. The second, Group II, contained asingle sample taken at night, also in the Azorean Zone. Thethird, Group VII, contained a single sample taken near thebottom at 1500m over the Reykjanes Ridge. This groupwill be detailed separately in a treatment of near-bottomassemblages.
Group I assemblage was characterized by the moderatedominance of C. microdon, with this single speciesrepresenting 63% of the assemblage numbers. The loose-jaw dragonfish Malacosteus niger was a distant second(3.5%), while three big-scale species (Scopeloberyx robus-
tus, S. beanii and Poromitra megalops) each contributed
between 2% and 4%. Cyclothone pallida, B. glaciale andN. bolini were the remaining species contributing at least2%. Twenty-eight other species, 10 of which were deeper-living lanternfishes, each contributed 0.5–1.5% of numbers.Abundance for this assemblage was approximately half(717 fish 10�6m�3) that of the 0–750m Azorean Zoneassemblage directly above it (Group VIII; 1351 fish10�6m�3). The biomass of Group I, however, (3.70 kgww 10�6m�3), was greater than that of Group VIII (2.4 kgww 10�6m�3; Table 3). This resulted from the greatercontribution of larger species, such as M. niger (ranked 1st,18.4%), the fangtooth Anoplogaster cornuta, C. sloani, thedeep-sea smelt Melanolagus bericoides, S. beanii andS. lanceolatoides, all contributing at least 6%. C. microdon,in comparison, contributed only 5.7% despite its highnumbers.Group II assemblage was an ‘‘admixture’’ group, with
numerical co-domination by both C. microdon (43.5%) andB. glaciale (30.6%). This point can be made graphicallyby noting the position of Group II in the ordination plot(Fig. 4), sandwiched firmly between Group V (dominatedby B. glaciale) and Group I (dominated by C. microdon).Chiasmodon niger and the pelican eel Eurypharynx peleca-
noides (Eurypharyngidae) were the only other speciescontributing at least 3% of numbers. The abundance ofthis assemblage was less than Group I at 570 fish 10�6m�3.As with Group I, the biomass contribution of C. microdon
was low, �5% of the total. The main biomass contribu-tions were spread out over a diverse group of fishes:E. pelecanoides (22%), the tubeshoulder Normichthys
operosus (Platytroctidae; 18%), the silver spinyfin Diretmus
argenteus (Diretmidae; 16%), B. glaciale (12%) andC. sloani (12%). The biomass of this assemblage, 2.52 kgww 10�6m�3, was similar to the 0–750m Azorean Zoneassemblage (Table 3).
3.3.5. 750 to 42300 m
That approximately half of all trawl samples (53 of 114)was found in one large group (Group III) in this aggregatedepth stratum suggests that for much of its extent, thewaters below 750m over the northern MAR werepopulated by one large bathypelagic fish assemblage duringthe time of this survey. The even distribution of sampleswith respect to the four geographic regions (see Fig. 1) wasstriking, with a north-south ratio of 11:17:10:15. Likewisefor depth, there were 20 samples between 750 and 1500m,26 between 1500 and 2300m, and seven at depths42300m. In Fig. 2, the maximum fish biomass per volumeacross the entire ridge transect occurred in the 1500–2300mdepth interval. The majority of samples that contributed tothis value was contained in this group.Group III was dominated by C. microdon, which
comprised 88% by number (Table 4). Of the 64 otherspecies caught in quantitative (Krill trawl) samples fromthis group, only four contributed more than 1% of totalabundance: B. euryops (2.3%), S. beanii (1.5%), Sigmops
bathyphilum (1.4%) and L. macdonaldi (1.1%). Rare
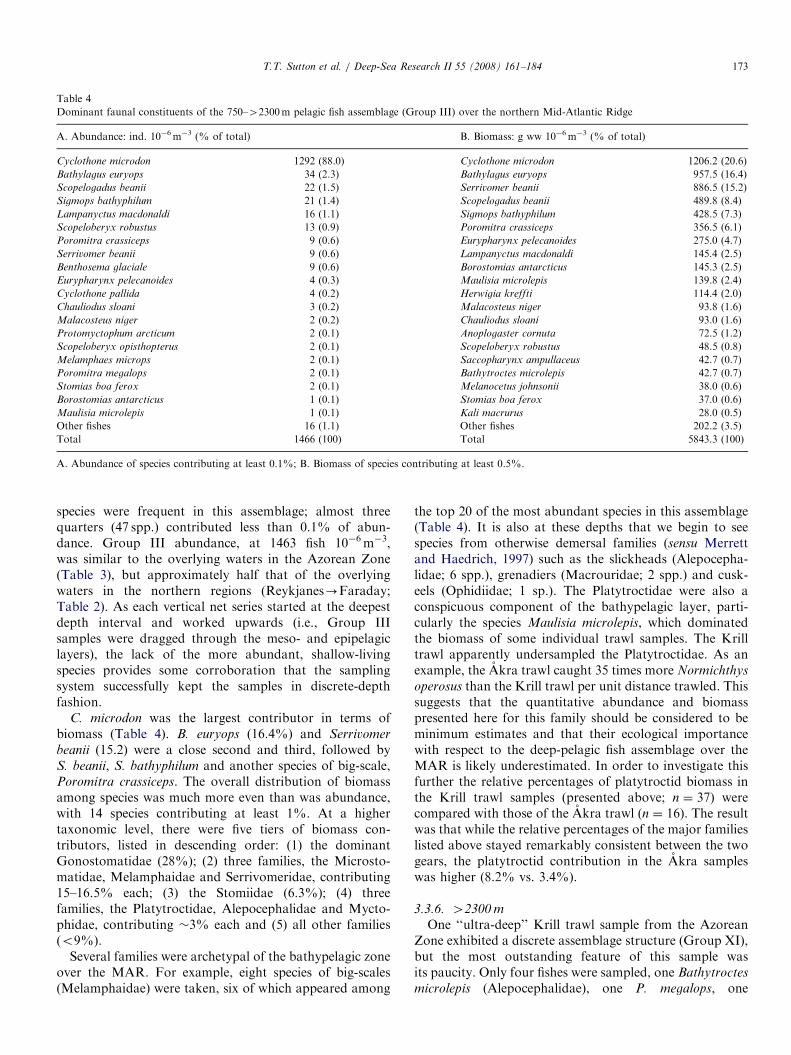
ARTICLE IN PRESS
Table 4
Dominant faunal constituents of the 750–42300m pelagic fish assemblage (Group III) over the northern Mid-Atlantic Ridge
A. Abundance: ind. 10�6m�3 (% of total) B. Biomass: g ww 10�6m�3 (% of total)
Cyclothone microdon 1292 (88.0) Cyclothone microdon 1206.2 (20.6)
Bathylagus euryops 34 (2.3) Bathylagus euryops 957.5 (16.4)
Scopelogadus beanii 22 (1.5) Serrivomer beanii 886.5 (15.2)
Sigmops bathyphilum 21 (1.4) Scopelogadus beanii 489.8 (8.4)
Lampanyctus macdonaldi 16 (1.1) Sigmops bathyphilum 428.5 (7.3)
Scopeloberyx robustus 13 (0.9) Poromitra crassiceps 356.5 (6.1)
Poromitra crassiceps 9 (0.6) Eurypharynx pelecanoides 275.0 (4.7)
Serrivomer beanii 9 (0.6) Lampanyctus macdonaldi 145.4 (2.5)
Benthosema glaciale 9 (0.6) Borostomias antarcticus 145.3 (2.5)
Eurypharynx pelecanoides 4 (0.3) Maulisia microlepis 139.8 (2.4)
Cyclothone pallida 4 (0.2) Herwigia kreffti 114.4 (2.0)
Chauliodus sloani 3 (0.2) Malacosteus niger 93.8 (1.6)
Malacosteus niger 2 (0.2) Chauliodus sloani 93.0 (1.6)
Protomyctophum arcticum 2 (0.1) Anoplogaster cornuta 72.5 (1.2)
Scopeloberyx opisthopterus 2 (0.1) Scopeloberyx robustus 48.5 (0.8)
Melamphaes microps 2 (0.1) Saccopharynx ampullaceus 42.7 (0.7)
Poromitra megalops 2 (0.1) Bathytroctes microlepis 42.7 (0.7)
Stomias boa ferox 2 (0.1) Melanocetus johnsonii 38.0 (0.6)
Borostomias antarcticus 1 (0.1) Stomias boa ferox 37.0 (0.6)
Maulisia microlepis 1 (0.1) Kali macrurus 28.0 (0.5)
Other fishes 16 (1.1) Other fishes 202.2 (3.5)
Total 1466 (100) Total 5843.3 (100)
A. Abundance of species contributing at least 0.1%; B. Biomass of species contributing at least 0.5%.
T.T. Sutton et al. / Deep-Sea Research II 55 (2008) 161–184 173
species were frequent in this assemblage; almost threequarters (47 spp.) contributed less than 0.1% of abun-dance. Group III abundance, at 1463 fish 10�6m�3,was similar to the overlying waters in the Azorean Zone(Table 3), but approximately half that of the overlyingwaters in the northern regions (Reykjanes-Faraday;Table 2). As each vertical net series started at the deepestdepth interval and worked upwards (i.e., Group IIIsamples were dragged through the meso- and epipelagiclayers), the lack of the more abundant, shallow-livingspecies provides some corroboration that the samplingsystem successfully kept the samples in discrete-depthfashion.
C. microdon was the largest contributor in terms ofbiomass (Table 4). B. euryops (16.4%) and Serrivomer
beanii (15.2) were a close second and third, followed byS. beanii, S. bathyphilum and another species of big-scale,Poromitra crassiceps. The overall distribution of biomassamong species was much more even than was abundance,with 14 species contributing at least 1%. At a highertaxonomic level, there were five tiers of biomass con-tributors, listed in descending order: (1) the dominantGonostomatidae (28%); (2) three families, the Microsto-matidae, Melamphaidae and Serrivomeridae, contributing15–16.5% each; (3) the Stomiidae (6.3%); (4) threefamilies, the Platytroctidae, Alepocephalidae and Mycto-phidae, contributing �3% each and (5) all other families(o9%).
Several families were archetypal of the bathypelagic zoneover the MAR. For example, eight species of big-scales(Melamphaidae) were taken, six of which appeared among
the top 20 of the most abundant species in this assemblage(Table 4). It is also at these depths that we begin to seespecies from otherwise demersal families (sensu Merrettand Haedrich, 1997) such as the slickheads (Alepocepha-lidae; 6 spp.), grenadiers (Macrouridae; 2 spp.) and cusk-eels (Ophidiidae; 1 sp.). The Platytroctidae were also aconspicuous component of the bathypelagic layer, parti-cularly the species Maulisia microlepis, which dominatedthe biomass of some individual trawl samples. The Krilltrawl apparently undersampled the Platytroctidae. As anexample, the Akra trawl caught 35 times more Normichthys
operosus than the Krill trawl per unit distance trawled. Thissuggests that the quantitative abundance and biomasspresented here for this family should be considered to beminimum estimates and that their ecological importancewith respect to the deep-pelagic fish assemblage over theMAR is likely underestimated. In order to investigate thisfurther the relative percentages of platytroctid biomass inthe Krill trawl samples (presented above; n ¼ 37) werecompared with those of the Akra trawl (n ¼ 16). The resultwas that while the relative percentages of the major familieslisted above stayed remarkably consistent between the twogears, the platytroctid contribution in the Akra sampleswas higher (8.2% vs. 3.4%).
3.3.6. 42300 m
One ‘‘ultra-deep’’ Krill trawl sample from the AzoreanZone exhibited a discrete assemblage structure (Group XI),but the most outstanding feature of this sample wasits paucity. Only four fishes were sampled, one Bathytroctes
microlepis (Alepocephalidae), one P. megalops, one
ARTICLE IN PRESST.T. Sutton et al. / Deep-Sea Research II 55 (2008) 161–184174
S. bathyphilum and one Lepidophanes guentheri (probably acontaminant caught on the way up). All that will be saidabout this assemblage is that it fits with the abundance andbiomass minima for this depth interval when not inproximity to the bottom (Fig. 2).
3.3.7. Near-bottom samples
Interactions between deep-pelagic fauna and near-ridgedemersal fauna (Bergstad et al., 2008) are central tounderstanding mid-ocean ridge ecosystems. Two near-bottom pelagic assemblages were unique, Groups IV andVII, both occurring in the Reykjanes Ridge Zone. Thedeeper of the two, Group IV, consisted of one Akra andtwo Krill trawl samples taken between 1500 and 2300mdepth. This assemblage had relatively low abundance (183fish 10�6m�3), but high biomass (4.7 kg ww 10�6m�3) dueto the larger fish species collected, and had an absence ofCyclothone species. By biomass the primary constituentsincluded E. pelecanoides (42%), B. euryops (27%),S. bathyphilum (17%) and the big-scale species Scopelober-
yx robustus (12%). The shallow assemblage, Group VII,was collected in a single sample taken close to theReykjanes Ridge summit between 750 and 1500m depth.This assemblage exaggerated the previous trend, with lowabundances (429 fish 10�6m�3) and high biomass (18.6 kgww 10�6m�3). This catch was at least triple the pelagic fishbiomass per unit volume caught anywhere along the cruisetrack. The primary contributor to this biomass was thesawtooth eel Serrivomer beanii, a bathypelagic fish whoseabundance and biomass peaked within the boundary layerrelative to the same depths in open water. The remainingdominant species were also high-level predators, includingB. antarcticus, C. niger and C. sloani.
Six BBL samples also clustered within Group III, thelarge pan-MAR bathypelagic fish assemblage. When allsamples of Group III were split into BBL and off-bottomtreatments, increases in density and biomass were observedwithin the BBL. Density within the BBL was nearly doublethat of the water column (2634 vs. 1352 fish 10�6m�3) andbiomass was approximately 50% higher (8.7 vs. 5.6 kg ww10�6m�3). The same species in this group (III) as in theprevious two groups (IV and VII) also peaked in densityand biomass within the BBL, but in a different order:B. euryops, Serrivomer beanii (these two contributingnearly half of the total biomass of the BBL samples),E. pelecanoides and B. antarcticus. These species, plusS. bathyphilum, S. beanii, and S. robustus, constitute agroup of bathypelagic fishes that aggregate near topo-graphic features of a mid-ocean ridge system.
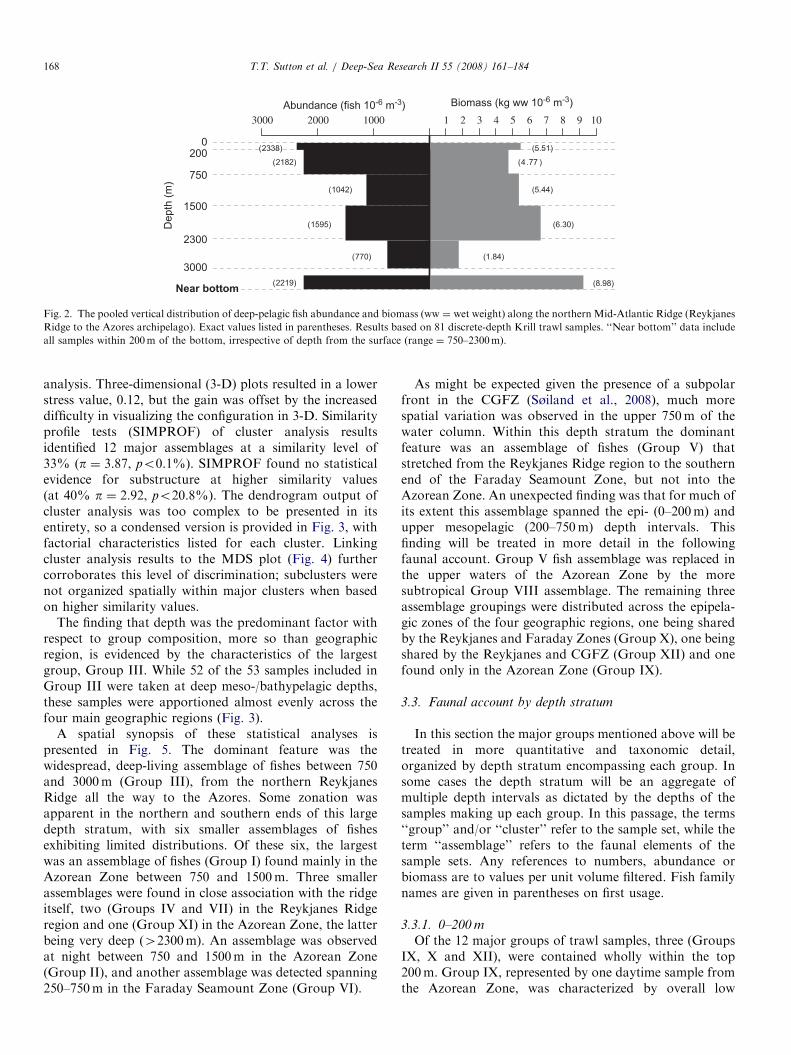
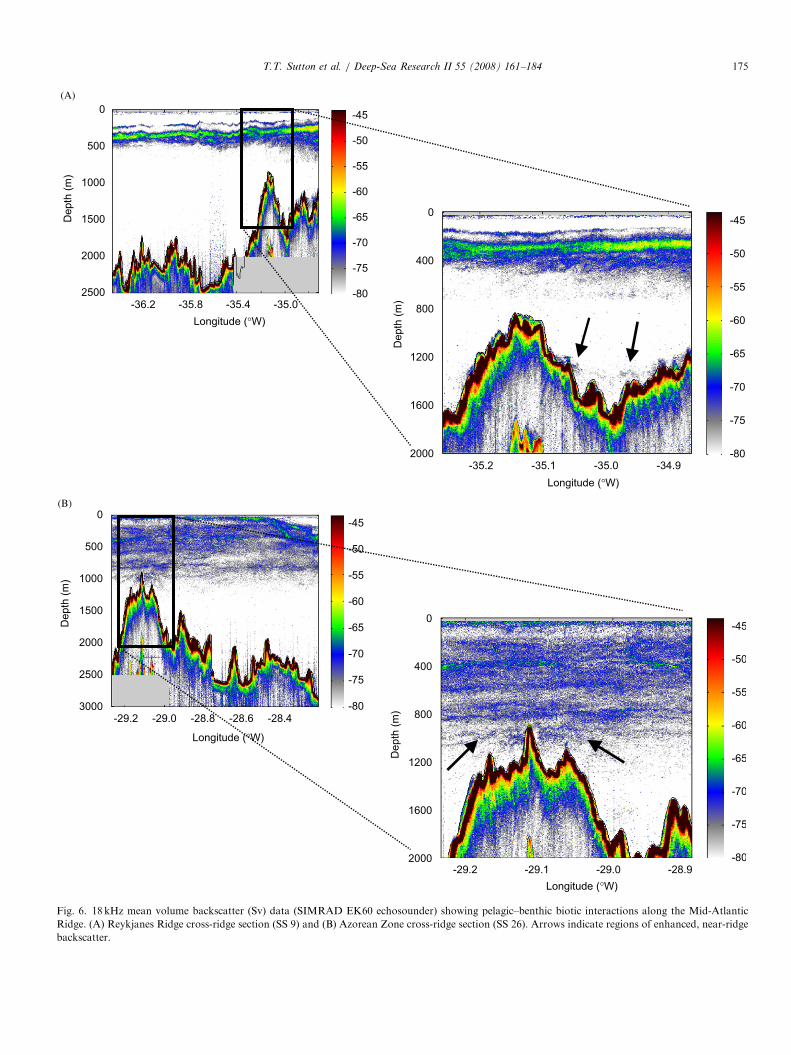
Supporting evidence of a bathypelagic faunal aggrega-tion over the MAR was observed in the acoustic datarecorded continuously during Leg 1 of the G.O. Sars cruise(Fig. 6). When the cruise track crossed the ReykjanesRidge (Fig. 6A) and the Azorean MAR (Fig. 6B) intransverse fashion, discernable biological ‘features ofinterest’ were observed 100m off the bottom near valleysand peaks. While these locations were not trawled, we
suggest that backscatter from these regions may haveoriginated from assemblages of bathypelagic fishes. Thesebackscatter patterns were similar to other signals from themesopelagic deep scattering layer (DSL) and the trawl-derived densities of fishes in the mesopelagic stratum weresimilar to those of the near-bottom layer. The DSL is notlimited to fish taxa, so the observed near-bottom aggrega-tions could be composed of demersal fishes or inverte-brates. Some large demersal fish species were caught in thepelagic gear, the larger of which (Akra) was twice themouth size of the demersal trawl, suggesting that if denseconcentrations of demersal fishes were aggregating in thewater column, it is likely that they would have beensampled by the pelagic gear. The corollary, pelagic fishesbeing caught in bottom trawls, was the case; Bergstad et al.(2008) excluded as much as 60% of individual bottomtrawl samples as pelagic fish ‘contaminants’ prior to theiranalyses. While these specimens could have been caughtduring retrieval and/or deployment of the bottom trawl,the high numbers taken relative to fishing effort comparedto numbers from pelagic trawls suggest that these fisheswere captured during bottom trawling. Higher densities ofinvertebrates near the bottom relative to open water arenot mutually exclusive of elevated vertebrate densities, asdense aggregations of invertebrate prey may be attractingvertebrate predators. These acoustic data provide corollaryevidence supporting the trawl-based discrimination of anassemblage of bathypelagic fishes that aggregates over amid-ocean ridge system.
3.3.8. Faunal account by depth zone: summary
In order to reduce the complexity of these results withrespect to biodiversity and faunal composition, a briefsummary is presented here. Few assemblages were foundwholly within the epipelagic zone, and of these only fourspecies were abundant (a pipefish in the Reykjanes Ridgeregion and three shallow mesopelagic fishes near theAzores). Two large, vertically migrating mesopelagicassemblages were found: (1) a northern (60–451N), low-diversity, high-abundance assemblage dominated by threelanternfishes (B. glaciale, P. arcticum and M. punctatum), adragonfish (C. sloani), a pearlside (M. muelleri) and abristlemouth (C. microdon) and (2) a southern (Azorean)assemblage of high diversity (29 lanternfishes alone; 19‘‘dominant’’ species) and low abundance (half that ofnorthern assemblage). Two discrete deep-meso/upper-bathypelagic assemblages were found near the Azores,with C. microdon, the loosejaw dragonfish (M. niger), andthree large melamphaid species (S. beanii, S. robustus andP. megalops) the dominant fishes. The bathypelagic zonewas characterized by the presence of a single, large (half ofall trawl samples) assemblage spanning the entire northernMAR. This assemblage was dominated numerically byC. microdon, while the main biomass contributors wereC. microdon, the deep-sea smelt (B. euryops), the sawtootheel (S. beanii), two melamphaids (S. robustus andP. crassiceps) and a tubeshoulder (M. microlepis). The
ARTICLE IN PRESS
0
400
1200
1600
2000
800
-45
-50
-55
-60
-65
-70
-75
-80-28.9-29.0-29.1-29.2
Longitude (°W)
Depth
(m
)
0
500
1500
2000
2500
1000
-45
-50
-55
-60
-65
-70
-75
-80-28.6-28.8-29.0-29.2
Longitude (°W)
Depth
(m
)
3000-28.4
0
400
1200
1600
2000
800
-45
-50
-55
-60
-65
-70
-75
-80-34.9-35.0-35.1-35.2
Longitude (°W)
Depth
(m
)
0
500
1500
2000
2500
1000
-45
-50
-55
-60
-65
-70
-75
-80-35.0-35.4-35.8-36.2
Longitude (°W)
Depth
(m
)
Fig. 6. 18 kHz mean volume backscatter (Sv) data (SIMRAD EK60 echosounder) showing pelagic–benthic biotic interactions along the Mid-Atlantic
Ridge. (A) Reykjanes Ridge cross-ridge section (SS 9) and (B) Azorean Zone cross-ridge section (SS 26). Arrows indicate regions of enhanced, near-ridge
backscatter.
T.T. Sutton et al. / Deep-Sea Research II 55 (2008) 161–184 175
ARTICLE IN PRESST.T. Sutton et al. / Deep-Sea Research II 55 (2008) 161–184176
BBL over the ridge itself (variable depths between 750 and2300m) exhibited low diversity (seven main species) butcontained the highest numbers and biomass per volumefor the entire water column over the MAR. Putativebathypelagic aggregators near the ridge itself includeB. euryops, S. beanii, Serrivomer beanii, E. pelecanoides,B. antarcticus, S. bathyphilum and S. robustus.
4. Discussion
In this paper, we have described and quantified theassemblage structure and vertical distribution of the deep-pelagic fishes occurring over a mid-ocean ridge system,broken down into discrete assemblages. As a detailedbiogeographic account will appear elsewhere, here we focusour discussion on the major depth-related patterns andhow these relate to a mid-ocean ridge ecosystem as a whole.
4.1. Faunal structure with depth
The overall vertical distributions for most of the dominantfishes taken during this survey have been reported in theliterature, and the records from this survey generally fit thereported patterns. In the 0–200m stratum the dominantfishes were M. muelleri, a species often taken in largenumbers in shallow waters (Bergstad, 1990; Quero et al.,1990a), and the pipefish E. aequoreus, whose occasionalpresence in the oceanic Mid-Atlantic had previously beenreported (Dawson, 1986), but whose oceanic verticaldistribution is reported for the first time here.
The 0–750m depth stratum is largely the realm of thevertically migrating Myctophidae, and samples overthe MAR were generally dominated numerically either byB. glaciale, with a known distribution of 100–850m in theNorth Atlantic (Halliday, 1970; Craddock et al., 2002; butoccasionally 41000m south of 401N; Angel, 1993), orL. doefleini, recorded in the upper 600m (Karnella, 1987).Other important myctophid species above 750m along theMAR included Protomyctophum arcticum (80–850m;Hulley, 1984) and Myctophum punctatum (0–750m; Crad-dock et al., 2002). One unusual finding of this study was theoccurrence of C. microdon in 9 of 20 0–200-m trawlsamples, often in large numbers. This species has beenreported as shallow as 300m in the Southern Ocean(Lancraft et al., 1989), but is usually found well below500m (Backus et al., 1969; Badcock, 1984; Quero et al.,1990b). We are not aware of any records of this speciesabove 200m (J. Craddock, A. Harold, pers. comm.). Eitherthis represents a new vertical range extension for thespecies, or the multiple cod-end system used in thissurvey was prone to selective contamination by this species.As for the latter, contamination can be a problemwith multiple cod-end samplers (Pearcy, 1983). Fishspecimens can become entangled in the fore-net in onedepth level and then wash down to the cod-end whilefishing at another level. The presence of other surfacespecies (e.g., E. aequoreus) suggested that these particular
net tows fished properly within the 0–200m stratum. Thepossibility that C. microdon was retained by the deeper netsand released in the shallow net also seems unlikely, as thecatch numbers for the 0–200m nets were often quite higherthan the net below (200–750m). Some degree of contam-ination was seen with other deep-living species (e.g.,M. niger, S. bathyphilum), but these were usually one- ortwo-fish occurrences. Additionally, all recorded datapertaining to the shallow net samples in which C. microdon
was caught were examined, and this revealed no data entryor other human errors. Thus, the occurrence of this fish inthe upper 200m does not appear to be artifactual, andrepresents another indication that the abundance anddistribution of deep-pelagic fishes over the MAR differsfrom the ‘typical’ open ocean patterns.Many of the dominant deep-mesopelagic fishes of the
North Atlantic exhibited distributions well into the bath-ypelagic zone (41500m) over the MAR. The depth rangesfor L. macdonaldi, previously known to 1000m (Hulley,1984), and C. sloani, known from 50 to 1800m (Gibbs,1984; Sutton and Hopkins, 1996) are extended downwards,as they were routinely taken between 1500 and 2300m overthe MAR. With the exception of M. niger, a non-migratorwith maximum abundances between 700 and 900m(Sutton, 2003), the remaining dominant lower meso- andbathypelagic species occupy a wide range of depths. In theNorth Atlantic, C. microdon has been found primarilybetween 800 and 2700m (Badcock, 1984), S. bathyphilum
between 700 and 3000m (Badcock, 1984), E. pelecanoides
between 500 and 7500m (Nielsen and Bertelsen, 1990),S. beanii between 800 and 2500m (Mauchline and Gordon,1984; Maul, 1990), and B. euryops between 500 and 3000m(Mauchline and Gordon, 1983; Cohen, 1984). Largerindividuals of the latter two species have been reportedas catches in demersal trawls in the Rockall Trough(Mauchline and Gordon, 1983, 1984), suggesting abenthopelagic affinity that results of this study confirmfor the latter four species.In the only semi-quantitative study of deep-pelagic fishes
over the MAR prior to this one, Fock et al. (2004)examined a series of 250–3200m samples taken during a1982 cruise in a frontal gradient area just south of theCGFZ (45–501N). While the focus of this study wasprimarily biogeographic and the trawling gear andsampling strategy differed (they used a larger mesh andno opening/closing device), some parallels to this study canbe drawn. Using similar statistical methods, Fock et al.(2004) discriminated six clusters of species groups. Evenwithout Cyclothone, which was excluded from theiranalysis, the Gonostomatidae (primarily S. bathyphilum)dominated net catches at bathypelagic depths. The authorsalso found increased relative abundances of the Stomiidae,Melamphaidae, Serrivomeridae and Eurypharyngidae overthe ridge, the same near-ridge dominants reported in thisstudy. Direct comparisons with their values are notpossible given their catch standardization (no. fish h�1
towing). In a complementary analysis of the vertical
ARTICLE IN PRESST.T. Sutton et al. / Deep-Sea Research II 55 (2008) 161–184 177
distribution of the gulper eel Saccopharynx ampullaceus
(Saccopharyngidae), Fock et al. (2004) found that theminimum depth of occurrence of this species rose from2550m over the Porcupine Abyssal Plain to 1000m overthe MAR, a finding similar to our observation of reducedminimum depth of occurrence of C. microdon. Theyconcluded that special features of the MAR environmentlikely cause changes in the ecological structure of the fishassemblage. Our study differed from that of Fock et al.(2004) in that they found that surface features (i.e.,chlorophyll, temperature, salinity) affected the composi-tion of the lower meso- and bathypelagic fish assemblages,whereas we found assemblages below 750m to beremarkably consistent from north to south, with somedifferentiation near particularly shallow ridge regions(Reykjanes Ridge and near the Azores). Perhaps theprimary difference was the impact of C. microdon in ourstudy, which had the overall effect of uniting the deepestpelagic strata by its abundance, even after severe datatransformation. Differences notwithstanding, the parallelsbetween their more localized study with different methodsand the one presented here are notable.
4.2. Biomass as a function of depth
Oceanic ecosystems ultimately rely on near-surface pri-mary production for fuel, with the possible exception ofhighly localized chemosynthetic communities. The primaryconsequence for the deep-pelagic fauna is a decrease in foodsupply with depth as a function of an increasing separationfrom the euphotic zone. Over the MAR this effect is evidentin the decline in fish abundance below 200m, except for thenear-bottom (BBL) assemblage. In open ocean ecosystemsdeep-pelagic zooplankton and micronekton biomass hasbeen shown to decrease exponentially with depth (Angel andBaker, 1982; Angel and Boxshall, 1990), up to within�100mof the bottom. In this near-bottom layer an elevated biomassof zooplankton (Wishner, 1980a–c; Angel and Baker, 1982;Wishner and Gowing, 1987; Childress et al., 1989) andnekton (Angel and Baker, 1982; Hargreaves, 1984, 1985;Domanski, 1986) has been reported. Our data show asomewhat different vertical distribution of deep-pelagic fishbiomass, with a midwater maximum between 1500 and2300m, a sharp decline below 2300m, and then a dramaticincrease in the BBL. In a recent study utilizing mannedsubmersible (‘‘Mir-1’’) observations in the near-bottom layerover the CGFZ, Vinogradov (2005) reported elevatedabundances of macroplankton, particularly larvaceans, with-in 150m of the seafloor. It is difficult to compare results ofdifferent studies using different gears, but if we accept thesizable body of literature that demonstrates the exponentialdecline in biomass with depth, and if we accept the accuracyof the data presented here, then it is reasonable to supportthe supposition that the deep-pelagic ecosystem over thenorthernMAR differs in structure from that of ‘typical’ openocean regimes, at least with respect to fishes, but probablyalso other taxa. Furthermore, the multivariate statistical
results presented here suggest that this pattern is consistentalong much of the ridge rather than being an isolatedphenomenon.
4.2.1. Increased bathypelagic biomass over the MAR
Mid-ocean ridges differ markedly from continentalslopes in: (1) the lack of terrigenous organic input and(2) the depths at which deep-pelagic nekton impinge uponthe topography. The lack of terrigenous sedimentationsuggests that water column-derived energy sources primar-ily drive the ridge ecosystems. One such energy source isthe pelagic biota (Vinogradov, 1968; Angel, 1985; Long-hurst and Harrison, 1989). Most of what we know aboutdeep-pelagic/deep-demersal trophic interactions is basedon studies of the continental slopes, and to a lesser extentthe abyssal plains. Such studies have revealed importantconnections between the demersal fauna and their pelagicprey (Marshall and Merrett, 1977; Merrett, 1986; Roeet al., 1990; Bergstad, 1991; Gordon, 2001). In a study onthe slopes of the Rockall Trough, Mauchline and Gordon(1991) found that the depth and biomass distributions ofbenthopelagic fishes corresponded to the daytime depths oftheir vertically migrating mesopelagic prey. Haedrich andMerrett (1992) gave further evidence of the dependence ofdeep-demersal slope fishes on mesopelagic prey; 35% of thedemersal species in the Porcupine Seabight fed on pelagicprey, 52% on mixed pelagic/benthic prey, while only 13%were reliant on benthic food. These studies show theimportance of deep-pelagic prey to deep-demersal commu-nities. A second major difference between mid-ocean ridgesystems and continental slopes is depth—for most of itsextent only a small area of the mid-ocean ridges isshallower than 1000m. Even when the summit of theMAR penetrates the 1000m isobath, the bulk ofthe vertically migrating mesopelagic fauna is well abovethis depth (Fig. 6). Therefore, the primary pelagic preyresource of the near-ridge demersal fauna appears to be thebathypelagic component of the deep-pelagic fauna. Thefindings presented here of increased bathypelagic fishbiomass relative to the ‘typical’ biomass/depth profilesreported over abyssal ecosystems take on added signifi-cance. Bergstad et al. (2008) found that abundance andbiomass of demersal fishes over the MAR were highest atstations at or near the summit of the ridge. These depthscorrespond to the depth stratum of maximal deep-pelagicfish biomass (1500–2300m) reported here. The dominantcomponents of this biomass maximum, the Melamphaidae,Microstomatidae, Platytroctidae, Stomiidae, and Serrivo-meridae, are known prey of the dominant biomasscomponents of the demersal nekton (Pereyra et al., 1969;Haedrich and Henderson, 1974; Pearcy and Ambler, 1974;Sedberry and Musick, 1978; Clarke, 1985; Blaber andBulman, 1987; Gartner et al., 1997). Thus, lacking theterrigenous input of allochthonous organic carbon, in-creased demersal fish diversity and biomass over the MARrelative to the abyssal plains may be maintained byincreased bathypelagic food resources.
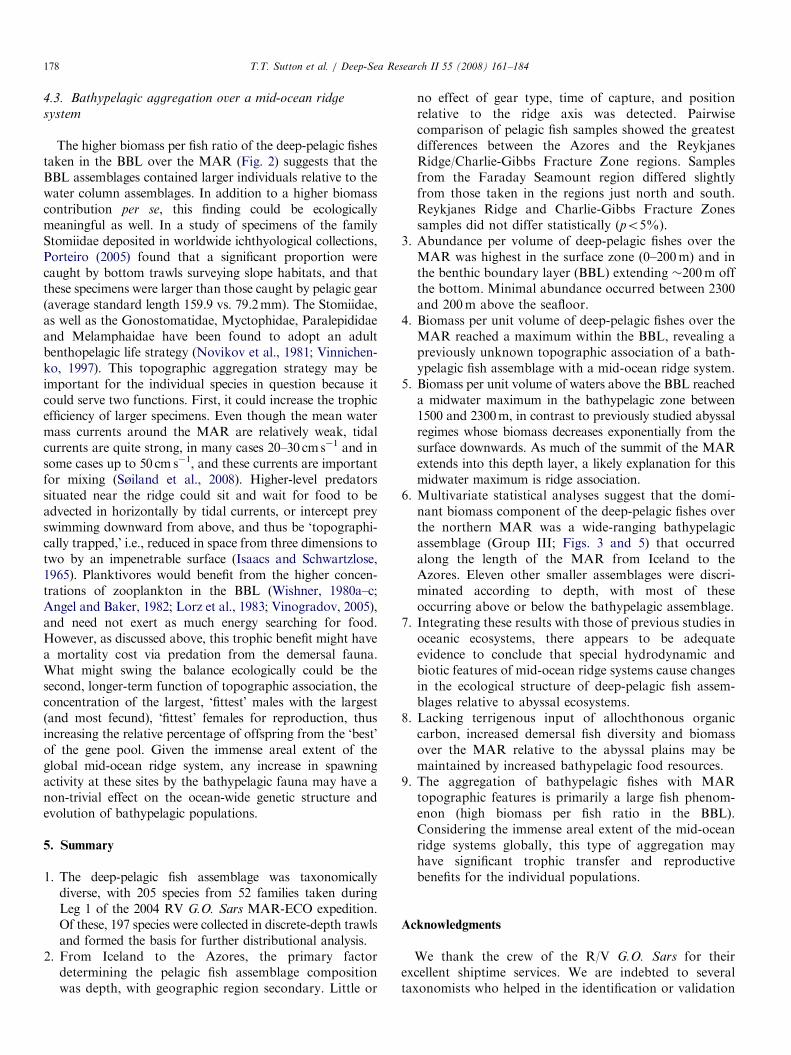
ARTICLE IN PRESST.T. Sutton et al. / Deep-Sea Research II 55 (2008) 161–184178
4.3. Bathypelagic aggregation over a mid-ocean ridge
system
The higher biomass per fish ratio of the deep-pelagic fishestaken in the BBL over the MAR (Fig. 2) suggests that theBBL assemblages contained larger individuals relative to thewater column assemblages. In addition to a higher biomasscontribution per se, this finding could be ecologicallymeaningful as well. In a study of specimens of the familyStomiidae deposited in worldwide ichthyological collections,Porteiro (2005) found that a significant proportion werecaught by bottom trawls surveying slope habitats, and thatthese specimens were larger than those caught by pelagic gear(average standard length 159.9 vs. 79.2mm). The Stomiidae,as well as the Gonostomatidae, Myctophidae, Paralepididaeand Melamphaidae have been found to adopt an adultbenthopelagic life strategy (Novikov et al., 1981; Vinnichen-ko, 1997). This topographic aggregation strategy may beimportant for the individual species in question because itcould serve two functions. First, it could increase the trophicefficiency of larger specimens. Even though the mean watermass currents around the MAR are relatively weak, tidalcurrents are quite strong, in many cases 20–30 cms�1 and insome cases up to 50 cm s�1, and these currents are importantfor mixing (Søiland et al., 2008). Higher-level predatorssituated near the ridge could sit and wait for food to beadvected in horizontally by tidal currents, or intercept preyswimming downward from above, and thus be ‘topographi-cally trapped,’ i.e., reduced in space from three dimensions totwo by an impenetrable surface (Isaacs and Schwartzlose,1965). Planktivores would benefit from the higher concen-trations of zooplankton in the BBL (Wishner, 1980a–c;Angel and Baker, 1982; Lorz et al., 1983; Vinogradov, 2005),and need not exert as much energy searching for food.However, as discussed above, this trophic benefit might havea mortality cost via predation from the demersal fauna.What might swing the balance ecologically could be thesecond, longer-term function of topographic association, theconcentration of the largest, ‘fittest’ males with the largest(and most fecund), ‘fittest’ females for reproduction, thusincreasing the relative percentage of offspring from the ‘best’of the gene pool. Given the immense areal extent of theglobal mid-ocean ridge system, any increase in spawningactivity at these sites by the bathypelagic fauna may have anon-trivial effect on the ocean-wide genetic structure andevolution of bathypelagic populations.
5. Summary
1.
The deep-pelagic fish assemblage was taxonomicallydiverse, with 205 species from 52 families taken duringLeg 1 of the 2004 RV G.O. Sars MAR-ECO expedition.Of these, 197 species were collected in discrete-depth trawlsand formed the basis for further distributional analysis.2.
From Iceland to the Azores, the primary factordetermining the pelagic fish assemblage compositionwas depth, with geographic region secondary. Little orno effect of gear type, time of capture, and positionrelative to the ridge axis was detected. Pairwisecomparison of pelagic fish samples showed the greatestdifferences between the Azores and the ReykjanesRidge/Charlie-Gibbs Fracture Zone regions. Samplesfrom the Faraday Seamount region differed slightlyfrom those taken in the regions just north and south.Reykjanes Ridge and Charlie-Gibbs Fracture Zonessamples did not differ statistically (po5%).
3.
Abundance per volume of deep-pelagic fishes over theMAR was highest in the surface zone (0–200m) and inthe benthic boundary layer (BBL) extending �200m offthe bottom. Minimal abundance occurred between 2300and 200m above the seafloor.4.
Biomass per unit volume of deep-pelagic fishes over theMAR reached a maximum within the BBL, revealing apreviously unknown topographic association of a bath-ypelagic fish assemblage with a mid-ocean ridge system.5.
Biomass per unit volume of waters above the BBL reacheda midwater maximum in the bathypelagic zone between1500 and 2300m, in contrast to previously studied abyssalregimes whose biomass decreases exponentially from thesurface downwards. As much of the summit of the MARextends into this depth layer, a likely explanation for thismidwater maximum is ridge association.6.
Multivariate statistical analyses suggest that the domi-nant biomass component of the deep-pelagic fishes overthe northern MAR was a wide-ranging bathypelagicassemblage (Group III; Figs. 3 and 5) that occurredalong the length of the MAR from Iceland to theAzores. Eleven other smaller assemblages were discri-minated according to depth, with most of theseoccurring above or below the bathypelagic assemblage.7.
Integrating these results with those of previous studies inoceanic ecosystems, there appears to be adequateevidence to conclude that special hydrodynamic andbiotic features of mid-ocean ridge systems cause changesin the ecological structure of deep-pelagic fish assem-blages relative to abyssal ecosystems.8.
Lacking terrigenous input of allochthonous organiccarbon, increased demersal fish diversity and biomassover the MAR relative to the abyssal plains may bemaintained by increased bathypelagic food resources.9.
The aggregation of bathypelagic fishes with MARtopographic features is primarily a large fish phenom-enon (high biomass per fish ratio in the BBL).Considering the immense areal extent of the mid-oceanridge systems globally, this type of aggregation mayhave significant trophic transfer and reproductivebenefits for the individual populations.Acknowledgments
We thank the crew of the R/V G.O. Sars for theirexcellent shiptime services. We are indebted to severaltaxonomists who helped in the identification or validation
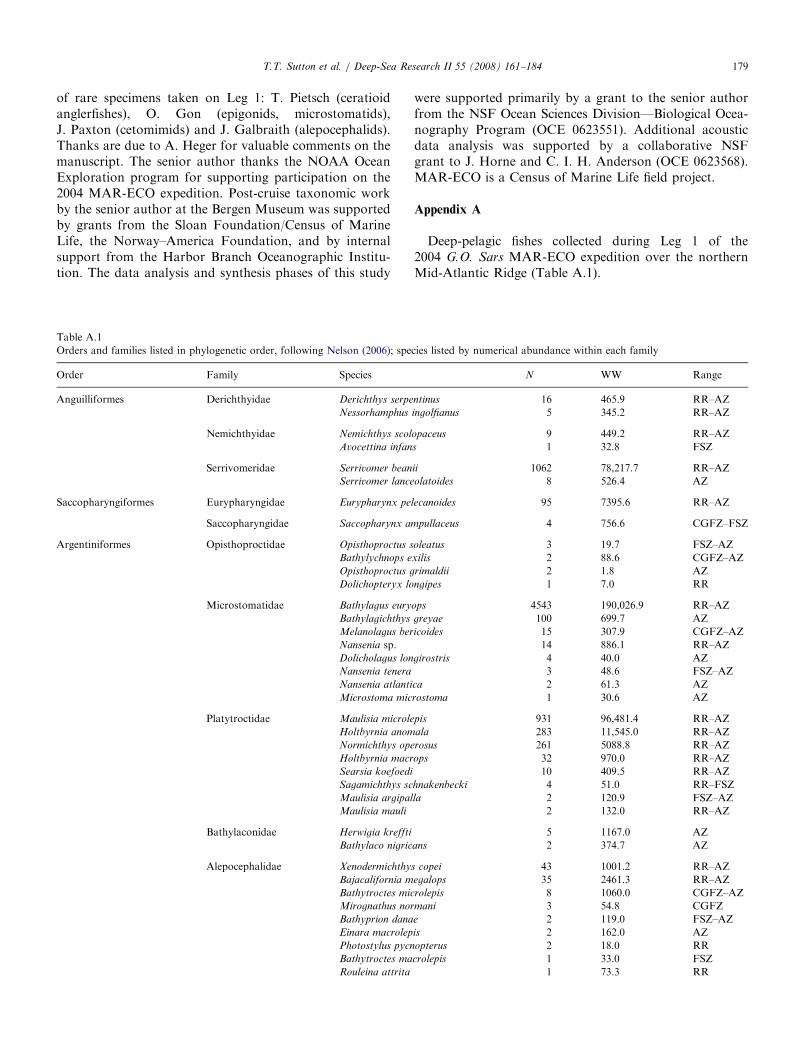
ARTICLE IN PRESST.T. Sutton et al. / Deep-Sea Research II 55 (2008) 161–184 179
of rare specimens taken on Leg 1: T. Pietsch (ceratioidanglerfishes), O. Gon (epigonids, microstomatids),J. Paxton (cetomimids) and J. Galbraith (alepocephalids).Thanks are due to A. Heger for valuable comments on themanuscript. The senior author thanks the NOAA OceanExploration program for supporting participation on the2004 MAR-ECO expedition. Post-cruise taxonomic workby the senior author at the Bergen Museum was supportedby grants from the Sloan Foundation/Census of MarineLife, the Norway–America Foundation, and by internalsupport from the Harbor Branch Oceanographic Institu-tion. The data analysis and synthesis phases of this study
Table A.1
Orders and families listed in phylogenetic order, following Nelson (2006); spe
Order Family Species
Anguilliformes Derichthyidae Derichthys serpe
Nessorhamphus
Nemichthyidae Nemichthys scol
Avocettina infan
Serrivomeridae Serrivomer bean
Serrivomer lance
Saccopharyngiformes Eurypharyngidae Eurypharynx pel
Saccopharyngidae Saccopharynx am
Argentiniformes Opisthoproctidae Opisthoproctus s
Bathylychnops e
Opisthoproctus g
Dolichopteryx lo
Microstomatidae Bathylagus eury
Bathylagichthys
Melanolagus ber
Nansenia sp.
Dolicholagus lon
Nansenia tenera
Nansenia atlanti
Microstoma mic
Platytroctidae Maulisia microle
Holtbyrnia anom
Normichthys ope
Holtbyrnia macr
Searsia koefoedi
Sagamichthys sc
Maulisia argipal
Maulisia mauli
Bathylaconidae Herwigia kreffti
Bathylaco nigric
Alepocephalidae Xenodermichthy
Bajacalifornia m
Bathytroctes mic
Mirognathus nor
Bathyprion dana
Einara macrolep
Photostylus pycn
Bathytroctes ma
Rouleina attrita
were supported primarily by a grant to the senior authorfrom the NSF Ocean Sciences Division—Biological Ocea-nography Program (OCE 0623551). Additional acousticdata analysis was supported by a collaborative NSFgrant to J. Horne and C. I. H. Anderson (OCE 0623568).MAR-ECO is a Census of Marine Life field project.
Appendix A
Deep-pelagic fishes collected during Leg 1 of the2004 G.O. Sars MAR-ECO expedition over the northernMid-Atlantic Ridge (Table A.1).
cies listed by numerical abundance within each family
N WW Range
ntinus 16 465.9 RR–AZ
ingolfianus 5 345.2 RR–AZ
opaceus 9 449.2 RR–AZ
s 1 32.8 FSZ
ii 1062 78,217.7 RR–AZ
olatoides 8 526.4 AZ
ecanoides 95 7395.6 RR–AZ
pullaceus 4 756.6 CGFZ–FSZ
oleatus 3 19.7 FSZ–AZ
xilis 2 88.6 CGFZ–AZ
rimaldii 2 1.8 AZ
ngipes 1 7.0 RR
ops 4543 190,026.9 RR–AZ
greyae 100 699.7 AZ
icoides 15 307.9 CGFZ–AZ
14 886.1 RR–AZ
girostris 4 40.0 AZ
3 48.6 FSZ–AZ
ca 2 61.3 AZ
rostoma 1 30.6 AZ
pis 931 96,481.4 RR–AZ
ala 283 11,545.0 RR–AZ
rosus 261 5088.8 RR–AZ
ops 32 970.0 RR–AZ
10 409.5 RR–AZ
hnakenbecki 4 51.0 RR–FSZ
la 2 120.9 FSZ–AZ
2 132.0 RR–AZ
5 1167.0 AZ
ans 2 374.7 AZ
s copei 43 1001.2 RR–AZ
egalops 35 2461.3 RR–AZ
rolepis 8 1060.0 CGFZ–AZ
mani 3 54.8 CGFZ
e 2 119.0 FSZ–AZ
is 2 162.0 AZ
opterus 2 18.0 RR
crolepis 1 33.0 FSZ
1 73.3 RR
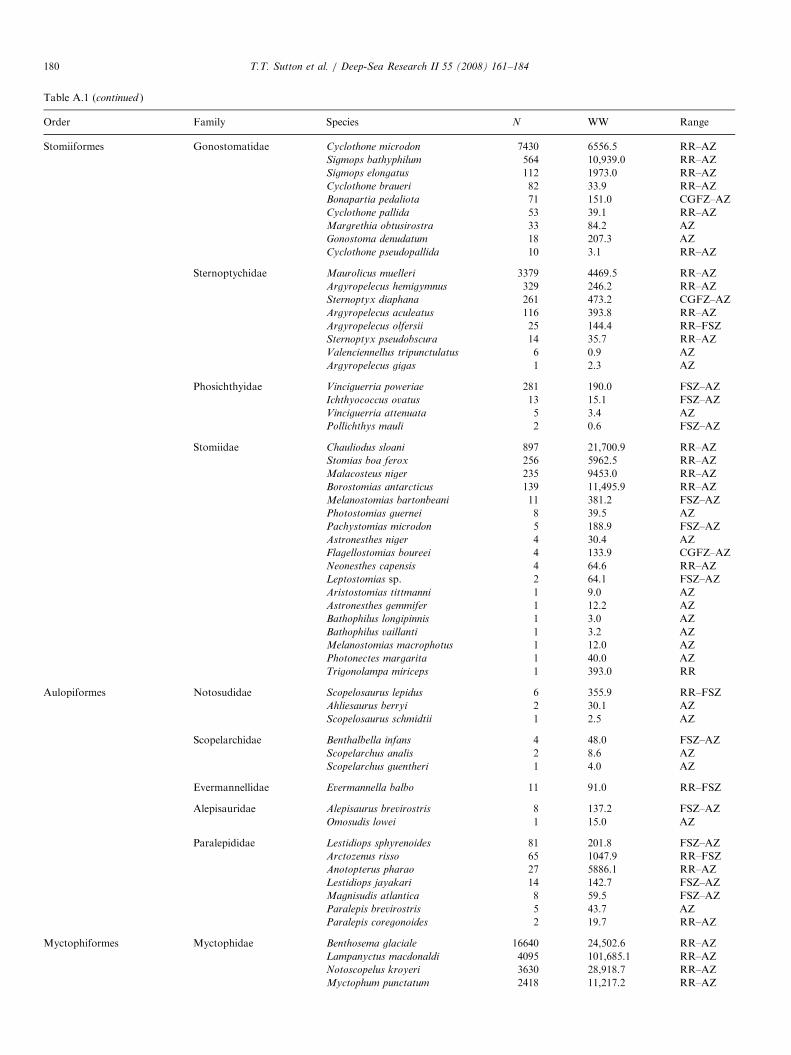
ARTICLE IN PRESS
Table A.1 (continued )
Order Family Species N WW Range
Stomiiformes Gonostomatidae Cyclothone microdon 7430 6556.5 RR–AZ
Sigmops bathyphilum 564 10,939.0 RR–AZ
Sigmops elongatus 112 1973.0 RR–AZ
Cyclothone braueri 82 33.9 RR–AZ
Bonapartia pedaliota 71 151.0 CGFZ–AZ
Cyclothone pallida 53 39.1 RR–AZ
Margrethia obtusirostra 33 84.2 AZ
Gonostoma denudatum 18 207.3 AZ
Cyclothone pseudopallida 10 3.1 RR–AZ
Sternoptychidae Maurolicus muelleri 3379 4469.5 RR–AZ
Argyropelecus hemigymnus 329 246.2 RR–AZ
Sternoptyx diaphana 261 473.2 CGFZ–AZ
Argyropelecus aculeatus 116 393.8 RR–AZ
Argyropelecus olfersii 25 144.4 RR–FSZ
Sternoptyx pseudobscura 14 35.7 RR–AZ
Valenciennellus tripunctulatus 6 0.9 AZ
Argyropelecus gigas 1 2.3 AZ
Phosichthyidae Vinciguerria poweriae 281 190.0 FSZ–AZ
Ichthyococcus ovatus 13 15.1 FSZ–AZ
Vinciguerria attenuata 5 3.4 AZ
Pollichthys mauli 2 0.6 FSZ–AZ
Stomiidae Chauliodus sloani 897 21,700.9 RR–AZ
Stomias boa ferox 256 5962.5 RR–AZ
Malacosteus niger 235 9453.0 RR–AZ
Borostomias antarcticus 139 11,495.9 RR–AZ
Melanostomias bartonbeani 11 381.2 FSZ–AZ
Photostomias guernei 8 39.5 AZ
Pachystomias microdon 5 188.9 FSZ–AZ
Astronesthes niger 4 30.4 AZ
Flagellostomias boureei 4 133.9 CGFZ–AZ
Neonesthes capensis 4 64.6 RR–AZ
Leptostomias sp. 2 64.1 FSZ–AZ
Aristostomias tittmanni 1 9.0 AZ
Astronesthes gemmifer 1 12.2 AZ
Bathophilus longipinnis 1 3.0 AZ
Bathophilus vaillanti 1 3.2 AZ
Melanostomias macrophotus 1 12.0 AZ
Photonectes margarita 1 40.0 AZ
Trigonolampa miriceps 1 393.0 RR
Aulopiformes Notosudidae Scopelosaurus lepidus 6 355.9 RR–FSZ
Ahliesaurus berryi 2 30.1 AZ
Scopelosaurus schmidtii 1 2.5 AZ
Scopelarchidae Benthalbella infans 4 48.0 FSZ–AZ
Scopelarchus analis 2 8.6 AZ
Scopelarchus guentheri 1 4.0 AZ
Evermannellidae Evermannella balbo 11 91.0 RR–FSZ
Alepisauridae Alepisaurus brevirostris 8 137.2 FSZ–AZ
Omosudis lowei 1 15.0 AZ
Paralepididae Lestidiops sphyrenoides 81 201.8 FSZ–AZ
Arctozenus risso 65 1047.9 RR–FSZ
Anotopterus pharao 27 5886.1 RR–AZ
Lestidiops jayakari 14 142.7 FSZ–AZ
Magnisudis atlantica 8 59.5 FSZ–AZ
Paralepis brevirostris 5 43.7 AZ
Paralepis coregonoides 2 19.7 RR–AZ
Myctophiformes Myctophidae Benthosema glaciale 16640 24,502.6 RR–AZ
Lampanyctus macdonaldi 4095 101,685.1 RR–AZ
Notoscopelus kroyeri 3630 28,918.7 RR–AZ
Myctophum punctatum 2418 11,217.2 RR–AZ
T.T. Sutton et al. / Deep-Sea Research II 55 (2008) 161–184180
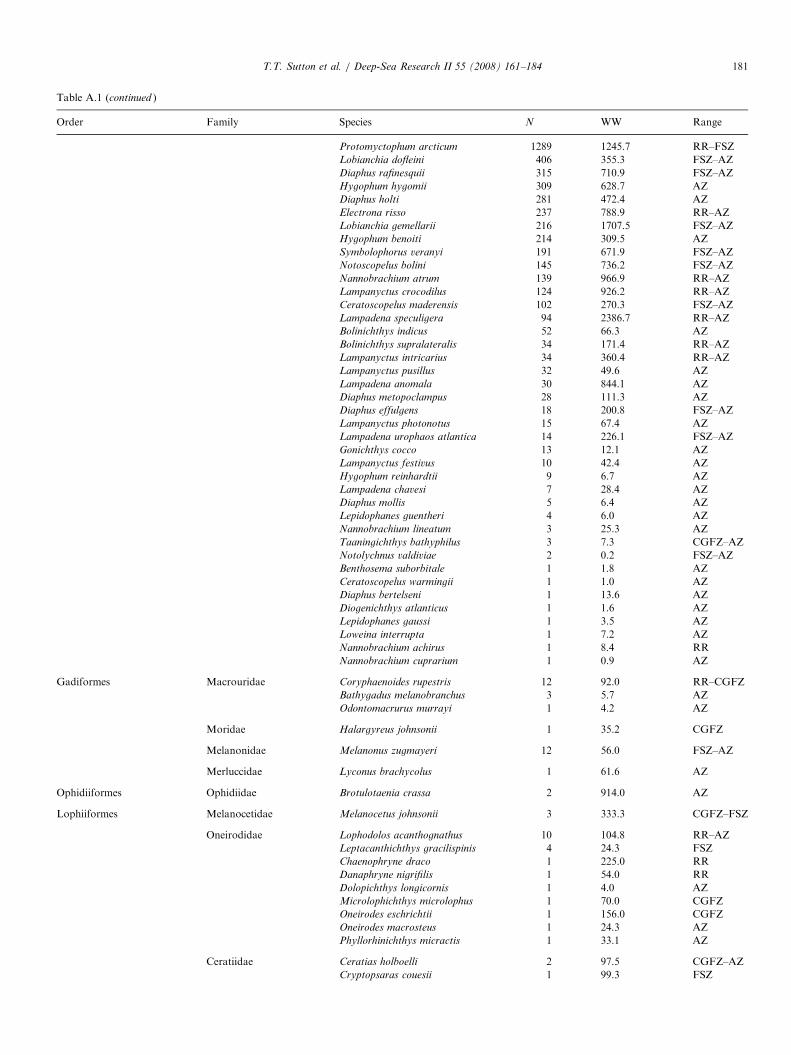
ARTICLE IN PRESS
Table A.1 (continued )
Order Family Species N WW Range
Protomyctophum arcticum 1289 1245.7 RR–FSZ
Lobianchia dofleini 406 355.3 FSZ–AZ
Diaphus rafinesquii 315 710.9 FSZ–AZ
Hygophum hygomii 309 628.7 AZ
Diaphus holti 281 472.4 AZ
Electrona risso 237 788.9 RR–AZ
Lobianchia gemellarii 216 1707.5 FSZ–AZ
Hygophum benoiti 214 309.5 AZ
Symbolophorus veranyi 191 671.9 FSZ–AZ
Notoscopelus bolini 145 736.2 FSZ–AZ
Nannobrachium atrum 139 966.9 RR–AZ
Lampanyctus crocodilus 124 926.2 RR–AZ
Ceratoscopelus maderensis 102 270.3 FSZ–AZ
Lampadena speculigera 94 2386.7 RR–AZ
Bolinichthys indicus 52 66.3 AZ
Bolinichthys supralateralis 34 171.4 RR–AZ
Lampanyctus intricarius 34 360.4 RR–AZ
Lampanyctus pusillus 32 49.6 AZ
Lampadena anomala 30 844.1 AZ
Diaphus metopoclampus 28 111.3 AZ
Diaphus effulgens 18 200.8 FSZ–AZ
Lampanyctus photonotus 15 67.4 AZ
Lampadena urophaos atlantica 14 226.1 FSZ–AZ
Gonichthys cocco 13 12.1 AZ
Lampanyctus festivus 10 42.4 AZ
Hygophum reinhardtii 9 6.7 AZ
Lampadena chavesi 7 28.4 AZ
Diaphus mollis 5 6.4 AZ
Lepidophanes guentheri 4 6.0 AZ
Nannobrachium lineatum 3 25.3 AZ
Taaningichthys bathyphilus 3 7.3 CGFZ–AZ
Notolychnus valdiviae 2 0.2 FSZ–AZ
Benthosema suborbitale 1 1.8 AZ
Ceratoscopelus warmingii 1 1.0 AZ
Diaphus bertelseni 1 13.6 AZ
Diogenichthys atlanticus 1 1.6 AZ
Lepidophanes gaussi 1 3.5 AZ
Loweina interrupta 1 7.2 AZ
Nannobrachium achirus 1 8.4 RR
Nannobrachium cuprarium 1 0.9 AZ
Gadiformes Macrouridae Coryphaenoides rupestris 12 92.0 RR–CGFZ
Bathygadus melanobranchus 3 5.7 AZ
Odontomacrurus murrayi 1 4.2 AZ
Moridae Halargyreus johnsonii 1 35.2 CGFZ
Melanonidae Melanonus zugmayeri 12 56.0 FSZ–AZ
Merluccidae Lyconus brachycolus 1 61.6 AZ
Ophidiiformes Ophidiidae Brotulotaenia crassa 2 914.0 AZ
Lophiiformes Melanocetidae Melanocetus johnsonii 3 333.3 CGFZ–FSZ
Oneirodidae Lophodolos acanthognathus 10 104.8 RR–AZ
Leptacanthichthys gracilispinis 4 24.3 FSZ
Chaenophryne draco 1 225.0 RR
Danaphryne nigrifilis 1 54.0 RR
Dolopichthys longicornis 1 4.0 AZ
Microlophichthys microlophus 1 70.0 CGFZ
Oneirodes eschrichtii 1 156.0 CGFZ
Oneirodes macrosteus 1 24.3 AZ
Phyllorhinichthys micractis 1 33.1 AZ
Ceratiidae Ceratias holboelli 2 97.5 CGFZ–AZ
Cryptopsaras couesii 1 99.3 FSZ
T.T. Sutton et al. / Deep-Sea Research II 55 (2008) 161–184 181
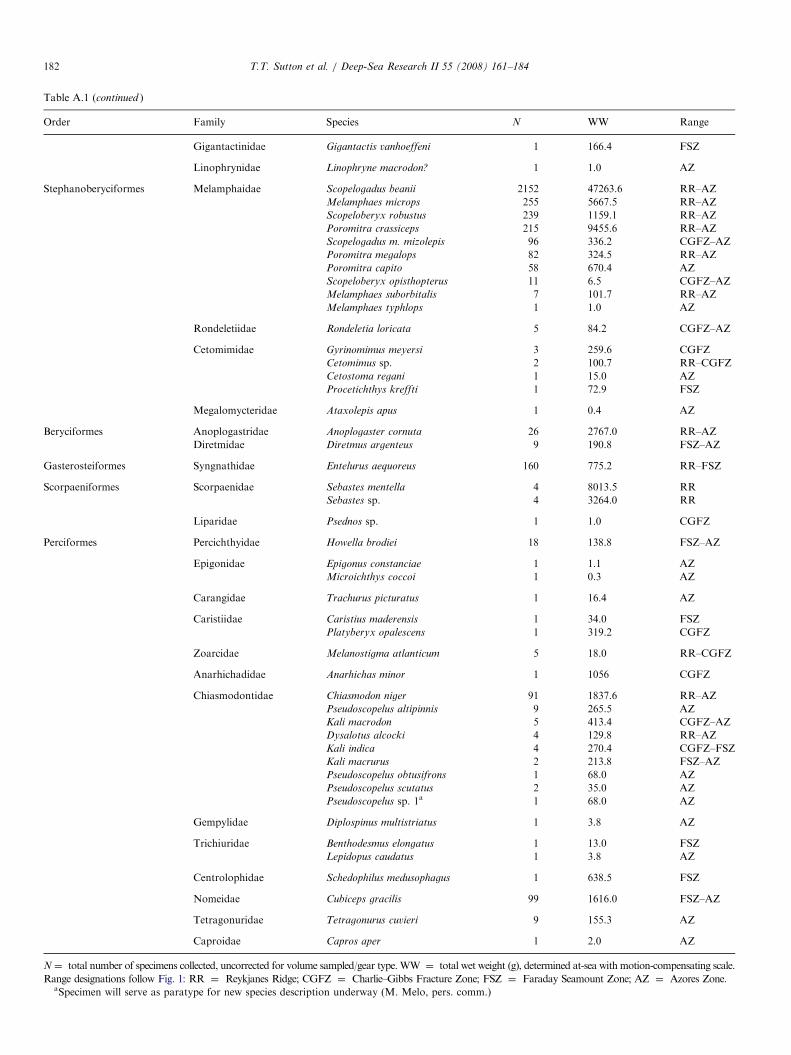
ARTICLE IN PRESS
Table A.1 (continued )
Order Family Species N WW Range
Gigantactinidae Gigantactis vanhoeffeni 1 166.4 FSZ
Linophrynidae Linophryne macrodon? 1 1.0 AZ
Stephanoberyciformes Melamphaidae Scopelogadus beanii 2152 47263.6 RR–AZ
Melamphaes microps 255 5667.5 RR–AZ
Scopeloberyx robustus 239 1159.1 RR–AZ
Poromitra crassiceps 215 9455.6 RR–AZ
Scopelogadus m. mizolepis 96 336.2 CGFZ–AZ
Poromitra megalops 82 324.5 RR–AZ
Poromitra capito 58 670.4 AZ
Scopeloberyx opisthopterus 11 6.5 CGFZ–AZ
Melamphaes suborbitalis 7 101.7 RR–AZ
Melamphaes typhlops 1 1.0 AZ
Rondeletiidae Rondeletia loricata 5 84.2 CGFZ–AZ
Cetomimidae Gyrinomimus meyersi 3 259.6 CGFZ
Cetomimus sp. 2 100.7 RR–CGFZ
Cetostoma regani 1 15.0 AZ
Procetichthys kreffti 1 72.9 FSZ
Megalomycteridae Ataxolepis apus 1 0.4 AZ
Beryciformes Anoplogastridae Anoplogaster cornuta 26 2767.0 RR–AZ
Diretmidae Diretmus argenteus 9 190.8 FSZ–AZ
Gasterosteiformes Syngnathidae Entelurus aequoreus 160 775.2 RR–FSZ
Scorpaeniformes Scorpaenidae Sebastes mentella 4 8013.5 RR
Sebastes sp. 4 3264.0 RR
Liparidae Psednos sp. 1 1.0 CGFZ
Perciformes Percichthyidae Howella brodiei 18 138.8 FSZ–AZ
Epigonidae Epigonus constanciae 1 1.1 AZ
Microichthys coccoi 1 0.3 AZ
Carangidae Trachurus picturatus 1 16.4 AZ
Caristiidae Caristius maderensis 1 34.0 FSZ
Platyberyx opalescens 1 319.2 CGFZ
Zoarcidae Melanostigma atlanticum 5 18.0 RR–CGFZ
Anarhichadidae Anarhichas minor 1 1056 CGFZ
Chiasmodontidae Chiasmodon niger 91 1837.6 RR–AZ
Pseudoscopelus altipinnis 9 265.5 AZ
Kali macrodon 5 413.4 CGFZ–AZ
Dysalotus alcocki 4 129.8 RR–AZ
Kali indica 4 270.4 CGFZ–FSZ
Kali macrurus 2 213.8 FSZ–AZ
Pseudoscopelus obtusifrons 1 68.0 AZ
Pseudoscopelus scutatus 2 35.0 AZ
Pseudoscopelus sp. 1a 1 68.0 AZ
Gempylidae Diplospinus multistriatus 1 3.8 AZ
Trichiuridae Benthodesmus elongatus 1 13.0 FSZ
Lepidopus caudatus 1 3.8 AZ
Centrolophidae Schedophilus medusophagus 1 638.5 FSZ
Nomeidae Cubiceps gracilis 99 1616.0 FSZ–AZ
Tetragonuridae Tetragonurus cuvieri 9 155.3 AZ
Caproidae Capros aper 1 2.0 AZ
N¼ total number of specimens collected, uncorrected for volume sampled/gear type. WW ¼ total wet weight (g), determined at-sea with motion-compensating scale.
Range designations follow Fig. 1: RR ¼ Reykjanes Ridge; CGFZ ¼ Charlie–Gibbs Fracture Zone; FSZ ¼ Faraday Seamount Zone; AZ ¼ Azores Zone.aSpecimen will serve as paratype for new species description underway (M. Melo, pers. comm.)
T.T. Sutton et al. / Deep-Sea Research II 55 (2008) 161–184182
ARTICLE IN PRESST.T. Sutton et al. / Deep-Sea Research II 55 (2008) 161–184 183
References
Angel, M.V., 1985. Vertical migrations in the oceanic realm: possible
causes and probable effects. Contributions in Marine Science 27
(Suppl.).
Angel, M.V., 1993. Biodiversity of the pelagic ocean. Conservation
Biology 7 (4), 760–772.
Angel, M.V., 1997. Pelagic biodiversity. In: Ormond, R.F.G., Gage, J.D.,
Angel, M.V. (Eds.), Marine Biodiversity: Patterns and Processes.
Cambridge University Press, Cambridge, 449pp.
Angel, M.V., Baker, A., 1982. Vertical distribution of the standing crop of
plankton and micronekton at three stations in the Northeast Atlantic.
Biological Oceanography 2, 1–30.
Angel, M.V., Boxshall, G.A., 1990. Life in the benthic boundary layer:
connections to the mid-water and seafloor. Philosophical Transactions
of the Royal Society of London A 331, 15–28.
Backus, R.H., Craddock, J.E., Haedrich, R.L., Shores, D.L., 1969.
Mesopelagic fishes and thermal fronts in the western Sargasso Sea.
Marine Biology 3, 87–106.
Badcock, J., 1984. Gonostomatidae. In: Whitehead, P.J.P., Bauchot, M.-
L., Hureau, J.-C., Nielsen, J., Tortonese, E. (Eds.), Fishes of the
North-eastern Atlantic and the Mediterranean, vol. 1. UNESCO,
Paris, pp. 284–301.
Berger, W.H., 1989. Global maps of ocean productivity. In: Berger, W.H.,
Smetacek, V.S., Wefer, G. (Eds.), Productivity of the Ocean: Present
and Past. Wiley, New York, pp. 429–455.
Bergstad, O.A., 1990. Ecology of the fishes of the Norwegian Deep:
distribution and species assemblages. Netherlands Journal of Sea
Research 25, 237–266.
Bergstad, O.A., 1991. Distribution and trophic ecology of some gadoid
fish of the Norwegian Deep. 2. Food-web linkages and comparison of
diets and distributions. Sarsia 75, 315–325.
Bergstad, O.A., Menezes, G., Høines, A., 2008. Demersal fish on a mid-
ocean ridge: distribution patterns of fishes captured by longlines on the
Mid-Atlantic Ridge.
Blaber, S.J.M., Bulman, C.M., 1987. Diets of fishes of the upper
continental slope of eastern Tasmania: content, calorific values,
dietary overlap and trophic relationships. Marine Biology 95, 345–356.
Bower, A.S., Le Cann, B., Rossby, T., Zenk, W., Gould, J., Speer, K.,
Richardson, P., Prator, M.D., Zhang, H.-M., 2002. Directly measured
mid-depth circulation in the northeastern North Atlantic Ocean.
Nature 419, 603–607.
Bray, J.R., Curtis, J.T., 1957. An ordination of the upland forest
communities of Southern Wisconsin. Ecological Monographs 27,
325–349.
Childress, J.J., Gluck, D.L., Carney, R.S., Gowing, M.M., 1989.
Benthopelagic biomass distribution and oxygen consumption in a
deep-sea benthic boundary layer dominated by gelatinous organisms.
Limnology and Oceanography 34, 913–930.
Clarke, K.R., Gorley, R.N., 2006. PRIMER v6: User Manual/Tutorial.
PRIMER-E, Plymouth.
Clarke, K.R., Chapman, M.G., Somerfield, P.J., Needham, H.R., 2006.
Dispersion-based weighting of species counts in assemblage analyses.
Marine Ecology Progress Series 320, 11–27.
Clarke, M.R., 1985. The food and feeding of seven fish species from the
Campbell Plateau, New Zealand. New Zealand Journal of Marine and
Freshwater Research 19, 339–363.
Cohen, D.M., 1984. Bathylagidae. In: Whitehead, P.J.P., Bauchot, M.-L.,
Hureau, J.-C., Nielsen, J., Tortonese, E. (Eds.), Fishes of the North-Eastern
Atlantic and the Mediterranean, vol. 1. UNESCO, Paris, pp. 392–394.
Craddock, J.E., Hartel, K.E., Flescher, D., 2002. Lanternfishes: order
myctophiformes. In: Collette, B.B., Klein-MacPhee, G. (Eds.), Fishes
of the Gulf of Maine, pp. 198–204.
Dawson, C.E., 1986. Syngnathidae. In: Whitehead, P.J.P., Bauchot,
M.-L., Hureau, J.-C., Nielsen, J., Tortonese, E. (Eds.), Fishes of the
North-eastern Atlantic and the Mediterranean, vol. 2. UNESCO,
Paris, pp. 628–639.
Domanski, P., 1986. The near-bottom shrimp faunas (Decapoda:
Natantia) at two abyssal sites in the Northeast Atlantic Ocean.
Marine Biology 93, 171–180.
Faith, D.P., Minchin, P.R., Belbin, L., 1987. Compositional dissimilarity
as a robust measure of ecological distance. Vegetatio 69, 57–68.
Fock, H.O., Pusch, C., Ehrich, S., 2002a. The 1982-cruise of FRVWalther
Herwig II to the Mid-Atlantic Ridge. In: Bergstad, O.A. (Ed.), The
Census of Marine Life: Turning Concept into Reality. ICES,
Copenhagen.
Fock, H.O., Matthiessen, B., Zidowitz, H., von Westernhagen, H., 2002b.
Diel and habitat-dependent resource utilization by deep-sea fishes at
the Great meteor seamount: niche overlap and support for the sound
scattering layer interception hypothesis. Marine Ecology Progress
Series 244, 219–233.
Fock, H.O., Pusch, C., Ehrich, S., 2004. Structure of deep-sea pelagic fish
assemblages in relation to the Mid-Atlantic Ridge (45–501N). Deep
Sea Research I 51, 953–978.
Forsythe, W.C., Rykiel Jr., E.J., Stahl, R.S., Wu, H., Schoolfield, R.M.,
1995. A model comparison for daylength as a function of latitude and
day of year. Ecological Modelling 80, 87–95.
Gartner, J.V., Crabtree, R.E., Sulak, K.J., 1997. Feeding at depth. In:
Randall, D.J., Farrell, A.P. (Eds.), Deep-Sea Fishes. Academic Press,
San Diego, pp. 115–193.
Gibbs Jr., R.H., 1984. Chauliodontidae. In: Whitehead, P.J.P., Bauchot,
M.-L., Hureau, J.-C., Nielsen, J., Tortonese, E. (Eds.), Fishes of the
North-eastern Atlantic and the Mediterranean, vol. 1. UNESCO,
Paris, pp. 336–337.
Gordon, J.D.M., 2001. Deep-water fisheries at the Atlantic Frontier.
Continental Shelf Research 21, 987–1003.
Haedrich, R.L., Henderson, N.R., 1974. Pelagic food of Coryphaenoides
armatus, a deep benthic rattail. Deep-Sea Research 21, 739–744.
Haedrich, R.L., Merrett, N.R., 1992. Production/biomass ratios,
size frequencies, and biomass spectra in deep-sea demersal fishes.
In: Rowe, G.T., Pariente, V. (Eds.), Deep-Sea Food Chains and
the Global carbon Cycle. Kluwer Academic Publishers, Dordrecht,
pp. 157–182.
Halliday, R.G., 1970. Growth and vertical distribution of the Glacier
Lanternfish, Benthosema glaciale, in the northwestern Atlantic. Journal
of the Fisheries Research Board of Canada 27, 105–116.
Hargreaves, P.M., 1984. The distribution of Decapoda (Crustacea) in the
open ocean and near-bottom over an adjacent slope in the northern
north-east Atlantic Ocean during 1979. Journal of the Marine
Biological Association, UK 64, 829–857.
Hargreaves, P.M., 1985. The distribution of Mysidacea in the open ocean
and near-bottom over slope regions in the northern North-east
Atlantic Ocean during 1979. Journal of Plankton Research 7,
241–261.
Heino, M., Porteiro, F., Sutton, T., Falkenhaug, T., Godø, O. R.,
Piatkowski, U., submitted. Catchability of pelagic trawls for sampling
deep-pelagic nekton in the mid North Atlantic. ICES Journal of
Marine Science.
Holloway, P.E., Merrifield, M.A., 1999. Internal tide generation by
seamounts, ridges and islands. Journal of Geophysical Research 104,
25937–25951.
Hopkins, T.L., Gartner Jr., J.V., 1992. Resource-partitioning and
predation impact of a low-latitude myctophid community. Marine
Biology 114, 185–197.
Horn, M.H., 1972. The amount of space available for marine and
freshwater fishes. Fishery Bulletin 70, 1295–1297.
Hulley, P.A., 1984. Myctophidae. In: Whitehead, P.J.P., Bauchot, M.-L.,
Hureau, J.-C., Nielsen, J., Tortonese, E. (Eds.), Fishes of the North-
eastern Atlantic and the Mediterranean, vol. 1. UNESCO, Paris,
pp. 429–483.
Isaacs, J.D., Schwartzlose, R.A., 1965. Migrant sound scatterers:
interactions with the sea florr. Science 150, 1810–1813.
Karnella, C., 1987. Biology of midwater fishes of Bermuda Ocean Acre.
Family Myctophidae, lanternfishes. Smithsonian Contributions in
Zoology 452, 51–168.
ARTICLE IN PRESST.T. Sutton et al. / Deep-Sea Research II 55 (2008) 161–184184
Kashkin, N.I., Parin, N.V., 1983. Quantitative assessment of micro-
nektonic fishes by nonclosing gear (a review). Biological Oceanogra-
phy 2, 263–287.
Kruskal, J.B., Wish, M., 1978. Multidimensional Scaling. Sage Publica-
tions, Beverly Hills, CA.
Lancraft, T.M., Torres, J.J., Hopkins, T.L., 1989. Micronekton and
macrozooplankton in the open waters near Antarctic Ice Edge Zones
(AMERIEZ 1983 and 1986). Polar Biology 9, 225–233.
Longhurst, A.R., Harrison, W.G., 1989. The biological pump: profiles of
plankton production and consumption in the open ocean. Progress in
Oceanography 22, 47–123.
Lorz, H.V., Pearcy, W.G., Fraidenburg, M., 1983. Notes on the feeding
habits of the yellowtail rockfish, Sebastes flavidus, off Washington and
in Queen Charlotte Sound. California Fish and Game 69, 33–38.
Magnusson, J.V., Magnusson, J., 1995. The distribution, relative
abundance, and biology of the deep-sea fishes of the Icelandic slope
and Reykjanes Ridge. In: Hooper, A.G. (Ed.), Deep-water Fisheries of
the North Atlantic Oceanic Slope. Kluwer Academic Publishers,
London, pp. 161–199.
Marshall, N.B., Merrett, N.R., 1977. The existence of a benthopelagic fish
fauna in the deep sea. In: Angel, M. (Ed.), A Voyage of Discovery.
Pergamon Press, Oxford.
Mauchline, J., Gordon, J.D.M., 1983. Diets of clupeoid, stomiatoid and
salmonoid fish of the Rockall Trough, northeastern Atlantic Ocean.
Marine Biology 77, 67–78.
Mauchline, J., Gordon, J.D.M., 1984. Occurrence and feeding of
berycomorphid and percomorphid teleost fish in the Rockall Trough.
Journal du Conseil International pour l’Exploration de la Mer 41,
239–247.
Mauchline, J., Gordon, J.D.M., 1991. Oceanic pelagic prey of benthope-
lagic fish in the benthic boundary layer of a marginal oceanic region.
Marine Ecology Progress Series 74, 109–115.
Maul, G.E., 1990. Melamphaidae. In: Quero, J.C., Hureau, J.C., Karrer,
C., Post, A., Saldanha, L. (Eds.), Check-list of the fishes of the eastern
tropical Atlantic (CLOFETA), vol. 2. JNICT, Lisbon; SEI, Paris; and
UNESCO, Paris, pp. 612–618.
Merrett, N.R., 1986. Biogeography and the oceanic rim: a poorly known
zone of ichthyofauna interaction. In: Pelagic Biogeography UNESCO
Technical Paper 49, pp. 201–209.
Merrett, N.R., Haedrich, R.L., 1997. Deep-Sea Demersal Fish and
Fisheries. Chapman & Hall, London.
Nelson, J.S., 2006. Fishes of the World, fourth ed. Wiley, Hoboken, NJ,
601pp.
Nielsen, J.G., Bertelsen, E., 1990. Eurypharyngidae. In: Quero, J.C.,
Hureau, J.C., Karrer, C., Post, A., Saldanha, L. (Eds.), Check-list of
the Fishes of the Eastern Tropical Atlantic (CLOFETA), vol. 1.
JNICT, Lisbon; SEI, Paris; and UNESCO, Paris, 206pp.
Novikov, N.P., Kodolov, L.S., Gavrilov, G.M., 1981. Preliminary list of
fishes of the Emperor Underwater Ridge. In: Parin, N.V. (Ed.), Fishes
of the Open Ocean. Moscow, pp. 32–35.
Pearcy, W.G., 1983. Quantitative assessment of the vertical distributions
of micronektonic fishes with opening/closing midwater trawls.
Biological Oceanography 2, 289–310.
Pearcy, W.G., Ambler, J.W., 1974. Food habits of deep-sea macrourid
fishes off the Oregon Coast. Deep Sea Research 21, 745–759.
Pereyra, W.T., Pearcy, W.G., Carvey, F.E., 1969. Sebastodes flavidus, a
shelf rockfish feeding on mesopelagic fauna, with consideration of
ecological implications. Journal of the Fisheries Research Board of
Canada 26, 1969.
Porteiro, F.M.P., 2005. Biogeography and biodiversity of stomiid fishes in
the North Atlantic. Ph.D. Dissertation, University of Liverpool.
Quero, J.-C., Njock, J.C., de la Hoz, M.M., 1990a. Sternoptychidae. In:
Quero, J.-C., Hureau, J.C., Karrer, C., Post, A., Saldanha, L. (Eds.),
Check-list of the Fishes of the Eastern Tropical Atlantic (CLOFETA),
vol. 1. JNICT, Lisbon; SEI, Paris; and UNESCO, Paris, pp. 278, 279.
Quero, J.-C., Njock, J.C., de la Hoz, M.M., 1990b. Gonostomatidae. In:
Quero, J.-C., Hureau, J.C., Karrer, C., Post, A., Saldanha, L. (Eds.),
Check-list of the Fishes of the Eastern Tropical Atlantic (CLOFETA),
vol. 1. JNICT, Lisbon; SEI, Paris; and UNESCO, Paris, pp. 283–292.
Ramm, D.C., Xiao, Y., 1995. Herding in groundfish and effective
pathwidth of trawls. Fisheries Research 24, 243–259.
Roden, G.I., 1987. Effect of seamount chains on ocean circulation and
thermohaline structure. In: Boehlert, G.W. (Ed.), Geophysical Mono-
graph 43. American Geophysical Union, Washington, DC,
pp. 335–354.
Roe, H.S.J., Billet, D.S.M., Lampitt, R.S., 1990. Benthic/midwater
interactions on the Madeira Abyssal Plain; evidence for biological
transport pathways. Progress in Oceanography 24, 127–140.
Romesburg, H.C., 1990. Cluster Analysis for Researchers. Robert E
Kreiger Publishing Company, Malabar, FL.
Rossby, T., 1999. On gyre interaction. Deep-Sea Research II 46, 139–164.
Sangster, G.I., Breen, M., 1998. Gear performance and catch comparison
trials between a single trawl and a twin rigged gear. Fisheries Research
36, 15–26.
Sedberry, G.R., Musick, J.A., 1978. Feeding strategies of some demersal
fishes of the continental slope and rise off the Mid-Atlantic Coast of
the USA. Marine Biology 44, 357–375.
Søiland, H., Budgell, P., Knutsen, Ø., 2008. The physical oceanographic
conditions along the Mid Atlantic Ridge north of the Azores in
June–July 2004.
Sutton, T.T., 2003. Stomiiformes: dragonfishes and relatives. In: Thoney,
D., Loiselle, P. (Eds.), Fishes I. Grzimek’s Animal Life Encyclopedia,
vol. 4. Gale, New York, pp. 421–430.
Sutton, T.T., Hopkins, T.L., 1996. The species composition, abundance
and vertical distribution of the stomiid (Pisces: Stomiiformes) fish
assemblage of the Gulf of Mexico. Bulletin of Marine Science 59 (3),
530–542.
Vinnichenko, V.I., 1997. Russian investigations and deep water fishery on
the Corner Rising seamount in subarea 6. NAFO Science Countries
Studies 30, 41–49.
Vinogradov, G.M., 2005. Vertical distribution of Macroplankton at the
Charlie-Gibbs Fracture Zone (North Atlantic), as observed from the
manned submersible ‘‘Mir-1. Marine Biology 146, 325–331.
Vinogradov, M.E., 1968. Vertikalnoe Raspredelenie Okeanicheskogo
Zooplanktona. Nauka, Moscow.
Wenneck, T. de Lange, Falkenhaug, T., Bergstad, O.A., 2008. Strategies,
methods, and technologies adopted on the RV G.O. Sars MAR-ECO
expedition to the Mid-Atlantic Ridge in 2004.
Wishner, K.F., 1980a. The biomass of the deep-sea benthopelagic
plankton. Deep-Sea Research 27, 203–216.
Wishner, K.F., 1980b. Near-bottom sound scatterers in the Ecuador
Trench. Deep-Sea Research 27, 217–223.
Wishner, K.F., 1980c. Aspects of the community ecology deep-sea
benthopelagic plankton, with special attention to gymnopleid cope-
pods. Marine Biology 60, 179–187.
Wishner, K.F., Gowing, M.M., 1987. In situ filtering and ingestion rates
of deep-sea benthic boundary-layer zooplankton in the Santa Catalina
Basin. Marine Biology 94, 357–366.