Vertical Coordination and Consumer Welfare - USDA ERS
35
United States Department of Agriculture .D^ Agricultural Economic Report Number 753 An Economic Research Service Report VerticaLÇoordination and Consumer Welfare: The Case of the Pork Industry Steve W. Martinez Kevin Snnith Kelly Zering
-
Upload
khangminh22 -
Category
Documents
-
view
0 -
download
0
Transcript of Vertical Coordination and Consumer Welfare - USDA ERS

United States Department of Agriculture
.D^ Agricultural Economic Report Number 753
An Economic Research Service Report
VerticaLÇoordination and Consumer Welfare: The Case of the Pork Industry
Steve W. Martinez Kevin Snnith Kelly Zering
Vertical Coordination and Consumer Welfare: The Case of the Pork Industry. By Steve W. Martinez, Kevin Smith, and Kelly Zering. Food Consumption and Economics Division, Economic Research Service, U.S. Department of Agriculture. Agricultural Economic Report No. 753.
Abstract
The industrialization of the hog industry is underway. Advances in hog production have allowed producers to grow in size and produce a large, uniform supply of high-quaUty hogs at lower costs. Packing operations are larger as well. At the same time, contractual arrangements and vertical integration between hog producers and packers are replacing open market exchange. These arrangements may be used by packers to procure a large, stable, uniform supply of high-quaUty hogs. Consumers benefit from lower pork production costs and a large supply of high-quality pork products deUvered on a consistent basis.
Keywords: vertical coordination, vertical integration, contracts, transactions costs, lean pork.
Acknowledgments
We thank Alden Manchester, Margaret Malanoski, Lawrence Duewer, Mike Wohlgenant, Annette Clauson, and Leland Southard for manuscript review, Tom McDonald for manuscript preparation, Douglas Martinez for editorial assistance, and Wynnice Napper for assistance with tables and charts.
Washington, DC 20005-4788 August 1997
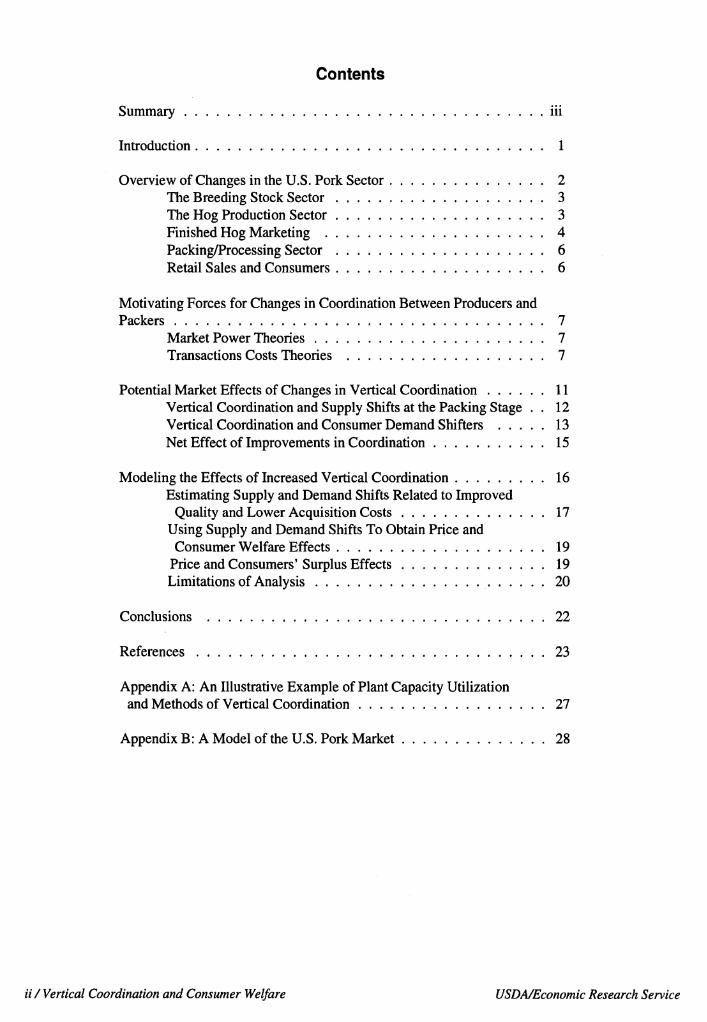
Contents
Summary iii
Introduction 1
Overviewof Changes in the U.S. Pork Sector 2 The Breeding Stock Sector 3 The Hog Production Sector 3 Finished Hog Marketing . 4 Packing/Processing Sector 6 Retail Sales and Consumers 6
Motivating Forces for Changes in Coordination Between Producers and Packers 7
Market Power Theories 7 Transactions Costs Theories 7
Potential Market Effects of Changes in Vertical Coordination 11 Vertical Coordination and Supply Shifts at the Packing Stage . . 12 Vertical Coordination and Consumer Demand Shifters 13 Net Effect of Improvements in Coordination 15
Modeling the Effects of Increased Vertical Coordination 16 Estimating Supply and Demand Shifts Related to Improved
Quality and Lower Acquisition Costs 17 Using Supply and Demand Shifts To Obtain Price and Consumer Welfare Effects 19
Price and Consumers' Surplus Effects . 19 Limitations of Analysis 20
Conclusions 22
References 23
Appendix A: An Illustrative Example of Plant Capacity Utilization and Methods of Vertical Coordination 27
Appendix B: A Model of the U.S. Pork Market 28
a / Vertical Coordination and Consumer Welfare VSDA/Economic Research Service
Summary
Although net benefits to consumers are not a certainty, the "industrialization" of the U.S. pork industry could lead to lower prices and larger supplies of higher quality pork products because of lower onfarm production costs, more efficient processing, and greater control over hog quality characteristics.
The U.S. food production and marketing system of 40 years ago delivered generic farm products to the marketplace, where consumers bought them and took them home for further preparation. But spending for food consumed at home has declined to about half of total food spending. And a wider range of differentiated food products is produced and marketed by fewer and larger operations.
Changes throughout the food system are reflected in most areas of the pork industry. These include the breeding stock sector, the hog production sector, the marketing system for finished hogs, the packing/processing sector, and retail markets for pork products.
Industrialization in agriculture refers to the use of modem methods of manufacturing, production, and distribution. Application of these methods has been accompanied by changes in vertical coordination. Types of vertical coordination include contracting with producers for a particular type of product, and integration.
As factors other than price—such as quaUty—have become increasingly important, contracting and integration have increased. Contracting and vertical integration between producers and packers can help to ensure that processing plants operate closer to optimum capacity with few disruptions in the supply of hogs. Changes in vertical coordination in the hog sector can result in lower production costs, lower retail prices, and improved quality of food products.
But increased contracting and integration also result in concerns about market power. Contracting and vertical integration, plus consoUdation, can create barriers to entry and reduce the amount and accuracy of pubhcly available market information, which may distort smaller, independent producers' production and marketing decisions. USDA's recent charge of price discrimination against IBP, the world's largest pork and beef packer, is the first time the Department has challenged contracts between packers and producers.
Policymakers are interested in monitoring the effects of contracting and vertical integration on prices, price variability, margins, and food quality. Information regarding the effects of alternative methods of vertical coordination, including sales on the open market, can influence legislative decisions that play a role in the types of coordinating arrangements that develop.
USDA/Economic Research Service Vertical Coordination and Consumer Welfare / Hi
Vertical Coordination and Consumer Welfare
The Case of the Pork Industry
Steve W. Martinez, Kevin Smith, and Kelly Zering^
Introduction
The term "industrialization of agriculture" has been used to describe fundamental changes in the agricultural sector. It refers to the application of modem industrial manufacturing, production, distribution, and coordination concepts (Boehlje, 1996; Urban). As the agricultural sector shifts from production of generic commodities to the manufacturing of food products with specific attributes, it responds to consumers' preferences for a variety of safe, nutritious, high-quality food products. New technologies and the drive to compete in a more capital-intensive domestic food market encourage firms to expand capacity and increase existing capacity use without disrupting input and output flows (Boehlje, 1996; O'Brien). In this environment, firms want more control over the quality and quantity of products. Consequently, firms in some industries are choosing alternative coordinating arrangements, such as contract production and integration, to establish a reliable market outlet and gain greater control over the quantity and quality of input supplies.
Changes in the pork industry illustrate the industriaUzation of agriculture (Hurt; Boehlje, 1995; Rhodes). The trend toward larger, more specialized
The authors are an agricultural economist with the Economic Research Service, U.S. Department of Agriculture; a Ph.D. candidate in the Department of Agricultural and Resource Economics, North Carolina State University; and an associate professor/extension specialist in the Department of Agricultural and Resource Economics, North Carolina State University, respectively.
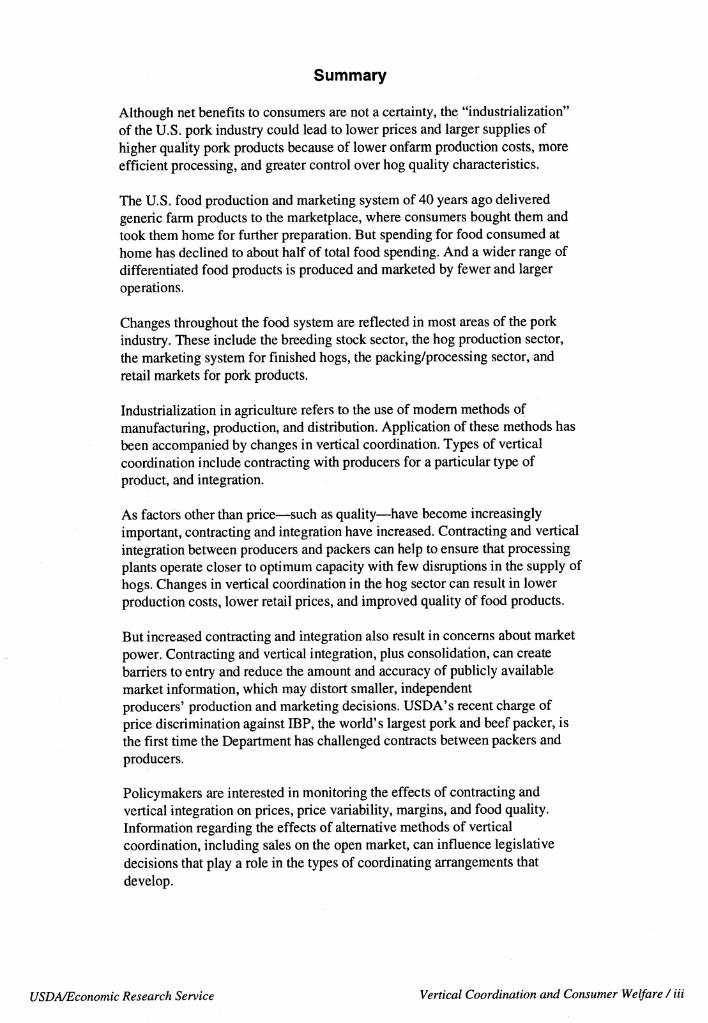
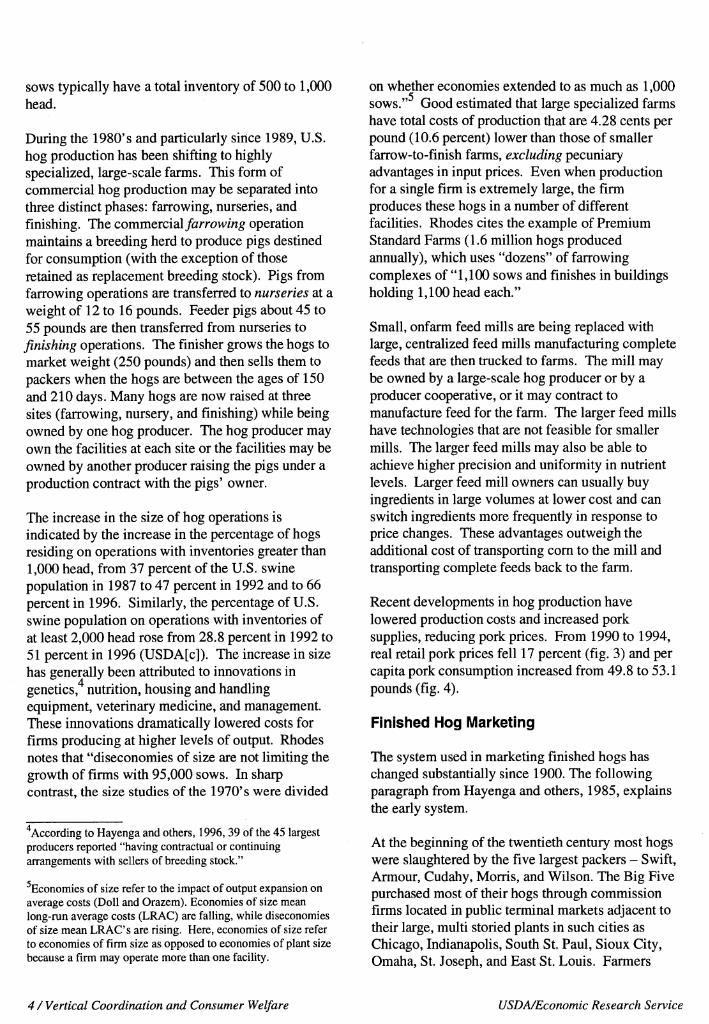
Figure 1
Proportion of hogs obtained by paclcers through alternative coordinating arrangements
Percent
uu MtfflH wiiiii^ 80 H^H ^^^ 60 ^1 ^1 40 ^^1 ^^1 20
0
- ^B ^B 1993 1998*
WM Open market ^g Contract 111 Integration 1 •Estimated. Source: Complied by ERS, USDA from Hayenga and others, 1996.
hog production and processing operations is accelerating (Hurt). Potential size economies and new health-enhancing technologies encourage greater concentration of animals. Changes in vertical coordination of stages of the pork industry are also evident (fig. l).^ Contracts and, to a lesser extent, vertical integration between large producers and large packers help to ensure that processing plants operate closer to optimum capacity with few disruptions in input flows. By tying premiums and discounts paid to the quality of hogs produced,
Vertical coordination includes all of the ways that output from one stage of production and distribution is transferred to another stage (for example, open-market exchange at spot prices, contract production, and vertical integration). See Mighell and Jones, and Martinez and Reed for more details.
USDA/Economic Research Service Vertical Coordination and Consumer Welfare /1
packers may receive a more consistent supply of high-quality hogs. These arrangements are presumably leading to a highly coordinated pork marketing system that is more responsive to consumer preferences and to technological developments.
Most previous studies of vertical coordination either have been theoretical in nature (Williamson; Logan; Roy er); have analyzed determinants of alternatives to spot market coordination (Levy; MacDonald); or have analyzed effects on farm operators related to transfer of price risk (Knoeber and Thurman) or vertical integration of imperfectly competitive stages (Azzam and Wellman). Empirical analyses of consumer effects of these alternative coordinating arrangements are scarce. However, limited empirical evidence suggests that these effects could be substantial. For example, Kinnucan and Nelson use a farm-retail price margin model of the egg industry to examine the effect of increased vertical control on marketing costs. They estimated that contract production reduced egg marketing costs by 25 percent between 1973 to 1983. In a competitive egg marketing system, this translates into lower egg prices on retail shelves for a given level of demand. Similar results have been documented for nonfood industries as well. Kwoka estimated that vertical integration of the generation and distribution stages of the U.S. electric utihty industry led to cost savings of 27 percent.
Why is it important that alternative coordinating arrangements be examined? To facilitate the exchange of farm products from producers to consumers, policy makers are interested in monitoring the potential effects of these arrangements on prices, price variability, margins, and food quality. Also, legislative decisions play a role in the types of coordinating arrangements that develop. Contracting and integration can lower production costs, lower retail prices, and improve food quality for consumers. On the other hand, the move toward contracting and integration brings with it concerns about market power. The U.S. Department of Agriculture's (USDA) recent charge of price discrimination against IBP, Inc. (IBP), the world's largest beef and pork packer, represents the
A recent study by Azzam, 1996, provides an empirical technique for examining the incentives for backward vertical integration by a monopsonistic buyer.
first time that USDA has challenged contracts between packers and producers. Market power through price discrimination, or barriers to entry, may result in misallocated resources. Contracting and integration also reduce the amount and accuracy of publicly available market information, which may distort production and marketing decisions of producers.
The objectives of this report are threefold: (1) to provide an overview of changes within stages of the pork industry, including changes in methods of vertical coordination, (2) to review what the theoretical literature has to say about the possible motives for changing vertical coordination of the pork industry and how these changes affect consumers' interests in pork products, and (3) to demonstrate potential gains to consumers from increased coordination of the production and packing stages of the pork industry. In this way, the potential effects of changing coordinating arrangements on consumers and how legislative actions might affect these interests can be better understood.
Overview of Changes in the U.S. Pork Sector
Several important changes have characterized the food and agricultural system over the past several decades. The food production and marketing system of 40 years ago delivered generic farm products to the marketplace for further preparation at home. At-home food consumption represented three-quarters of total food expenditures (O'Brien). Agricultural products were typically marketed through spot prices based on trade in central markets. Today, a wider range of differentiated food products is produced and marketed by fewer and larger operations. At-home food expenditures have declined to approximately half of total food expenditures. These changes have been accompanied by a decline in central market trade and a change in the role of price in allocating resources across stages of a food marketing system. As factors other than price, such as quality factors, have become more important, contracting and integration have gradually increased.
Changes throughout the food and agricultural system are clearly reflected in most areas of the pork
2 / Vertical Coordination and Consumer Welfare USD A/Economic Research Service
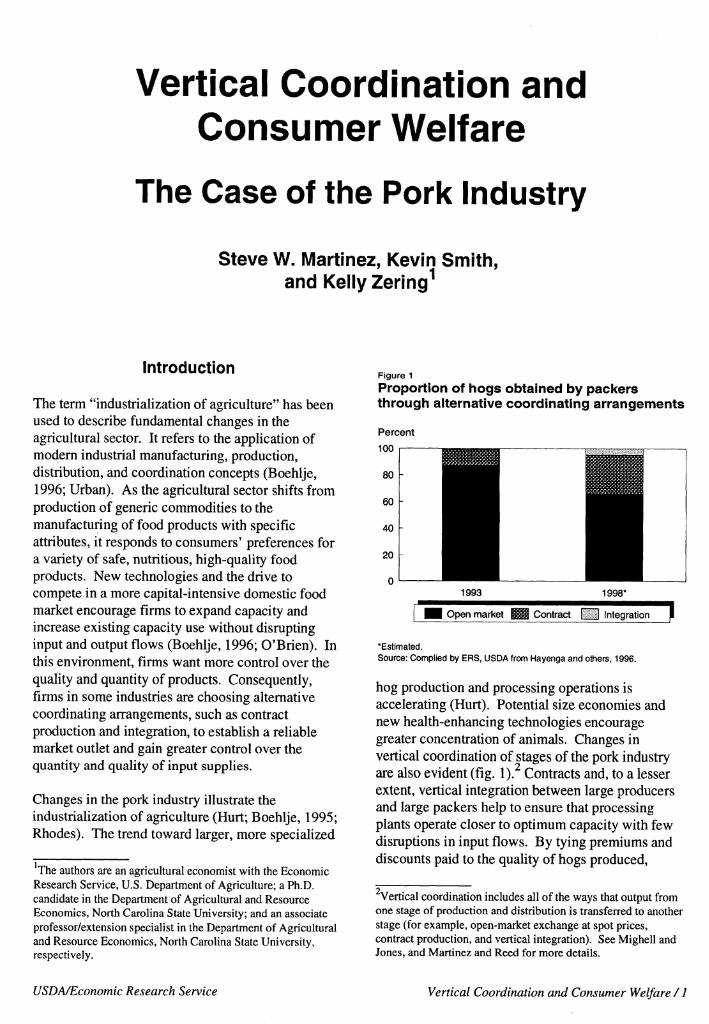
industry, including the breeding stock sector, the hog production sector, the marketing system for finished hogs, the packing/processing sector, and retail markets for pork products (fig. 2). By understanding these changes, we can better understand the changes in methods of vertical coordination in the pork industry.
The Breeding Stock Sector
Rapid change in the U.S, swine breeding stock sector over the last few years is significant for pork consumption. The emerging swine breeding stock sector is capable of selecting highly productive pigs with traits that producers and consumers value and quickly distributing those genes to commercial hog producers.
The breeding stock sector produces genetic stock for hog producers. Important economic characteristics of hogs are heritable from parent stock, creating an incentive for selecting genetically superior animals for hog production. These characteristics may serve to reduce costs at some point in the production process or increase the value of the final output. Examples of genetic traits that reduce production costs include larger litter size, feed conversion efficiency, and faster growth rate. Examples of genetic traits that reduce processing costs and thereby reduce costs of pork products include leanness (a higher proportion of high-valued cuts and reduced need for trimming excess fat), hog size (inversely related to processing costs per pound sold), and traits that affect the rate of meat quality degradation (such as drip loss and pale, soft, exudative (PSE) pork). Other genetic traits that directly affect meat quaUty include intra-muscular fat (that is, marbUng), meat color, pH, and tenderness.
Hayenga and others, 1985, and Johnson provide data that indicate a shift from small-scale purebred breeding stock suppHers to large-scale "corporate" suppliers of hybrid breeding stock between 1980 and 1989. A number of international swine genetics supphers initiated or expanded U.S. production and sales in 1992 after most major U.S. packers began paying premiums for leanness.
A recent innovation in swine breeding is the widespread adoption of artificial insemination (AI). Since swine semen does not survive freezing well.
Figure 2
Vertical stages of the pork industry
Finished hog marketing
Breeder
Hog producer
Packer
Processor
Retailer
Source: ERS, USDA.
commercial adoption of swine AI requires that semen be collected, extended, distributed, and used within several hours. An AI boar can inseminate up to 20 sows for each sow inseminated by a boar by natural mating (Almond, Britt, and others). AI boars are housed at an AI stud farm, where semen is collected, processed, and distributed to sow farms. The first boar stud farm for commercial production in North CaroUna was built in 1993. Artificial insemination allows the most desirable genetic traits to be distributed across the commercial breeding herd in a much shorter time than traditional breeding methods. As a result, the pork industry is now able to respond to consumer demands in a shorter period with greater precision than ever before.
The Hog Production Sector
The hog production sector has been substantially restructured over the past decade. Changes include the organization of production, the size of farms, and the relationships between hog producers and input suppliers. These changes result in lower costs of production and improved capacity for quality assurance.
During the 1970's and 1980's, the most common method of producing hogs was thcfarrow-to-finish farm with fewer than 1,000 hogs and pigs in inventory. Farrow-to-finish operations have a breeding herd and raise the pigs from birth to market. Farrow-to-finish operations with 50 to 100
USD A/Economic Research Service Vertical Coordination and Consumer Welfare / 3
sows typically have a total inventory of 500 to 1,000 head.
During the 1980's and particularly since 1989, U.S. hog production has been shifting to highly specialized, large-scale farms. This form of commercial hog production may be separated into three distinct phases: farrowing, nurseries, and finishing. The commercial farrowing operation maintains a breeding herd to produce pigs destined for consumption (with the exception of those retained as replacement breeding stock). Pigs from farrowing operations are transferred to nurseries at a weight of 12 to 16 pounds. Feeder pigs about 45 to 55 pounds are then transferred from nurseries to finishing operations. The finisher grows the hogs to market weight (250 pounds) and then sells them to packers when the hogs are between the ages of 150 and 210 days. Many hogs are now raised at three sites (farrowing, nursery, and finishing) while being owned by one hog producer. The hog producer may own the facilities at each site or the facilities may be owned by another producer raising the pigs under a production contract with the pigs' owner.
The increase in the size of hog operations is indicated by the increase in the percentage of hogs residing on operations with inventories greater than 1,000 head, from 37 percent of the U.S. swine population in 1987 to 47 percent in 1992 and to 66 percent in 1996. Similarly, the percentage of U.S. swine population on operations with inventories of at least 2,000 head rose from 28.8 percent in 1992 to 51 percent in 1996 (USDA[c]). The increase in size has generally been attributed to innovations in genetics, nutrition, housing and handling equipment, veterinary medicine, and management. These innovations dramatically lowered costs for firms producing at higher levels of output. Rhodes notes that "diseconomies of size are not limiting the growth of firms with 95,000 sows. In sharp contrast, the size studies of the 1970's were divided
According to Hayenga and others, 1996, 39 of the 45 largest producers reported "having contractual or continuing arrangements with sellers of breeding stock."
^Economies of size refer to the impact of output expansion on average costs (Doll and Orazem). Economies of size mean long-run average costs (LRAC) are falling, while diseconomies of size mean LRAC s are rising. Here, economies of size refer to economies of firm size as opposed to economies of plant size because a firm may operate more than one facility.
on whether economies extended to as much as 1,000 sows." Good estimated that large specialized farms have total costs of production that are 4.28 cents per pound (10.6 percent) lower than those of smaller farrow-to-finish farms, excluding pecuniary advantages in input prices. Even when production for a single firm is extremely large, the firm produces these hogs in a number of different facilities. Rhodes cites the example of Premium Standard Farms (1.6 million hogs produced annually), which uses "dozens" of farrowing complexes of "1,1(X) sows and finishes in buildings holding 1,100 head each."
Small, onfarm feed mills are being replaced with large, centralized feed mills manufacturing complete feeds that are then trucked to farms. The mill may be owned by a large-scale hog producer or by a producer cooperative, or it may contract to manufacture feed for the farm. The larger feed mills have technologies that are not feasible for smaller mills. The larger feed mills may also be able to achieve higher precision and uniformity in nutrient levels. Larger feed mill owners can usually buy ingredients in large volumes at lower cost and can switch ingredients more frequently in response to price changes. These advantages outweigh the additional cost of transporting com to the mill and transporting complete feeds back to the farm.
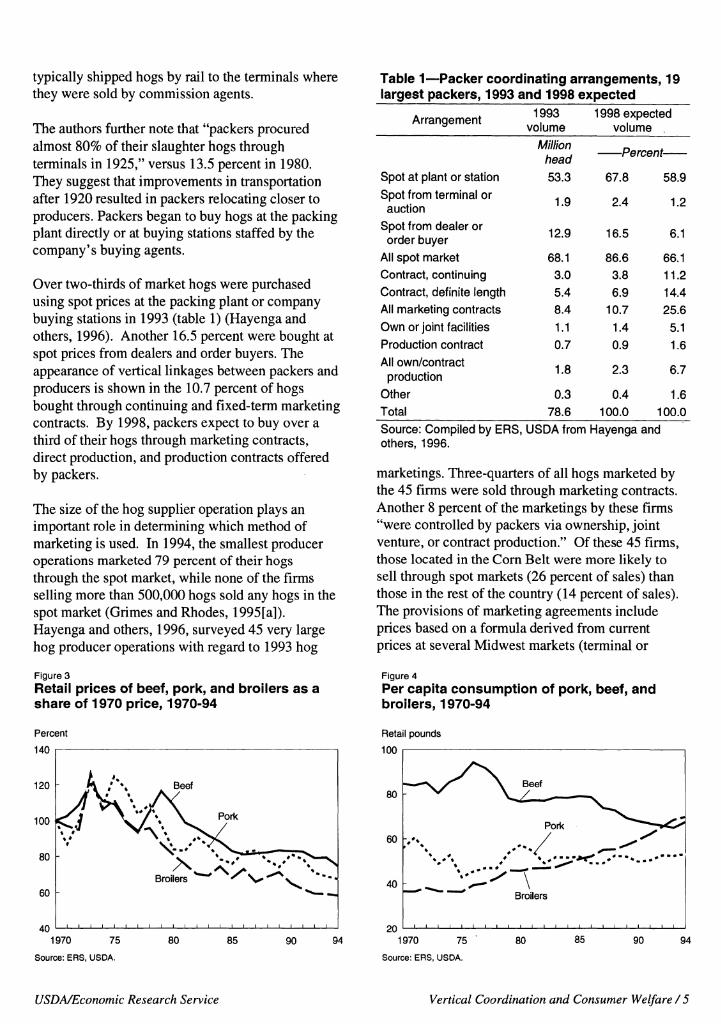
Recent developments in hog production have lowered production costs and increased pork supplies, reducing pork prices. From 1990 to 1994, real retail pork prices fell 17 percent (fig. 3) and per capita pork consumption increased from 49.8 to 53.1 pounds (fig. 4).
Finished Hog iUlarlceting
The system used in marketing finished hogs has changed substantially since 1900. The following paragraph from Hayenga and others, 1985, explains the early system.
At the beginning of the twentieth century most hogs were slaughtered by the five largest packers - Swift, Armour, Cudahy, Morris, and Wilson. The Big Five purchased most of their hogs through commission firms located in public terminal markets adjacent to their large, multi storied plants in such cities as Chicago, Indianapolis, Soutii St. Paul, Sioux City, Omaha, St. Joseph, and East St. Louis. Farmers
4 / Vertical Coordination and Consumer Welfare USDA/Economic Research Service
typically shipped hogs by rail to the terminals where they were sold by commission agents.
The authors further note that "packers procured almost 80% of their slaughter hogs through terminals in 1925," versus 13.5 percent in 1980. They suggest that improvements in transportation after 1920 resulted in packers relocating closer to producers. Packers began to buy hogs at the packing plant directly or at buying stations staffed by the company's buying agents.
Over two-thirds of market hogs were purchased using spot prices at the packing plant or company buying stations in 1993 (table 1) (Hayenga and others, 1996). Another 16.5 percent were bought at spot prices from dealers and order buyers. The appearance of vertical linkages between packers and producers is shown in the 10.7 percent of hogs bought through continuing and fixed-term marketing contracts. By 1998, packers expect to buy over a third of their hogs through marketing contracts, direct production, and production contracts offered by packers.
The size of the hog supplier operation plays an important role in determining which method of marketing is used. In 1994, the smallest producer operations marketed 79 percent of their hogs through the spot market, while none of the firms seUing more than 500,000 hogs sold any hogs in the spot market (Grimes and Rhodes, 1995[a]). Hayenga and others, 1996, surveyed 45 very large hog producer operations with regard to 1993 hog
Figure 3
Retail prices of beef, porl<, and broilers as a share of 1970 price, 1970-94
Percent
140
120
100
40 _J 1 1 L_
1970 75
Source: ERS, USDA.
80 85 90 94
Table 1—Packer coordinating arrangements, 19 largest packers, 1993 and 1998 expected
Arrangement 1993 volume
1998 expected volume
Million head Percent
Spot at plant or station 53.3 67.8 58.9
Spot from terminal or auction 1.9 2.4 1.2
Spot from dealer or order buyer 12.9 16.5 6.1
All spot market 68.1 86.6 66.1 Contract, continuing 3.0 3.8 11.2 Contract, definite length 5.4 6.9 14.4 All marketing contracts 8.4 10.7 25.6
Own or joint facilities 1.1 1.4 5.1 Production contract 0.7 0.9 1.6 All own/contract
production 1.8 2.3 6.7
Other 0.3 0.4 1.6 Total 78.6 100.0 100.0
Source: Compiled by ERS, USDA from Hayenga and others, 1996.
marketings. Three-quarters of all hogs marketed by the 45 firms were sold through marketing contracts. Another 8 percent of the marketings by these firms "were controlled by packers via ownership, joint venture, or contract production." Of these 45 firms, those located in the Com Belt were more likely to sell through spot markets (26 percent of sales) than those in the rest of the country (14 percent of sales). The provisions of marketing agreements include prices based on a formula derived from current prices at several Midwest markets (terminal or
Figure 4
Per capita consumption of poric, beef, and broilers, 1970-94
Retail pounds
100
20 _i I I I I i_ _i I ' I
1970 75
Source: ERS, USDA.
80 85 90 94
USDA/Economic Research Service Vertical Coordination and Consumer Welfare / 5
direct) plus premiums or discounts for quality. Hayenga and others, 1996, also reported that "packers usually attached requirements to contracts regarding the quality, size, and timing of the producers' market hog deUveries."
Another important change in the marketing of finished hogs has been the introduction of carcass merit (value) pricing. Historically, the price paid for a hog was negotiated on the basis of the Uve weight of the hog. Hogs might be graded according to the broad USDA grading standards or sorted into categories by buying or selling agents. In recent years, the pricing system has dramatically shifted to carcass merit pricing. Under this system, the carcass is weighed and inspected after slaughter. Premiums or discounts are offered based on the carcass weight and size, backfat measures (serves as a proxy for total fat), muscling, the quahty of seller's previous loads, and the size of the lot. The premium/discount schedule and the base carcass price can vary substantially among packers. In a study of 10 packers using this pricing system, Kenyon and others found that the average difference between an ideal carcass price and the average carcass price was almost $4 per hundredweight (cwt) ($55.13 versus $51.34 per cwt). In 1994, 84 percent of the hogs marketed by production contractors were sold under carcass merit pricing compared with 60 percent of hogs marketed by independents (Grimes). The number of hogs purchased under carcass merit pricing increased from 14 percent in 1984 to 74 percent in 1993 (Kenyon and others). The introduction of carcass merit pricing has created strong incentives for farmers to produce the type of hogs most valued by packers in producing pork products for consumers.
Marketing contracts between producers and packers are reducing procurement costs and eliminating the supply variabiUty that is costly to packers. The closer coordination between individual producers and packers also allows more identification of the source and more control of the characteristics of pork products. Contractual arrangements between producers and packers and vertical integration also have been referred to as "captive supplies." Captive supplies raise concerns that packers may exploit producers selUng on the spot market, market price information may be less public, and markets may become less efficient as a result.
Packing/Processing Sector
Packing firms purchase hve hogs that are slaughtered and cut into wholesale pork cuts, with over 50 percent sold as fresh cuts directly to retailers and 40 percent further processed by the processor (Hayenga and others, 1985), The processing firms produce processed meats (for example, sausage, canned ham, bacon, luncheon meats) that are then sold to retailers, wholesalers, or institutional buyers. Although the packing and processing sectors are integrated to a lesser extent than 20 years ago, there appears to be a high degree of vertical integration between the packing and processing stages. Packing firms tend to engage in further processing but they also sell raw product to processors solely engaged in processing. For example, when IBP and Excel entered the hog slaughtering business, they did not process. Established integrated packer/processor firms, like Oscar Mayer, then "disintegrated" to processing only.
Not surprisingly, the major packers are located in the largest pork-producing regions, operating multiple plants in different locations. A considerable number of packers are competing for hogs in the North Central region (Ilhnois, Iowa, Minnesota, Missouri, Kansas, Indiana, Nebraska, South Dakota, and Kentucky) with no single firm possessing more than 25 percent of available packing capacity. However, Smithfield (a significant user of contracts and integration) possesses 72 percent of the available packing capacity in the South Atlantic region (North Carolina, South Carohna, Virginia, Georgia, and Tennessee). According to Hayenga and others, 1996, over 13 percent of the top 19 packers' slaughter capacity in 1993 was committed to their own or contract production or long-term marketing contracts.
Substantial economies of scale may exist in packing/processing (Cassell and West). Most hog packing plants built recently in the United States include lines that can process 1,000 hogs per hour. Large packing plants operating near capacity result in lower packing and processing costs.
Retail Sales and Consumers
U.S. consumers are demanding a wider variety of high-quality food products (Kinsey). As the value
6 / Vertical Coordination and Consumer Welfare USDA/Economic Research Service
of consumers' time has increased and households have become smaller, consumers place a greater value on convenience of food products and assurances of food quality. Information Hnking diet and health has raised concerns about healthy eating and has led to demand for more nutritious products. In addition, the U.S. population is becoming more ethnically diverse, thereby creating niche markets.
Consumer trends affect how food is produced and marketed. In the United States, the proportion of food expenditures for food consumed away from home is increasing. The share of food expenditures spent on food away from home rose to 46 percent in 1995 from 42 percent in 1985 (Manchester and Claiison). Fast food restaurants accounted for 33.3 percent of expenditures on food away from home in 1994, while full-service restaurants accounted for 39.2 percent (Manchester and Clauson).
Restaurant chains make up significant portions of the market for food away from home. McDonald's 1993 domestic sales were $14.2 billion at 9,283 stores nationwide (Price). Full-service restaurant chains, such as Boston Market, are also important outlets for food. Educational institutions are the largest noncommercial outlet for food eaten away from home with over $19.5 billion in sales in 1994 (Price).
The trends toward more away-from-home food consumption and increased sales by large restaurant chains indicate that food suppliers must be able to provide large amounts of consistently high-quality, uniform products on a regular schedule. Many chain restaurants require very uniform input supplies so that they can provide their customers with consistent, reUable product quality. Because those chains handle large volumes of food, they also require large volumes of inputs on a regular schedule. Food wholesalers strive to meet retailers' demand, either by sorting variable raw product to obtain a product meeting buyer specifications or by purchasing a more uniform raw product.
The quantity of pork demanded may be affected by the ability to supply specified products to chain restaurants. The National Pork Producers Council reported that during the first 4 months of 1996, Hardee's restaurants were seUing 1.5 million pounds of bacon per month. When McDonald's restaurants introduced the Arch Deluxe sandwich, a new outlet
for miUions of pounds of bacon was opened. Similarly, when Boston Market added ham to its menu, a large new outlet for pork was opened.
Grocery stores and other outlets for food eaten at home remain very important to consumers and producers. Pork producers and processors are introducing new products, such as Smithfield Foods' Lean Generation branded line of lean, fresh pork products and Farmland Foods' line of "moisture enhanced" fresh pork.
A more ethnically diverse population creates opportunities for firms to target niche markets. The popularity of ethnic dishes, such as Caribbean, Mediterranean, and Asian, continues to grow. Pork is used more in ethnic dishes than are other meats (Kline), which creates opportunities to differentiate pork products for selected groups.
Motivating Forces for Changes in Coordination Between Producers and Packers
An increasingly important aspect of the "industrialization" of the pork industry is the replacement of traditional spot market transactions, between processors and packers, with vertical integration and vertical contractual exchanges. This section examines some of the theoretical literature on vertical integration and contracting that may be appUcable to the pork industry. The five motivations discussed may be broadly grouped into either transaction costs or market power theories.
IVIarket Power Theories
Market power theories suggest that vertical integration and contracting occurs to gain market power (Kinnucan and Nelson; Mighell and Jones) or to increase profits in imperfectly competitive markets (Royer; Wu; Azzam and Wellman). When firms seek greater vertical control to gain market power, marketing costs increase because marketing services are priced noncompetitively. As a result, retail supply falls and price rises. This motive is referred to by Kinnucan and Nelson as the concentration hypothesis. On the other hand, consumer effects of contracting or integration across noncompetitive vertical stages depend on market structure (for example, monopoly, oligopsony), type
USDA/Economic Research Service Vertical Coordination and Consumer Welfare / 7
of coordination (backward or forward), and method of coordination (integration or contracts) (Royer). The concentration hypothesis and profit motives arising from imperfect competition are discussed below.
Concentration Hypothesis
According to the concentration hypothesis, increased vertical control through contracting or integration may be used to gain market power by creating barriers to entry, practicing price discrimination at the retail stage, or avoiding monopoly pricing practices for inputs. Of these motives, the creation of barriers to entry into the processing industry seems most relevant for changes in coordination between pork packers and hog producers. Kinnucan and Nelson suggest that "integration may discourage nonintegrated entry because such firms run the risk of being subject to price squeezes and supply cutoffs." They also note that the integrating firm may "foreclose part of the market," preventing nonintegrated firms from achieving production levels sufficient to achieve economies of size. By blocking entry, the processor can exercise market power in the output (pork) market. The processor may, therefore, reduce output (and raise output prices) in order to maximize profits.
Imperfect Competition
Changes in vertical coordination that are motivated by maximizing profits in noncompetitive stages generally increase output, lower consumer prices, and increase social welfare (Royer). For example, Azzam and Wellman examined vertical integration in the pork industry, assuming backward integration by a monopsonistic packer into hog production. Under certain parametric assumptions, they found that increased integration would increase pork production and lower consumer price. There may, however, be instances where these arrangements can lower social welfare. Assuming monopolies at successive stages and variable-proportions production technology at the downstream stage, the upstream firms can gain control over input use at the downstream stage by integrating forward. It may then exploit its monopoly power to restrict output and decrease social welfare (Royer).
The Structure-Gonduct-Performance (SCP) paradigm posits that market structure (for instance, number of buyers and sellers, vertical integration) affects conduct (pricing behavior, research and innovation, and so forth), which determines market performance (for example, production and allocative efficiency). In contrast to the SCP paradigm, Demsetz argued that concentration leads to increases in efficiency, which led to the development of the theory of contestable markets (Purcell, 1990). With one or a few firms, ease of entry and exit could prevent significant departures from competitiveness. Hence, market structure alone is not sufficient evidence of anticompetitive behavior.
Empirical evidence of anticompetitive behavior in meatpacking has been mixed. Azzam and Pagoulatos, employing data through 1982, conclude that market power was present on both the buying and selling side of the meatpacking sector. Schroeter and Azzam find farm/wholesale margins in the pork industry during the 1980's to be consistent with competitive behavior in output markets. In a review of the literature on the meat packing industry, Azzam and Anderson (1996) find the evidence "insufficient to support a finding of noncompetitive behavior" but also insufficient to "conclude that the industry is competitive."
Large producers are more rehant on long-term marketing contracts compared to the larger packers, which suggests that the incentives to integrate could be greater for large producers (Hayenga and others, 1996). For example. Premium Standard Farms, Cargill, and Tyson were major producers that acquired packing plants near their production facilities to accommodate the slaughter of their hogs (Rhodes, 1995). This is not consistent with the belief that large packers are integrating to control production. Given these examples and the mixed empirical evidence supporting market power at the packing stage, we focus in the rest of this report on reducing transactions costs as motivation for changes in coordination.
Transactions Costs Theories
Transactions costs are costs associated with obtaining products in the open market, including such costs as measuring performance, creating incentives, and enforcing agreements to ensure desired performance. Transactions cost theory
8 / Vertical Coordination and Consumer Welfare USDA/Economic Research Service
suggests that vertical integration and contracting may actually reduce or eliminate these costs.
Opportunism and Specific Assets
Klein, Crawford, and Alchian argue that the use of specific assets in the production process of intermediate goods or services may create an incentive for vertical contracting and vertical integration. Specific assets are assets specifically designed or located to produce an intermediate good for one or a few buyers or sellers. A specific asset may be physical (unique physical characteristics), human (unique skills), or site (unique location) specific capital. The authors suggest that specific assets may generate quasi-rent streams and that these quasi-rents may be appropriated through the opportunistic behavior of others. They argue that these quasi-rents are the value of the asset in excess of the salvage value of the asset (or next best alternative use). An individual contemplating investment in a specific asset may agree to exchange with another party at prices that will ensure that the owner receives some level of quasi-rent from the specific asset. Once the investment is made, the second party may then renege on the agreement and offer a different price in order to appropriate the quasi-rents. As long as the second party offers a price only shghtly more favorable to the owners than they would receive in the next best alternative use of the asset, the owner may be forced to accept.
Long-term contracts and vertical integration serve to protect individuals from opportunism by trading partners. A large number of studies find that as the level of appropriable quasi-rents increases, the use of long-term contracts and vertical integration increases (see Shelanski and Klein for a review of the literature).
The investments necessary to take advantage of economies of size in hog production are substantial (for example, feed mills, confinement housing, and so forth). Likewise, the investments necessary to capture the economies of size in hog processing are also large (for example, packing plants, storage facilities). These types of investments might be considered site-specific assets. By locating a plant in an area with few hog producers, the processor creates a quasi-rent stream that might be appropriated by local producers. This quasi-rent stream is the difference between the prevailing price
of hogs in the local market before the investment is made and the cost of acquiring hogs in more distantly located markets (Martin). The costs of acquiring hogs in more distant markets include the price of the hog, and the costs of buyers' fees, transportation, and shrinkage. Once the plant is in place, local producers may attempt to appropriate the quasi-rents by demanding higher prices for their hogs. The hog producer who invests in production facilities in an area with few processors may be faced with the same type of problem. In this case, the processor may attempt to appropriate the quasi-rents from the producer, where the quasi-rents are the difference between the price the producer had expected to receive from the local processor and the price he or she might receive in a distantly located market (less transportation and shrinkage).
The use of long-term marketing agreements may also serve to reduce the potential for opportunism in the development of pork products with unique quaUty characteristics. One example might be PSE (pale, soft, exudative) free pork. The quahties associated with PSE result in lower quality pork and are highly related to the "stress gene" in the hogs processed. The NPPC estimates that PSE costs packers $3.29 per hog, with PSE affecting over 10 percent of U.S. hogs. Packers may reduce these costs by offering premiums to hog producers using genetic lines that are free of the stress gene. Current carcass merit pricing schemes used in spot markets offer no premiums for hogs bred from genetic Unes free of the stress gene. In order to receive premiums from packers, hog producers may be forced to make substantial investments in stress-gene-free breeding stock (physical-specific assets). Once the investment is in place, the premium over the spot market price offered by the packer becomes a quasi-rent that can be appropriated to the packer. If the packer lowers the premium offered, the producer is left with the alternative of accepting the reduced premium or selling in the spot market for no premium at all.
Surveys suggest that the use of long-term marketing contracts increases as the number of hogs marketed by the producer increases (Grimes and Rhodes, 1995[a]; Hayenga and others, 1996). The largest hog producer operations can provide a substantial portion of the daily packing needs of the typical packer (Hayenga and others, 1996). In the absence of contractual performance guarantees, opportunism by either party could impose substantial costs on the
USD A/Economic Research Service Vertical Coordination and Consumer Welfare/9
other. Without a contractual agreement, the large producer operation might have substantial shortrun difficulties in finding alternative markets for the large volume of hogs produced. Likewise, the packer might have difficulty replacing the large number of hogs anticipated from the large operation. Exchanges between smaller operations and packers are less likely to create difficulties for either party. Long-term contracts serve to reduce the likelihood of costly supply interruptions between packers and large producers.
The potential for opportunistic behavior by either party, or both parties, may preclude the use of the spot market in the presence of specific assets. A legally enforceable long-term contract with specific quahty provisions provides protection against short-term opportunism by either party. As the level of appropriable quasi-rents increases, the likelihood of vertical integration also increases. As a result, the level of appropriable quasi-rents increases the one-time benefit of reneging on a long-term contract.
Measurement and Sorting Costs
Changes in vertical coordination may also reduce transaction costs associated with asymmetric information and monitoring between different stages of production. A buyer of an intermediate product (input) may have difficulty in assessing the quality of the product. For example, the PSE pork quality problem in some pork carcasses is not easy to identify in carcasses at the time of grading. Barzel argues that, to judge the value of a good, its attributes must be measured. The cost of measuring these attributes may be expensive, and mistakes in measurement may result in wealth transfers. If there exists some variability in desirable attributes of the
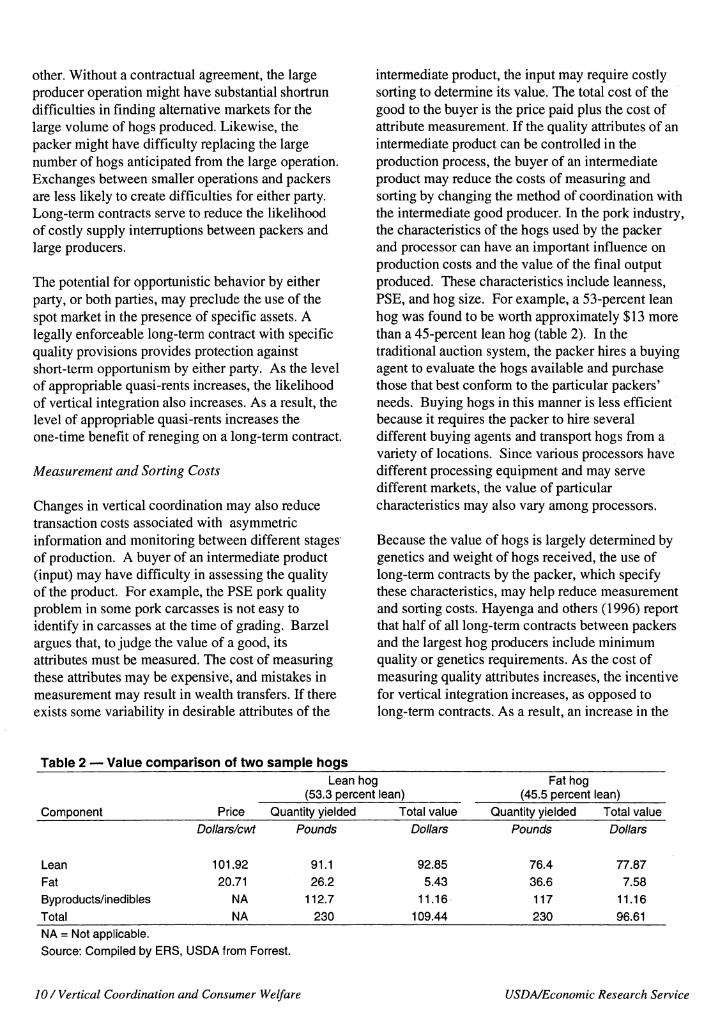
intermediate product, the input may require costly sorting to determine its value. The total cost of the good to the buyer is the price paid plus the cost of attribute measurement. If the quality attributes of an intermediate product can be controlled in the production process, the buyer of an intermediate product may reduce the costs of measuring and sorting by changing the method of coordination with the intermediate good producer. In the pork industry, the characteristics of the hogs used by the packer and processor can have an important influence on production costs and the value of the final output produced. These characteristics include leanness, PSE, and hog size. For example, a 53-percent lean hog was found to be worth approximately $13 more than a 45-percent lean hog (table 2). In the traditional auction system, the packer hires a buying agent to evaluate the hogs available and purchase those that best conform to the particular packers' needs. Buying hogs in this manner is less efficient because it requires the packer to hire several different buying agents and transport hogs from a variety of locations. Since various processors have different processing equipment and may serve different markets, the value of particular characteristics may also vary among processors.
Because the value of hogs is largely determined by genetics and weight of hogs received, the use of long-term contracts by the packer, which specify these characteristics, may help reduce measurement and sorting costs. Hayenga and others (1996) report that half of all long-term contracts between packers and the largest hog producers include minimum quality or genetics requirements. As the cost of measuring quality attributes increases, the incentive for vertical integration increases, as opposed to long-term contracts. As a result, an increase in the
Table 2 — Value comparison of two saniiple hogs Lean hog
(53.3 percent lean) Fat hog
(45.5 percent lean)
Component Price Quantity yielded Total value Quantity yielded Total value Dollars/cwt Pounds Dollars Pounds Dollars
Lean 101.92 91.1 92.85 76.4 77.87
Fat 20.71 26.2 5.43 36.6 7.58 Byproducts/inedibies NA 112.7 11.16 117 11.16
Total NA 230 109.44 230 96.61 NA = Not applicable.
Source: Compiled by ERS, USDA from Forrest.
10/Vertical Coordination and Consumer Welfare USD A/Economic Research Service
costs of measuring quality attributes also increases the cost of monitoring contractual performance in long-term contracts. This may be particularly important when buying hogs with quahty attributes that are costly to measure in the live hog. Quality attributes that might be expensive to measure in the Uve hog include leanness, PSE, drug residues, and carcass defects from injections.
Hennessy presents a model demonstrating that inaccuracies in measuring the quality of an intermediate agricultural product create incentives for vertical integration or the use of production contracts. In this model, information asymmetries exist between producers and processors regarding the quality of the intermediate product. Testing is required by the processor to determine the appropriate premium for the intermediate product. Inaccuracies in the testing of the product's quaUty result in reducing the incentive for producers to invest in assets that improve the quaUty of the intermediate product (for example, genetic stock, technical education, harvesting and storage equipment). Hennessy suggests that vertical integration and production contracts solve the problem by removing the need to test for quality.
Smith develops a sorting model where the cost of measuring the quality of the intermediate product (hogs) increases with the accuracy of the measurement. The incentive to sort hogs into different categories is based on information asymmetries between producers and processors. The producer is awarded premiums based on the expected quahty of the intermediate product. All of the intermediate products (hogs) are sorted into different categories, each with the same expected quahty. As the cost of measuring quality falls, the processor increases the accuracy of sorting and therefore the number of sorting categories. As the number of sorting categories increases, the producer receives premiums that more closely match the quahty of the intermediate product produced. This serves to increase the incentive for producers to invest in improving quahty. As the processor acquires more information on the inputs used in the production process of the intermediate product, the cost of sorting falls. This creates incentives for increased vertical coordination between producers and processors.
Stable Input Flows
The reason often given by business people for vertical integration is the need to assure a certain supply of key inputs or demand for outputs. Carlton and Perloff argue that firms are interested in the "timely delivery" of inputs. In "real world" situations, firms may not be able to purchase or sell all of the input they wish at the preyaihng price. In such situations, firms have an "incentive to vertically integrate in order to increase the probabihty of obtaining the product." Jensen, Kehrberg, and Thomas suggest that vertical integration may reduce costs of "under- or over-use of resources that stem from erroneous expectations and plans (viewed ex post) and reduces the need for insurance schemes used as adjustments to risk and uncertainty in unintegrated systems." Jensen, Kehrberg, and Thomas suggest that the "variability of supply and demand for inputs and outputs are a function of the nature of the products and their associated production processes." The authors indicate that, as the variability of the supply and the cost of storing the commodity increases, so does the incentive to coordinate production.
Due to the large fixed costs involved in hog packing and processing, deviations from producing at the optimum plant-scale level can involve substantial costs. Through increased coordination between hog producers and packers (through contracts or vertical integration), the production of hogs may be timed to coincide with the supply needs of the packer. By coordinating the timing of hog arrivals to the plant, the processor may substantially reduce the costs of overusing or underusing processing facihties. Without coordinating arrangements, plant efficiency may dechne and packers' production costs may rise.
Potential Market Effects of Changes in Vertical Coordination
Given the important motivational forces for changing methods of coordination between the pork production and packing stages, we explore the potential market effects. Effects on consumers of improved vertical coordination are indicated by the change in the retail price and product quahty.
USDA/Economic Research Service Vertical Coordination and Consumer Welfare/ÎÎ
Vertical Coordination and Suppiy Shifts at the Paclcing Stage
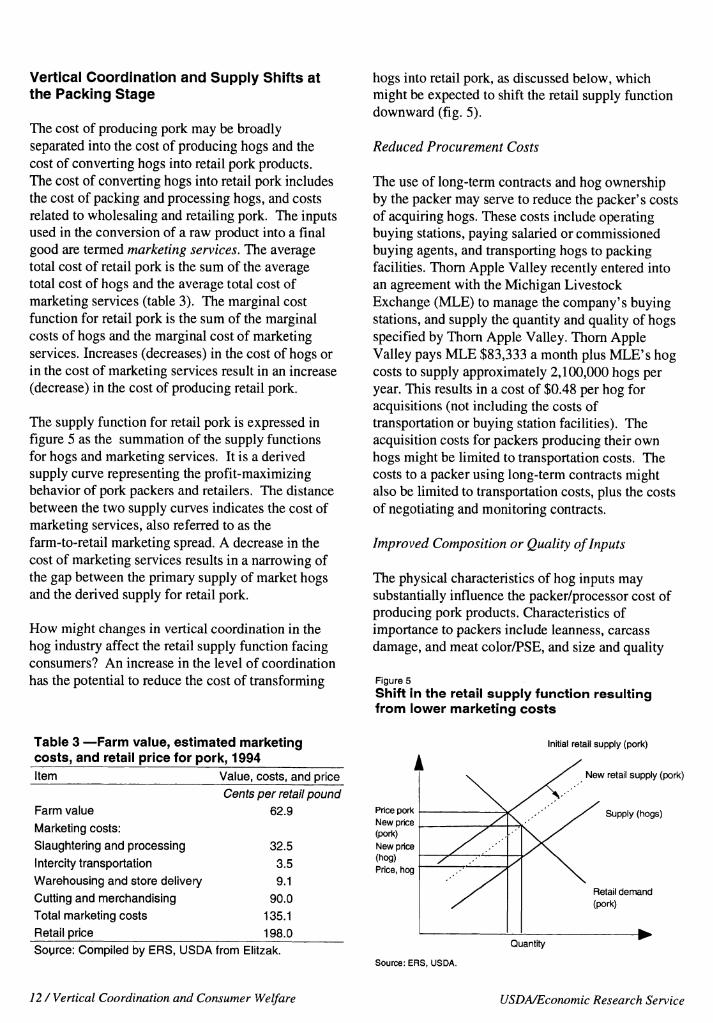
The cost of producing pork may be broadly separated into the cost of producing hogs and the cost of converting hogs into retail pork products. The cost of converting hogs into retail pork includes the cost of packing and processing hogs, and costs related to wholesaUng and retailing pork. The inputs used in the conversion of a raw product into a final good are termed marketing services. The average total cost of retail pork is the sum of the average total cost of hogs and the average total cost of marketing services (table 3). The marginal cost function for retail pork is the sum of the marginal costs of hogs and the marginal cost of marketing services. Increases (decreases) in the cost of hogs or in the cost of marketing services result in an increase (decrease) in the cost of producing retail pork.
The supply function for retail pork is expressed in figure 5 as the summation of the supply functions for hogs and marketing services. It is a derived supply curve representing the profit-maximizing behavior of pork packers and retailers. The distance between the two supply curves indicates the cost of marketing services, also referred to as the farm-to-retail marketing spread. A decrease in the cost of marketing services results in a narrowing of the gap between the primary supply of market hogs and the derived supply for retail pork.
How might changes in vertical coordination in the hog industry affect the retail supply function facing consumers? An increase in the level of coordination has the potential to reduce the cost of transforming
Table 3 —Farm value, estimated marketing costs, and retail price for pork, 1994 Item Value, costs, and price
1
Cents per retail pound Farm value 62.9 Price pork
Marketing costs: New price (pork)
Slaughtering and processing 32.5 New price
Intercity transportation 3.5 (hog)
Price, hog Warehousing and store delivery 9.1 Cutting and merchandising 90.0 Total marketing costs 135.1 Retail price 198.0
hogs into retail pork, as discussed below, which might be expected to shift the retail supply function downward (fig. 5).
Reduced Procurement Costs
The use of long-term contracts and hog ownership by the packer may serve to reduce the packer's costs of acquiring hogs. These costs include operating buying stations, paying salaried or commissioned buying agents, and transporting hogs to packing faciUties. Thorn Apple Valley recently entered into an agreement with the Michigan Livestock Exchange (MLE) to manage the company's buying stations, and supply the quantity and quaUty of hogs specified by Thorn Apple Valley. Thorn Apple Valley pays MLE $83,333 a month plus MLE's hog costs to supply approximately 2,100,000 hogs per year. This results in a cost of $0.48 per hog for acquisitions (not including the costs of transportation or buying station facilities). The acquisition costs for packers producing their own hogs might be limited to transportation costs. The costs to a packer using long-term contracts might also be limited to transportation costs, plus the costs of negotiating and monitoring contracts.
Improved Composition or Quality of Inputs
The physical characteristics of hog inputs may substantially influence the packer/processor cost of producing pork products. Characteristics of importance to packers include leanness, carcass damage, and meat color/PSE, and size and quaUty
Figure 5
Shift in the retail supply function resulting from lower marketing costs
Initial retail supply (pork)
New retail supply (pork)
Supply (hogs)
Sogrce: Compiled by ERS, USDA from Elitzak. Quantity
Source: ERS, USDA.
12 / Vertical Coordination and Consumer Welfare USDA/Economic Research Service
consistency. Hogs with excessive fat raise packer costs due to the costs of trimming the excess fat. Moreover, lean hogs provide a larger amount of salable lean meat and thereby reduce the number of hogs needed by the packer to produce a given level of pork. Carcass damage may require additional packer costs in trimming damaged areas and in discarding damaged areas unusable as pork. PSE and meat color problems may cause pork cuts best suited for fresh pork to be used in further processed pork (for example, sausage). Sonka and others summarize results from surveys conducted by Colorado State University and University of Illinois meat scientists on potential cost reductions at the packer level resulting from increased leanness. They report that per hog packer costs related to hog quaUty characteristics were increased $6.53 per head from leanness problems, $2.93 from carcass problems, and $0.66 from color/PSE and size and quality consistency. These costs are controlled at the farm stage through the choice of genetic stock and through proper management at the farm level. Long-term marketing contracts between hog producers and packers might be expected to reduce these costs by specifying the genetic strains of the hogs delivered. Packers that acquire hogs from company-owned facilities (ownership integration) may directly control these costs since they directly control genetic selection and management techniques used in production.
Improved Product Flow
By contracting or producing hogs themselves, packers can control the flow of hogs entering their plants. This allows the packer to run packing facilities at optimum (minimum average cost) levels (see box and Appendix A). Increased variability in the number of hogs slaughtered may result in increased packing costs by underusing or overusing existing facilities. Several somewhat dated studies suggest substantial packing cost reductions as plants run at near-capacity levels (Cassell and West; Dallenbach and Fletcher). Increased variability in the quality of hogs slaughtered might also be expected to increase the costs at the packer level. A uniformity of hogs with regard to such characteristics as weight and leanness allows a higher degree of automation in the packing production process.
Vertical Coordination and Consumer Demand Sliifters
Common examples of demand shifters for a product include consumer income, the prices of other products, and consumer tastes and preferences. Consumer demand shifters affected by vertical coordination are characteristics of the product itself. A product can be considered as a bundle of attributes that may be positively or negatively valued by each consumer. Attributes of food products that consumers may value include taste, texture, appearance, healthfulness (nutritive attributes and food safety attributes), reliability or consistency, convenience (availability and ease of preparation/consumption), and source. Each of these attributes can be a demand shifter if a change in the attribute results in a change in the quantity of product demanded at a given price.
Improved coordination can affect demand in several ways. Examples of three effects are described below.
Quality
In addition to such demand shifters as income, population, tastes and preferences for a given quality of product, and related product prices, an improvement in product quahty can also shift out the demand curve for the product. This requires an understanding within the food marketing system of the meat characteristics that consumers value and are willing to pay. The Consumers Goods Characteristics Model, developed by Ladd and Suvannunt, provides the underlying theory for relating product quality improvements and consumer demand shifts. Consumers derive utiUty from the characteristics of the products that they consume. Under certain simphfying assumptions, the price of a product depends on the sum of the marginal values of the products' characteristics, which depend on the amount of characteristics derived from a single unit of product and the values placed on the characteristics. A quality improvement will increase the quantity of a desirable characteristic in a unit of product. This will result in an increase in the quantity of product consumed, assuming that the market price of the product and the level of other
Increased leanness refers to a reduction in backfat and seam fat. See Unnevehr and Lemieux and Wohlgenant for an application
of the model to rice and pork, respectively.
USD A/Economic Research Service Vertical Coordination and Consumer Welfare/13
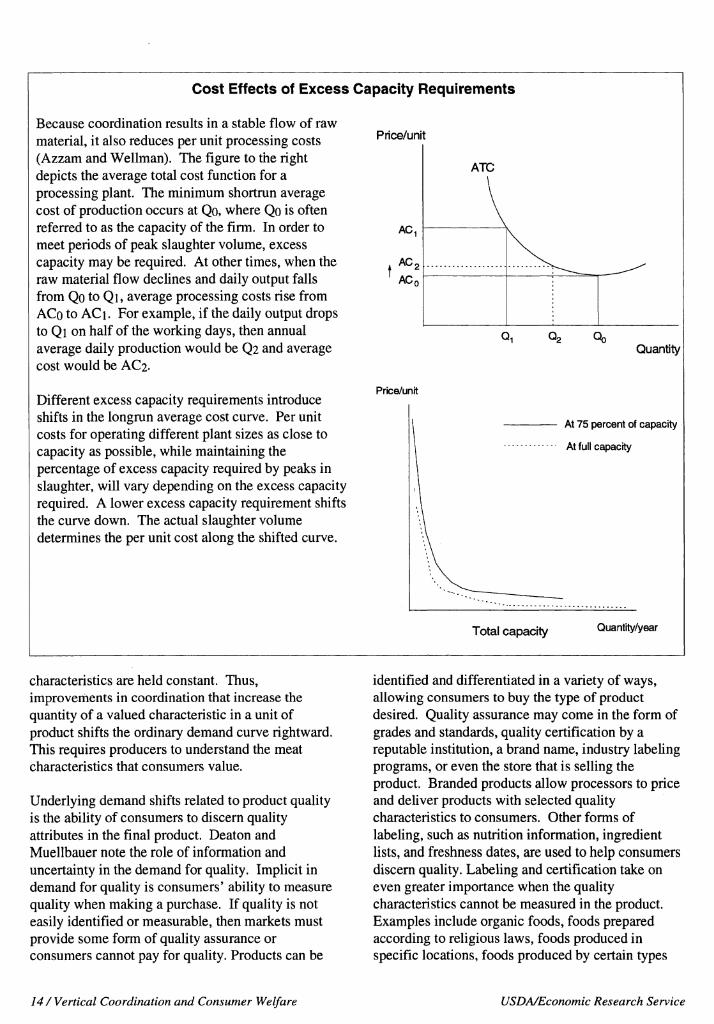
Cost Effects of Excess Capacity Requirements
Because coordination results in a stable flow of raw material, it also reduces per unit processing costs (Azzam and Wellman). The figure to the right depicts the average total cost function for a processing plant. The minimum shortrun average cost of production occurs at Qo, where Qo is often referred to as the capacity of the firm. In order to meet periods of peak slaughter volume, excess capacity may be required. At other times, when the raw material flow decUnes and daily output falls from Qo to Qi, average processing costs rise from ACo to ACi. For example, if the daily output drops to Qi on half of the working days, then annual average daily production would be Q2 and average cost would be AC2.
Different excess capacity requirements introduce shifts in the longrun average cost curve. Per unit costs for operating different plant sizes as close to capacity as possible, while maintaining the percentage of excess capacity required by peaks in slaughter, will vary depending on the excess capacity required. A lower excess capacity requirement shifts the curve down. The actual slaughter volume determines the per unit cost along the shifted curve.
Price/unit
Price/unit
Quantity
At 75 percent of capacity
At full capacity
Total capacity Quantity/year
characteristics are held constant. Thus, improveriients in coordination that increase the quantity of a valued characteristic in a unit of product shifts the ordinary demand curve rightward. This requires producers to understand the meat characteristics that consumers value.
Underlying demand shifts related to product quality is the abiUty of consumers to discern quaUty attributes in the final product. Deaton and Muellbauer note the role of information and uncertainty in the demand for quality. Implicit in demand for quaUty is consumers' ability to measure quaUty when making a purchase. If quaUty is not easily identified or measurable, then markets must provide some form of quahty assurance or consumers cannot pay for quahty. Products can be
identified and differentiated in a variety of ways, allowing consumers to buy the type of product desired. Quahty assurance may come in the form of grades and standards, quality certification by a reputable institution, a brand name, industry labehng programs, or even the store that is selling the product. Branded products allow processors to price and deliver products with selected quality characteristics to consumers. Other forms of labehng, such as nutrition information, ingredient hsts, and freshness dates, are used to help consumers discern quahty. Labeling and certification take on even greater importance when the quality characteristics cannot be measured in the product. Examples include organic foods, foods prepared according to religious laws, foods produced in specific locations, foods produced by certain types
14 / Vertical Coordination and Consumer Welfare USDA/Economic Research Service
of fanners, animal products produced under certain conditions of animal welfare, and even meat from animals from certain genetic lines.
Niche Markets, Market Segments, and Optimal Sorting
Consumers are not a homogenous group. Instead, they have diverse tastes and preferences. In order to maximize consumer utility subject to resource constraints, a product marketing system must achieve an optimal level of sorting or differentiation. The optimal level of sorting will differentiate levels of quality of a product to the point that the cost of additional sorting is equal to consumers' willingness to pay for further differentiated product quality. Barzel provides a model of optimal levels of sorting by sellers to meet diverse consumers' demand. Measuring and sorting are costly so processors or retailers will not sort beyond some level of differentiation. Increased vertical coordination may result in less sorting being required, less costly quality assurance, and possibly better product identification and assurance of source and method of production.
Deaton and Muellbauer discuss market segments as an area of economics of demand for quality that has not been studied in great detail. It seems clear that to fully exploit the aggregate demand for a product, each segment or demand for product with certain characteristics must be exploited to the same degree. Larger segments of consumers may be best served by large-scale suppHers taking advantage of economies of size, while smaller segments or niche markets may better be served by smaller specialized firms.
Aggregate demand for a product can be shifted by sorting the product to supply a market segment that had not been adequately supplied before. For example, if overall quality of pork is unchanged but the leanest pork is sorted and labeled so that the segment preferring lean pork is willing to pay more or consume more, then aggregate demand is increased. The optimal level of sorting allows a diverse population of consumers to maximize their utility for any given supply of a product. Inadequate sorting would result in consumer dissatisfaction with quahty or rehability, while excessive sorting would result in too high a price.
Convenience and Availability
A third example of a demand shifter is an improvement in convenience and availability. A marketing system must make a product available in the volume, place, and form and at the time that consumers prefer, to the extent that they are willing to pay for it. For example, a food marketing system may have to satisfy additional requirements to have a product widely available for away-from-home consumption. Demand can be shifted by providing a large volume of product on a regular schedule with a high degree of uniformity (quality, portion, safety, and so forth). Volume and consistency may also be important in supplying grocery store chains as more meat is delivered already packaged to be placed directly on the shelf.
Net Effect of Improvements in Coordination
To understand the potential net market effect of improvements in coordination of the pork industry, consider figure 6, which illustrates the market demand and supply for pork at the retail stage. At the initial equilibrium, the retail price is PO and retail quantity is QO.
Now consider packers and producers that establish contracts for delivery of finished hogs or integration of the two stages. Higher quality hogs, manifested in quahty improvements of pork products, shift out the demand for pork from Dr to Dr'. Improving the quality and quantity of hogs reduces marketing costs, which shifts the retail supply curve from Sr to Sr'. The shifts in supply and demand result in a new equilibrium at Ql and PI. The new equilibrium quantity is unambiguously larger. The net effect on the retail price is indeterminant, depending on the elasticities of supply and demand and on the extent of the horizontal shift out in supply and demand. In figure 6, the shift out in supply exceeds that of demand, so that the retail price falls.
Figure 6 can also be used to illustrate the gains in consumer surplus from improved coordination of vertical stages. Assuming the same absolute reduction in costs and increase in demand at all quantities, there is a consumer surplus gain equal to the shaded area (Lemieux and Wohlgenant).
USDA/Economic Research Service Vertical Coordination and Consumer Welfare /15
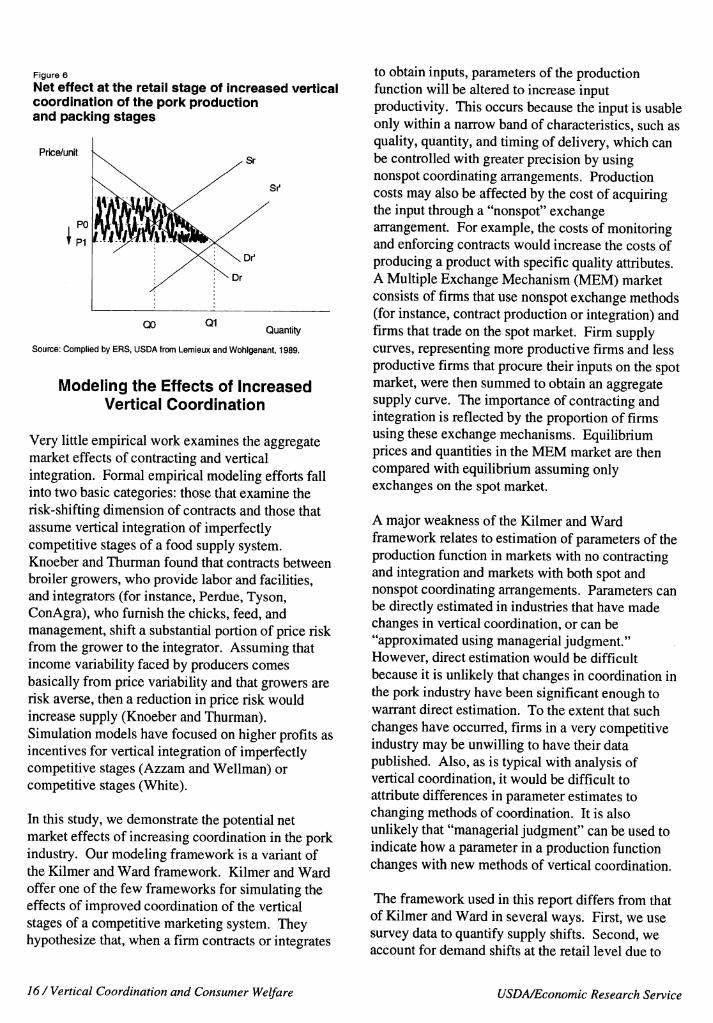
Figure 6
Net effect at the retail stage of increased vertical coordination of the pork production and packing stages
Price/unit
Quantity
Source: Complied by ERS, USDA from Lemieux and Wohlgenant, 1989.
Modeling the Effects of Increased Vertical Coordination
Very little empirical work examines the aggregate market effects of contracting and vertical integration. Formal empirical modeling efforts fall into two basic categories: those that examine the risk-shifting dimension of contracts and those that assume vertical integration of imperfectly competitive stages of a food supply system. Knoeber and Thurman found that contracts between broiler growers, who provide labor and facilities, and integrators (for instance, Perdue, Tyson, ConAgra), who furnish the chicks, feed, and management, shift a substantial portion of price risk from the grower to the integrator. Assuming that income variability faced by producers comes basically from price variability and that growers are risk averse, then a reduction in price risk would increase supply (Knoeber and Thurman). Simulation models have focused on higher profits as incentives for vertical integration of imperfectly competitive stages (Azzam and Wellman) or competitive stages (White).
In this study, we demonstrate the potential net market effects of increasing coordination in the pork industry. Our modeling framework is a variant of the Kilmer and Ward framework. Kilmer and Ward offer one of the few frameworks for simulating the effects of improved coordination of the vertical stages of a competitive marketing system. They hypothesize that, when a firm contracts or integrates
to obtain inputs, parameters of the production function will be altered to increase input productivity. This occurs because the input is usable only within a narrow band of characteristics, such as quality, quantity, and timing of delivery, which can be controlled with greater precision by using nonspot coordinating arrangements. Production costs may also be affected by the cost of acquiring the input through a "nonspot" exchange arrangement. For example, the costs of monitoring and enforcing contracts would increase the costs of producing a product with specific quality attributes. A Multiple Exchange Mechanism (MEM) market consists of firms that use nonspot exchange methods (for instance, contract production or integration) and firms that trade on the spot market. Firm supply curves, representing more productive firms and less productive firms that procure their inputs on the spot market, were then summed to obtain an aggregate supply curve. The importance of contracting and integration is reflected by the proportion of firms using these exchange mechanisms. Equilibrium prices and quantities in the MEM market are then compared with equilibrium assuming only exchanges on the spot market.
A major weakness of the Kilmer and Ward framework relates to estimation of parameters of the production function in markets with no contracting and integration and markets with both spot and nonspot coordinating arrangements. Parameters can be directly estimated in industries that have made changes in vertical coordination, or can be "approximated using managerial judgment." However, direct estimation would be difficult because it is unlikely that changes in coordination in the pork industry have been significant enough to warrant direct estimation. To the extent that such changes have occurred, firms in a very competitive industry may be unwilling to have their data pubhshed. Also, as is typical with analysis of vertical coordination, it would be difficult to attribute differences in parameter estimates to changing methods of coordination. It is also unlikely that "managerial judgment" can be used to indicate how a parameter in a production function changes with new methods of vertical coordination.
The framework used in this report differs from that of Kilmer and Ward in several ways. First, we use survey data to quantify supply shifts. Second, we account for demand shifts at the retail level due to
16/Vertical Coordination and Consumer Welfare USDA/Economic Research Service
food quality improvements. Third, Kilmer and Ward focused on consumer effects, whereas we focused on farm stage effects. Finally, we use percentage of hog sales through contract production or vertical integration to reflect their importance in the pork industry, instead of the proportion of firms using these arrangements. This is because firms can use several methods of coordination at the same time.
To demonstrate potential consumer effects of changing vertical coordination in the U.S. pork industry, we first derive potential aggregate supply and demand shifts that result from increased coordination between the production and packing stages. Next, we employ a U.S. pork model to obtain consumer price and welfare effects of improved coordination. These steps are explained in greater detail below.
Estimating Supply and Demand Shifts Related to Improved Quality and Lower Acquisition Costs
Following the methodology used by Sonka and others for estimating supply and demand shifts related to improved pork quality, the effects of increased coordination of the production and packer stages are represented as demand and supply shifters. We estimated shifts in retail demand related to improved leanness and shifts in retail supply related to improved leanness and lower hog acquisition costs. Demand shifts related to reduction in the "fatness" attribute were examined because more information exists regarding consumer preferences for leaner pork compared with other quality attributes, such as PSE (Sonka and others). Next, improvements in leanness were attributed to long-term contracts and vertical integration, and demand and supply shifts were adjusted accordingly.
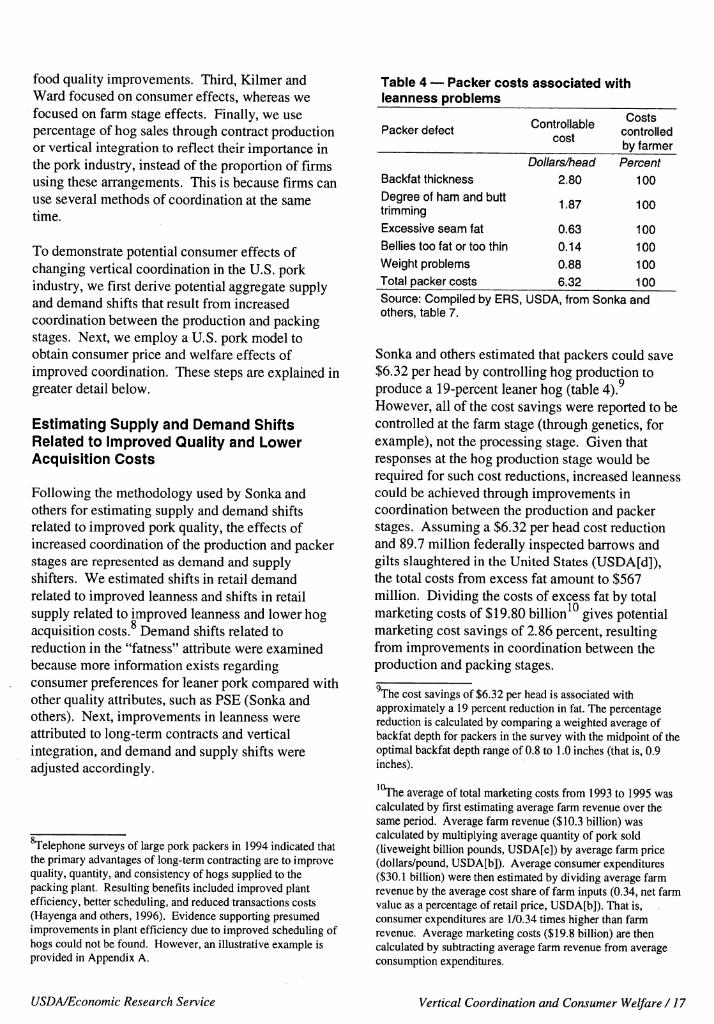
Table 4 — Packer costs associated with leanness problems
Telephone surveys of large pork packers in 1994 indicated that the primary advantages of long-term contracting are to improve quality, quantity, and consistency of hogs supplied to the packing plant. Resulting benefits included improved plant efficiency, better scheduling, and reduced transactions costs (Hayenga and others, 1996). Evidence supporting presumed improvements in plant efficiency due to improved scheduling of hogs could not be found. However, an illustrative example is provided in Appendix A.
Packer defect Controllable cost
Costs controlled by farmer
1.87 100
Dollars/head Percent Backfat thickness 2.80 100
Degree of ham and butt trimming
Excessive seam fat 0.63 100
Bellies too fat or too thin 0.14 100
Weight problems 0.88 100 Total packer costs 6.32 100
Source: Compiled by ERS, USDA, from Sonka and others, table 7.
Sonka and others estimated that packers could save $6.32 per head by controUing hog production to produce a 19-percent leaner hog (table 4).^ However, all of the cost savings were reported to be controlled at the farm stage (through genetics, for example), not the processing stage. Given that responses at the hog production stage would be required for such cost reductions, increased leanness could be achieved through improvements in coordination between the production and packer stages. Assuming a $6.32 per head cost reduction and 89.7 million federally inspected barrows and gilts slaughtered in the United States (USDA[d]), the total costs from excess fat amount to $567 miUion. Dividing the costs of excess fat by total marketing costs of $19.80 billion^^ gives potential marketing cost savings of 2.86 percent, resulting from improvements in coordination between the production and packing stages.
The cost savings of $6.32 per head is associated with approximately a 19 percent reduction in fat. The percentage reduction is calculated by comparing a weighted average of backfat depth for packers in the survey with the midpoint of the optimal backfat depth range of 0.8 to 1,0 inches (that is, 0.9 inches).
^^e average of total marketing costs from 1993 to 1995 was calculated by first estimating average farm revenue over the same period. Average farm revenue ($10.3 billion) was calculated by multiplying average quantity of pork sold (liveweight billion pounds, USDA[e]) by average farm price (dollars/pound, USDA[b]). Average consumer expenditures ($30.1 billion) were then estimated by dividing average farm revenue by the average cost share of farm inputs (0.34, net farm value as a percentage of retail price, USDA[b]). That is, consumer expenditures are 1/0.34 times higher than farm revenue. Average marketing costs ($19.8 billion) are then calculated by subtracting average farm revenue from average consumption expenditures.
USDA/Economic Research Service Vertical Coordination and Consumer Welfare /17
Because direct evidence could not be found relating long-term contracts and vertical integration to reductions in fat, we infer this relationship using survey results and firm-level cases. In a 1993 survey of the 19 largest pork packers, each was asked to give primary reasons for using long-term contracts (Hayenga and others, 1996). Seven of the 10 respondents ranked improved quality as the most significant reason. Smithfield Foods, a leading packer in the pork industry, emphasizes the importance of long-term contracts and vertical integration in obtaining consistent supplies of lean, high-quality hogs (Smithfield Foods, Inc.). In fiscal year 1996, it bought approximately 61 percent of its hogs through long-term agreements and integrated operations. It touts its National Pig Development (NPD) program as an excellent demonstration of the effects of a highly coordinated operation. Through Smithfield Carroll's, a joint hog production operation with a major North Carolina hog producer, Carroll's Foods, Smithfield Foods obtained exclusive rights to develop and market the NPD breed of hog. This breed produces the leanest hog in U.S. commercial production and one of the leanest meats of any kind, including chicken.
Nutritional studies indicate that NPD pork is 35 percent to 73 percent leaner than non-NPD pork, depending on the cut. Although pork with this degree of leanness would appear to be targeted toward a niche market (for example, health care facilities, exports to Japan), it does suggest that a 19-percent reduction in fat from increasing vertical control through contracting or integration is realistic. Farmland Foods and Excel also offer contracts with specific requirements regarding leanness (Freese and others).
Assuming that increased leanness is achieved through contracting and integration, another potential source of cost savings are hog acquisition costs. Assuming 89.7 miUion hogs slaughtered in the United States and a $0.48-per-hog reduction in buying agent costs, hog acquisition cost savings as a percentage of total marketing costs ($19.80 billion) are 0.22 percent. Adding this to packer cost reductions due to increased leanness (2.86 percent), the net percentage change in marginal cost is
(1) -(2.86 + 0.22)-a = -3.08.a
where a is the percentage of market hog sales through long-term contracting and vertically integrated operations (that is, nonspot coordinating arrangements). Percentage shifts are adjusted down to reflect the degree of contracting and integration in the hog industry. A similar approach was used by Lemieux and Wohlgenant to reflect adoption rates of the growth hormone porcine somatotropin (PST).
The shift in the demand for pork from a 19-percent reduction in fat is calculated in our study using consumer premiums placed on leaner pork. Because we could not locate an estimate of consumers' value of a reduction in the characteristic "fatness" in pork, we derived the premium placed on 19 percent leaner pork by using consumers' willingness to pay for 10 percent leaner pork. Lemieux and Wohlgenant used survey data to estimate consumers' willingness to pay for leaner pork that is produced by PST. They found that mean willingness to pay for 10 percent leaner PST pork was 4.3 percent of the retail price. Using a Unear interpolation of consumers' wiUingness to pay for 10 percent leaner PST pork, we estimate that consumers' willingness to pay for 19 percent leaner pork is 8.2 percent of the retail price of pork.^^ Assuming that the willingness to pay for leaner pork applies to only fresh pork, which comprises only 25 percent of total pork consumption (Sonka and others), the percentage demand shift is estimated to be 2.0^a (that is, 8.20.25-a), where a reflects the degree of contracting and integration.
We use two estimates of the degree of contracting and integration in the pork industry. Hayenga and others (1996) surveyed 19 large packing operations in 1994, accounting for 86 percent of U.S. hog slaughter in 1993. The results showed that contracting and integration accounted for about 13 percent of the surveyed packers' market hog transactions in 1993, and was projected to increase to 34 percent by 1998. We assumed that packing operations excluded from the survey (14 percent of
Although available evidence suggests a negative relationship between fat (backfat and seam fat) in beef cuts and prices at retail (Unnevehr and Bard), such conclusive evidence does not exist for pork (Sonka and others).
ihis estimate is based on consumers' willingness to pay for leaner PST pork at a particular time. Consumers' willingness to pay may vary for leanness obtained through genetic advances or over time as consumer preferences change.
18/Vertical Coordination and Consumer Welfare USD A/Economic Research Service
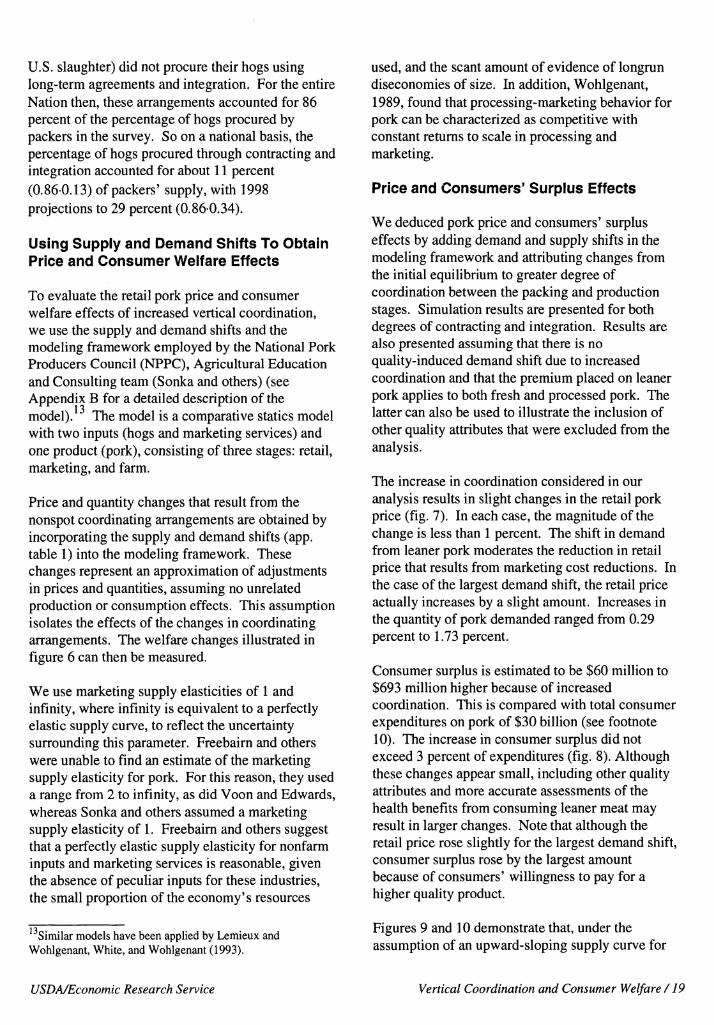
U.S. slaughter) did not procure their hogs using long-term agreements and integration. For the entire Nation then, these arrangements accounted for 86 percent of the percentage of hogs procured by packers in the survey. So on a national basis, the percentage of hogs procured through contracting and integration accounted for about 11 percent (0.860.13) of packers' supply, with 1998 projections to 29 percent (0.860.34).
Using Supply and Demand Shifts To Obtain Price and Consumer Welfare Effects
To evaluate the retail pork price and consumer welfare effects of increased vertical coordination, we use the supply and demand shifts and the modehng framework employed by the National Pork Producers Council (NPPC), Agricultural Education and Consulting team (Sonka and others) (see Appendix B for a detailed description of the model). The model is a comparative statics model with two inputs (hogs and marketing services) and one product (pork), consisting of three stages: retail, marketing, and farm.
Price and quantity changes that result from the nonspot coordinating arrangements are obtained by incorporating the supply and demand shifts (app. table 1) into the modeling framework. These changes represent an approximation of adjustments in prices and quantities, assuming no unrelated production or consumption effects. This assumption isolates the effects of the changes in coordinating arrangements. The welfare changes illustrated in figure 6 can then be measured.
We use marketing supply elasticities of 1 and infinity, where infinity is equivalent to a perfectly elastic supply curve, to reflect the uncertainty surrounding this parameter. Freebaim and others were unable to find an estimate of the marketing supply elasticity for pork. For this reason, they used a range from 2 to infinity, as did Voon and Edwards, whereas Sonka and others assumed a marketing supply elasticity of 1. Freebaim and others suggest that a perfectly elastic supply elasticity for nonfarm inputs and marketing services is reasonable, given the absence of peculiar inputs for these industries, the small proportion of the economy's resources
13c;. Similar models have been applied by Lemieux and Wohlgenant, White, and Wohlgenant (1993).
used, and the scant amount of evidence of longrun diseconomies of size. In addition, Wohlgenant, 1989, found that processing-marketing behavior for pork can be characterized as competitive with constant returns to scale in processing and marketing.
Price and Consumers' Surplus Effects
We deduced pork price and consumers' surplus effects by adding demand and supply shifts in the modeling framework and attributing changes from the initial equilibrium to greater degree of coordination between the packing and production stages. Simulation results are presented for both degrees of contracting and integration. Results are also presented assuming that there is no quality-induced demand shift due to increased coordination and that the premium placed on leaner pork applies to both fresh and processed pork. The latter can also be used to illustrate the inclusion of other quaUty attributes that were excluded from the analysis.
The increase in coordination considered in our analysis results in slight changes in the retail pork price (fig. 7). In each case, the magnitude of the change is less than 1 percent. The shift in demand from leaner pork moderates the reduction in retail price that results from marketing cost reductions. In the case of the largest demand shift, the retail price actually increases by a slight amount. Increases in the quantity of pork demanded ranged from 0.29 percent to 1.73 percent.
Consumer surplus is estimated to be $60 million to $693 milUon higher because of increased coordination. This is compared with total consumer expenditures on pork of $30 billion (see footnote 10). The increase in consumer surplus did not exceed 3 percent of expenditures (fig. 8). Although these changes appear small, including other quality attributes and more accurate assessments of the health benefits from consuming leaner meat may result in larger changes. Note that although the retail price rose slightly for the largest demand shift, consumer surplus rose by the largest amount because of consumers' willingness to pay for a higher quality product.
Figures 9 and 10 demonstrate that, under the assumption of an upward-sloping supply curve for
USDA/Economic Research Service Vertical Coordination and Consumer Welfare /19
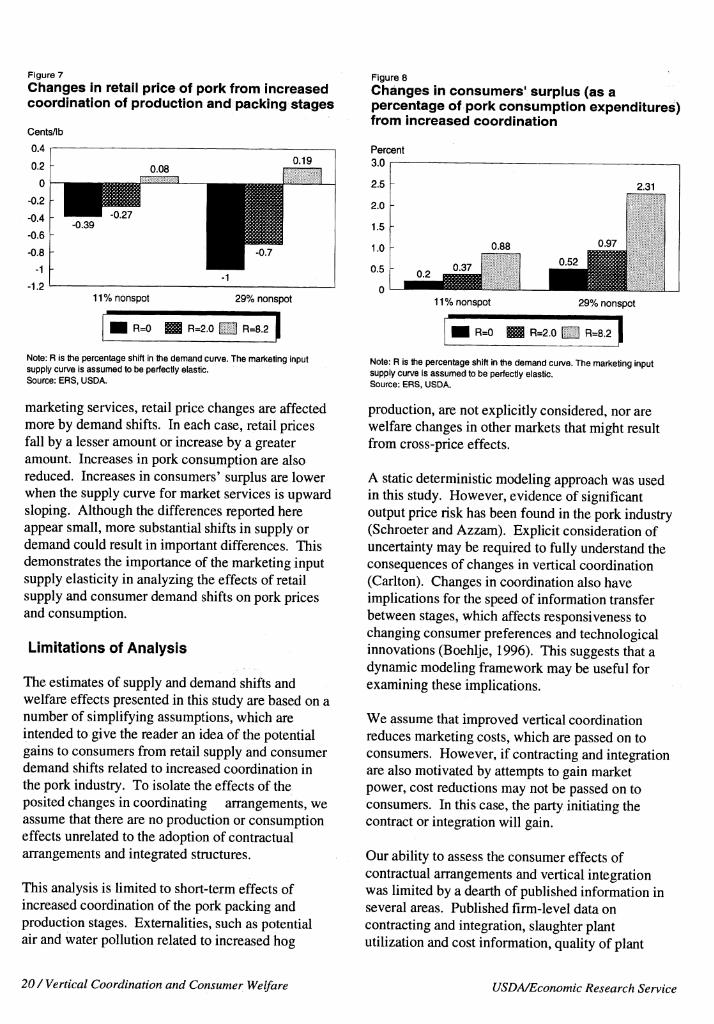
Figure 7
Changes in retail price of pork from increased coordination of production and paclcing stages
Cents/lb
0.4
0.2
0
-0.2
-0.4
-0.6
-0.8
-1
-1.2
0.19 u.uo
mmmmm liilii
-1
-0.7 ^
11 % nonspot 29% nonspot
R=0 W R=2.0 □ R=8.2 I
Note: R is the percentage shift in the demand curve. The marketing input supply cun/e is assumed to be perfectly elastic. Source: ERS, USDA.
marketing services, retail price changes are affected more by demand shifts. In each case, retail prices fall by a lesser amount or increase by a greater amount. Increases in pork consumption are also reduced. Increases in consumers' surplus are lower when the supply curve for market services is upward sloping. Although the differences reported here appear small, more substantial shifts in supply or demand could result in important differences. This demonstrates the importance of the marketing input supply elasticity in analyzing the effects of retail supply and consumer demand shifts on pork prices and consumption.
Limitations of Analysis
The estimates of supply and demand shifts and welfare effects presented in this study are based on a number of simplifying assumptions, which are intended to give the reader an idea of the potential gains to consumers from retail supply and consumer demand shifts related to increased coordination in the pork industry. To isolate the effects of the posited changes in coordinating arrangements, we assume that there are no production or consumption effects unrelated to the adoption of contractual arrangements and integrated structures.
This analysis is limited to short-term effects of increased coordination of the pork packing and production stages. Externalities, such as potential air and water pollution related to increased hog
Figure 8 Clianges in consumers' surplus (as a percentage of poric consumption expenditures) from increased coordination
Percent 3.0
2.5
2.0
1.5
1.0
0.5
0
0.2 0.37
0.88
0.52
0.97
2.31
III SI
11% nonspot 29% nonspot
R=0 R=2.0 H R=8.2
Note: R Is the percentage shift In the demand curve. The marketing input supply cun/e is assumed to be perfectly elastic. Source: ERS, USDA.
production, are not expHcitly considered, nor are welfare changes in other markets that might result from cross-price effects.
A static deterministic modeling approach was used in this study. However, evidence of significant output price risk has been found in the pork industry (Schroeter and Azzam). Expücit consideration of uncertainty may be required to fully understand the consequences of changes in vertical coordination (Carlton). Changes in coordination also have implications for the speed of information transfer between stages, which affects responsiveness to changing consumer preferences and technological innovations (Boehlje, 1996). This suggests that a dynamic modeling framework may be useful for examining these implications.
We assume that improved vertical coordination reduces marketing costs, which are passed on to consumers. However, if contracting and integration are also motivated by attempts to gain market power, cost reductions may not be passed on to consumers. In this case, the party initiating the contract or integration will gain.
Our ability to assess the consumer effects of contractual arrangements and vertical integration was Umited by a dearth of pubHshed information in several areas. Published firm-level data on contracting and integration, slaughter plant utilization and cost information, quahty of plant
20 / Vertical Coordination and Consumer Welfare USD A/Economic Research Service
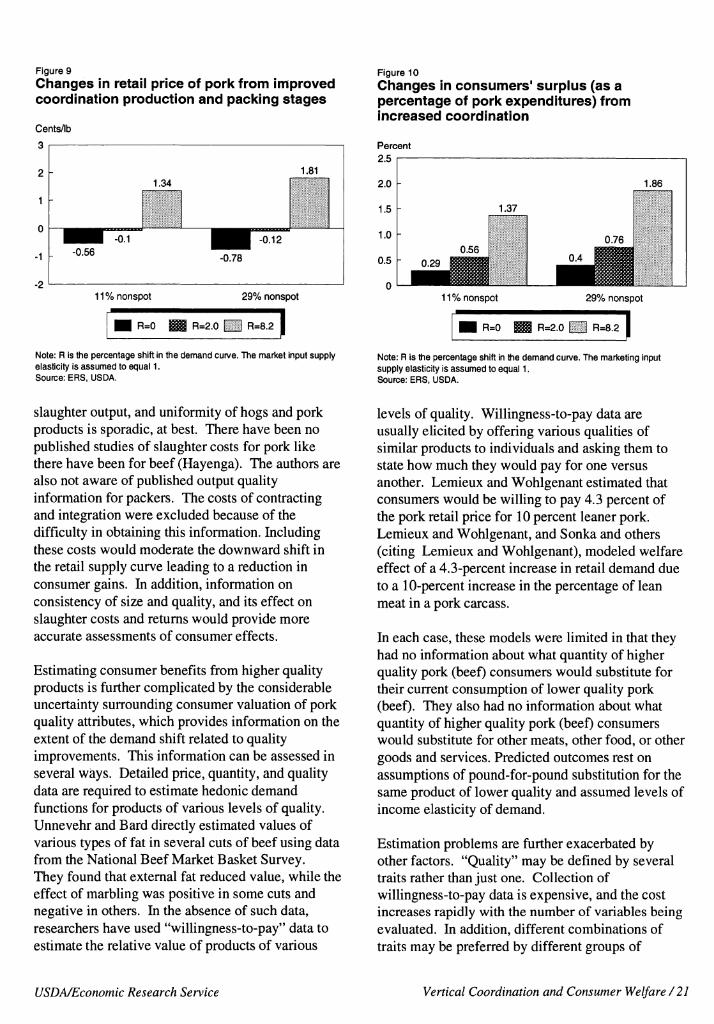
Figure 9
Changes in retail price of pork from improved coordination production and packing stages
Cents/lb
-0.56 -0.1
1.34 1.81
B ■ -0.78
-0.12
11 % nonspot 29% nonspot
R=0 gi R=2.0 IH R=8.2 I
Note: R is tlie percentage shift in the demand curve. The market input supply elasticity is assumed to equal 1. Source: ERS, USDA.
Figure 10
Changes in consumers' surplus (as a percentage of pork expenditures) from increased coordination
11 % nonspot 29% nonspot
R=0 W R=2.0 Hi R=8.2 I
Note: R is tiie percentage shift in the demand cun/e. The marketing input supply elasticity is assumed to equal 1. Source: ERS, USDA.
slaughter output, and uniformity of hogs and pork products is sporadic, at best. There have been no pubhshed studies of slaughter costs for pork like there have been for beef (Hayenga). The authors are also not aware of pubhshed output quahty information for packers. The costs of contracting and integration were excluded because of the difficulty in obtaining this information. Including these costs would moderate the downward shift in the retail supply curve leading to a reduction in consumer gains. In addition, information on consistency of size and quality, and its effect on slaughter costs and returns would provide more accurate assessments of consumer effects.
Estimating consumer benefits from higher quality products is further complicated by the considerable uncertainty suirounding consumer valuation of pork quality attributes, which provides information on the extent of the demand shift related to quality improvements. This information can be assessed in several ways. Detailed price, quantity, and quahty data are required to estimate hedonic demand functions for products of various levels of quality. Unnevehr and Bard directly estimated values of various types of fat in several cuts of beef using data from the National Beef Market Basket Survey. They found that external fat reduced value, while the effect of marbhng was positive in some cuts and negative in others. In the absence of such data, researchers have used "willingness-to-pay" data to estimate the relative value of products of various
levels of quahty. Willingness-to-pay data are usually eUcited by offering various quahties of similar products to individuals and asking them to state how much they would pay for one versus another. Lemieux and Wohlgenant estimated that consumers would be wiUing to pay 4.3 percent of the pork retail price for 10 percent leaner pork. Lemieux and Wohlgenant, and Sonka and others (citing Lemieux and Wohlgenant), modeled welfare effect of a 4.3-percent increase in retail demand due to a 10-percent increase in the percentage of lean meat in a pork carcass.
In each case, these models were limited in that they had no information about what quantity of higher quality pork (beef) consumers would substitute for their current consumption of lower quahty pork (beef). They also had no information about what quantity of higher quality pork (beef) consumers would substitute for other meats, other food, or other goods and services. Predicted outcomes rest on assumptions of pound-for-pound substitution for the same product of lower quality and assumed levels of income elasticity of demand.
Estimation problems are further exacerbated by other factors. "Quality" may be defined by several traits rather than just one. Collection of willingness-to-pay data is expensive, and the cost increases rapidly with the number of variables being evaluated. In addition, different combinations of traits may be preferred by different groups of
USD A/Economic Research Service Vertical Coordination and Consumer Welfare/21
consumers. Willingness-to-pay data are useful in estimating the direction and scale of consumers' preferences, but extrapolation and assumptions are required to predict overall demand shifts.
There is also considerable uncertainty regarding marketing supply elasticities, which affect estimated changes in retail prices and consumer surplus gains. Given the uncertainty surrounding the marketing supply elasticity and consumers' willingness to pay for changes in quality, further research in these areas appears warranted.
Aside from the methodological and data problems recognized above, problems are inherent in estimating reductions in transactions costs. For example, separating out production costs and transactions costs is difficult. Transactions costs associated with coordinating an integrated system of stages include the costs of delay while the plan is being communicated. If sales are lost due to planning delays, it is not clear whether it is the result of slow planning (that is, poor coordination) or a technology that cannot adapt quickly to changes in the plan (Milgrom and Roberts).
Conclusions
The industrialization of agriculture is demonstrated by changes in the pork industry. Technological advances and speciaUzation in production activities encourage growth in farm size, which lowers production costs. Genetic advances allow producers to improve quality more quickly and with greater precision. Increasingly, these changes are supported by long-term contracts and integration between large producers and large packers. These coordinating arrangements ensure the large producers of a market outlet for their hogs and enable large packers to obtain a regular large supply of uniform, high-quality hogs. Closer coordination between the production and packing stages lowers slaughter costs and satisfies consumer demand for a variety of high-quality pork products.
We found several reasons that producers and packers might enter into long-term contracts or integrate: (1) to limit opportunistic behavior associated with large, specialized, fixed investments; (2) to lower measuring and sorting costs for obtaining uniform high-quahty products; and (3) to gain market power. In the first two cases,
consumers are expected to benefit by lower prices or improved quality.
One objective of our study was to demonstrate potential effects on consumers implied by improvements in coordination between the hog production and packing stages. These effects are rather modest, partly due to our assumption that these benefits are derived from contracting and integration, which represents between a tenth and a third of market transactions. Also, our ability to measure the effects of increased coordination was limited by the absence of published data related to firm-level contracting and integration, plant utilization and slaughter costs, and quality of plant output.
Better information is needed on the premium placed on pork attributes. Although more information is available on leanness than on other attributes, surprisingly little is known about consumers' willingness to pay for this attribute in pork. More accurate assessments of consumer effects of improved pork quality will be possible once the values of these attributes are more clearly recognized.
Several types of studies have measured the cost and quality effects of increased coordination, including (1) a single-firm case study, where the firm operates both a plant that procures inputs on the open market and a plant that uses other coordinating arrangements, such as long-term contracts; (2) a multi-firm study for a single industry, where costs and quality of product are related to degree of coordination; and (3) a multi-industry study where change in product price and quality over time is related to the degree of coordination in each industry. Data and methodological problems include finding an appropriate definition of quality and, for single-firm or multi-firm studies, obtaining cost and quality information that is proprietary in nature. For multi-industry studies, the challenge is to obtain comparable measures of quality and costs.
Data problems suggest the need for improved data definition and collection programs. Possibly, voluntary cost reporting by firms to USDA or an independent accounting firm— in a format that would allow meaningful analysis—could be established. Output would include packing, processing, and marketing costs and, ideally, output
22 / Vertical Coordination and Consumer V^elf are USDA/Economic Research Service
quality measures. Another possibility is to undertake research projects with cooperatives, such as Farmland, or private firms, without identifying participants. A final alternative is to conduct industry-sponsored studies where firms may be more willing to participate with the intent of improving overall standards and competitiveness in the industry.
Currently, there is no estabhshed aggregate modeUng framework where coordination is achieved through contract negotiation and management directive rather than through open markets. From a broad view, the challenge may be to use methods that rely less on historical data (for example, simulation) and old paradigms (Boehlje, 1995; Streeter and others). Traditional theory that relies on open markets and coordination by prices may be inappropriate as contracts and integration coordinate a larger percentage of transactions. Vertical contracting and integration reduce the number of points in the marketing system at which prices are estabhshed. This means that pubhshed prices may become less meaningful as more product moves through integrated channels. The empirical definition of the farm-retail marketing spreads becomes more difficult (Tomek and Robinson).
References
Almond, G., J. Britt, J. Carr, B. Flowers, C. Glossop, M. Morrow, and T. See. 1994. The Swine AI Book. Raleigh, NC: Morgan Morrow.
Azzam, Azzeddine. Aug. 1996. "Testing the Monopsony-Inefficiency Incentive for Backward Integration," American Journal of Agricultural Economics, Vol. 78, No. 3.
, and Dale Anderson. Feb. 1996. "Literature Review," Concentration in the Red Meat Packing Industry. U. S. Dept. of Agr., Packers and Stockyards Programs, Grain Inspection, Packers and Stockyards Admin.. Washington, DC.
, and E. Pagoulatos. Sept. 1990. "Testing Ohgopolistic and OUgopsonistic Behavior: An Application to the US Meat-Packing Industry," Journal of Agricultural Economics, Vol. 41, No. 3.
, and Allen Wellman. 1992. Packer
and Likely Impacts of Increased Vertical Control on Hog Prices and Quantities. Res. Bull. 31 5-F. Lincoln: Univ. of Nebraska, lANR Agr. Res. Div..
Barkema, Alan, and M. Cook. 1993. "The Changing Pork Industry: A Dilemma For Public PoUcy," Economic Review Second Quarter. Federal Reserve Bank of Kansas City.
Barzel, Y. 1982. "Measurement Costs and the Organization of Markets," Journal of Law and Economics, Vol. 25, pp. 27-48.
Baumöl, W., S. Panzar, and R. Willig. 1982. Contestable Markets and the Theory of Industry Structure. New York: Harcourt Brace Jovanovich.
Blair, Roger D., and David L. Kasserman. 1983. Law and Economics of Vertical Integration and Control. New York: Academic Press.
Boehlje, Michael. 1996. "Industriahzation of Agriculture: What are the ImpUcations?," Choices, First Quarter.
. Dec. 1995. "Vertical Coordination and Structural Change in the Pork Industry: Discussion," American Journal of Agricultural Economics, Vol. 77, No. 5.
Boland, M. A., K. A. Foster, and J. T. Akridge. Sept./Oct. 1995. "Packer Sorting Strategies for Fresh Pork," Agribusiness, Vol. 11, No. 5.
Carlton, Dennis W. March 1979. "Vertical Integration in Competitive Markets Under Uncertainty," The Journal of Industrial Economics, Vol. 27, No. 3.
Carlton, Dennis W., and Jeffrey M. Perioff. 1990. Modern Industrial Organization. New York: HarperColhns College PubUshers.
Cassell, Guy R., and Donald A. West. 1967. Assembly and Slaughter Costs for Hogs in North Carolina. North Carolina State Economics Research Report # 3. North CaroUna State Univ., Dept. of Economics.
Coase, R. H., 1937. "The Nature of the Firm" Económica, Vol. 4, pp. 386-405.
Integration into Hog Production: Current Status
USD A/Economic Research Service Vertical Coordination and Consumer Welfare / 23
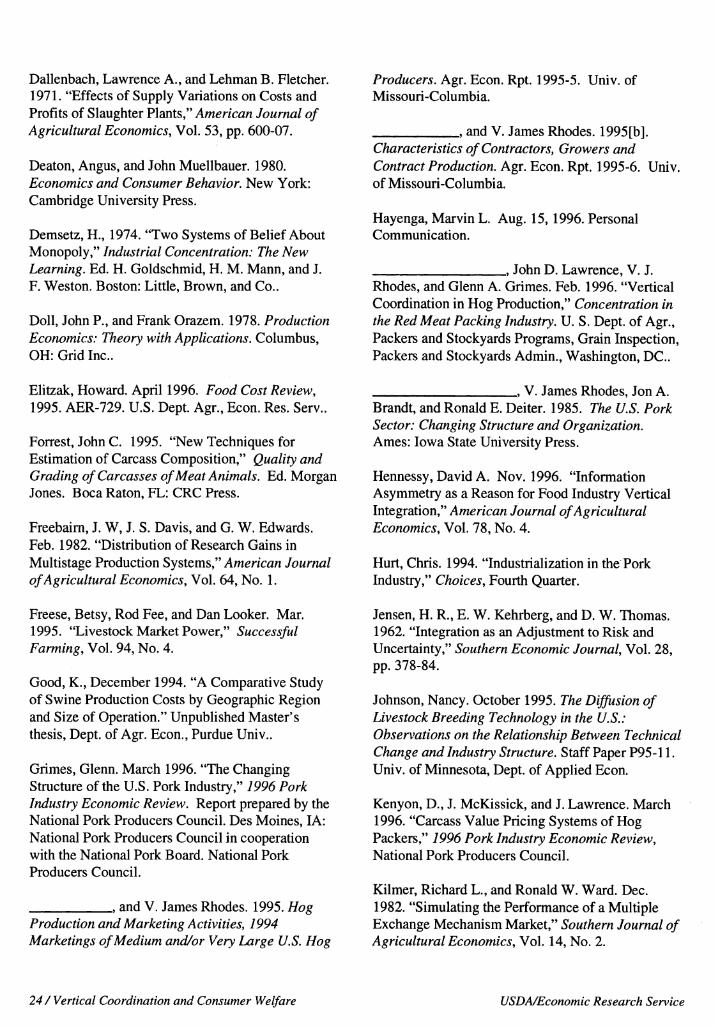
Dallenbach, Lawrence A., and Lehman B. Fletcher. 197L "Effects of Supply Variations on Costs and Profits of Slaughter Plants," American Journal of Agricultural Economics, Vol. 53, pp. 600-07.
Deaton, Angus, and John Muellbauer. 1980, Economics and Consumer Behavior. New York: Cambridge University Press.
Demsetz, H., 1974. "Two Systems of Belief About Monopoly," Industrial Concentration: The New Learning. Ed. H. Goldschmid, H. M. Mann, and J. F. Weston. Boston: Little, Brown, and Co..
Doll, John P., and Frank Orazem. 1978. Production Economics: Theory with Applications. Columbus, OH: Grid Inc..
Elitzak, Howard. April 1996. Food Cost Review, 1995. AER-729. U.S. Dept. Agr., Econ. Res. Serv..
Forrest, John C. 1995. "New Techniques for Estimation of Carcass Composition," Quality and Grading of Carcasses of Meat Animals. Ed. Morgan Jones. Boca Raton, FL: CRC Press.
Freebaim, J. W, J. S. Davis, and G. W. Edwards. Feb. 1982. "Distribution of Research Gains in Multistage Production Systems," American Journal of Agricultural Economics, Vol. 64, No. 1.
Freese, Betsy, Rod Fee, and Dan Looker. Mar. 1995. "Livestock Market Power," Successful Farming, Vol. 94, No. 4.
Good, K., December 1994. "A Comparative Study of Swine Production Costs by Geographic Region and Size of Operation." Unpublished Master's thesis, Dept. of Agr. Econ., Purdue Univ..
Grimes, Glenn. March 1996. "The Changing Structure of the U.S. Pork Industry," 1996 Pork Industry Economic Review. Report prepared by the National Pork Producers Council. Des Moines, lA: National Pork Producers Council in cooperation with the National Pork Board. National Pork Producers Council.
, and V. James Rhodes. 1995. Hog
Producers. Agr. Econ. Rpt. 1995-5. Univ. of Missouri-Columbia.
, and V. James Rhodes. 1995[b]. Characteristics of Contractors, Growers and Contract Production. Agr. Econ. Rpt. 1995-6. Univ. of Missouri-Columbia.
Hayenga, Marvin L. Aug. 15,1996. Personal Communication.
, John D. Lawrence, V. J. Rhodes, and Glenn A. Grimes. Feb. 1996. "Vertical Coordination in Hog Production," Concentration in the Red Meat Packing Industry. U. S. Dept. of Agr., Packers and Stockyards Programs, Grain Inspection, Packers and Stockyards Admin., Washington, DC.
, V. James Rhodes, Jon A.
Production and Marketing Activities, 1994 Marketings of Medium and/or Very Large U.S. Hog
Brandt, and Ronald E. Deiter. 1985. The U.S. Pork Sector: Changing Structure and Organization. Ames: Iowa State University Press.
Hennessy, David A. Nov. 1996. "Information Asymmetry as a Reason for Food Industry Vertical Integration," American Journal of Agricultural Economics, Vol. 78, No. 4.
Hurt, Chris. 1994. "Industriahzation in the Pork Industry," Choices, Fourth Quarter.
Jensen, H. R., E. W. Kehrberg, and D. W. Thomas. 1962. "Integration as an Adjustment to Risk and Uncertainty," Southern Economic Journal, Vol. 28, pp. 378-84.
Johnson, Nancy. October 1995. The Diffusion of Livestock Breeding Technology in the U.S.: Observations on the Relationship Between Technical Change and Industry Structure. Staff Paper P95-11. Univ. of Minnesota, Dept. of Applied Econ.
Kenyon, D., J. McKissick, and J. Lawrence. March 1996. "Carcass Value Pricing Systems of Hog Packers," 7996 Pork Industry Economic Review, National Pork Producers Council.
Kilmer, Richard L., and Ronald W. Ward. Dec. 1982. "Simulating the Performance of a Multiple Exchange Mechanism Market," Southern Journal of Agricultural Economics, Vol. 14, No. 2.
24/Vertical Coordination and Consumer Welfare USDA/Economic Research Service
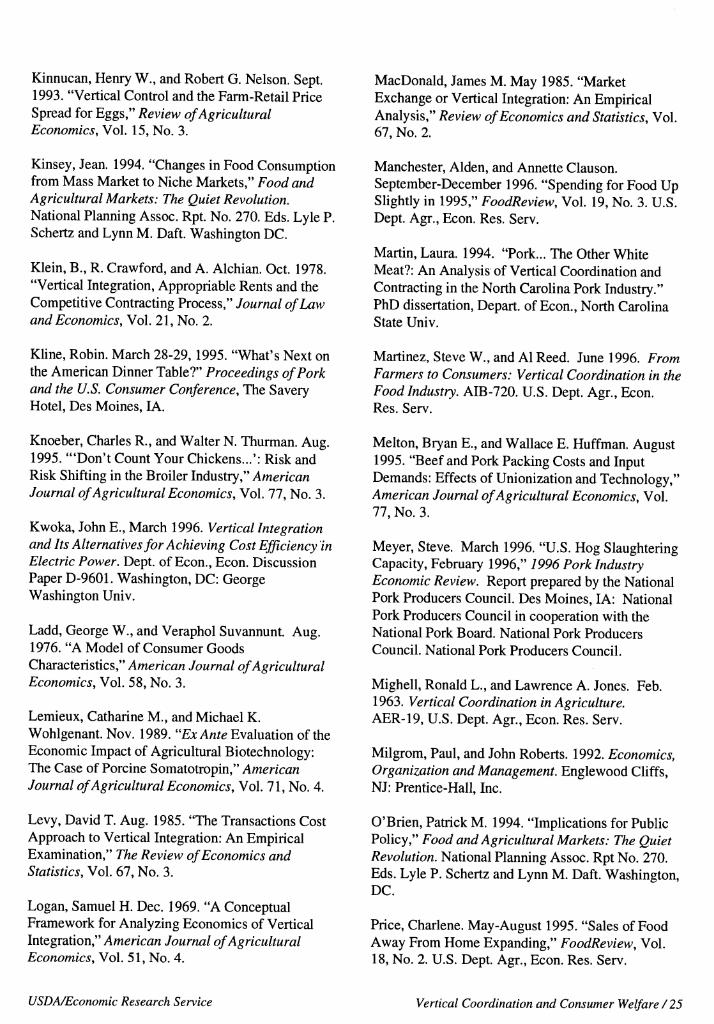
Kinnucan, Henry W., and Robert G. Nelson. Sept. 1993. "Vertical Control and the Farm-Retail Price Spread for Eggs," Review of Agricultural Economics, Vol. 15, No. 3.
Kinsey, Jean. 1994. "Changes in Food Consumption from Mass Market to Niche Markets," Food and Agricultural Markets: The Quiet Revolution. National Planning Assoc. Rpt. No. 270. Eds. Lyle P. Schertz and Lynn M. Daft. Washington DC.
Klein, B., R. Crawford, and A. Alchian. Oct. 1978. "Vertical Integration, Appropriable Rents and the Competitive Contracting Process," Journal of Law and Economics, Vol. 21, No. 2.
MacDonald, James M. May 1985. "Market Exchange or Vertical Integration: An Empirical Analysis," Review of Economics and Statistics, Vol. 67, No. 2.
Manchester, Alden, and Annette Clauson. September-December 1996. "Spending for Food Up Slightly in 1995," FoodReview, Vol. 19, No. 3. U.S. Dept. Agr., Econ. Res. Serv.
Martin, Laura. 1994. "Pork... The Other White Meat?: An Analysis of Vertical Coordination and Contracting in the North Carohna Pork Industry." PhD dissertation, Depart, of Econ., North Carolina State Univ.
Kline, Robin. March 28-29, 1995. "What's Next on the American Dinner Table?" Proceedings of Pork and the U.S. Consumer Conference, The Savery Hotel, Des Moines, lA.
Knoeber, Charles R., and Walter N. Thurman. Aug. 1995. "'Don't Count Your Chickens...': Risk and Risk Shifting in the Broiler Industry," American Journal of Agricultural Economics, Vol. 77, No. 3.
Kwoka, John E., March 1996. Vertical Integration and Its Alternatives for Achieving Cost Efficiency in Electric Power. Dept. of Econ., Econ. Discussion Paper D-9601. Washington, DC: George Washington Univ.
Ladd, George W., and Veraphol Suvannunt. Aug. 1976. "A Model of Consumer Goods Characteristics," American Journal of Agricultural Economics, Vol. 58, No. 3.
Lemieux, Catharine M., and Michael K. Wohlgenant. Nov. 1989. ''Ex Ante Evaluation of the Economic Impact of Agricultural Biotechnology: The Case of Porcine Somatotropin," American Journal of Agricultural Economics, Vol. 71, No. 4.
Levy, David T. Aug. 1985. "The Transactions Cost Approach to Vertical Integration: An Empirical Examination," The Review of Economics and Statistics, Vol. 67, No. 3.
Logan, Samuel H. Dec. 1969. "A Conceptual Framework for Analyzing Economics of Vertical Integration," American Journal of Agricultural Economics, Vol. 51, No. 4.
Martinez, Steve W., and Al Reed. June 1996. From Farmers to Consumers: Vertical Coordination in the Food Industry. AIB-720. U.S. Dept. Agr., Econ. Res. Serv.
Melton, Bryan E., and Wallace E. Huffman. August 1995. "Beef and Pork Packing Costs and Input Demands: Effects of Unionization and Technology," American Journal of Agricultural Economics, Vol. 77, No. 3.
Meyer, Steve. March 1996. "U.S. Hog Slaughtering Capacity, February 1996," 1996 Pork Industry Economic Review. Report prepared by the National Pork Producers Council. Des Moines, lA: National Pork Producers Council in cooperation with the National Pork Board. National Pork Producers Council. National Pork Producers Council.
Mighell, Ronald L., and Lawrence A. Jones. Feb. 1963. Vertical Coordination in Agriculture, AER-19, U.S. Dept. Agr., Econ. Res. Serv.
Milgrom, Paul, and John Roberts. 1992. Economics, Organization and Management. Englewood Cliffs, NJ: Prentice-Hall, Inc.
O'Brien, Patrick M. 1994. "Implications for Public Policy," Food and Agricultural Markets: The Quiet Revolution. National Planning AssoC. Rpt No. 270. Eds. Lyle P. Schertz and Lynn M. Daft. Washington, DC.
Price, Charlene. May-August 1995. "Sales of Food Away From Home Expanding," FoodReview, Vol. 18, No. 2. U.S. Dept. Agr., Econ. Res. Serv.
USD A/Economic Research Service Vertical Coordination and Consumer Welfare/25
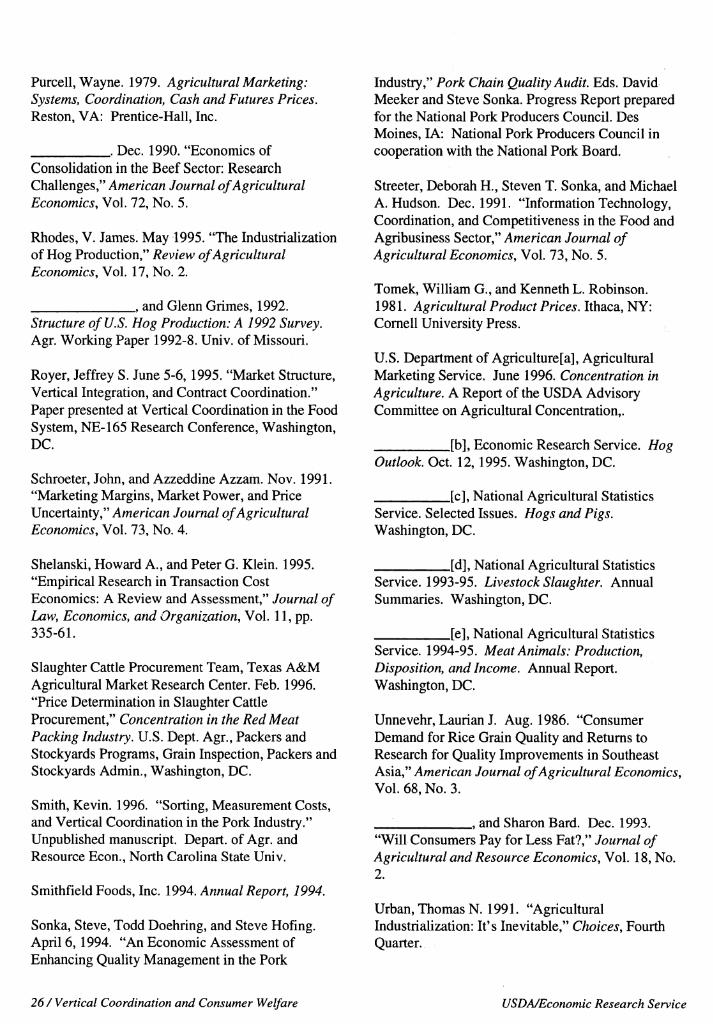
Purcell, Wayne. 1979. Agricultural Marketing: Systems, Coordination, Cash and Futures Prices. Reston, VA: Prentice-Hall, Inc.
. Dec. 1990. "Economics of Consolidation in the Beef Sector: Research Challenges," American Journal of Agricultural Economics, Vol. 72, No. 5.
Rhodes, V. James. May 1995. "The Industrialization of Hog Production," Review of Agricultural Economics, Vol. 17, No. 2.
, and Glenn Grimes, 1992. Structure of U.S. Hog Production: A 1992 Survey. Agr. Working Paper 1992-8. Univ. of Missouri.
Royer, Jeffrey S. June 5-6,1995. "Market Structure, Vertical Integration, and Contract Coordination." Paper presented at Vertical Coordination in the Food System, NE-165 Research Conference, Washington, DC.
Schroeter, John, and Azzeddine Azzam. Nov. 1991. "Marketing Margins, Market Power, and Price Uncertainty," American Journal of Agricultural Economics, Vol. 73, No. 4.
Industry," Pork Chain Quality Audit. Eds. David Meeker and Steve Sonka. Progress Report prepared for the National Pork Producers Council. Des Moines, I A: National Pork Producers Council in cooperation with the National Pork Board.
Streeter, Deborah H., Steven T. Sonka, and Michael A.Hudson. Dec. 1991. "InformationTechnology, Coordination, and Competitiveness in the Food and Agribusiness Sector," American Journal of Agricultural Economics, Vol. 73, No. 5.
Tomek, William G., and Kenneth L. Robinson. 1981. Agricultural Product Prices. Ithaca, NY: Cornell University Press.
U.S. Department of Agriculture[a], Agricultural Marketing Service. June 1996. Concentration in Agriculture. A Report of the USDA Advisory Committee on Agricultural Concentration,.
[b], Economic Research Service. Hog Outlook. Oct. 12,1995. Washington, DC.
[c]. National Agricultural Statistics Service. Selected Issues. Hogs and Pigs. Washington, DC.
Shelanski, Howard A., and Peter G. Klein. 1995. "Empirical Research in Transaction Cost Economics: A Review and Assessment," Journal of Law, Economics, and Organization, Vol. 11, pp. 335-61.
Slaughter Cattle Procurement Team, Texas A&M Agricultural Market Research Center. Feb. 1996. "Price Determination in Slaughter Cattle Procurement," Concentration in the Red Meat Packing Industry. U.S. Dept. Agr., Packers and Stocky^ds Programs, Grain Inspection, Packers and Stockyards Admin., Washington, DC.
Smith, Kevin. 1996. "Sorting, Measurement Costs, and Vertical Coordination in the Pork Industry." Unpublished manuscript. Depart, of Agr. and Resource Econ., North Carolina State Univ.
Smithfield Foods, Inc. 1994. Annual Report, 1994.
Sonka, Steve, Todd Doehring, and Steve Hofing. April 6,1994. "An Economic Assessment of Enhancing Quality Management in the Pork
[d], National Agricultural Statistics Service. 1993-95. Livestock Slaughter. Annual Summaries. Washington, DC.
[e]. National Agricultural Statistics Service. 1994-95. Meat Animals: Production, Disposition, and Income. Annual Report. Washington, DC.
Unnevehr, Laurian J. Aug. 1986. "Consumer Demand for Rice Grain Quality and Returns to Research for Quality Improvements in Southeast Asia," American Journal of Agricultural Economics, Vol. 68, No. 3.
_^ , and Sharon Bard. Dec. 1993. "Will Consumers Pay for Less Fat?," Journal of Agricultural and Resource Economics, Vol. 18, No. 2.
Urban, Thomas N. 1991. "Agricultural IndustriaUzation: It's Inevitable," Choices, Fourth Quarter.
26/Vertical Coordination and Consumer Welfare USDA/Economic Research Service
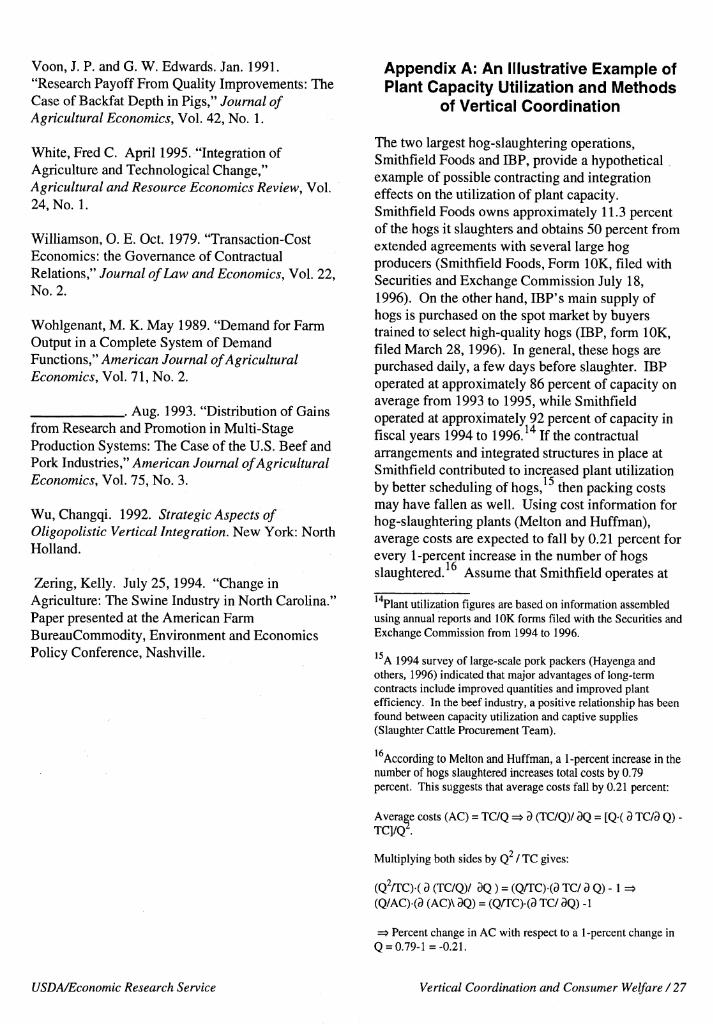
Voon, J. P. and G. W. Edwards. Jan. 1991. "Research Payoff From Quality Improvements: The Case of Backfat Depth in Pigs," Journal of Agricultural Economics, Vol. 42, No. 1.
White, Fred C. April 1995. "Integration of Agriculture and Technological Change," Agricultural and Resource Economics Review, Vol. 24,No. 1.
Wilhamson, O. E. Oct. 1979. "Transaction-Cost Economics: the Governance of Contractual Relations," Journal of Law and Economics, Vol. 22, No. 2.
Wohlgenant, M. K. May 1989. "Demand for Farm Output in a Complete System of Demand Functions," American Journal of Agricultural Economics, Vol. 71, No. 2.
. Aug. 1993. "Distribution of Gains from Research and Promotion in Multi-Stage Production Systems: The Case of the U.S. Beef and Pork Industries," American Journal of Agricultural Economics, Vol. 75, No. 3.
Wu, Changqi. 1992. Strategic Aspects of Oligopolistic Vertical Integration. New York: North Holland.
Zering, Kelly. July 25,1994. "Change in Agriculture: The Swine Industry in North Carolina." Paper presented at the American Farm BureauCommodity, Environment and Economics Policy Conference, Nashville.
Appendix A: An Illustrative Example of Plant Capacity Utilization and Methods
of Vertical Coordination
The two largest hog-slaughtering operations, Smithfield Foods and IBP, provide a hypothetical example of possible contracting and integration effects on the utihzation of plant capacity. Smithfield Foods owns approximately 11.3 percent of the hogs it slaughters and obtains 50 percent from extended agreements with several large hog producers (Smithfield Foods, Form lOK, filed with Securities and Exchange Commission July 18, 1996). On the other hand, IBP's main supply of hogs is purchased on the spot market by buyers trained to select high-quality hogs (IBP, form lOK, filed March 28,1996). In general, these hogs are purchased daily, a few days before slaughter. IBP operated at approximately 86 percent of capacity on average from 1993 to 1995, while Smithfield operated at approximately 92 percent of capacity in fiscal years 1994 to 1996.^"^ If the contractual arrangements and integrated structures in place at Smithfield contributed to increased plant utilization by better scheduling of hogs, then packing costs may have fallen as well. Using cost information for hog-slaughtering plants (Melton and Huffman), average costs are expected to fall by 0.21 percent for every 1 -percent increase in the number of hogs slaughtered. Assume that Smithfield operates at
Plant utilization figures are based on information assembled using annual reports and lOK forms filed with the Securities and Exchange Commission from 1994 to 1996.
A 1994 survey of large-scale pork packers (Hayenga and others, 1996) indicated that major advantages of long-term contracts include improved quantities and improved plant efficiency. In the beef industry, a positive relationship has been found between capacity utilization and captive supplies (Slaughter Cattle Procurement Team).
According to Melton and Huffman, a 1-percent increase in the number of hogs slaughtered increases total costs by 0.79 percent. This suggests that average costs fall by 0.21 percent:
Average costs (AC) = TC/Q => d ÇTC/Q)/ dQ = [Q( d TC/d Q) - TC]/Q^.
Multiplying both sides by Q / TC gives:
(Q^A'Oi a (TC/Q)/ dQ ) = (Q/rc)(a TC/ a Q) -1 => (Q/AC)-(a (AC)\ aQ) = (Q/TCHd TC/ dQ) -1
=> Percent change in AC with respect to a 1-percent change in Q = 0.79-1 =-0.21.
USD A/Economic Research Service Vertical Coordination and Consumer Welfare /27
86 percent of capacity, instead of 92 percent, because of less coordination between plant operations and hog deliveries. If Smithfield's annual capacity is 18.1 million head (Meyer, 1996), then operating at 86 percent of capacity suggests that annual production would be 15.5 million head (0.8618.1). This represents a 6.6-percent reduction in production compared with producing at 92 percent of capacity, or 16.6 million head (0.9218.1). If production falls by 6.6 percent, then average costs would increase by 1.39 percent (6.60.21). Assuming average hog-slaughtering costs of $26.85/head, average slaughter costs would increase by $0.37/head (26.85 0.0246). Multiplying 0.37 by the number of federally inspected barrows and gilts slaughtered in the United States (89.7 milUon) and dividing by total marketing costs ($19.80 billion), this suggests that potential cost savings resulting from increased plant utilization are $33.2 miUion annually, or 0.17 percent of total pork marketing costs.
Claims that contracting and integration reduce input supply variabiUty and increase capacity utiUzation could not be substantiated. Although Smithfield operated at a higher capacity utilization than IBP from 1993 to 1995, the difference could be due to any number of factors besides the extent of contracting and integration. Comparisons of capacity utiUzation in the Mid-west (less contracting and integration) with utilization in the Southeast (more contracting and integration), using information contained in Meyer and actual slaughter rates by region, showed no differences. Comparing capacity utiUzation rates in North Carolina (more contracting and integration) and Iowa (less contracting and integration) showed North Carolina to have a higher capacity utilization rate in recent years as growth in hog production has occurred. However rapid changes occurring in both States make the methodology used questionable. Also, factors other than contracting and integration may account for differences in utiUzation. Finally, comparisons of the coefficient of variation in the number of hogs slaughtered in Iowa and North Carolina indicated no differences in input supply variability between the two States.
Appendix B: A Model of the U.S. Pork Market
The model developed by the NPPC, Agricultural Education and Consulting team (Sonka and others) consists of three vertical stages:
Retail Level
(2) Prinmry demand: Pr = f(QrJr)
(3) Derived supply: Qr =f(Qm, Qf)
Marketing Level
(4) Pm=f(QmMf)
(5) Pm =f(Qmrm)
Farm Level
(6) Primary supply: Pf = f(Qf^ T/j
(7) Derived demand: Pf =f(Qm,Qf)
Hogs are combined with marketing services to produce a pork product.
Equation 2 represents the inverse of consumer demand for pork (Qr), where Pr is the retail price of pork and Tr is the relative shift in demand for pork from quaUty improvements that are induced by improved coordination of the production and marketing stages. Equation 3 is the derived supply of pork, which is determined by the quantity of marketing services (Qm) and the quantity of pork demanded at the farm level (Qf). The inverse demand for marketing services (equation 4) is a function of the quantity of marketing services and quantity of pork demanded. Equation 5 is the inverse supply function for marketing services, which is a function of the quantity of marketing services demanded and relative changes in marketing costs induced by closer coordination. Equation 6 is the inverse farm demand function and equation 7 is the inverse farm supply function, where Tf are exogenous shifts.
17 Average slaughter cost per head is calculated assuming average slaughter cost of $0.105 per pound of slaughter weight (Melton and Huffman) and average slaughter weight of 256 pounds (USDA[d]).
28/Vertical Coordination and Consumer Welfare USDA/Economic Research Service

The change in equihbrium prices and quantities from shifts in retail demand or marketing costs is characterized as:
(8) Qt^ -SmQm 'SfQ¡ = 0
(9) -(1A\ )Qr +Pr* = R
(10) -(l/Zm)Qm'' + Pm^'^M
(11) (Sf/a)Qm - (Sf/ö)Q/ -^Pm"- P/ =0
(12)-(l/£/)ö/V/ = F
(13) (-Sni/(5)Qm + (Sm/CS)Qf^ + P/ - Pr"" = 0
where asterisks denote approximate relative changes (for example, X* = dX/X), Sm is the cost share of the marketing input, Sf is the cost share of the farm input, r| is the retail elasticity of demand, R is the percentage change in consumer demand for pork at a given quantity, 8m is the elasticity of supply of the marketing input, M is the percentage change in marketing costs at a given quantity, a is the elasticity of substitution between the bundle of marketing inputs and hogs, ef is the supply elasticity of hogs, and F is the percentage change in farm production costs at a given quantity.
After rearranging equations 8-13 and expressing them in matrix form, the solutions for Qr*, Qm*, Qf*, Pr*, Pm*, and Pf* are
(14)A'B = C^B =A~^C
where
B =
Q:
Q:
Q) , A = H*
K m
p;
0 ~L a S
Ü ^m
CT -1
0 Î1
-1 Ü
e„ 0 0
-h 0 0 0
-Sr f
a -1 1 0 0
S 0 -1 0 -1
G 0 0 1 0 0 , c=
R
M Ü ü 1 ü
F -1
0 0 1 £/
Change in consumers' surplus, assuming parallel shifts in retail demand and marketing level supply, is
(15) ACS = -PrQriPr^ - R)(l + 0,5Qr^),
Changes in prices, quantities, and consumers' surplus are calculated using equations 14 and 15. Parameter values used in the simulations are reported in appendix table 1.
Appendix table 1 — Parameter values for the U.S. pork industry
Elasticity of demand at retail (r|) Elasticity of supply of farm inputs (€f)
Elasticity of supply of marketing inputs (em)
Elasticity of substitution (a)
Farm operator's cost share (Sf)
Cost share of marketing input (Sm) Decrease in marketing costs (M)' Increase in retail demand price (R)' Consumer expenditures (PrQr) ^Source: Wohlgenant (1993).
^Source: Sonka and others. ^Source: USDA[b].
Percentage change in costs of -3.08 percent is multiplied by 0.11 and 0.29, which correspond to two percentages of market hogs procured through nonspot arrangements.
^For the first two values, no demand shift is assumed.For the next two values, percentage shift in consumer demand for pork of 2.0 percent is multiplied by 0.11 and 0.29, which correspond to two percentages of market hogs procured through nonspot arrangements ^See footnote 10 for derivation.
-0.65'
0.40^
-\l2
0.35^
0.34^
0.66^
■0.34, -0.90
0.0, 0.0; or 0.23, 0.60; or 0.91, 2.39
$30.1 bill.^
USDA/Economic Research Service Vertical Coordination and Consumer Welfare/29
It's Easy To Order Another Copy!
Just dial 1-800-999-6779. Toll free in the United States and Canada.
Ask for Vertical Coordination and Consumer Welfare: The Case of the Pork Industry (AER-753).
Charge your purchase to your VISA or MasterCard
For additional information about ERS publications, databases, and other products, both paper and electronic, visit the ERS Home Page on the Internet at http://www.econ.ag.gov
The United States Department of Agriculture (USDA) prohibits discrimination in its programs on the basis of race, color, national origin, sex, religion, age, disability, political beliefs» and marital or familial status. (Not all pro- hibited bases apply to all programs.) Persons with disabilities who require alternative means for communication of program information (braille, large print, audiotape, etc.) should contact USDA's TARGET Center at 202-720- 2600 (voice and TDD).
To file a complaint, write the Secretary of Agriculture, U.S. Department of Agriculture, Washington, DC 20250, or call 1-800-245-6340 (voice) or (202) 720-1127 (TDD). USDA is an equal employment opportunity employer.
United States Department of Agriculture Economic Research Service 1301 New York Avenue, NW Washington, DC 20005-4788