VAR 모델을 이용한 야생 동물의 농장 침입 예측 서비스
9
한국정보통신학회논문지 Vol. 25, No. 5: 628~636, May. 2021 VAR 모델을 이용한 야생 동물의 농장 침입 예측 서비스 카담 아쉬위니 1 ·황민태 2* Prediction Service of Wild Animal Intrusions to the Farm Field based on VAR Model Ashwini L. Kadam 1 · Mintae Hwang 2* 1 M.S. Student, Department of Information & Communication Engineering, Changwon National University, Changwon, 51140 Korea 2* Professor, Department of Information & Communication Engineering, Changwon National University, Changwon, 51140 Korea 요 약 본 논문은 야생 동물들이 농장에 침입할 때 마다 당시의 환경 데이터를 수집한 다음 이를 이용한 벡터 자동 회귀 (VAR) 모델 기반의 기계 학습을 통해 향후 야생 동물의 침입을 예측하는 서비스의 구현 및 성능 평가 결과를 담고 있 다. 침입 예측을 위한 학습 데이터를 수집하기 위해 사물인터넷 기반의 하드웨어 프로토타입을 개발했으며, 이를 학 교 인근에 위치한 소규모 농장에 설치하고서 침입 이벤트를 발생시키는 모의 시험을 장기간에 걸쳐 실시하였다. 구 현한 벡터 자동 회귀 모델 기반의 침입 예측 서비스는 앞으로 30일간의 침입 발생 가능성이 높은 날짜와 시간을 제공 한다. 더불어 제안 서비스는 야생 동물의 농장 침입 시 농장 주인의 모바일 기기에 실시간으로 알림을 제공하는 기능 을 포함하며, 이에 대한 성능 평가를 실시하여 평균 7.89초의 응답 시간을 보여줌을 확인하였다. ABSTRACT This paper contains the implementation and performance evaluation results of a system that collects environmental data at the time when the wild animal intrusion occurred at farms and then predicts future wild animal intrusions through a machine learning-based Vector Autoregression(VAR) model. To collect the data for intrusion prediction, an IoT-based hardware prototype was developed, which was installed on a small farm located near the school and simulated over a long period to generate intrusion events. The intrusion prediction service based on the implemented VAR model provides the date and time when intrusion is likely to occur over the next 30 days. In addition, the proposed system includes the function of providing real-time notifications to the farmers mobile device when wild animals intrusion occurs in the farm, and performance evaluation was conducted to confirm that the average response time was 7.89 seconds. 키워드 : 야생 동물, 침입 예측, 벡터 자동 회귀 모델, 모바일 애플리케이션, 스마트 농장 Keywords : Wild animal, Intrusion prediction, Vector Autoregression(VAR) model, Mobile application, Smart farm. Received 18 March 2021, Revised 3 April 2021, Accepted 18 April 2021 * Corresponding Author Mintae Hwang (E-mail:[email protected], Tel:+82-55-213-3832) Professor, Department of Information and Computer Engineering, Changwon National University, Changwon, 51140 Korea Open Access http://doi.org/10.6109/jkiice.2021.25.5.628 print ISSN: 2234-4772 online ISSN: 2288-4165 This is an Open Access article distributed under the terms of the Creative Commons Attribution Non-Commercial License(http://creativecommons.org/li-censes/ by-nc/3.0/) which permits unrestricted non-commercial use, distribution, and reproduction in any medium, provided the original work is properly cited. Copyright The Korea Institute of Information and Communication Engineering. Journal of the Korea Institute of Information and Communication Engineering
-
Upload
khangminh22 -
Category
Documents
-
view
1 -
download
0
Transcript of VAR 모델을 이용한 야생 동물의 농장 침입 예측 서비스

한국정보통신학회논문지 Vol. 25, No. 5: 628~636, May. 2021
VAR 모델을 이용한 야생 동물의 농장 침입 예측 서비스
카담 아쉬위니1·황민태2*
Prediction Service of Wild Animal Intrusions to the Farm Field based on VAR Model
Ashwini L. Kadam1 · Mintae Hwang2*
1M.S. Student, Department of Information & Communication Engineering, Changwon National University, Changwon, 51140 Korea2*Professor, Department of Information & Communication Engineering, Changwon National University, Changwon, 51140 Korea
요 약
본 논문은 야생 동물들이 농장에 침입할 때 마다 당시의 환경 데이터를 수집한 다음 이를 이용한 벡터 자동 회귀
(VAR) 모델 기반의 기계 학습을 통해 향후 야생 동물의 침입을 예측하는 서비스의 구현 및 성능 평가 결과를 담고 있
다. 침입 예측을 위한 학습 데이터를 수집하기 위해 사물인터넷 기반의 하드웨어 프로토타입을 개발했으며, 이를 학
교 인근에 위치한 소규모 농장에 설치하고서 침입 이벤트를 발생시키는 모의 시험을 장기간에 걸쳐 실시하였다. 구현한 벡터 자동 회귀 모델 기반의 침입 예측 서비스는 앞으로 30일간의 침입 발생 가능성이 높은 날짜와 시간을 제공
한다. 더불어 제안 서비스는 야생 동물의 농장 침입 시 농장 주인의 모바일 기기에 실시간으로 알림을 제공하는 기능
을 포함하며, 이에 대한 성능 평가를 실시하여 평균 7.89초의 응답 시간을 보여줌을 확인하였다.
ABSTRACT
This paper contains the implementation and performance evaluation results of a system that collects environmental data at the time when the wild animal intrusion occurred at farms and then predicts future wild animal intrusions through a machine learning-based Vector Autoregression(VAR) model. To collect the data for intrusion prediction, an IoT-based hardware prototype was developed, which was installed on a small farm located near the school and simulated over a long period to generate intrusion events. The intrusion prediction service based on the implemented VAR model provides the date and time when intrusion is likely to occur over the next 30 days. In addition, the proposed system includes the function of providing real-time notifications to the farmers mobile device when wild animals intrusion occurs in the farm, and performance evaluation was conducted to confirm that the average response time was 7.89 seconds.
키워드 : 야생 동물, 침입 예측, 벡터 자동 회귀 모델, 모바일 애플리케이션, 스마트 농장
Keywords : Wild animal, Intrusion prediction, Vector Autoregression(VAR) model, Mobile application, Smart farm.
Received 18 March 2021, Revised 3 April 2021, Accepted 18 April 2021* Corresponding Author Mintae Hwang (E-mail:[email protected], Tel:+82-55-213-3832)Professor, Department of Information and Computer Engineering, Changwon National University, Changwon, 51140 Korea
Open Access http://doi.org/10.6109/jkiice.2021.25.5.628 print ISSN: 2234-4772 online ISSN: 2288-4165This is an Open Access article distributed under the terms of the Creative Commons Attribution Non-Commercial License(http://creativecommons.org/li-censes/
by-nc/3.0/) which permits unrestricted non-commercial use, distribution, and reproduction in any medium, provided the original work is properly cited.Copyright ⒸThe Korea Institute of Information and Communication Engineering.
Journal of the Korea Institute of Information andCommunication Engineering
VAR 모델을 이용한 야생 동물의 농장 침입 예측 서비스
629
Ⅰ. Introduction
Crop damage caused by the wild animal intrusions into farmland is a rising concern to farmers. Wild animals face the problem of lack of water and food. As a consequence, they travel towards the farmland, jump across the field and trample over the crops, contributing to crop losses in the farm field. This causes a major crop loss and the money spent by the farmer to cultivate the crop. Therefore it is of utmost importance to prevent the intrusions of wild animals to protect the crops. This issue can be overcome by using a prediction system.
Consequently, this paper proposed a system that is useful for the analysis of wild animal intrusions predictions using a Vector Autoregression (VAR) model. Machine learning-based intrusion prediction technology has specific flexible capabilities that can adapt to various network conditions and provide a high intrusion prediction rate. As an outcome, farmers can easily obtain prediction information about the wild animal intrusions on mobile applications.
In this study, we have developed a very useful system to ensure farm field intrusion predictions of wild animals using a prediction system. For predicting intrusions, the data is collected from the farm field by using the HW module and stored on the firebase database, and the prediction system access this data and generates the predictions. These predicted results are stored back to the firebase, and by using a mobile application, farmers can see wild animal prediction information in the form of a graph. This research aims to assist farmers, so the farmers will know the future intrusion events in the farm field.
The rest of the chapter is structured as follows: Section 2 explains the research related to animal intrusion and prevention techniques. Section 3 illustrates the Prediction System. Section 4 describes the performance evaluation. Section 5 concludes this research and discussion on future studies.
Ⅱ. Related Works
Radhakrishnan and Ramanathan [1] developed a support vector machine with Gabor features for animal intrusion detection in agriculture fields. Their work reported image processing and machine learning-based approaches to classify the animal as a threat and then warn the farmer. They used a 2D Gabor filter bank for feature extraction, an image segmentation watershed algorithm, and the Support Vector Machines algorithm classification.
Xu et al. [2] proposed an animal intrusion detection system based on a convolutional neural network. In their research, intrusion detection of animals is done by using UWB (Ultra-Wide Band) technology. To classify human beings from animals, they also used SVM or Softmax classifier.
Nithin et al. [3] IoT enabled farming assistance, and security system is proposed by using machine learning. The technique developed enhances an efficient security system that protects the field against wild animals' intrusions.
Trnovszký et al. [4] proposed an animal recognition system based on a convolutional neural network. In this research, the Convolutional Neural Network (CNN) was used to classify input animal images. This approach is compared to well-known methods of image recognition, like Local Binary Pattern Histograms (LBPH), Support Vector Machine (SVM), Linear Discriminant Analysis (LDA), and Principal Component Analysis (PCA).
Nikhil et al. [5] proposed a real-time monitoring system of agricultural land with crop prediction and animal intrusion prevention using the IoT and machine learning at the edge. The system that has been built saves time, eliminates problems such as constant monitoring, crop prediction, and prevents wild animal intrusion from approaching the farm field.
Varghese and Sharma [6] developed affordable smart farming using the Internet of Things (IoT) and machine learning, via which one can build a cost-efficient smart farming module.

한국정보통신학회논문지 Vol. 25, No. 5: 628-636, May. 2021
630
Ashwini and Hwang [7] proposed field test and pattern analysis of wild animals intrusion to the farm field. This study presents the wild animal intrusion patterns analysis in the farm field. Their research conducted the hardware (HW) module field to collect the data such as motion detection data, temperature, humidity, date, time, and GPS data.
Ⅲ. Prediction System
In this research, we mainly focus on the prediction technologies used to predict farm field intrusions of the wild animal offered to farmers using prediction technology via the mobile application. In the context of this study, the recently proposed system is based on the previously proposed system [7]. The system includes four parts: first, a hardware module (HW) gathers data on motion detection, which are time, Global Positioning System (GPS), temperature, and humidity data. When the intrusions of wild animals occurred in the farm field. Secondly, a firebase database stores the data collected data by the HW module. A VAR model, as a simulation platform that is used for the prediction of wild animal intrusions. Subsequently, with the mobile application's help, farmers can view predicted information about the farm field's wild animal intrusion data. Fig. 1 shows the process of the system.
Fig. 1 Overall Process of the System
3.1. Vector Autoregression (VAR) Model
The Vector Autoregression (VAR) is used to create, which plays a major role in our predictive analytics. A VAR model is used to explain the evolution of k endogenous variables with time. The VAR model's form is like every variable is a linear function of its own previous lags. The typical VAR model is written as[8]:
(1)
The variable t defines that the variable i's value is
previous time periods and is called the "ith lag" of .
The variable is the k-vector's constants acting as the model's intercept. i is a time-invariant [k × k] matrix
and t define k-vector of error terms. In a VAR(p)
process, the white noise of multivariate vectors is represented by t. In a multivariate time series, the t has
to be a continuous random vector that should satisfy the below conditions:
(2)
The expected value for the error vector is 0.
(3)
The expected value of t and t is the standard
deviation of the series.The VAR model is one of the most effective, scalable,
and easy to use the model for the multivariate time series analysis. This is a natural expansion of the univariate time series model to multivariate time series. The VAR model has proven to be highly useful to decide complex behavior of economic time series and other time- dependent variables and for forecasting. It offers better forecasts than those from simultaneous equations models and univariate time series models. Forecasts from VAR models are versatile since the possible future paths of defined variables in the model are possible to make it conditional. The VAR model is used for policy analysis and structural inference in addition to predictions and data explanation. The VAR model is one of the most frequently used multivariate regression time series

VAR 모델을 이용한 야생 동물의 농장 침입 예측 서비스
631
analysis techniques. The VAR model is beneficial because it can describe past and causal relationships between multiple variables over time and predict future events. Description and prediction of future events in a time series depend on properly implying a VAR model and estimating its variables.
3.2. Prediction Model for Wild Animal Intrusions
The main purpose of the using VAR model as a prediction system is to provide information about the future farm field events in the farm field and allow farmers to make decisions about it. An intrusion occurred data from the farm field by the HW module [7] to create a daily prediction. The key justification for choosing the VAR model is useful for analyzing multiple time series. There are a couple of other models available such as ARIMA, one of the most widely known time series forecasting models, although it is only useful for univariate time series analysis. Time-Series data varies continuously over time. There may be one variable in a given dataset that does so (univariate) or multiple variables that vary over time (multivariate).
There are five variables data such as time, date, Global Positioning System (GPS), temperature, and humidity at which the recordings were observed in our dataset. So it is a multivariate time series. In a Multivariate time series, there are many time-dependent variables. Every variable does not only depend on its past data but also can be dependent on other variables. Each variable does not only depend on its past data but also can be dependent on other variables. This dependency has been used for future forecasting. For handling this type of time series forecasting, Vector Autoregression is a good option. Even if the computation is larger, you will get good accuracy on the prediction. To find inter-dependencies between the different series over time, VAR models are perfectly suited. For handling this type of time series forecasting, Vector Autoregression is a good option. Even if the computation is larger, you will get good accuracy on the prediction. To find inter-dependencies between the different series
over time, VAR models are perfectly suited. Models are tools for forecasting wild animal
intrusions among the time series. As such, time-series methods provide a framework for analyzing future events based on past data a predicting how a particular wild animal intrusions time series data can behave based on past data. For multivariate time series analysis, the VAR model is the most efficient, convenient, and dynamic model. It often gives effective forecasts to the multiple time series models and simultaneous equations models. Predictions from VAR models are quite robust because they could be made conditional on the prospective future paths of defined variables. VAR models are also progressively used in health research and automatic analyses of sensor data.
3.3. Prediction Procedures
Fig. 2 shows the VAR model for farm field data was developed using the following steps:
Fig. 2 Steps to Build a VAR Model
The detailed description of the steps mentioned in fig. 2 as follows:1) Test for stationarity: Stationarity is crucial to
developing a VAR model because, in its absence, the time-series signal can not be correctly represented by model statistics like correlations and means. A

한국정보통신학회논문지 Vol. 25, No. 5: 628-636, May. 2021
632
stationary time series has features such as variance and the mean does not change with time. To ensure stationarity, the augmented Dickey-Fuller test is performed by using a function (adfuller_test()). The stationarity test was carried out separately for time, temperature, humidity, and GPS data for each intrusion data, the output of the p-value of this test for every variable. A p value of <.05 confirmed that the time series is stationary.
2) Transforming the series to make it stationary, if necessary: When a p-value > 0.05, the series is assumed to be non-stationary. We can make it stationary by differentiating the series once, perform the test again and again until it becomes stationary. The null hypothesis is the non-stationary time series, and the option is that the series is stationary. The null hypothesis's rejection shows that the series should not require to be transformed to achieve stationarity, and modeling will move to the lag length selection step.
3) Lag is determined using lag-length selection criteria: Lag length determination tends to refer to the number of previous events in a time series that would be used in the VAR model as predictors. Utilizing very few lags can lead to autocorrelated errors, and using too many lags can results in over-fitting, cause a rise in mean square errors in the forecast of the VAR model. The model selection criteria are used for the determination of the VAR(p) model's lag length. Once it has been confirmed that a series is stationary, we proceeded to select the lag length using Hannan Quinn Criterion (HQIC) and Akaike Information Criterion (AIC). A most popular method to fit VAR (p) models along with orders p = 0, 1,... pmax and select the p-value, which reduces certain model selection criteria. An alternate method to select the order(p) of the VAR models is using the model.select_order(maxlags) method.
4) The Granger causality test is performed: The time- series data impact each other in the system. We can forecast the series with previous values of data along with another series in the system. Granger's causality
checks the null hypothesis which is coefficients of previous data values in the regression equation are zero. In the tested data with granger's causality, the null hypothesis does not cause past data values of time series to the other series. So, the derived p-value from the performed test's significance level is lesser than 0.05. Hence, we can easily reject the null hypothesis.
5) Prepare Train-Validation Split: The concept of generating a validation set is to evaluate the model's performance before using it to make predictions. Generating a validation set for time series issues is tricky, so we need to consider the time component. So here, by considering the time and date values, the validation set is generated.
6) Train the model: To forecast the date, time, GPS data temperature, and humidity data for the next month period, we used the data from the last month. The model has been trained, and we used it to make predictions on the validation set. Based on these predictions and the real values, determining how well the model performed.
7) Forecast to future: To predict, the VAR model assumes the number of observations from the previous data up to the lag order. This is because the VAR model's terms are the lags of the several time series in the dataset, so we need to provide it with as many of the previous values as designated by the model's lag order.
3.4. Prediction Result based on VAR Model
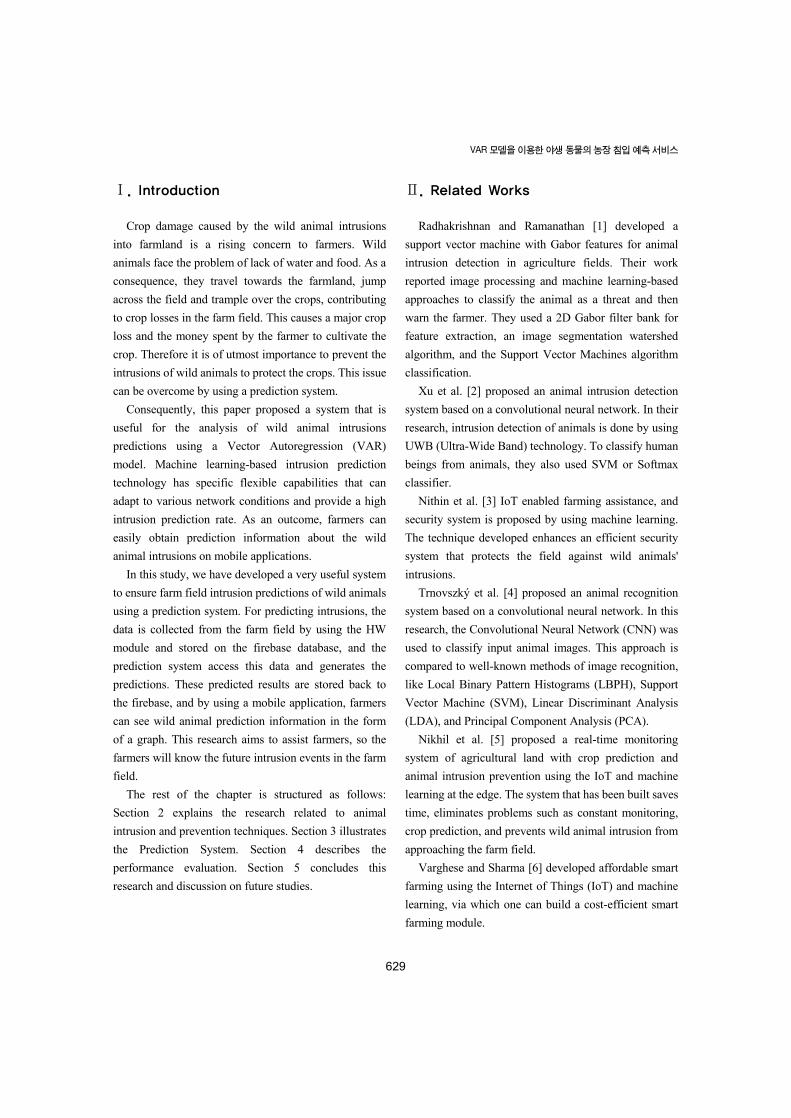
By following the steps from section 3.3, the obtained future forecast results are achieved using the pseudocode, as shown in fig. 3 and Table 1. The pseudocode provides the future forecast data such as date, time, temperature, humidity, and GPS data. The GPS data will be the same as intrusion has occurred GPS data because the targeted farm field location is the same: Latitude 35.24597 and Longitude 128.691863, at which the wild animal can intrude to the farm field.
The predicted data is in the form of values, which are exported into a CSV file, and using this file, the
VAR 모델을 이용한 야생 동물의 농장 침입 예측 서비스
633
predicted data is visualized in the graphical form.
1. Initialization.
● Import the datasets
● Read the data, the number of the row and the number of the column of the data (n *m)
2. Data conversion based on parameters
● Read different rows of the data
● Change different columns of the data based on requirement
● Convert the data format
3. Stationarity checking
● p-value of <.05, confirms time series is stationary
● p-value > 0.05, confirms time series is non-stationary.
● Determination of lag length
4. Granger’s Causality test
● p-value < significance level of 0.05, reject the null hypothesis.
5. Creating the train and validation
● Train and valid data
● Fit the model on validation data and make prediction
● Fit the model on the complete dataset and make final predictions
Fig. 3 Pseudocode
Table. 1 Predicted Result
Date_forecast 19-11-2020
19-11-2020
19-11-2020
19-11-2020
Time_forecast 12:09 13:07 21:20 22:23
Humidity_forecast 60 55 96 80
Temperature_forecast 14 15 12 11
The exported prediction results in the CSV file will be sent to the firebase database. Then, the predicted data will be shown in the mobile application in graphical form. In this research, the motion is generated by humans and recording the motion detection with environmental data with sensors and Raspberry Pi, which amounts to datasets of 30 days.
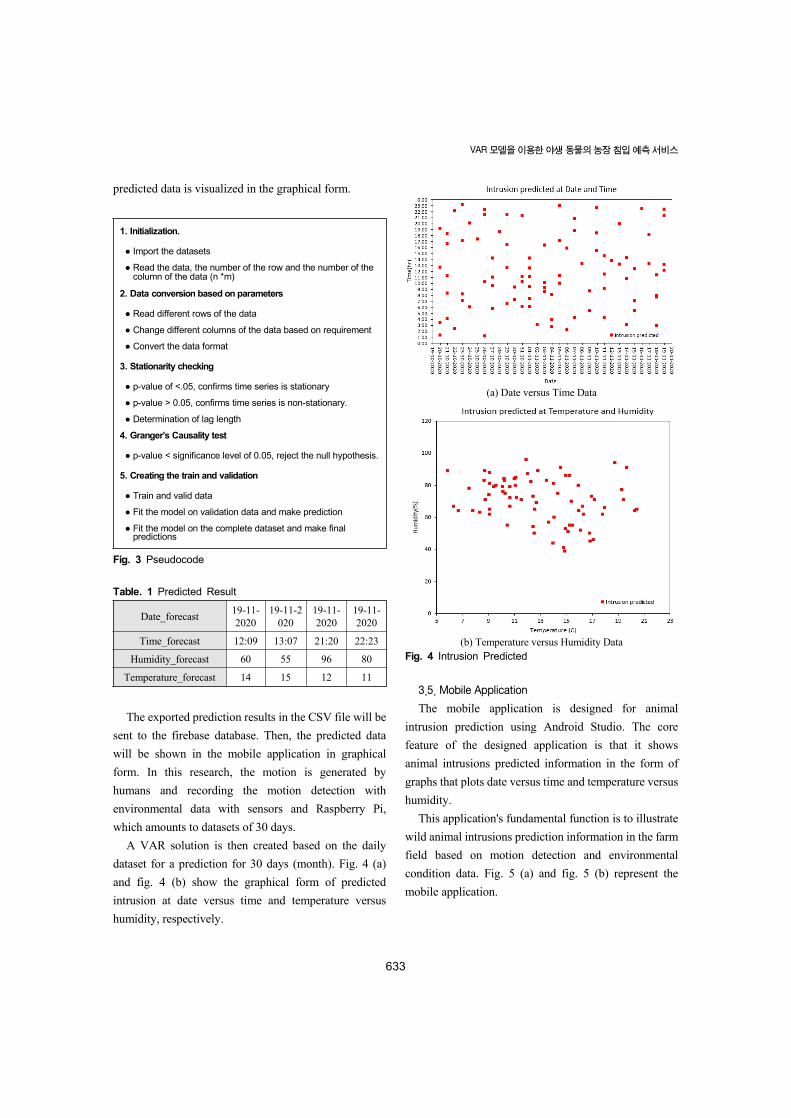
A VAR solution is then created based on the daily dataset for a prediction for 30 days (month). Fig. 4 (a) and fig. 4 (b) show the graphical form of predicted intrusion at date versus time and temperature versus humidity, respectively.
(a) Date versus Time Data
(b) Temperature versus Humidity DataFig. 4 Intrusion Predicted
3.5. Mobile Application
The mobile application is designed for animal intrusion prediction using Android Studio. The core feature of the designed application is that it shows animal intrusions predicted information in the form of graphs that plots date versus time and temperature versus humidity.
This application's fundamental function is to illustrate wild animal intrusions prediction information in the farm field based on motion detection and environmental condition data. Fig. 5 (a) and fig. 5 (b) represent the mobile application.

한국정보통신학회논문지 Vol. 25, No. 5: 628-636, May. 2021
634
(a) Intrusion Prediction Information with Date and Time
(b) Intrusion Prediction Information with Temperature and HumidityFig. 5 The Mobile Application
Ⅳ. Performance Evaluation
As seen in fig. 6, an HW module simulation is conducted at a small farm field. As the developed system is a prototype, then each motion near the farm field is assumed to be a wild animal intrusion. The simulation was carried out to determine the time response when intrusions occurred at the farm field and were recorded in the firebase database.
Fig. 6 The Performance Evaluation of HW Module at Farm Field
To collect the farm field's time responses, we planted an HW module prototype in the farm field. For the five days of the demo, the time-responses were counted by saving time-stamps in the firebase database, then subtracting each of the time-stamps, time-response, and HW module to the firebase database, and time-response from the firebase database to the mobile application.
The python code saved the time-stamps for HW module intrusion detection at the farm field into the firebase database. The HW module prototype field test results are shown in fig. 7 (a), time-response from the firebase database to the mobile application are demonstrated in fig. 7 (b), and for five days daily average time-response results are shown in Table 2.
(a) Time Response from HW Module to Firebase Database

VAR 모델을 이용한 야생 동물의 농장 침입 예측 서비스
635
(b) Time Response from Firebase Database to Mobile ApplicationFig. 7 Performance Evaluation of Simulations
Table. 2 Average Time-Response of the System
Day 1 2 3 4 5
Time response HW module (sec) 5.38 5.37 5.37 5.25 5.36
Time response Mobile Application (sec) 2.69 2.47 2.42 2.62 2.5
Total(sec) 8.07 7.85 7.8 7.87 7.86
Based on the performance evaluation tests of the system has a 7.89 seconds average time response. Time-response from the firebase database to the mobile application is faster than the time response HW module to the firebase database, as it has good internet connectivity.
One more reason for the good response time of mobile application as it has specific functions. While the HW module sends collected data from the farm field, the firebase database will respond to storing it.
Ⅴ. Conclusion
crop destruction due to wild animal intrusions into farm fields contributes to economic losses for farmers. The developed smart farming system using machine learning technology effectively prevents wild animal intrusion into a farm field in the future. It comprises an HW module in the farm field area, a firebase database, and a mobile application.
The proposed system's key benefit is that the farmers will know the wild animal's future intrusion events, which will assist in taking appropriate precautions
before intrusions. The presented system is implemented as a prototype, and farm field trials were carried out.
The observed results and the performance evaluation of the hardware module and mobile application indicate that the proposed system's average time response is 7.89 seconds. In the future, we will consider applying better performance hardware modules and increasing the dataset for better prediction to improve the system's performance.
REFERENCES
[ 1 ] S. Radhakrishnan and R. Ramanathan, “A support vector machine with Gabor features for animal intrusion detection in agriculture fields,” Procedia computer science, vol. 1, no. 143, pp. 493-501, 2018.
[ 2 ] W. Xu, T. Jiang, and J. Shi, “Animal intrusion detection based on convolutional neural network,” International Symposium on Communications and Information Technologies, Cairns, Australia, pp. 1-5, 2017.
[ 3 ] V. Nithin, S. Mishra, P. Devarubiny, and S. Muthulakshmi, “IoT enabled farming assist and security using machine learning,” Asian Research Publishing Network Journal of Engineering and Applied Sciences, vol. 14, no. 9, pp. 1809-1819, 2019.
[ 4 ] T. Trnovszký, P. Kamencay, R. Orješek, M. Benčo, and P. Sýkora, “Animal recognition system based on convolutional neural network,” Advances in Electrical and Electronic Engineering, vol. 15, no. 3, pp. 517-525, 2017.
[ 5 ] R. Nikhil, B. S. Anisha, and P. R. Kumar, “Real-time monitoring of agricultural land with crop prediction and animal intrusion prevention using internet of things and machine learning at edge,” EasyChair, no. 3016, 2020.
[ 6 ] R. Varghese and S. Sharma, “Affordable smart farming using IoT and machine learning,” Second International Conference on Intelligent Computing and Control Systems, Madurai, India, pp. 645-650, 2018.
[ 7 ] A. L. Kadam and M. Hwang, “Field test and pattern analysis of wild animals intrusions to the farm field,” in Proceeding of The 13th International Conference on Future Information & Communication Engineering(ICFICE2020), Korea: Changwon, pp. 57-60, 2021.
[ 8 ] Vector Autoregression [Internet]. Available: https://en.wikipedia.org/wiki/Vector_autoregression/.

한국정보통신학회논문지 Vol. 25, No. 5: 628-636, May. 2021
636
카담 아쉬위니(Ashwini L. Kadam)
2019 SRTMUN 대학교(인디아) 전자통신공학과 공학사2019 ~ 현재 창원대학교 정보통신공학과 석사과정※관심분야 : 사물인터넷, 기계학습, 전자회로 설계, 인터넷 응용
황민태(Mintae Hwang)
1990 부산대학교 컴퓨터공학과 공학사1992 부산대학교 컴퓨터공학과 공학석사1996 부산대학교 컴퓨터공학과 공학박사1996 ~ 1999 한국전자통신연구원 표준연구센터 선임연구원1999 ~ 2000 인제대학교 정보컴퓨터공학부 교수2000 ~ 현재 창원대학교 정보통신공학과 교수※ 관심분야 : 통신 프로토콜, 데이터베이스 설계 , 사물인터넷 응용, 기계학습, 스마트시티