ATLAS 를 이용한 저온관 6 인치 소형파단모의사고(SB-CL-09 ...
74
KAERI/TR-4077/2010 기술보고서 ATLAS 를 이용한 저온관 6 인치 소형파단모의사고(SB-CL-09) 실험보고서 6 inch Cold Leg SBLOCA Simulation Test (SB-CL-09) Report using the ATLAS 한 국 원 자 력 연 구 원
-
Upload
khangminh22 -
Category
Documents
-
view
1 -
download
0
Transcript of ATLAS 를 이용한 저온관 6 인치 소형파단모의사고(SB-CL-09 ...
KAERI/TR-4077/2010 기술보고서
ATLAS 를 이용한 저온관 6 인치
소형파단모의사고(SB-CL-09) 실험보고서
6 inch Cold Leg SBLOCA Simulation Test (SB-CL-09) Report using the ATLAS
한 국 원 자 력 연 구 원
제 출 문
한국원자력연구원장 귀하
본 보고서를 2010 년도 “APR1400/OPR1000 핵심 사고 열수력 종합
효과실험” 과제의 기술보고서로 제출합니다.
2010. 9.
주 저 자: 조 석
공 저 자: 최기용
박현식
강경호
김연식
최남현
김복득
민경호
백원필
i
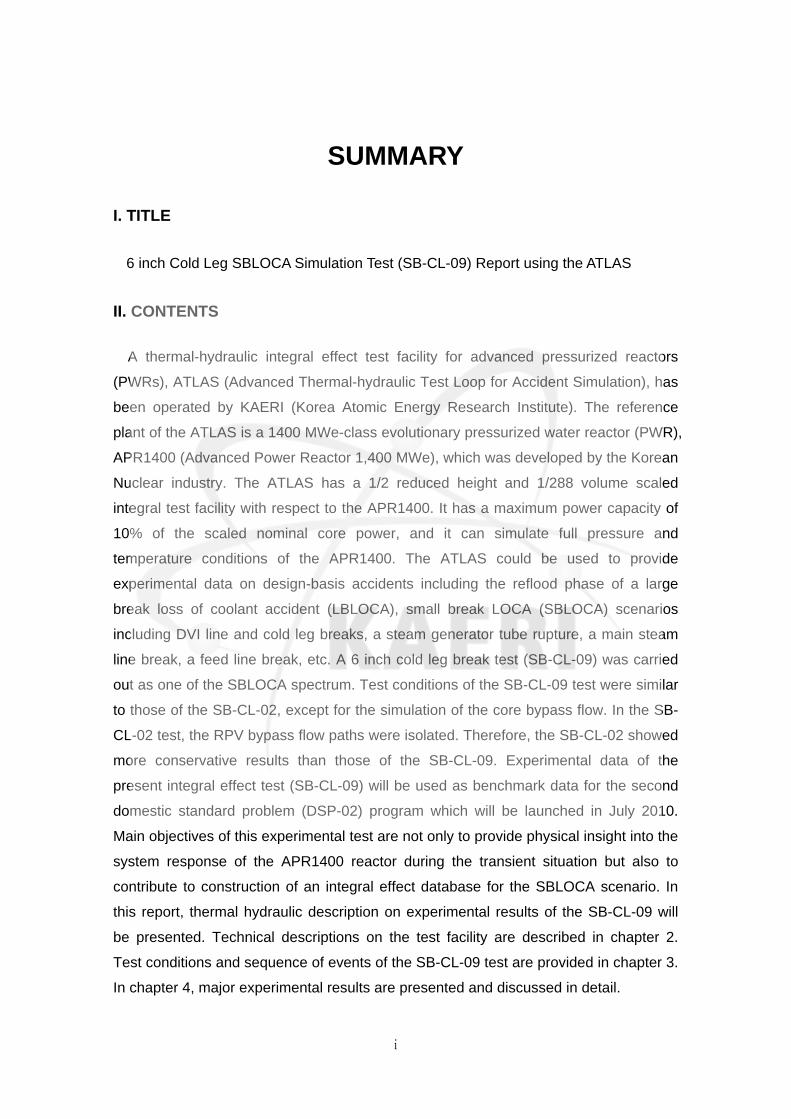
SUMMARY I. TITLE
6 inch Cold Leg SBLOCA Simulation Test (SB-CL-09) Report using the ATLAS
II. CONTENTS
A thermal-hydraulic integral effect test facility for advanced pressurized reactors
(PWRs), ATLAS (Advanced Thermal-hydraulic Test Loop for Accident Simulation), has
been operated by KAERI (Korea Atomic Energy Research Institute). The reference
plant of the ATLAS is a 1400 MWe-class evolutionary pressurized water reactor (PWR),
APR1400 (Advanced Power Reactor 1,400 MWe), which was developed by the Korean
Nuclear industry. The ATLAS has a 1/2 reduced height and 1/288 volume scaled
integral test facility with respect to the APR1400. It has a maximum power capacity of
10% of the scaled nominal core power, and it can simulate full pressure and
temperature conditions of the APR1400. The ATLAS could be used to provide
experimental data on design-basis accidents including the reflood phase of a large
break loss of coolant accident (LBLOCA), small break LOCA (SBLOCA) scenarios
including DVI line and cold leg breaks, a steam generator tube rupture, a main steam
line break, a feed line break, etc. A 6 inch cold leg break test (SB-CL-09) was carried
out as one of the SBLOCA spectrum. Test conditions of the SB-CL-09 test were similar
to those of the SB-CL-02, except for the simulation of the core bypass flow. In the SB-
CL-02 test, the RPV bypass flow paths were isolated. Therefore, the SB-CL-02 showed
more conservative results than those of the SB-CL-09. Experimental data of the
present integral effect test (SB-CL-09) will be used as benchmark data for the second
domestic standard problem (DSP-02) program which will be launched in July 2010.
Main objectives of this experimental test are not only to provide physical insight into the
system response of the APR1400 reactor during the transient situation but also to
contribute to construction of an integral effect database for the SBLOCA scenario. In
this report, thermal hydraulic description on experimental results of the SB-CL-09 will
be presented. Technical descriptions on the test facility are described in chapter 2.
Test conditions and sequence of events of the SB-CL-09 test are provided in chapter 3.
In chapter 4, major experimental results are presented and discussed in detail.
ii
요약문
I. 제 목
ATLAS 를 이용한 저온관 6 인치 소형파단모의사고(SB-CL-09) 실험보고서
II. 내 용
열수력종합효과 실험장치인 ATLAS (Advanced Thermal-hydraulic Test Loop for
Accident Simulation)는 APR1400 을 참조발전소로 건설되었다. ATLAS 는 높이를
원형발전소의 1/2 로 축소하고 1/288 의 체적비를 바탕으로 설계 및 제작되었다.
ATLAS 의 최대노심출력은 정격조건 척도비의 10%인 2MW 용량이며, 참조발전소인
APR1400 원자로의 정상상태 압력과 온도 조건을 모의할 수 있다. ATLAS 는
대형냉각재 상실사고(Large Break Loss of Coolant Accident), DVI 배관 및
저온관에서의 소형냉각재 상실사고(Small Break LOCA), 증기발생기 세관 파단사고
(Steam Generator Tube Rupture), 주증기 및 주급수 배관 파단사고 등의
설계기준사고를 모의할 수 있도록 제작되었다. 본 보고서에서 기술한 SB-CL-09 는
소형냉각재 상실사고 중 6 인치 소형관 파단사고에 대한 모의실험으로,
노심우회유량을 제외한 다른 실험조건은 SB-CL-02 와 같다. SB-CL-02 의 경우
노심우회 모의밸브를 폐쇄하고 실험을 수행하였다. 따라서 정상상태 우회유량을
모의한 SB-CL-09 에 비하여 보수적 결과를 얻었다. 본 종합효과실험(SB-CL-09)
결과는 2010 년 7 월부터 시작되는 제 2 회 국내표준문제(DSP-02) 프로그램을
위한 기준 실험 데이터로서 제공될 예정이다. 본 실험에서는 정상운전 조건에서의
노심우회유량을 모의하여 실험을 수행하였다. 실험의 목적은 저온관
소형파단사고의 경우 계통의 천이 열수력 거동에 대한 이해 증진과 소형냉각재
상실사고에 대한 종합효과 실험자료 데이터 베이스 구축에 기여하는 것이다. 본
보고서는 SB-CL-09 실험결과를 바탕으로 계통의 열수력적 거동에 대한 해석을
제공한다. 제 2 장에서는 ATLAS 에 대한 기술사양을 설명하였고, 제 3 장에서는
실험조건 및 방법을 기술하였으며, 제 4 장에서는 실험결과를 설명하였다.
iii
Table of Contents
SUMMARY (in English) .................................................................................................. i
SUMMARY (in Korean) ..................................................................................................ii
Table of Contents .......................................................................................................... iii
List of Tables ................................................................................................................ v
List of Figures ...............................................................................................................vi
Abbreviation .............................................................................................................. viii
1.0 INTRODUCTION ........................................................................................ 1
1.1 Background ......................................................................................................... 1
1.2 Objectives ............................................................................................................ 1
2.0 DESCRIPTION OF THE ATLAS .................................................................. 3
2.1 Fluid System ......................................................................................................... 3
2.2 Containment and Break Simulation System.......................................................... 4
2.3 Control and Instrumentation.................................................................................. 5
3.0 EXPERIMENTAL CONDITIONS AND PRDCEDURES.............................. 20
3.1 Test Conditions ................................................................................................. 20
3.2 Test Procedures ................................................................................................ 22
4.0 DISCUSSIONS ON THE EXPERIMENTAL RESULTS ........................... 34
4.1 Blowdown Phase ............................................................................................... 34
4.2 Two-phase Natural Circulation Phase ............................................................... 34
4.3 Loop Seal Clearance Phase .............................................................................. 35
4.4 Boil-off Phase .................................................................................................... 36
4.5 Core Recovery Phase ....................................................................................... 37
iv
4.6 Estimation of the Break Flow ............................................................................. 37
4.7 Effect of the Core Bypass Flow Rate ................................................................ 38
4.8 Fluid temperatures in the RPV............................................................................ 39
4.9 Wall temperatures in the RPV............................................................................. 40
4.10 Fluid temperatures in the SG U-tube ................................................................ 40
5.0 UNCERTAINTY ANALYSIS ....................................................................... 55
5.1 loop Flow Rate .................................................................................................... 55
5.2 Collapsed Water Level ........................................................................................ 56
5.3 Differential Pressure............................................................................................ 57
5.4 Static Pressure.................................................................................................... 57
5.5 Temperature........................................................................................................ 58
6.0 CONCLUSIONS ......................................................................................... 60
7.0 REFERENCES........................................................................................... 61

v
List of Tables
Table 2.1 Major scaling parameters of the ATLAS....................................................... 8
Table 2.2 Summary of the ATLAS instrument channels............................................... 9
Table 3.1 Calculated initial conditions for the SB-CL-09 ............................................ 24
Table 3.2 Applied decay power level with the variation of time .................................. 25
Table 3.3 Actual initial and boundary condition of the SB-CL-02 and SB-CL-09........ 26
Table 3.4 Sequence of events of the SB-CL-09 ......................................................... 27
Table 3.5 Sequence of events of the SB-CL-02 and SB-CL-09 ................................. 29

vi
List of Figures
Figure 2.1 Schematics of the ATLAS.......................................................................... 10
Figure 2.2 3-D view of the ATLAS .............................................................................. 11
Figure 2.3 3-D arrangement of the primary components of the ATLAS ..................... 12
Figure 2.4 Arrangement of the primary loop of the ATLAS......................................... 13
Figure 2.5 Schematics of the containment simulation system.................................... 14
Figure 2.6 Configuration of the break simulation system for the cold-leg SBLOCA
tests............................................................................................................ 15
Figure 2.7 Drawing of a cold-leg small break piping................................................... 16
Figure 2.8 Level transmitters in the RPV.................................................................... 17
Figure 2.9 Sensing locations of temperature in the RPV............................................ 18
Figure 2.10 Detailed fluid temperature measurement locations in the down-comer... 19
Figure 3.1 Injected SIPs flow rate of the SB-CL-09 compared with MARS post-
calculation results....................................................................................... 30
Figure 3.2 Injected SITs flow rate during the SB-CL-09 test ...................................... 30
Figure 3.3 Applied core power of the SB-CL-09 test .................................................. 31
Figure 3.4 Flow characteristic curves of RPV bypass valves ..................................... 32
Figure 3.5 Heat balance during the initial steady-state............................................... 33
Figure 4.1 SBLOCA phase separation of the SB-CL-02 and -09 tests....................... 41
Figure 4.2 Collapsed water levels in the SG and intermediate leg ............................. 42
Figure 4.3 Collapsed water levels of the down-comer and the core region................ 43
vii
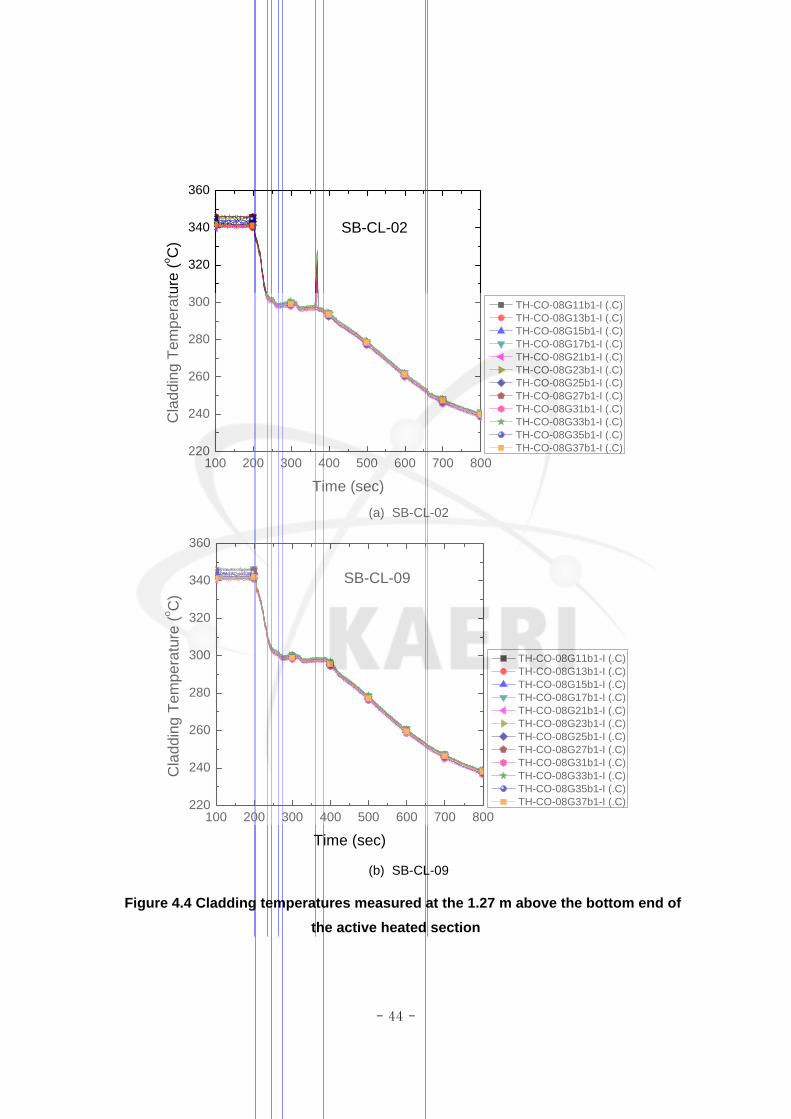
Figure 4.4 Cladding temperatures measured at the 1.27 m above the bottom end of
the active heated section............................................................................ 44
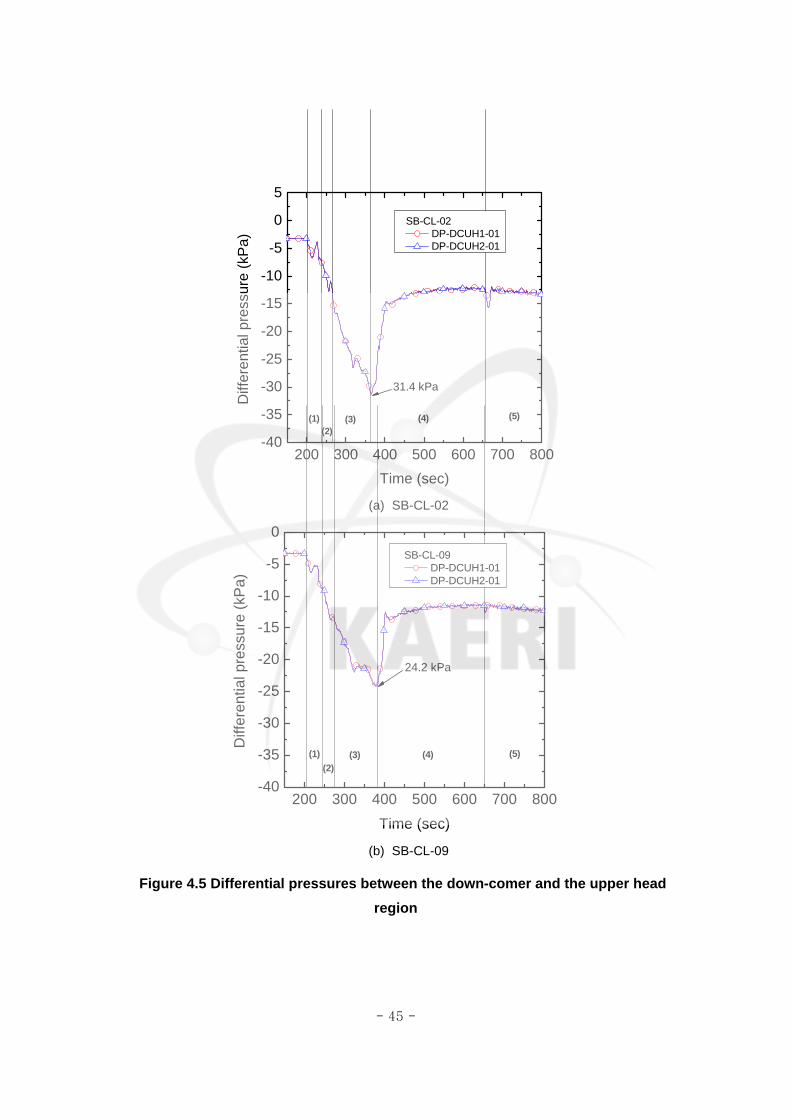
Figure 4.5 Differential pressures between the down-comer and the upper head
region ......................................................................................................... 45
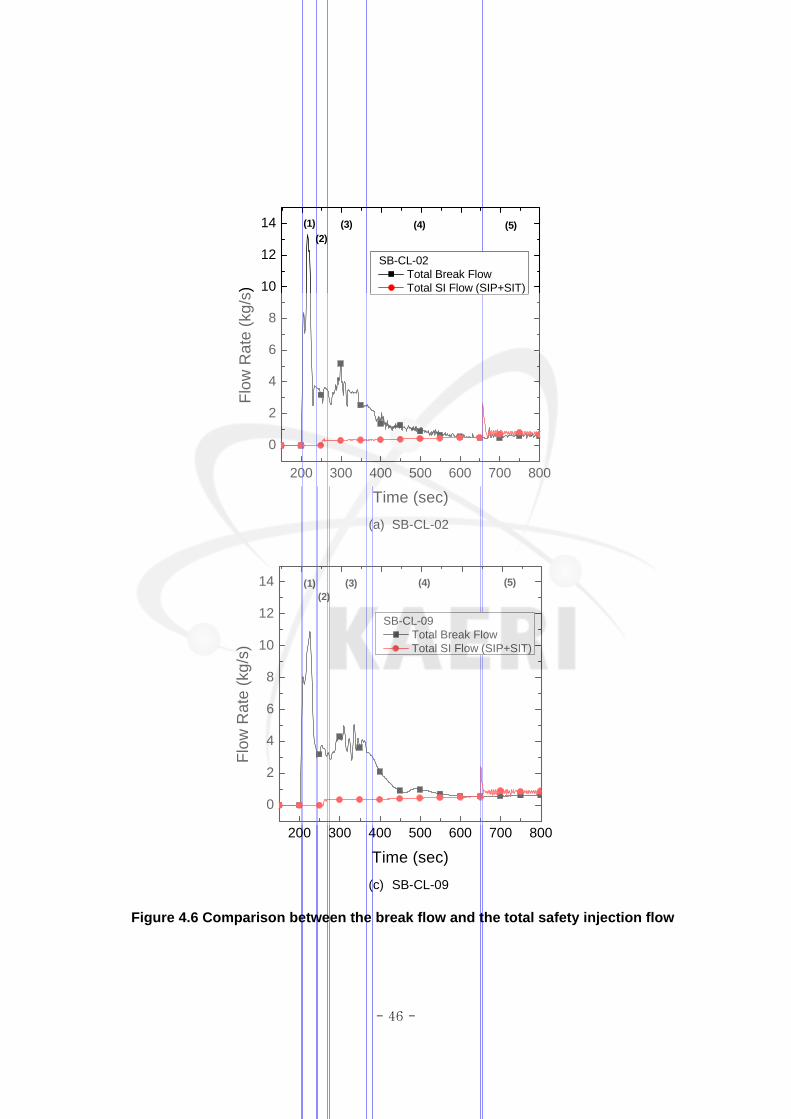
Figure 4.6 Comparison between the break flow and the total safety injection flow .... 46
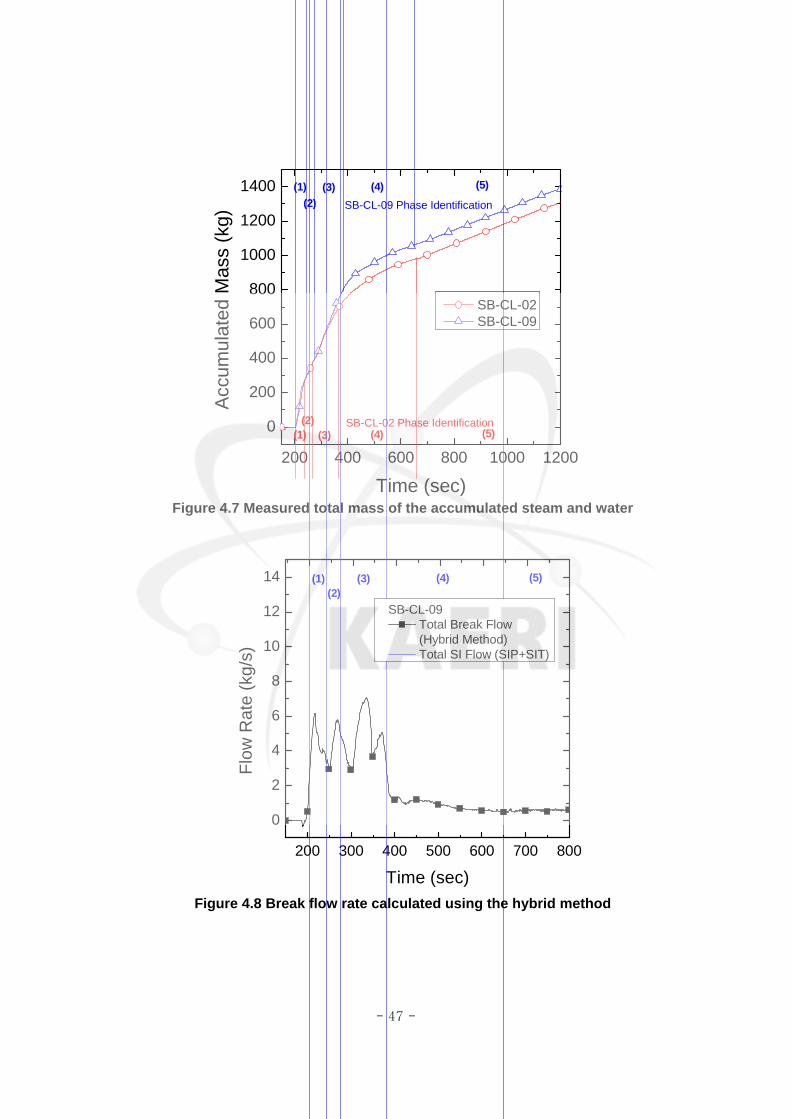
Figure 4.7 Measured total mass of the accumulated steam and water ...................... 47
Figure 4.8 Break flow rate calculated using the hybrid method .................................. 47
Figure 4.9 Core collapsed liquid level in LSTF SC5 (2.3% bypass) and SC7 (9.2%
bypass) experiments .................................................................................. 48
Figure 4.10 Core inlet and outlet fluid temperature during the transient..................... 49
Figure 4.11 Fluid temperature behavior along the axial direction of the core region.. 50
Figure 4.12 Fluid temperature behavior along the axial direction of the core upper
plenum and the upper head region ............................................................ 51
Figure 4.13 Fluid temperature behaviors in the down-comer region .......................... 52
Figure 4.14 Wall temperature behavior of the outer wall of the down-comer ............. 53
Figure 4.15 Fluid temperature behavior of the SG U-tube (a: hot side, b: cold-side) . 54
Figure 5.1 Schematic diagram of the horizontal test loop........................................... 59
Figure 5.2 Comparison of the two-phase flow rates in the calibration test ................. 59
viii
Abbreviation AFW Auxiliary Feed Water BMS Break flow Measurement System CS Containment Simulator CWS Component Cooling System DVI Direct Vessel Injection FLB Feed Line Break HCS Heat Compensation System MSLB Main Steam Line Break MWS Make-up Water System NSS Nitrogen Supply System PZR Pressurizer RPV Reactor Pressure Vessel RWT Refueling Water storage Tank SBLOCA Small Break Loss of Coolant Accident SDS Safety Depressurization System SG Steam Generator SGTR Steam Generator Tube Rupture SIP Safety Injection Pump SIS Safety Injection System SIT Safety Injection Tank SSS Steam Supply System
- 1 -
1.0 INTRODUCTION An integral effect test on the SBLOCA (Small-Break Loss of Coolant Accident)
aiming at 6-inch cold leg bottom break, SB-CL-09, was conducted with the ATLAS
(Advanced Thermal-Hydraulic Test Loop for Accident Simulation) on November 13,
2009 by KAERI. This report presents major experimental results of the SB-CL-09 test.
1.1 Background
An SBLOCA is characterized by relatively slow reactor coolant system (RCS)
depressurization rates and relatively slow mass loss from the RCS, compared to the
design basis accident of LBLOCA [1]. Because of the slow depressurization rates and
the low primary flow rates (after RCPs are tripped), the steam and liquid phases in the
RCS can be easily separated. The nature and amount of phase separation depend
upon the location within the RCS and the time during the transient. These phase
separation has a significant effect on both hydraulic and heat transfer characteristics of
the SBLOCA. The detailed response of the RCS parameters during the SBLOCA
depends on several PWR design characteristics: an initial core power, a core power
distribution, a fuel burn-up, an RCS inventory, a relative volumetric distribution of major
RCS components, a steam generator type, and an emergency core cooling system
(ECCS) design. The real safety issue associated with the SBLOCA is the possibility of
severe voiding of vessel liquid before the primary pressure decreases to a set-point for
safety injection. Semiscale studies [2] indicated that a 5% SBLOCA produced the most
severe core liquid depressions and that the core bypass flow significantly affected the
accident.
1.2 Objectives
A 6 inch cold leg break test (SB-CL-09) was carried out as one of the SBLOCA
spectrum. Experimental data of the present integral effect test (SB-CL-09) will be used
as benchmark data for the second domestic standard problem (DSP-02) program
which will be launched at July 2010. Main objectives of this experimental test are not
only to provide a physical insight into the system response of the APR1400 reactor
during the transient situation but also to contribute to construction of an integral effect

- 2 -
database for the SBLOCA scenario. In this report, thermal hydraulic description on the
experimental results of the SB-CL-09 test will be presented. Technical descriptions on
the test facility are described in chapter 2. Test conditions and sequence of events of
the SB-CL-09 test are provided in chapter 3. In chapter 4, major experimental results
are presented and discussed in detail.

- 3 -
2.0 DESCRIPTION OF THE ATLAS
After an extensive series of commissioning tests in 2006, KAERI started operations
of the ATLAS [3]. The ATLAS is a thermal-hydraulic integral effect test facility for
evolutionary pressurized water reactors of APR1400 and OPR1000. The reference
plant of the ATLAS is the APR1400, which is an advanced power reactor developed by
the Korean nuclear industry and has a rated thermal power of 4000 MW and a loop
arrangement of 2 hot legs and 4 cold legs for the reactor coolant system [4, 5]. The
ATLAS also incorporates some specific design features of the Korean standard nuclear
power plant, the OPR1000, such as a cold-leg injection mode for a safety injection and
a low pressure safety injection mode. The ATLAS can be used to investigate the
multiple responses between the systems for a whole plant or between the
subcomponents in a specific system during anticipated transients and postulated
accidents.
2.1 Fluid System
The ATLAS has the same two-loop features as the APR1400 and is designed
according to the well-known scaling method suggested by Ishii and Kataoka [6] to
simulate the various test scenarios as realistically as possible. It is a half-height and
1/288-volume scaled test facility with respect to the APR1400. The main motive for
adopting the reduced-height design is to allow for an integrated annular down-comer
where the multidimensional phenomena can be important in some accident conditions
with a DVI operation. According to the scaling law, the reduced height scaling has the
time-reducing results in the model. For the one-half-height facility, the time for the
scaled model is 2 times faster than the prototypical time. The friction factors in the
scaled model are maintained the same as those of the prototype. The hydraulic
diameter of the scaled model is maintained the same as that of the prototype to
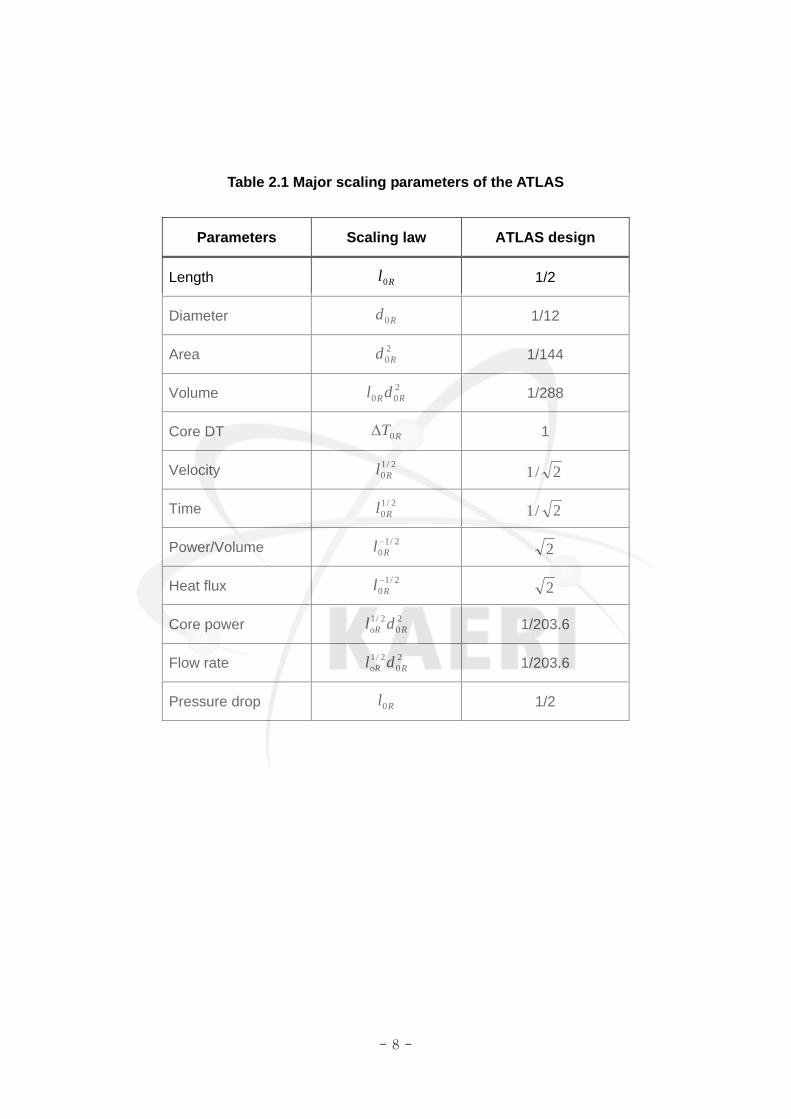
preserve the prototypical conditions for the heat transfer coefficient. Major scaling
parameters of the ATLAS are summarized in Table 2.1.
The fluid system of the ATLAS consists of a primary system, a secondary system, a
safety injection system, a break simulating system, a containment simulating system,
and auxiliary systems. The primary system includes a reactor pressure vessel, two hot
- 4 -
legs, four cold legs, a pressurizer, four reactor coolant pumps (RCPs), and two steam
generators. The secondary system of the ATLAS is simplified to be of a circulating
loop-type. The steam generated at two steam generators is condensed in a direct
condenser tank and the condensed feedwater is again injected to the steam generators.
Most of the safety injection features of the APR1400 and the OPR1000 are
incorporated into the safety injection system of the ATLAS. It consists of four safety
injection tanks (SITs), a high pressure safety injection pump (SIP) which can simulate
safety injection and long-term cooling, a charging pump for charging auxiliary spray,
and a shut down cooling pump and a shutdown heat exchanger for low pressure safety
injection, shutdown cooling operation and recirculation operation. The break simulation
system consists of several break simulating lines such as large break LOCA (LBLOCA),
direct vessel injection (DVI) line break LOCA, SBLOCA, steam generator tube rupture
(SGTR), main steam line break (MSLB) and feedwater line break (FLB), etc. Each
break simulating line consists of a quick opening valve, a break nozzle and instruments.
It is precisely manufactured to have a scaled break flow through it in the case of LOCA
tests. The containment simulating system of the ATLAS has a function of collecting the
break flow and maintaining a specified back-pressure in order to simulate containment.
Besides, the ATLAS has some auxiliary systems such as a makeup system, a
component cooling system, a nitrogen/air/steam supply system, a vacuum system, and
a heat tracing system.
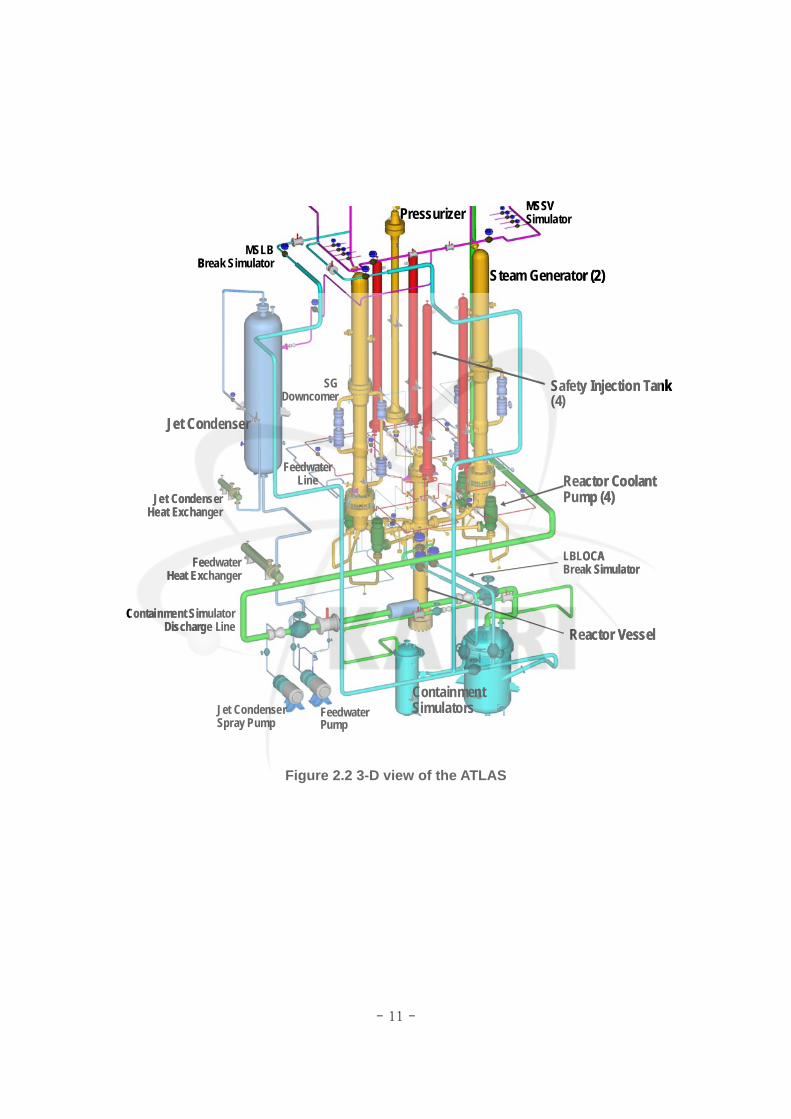
Schematic diagram of the ATLAS is shown in Fig. 2.1. More realistic 3-dimensional
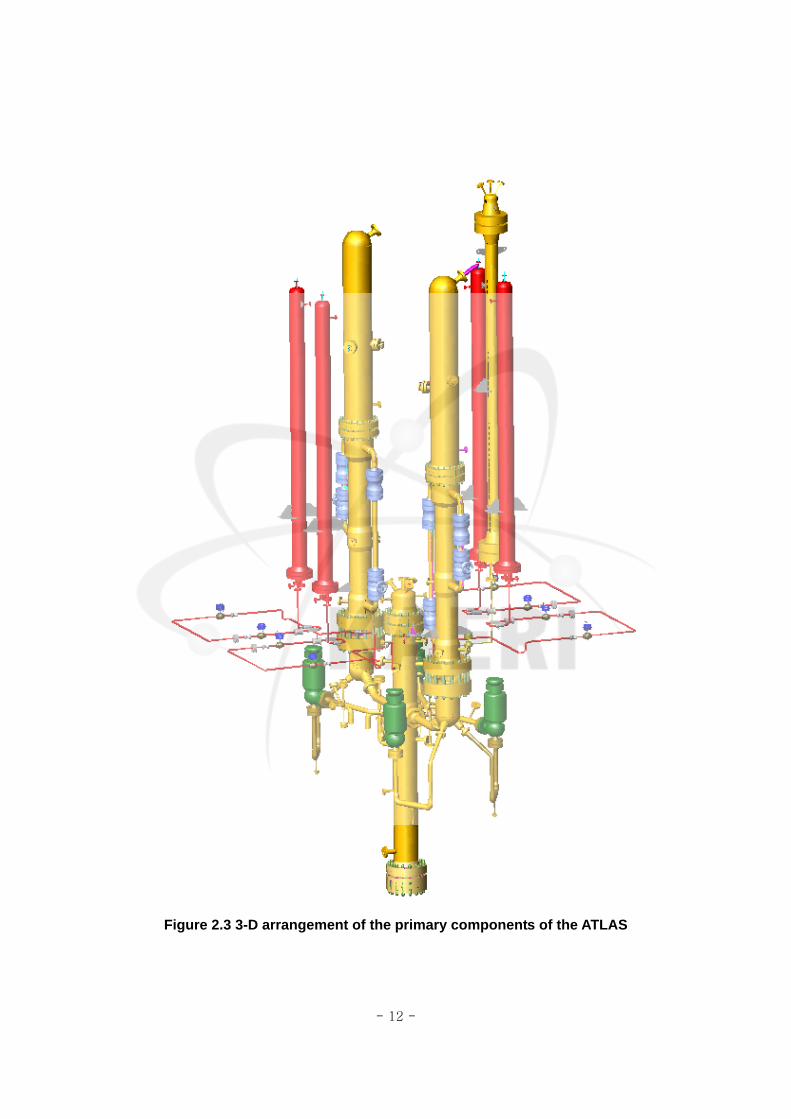
view of the ATLAS is shown in Fig. 2.2. A 3-dimensional arrangement of the primary
components is shown in Fig. 2.3, including a reactor pressure vessel, two steam
generators, four reactor coolant pumps, a pressurizer, and four safety injection tanks.
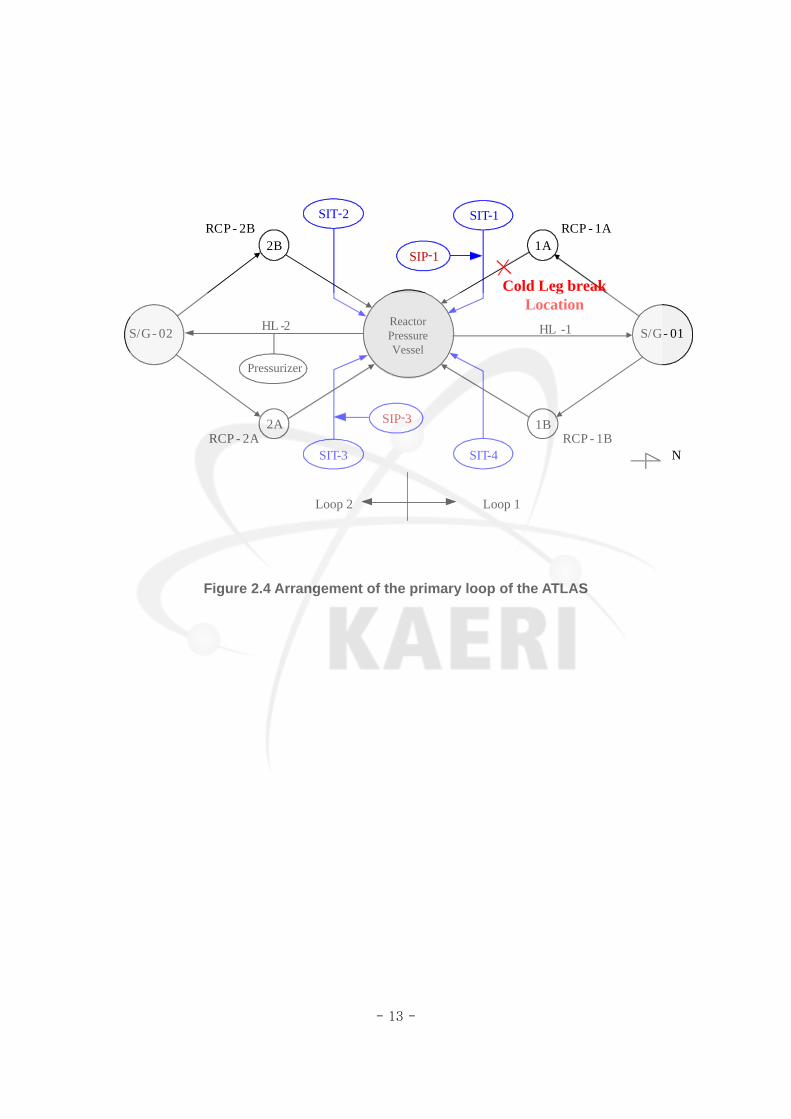
Arrangement and labeling of the primary legs is also shown in Fig. 2.4. Detailed ATLAS
design and description of the ATLAS development program can be found in the
literature [7]. The containment and break simulation systems in the ATLAS are
described in the following sections in detail.
2.2 Containment and Break Simulation System
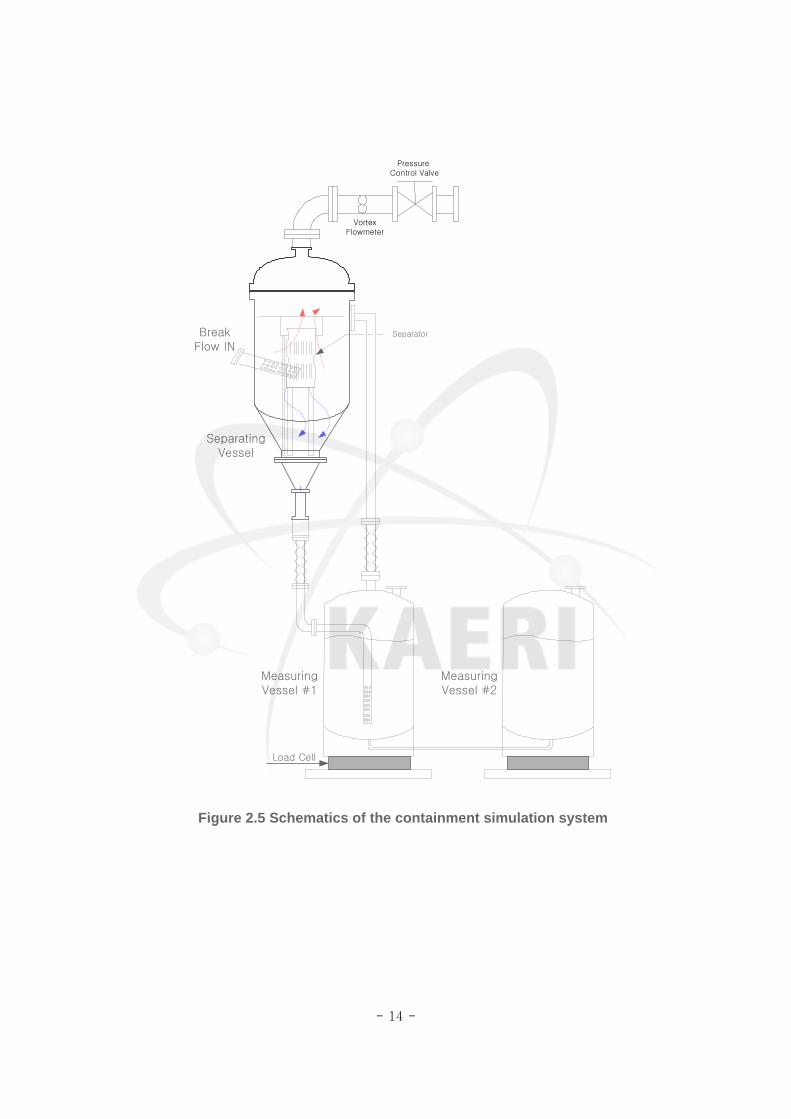
The break flow is discharged to a containment simulation system, which consists of a
separating vessel and two measuring vessels. Overall configuration of the containment
simulation system is shown in Fig. 2.5. The separating vessel is designed to be used

- 5 -
for separating a two-phase break flow. The steam, which was separated in two
separating vessels, was discharged through a silencer to the atmosphere, and the
separated steam flow rate is measured by a vortex-type flow meter at the discharge
line. The water, which is separated in the separating vessel, is drained to one of the
measuring vessels. A load cell is installed on the bottom of each measuring vessel to
measure the water mass. The water from the separating vessel is accumulated in the
measuring vessels. The separating vessel is also designed to simulate a containment
back-pressure by controlling its pressure by using a pressure control valve.
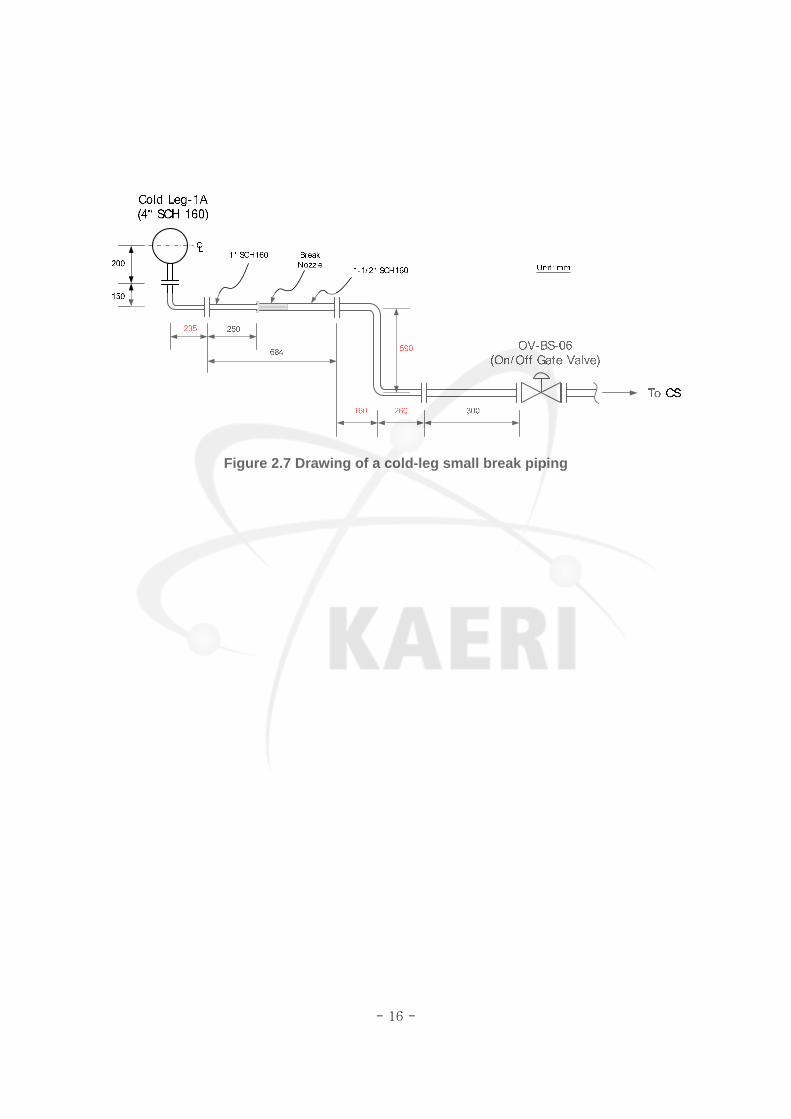
A break simulator consists of a quick opening valve (OV-BS-06), a break nozzle and
its housing, and related instruments. Detailed geometry of the break nozzle for the
present test is shown in Fig. 2.6. The inner diameter of the break nozzle is determined
to be 10.7 mm which corresponds to 1/203.6 of a 6 inch break area. The break nozzle
has a well-rounded entrance and total length is up to 138.2 mm including the entrance
region to comply with the long pipe requirement that the length to diameter ratio should
be above 12. Figure 2.7 shows
2.3 Control and Instrumentation
The control and data acquisition system of the ATLAS has been built with a hybrid
distributed control system (DCS). The input and output modules are distributed in 10
cabinets and they are controlled by two CPUs. The raw signals from the field are
processed or converted to engineering units (EU) in a system server and the
processed or converted signals are monitored and controlled through the HMI (Human
Machine Interface) system by operators. The ARIDES system, which is provided by
BNF Technology Inc. and is run on a LINUX platform, is used as control software.
Instrumentation signal of the ATLAS consists of measurement-based analog input
signals and control-based in-out signals such as AI (Analog Input), AO (Analog Output),
TC (Thermocouple), DI (Digital Input), DO (Digital Output), and SR (Serial
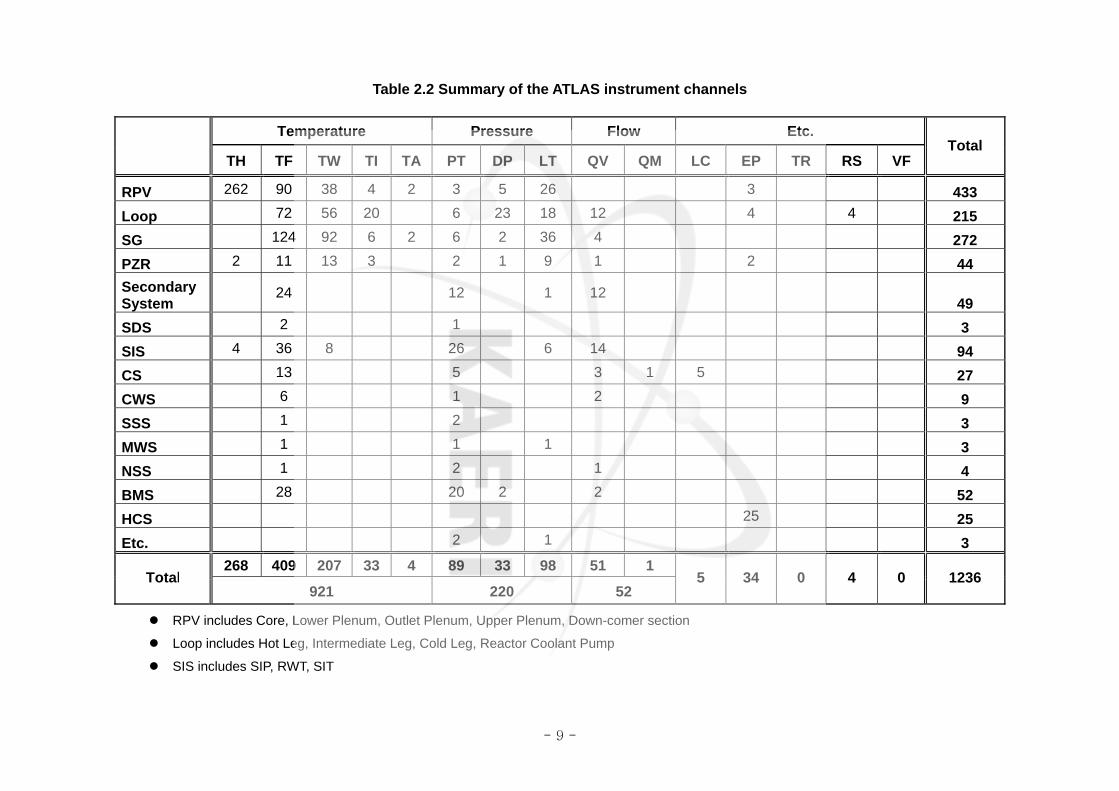
communication). Table 2 shows the number of measurement-based analog input
signals according to a sub-system of the ATLAS. The number of instruments is up to
1,236 at present, and the number of each signal processing group can be identified in
Table 2.2. Instrument signals can also be categorized according to the instrument type
such as the temperature, static pressure, differential pressure, water level, flow rate,
power, and rotational speed. The measurement locations of the instruments for

- 6 -
measuring the water levels of the reactor pressure vessel, the steam generator, and
the pressurizer can be found in Kang et al., [8]. There are 390 electric heaters which
are divided concentrically into 3 groups (Group-1, Group-2 and Group-3). Group-1, -2,
and -3 heaters are located in inner, middle, and outer regions of the heater bundle,
respectively, and they have 102, 138 and 150 heaters, respectively. The cross-
sectional location of the thermocouples installed in the core heater bundles and the
axial location of the thermocouples, spacer grids, and level transmitters can be found in
the reference [8].
The control-based in-out signal is assigned for an individual control of working
devices such as pumps, valves, and heaters and for a monitoring of the status
including alarm and fault signals of the related devices. There are about 1500 logically
derived IO signals. All the IO signals are processed at 10Hz.
The Human-Machine-Interface (HMI) consists of 43 processing windows and they
are classified according to the ATLAS fluid system. All the control devices can be
controlled by manual, auto, sequence, group, or table control methods. The control
logics are distributed in the RTP CPU, the system server and the HMI itself. The control
logics which directly control or protect the control devices in the field are installed in the
RTP CPU. Flexible control logics which control and monitor the sequential operations
of the control devices are installed at the system server. They are based on a standard
C++ program structure and can be customized easily depending on a users’ request.
Flexibility is essential for an implementation of the major accident scenario simulations
of the APR1400/OPR1000 with the ATLAS. Some control logics which are needed for
a communication between the system server (or RTP CPU) and the HMI are also
installed at the HMI.
The monitoring system can display real time trends or historical data of the selected
IO signals on LCD monitors in a graphical form. The data logging system can be
started or stopped by operators and a logging frequency can be selected from among
0.5, 1, 2, 10Hz. The raw signals as well as EU converted signals are saved in one of
four operator processing stations.
The ATLAS has a protection system which protects the operators in a control room
and prevents the major hardware from a failure in the case of an emergency. The
protection system consists of a software protection by control logics and a manual
protection device on the emergency panel. Detailed description of the signal
processing system and control system of the ATLAS can be found in the literatures [9,
- 7 -
10]. In the ATLAS test facility, a total of 1,236 instrumentations are installed for the
measurement of thermal hydraulics phenomena in the components. Most of the
instrumentations are chosen from commercially available ones. However, an average
bi-directional flow tube (BDFT or BiFlow) and a break flow system are specially
developed or designed for the measurements of the flow rates in the primary piping
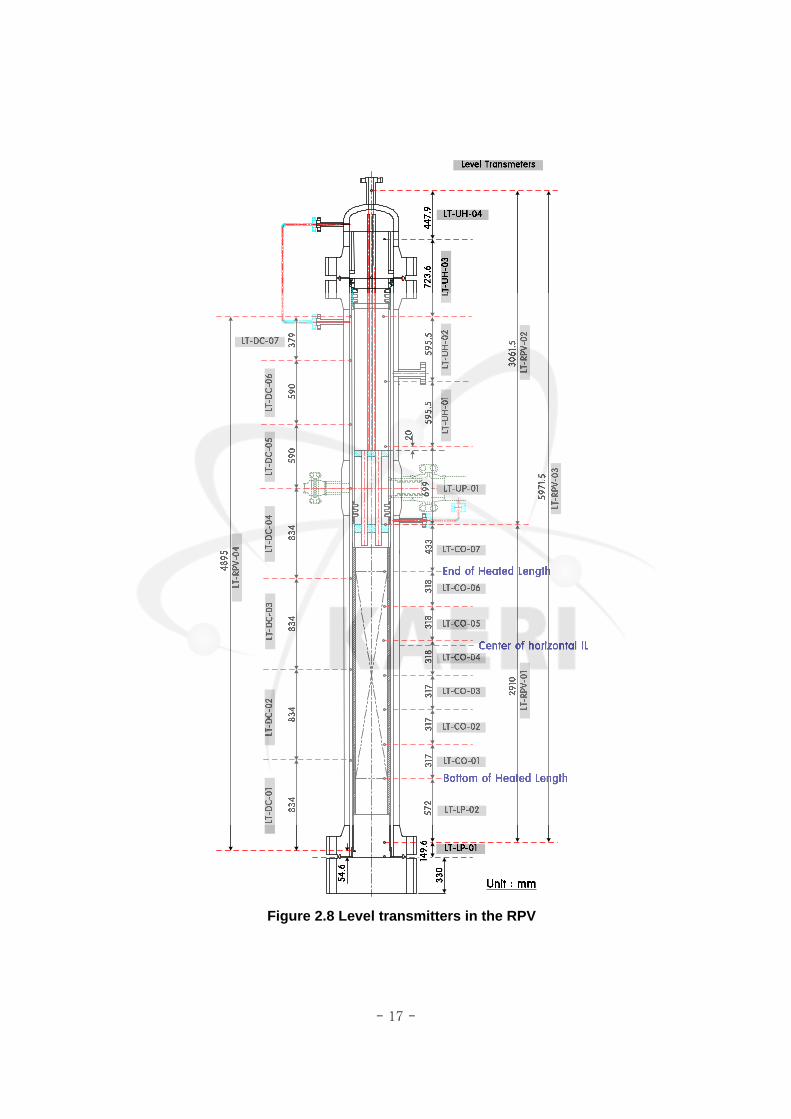
and in the containment system, respectively [11]. Sensing locations of the collapsed
water level and temperature in the RPV can be observed in Fig. 2.8 and 2.9,
respectively, and detailed locations of fluid temperature measurement in the down-
comer regions can be seen in Fig. 2.10.
- 8 -
Table 2.1 Major scaling parameters of the ATLAS
Parameters Scaling law ATLAS design
Length Rl0 1/2
Diameter Rd0 1/12
Area 20Rd 1/144
Volume 200 RRdl 1/288
Core DT RT0∆ 1
Velocity 2/10Rl 2/1
Time 2/10Rl 2/1
Power/Volume 2/10−Rl 2
Heat flux 2/10−Rl 2
Core power 20
2/1RoR dl 1/203.6
Flow rate 20
2/1RoR dl 1/203.6
Pressure drop Rl0 1/2
- 9 -
Table 2.2 Summary of the ATLAS instrument channels
Temperature Pressure Flow Etc.
TH TF TW TI TA PT DP LT QV QM LC EP TR RS VF Total
RPV 262 90 38 4 2 3 5 26 3 433 Loop 72 56 20 6 23 18 12 4 4 215 SG 124 92 6 2 6 2 36 4 272 PZR 2 11 13 3 2 1 9 1 2 44 Secondary System
24 12 1 12 49
SDS 2 1 3 SIS 4 36 8 26 6 14 94 CS 13 5 3 1 5 27 CWS 6 1 2 9 SSS 1 2 3 MWS 1 1 1 3 NSS 1 2 1 4 BMS 28 20 2 2 52 HCS 25 25 Etc. 2 1 3
268 409 207 33 4 89 33 98 51 1 Total
921 220 52 5 34 0 4 0 1236
RPV includes Core, Lower Plenum, Outlet Plenum, Upper Plenum, Down-comer section
Loop includes Hot Leg, Intermediate Leg, Cold Leg, Reactor Coolant Pump
SIS includes SIP, RWT, SIT

- 10 -
Figure 2.1 Schematics of the ATLAS
- 11 -
Steam Generator (2)
Safety Injection Tank (4)
Reactor Vessel
Jet Condenser
Jet CondenserHeat Exchanger
FeedwaterHeat Exchanger
FeedwaterPump
Jet CondenserSpray Pump
LBLOCABreak Simulator
Containment SimulatorDischarge Line
ContainmentSimulators
Reactor CoolantPump (4)
Pressurizer MSSV Simulator
MSLBBreak Simulator
SGDowncomer
FeedwaterLine
Figure 2.2 3-D view of the ATLAS
- 12 -
Figure 2.3 3-D arrangement of the primary components of the ATLAS
- 13 -
N
Cold Leg breakLocation
Loop 2 Loop 1
Pressurizer
SIP-1
SIT-3 SIT-4
HL -1HL -2
SIP-3
S/G- 01
RCP - 2A
RCP - 2B
RCP - 1B
RCP - 1A
ReactorPressureVessel
S/G- 02
1B
1A2B
2A
SIT-1SIT-2
Figure 2.4 Arrangement of the primary loop of the ATLAS
- 14 -
PressureControl Valve
VortexFlowmeter
Separator
MeasuringVessel #1
Load Cell
SeparatingVessel
BreakFlow IN
MeasuringVessel #2
Figure 2.5 Schematics of the containment simulation system

- 15 -
1.5" x 3" S801.5" 160s
10
R10
128.2
(Rmax = 0.025 mm)
10.68 +/- 0.05
32.0+/- 0.1
Connection for ANSI Std Flange (1.5 in, 2500 lb)
*Unit : mm
From CL break Nozzle
1.5" 2500 lb Flange
1.5" 2500 lb Flange
1.5" 2500 lb Flange
1.5" 80s1.5" 160s
Drain
PTPT TC
TC
TC
TC
Break nozzle and its Housing
1.5" 2500 lb Gate Quick Opening Valve
Figure 2.6 Configuration of the break simulation system for the cold-leg SBLOCA tests
- 16 -
Figure 2.7 Drawing of a cold-leg small break piping
- 17 -
Figure 2.8 Level transmitters in the RPV

- 18 -
Figure 2.9 Sensing locations of temperature in the RPV
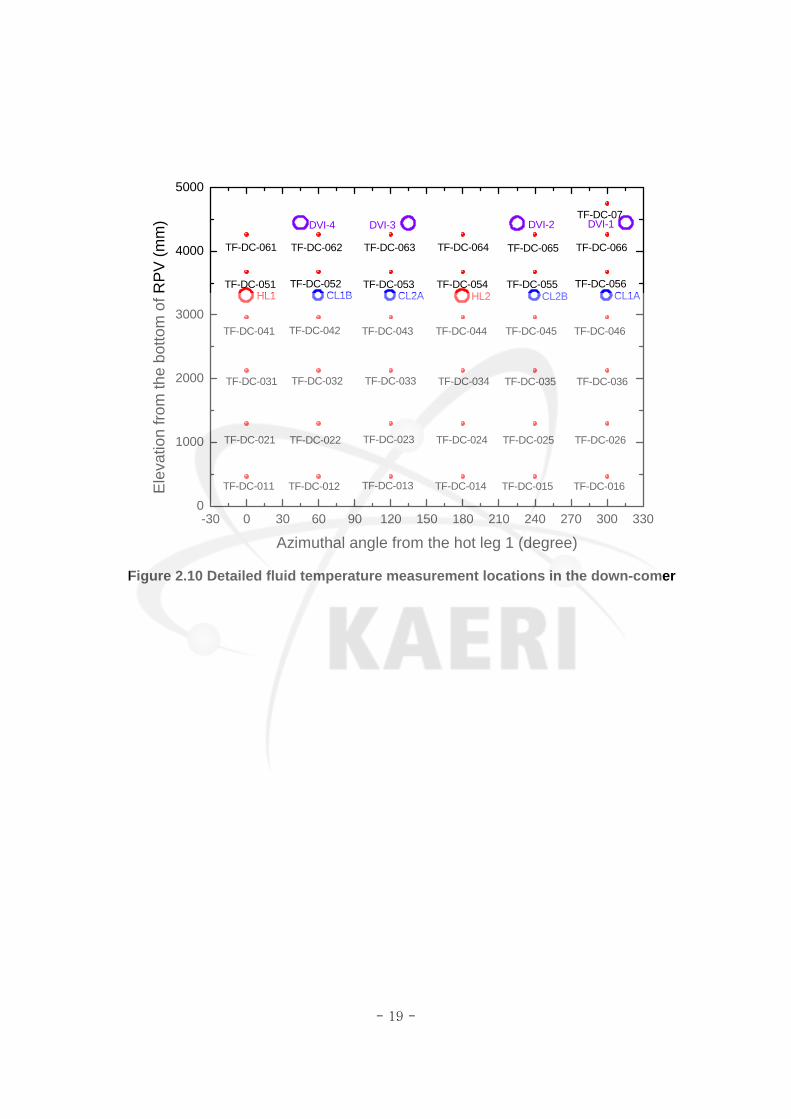
- 19 -
-30 0 30 60 90 120 150 180 210 240 270 300 3300
1000
2000
3000
4000
5000
DVI-1DVI-2DVI-3
CL1ACL2BHL2CL2ACL1B
TF-DC-013TF-DC-012Ele
vatio
n fro
m th
e bo
ttom
of R
PV
(mm
)
Azimuthal angle from the hot leg 1 (degree)
TF-DC-011 TF-DC-016TF-DC-015TF-DC-014
TF-DC-07
TF-DC-063TF-DC-062TF-DC-061 TF-DC-066TF-DC-065TF-DC-064
TF-DC-053TF-DC-052TF-DC-051 TF-DC-056TF-DC-055TF-DC-054
TF-DC-043TF-DC-042TF-DC-041 TF-DC-046TF-DC-045TF-DC-044
TF-DC-023TF-DC-022TF-DC-021 TF-DC-026TF-DC-025TF-DC-024
TF-DC-033TF-DC-032TF-DC-031 TF-DC-036TF-DC-035TF-DC-034
HL1
DVI-4
Figure 2.10 Detailed fluid temperature measurement locations in the down-comer
- 20 -
3.0 EXPERIMENTAL CONDITIONS AND PROCEDURES
In the present experimental test, SB-CL-09, the small break LOCA was assumed
primarily to occur at a cold leg-1A piping located between the outlet of the RCP-1A and the
corresponding reactor pressure vessel (RPV) inlet nozzle. In addition, the single-failure of
a loss of a diesel generator, resulting in the minimum safety injection flow to the reactor
pressure vessel, was assumed to occur in concurrence with the reactor trip. Therefore, the
SI water from the SIP is only injected through the DVI-1 and -3 nozzles and the SI water
from the SIT is injected through all of the DVI nozzles.
3.1 Test Conditions
The present test conditions were determined by a pre-test calculation with a best-
estimate thermal hydraulic code, MARS 3.1. First of all, a transient calculation was
performed for the 6-inch SBLOCA of the APR1400 to obtain the reference initial and
boundary conditions. A best-estimate safety analysis methodology, which is now commonly
accepted in nuclear industries, was applied to the transient calculation of the APR1400. A
single failure assumption for a safety injection system was assumed in the MARS
calculation; four SITs and two of the SIPs were utilized during the test period. The initial
and boundary conditions were obtained by applying the scaling ratios to the MARS
calculation results for the APR1400 [12]. Table 3.1 compares the rated steady-state
condition between the APR1400 and the ATLAS for the SBLOCA test.
A set of characterization tests were performed for reliable simulation of the scaled-down
safety injection flow rates by the SIPs and the SITs. The estimated maximum SIP flow rate
of the APR1400 was at about 65.2 kg/s from the MARS code and thus, according to the
scaling ratio, 0.32 kg/s of ECC water should be delivered to the reactor pressure vessel
through the DVI-1 and -3 nozzles. In the ATLAS, the ECC water was supplied from the
RWT and the temperature of 50 oC was kept the same as that of the APR1400. By the
single-failure assumption, the safety injection by the SIP was not injected to the DVI-2 and
-4 nozzles. On the other hand, the ECC water from the SIT was injected through all the
DVI nozzles. Figure 3.1 shows the injected SIPs flow rate during the SB-CL-09 test and
- 21 -
also compares with those of the MARS analysis results. Figure 3.2 shows the injected SIT
flow rates during the SB-CL-09 test.
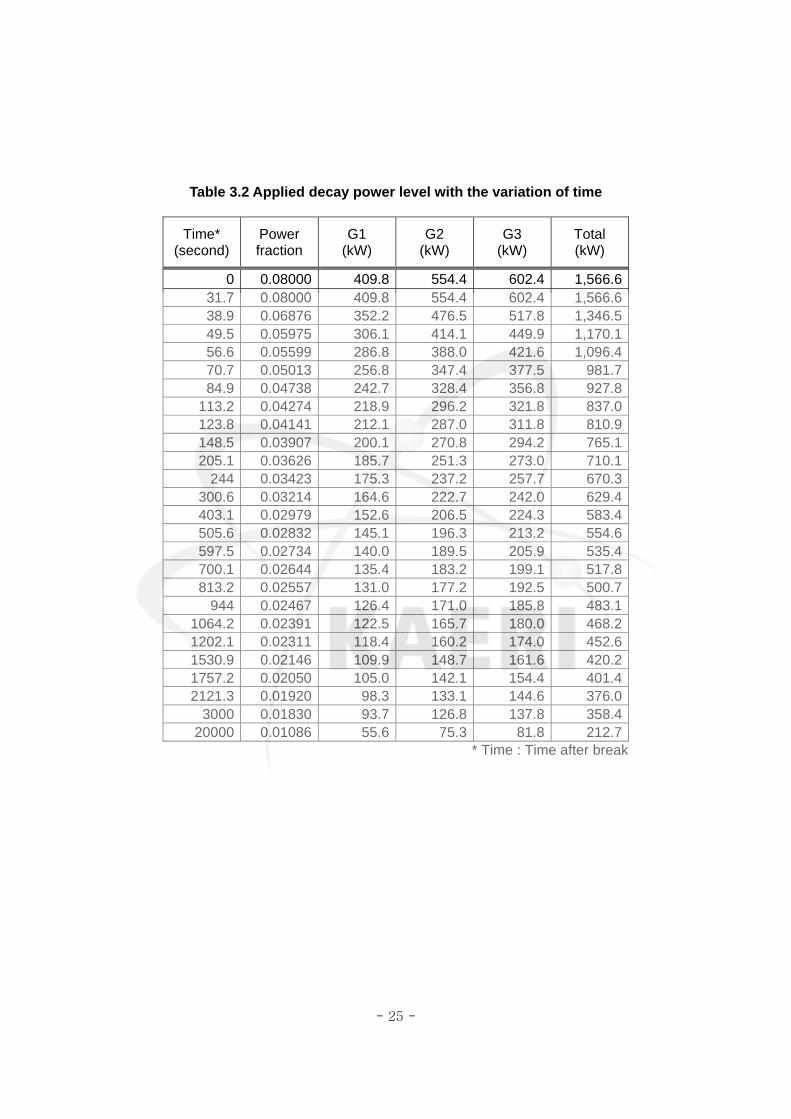
The decay heat was simulated to be 1.2 times of the ANS-73 decay curve for the
conservative condition. The initial heater power was controlled to maintain at 1.633 MW,
which was equal to the sum of the scaled-down core power (1.567 MW) and the heat loss
rate of the primary system (about 66 kW), and then the heater power was controlled to
follow the specified decay curve after 31.7 seconds from the opening of the break valve.
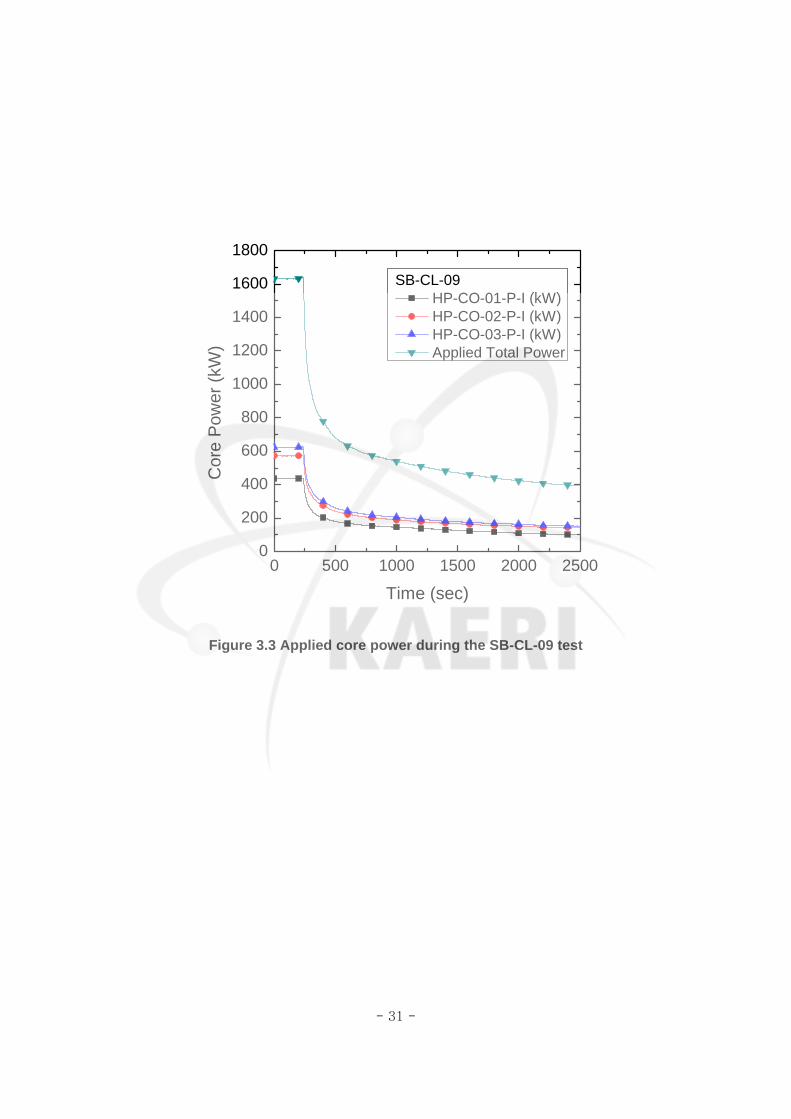
Table 3.2 shows the applied decay power level with the variation of time. In the SB-CL-09
test, the uniform radial power distribution was applied. Figure 3.3 shows the initial power
level and decay power shape during the SB-CL-09 test.
There are four bypass valves connected to the down-comer in the ATLAS. Two bypass
valves of FCV-RV-37 and FCV-RV-38 are between the down-comer and the upper head,
and two bypass valves of FCV-RV-95 and FCV-RV-96 are between the down-comer and
hot legs. The two bypass valves of FCV-RV-37 and FCV-RV-38 should be opened by 74%
and 65%, respectively, to provide the required flow rate of 0.25 kg/s each (0.25% of the
primary flow rate of the rated condition), and the two bypass valves of FCV-RV-95 and
FCV-RV-96 should be opened by 81% and 97%, respectively, to provide the required flow
rate of 0.71 kg/s each (0.7% of the primary flow rate of the rated condition).
The opening degrees of these four bypass flow control valves to simulate the rated
condition were calibrated during the commissioning test performed in 2006 [4]. The
opening degrees for the rated flow condition can be found in Table 3.3 which shows the
actual initial and boundary conditions for the SB-CL-02 [13] and the SB-CL09 tests. For a
comparison with the SB-CL-02, break size of which was the same with the SB-CL-09,
opening degrees of these bypass valves for the SB-CL-02 and SB-CL-09 are presented in
Table 3.3. In the SB-CL-02, all the bypass valves except for FCV-RV-38 were closed; the
bypass flow rates were relatively smaller than those of the SB-CL-09. In the SB-CL-09,
however, the opening degree of the bypass valves was set to the corresponding values as
shown in Table 3.3. The estimated total bypass flow rates at the 100% of the scaled full
flow condition are estimated at 0.42 kg/s and 1.92 kg/s for the SB-CL-02 and -09,
respectively.
Figure 3.4 show the relationship between flow rate and opening degrees of the FCV-RV-
37, -38 and FCV-RV-95, -96. In Table 3.3, the actual initial and boundary conditions of the
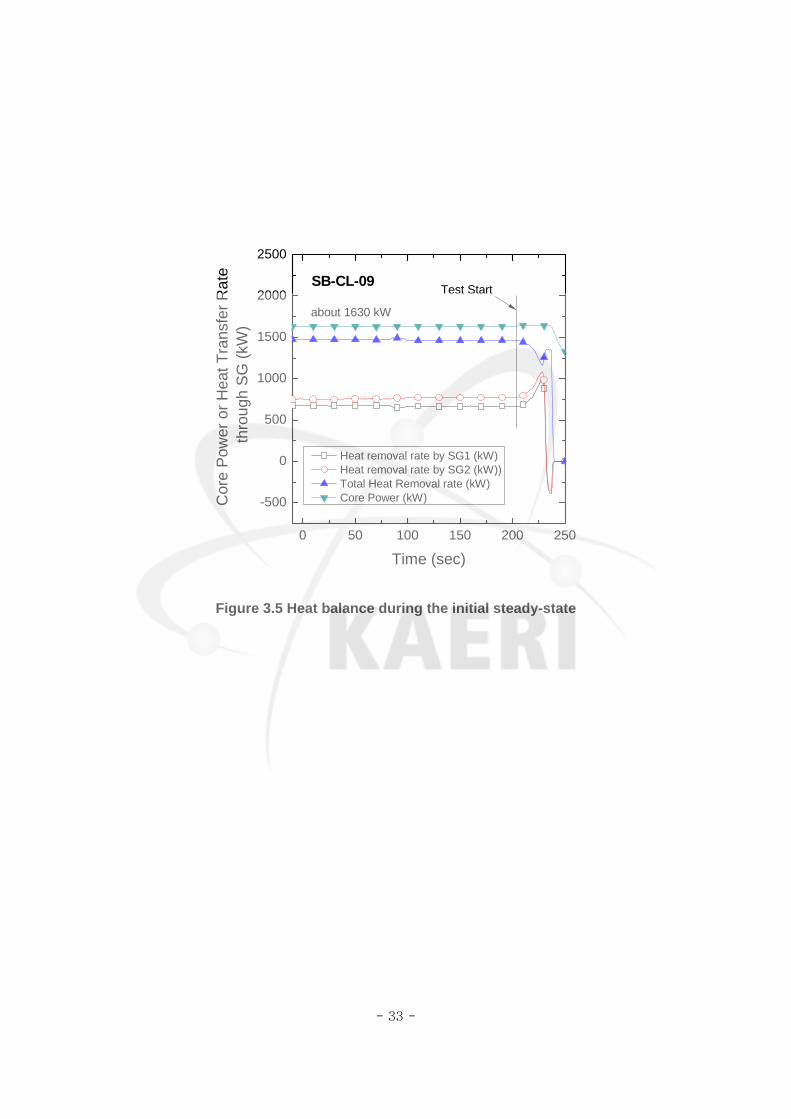
SB-CL-02 and the SB-CL-09 tests could be observed. The initial steady-state heat balance
- 22 -
was confirmed by comparing the applied core power with the heat removal rate through
two SGs calculated by steam flow rates and temperature differences between the feed
water and the main steam. Figure 3.5 shows a heat balance at a steady state condition of
the SB-CL-09.
The heat loss from the primary system to environment cannot completely be prevented
even though thick insulation materials envelop the reactor pressure vessel and the primary
pipelines. The heat loss was estimated by a following simplified empirical correlation [8];
)(32.01, atmwloss TTQ −⋅= (3.1)
where TW is outer wall surface temperature measured at the middle of the reactor pressure
vessel, TW-DC-04A and Tatm is atmospheric temperature measured on the test day.
The heat loss from each steam generator to environment was also estimated according
to the empirical correlation.
8843.1
2, )(00077.0 atmwloss TTQ −⋅= (3.2)
where TW is averaged values of the temperatures measured at the outer wall surface of the
steam generators, TW-SGP1-02A, TW-SGRS1-01A, TW-SGRS1-02A, TW-SGRS1-03A,
TW-SGSD1-01A, TW-SGSD1-02A and Tatm is atmospheric temperature.
3.2 Test Procedures
Prior to a transient test, several operational actions were taken. They include an
instrument calibration with the ATLAS system drained, purging and filling the ATLAS
system including leakage tests, an instrument calibration with the water-filled primary
system, and an implementation of test specific control logics into the process control
computers for sequence control. The sequence control logics execute the required control
actions for the corresponding control devices such as the main core heater, RCP, SIP, and
valves. The detailed descriptions on the test procedures could be found in the literature
[14].
- 23 -
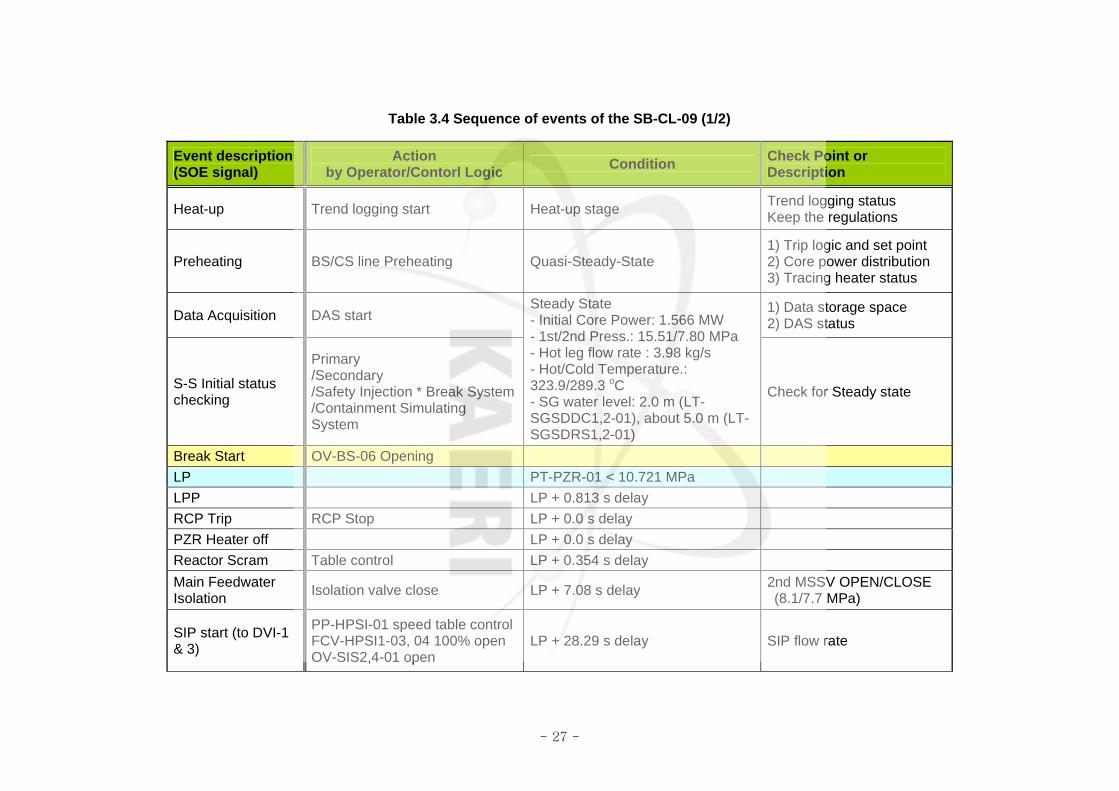
The whole system reaching a specified initial condition for the test as shown in Table 3.1,
the steady-state conditions of the primary and secondary system were maintained for more
than 30 minutes. After this steady-state period, the main test was started by opening the
break simulation valve, OV-BS-06. With the start of the test, a pressure of the primary
system decreased rapidly below 10.7 MPa, which is the set-point of the low-pressurizer
pressure (LPP) signal. When the LPP signal occurs, the RCP and pressurizer heater are
stopped, and the main feed water isolation valves and the SIP are actuated with a
specified delay time. Further decreasing of the primary pressure, below 4.03 MPa, results
in a passive actuation of the SIT injection. Tables 3.4 and 3.5 show the sequence of event
table and the actual progress of the events observed in the SB-CL-09.

- 24 -
Table 3.1 Calculated initial conditions for the SB-CL-09
Design parameters APR1400 (P) (Steady State)
ATLAS (M) (Steady State)
Ratio (P/M)
Reactor vessel Normal power, MWt 3983.00 1.56 2,553.21 Pressurizer pressure, MPa 15.50 15.50 1.00 Core exit temp, oC 324.20 324.20 1.00 Core inlet temp, oC 291.30 290.70 1.00 Temp. rise, oC 32.90 33.50 0.98 Core flow, kg/s 20275.00 7.99 2,537.55 Steam generator Steam flow rate, kg/s (SG-1) 1152.40 0.44 2,619.09 Steam flow rate, kg/s (SG-2) 1152.40 0.44 2,619.09 Saturated steam pressure, MPa 6.90 7.83 0.88 Steam temp., oC 284.90 293.50 0.97 Primary piping Hot leg flow, kg/s 10496.00 3.99 2,630.58 Cold leg flow, kg/s 5540.10 1.99 2,783.97 Hot leg temp., oC 323.30 323.80 1.00 Cold leg temp., oC 291.30 289.60 1.01 Heat transfer rate (W) 2044.80 0.77 2,655.58
- 25 -
Table 3.2 Applied decay power level with the variation of time
Time* (second)
Power fraction
G1 (kW)
G2 (kW)
G3 (kW)
Total (kW)
0 0.08000 409.8 554.4 602.4 1,566.6 31.7 0.08000 409.8 554.4 602.4 1,566.6 38.9 0.06876 352.2 476.5 517.8 1,346.5 49.5 0.05975 306.1 414.1 449.9 1,170.1 56.6 0.05599 286.8 388.0 421.6 1,096.4 70.7 0.05013 256.8 347.4 377.5 981.7 84.9 0.04738 242.7 328.4 356.8 927.8
113.2 0.04274 218.9 296.2 321.8 837.0 123.8 0.04141 212.1 287.0 311.8 810.9 148.5 0.03907 200.1 270.8 294.2 765.1 205.1 0.03626 185.7 251.3 273.0 710.1
244 0.03423 175.3 237.2 257.7 670.3 300.6 0.03214 164.6 222.7 242.0 629.4 403.1 0.02979 152.6 206.5 224.3 583.4 505.6 0.02832 145.1 196.3 213.2 554.6 597.5 0.02734 140.0 189.5 205.9 535.4 700.1 0.02644 135.4 183.2 199.1 517.8 813.2 0.02557 131.0 177.2 192.5 500.7
944 0.02467 126.4 171.0 185.8 483.1 1064.2 0.02391 122.5 165.7 180.0 468.2 1202.1 0.02311 118.4 160.2 174.0 452.6 1530.9 0.02146 109.9 148.7 161.6 420.2 1757.2 0.02050 105.0 142.1 154.4 401.4 2121.3 0.01920 98.3 133.1 144.6 376.0
3000 0.01830 93.7 126.8 137.8 358.4 20000 0.01086 55.6 75.3 81.8 212.7
* Time : Time after break

- 26 -
Table 3.3 Actual initial and boundary condition of the SB-CL-02 and SB-CL-09
SB-CL-02 SB-CL-09
Prim ary system
- Core pow er (M W ) 1.637 1.633 -including
heat loss
- H eat loss (kW ) 70.0/57.0 66.0/57.0 Prim ary/Secondary estim ation
- PZR Pressure (M Pa) 15.5 15.5 PT-PZR-01 pressurizer
- Core inlet tem p. (K) 562.9 563.2 TF-LP-02G 18
- Core exit tem p.( K) 598.5 598.8 TF-CO -07-G 14, G 18, G 21, G 25 averaged
596.9 597.7 TF-H L1-03A hot leg 1
597.7 598.7 TF-H L2-03A hot leg 2
565.2 565.4 TF-CL1A -04A cold leg 1A
565.0 565.5 TF-CL1B-04A cold leg 1B
564.0 564.2 TF-CL2A -04A cold leg 2A
564.9 565.3 TF-CL2B-04A cold leg 2B
2.2 + /- 5 % 2.2 + /- 5 % Q V-CL1A -01B cold leg 1A
2.2 + /- 5 % 2.2 + /- 5 % Q V-CL1B-01B cold leg 1B
2.2 + /- 5 % 2.2 + /- 5 % Q V-CL2A -01B cold leg 2A
2.2 + /- 5 % 2.2 + /- 5 % Q V-CL2B-01B cold leg 2B
~ 0.0 ~ 0.0 D ow n-com er to upper head
~ 0.0 ~ 0.0 D ow n-com er to hot leg
- Pressurizer level (m ) 2.26 3.83 LT-PZR-01
Secondary system (SG 1/SG 2)
- Pressure (M Pa) 7.73/7.73 7.82/7.82 PT-SG SD 1-01/PT-SG SD 2-01
565.7/565.1 566.9/566.7 steam pipe line
567.8/568.1 568.5/568.8 steam dom e
509.5/511.1 505.4/506.4
508.2/505.0 496.5/495.7
0.262/0.334 0.373/0.382
0.016/0.002 0.044/0.042
- W ater level (m ) 2.6/2.4 1.95/2.0LT-SG SD D C1-01
/LT-SG SD D C2-01
- H eat rem oval(M W ) 0.673/0.752 0.673/0.752 - approxim ation
- H eat loss(kW ) 28.5/28.5 28.5/28.5 estim ation
ECCS
- SIT pressure (M Pa)4.27/4.28
/4.24/4.28
4.24/4.15
/4.01/4.17PT-SIT1,2,3,4-02 @ 649 s (SB-CL-09)
- SIT tem p. (K) 320.6~ 323.7322.5/323.2
323.2/325.4TF-SIT1,2,3,4-03
- SIT level (% )95.1/95.1
/94.8/94.7
95.1/94.9
/94.2/94.5
LT-SIT1,2,3,4-01
(5.32/5.33/5.28/5.29)Tag nam e/m eter
- RW T tem p. (K) 325.7 323.2 TF-RW T-01 storage tank
Containm ent
- Pressure (M Pa) 0.1013 0.1013 atm ospheric condition open
R PV Bypass V alve
O pening D egree (O D )
- O D of FCV-RV-37 (% ) 0 79.3 FCV-RV-37 74%
- O D of FCV-RV-38 (% ) 95.2 57.5 FCV-RV-38 65%
- O D of FCV-RV-95 (% ) 0 91.3 FCV-RV-95 81%
- O D of FCV-RV-96 (% ) 0 98.5 FCV-RV-96 97%
M easured value
- Steam tem p. (K)TF-M S1-01/TF-M S2-01
TF-SG SD 1-03/TF-SG SD 2-03
- FW tem p. (K)TF-M F1-03/TF-M F2-03
TF-M F1-04/TF-M F2-04
econom izer
dow n-com er
- H ot leg tem p. (K)
- FW flow rate (kg/s)Q V-M F1-01/Q V-M F2-01
Q V-M F1-02/Q V-M F2-02
econom izer
dow n-com er
- RCS flow rate (kg/s)
- Core bypass flow rate
(kg/s)
Param eter Instrum ents Rem arks
- Cold leg tem p. (K)
estim ated value
- 27 -
Table 3.4 Sequence of events of the SB-CL-09 (1/2)
Event description (SOE signal)
Action by Operator/Contorl Logic Condition Check Point or
Description
Heat-up Trend logging start Heat-up stage Trend logging status Keep the regulations
Preheating BS/CS line Preheating Quasi-Steady-State 1) Trip logic and set point 2) Core power distribution 3) Tracing heater status
Data Acquisition DAS start 1) Data storage space 2) DAS status
S-S Initial status checking
Primary /Secondary /Safety Injection * Break System/Containment Simulating System
Steady State - Initial Core Power: 1.566 MW - 1st/2nd Press.: 15.51/7.80 MPa - Hot leg flow rate : 3.98 kg/s - Hot/Cold Temperature.: 323.9/289.3 oC - SG water level: 2.0 m (LT-SGSDDC1,2-01), about 5.0 m (LT-SGSDRS1,2-01)
Check for Steady state
Break Start OV-BS-06 Opening LP PT-PZR-01 < 10.721 MPa LPP LP + 0.813 s delay RCP Trip RCP Stop LP + 0.0 s delay PZR Heater off LP + 0.0 s delay Reactor Scram Table control LP + 0.354 s delay Main Feedwater Isolation Isolation valve close LP + 7.08 s delay 2nd MSSV OPEN/CLOSE
(8.1/7.7 MPa)
SIP start (to DVI-1 & 3)
PP-HPSI-01 speed table controlFCV-HPSI1-03, 04 100% open OV-SIS2,4-01 open
LP + 28.29 s delay SIP flow rate

- 28 -
Table 3.4 Sequence of events of the SB-CL-09 (2/2)
Event description (SOE signal)
Action by Operator/Contorl Logic Condition Check Point or
Description
Low Upper Down-comer Pressure (LUDP)
PT-DC_01 < 4.0315 MPa
SIT begin (to DVI-1~4) FCV-SIT1,2,3,4-01 100% openOV-SIS1,3-01 open LUDP + 0.0 s delay SIT flow rate
SIT low flow conversion
FCV-SIT1,2,3,4-01 : 18, 13, 24, 13% open
LT-SIT-1,2,3,4-01 < 72.8, 72.6, 72.0, 72.1%
LT-SIT-1,2,3,4-01 < 4.077, 4.066, 4.033, 4.039m
SIT Stop FCV-SIT1,2,3,4-01 : close
LT-SIT-1,2,3,4-01 < 47.4, 47.2, 46.6, 46.7%
LT-SIT-1,2,3,4-01 < 2.654, 2.643, 2.611, 2.66m
Core shutdown Core Power Off DAS End Data backup System Cool-down Keep the regulation

- 29 -
Table 3.5 Sequence of events of the SB-CL-02 and SB-CL-09
SB-CL-02 SB-CL-09
Test Start 202 204
LP 223 228Reactor Coastdown 233 236
2nd Isolation 230 238
SIP 253 257
LSC (Time) 364~376 382
LSC (Locations) 1A,2A,2B 1A, 2B
SIT 655 649

- 30 -
0 500 1000 1500 2000 2500
0.00
0.05
0.10
0.15
0.20
0.25
0.30
0.35
Flow
Rat
e (k
g/s)
Time (sec)
Experiment (SB-CL-09) SIP-1(QV-HPSI1-01-I (kg/sec)) SIP-3(QV-HPSI3-01-I (kg/sec))
Post-calculation by MARS mflowj (560000000) mflowj (561000000) mflowj (562000000) mflowj (563000000)
Figure 3.1 Injected SIPs flow rate of the SB-CL-09 compared with MARS Post-
calculation results
0 500 1000 1500 2000 2500-0.05
0.00
0.05
0.10
0.15
0.20
0.25
0.30
Flow
Rat
e (k
g/s)
Time (sec)
SB-CL-09 QV-SIT1-01-I (kg/sec) QV-SIT2-01-I (kg/sec) QV-SIT3-01-I (kg/sec) QV-SIT4-01-I (kg/sec)
Figure 3.2 Injected SITs flow rates during the SB-CL-09 test
- 31 -
0 500 1000 1500 2000 25000
200
400
600
800
1000
1200
1400
1600
1800
C
ore
Pow
er (k
W)
Time (sec)
SB-CL-09 HP-CO-01-P-I (kW) HP-CO-02-P-I (kW) HP-CO-03-P-I (kW) Applied Total Power
Figure 3.3 Applied core power during the SB-CL-09 test

- 32 -
0 20 40 60 80 100-0.050.000.050.100.150.200.250.300.350.400.45
Flow
Rat
e (k
g/s)
% of Stroke
FCV-RV-37 FCV-RV-38
(a) DC-upper head bypass valve (FCV-RV-37 and -38)
0 20 40 60 80 100
0.0
0.1
0.2
0.3
0.4
0.5
0.6
0.7
0.8
Flow
Rat
e (k
g/s)
% of Stroke
FCV-RV-95 FCV-RV-96
(b) DC-hot leg bypass valve (FCV-RV-96 and -96)
Figure 3.4 Flow characteristic curves of RPV bypass valves
- 33 -
0 50 100 150 200 250
-500
0
500
1000
1500
2000
2500
C
ore
Pow
er o
r Hea
t Tra
nsfe
r Rat
e th
roug
h SG
(kW
)
Time (sec)
Heat removal rate by SG1 (kW) Heat removal rate by SG2 (kW)) Total Heat Removal rate (kW) Core Power (kW)
SB-CL-09
about 1630 kW
Test Start
Figure 3.5 Heat balance during the initial steady-state
- 34 -
4.0 DISCUSSIONS ON THE EXPERIMENTAL RESULTS
Compared with the large break LOCA, the phases of the small break LOCA prior to core
recovery occur over a long period. In order to identify various phenomena, the small break
LOCA could be divided into five phases such as blowdown, natural circulation, loop seal
clearance, boil-off, and core recovery [15]. The duration of each phase depends on the
break size and the performance of the ECCS. In the case of the SB-CL-09 test, the
characteristic five phases were identified, and they were compared with the characteristic
parameters such as the primary pressure (PT-PZR-01), the secondary pressure (PT-
SGSD1-01), and the collapsed water level of the down-comer (LT-RPV-04A) as shown in
Fig. 4.1.
4.1 Blowdown Phase
In this experiment, the blowdown phase was started by opening the break valve, OV-BS-
06. Upon initiation of the break at the bottom of the cold leg, the RCS primary side rapidly
depressurized until the hot coolant began to flash into steam. The reactor and the RCP
trips were initiated by the low pressurizer pressure (LPP) set-point of 10.72 MPa. The SG
secondary side was isolated by the LPP (low pressurizer pressure) signal with a delay of
7.08 s. As a result, the SG secondary side pressure increased up to the main steam safety
valve (MSSV) set-point of 8.1 MPa, and steam was released through the MSSV. The set-
points for the opening and the closing of the MSSV bank-1 were 8.1 and 7.7 MPa,
respectively. The ECCS actuation signal was also generated at the LPP signal with a time
delay. The coolant in the RCS remained in the liquid phase throughout the most blowdown
period, although, toward the end of the period, steam began to form in the upper head,
upper plenum, and hot legs. The rapid depressurization ended when the pressure fell to
just above the saturation pressure of the SG secondary side. Generally, the break flow
during the blowdown period is a single-phase liquid [15].
4.2 Two-phase Natural Circulation Phase
When the blowdown phase ended, a two-phase natural circulation phase was
- 35 -
established in the RCS loops with the decay heat removed by the heat transfer
(condensation and convection) to the SG secondary side. In this phase, the auxiliary feed
water (AFW) might be initiated to maintain the secondary side inventory [16]. In the
present test, however, the AFW was not injected during the whole period of the test due to
the fact that the collapsed water level in the secondary side of the SGs did not reach the
set-level for the AFAS (Auxiliary Feed water Actuation Signal). As more coolant was lost
from the RCS through the break, steam was accumulated in the downhill side of the SG
tubes as well as the crossover leg.
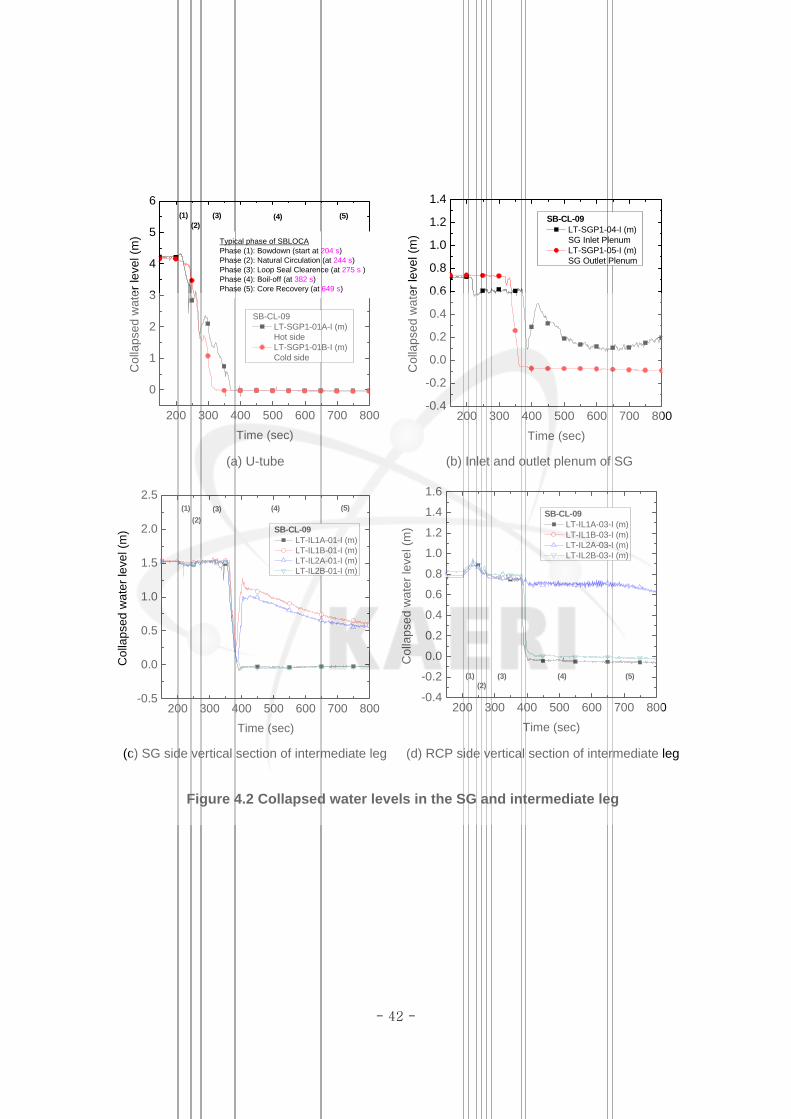
The natural circulation phase might continue until there was insufficient driving head on
the cold leg side of the loops, due to the accumulation of steam in loops between the top
of the steam generator tubes and the loop seals. Steam generated at the top of the U-
tubes due to the flashing with the RCS inventory loss from the break point might be
accumulated especially in the cold-side of the U-tubes. This accumulated steam affected
the natural circulation flow through the U-tube section. Figures 4.2 (a), (b), (c), and (d)
show the collapsed water levels in the U-tube, the inlet and the outlet plenums, and the
two vertical sections of the intermediate legs of the SG-01 during the transient period,
respectively. In the SB-CL-09 test, the natural circulation period (phase-2) was assumed to
continue from the end of the blowdown phase of 244 seconds to the 275 seconds as
indicated in the Fig. 4.2 (a). For the present test, the natural circulation phase was
assumed to end at the time when deviation of the collapsed water levels of the SG U-tube
between the hot and the cold sides started to increase. The collapsed water levels of the
cold-side of SG U-tube were depleted faster than those of the hot-side as shown in Fig.
4.2 (b).
4.3 Loop Seal Clearance Phase
The observed third phase was the loop seal clearance period. As mentioned in the
previous section, the break flow might be remained with a single phase water until the loop
seals were covered with water. The RCS water inventory decreased continuously and
steam volume in the RCS increased.
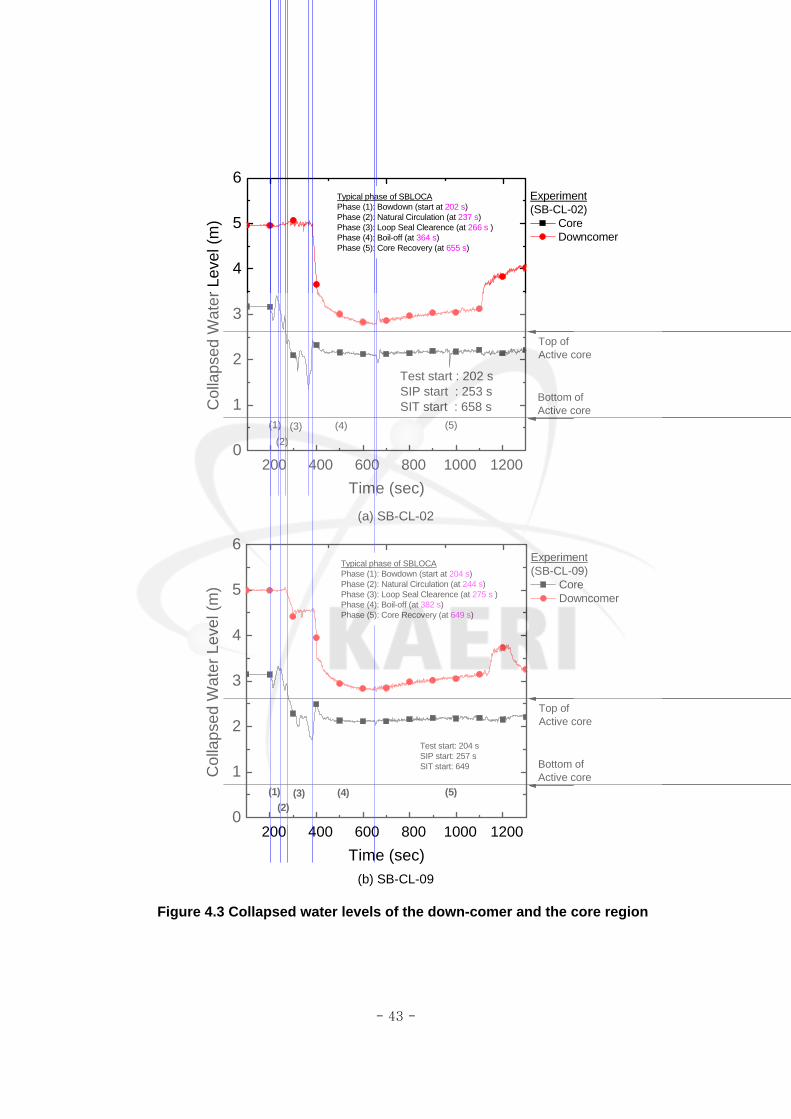
In spite of the loss of the RCS inventory through the break, the pressure in the core
increased due to the generation of steam in the core section, causing continuous decrease
in the liquid levels of the core and the cold-side of the U-tubes. Behavior of the collapsed
- 36 -
water levels of the down-comer and the core region could be observed in Fig. 4.3, which
showed that the core water level dropped below the top of the active core. For a reference,
the collapsed water levels of the down-comer and the core, the cladding temperatures, the
differential pressure between the down-comer and the upper head regions were compared
with those of the SB-CL-02 in Figs. 4.3, 4.4, and 4.5, respectively. As the collapsed water
level in the core decreased, the cladding temperatures in the upper part of the core began
to rise as shown in Fig. 4.4(a) in the case of the SB-CL-02 test. However, in the case of
the SB-CL-09 test, there was no excursion of the cladding temperatures. The collapsed
water level in the core reached a minimum value at the instant of the loop seal clearing
and, it experienced a sudden increase after the loop seal clearing. On the other hand, the
collapsed water level in the down-comer region showed a rapid decrease when the loop
seal clearing occurred.
A differential pressure between the down-comer and the upper head region (DP-
DCUH1-01) reached a maximum value at the instant of the loop seal clearing as presented
in Fig. 4.5. The maximum differential pressure between these two regions was observed
up to 31.4 kPa and 24.2 kPa for the SB-CL-02 and -09, respectively. The SB-CL-02
showed a larger differential pressure than that of the SB-CL-09 due to the higher upper
head pressure in the case of the SB-CL-02. It was because the SB-CL-02 had a relatively
low core bypass flow than that of the SB-CL-09. When the liquid level of the downhill side
of the SG was depressed to the elevation of the loop seals, the loop seals were cleared
and the steam in the RCS was vented to the cold legs. Hence, the break flow changed
from a low quality mixture condition to a high quality steam condition with a high volumetric
flow rate which caused the re-depressurization of the RCS. The depressed pressure in the
core and the core liquid level were restored by incoming flow from the down-comer region
as indicated in Fig. 4.3. After the core water level was restored, the down-comer water
level started to decrease to the cold leg level.
4.4 Boil-off Phase
After the loop seals clearance phase, the RCS primary side pressure started to decrease
below that of the secondary side, as can be seen in Fig. 4.1. It was mainly due to the
increase of the break flow quality, resulting in a lower mass flow rate but a higher
volumetric flow through the break. The collapsed water (or mixture) levels of the down-
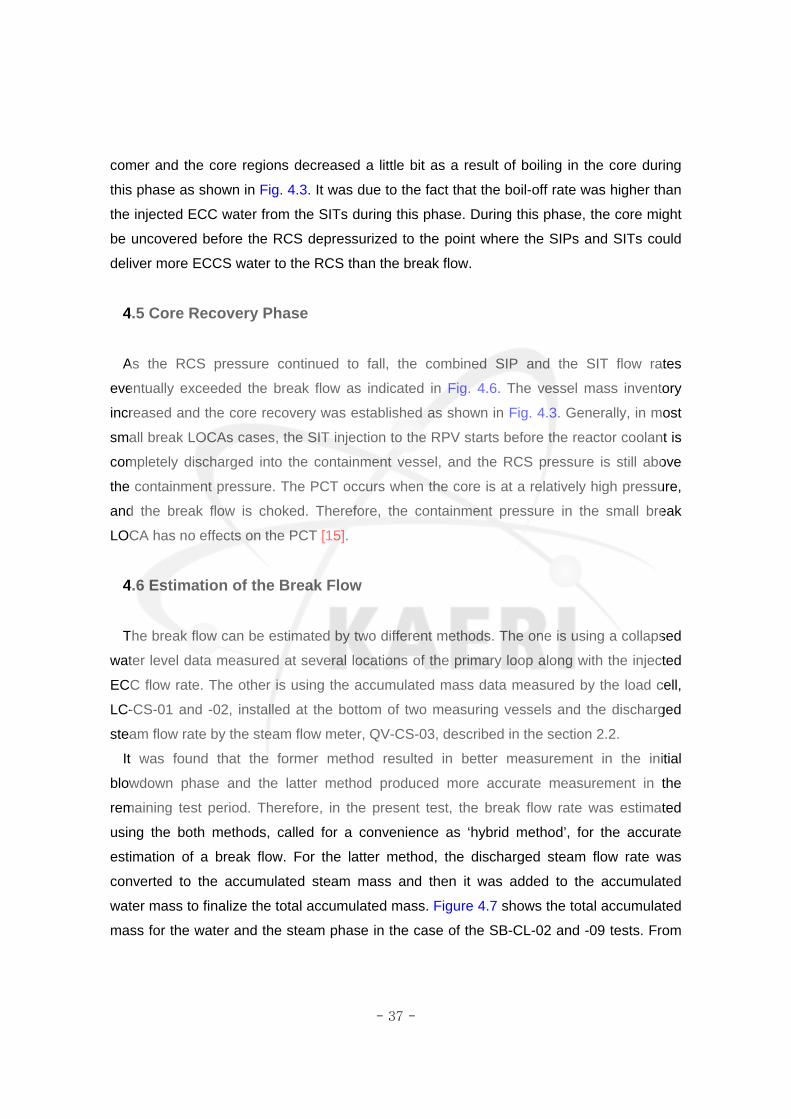
- 37 -
comer and the core regions decreased a little bit as a result of boiling in the core during
this phase as shown in Fig. 4.3. It was due to the fact that the boil-off rate was higher than
the injected ECC water from the SITs during this phase. During this phase, the core might
be uncovered before the RCS depressurized to the point where the SIPs and SITs could
deliver more ECCS water to the RCS than the break flow.
4.5 Core Recovery Phase
As the RCS pressure continued to fall, the combined SIP and the SIT flow rates
eventually exceeded the break flow as indicated in Fig. 4.6. The vessel mass inventory
increased and the core recovery was established as shown in Fig. 4.3. Generally, in most
small break LOCAs cases, the SIT injection to the RPV starts before the reactor coolant is
completely discharged into the containment vessel, and the RCS pressure is still above
the containment pressure. The PCT occurs when the core is at a relatively high pressure,
and the break flow is choked. Therefore, the containment pressure in the small break
LOCA has no effects on the PCT [15].
4.6 Estimation of the Break Flow
The break flow can be estimated by two different methods. The one is using a collapsed
water level data measured at several locations of the primary loop along with the injected
ECC flow rate. The other is using the accumulated mass data measured by the load cell,
LC-CS-01 and -02, installed at the bottom of two measuring vessels and the discharged
steam flow rate by the steam flow meter, QV-CS-03, described in the section 2.2.
It was found that the former method resulted in better measurement in the initial
blowdown phase and the latter method produced more accurate measurement in the
remaining test period. Therefore, in the present test, the break flow rate was estimated
using the both methods, called for a convenience as ‘hybrid method’, for the accurate
estimation of a break flow. For the latter method, the discharged steam flow rate was
converted to the accumulated steam mass and then it was added to the accumulated
water mass to finalize the total accumulated mass. Figure 4.7 shows the total accumulated
mass for the water and the steam phase in the case of the SB-CL-02 and -09 tests. From

- 38 -
this total accumulated mass data, the break flow rate can be calculated by the
differentiation of the accumulated mass. Figure 4.6 shows the estimated break flow
calculated using the accumulated mass data measured by the load cell and Fig. 4.8 shows
the estimated break flow calculated using the hybrid method.
4.7 Effect of the Core Bypass Flow Rate
As mentioned in section 3.1, four control valves were installed to simulate the
downcomer-to-upper head bypass and the downcomer-to-hot leg bypass flow. The bypass
flow fractions of the downcomer-to-upper head and the downcomer-to-hot leg are 0.5%
and 1.4% of the rated primary flow, respectively. As the rated primary flow rate was up to
97 kg/s in a separate performance test, each bypass flow rates of the downcomer-to-upper
head and the downcomer-to-hot leg was 0.49 kg/s and 1.36 kg/s, respectively. The
opening degrees of these four bypass valves for the SB-CL-09 test were presented and
were compared with those of the SB-CL-02 test in Table 3.3. It can be found that the
bypass flow rates of the SB-CL-02 were relatively smaller than those of the SB-CL-09 test.
With an opening of the break simulation valve (OV-CL-06), the depressurization of the
cold leg resulted in an increase of the differential pressure between the down-comer side
and the core side. This difference in the pressure between these two regions was a driving
force for the loop seal clearing phenomena. However, the core bypass had an effect of
reducing this differential pressure by leakage of the water and/or steam from the core side
to the down-comer side through the bypass passage as can be observed in Fig. 4.5. This
differential pressure was responsible for the collapsed water level in the core and the
break flow rate. In the case of the SB-CL-02, which was performed at a relatively small
bypass condition, the differential pressure, the collapsed water level depression, and the
initial maximum break flow were larger than those of the SB-CL-09 test as can be
compared in Figs. 4.3, 4.5, and 4.6. Consequently, the larger differential pressure induced
a faster loop seal clearing as indicated in Fig. 4.1.
The previous experiments [2, 17] showed that the smaller the bypass rate was, the
greater the core liquid level depression was. It implies that the smaller core bypass case
results in a more severe core liquid level depression than for the larger core bypass case.
The core bypass effect could be observed in the test results of the LSTF. Figure 4.9 shows
the measured core collapsed liquid level in the SC5 and SC7 experiments of the LSTF.

- 39 -
The more severe core liquid level depression was observed in the case of the SC5
performed with a 2.3 % bypass than that of the SC7 with a 9.2 % bypass fraction.
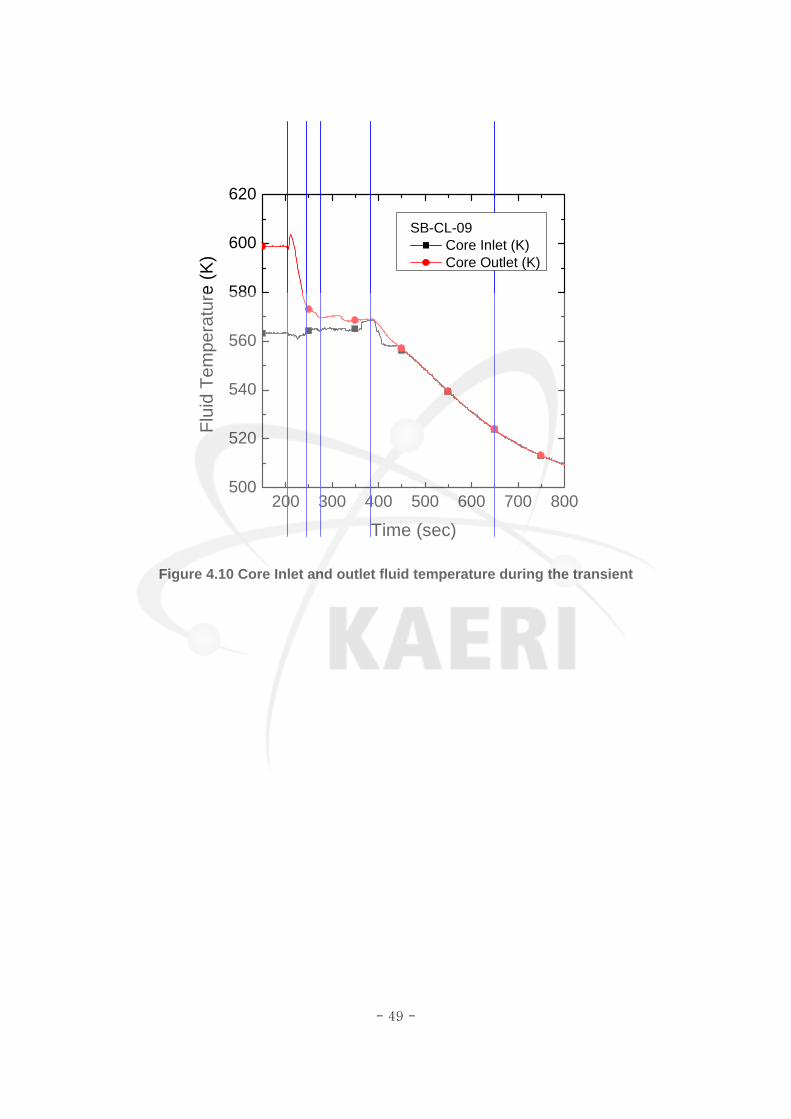
4.8 Fluid temperatures in the RPV
In this section, measured fluid and wall temperatures in the PRV are investigated. Figure
4.10 shows the behavior of the core inlet and the outlet fluid temperature. The core inlet
temperature was measured by TF-LP-02G18 located 278 mm below the bottom of the
active core region, and the core outlet temperature was calculated by the average of the
four temperatures, TF-CO-07-G14, TF-CO-07-G18, TF-CO-07-G21, and TF-CO-07-G25
located 222 mm above the top of the active core region. On the break, the core exit
temperature suddenly increased up to 603.6 K and then decreased as shown in Fig. 4.10.
The core inlet temperature, maintained almost the constant value until the loop seal
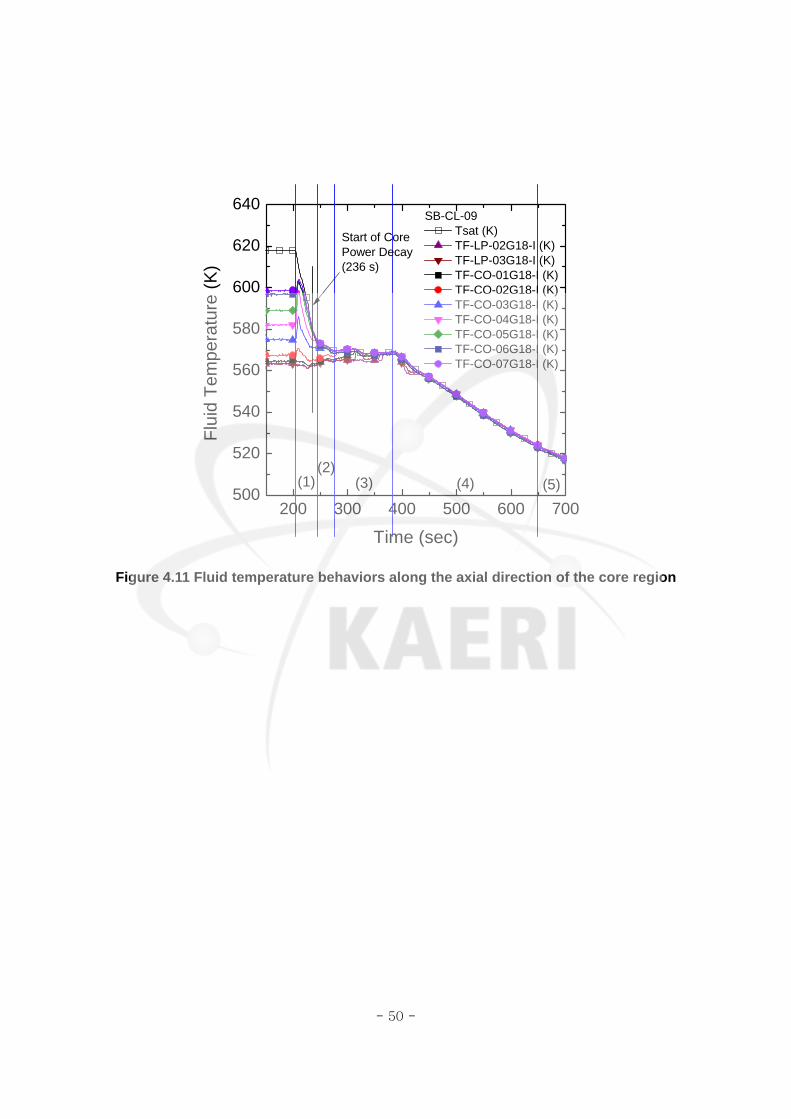
clearing. More detailed fluid temperature behavior along the axial direction of the core was
shown in Fig. 4.11. During the blowdown phase, the fluid temperature in the core showed
a large fluctuation caused by the redistribution of the fluid inventory and the core power
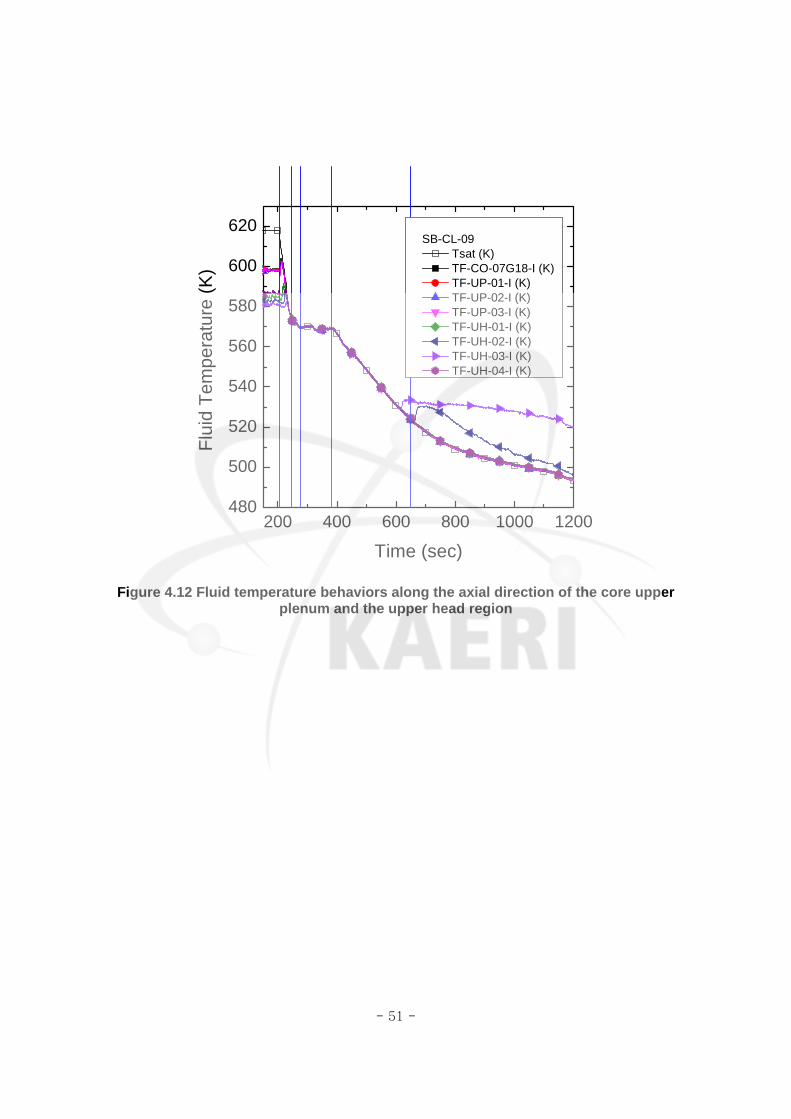
which started the decay at 236 s. The fluid temperature in the upper plenum and the upper
head regions are shown in Fig. 4.12. When the transient started, the fluid temperatures in
these regions showed the similar fluctuating trend to those in the core region and showed
nearly the same or a little lower temperatures than the saturation temperature except for
the TF-UH-02 and -03 which showed abrupt increase around the start of the SIT injection.
The reason for this abrupt temperature increase needs to be further investigated.
Figure 4.13 shows the fluid temperature behavior in the down-comer region at the
azimuthal angle of 60o, 120o, 240o, and 300o which is corresponding to the CL-1B, CL-2A,
CL-2B, and CL-1A, respectively. The DVI-1, -2, -3, and -4 nozzles were installed at the
azimuthal angle of 315o, 225o, 135o, and 45o, respectively. The DVI nozzles were installed
at 1051 mm above from the center of the cold-leg. On the start of the SIP injection at 257 s,
large fluctuation in fluid temperature was observed at the TF-DC-05i-I and TF-DC-06i-I as
shown in Fig. 4.13. The vertical locations of the TF-DC-05i-I and TF-DC-06i-I are 295 mm
and 885 mm higher than the center line of the cold-leg. This temperature fluctuation
indicates the flow redistribution during the loop seal clearance phase, and it ended with the
loop seal clearing. However, as indicated in Fig. 4.13, at the azimuthal angle 300o and
120o near the DVI-1 and -03 nozzles, which were active SIP injection nozzles, the fluid
- 40 -
temperature showed a larger fluctuation than that at the azimuthal angle for the DVI-2 and
4 nozzles, which were non-active SIP injection nozzles.
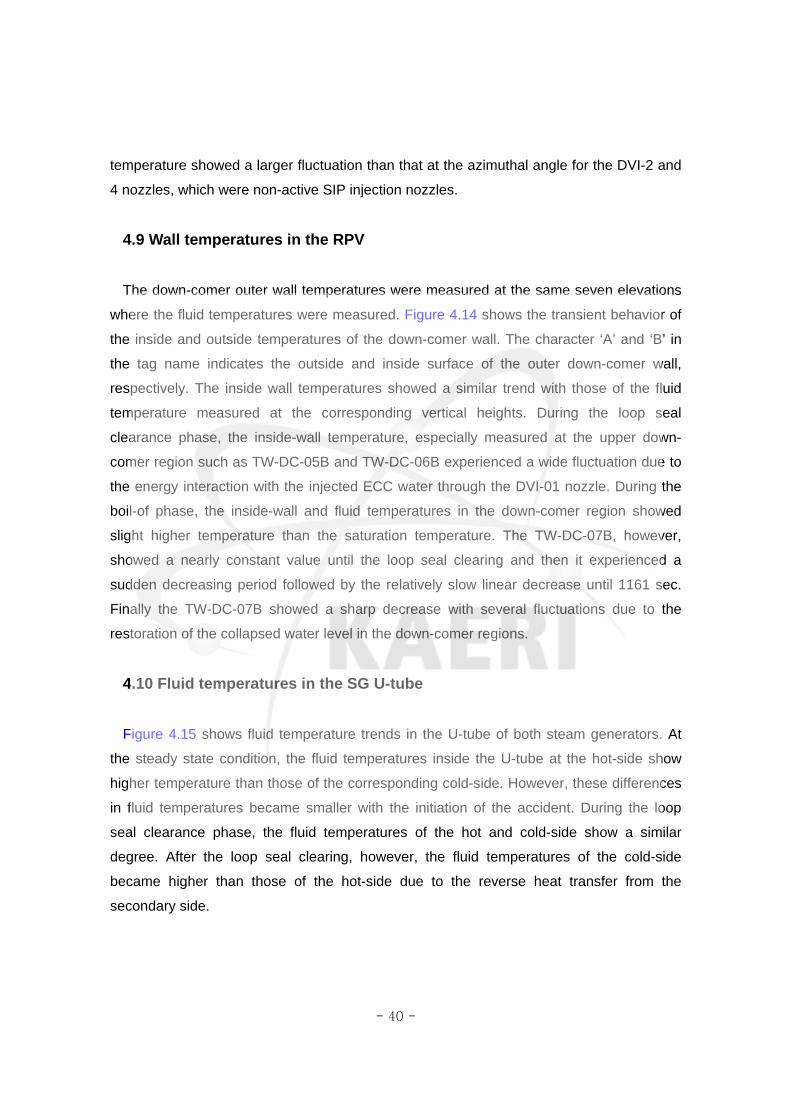
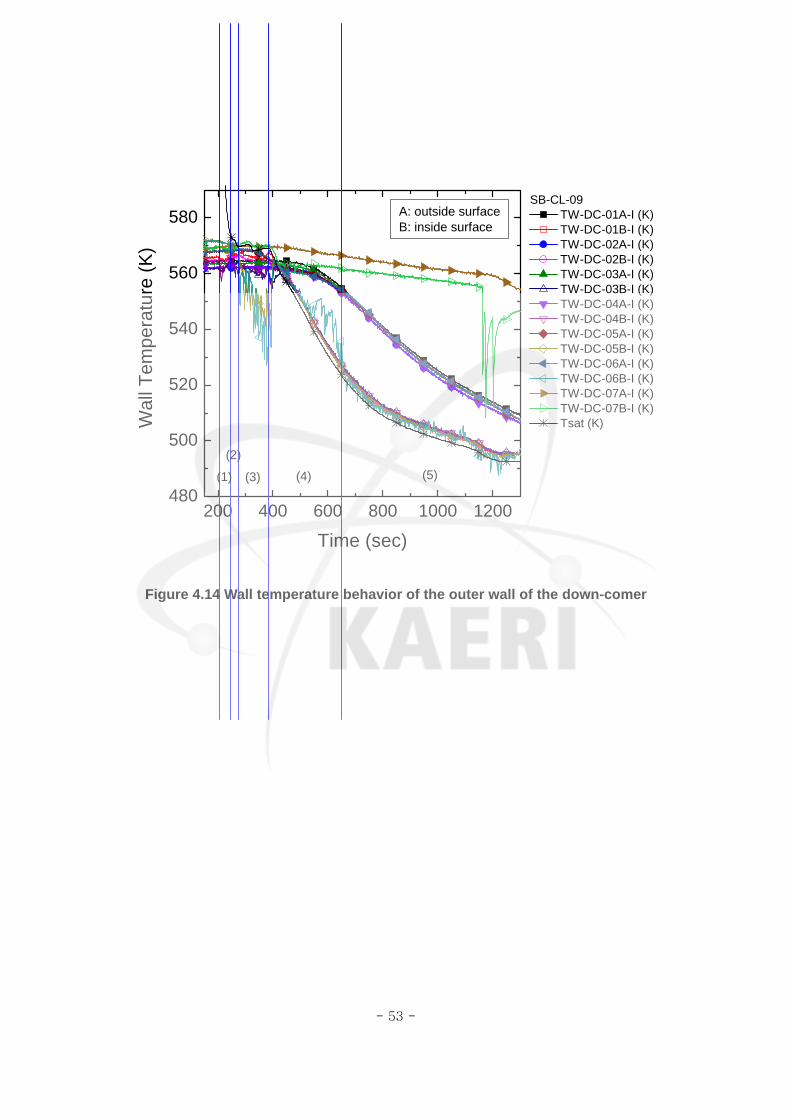
4.9 Wall temperatures in the RPV
The down-comer outer wall temperatures were measured at the same seven elevations
where the fluid temperatures were measured. Figure 4.14 shows the transient behavior of
the inside and outside temperatures of the down-comer wall. The character ‘A’ and ‘B’ in
the tag name indicates the outside and inside surface of the outer down-comer wall,
respectively. The inside wall temperatures showed a similar trend with those of the fluid
temperature measured at the corresponding vertical heights. During the loop seal
clearance phase, the inside-wall temperature, especially measured at the upper down-
comer region such as TW-DC-05B and TW-DC-06B experienced a wide fluctuation due to
the energy interaction with the injected ECC water through the DVI-01 nozzle. During the
boil-of phase, the inside-wall and fluid temperatures in the down-comer region showed
slight higher temperature than the saturation temperature. The TW-DC-07B, however,
showed a nearly constant value until the loop seal clearing and then it experienced a
sudden decreasing period followed by the relatively slow linear decrease until 1161 sec.
Finally the TW-DC-07B showed a sharp decrease with several fluctuations due to the
restoration of the collapsed water level in the down-comer regions.
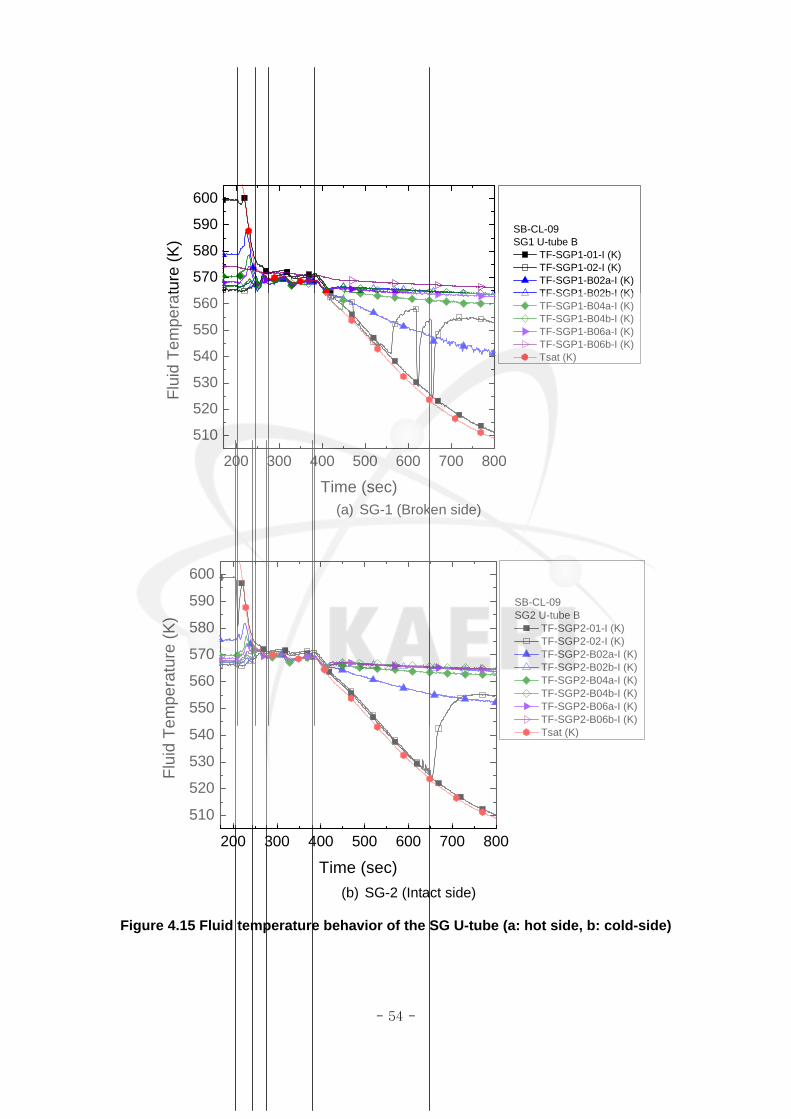
4.10 Fluid temperatures in the SG U-tube
Figure 4.15 shows fluid temperature trends in the U-tube of both steam generators. At
the steady state condition, the fluid temperatures inside the U-tube at the hot-side show
higher temperature than those of the corresponding cold-side. However, these differences
in fluid temperatures became smaller with the initiation of the accident. During the loop
seal clearance phase, the fluid temperatures of the hot and cold-side show a similar
degree. After the loop seal clearing, however, the fluid temperatures of the cold-side
became higher than those of the hot-side due to the reverse heat transfer from the
secondary side.

- 41 -
200 400 600 800 10000
2
4
6
8
10
12
14
16
(5)(3) (4)(2)
Typical phase of SBLOCAPhase (1): Bowdown (start at 202 s)Phase (2): Natural Circulation (at 237 s)Phase (3): Loop Seal Clearence (at 266 s )Phase (4): Boil-off (at 364 s)Phase (5): Core Recovery (at 658 s)
Pre
ssur
e (M
Pa)
Time (sec)
SB-CL-02 PT-PZR-01-I (MPa) PT-SGSD1-01-I (MPa) LT-RPV-04A-I (m)
(1)
SIT start
(a) SB-CL-02
200 400 600 800 10000
2
4
6
8
10
12
14
16
Typical phase of SBLOCAPhase (1): Bowdown (start at 204 s)Phase (2): Natural Circulation (at 244 s)Phase (3): Loop Seal Clearence (at 275 s )Phase (4): Boil-off (at 382 s)Phase (5): Core Recovery (at 649 s)
(5)(3) (4)(2)
Pre
ssur
e (M
Pa)
Time (sec)
SB-CL-09 PT-PZR-01-I (MPa) PT-SGSD1-01-I (MPa) LT-RPV-04A-I (m)
(1)
SIT start
(b) SB-CL-09
Figure 4.1 SBLOCA phase separation of the SB-CL-02 and -09 tests
- 42 -
200 300 400 500 600 700 800
0
1
2
3
4
5
6
Typical phase of SBLOCAPhase (1): Bowdown (start at 204 s)Phase (2): Natural Circulation (at 244 s)Phase (3): Loop Seal Clearence (at 275 s )Phase (4): Boil-off (at 382 s)Phase (5): Core Recovery (at 649 s)
Col
laps
ed w
ater
leve
l (m
)
Time (sec)
SB-CL-09 LT-SGP1-01A-I (m)
Hot side LT-SGP1-01B-I (m)
Cold side
(1)(2)
(3) (4) (5)
200 300 400 500 600 700 800-0.4
-0.2
0.0
0.2
0.4
0.6
0.8
1.0
1.2
1.4
Col
laps
ed w
ater
leve
l (m
)
Time (sec)
SB-CL-09 LT-SGP1-04-I (m)
SG Inlet Plenum LT-SGP1-05-I (m)
SG Outlet Plenum
(a) U-tube (b) Inlet and outlet plenum of SG
200 300 400 500 600 700 800-0.5
0.0
0.5
1.0
1.5
2.0
2.5
Col
laps
ed w
ater
leve
l (m
)
Time (sec)
SB-CL-09 LT-IL1A-01-I (m) LT-IL1B-01-I (m) LT-IL2A-01-I (m) LT-IL2B-01-I (m)
(1)(2)
(3) (4) (5)
200 300 400 500 600 700 800-0.4
-0.2
0.0
0.2
0.4
0.6
0.8
1.0
1.2
1.4
1.6
Col
laps
ed w
ater
leve
l (m
)
Time (sec)
SB-CL-09 LT-IL1A-03-I (m) LT-IL1B-03-I (m) LT-IL2A-03-I (m) LT-IL2B-03-I (m)
(1)(2)
(3) (4) (5)
(c) SG side vertical section of intermediate leg (d) RCP side vertical section of intermediate leg
Figure 4.2 Collapsed water levels in the SG and intermediate leg
- 43 -
200 400 600 800 1000 12000
1
2
3
4
5
6
(5)(4)(3)(2)
Typical phase of SBLOCAPhase (1): Bowdown (start at 202 s)Phase (2): Natural Circulation (at 237 s)Phase (3): Loop Seal Clearence (at 266 s )Phase (4): Boil-off (at 364 s)Phase (5): Core Recovery (at 655 s)
Top of Active core
Col
laps
ed W
ater
Lev
el (m
)
Time (sec)
Experiment(SB-CL-02)
Core Downcomer
Bottom of Active core
Test start : 202 sSIP start : 253 sSIT start : 658 s
(1)
(a) SB-CL-02
200 400 600 800 1000 12000
1
2
3
4
5
6
Test start: 204 sSIP start: 257 sSIT start: 649
Typical phase of SBLOCAPhase (1): Bowdown (start at 204 s)Phase (2): Natural Circulation (at 244 s)Phase (3): Loop Seal Clearence (at 275 s )Phase (4): Boil-off (at 382 s)Phase (5): Core Recovery (at 649 s)
(5)(4)(3)(2)
Top of Active core
Col
laps
ed W
ater
Lev
el (m
)
Time (sec)
Experiment(SB-CL-09)
Core Downcomer
Bottom of Active core
(1)
(b) SB-CL-09
Figure 4.3 Collapsed water levels of the down-comer and the core region
- 44 -
100 200 300 400 500 600 700 800220
240
260
280
300
320
340
360
SB-CL-02
Cla
ddin
g Te
mpe
ratu
re (o C
)
Time (sec)
TH-CO-08G11b1-I (.C) TH-CO-08G13b1-I (.C) TH-CO-08G15b1-I (.C) TH-CO-08G17b1-I (.C) TH-CO-08G21b1-I (.C) TH-CO-08G23b1-I (.C) TH-CO-08G25b1-I (.C) TH-CO-08G27b1-I (.C) TH-CO-08G31b1-I (.C) TH-CO-08G33b1-I (.C) TH-CO-08G35b1-I (.C) TH-CO-08G37b1-I (.C)
(a) SB-CL-02
100 200 300 400 500 600 700 800220
240
260
280
300
320
340
360
SB-CL-09
Cla
ddin
g Te
mpe
ratu
re (o C
)
Time (sec)
TH-CO-08G11b1-I (.C) TH-CO-08G13b1-I (.C) TH-CO-08G15b1-I (.C) TH-CO-08G17b1-I (.C) TH-CO-08G21b1-I (.C) TH-CO-08G23b1-I (.C) TH-CO-08G25b1-I (.C) TH-CO-08G27b1-I (.C) TH-CO-08G31b1-I (.C) TH-CO-08G33b1-I (.C) TH-CO-08G35b1-I (.C) TH-CO-08G37b1-I (.C)
(b) SB-CL-09
Figure 4.4 Cladding temperatures measured at the 1.27 m above the bottom end of the active heated section
- 45 -
200 300 400 500 600 700 800-40
-35
-30
-25
-20
-15
-10
-5
0
5
Diff
eren
tial p
ress
ure
(kP
a)
Time (sec)
SB-CL-02 DP-DCUH1-01 DP-DCUH2-01
(1)(2)
(3) (4) (5)
31.4 kPa
(a) SB-CL-02
200 300 400 500 600 700 800-40
-35
-30
-25
-20
-15
-10
-5
0
24.2 kPa
Diff
eren
tial p
ress
ure
(kP
a)
Time (sec)
SB-CL-09 DP-DCUH1-01 DP-DCUH2-01
(1)(2)
(3) (4) (5)
(b) SB-CL-09
Figure 4.5 Differential pressures between the down-comer and the upper head region
- 46 -
200 300 400 500 600 700 800
0
2
4
6
8
10
12
14Fl
ow R
ate
(kg/
s)
Time (sec)
SB-CL-02 Total Break Flow Total SI Flow (SIP+SIT)
(1)(2)
(3) (4) (5)
(a) SB-CL-02
200 300 400 500 600 700 800
0
2
4
6
8
10
12
14
Flow
Rat
e (k
g/s)
Time (sec)
SB-CL-09 Total Break Flow Total SI Flow (SIP+SIT)
(1)(2)
(3) (4) (5)
(c) SB-CL-09
Figure 4.6 Comparison between the break flow and the total safety injection flow
- 47 -
200 400 600 800 1000 1200
0
200
400
600
800
1000
1200
1400
SB-CL-02 Phase Identification
Acc
umul
ated
Mas
s (k
g)
Time (sec)
SB-CL-02 SB-CL-09
(1)(2)
(3) (4) (5)
(1)(2)
(3) (4) (5)
SB-CL-09 Phase Identification
Figure 4.7 Measured total mass of the accumulated steam and water
200 300 400 500 600 700 800
0
2
4
6
8
10
12
14
Flow
Rat
e (k
g/s)
Time (sec)
SB-CL-09 Total Break Flow
(Hybrid Method) Total SI Flow (SIP+SIT)
(1)(2)
(3) (4) (5)
Figure 4.8 Break flow rate calculated using the hybrid method

- 48 -
Figure 4.9 Core collapsed liquid level in LSTF SC5 (2.3% bypass) and SC7 (9.2% bypass) experiments
- 49 -
200 300 400 500 600 700 800500
520
540
560
580
600
620
Flui
d Te
mpe
ratu
re (K
)
Time (sec)
SB-CL-09 Core Inlet (K) Core Outlet (K)
Figure 4.10 Core Inlet and outlet fluid temperature during the transient
- 50 -
200 300 400 500 600 700500
520
540
560
580
600
620
640
(5)(4)(3)(2)
Flui
d Te
mpe
ratu
re (K
)
Time (sec)
SB-CL-09 Tsat (K) TF-LP-02G18-I (K) TF-LP-03G18-I (K) TF-CO-01G18-I (K) TF-CO-02G18-I (K) TF-CO-03G18-I (K) TF-CO-04G18-I (K) TF-CO-05G18-I (K) TF-CO-06G18-I (K) TF-CO-07G18-I (K)
(1)
Start of Core Power Decay(236 s)
Figure 4.11 Fluid temperature behaviors along the axial direction of the core region
- 51 -
200 400 600 800 1000 1200480
500
520
540
560
580
600
620
Fl
uid
Tem
pera
ture
(K)
Time (sec)
SB-CL-09 Tsat (K) TF-CO-07G18-I (K) TF-UP-01-I (K) TF-UP-02-I (K) TF-UP-03-I (K) TF-UH-01-I (K) TF-UH-02-I (K) TF-UH-03-I (K) TF-UH-04-I (K)
Figure 4.12 Fluid temperature behaviors along the axial direction of the core upper
plenum and the upper head region

- 52 -
200 300 400 500 600 700 800 900490
500510520
530540550
560570580590
200 300 400 500 600 700 800 900490
500510520
530540550
560570580590
200 300 400 500 600 700 800 900490
500510520
530540550
560570580590
200 300 400 500 600 700 800 900490
500510520
530540550
560570580590
Time (sec)
SB-CL-09Azimuthal angle:60o (CL-1B)
TF-DC-012-I (K) TF-DC-022-I (K) TF-DC-032-I (K) TF-DC-042-I (K) TF-DC-052-I (K) TF-DC-062-I (K)
Flui
d Te
mpe
ratu
re (K
)
Time (sec)
SB-CL-09Azimuthal angle:120o (CL-2A)
TF-DC-013-I (K) TF-DC-023-I (K) TF-DC-033-I (K) TF-DC-043-I (K) TF-DC-053-I (K) TF-DC-063-I (K)
(5)(4)(3)(1)
Flui
d Te
mpe
ratu
re (K
)
SB-CL-09Azimuthal angle:240o (CL-2B)
TF-DC-015-I (K) TF-DC-025-I (K) TF-DC-035-I (K) TF-DC-045-I (K) TF-DC-055-I (K) TF-DC-065-I (K)
(2)
(1)(2)
(3) (4) (5)
(1)(2)
(3) (4) (5)
(1)(2)
(3) (4) (5)
(d)
(b)
(c)
SB-CL-09Azimuthal angle: 300o (CL-1A)Broken Cold-Leg
TF-DC-016-I (K) TF-DC-026-I (K) TF-DC-036-I (K) TF-DC-046-I (K) TF-DC-056-I (K) TF-DC-066-I (K)
(a)
Figure 4.13 Fluid temperature behaviors in the down-comer region
- 53 -
200 400 600 800 1000 1200480
500
520
540
560
580
W
all T
empe
ratu
re (K
)
Time (sec)
SB-CL-09 TW-DC-01A-I (K) TW-DC-01B-I (K) TW-DC-02A-I (K) TW-DC-02B-I (K) TW-DC-03A-I (K) TW-DC-03B-I (K) TW-DC-04A-I (K) TW-DC-04B-I (K) TW-DC-05A-I (K) TW-DC-05B-I (K) TW-DC-06A-I (K) TW-DC-06B-I (K) TW-DC-07A-I (K) TW-DC-07B-I (K) Tsat (K)
(1)
(2)
(3) (4) (5)
A: outside surfaceB: inside surface
Figure 4.14 Wall temperature behavior of the outer wall of the down-comer
- 54 -
200 300 400 500 600 700 800
510
520
530
540
550
560
570
580
590
600
Flui
d Te
mpe
ratu
re (K
)
Time (sec)
SB-CL-09SG1 U-tube B
TF-SGP1-01-I (K) TF-SGP1-02-I (K) TF-SGP1-B02a-I (K) TF-SGP1-B02b-I (K) TF-SGP1-B04a-I (K) TF-SGP1-B04b-I (K) TF-SGP1-B06a-I (K) TF-SGP1-B06b-I (K) Tsat (K)
(a) SG-1 (Broken side)
200 300 400 500 600 700 800
510
520
530
540
550
560
570
580
590
600
Flui
d Te
mpe
ratu
re (K
)
Time (sec)
SB-CL-09SG2 U-tube B
TF-SGP2-01-I (K) TF-SGP2-02-I (K) TF-SGP2-B02a-I (K) TF-SGP2-B02b-I (K) TF-SGP2-B04a-I (K) TF-SGP2-B04b-I (K) TF-SGP2-B06a-I (K) TF-SGP2-B06b-I (K) Tsat (K)
(b) SG-2 (Intact side)
Figure 4.15 Fluid temperature behavior of the SG U-tube (a: hot side, b: cold-side)
- 55 -
5.0 UNCERTAINTY ANALYSIS
5.1 Loop flow rate
Flow rate in the RCS loop during transient period has a high priority from a viewpoint of
instrumentation. There are much difficulty in measuring the loop flow rate especially in the
transient period because a two-phase flow rather than a single-phase flow is expected to
occur. In the ATLAS, a BiFlow flow meters which was developed by the KAERI were
installed at 2 hot legs and 4 cold legs. In principle, it can measure a flow rate in a single-
phase condition as well as in a two-phase condition if a void fraction at the measuring
location is available. Thus, a level transmitter was attached at the measuring location
together with the BiFlow meter. However, the measured void fractions (or water level) at
the legs had much uncertainties due to the smaller diameter of the legs. ( ,
) The uncertainty of the loop flow rate thus greatly depends on the accuracy of
the water level of the loop.
In order to avoid the uncertainties caused by the water level measurement, the void
fractions of the loops were enforced to be zero at the initial steady state condition by
operators. After logging the data for around 100 seconds, the enforcing on the water level
was released for the instrument to be ready to measure two-phase flow rate.
Applicability of the BiFlow flow meter for the measurement of a two-phase flow rate
was examined by performing a calibration test [18]. The calibration test was conducted at
the horizontal air/water test loop whose schematic diagram is shown in Figure 5.1. The
horizontal air/water test loop consists of a test section, an inlet reservoir, an outlet reservoir,
a water supply system, an air supply system, a water storage tank, and a data acquisition
system. The test section is composed of a transparent acryl pipe whose diameter is 0.08 m
similar to that of the cold leg of the ATLAS. A Coriolis mass flow meter and a vortex flow
meter were installed at the inlet of the test section to measure the reference flow rates of
water and air, respectively.
The flow regime of the calibration test was a stratified flow which is expected to be a
major flow regime in the cold legs during the transient period of the ATLAS. In the
calibration test, the void fraction was changed from 35 % to 94 %, and the velocity ranges
were 0.3-1.2 m/sec and 3.0-18 m/sec for the water and the air flows, respectively. The two-

- 56 -
phase flow rates measured by the BiFlow flow meter were compared with the reference
flow rates measured by the Coriolis and the vortex flow meters. Figure 5.2 shows the
comparison between the reference flow rates and the flow rates measured by the BiFlow
flow meter in the present calibration test. As shown in Figure 5.2, the BiFlow flow meter
can measure the two-phase flow rates within a ± 15 % error against the reference flow
rates. It was confirmed from the calibration test that the BiFlow flow meter can measure a
two-phase flow rate with an acceptable measurement uncertainty for an anticipated flow
regime in the cold legs during the transient period of the ATLAS.
5.2 Collapsed water level
Collapsed water levels were measured by using differential-type pressure transmitter
(DP). To obtain correct water level of measuring section, density difference of fluid
between in measuring section and impulse line should be compensated by the following
equation;
( )( )gh
gc gPHh
ρρρρ
−
∆−−=
/ (5.1)
Uncertainty of a collapsed water level calculated by Eq. 5.1 could be obtained by
applying the error-propagation relation for the calculated data as followed;
( )( )
( )( )
2/1
22
22
22
)/()/(
)())(
(
⎥⎥⎥⎥
⎦
⎤
⎢⎢⎢⎢
⎣
⎡
−∆−−
+−
−−∆+
−−
+−
=
∆
shUgPHUHgP
Ug
U
U
sh
hc
sh
sc
hsh
sc
sh
P
h
ρρ ρρρρ
ρρρρ
ρρρρ
ρρ
(5.2)
As can be observed in Eq. 5.2, total uncertainty of collapsed water level was induced by
the error of DP measurement and tap-to-tap height measurement and fluid density
measurement. The density measurement error was evaluated by considering the error
range of a reference pressure and a temperature used for the steam table calculation. The
errors related to the density measurement were relatively smaller than the other two
- 57 -
factors. The second error was due to the tap-to-tap measurement error. The DP
measurement error was the largest error source.
The DP measurement error during a transient phase, especially at an initial break stage,
could be evaluated by considering several error factors such as not only a bias error of a
corresponding measurement system but also phenomena dependent random errors. The
phenomena dependent random errors were calculated by using the friction and form loss
evaluation and it was presented in the literature [19]. The maximum value of the
phenomena dependent random error was up to 0.754 kPa for the down-comer region.
Evaluated maximum uncertainty level of the collapsed water level using Eq. 5.2 was
0.166 m for LT-RPV-04A (3.38% of the full scale value).
5.3 Differential pressure
The same method, described in the previous section, was applied to evaluate an
uncertainty of DP measurement. Total uncertainty was evaluated as a root-mean-square
value of a measurement system bias error and phenomena dependent random error. The
Differential pressures (DP-HL1IL1A-01, DP-HL1IL1B-01, DP-HL2IL2A-01, and DP-
HL2IL2B-01) between the inlet and outlet plenum of SGs were measured by KDG 4301
differential pressure. In the ATLAS, pressure taps for these instruments were located in the
hot legs (6 inch, Sch.160) and corresponding intermediate legs (3 inch, Sch.160).
Therefore, the velocity difference in the hot leg and intermediate leg could lead the
additional error in the measured differential pressure. The maximum error due to the
velocity difference was calculated as 0.0035 kPa. The phenomena dependent random
error due to the velocity difference between two measurement taps was very small
compared with that due to the measurement system. However, considering that total error
of the measured differential pressure was root-mean-square value of the system bias error
and the phenomena dependent random error, the total error of the measured differential
pressure was estimated up to 0.23 kPa.
5.4 Static pressure
Static pressure could be obtained from measured signal of corresponding PT
- 58 -
instrument (Pmeasured). However, this measured PT signal should be compensated by tap-
to-instrument height and an atmospheric pressure as followed;
(5.3)
Uncertainty of a static pressure calculated by Eq. 5.3 was obtained by applying the error-
propagation relation for the calculated data as followed;
(5.4)
Evaluated maximum uncertainty level of the static pressure using Eq. 5.4 was 0.039
MPa for PT-PZR-01 (0.25 % of the full scale value).
5.5 Temperature
An uncertainty evaluation of measured temperature was performed in accordance with
a 95 % confidence level. In the ATLAS system, the temperatures were measured by K-type
thermocouples, and the maximum error of the temperature was estimated up to 2.4oC.
atminstrumenttotapcmeasured PgHPP +−= −−ρ
2/122 ])()[(instrumenttotapmeasured HcPP gUUU
−−+= ρ

- 59 -
Figure 5.1 Schematic diagram of the horizontal test loop
Figure 5.2 Comparison of the two-phase flow rates in the calibration test
- 60 -
6.0 CONCLUSIONS
The SB-CL-09 simulation test using the ATLAS was performed to simulate a 6 inch cold-
leg-bottom break of the APR1400. Main objectives of this experimental test are not only to
provide physical insight into the system response of the APR1400 reactor during the
transient situation but also to contribute to construction of an integral effect database for
the SBLOCA scenario. In the present report, the major thermal hydraulic phenomena such
as the system pressure, the loop seal behaviour in the primary coolant system, the
collapsed water levels in the core and the down-comer region, and the resultant trends of
the cladding temperatures were presented and discussed along with the identified
SBLOCA sub-phases such as the blowdown, natural circulation, loop seal clearance, boil-
off, core recovery phase with a comparison of that of the SB-CL-02 performed without the
RPV bypass flow. This integral effect data will be used to evaluate the prediction capability
of safety analysis codes and also be used as benchmark data for the second domestic
standard problem (DSP-02) program. Furthermore this data will be utilized to identify any
code deficiency for small break LOCA simulation, especially for the DVI-adapted plants.
- 61 -
7.0 REFERENCES
[1] P.B. Abramson, “Guidebook to light water reactor safety analysis,” Hemisphere
publishing corporation,” (1985).
[2] G.G. Loomis, J.E. Streit, “Results of semiscale mod-2c small break (5%) LOCA
experiments S-LH-2 and S-LH-2,” NUREG/CR-4438, EGG-2424, EG&G Idaho, Inc,
(1985)
[3] W.P. Baek, C.H. Song, B.J. Yun, et al. “KAERI Integral Effect Test Program and the
ATLAS Design,” Nuclear Technology, 152, 183 (2005).
[4] Y.S. Kim, K.Y. Choi, H.S. Park, S. Cho, B.D. Kim, N.H. Choi, W.P. Baek,
“Commissioning of the ATLAS thermal-hydraulic integral test facility,” Annals of
Nuclear Energy, 35, 1791-1799 (2008).
[5] K.Y. Choi, H.S. Park, S. Cho, D.J. Euh, Y.S. Kim, and W.P.Baek, “Integral Behavior of
the ATLAS Facility for a 3-inch Small Break Loss of Coolant Accident,” Nuclear
Engineering and Technology, 40, 199-212, (2008).
[6] M. Ishii and I. Kataoka, “Similarity Analysis and Scaling Criteria for LWRs Under Single
Phase and Two-Phase Natural Circulation,” NUREG/CR-3267, ANL-83-32, Argonne
National Laboratory (1983).
[7] H.S. Park., D.J. Euh., K.T. Choi., et al., ”Calculation Sheet for the Basic Design of the
ATLAS Fluid System,” KAERI/TR-3333/2007 (2007).
[8] K.H. Kang, S.K. Moon, H.S. Park, S. Cho, K.Y. Choi, B.J. Yun, T.S. Kwon, S.J. Yi, C.K.
Park, B.D. Kim, Y.S. Kim, and W.P.Baek, “ATLAS facility and instrumentation
description report,” KAERI/TR-3779/2009, Technical report of KAERI, (2009).
[9] S. Cho et al., “Description of the Signal Processing System of ATLAS Facility,”
KAERI/TR-3334/2007 (2007).
[10] K.Y. Choi et al., “Control and Data Acquisition System of the ATLAS Facility,”
KAERI/TR-3338/2007 (2007).
[11] B.J. Yun, S. Cho, K.H. Kang, et al., “Instrumentation and Control System of the
ATLAS Integral Effect Test Facility,” Proceedings of NUTHOS-7 (The 7th International
Topical Meeting on Nuclear Reactor Thermal Hydraulics, Operation and Safety), Seoul,
Korea, October 5-9 (2008).
- 62 -
[12] S. Cho, “Test prospectus for the cold-leg line small break test,” 53211-TP-CLSB-01,
R01, Internal report of Thermal Hydraulics Safety Research Division, (2009).
[13] S. Cho, et al., “6 inch cold leg SBLOCA simulation test report using the ATLAS,”
KAERI/TR-3969/2009, (2009).
[14] Y. S. Kim et al., “Startup Test Report of ATLAS,” KAERI/TR-3330/2007 (2007).
[15] Mitsubishi heavy industries, Ltd, “Small break LOCA sensitivity analyses for US-
APWR,” MUAP-07025-NP(R0), (2007).
[16] K. Tasaka, Y. Kukita, Y. Koizumi, M. Osakabe, and H. Nakamura, “The results of 5%
SBLOCA tests and natural circulation tests at the ROSA-IV LSTF,” Nuclear
Engineering Design, 108, 37~44, (1988).
[17] M.Osakabe, T. Yonomoto, Y. Kukita, Y. Koizumi, and K. Tasaka, “Core liquid level
depression due to manometric effect during PWR small break LOCA,” J. Nucl. Sci.
Tech., 25(3), 274~282, (1988).
[18] B. J. Yun et al., “Development of an Average Bidirectional Flow Tube for a
Measurement of the Single and Two Phase Flow,” The 11th International Topical
Meeting on Nuclear Reactor Thermal-Hydraulics (NURETH-11), Avignon, France,
October 2 ~ 6 (2005).
[19] K. Y. Choi, et al., “OECD/NEA/CSNI International Standard Problem No. 50, Draft
Comparison Report, Volume 1, Analysis of Blind Calculations,” NEA/CSNI/R(2010),
(2010).

서 지 정 보 양 식
수행기관보고서번호 위탁기관보고서번호 표준보고서번호 INIS 주제코드
KAERI/TR-4077/2010
제목 / 부제 ATLAS를 이용한 저온관 6인치 소형파단모의사고(SB-CL-09)
실험보고서
연구책임자 및 부서명
(TR 등의 경우 주저자) 조석 (열수력안전연구부)
연구자 및 부서명 최기용, 박현식, 강경호, 김연식, 최남현, 김복득, 민경호, 백원필
(열수력안전연구부)
출 판 지 대전 발행기관 한국원자력연구원 발행년 2010. 09
페 이 지 P. 62 도 표 있음(O), 없음( ) 크 기 21x29 cm
참고사항
공개여부 공개(O ), 비공개( )
비밀여부 대외비( ), 급비밀 보고서종류 기술보고서
연구위탁기관 계약번호
초록 (15-20줄내외)
열수력종합효과 실험장치인 ATLAS (Advanced Thermal-hydraulic Test Loop for
Accident Simulation)는 APR1400을 원형발전소로 건설되었다. ATLAS는 높이를
원형발전소의 1/2로 축소하고 1/288의 체적비를 바탕으로 설계 및 제작되었다.
ATLAS의 최대노심출력은 정격조건 척도비의 10%인 2MW 용량이며,
원형발전소인 APR1400원자로의 정상상태 압력과 온도 조건을 모의할 수 있다.
ATLAS는 대형냉각재 상실사고(Large Break Loss of Coolant Accident), DVI 배관
및 저온관에서의 소형냉각재 상실사고(Small Break LOCA), 증기발생기 U-tube
파단 (SGTR), 주증기 및 주급수배관 파단 등의 설계기준사고를 모의할 수 있도록
제작되었다. 본 보고서에서 기술한 SB-CL-09는 소형냉각재 상실사고 중 6인치
소형관 파단사고에 대한 모의실험으로, 노심우회유량을 제외한 다른 실험조건은
SB-CL-02와 같다. 본 종합효과실험(SB-CL-09) 결과는 2010년 7월부터
시작되는 제 2 회 국내표준문제(DSP-02) 프로그램을 위한 기준 실험 데이터로서
제공될 예정이다. 본 실험에서는 정상운전 조건에서의 노심우회유량을 모의하여
실험을 수행하였다. 실험의 목적은 저온관 소형파단사고의 경우 계통의 천이
열수력 거동에 대한 이해 증진과 소형냉각재 상실사고에 대한 종합효과 실험자료
데이터 베이스 구축에 기여하는 것이다. 본 보고서는 SB-CL-09 실험결과를
바탕으로 계통의 열수력적 거동에 대한 설명자료를 제공한다.
주제명 키워드
(10단어내외) ATLAS, 소형냉각재상실사고

BIBLIOGRAPHIC INFORMATION SHEET
Performing Org. Report No.
Sponsoring Org. Report No.
Standard Report No. INIS Subject Code
KAERI/TR-4077/2010 Title / Subtitle 6inch Cold Leg SBLOCA Simulation Test (SB-CL-09) Report
using the ATLAS
Main Author and Department Seok CHO (Thermal Hydraulics Safety Research Division)
Researcher and Department
Ki-Yong CHOI, Hyun-Sik PARK, Kyoung-Ho KANG, Yeon-Sik KIM, Nam-Hyun CHOI, Bok-Duk KIM, Kyoung-Ho MIN, Won-Pil BAEK (Thermal Hydraulics Safety Research Division)
Publication Place Daejeon Publisher KAERI Publication
Date 2010. 09
Page P. 62 III. & Tab. Yes(O), No( ) Size 21x29 cm
Note
Open Open ( O ), Closed ( )
Classified Restricted ( ), Class Document
Report Type Technical Report
Sponsoring Org. Contract No.
Abstract (15-20 Lines) A thermal-hydraulic integral effect test facility for advanced pressurized reactors (PWRs), ATLAS (Advanced Thermal-hydraulic Test Loop for Accident Simulation), has been operated by KAERI (Korea Atomic Energy Research Institute). The reference plant of the ATLAS is a 1400 MWe-class evolutionary pressurized water reactor (PWR), APR1400 (Advanced Power Reactor 1,400 MWe), which was developed by the Korean industry. The ATLAS has a 1/2 reduced height and 1/288 volume scaled integral test facility with respect to the APR1400. It has a maximum power capacity of 10% of the scaled nominal core power, and it can simulate full pressure and temperature conditions of the APR1400. The ATLAS could be used to provide experimental data on design-basis accidents including the reflood phase of a large break loss of coolant accident (LBLOCA), small break LOCA (SBLOCA) scenarios including DVI line and cold leg breaks, a steam generator tube rupture, a main steam line break, a feed line break, etc. A 6 inch cold leg break test (SB-CL-09) was carried out as one of the SBLOCA spectrum. Test conditions of the SB-CL-09 were similar to those of the SB-CL-02, except for the simulation of the core bypass flow. Experimental data of the present integral effect test (SB-CL-09) will be used as benchmark data for the second domestic standard problem (DSP-02) program which will be launched at Jul. 2010. Main objectives of this experimental test are not only to provide physical insight into the system response of the APR1400 reactor during the transient situation but also to contribute to construction of an integral effect database for the SBLOCA scenario. In this report, thermal hydraulic description on experimental results of the SB-CL-09 will be presented. Subject Keywords (About 10 words) ATLAS, SBLOCA,